

Form 6-K Teekay Offshore Partners For: Feb 18
 Tweet
Tweet Share
Share
UNITED STATES
SECURITIES AND EXCHANGE COMMISSION
WASHINGTON, D.C. 20549
FORM 6-K
Report of Foreign Private Issuer
Pursuant to Rule 13a-16 or 15d-16
of the Securities Exchange Act of 1934
Date of Report: February 18, 2016
Commission file number 1- 33198
TEEKAY OFFSHORE PARTNERS L.P.
(Exact name of Registrant as specified in its charter)
4th Floor, Belvedere Building
69 Pitts Bay Road
Hamilton, HM 08, Bermuda
(Address of principal executive office)
Indicate by check mark whether the registrant files or will file annual reports under cover Form 20-F or Form 40-F.
Form 20-F x Form 40-F ¨
Indicate by check mark if the registrant is submitting the Form 6-K in paper as permitted by Regulation S-T Rule 101(b)(1).
Yes ¨ No x
Indicate by check mark if the registrant is submitting the Form 6-K in paper as permitted by Regulation S-T Rule 101(b)(7).
Yes ¨ No x
Item 1 — Information Contained in this Form 6-K Report
Attached as Exhibit 99.1 is a copy of an announcement of Teekay Offshore Partners L.P. dated February 18, 2016, relating to its results for the quarter and year ended December 31, 2015.
Attached as Exhibit 99.2 is a copy of Teekay Offshore Partners L.P.’s Fourth Quarter 2015 Earnings and Business Outlook Presentation dated February 18, 2016.
SIGNATURES
Pursuant to the requirements of the Securities Exchange Act of 1934, the registrant has duly caused this report to be signed on its behalf by the undersigned, thereunto duly authorized.
| TEEKAY OFFSHORE PARTNERS L.P.
Teekay Offshore GP L.L.C., its general partner | ||||||
| Date: February 18, 2016 | By: | /s/ Peter Evensen | ||||
| Peter Evensen | ||||||
| Chief Executive Officer and Chief Financial Officer | ||||||
| (Principal Financial and Accounting Officer) | ||||||
Exhibit 99.1

TEEKAY OFFSHORE PARTNERS REPORTS
FOURTH QUARTER AND ANNUAL 2015 RESULTS
Highlights
| • | Generated distributable cash flow of $67.0 million, or $0.62 per common unit, in the fourth quarter of 2015 and $244.7 million, or $2.29 per common unit, during 2015. |
| • | Generated cash flow from vessel operations of $172.9 million and $588.4 million in the fourth quarter and fiscal year of 2015, respectively, increases of 38 percent and 25 percent from the same periods of the prior year. |
| • | Declared fourth quarter 2015 cash distribution of $0.11 per common unit. |
| • | Completed the sale of two conventional tankers and agreed to sell the remaining two conventional tankers for total gross proceeds of approximately $130 million. |
| • | Total liquidity of approximately $283 million as at December 31, 2015. |
Hamilton, Bermuda, February 18, 2016 - Teekay Offshore GP LLC, the general partner of Teekay Offshore Partners L.P. (Teekay Offshore or the Partnership) (NYSE: TOO), today reported the Partnership’s results for the quarter and year ended December 31, 2015. During the fourth quarter of 2015, the Partnership generated distributable cash flow(1) of $67.0 million, compared to $50.0 million in the same period of the prior year. The increase in distributable cash flow was primarily due to the acquisition of the Petrojarl Knarr (Knarr) floating production, storage and offloading (FPSO) unit in July 2015, the acquisition of six long-distance towing and offshore installation vessels during the first seven months of 2015, the commencement of the Arendal Spirit unit for maintenance and safety (UMS) charter contract in early-June 2015 and a production bonus recorded in the fourth quarter of 2015 relating to the Voyageur Spirit FPSO. These increases were partially offset by the expiration of two shuttle tanker contracts in the second quarter of 2015 and the sale of two conventional tankers, the SPT Explorer and Navigator Spirit, in the fourth quarter of 2015.
On January 20, 2016, the Partnership declared a cash distribution of $0.11 per unit for the quarter ended December 31, 2015. The cash distribution was paid on February 12, 2016 to all unitholders of record on February 5, 2016.
CEO Commentary
“Despite the challenging macro energy environment affecting our customers, the Partnership grew its cash flows during the fourth quarter and fiscal year 2015, highlighting the stability of our business which plays an integral role in our customers’ oil production logistics chains,” commented Peter Evensen, Chief Executive Officer of Teekay Offshore GP LLC. “The growth was driven mostly by the delivery and acquisition of several offshore units during 2015, including our largest FPSO acquisition to date, the Knarr FPSO, the Arendal Spirit UMS and six long-distance towing and offshore installation vessels.”
Mr. Evensen added “Teekay Offshore’s fleet continues to operate with high uptime and fleet utilization, generating stable cash flow, supported by a diversified portfolio of long-term contracts with high quality counterparties.”
“The decision in December to temporarily reduce Teekay Offshore’s distributions was a difficult decision and was caused by the inability to access competitively priced capital in the current negative capital market environment and was not caused by a shortfall in the cash flows of our operations,” Mr. Evensen continued, “We believe the reduction is in the best interests of long-term unitholders as the reallocation of a significant portion of our internally generated cash flows to fund our profitable growth projects that will deliver over the next several years will result in higher available distributable cash flow per unit.”
| (1) | Distributable cash flow is a non-GAAP financial measure used by certain investors to measure the financial performance of the Partnership and other master limited partnerships. Please see Appendix B for a reconciliation of distributable cash flow to the most directly comparable financial measure under United States generally accepted accounting principles (GAAP). |
Teekay Offshore Partners L.P. Investor Relations Tel: +1 604 844-6654 www.teekayoffshore.com
4th Floor, Belvedere Building, 69 Pitts Bay Road, Hamilton, HM 08, Bermuda
1

“We are pleased to announce the sale of our four remaining non-core conventional tankers, further improving the Partnership’s liquidity position,” Mr. Evensen continued. “These asset sales take advantage of strong tanker asset prices and represent one of many ways that the Partnership is able to supplement its internally generated cash flows to fund our financing requirements.”
Mr. Evensen added “Looking ahead to 2016, despite the sale of the conventional tankers and the anticipated redelivery of the Varg FPSO after operating on the Varg field for almost 18 years, the Partnership’s cash flows are expected to increase compared to 2015 supported by high uptime and fleet utilization and the delivery of various growth projects in 2016, including the Petrojarl I FPSO project and the delivery of four newbuilding long-distance towing and offshore installation vessels. We remain focused on completing our existing growth pipeline and are now pivoting our business strategy to focus on the future redeployment of our existing assets onto new contracts instead of new organic growth projects, implementing various cost saving initiatives, and addressing our remaining funding needs.”
Business Outlook for 2016 and 2017
The Partnership plans to host a conference call on Thursday, February 18, at 12:30 p.m. (ET) to discuss the results contained in this news release as well as its business outlook, which includes additional forecasted cash flows for 2016 and 2017. A copy of the Fourth Quarter 2015 Earnings and Business Outlook Presentation, which will be discussed during this conference call, is available at www.teekayoffshore.com.
Summary of Recent Events
Sale of Four Conventional Tankers
The Partnership completed the sale of two conventional tankers and has entered into an agreement to sell its remaining two conventional tankers for aggregate sales proceeds of approximately $130 million. The first two conventional tankers, the SPT Explorer and Navigator Spirit, were sold to Teekay Tankers Ltd. (Teekay Tankers) in mid-December 2015 and the two remaining conventional tankers, the Kilimanjaro Spirit and Fuji Spirit, are expected to be delivered to a third party in March 2016. After repaying existing debt secured by these assets and the novation of an existing $50 million revolving credit facility to Teekay Tankers, these transactions are expected to add approximately $60 million to the Partnership’s liquidity position. As part of the sale of the Kilimanjaro Spirit and the Fuji Spirit, the Partnership has agreed to charter-in both vessels for a period of three-years at $23,000 per day and $22,750 per day, respectively. Both vessels are expected to operate on the spot tanker market in Teekay’s Aframax RSA pool.
Termination of the Petrojarl Varg FPSO Contract
In November 2015, the Partnership received a termination notice for the Petrojarl Varg (Varg) FPSO charter contract from Repsol S.A. (Repsol), formerly Talisman Energy, based on a termination right that is specific to the Varg FPSO contract. Following discussions with Repsol, the Partnership currently expects the Varg FPSO to be redelivered to the Partnership in August 2016. The Partnership is currently pursuing various redeployment opportunities for the Varg FPSO, a unit which meets the strict Norwegian petroleum industry (NORSOK) standards.
- more -
2
Financial Summary
The Partnership reported adjusted net income attributable to the partners(1) of $53.7 million for the quarter ended December 31, 2015, compared to $40.1 million for the same period of the prior year. Adjusted net income attributable to the partners excludes a number of specific items that had the net effect of decreasing net income by $9.8 million and $63.4 million for the quarters ended December 31, 2015 and 2014, respectively, as detailed in Appendix A to this release. Including these items, the Partnership reported, on a GAAP basis, net income attributable to the partners of $43.9 million for the fourth quarter of 2015, compared to a net loss attributable to the partners of $23.3 million in the same period of the prior year. Net revenues(2) increased to $312.5 million for the fourth quarter of 2015, compared to $236.3 million in the same period of the prior year.
The Partnership reported adjusted net income attributable to the partners(1) of $165.7 million for the year ended December 31, 2015, compared to $123.8 million for the same period of the prior year. Adjusted net income attributable to the partners excludes a number of specific items that had the net effect of decreasing net income by $89.6 million and $116.7 million for the years ended December 31, 2015 and 2014, respectively, as detailed in Appendix A to this release. Including these items, the Partnership reported, on a GAAP basis, net income attributable to the partners of $76.1 million for the year ended December 31, 2015, compared to $7.2 million in the same period of the prior year. Net revenues(2) increased to $1.1 billion for the year ended December 31, 2015, compared to $907.0 million in the same period of the prior year.
Adjusted net income attributable to the partners for the three months and year ended December 31, 2015 increased from the same period in the prior year mainly due to the acquisition of the Knarr FPSO unit on July 1, 2015, the acquisition of six long-distance towing and offshore installation vessels during the first seven months of 2015, the Arendal Spirit UMS commencing its charter contract in early-June 2015 and a production bonus recorded in the fourth quarter of 2015 relating to the Voyageur Spirit FPSO. These increases were partially offset by a temporary shut-down on the Piranema Spirit FPSO for unscheduled repairs during the third quarter of 2015, the expiration of two shuttle tanker contracts in the second quarter of 2015, the sale of the Navion Svenita shuttle tanker in March 2015, and the sale of the SPT Explorer and Navigator Spirit conventional tankers during the fourth quarter of 2015.
For accounting purposes, the Partnership is required to recognize, through the consolidated statements of income (loss), changes in the fair value of derivative instruments as unrealized gains or losses. This revaluation does not affect the economics of any hedging transactions nor does it have any impact on the Partnership’s actual cash flows or the calculation of its distributable cash flow.
| (1) | Adjusted net income attributable to the partners is a non-GAAP financial measure. Please refer to Appendix A included in this release for a reconciliation of this non-GAAP measure to the most directly comparable financial measure under GAAP and information about specific items affecting net income (loss) that are typically excluded by securities analysts in their published estimates of the Partnership’s financial results. |
| (2) | Net revenues is a non-GAAP financial measure used by certain investors to measure the financial performance of shipping companies. Please refer to Appendix C included in this release for a reconciliation of this non-GAAP measure to the most directly comparable financial measure under GAAP. |
- more -
3
Operating Results
The following table highlights certain financial information for Teekay Offshore’s six segments: the Shuttle Tanker segment, the FPSO segment, the FSO segment, the Conventional Tanker segment, the Towage segment and the UMS segment (please refer to the “Teekay Offshore’s Fleet” section of this release below and Appendices C through F for further details).
| Three Months Ended | ||||||||||||||||||||||||||||
| December 31, 2015 | ||||||||||||||||||||||||||||
| (in thousands of U.S. Dollars) | (unaudited) | |||||||||||||||||||||||||||
| Shuttle Tanker Segment |
FPSO Segment |
FSO Segment |
Conventional Tanker Segment |
Towage Segment |
UMS Segment(1) |
Total | ||||||||||||||||||||||
| Net revenues(2) |
117,994 | 153,669 | 14,093 | 5,571 | 8,297 | 12,911 | 312,535 | |||||||||||||||||||||
| Vessel operating expenses |
(33,906 | ) | (55,148 | ) | (6,603 | ) | (1,726 | ) | (4,763 | ) | (6,774 | ) | (108,920 | ) | ||||||||||||||
| Time-charter hire expense |
(15,112 | ) | — | — | — | — | — | (15,112 | ) | |||||||||||||||||||
| Depreciation and amortization |
(25,666 | ) | (37,595 | ) | (2,584 | ) | (1,558 | ) | (2,874 | ) | (1,697 | ) | (71,974 | ) | ||||||||||||||
|
|
|
|
|
|
|
|
|
|
|
|
|
|
|
|||||||||||||||
| CFVO from consolidated vessels(3) |
63,223 | 83,761 | 8,679 | 3,690 | 2,753 | 5,732 | 167,838 | |||||||||||||||||||||
| CFVO from equity accounted vessels(4) |
— | 5,091 | — | — | — | — | 5,091 | |||||||||||||||||||||
|
|
|
|
|
|
|
|
|
|
|
|
|
|
|
|||||||||||||||
| Total CFVO(3)(4) |
63,223 | 88,852 | 8,679 | 3,690 | 2,753 | 5,732 | 172,929 | |||||||||||||||||||||
|
|
|
|
|
|
|
|
|
|
|
|
|
|
|
|||||||||||||||
| Three Months Ended | ||||||||||||||||||||||||||||
| December 31, 2014 | ||||||||||||||||||||||||||||
| (in thousands of U.S. Dollars) | (unaudited) | |||||||||||||||||||||||||||
| Shuttle Tanker Segment |
FPSO Segment |
FSO Segment |
Conventional Tanker Segment |
Towage Segment |
UMS Segment(1) |
Total | ||||||||||||||||||||||
| Net revenues(2) |
119,301 | 94,595 | 14,830 | 7,417 | 110 | — | 236,253 | |||||||||||||||||||||
| Vessel operating expenses |
(40,386 | ) | (35,211 | ) | (7,275 | ) | (1,422 | ) | — | — | (84,294 | ) | ||||||||||||||||
| Time-charter hire expense |
(7,618 | ) | — | — | — | — | — | (7,618 | ) | |||||||||||||||||||
| Depreciation and amortization |
(28,300 | ) | (18,629 | ) | (3,059 | ) | (1,844 | ) | — | — | (51,832 | ) | ||||||||||||||||
|
|
|
|
|
|
|
|
|
|
|
|
|
|
|
|||||||||||||||
| CFVO from consolidated vessels(3) |
60,713 | 47,439 | 7,453 | 5,498 | (562 | ) | (203 | ) | 120,338 | |||||||||||||||||||
| CFVO from equity accounted vessel(4) |
— | 5,133 | — | — | — | — | 5,133 | |||||||||||||||||||||
|
|
|
|
|
|
|
|
|
|
|
|
|
|
|
|||||||||||||||
| Total CFVO(3)(4) |
60,713 | 52,572 | 7,453 | 5,498 | (562 | ) | (203 | ) | 125,471 | |||||||||||||||||||
|
|
|
|
|
|
|
|
|
|
|
|
|
|
|
|||||||||||||||
| (1) | The Partnership acquired 100 percent of the outstanding shares of Logitel Offshore Holding AS (Logitel) during the third quarter of 2014 and operations began in the second quarter of 2015. |
| (2) | Net revenues is a non-GAAP financial measure used by certain investors to measure the financial performance of shipping companies. Please refer to Appendix C, included in this release for a reconciliation of this non-GAAP measure to the most directly comparable GAAP financial measure. |
| (3) | Cash flow from vessel operations (CFVO) from consolidated vessels represents income (loss) from vessel operations before depreciation and amortization expense, write-down and gain on sale of vessels, and amortization of the non-cash portion of revenue contracts, and includes the realized gains and losses on the settlement of foreign exchange forward contracts and adjusts for direct financing leases to a cash basis. CFVO is a non-GAAP financial measure used by certain investors to measure the financial performance of shipping companies. CFVO should not be considered as an alternative to net income, equity income or any other indicator of the Partnership’s performance required by GAAP. Please refer to Appendix E included in this release for a description and reconciliation of this non-GAAP measure to the most directly comparable GAAP financial measure. |
| (4) | CFVO from equity accounted vessels represents the Partnership’s proportionate share of CFVO from its equity-accounted vessels, the Cidade de Itajai FPSO unit and the Libra FPSO conversion project. Please see Appendix F for a description and reconciliation of CFVO from equity accounted vessels (a non-GAAP measure) as used in this release to the most directly comparable GAAP financial measure. |
- more -
4
Shuttle Tanker Segment
Cash flow from vessel operations from the Partnership’s Shuttle Tanker segment increased to $63.2 million for the fourth quarter of 2015 compared to $60.7 million for the same period of the prior year, primarily due to the commencement of the shuttle tanker contract for the East Coast of Canada in June 2015, mobilization costs expensed on the HiLoad DP unit during the fourth quarter of 2014, and a reduction in operating expenses resulting from cost-saving initiatives and the depreciation of certain foreign currencies, partially offset by the sale of Navion Svenita in March 2015 and an increase in repair and crew training costs in the fourth quarter of 2015.
FPSO Segment
Cash flow from vessel operations from the Partnership’s FPSO segment (which also includes the results from two equity-accounted FPSO units), increased to $88.9 million for the fourth quarter of 2015 compared to $52.6 million for the same period of the prior year, primarily due to the acquisition of the Knarr FPSO unit from Teekay Corporation in July 2015 and a production bonus recorded in the fourth quarter of 2015 relating to the Voyageur Spirit FPSO, partially offset by a retroactive increase in charter rates for the Cidade de Rio das Ostras FPSO unit recorded in the fourth quarter of 2014 and higher repairs and maintenance on the Piranema Spirit FPSO unit in the fourth quarter of 2015.
FSO Segment
Cash flow from vessel operations from the Partnership’s FSO segment increased to $8.7 million for the fourth quarter of 2015, compared to $7.5 million for the same period of the prior year, primarily due to a decrease in management fees resulting from cost-saving initiatives.
Conventional Tanker Segment
Cash flow from vessel operations from the Partnership’s Conventional Tanker segment decreased to $3.7 million for the fourth quarter of 2015, compared to $5.5 million for the same period of the prior year, primarily due to net early termination fees paid to Teekay Corporation of $1.8 million relating to the charter contract terminations for the SPT Explorer, Navigator Spirit and the Fuji Spirit during the fourth quarter of 2015.
Towage Segment
Cash flow from vessel operations from the Partnership’s Towage segment of $2.8 million for the fourth quarter of 2015, primarily relates to the acquisition of the six towage vessels during the first seven months of 2015.
UMS Segment
Cash flow from vessel operations from the Partnership’s UMS segment increased to $5.7 million for the fourth quarter of 2015, primarily related to the Arendal Spirit UMS, which commenced its charter contract with Petrobras in June 2015.
- more -
5

Teekay Offshore’s Fleet
The following table summarizes Teekay Offshore’s fleet as of February 1, 2016.
| Number of Vessels | ||||||||||||||||
| Owned Vessels |
Chartered-in Vessels |
Committed Newbuildings / Conversions / Upgrade |
Total | |||||||||||||
| Shuttle Tanker Segment |
30 | (i) | 3 | 3 | (ii) | 36 | ||||||||||
| FPSO Segment |
6 | (iii) | — | 2 | (iv) | 8 | ||||||||||
| FSO Segment |
6 | — | 1 | (v) | 7 | |||||||||||
| Towage Segment |
6 | — | 4 | (vi) | 10 | |||||||||||
| Conventional Segment |
2 | — | — | 2 | ||||||||||||
| UMS Segment |
1 | — | 2 | (vii) | 3 | |||||||||||
|
|
|
|
|
|
|
|
|
|||||||||
| Total |
51 | 3 | 12 | 66 | ||||||||||||
|
|
|
|
|
|
|
|
|
|||||||||
| (i) | Includes six shuttle tankers in which Teekay Offshore’s ownership interest is 50 percent, one shuttle tanker in which Teekay Offshore’s ownership interest is 67 percent and one Hiload DP unit. |
| (ii) | Includes three Suezmax-size, DP2 shuttle tanker newbuildings scheduled to be delivered in the fourth quarter of 2017 through the first half of 2018 for employment under the East Coast of Canada contract. |
| (iii) | Includes one FPSO unit, the Cidade de Itajai, in which Teekay Offshore’s ownership interest is 50 percent. |
| (iv) | Consists of the Petrojarl I FPSO upgrade project and Teekay Offshore’s 50 percent ownership interest in the Libra FPSO conversion project. |
| (v) | Consists of the Randgrid shuttle tanker, which is being converted into an FSO unit for use with the Gina Krog FSO project. |
| (vi) | Consists of four long-distance towing and offshore installation vessel newbuildings scheduled to deliver in 2016. |
| (vii) | Consists of two UMS newbuildings currently scheduled to deliver in the fourth quarter of 2016 and the second quarter of 2019. |
Liquidity Update
As of December 31, 2015, the Partnership had total liquidity of $282.7 million (comprised of $258.5 million in cash and cash equivalents and $24.2 million in undrawn credit facilities).
- more -
6
Conference Call
The Partnership plans to host a conference call on Thursday, February 18, 2016 at 12:30 pm (ET) to discuss the results for the fourth quarter and fiscal year of 2015 as well as its business outlook. All unitholders and interested parties are invited to listen to the live conference call by choosing from the following options:
| • | By dialing 1-866-738-4015 or 416-204-9524, if outside North America, and quoting conference ID code 4410522. |
| • | By accessing the webcast, which will be available on Teekay Offshore’s website at www.teekayoffshore.com (the archive will remain on the website for a period of 30 days). |
A supporting Fourth Quarter and Fiscal Year 2015 Earnings and Business Outlook Presentation will also be available at www.teekayoffshore.com in advance of the conference call start time.
The conference call will be recorded and available until Thursday, March 3, 2016. This recording can be accessed following the live call by dialing 1-888-203-1112 or 647-436-0148, if outside North America, and entering access code 4410522.
About Teekay Offshore Partners L.P.
Teekay Offshore Partners L.P. is an international provider of marine transportation, oil production, storage, long-distance towing and offshore installation and maintenance and safety services to the offshore oil industry, primarily focusing on the deepwater offshore oil regions of the North Sea, Brazil and the East Coast of Canada. Teekay Offshore is structured as a publicly-traded master limited partnership (MLP) with consolidated assets of approximately $5.7 billion, comprised of 66 offshore assets, including shuttle tankers, floating production, storage and offloading (FPSO) units, floating storage and offtake (FSO) units, units for maintenance and safety (UMS), long-distance towing and offshore installation vessels and conventional tankers. The majority of Teekay Offshore’s fleet is employed on medium-term, stable contracts.
Teekay Offshore’s common units trade on the New York Stock Exchange under the symbol “TOO”.
For Investor Relations
enquiries contact:
Ryan Hamilton
Tel: +1 (604) 609-6442
Website: www.teekayoffshore.com
- more -
7
Teekay Offshore Partners L.P.
Summary Consolidated Statements of Income (Loss)
(in thousands of U.S. Dollars, except unit data)
| Three Months Ended | Year Ended | |||||||||||||||||||
| December 31, 2015 |
September 30, 2015 |
December 31, 2014 |
December 31, 2015(1) |
December 31, 2014 |
||||||||||||||||
| (unaudited) | (unaudited) | (unaudited) | (unaudited) | (unaudited) | ||||||||||||||||
| Revenues |
339,142 | 314,054 | 260,461 | 1,229,413 | 1,019,539 | |||||||||||||||
| Voyage expenses |
(26,607 | ) | (28,166 | ) | (24,208 | ) | (98,006 | ) | (112,540 | ) | ||||||||||
| Vessel operating expenses |
(108,920 | ) | (95,172 | ) | (84,294 | ) | (378,480 | ) | (352,209 | ) | ||||||||||
| Time-charter hire expense |
(15,112 | ) | (18,893 | ) | (7,618 | ) | (51,750 | ) | (31,090 | ) | ||||||||||
| Depreciation and amortization |
(71,974 | ) | (72,827 | ) | (51,832 | ) | (274,599 | ) | (198,553 | ) | ||||||||||
| General and administrative (2) |
(14,190 | ) | (27,321 | ) | (20,575 | ) | (72,613 | ) | (67,516 | ) | ||||||||||
| (Write-down) and gain on sale of vessels(3) |
(55,645 | ) | — | 3,121 | (69,998 | ) | (1,638 | ) | ||||||||||||
| Restructuring (charge) recovery |
(276 | ) | (157 | ) | — | (568 | ) | 225 | ||||||||||||
|
|
|
|
|
|
|
|
|
|
|
|||||||||||
| Income from vessel operations |
46,418 | 71,518 | 75,055 | 283,399 | 256,218 | |||||||||||||||
| Interest expense |
(33,013 | ) | (33,645 | ) | (24,982 | ) | (122,838 | ) | (88,381 | ) | ||||||||||
| Interest income |
203 | 153 | 207 | 633 | 719 | |||||||||||||||
| Realized and unrealized gains (losses) derivative instruments (4) |
16,478 | (77,102 | ) | (59,495 | ) | (73,704 | ) | (143,703 | ) | |||||||||||
| Equity income (loss) |
913 | (7,052 | ) | 1,764 | 7,672 | 10,341 | ||||||||||||||
| Foreign currency exchange loss(5) |
(827 | ) | (10,257 | ) | (11,590 | ) | (17,467 | ) | (16,140 | ) | ||||||||||
| Other income (loss) – net |
825 | (373 | ) | 597 | 1,091 | 781 | ||||||||||||||
|
|
|
|
|
|
|
|
|
|
|
|||||||||||
| Income (loss) before income tax expense |
30,997 | (56,758 | ) | (18,444 | ) | 78,786 | 19,835 | |||||||||||||
| Income tax recovery (expense) |
15,703 | 5,465 | 734 | 21,357 | (2,179 | ) | ||||||||||||||
|
|
|
|
|
|
|
|
|
|
|
|||||||||||
| Net income (loss) |
46,700 | (51,293 | ) | (17,710 | ) | 100,143 | 17,656 | |||||||||||||
|
|
|
|
|
|
|
|
|
|
|
|||||||||||
| Non-controlling interests in net income |
2,829 | 3,446 | 5,547 | 13,911 | 10,503 | |||||||||||||||
| Dropdown Predecessor’s interest in net income(1) |
— | — | — | 10,100 | — | |||||||||||||||
| Preferred unitholders’ interest in net income |
10,750 | 10,349 | 2,719 | 28,609 | 10,875 | |||||||||||||||
| General Partner’s interest in net income |
662 | 5,738 | 3,643 | 16,317 | 15,658 | |||||||||||||||
| Limited partners’ interest in net income (loss) |
32,459 | (70,826 | ) | (29,619 | ) | 31,206 | (19,380 | ) | ||||||||||||
|
|
|
|
|
|
|
|
|
|
|
|||||||||||
| Weighted-average number of common units: |
||||||||||||||||||||
| - basic |
107,016,572 | 102,009,737 | 88,159,388 | 98,507,732 | 86,212,290 | |||||||||||||||
| - diluted |
107,047,391 | 102,009,737 | 88,159,388 | 98,602,412 | 86,212,290 | |||||||||||||||
| Total number of common units outstanding at end of period |
107,026,979 | 107,003,043 | 92,386,383 | 107,026,979 | 92,386,383 | |||||||||||||||
|
|
|
|
|
|
|
|
|
|
|
|||||||||||
| (1) | The Partnership has recast its financial results to include the financial results of the Knarr FPSO unit relating to the period prior to its acquisition by the Partnership from Teekay Corporation when it was under common control, which pre-acquisition results are referred to in this release as the Dropdown Predecessor. In accordance with GAAP, business acquisitions of entities under common control that have begun operations are required to be accounted for in a manner whereby the Partnership’s financial statements are retroactively adjusted to include the historical results of the acquired vessels from the date the vessels were originally under the control of Teekay Corporation. For these purposes, the Knarr FPSO unit was under common control by Teekay Corporation from March 9, 2015 to July 1, 2015, when it was sold to the Partnership. |
| (2) | General and administrative expenses for the three months ended September 30, 2015 and the year ended December 31, 2015 include one-time business development fees of $13.9 million paid to Teekay Corporation relating to the purchases of the Knarr FPSO unit, six towage vessels and the Arendal Spirit UMS. |
| (3) | The write-down for the three months ended December 31, 2015 includes the impairment of two of the Partnership’s 2000s-built conventional tankers and five of the Partnership’s 1990s-built shuttle tankers to their estimated fair value, using appraised values. The write-down of the two conventional tankers was the result of the expected sale of the vessels and the vessels were classified as held for sale on the Partnership’s consolidated balance sheet as at December 31, 2015. The write-down of the five shuttle tankers, which have an average age of 17.5 years, was the result of changes in our expectations of their future opportunities, primarily due to their advanced age. While we expect four of the five vessels to continue to actively trade as shuttle tankers over the near-term and the fifth vessel to actively trade in the conventional tanker market, we anticipate fewer opportunities for alternative usage and increased age discrimination over time. |
- more -
8
| (4) | Realized losses on derivative instruments relate to amounts the Partnership actually paid to settle derivative instruments, and the unrealized gains (losses) on derivative instruments relate to the change in fair value of such derivative instruments, as detailed in the table below: |
| Three Months Ended | Year Ended | |||||||||||||||||||
| December 31, 2015 |
September 30, 2015 |
December 31, 2014 |
December 31, 2015 |
December 31, 2014 |
||||||||||||||||
| Realized losses relating to: |
||||||||||||||||||||
| Interest rate swaps |
(15,363 | ) | (15,857 | ) | (13,729 | ) | (60,741 | ) | (55,588 | ) | ||||||||||
| Interest rate swap termination |
— | (10,876 | ) | — | (10,876 | ) | — | |||||||||||||
| Foreign currency forward contracts |
(3,909 | ) | (4,064 | ) | (1,331 | ) | (13,799 | ) | (1,912 | ) | ||||||||||
|
|
|
|
|
|
|
|
|
|
|
|||||||||||
| (19,272 | ) | (30,797 | ) | (15,060 | ) | (85,416 | ) | (57,500 | ) | |||||||||||
|
|
|
|
|
|
|
|
|
|
|
|||||||||||
| Unrealized gains (losses) relating to: |
||||||||||||||||||||
| Interest rate swaps |
34,255 | (43,453 | ) | (35,625 | ) | 11,952 | (75,777 | ) | ||||||||||||
| Foreign currency forward contracts |
1,495 | (2,852 | ) | (8,810 | ) | (240 | ) | (10,426 | ) | |||||||||||
|
|
|
|
|
|
|
|
|
|
|
|||||||||||
| 35,750 | (46,305 | ) | (44,435 | ) | 11,712 | (86,203 | ) | |||||||||||||
|
|
|
|
|
|
|
|
|
|
|
|||||||||||
|
|
|
|
|
|
|
|
|
|
|
|||||||||||
| Total realized and unrealized gains (losses) on derivative instruments |
16,478 | (77,102 | ) | (59,495 | ) | (73,704 | ) | (143,703 | ) | |||||||||||
|
|
|
|
|
|
|
|
|
|
|
|||||||||||
| (5) | Foreign currency exchange loss includes realized losses relating to the amounts the Partnership paid to settle its non-designated cross currency swaps that were entered into as an economic hedge relating to the Partnership’s Norwegian Kroner (NOK)-denominated unsecured bonds as detailed in the table below. The Partnership issued NOK 600 million of unsecured bonds in 2012 maturing in 2017, NOK 1,300 million of unsecured bonds in 2013 maturing in 2016 and 2018, and NOK 1,000 million of unsecured bonds in 2014 maturing in 2019. Foreign currency exchange loss also includes unrealized losses relating to the change in fair value of such derivative instruments, partially offset by unrealized gains on the revaluation of the NOK bonds, as detailed in the table below: |
| Three Months Ended | Year Ended | |||||||||||||||||||
| December 31, 2015 |
September 30, 2015 |
December 31, 2014 |
December 31, 2015 |
December 31, 2014 |
||||||||||||||||
| Realized losses on cross currency swaps |
(2,967 | ) | (2,840 | ) | (1,473 | ) | (10,140 | ) | (1,992 | ) | ||||||||||
| Unrealized losses on cross currency swaps |
(9,409 | ) | (32,649 | ) | (68,455 | ) | (61,734 | ) | (93,953 | ) | ||||||||||
| Unrealized gains on revaluation of NOK bonds |
12,615 | 28,722 | 62,127 | 61,217 | 85,989 | |||||||||||||||
- more -
9
Teekay Offshore Partners L.P.
Consolidated Balance Sheets
(in thousands of U.S. Dollars)
| As at | As at | As at | ||||||||||
| December 31, 2015 | September 30, 2015 | December 31, 2014 | ||||||||||
| (unaudited) | (unaudited) | (unaudited) | ||||||||||
| ASSETS |
||||||||||||
| Current |
||||||||||||
| Cash and cash equivalents |
258,473 | 251,058 | 252,138 | |||||||||
| Restricted cash - current |
51,431 | 40,241 | 4,704 | |||||||||
| Accounts receivable |
153,662 | 154,965 | 103,665 | |||||||||
| Vessels held for sale |
55,450 | 5,000 | — | |||||||||
| Net investments in direct financing leases - current |
5,936 | 5,781 | 4,987 | |||||||||
| Prepaid expenses |
34,027 | 42,450 | 30,211 | |||||||||
| Due from affiliates |
81,271 | 44,829 | 44,225 | |||||||||
| Advances to joint venture |
— | — | 5,225 | |||||||||
| Other current assets |
20,490 | 20,284 | 4,626 | |||||||||
|
|
|
|
|
|
|
|||||||
| Total current assets |
660,740 | 564,608 | 449,781 | |||||||||
|
|
|
|
|
|
|
|||||||
| Restricted cash - long-term |
9,089 | 9,109 | 42,056 | |||||||||
| Vessels and equipment |
||||||||||||
| At cost, less accumulated depreciation |
4,348,535 | 4,579,915 | 3,010,689 | |||||||||
| Advances on newbuilding contracts and conversion costs |
395,084 | 327,286 | 172,776 | |||||||||
| Net investments in direct financing leases |
11,535 | 13,038 | 17,471 | |||||||||
| Investment in equity accounted joint ventures |
77,647 | 70,458 | 54,955 | |||||||||
| Deferred tax assets |
30,050 | 15,046 | 5,959 | |||||||||
| Other assets |
82,341 | 86,035 | 35,005 | |||||||||
| Goodwill |
129,145 | 129,145 | 129,145 | |||||||||
|
|
|
|
|
|
|
|||||||
| Total assets |
5,744,166 | 5,794,640 | 3,917,837 | |||||||||
|
|
|
|
|
|
|
|||||||
| LIABILITIES AND EQUITY |
||||||||||||
| Current |
||||||||||||
| Accounts payable |
15,899 | 36,865 | 15,064 | |||||||||
| Accrued liabilities |
91,065 | 100,506 | 68,013 | |||||||||
| Deferred revenues |
54,378 | 50,220 | 25,669 | |||||||||
| Due to affiliates |
304,583 | 296,683 | 108,941 | |||||||||
| Current portion of derivative instruments |
201,456 | 124,414 | 85,318 | |||||||||
| Current portion of long-term debt |
470,589 | 453,651 | 249,671 | |||||||||
| Current portion of in-process revenue contracts |
12,779 | 12,779 | 12,744 | |||||||||
|
|
|
|
|
|
|
|||||||
| Total current liabilities |
1,150,749 | 1,075,118 | 565,420 | |||||||||
|
|
|
|
|
|
|
|||||||
| Long-term debt |
2,893,285 | 2,864,036 | 2,158,925 | |||||||||
| Derivative instruments |
221,329 | 324,051 | 257,754 | |||||||||
| In-process revenue contracts |
63,026 | 66,238 | 75,805 | |||||||||
| Other long-term liabilities |
192,258 | 214,481 | 44,238 | |||||||||
|
|
|
|
|
|
|
|||||||
| Total liabilities |
4,520,647 | 4,543,924 | 3,102,142 | |||||||||
|
|
|
|
|
|
|
|||||||
| Redeemable non-controlling interest |
3,173 | 5,574 | 12,842 | |||||||||
| Convertible Preferred Units (10.4 million and nil units issued and outstanding at December 31, 2015 and December 31, 2014, respectively) |
252,498 | 254,724 | — | |||||||||
| Equity |
||||||||||||
| Limited partners - common units (107.0 million and 92.4 million units issued and outstanding at December 31, 2015 and December 31, 2014, respectively) |
629,264 | 641,320 | 589,165 | |||||||||
| Limited partners - preferred units (11.0 million and 6.0 million units issued and outstanding at December 31, 2015 and December 31, 2014, respectively) |
266,925 | 266,924 | 144,800 | |||||||||
| General Partner |
17,608 | 25,039 | 21,038 | |||||||||
| Non-controlling interests |
53,355 | 58,220 | 47,850 | |||||||||
| Accumulated other comprehensive income (loss) |
696 | (1,085 | ) | — | ||||||||
|
|
|
|
|
|
|
|||||||
| Total equity |
967,848 | 990,418 | 802,853 | |||||||||
|
|
|
|
|
|
|
|||||||
| Total liabilities and total equity |
5,744,166 | 5,794,640 | 3,917,837 | |||||||||
|
|
|
|
|
|
|
|||||||
- more -
10
Teekay Offshore Partners L.P.
Consolidated Statements of Cash Flows
(in thousands of U.S. Dollars)
| Year Ended | ||||||||
| December 31, 2015 |
December 31, 2014 |
|||||||
| (unaudited)(1) | (unaudited) | |||||||
| Cash and cash equivalents provided by (used for) |
||||||||
| OPERATING ACTIVITIES |
||||||||
| Net income |
100,143 | 17,656 | ||||||
| Non-cash items: |
||||||||
| Unrealized loss on derivative instruments |
51,072 | 180,156 | ||||||
| Equity income, net of dividends received of $7,843 (2014 - $16,803) |
171 | 6,462 | ||||||
| Depreciation and amortization |
274,599 | 198,553 | ||||||
| Write-down and (gain) on sale of vessels |
69,998 | 1,638 | ||||||
| Deferred income tax (recovery) expense |
(23,007 | ) | 889 | |||||
| Amortization of in-process revenue contracts |
(12,745 | ) | (12,744 | ) | ||||
| Foreign currency exchange gain and other |
(101,853 | ) | (84,719 | ) | ||||
| Change in non-cash working capital items related to operating activities |
25,903 | (111,484 | ) | |||||
| Expenditures for dry docking |
(13,060 | ) | (36,221 | ) | ||||
|
|
|
|
|
|||||
| Net operating cash flow |
371,221 | 160,186 | ||||||
|
|
|
|
|
|||||
| FINANCING ACTIVITIES |
||||||||
| Proceeds from long-term debt |
785,577 | 1,350,096 | ||||||
| Scheduled repayments of long-term debt |
(341,837 | ) | (804,704 | ) | ||||
| Prepayments of long-term debt |
(123,606 | ) | (418,625 | ) | ||||
| Debt issuance costs |
(22,587 | ) | (15,555 | ) | ||||
| Purchase of Teekay Knarr AS and Knarr L.L.C from Teekay Corporation (net of cash acquired of $14.2 million) |
(112,710 | ) | — | |||||
| Increase in restricted cash |
(13,760 | ) | (46,760 | ) | ||||
| Proceeds from issuance of common units |
9,674 | 186,353 | ||||||
| Proceeds from issuance of preferred units |
375,000 | — | ||||||
| Expenses relating to equity offerings |
(4,459 | ) | (228 | ) | ||||
| Cash distributions paid by the Partnership |
(257,900 | ) | (214,656 | ) | ||||
| Settlement of contingent consideration liability |
(3,303 | ) | — | |||||
| Cash distributions paid by subsidiaries to non-controlling interests |
(23,575 | ) | (27,939 | ) | ||||
| Equity contribution from joint venture partners |
5,500 | 27,267 | ||||||
| Purchase of Voyageur LLC from Teekay Corporation |
— | 6,181 | ||||||
| Other |
1,124 | 974 | ||||||
|
|
|
|
|
|||||
| Net financing cash flow |
273,138 | 42,404 | ||||||
|
|
|
|
|
|||||
| INVESTING ACTIVITIES |
||||||||
| Expenditures for vessels and equipment, including advances on newbuilding contracts and conversion costs |
(664,667 | ) | (172,169 | ) | ||||
| Proceeds from sale of vessels and equipment |
8,918 | 13,364 | ||||||
| Repayment (advances) from (to) joint venture partners and equity accounted joint ventures |
5,225 | (5,225 | ) | |||||
| Direct financing lease payments received |
4,987 | 5,097 | ||||||
| Investment in equity accounted joint ventures |
(22,855 | ) | (12,413 | ) | ||||
| Acquisition of ALP Maritime Services B.V. (net of cash acquired of $0.3 million) |
— | (2,322 | ) | |||||
| Acquisition of Logitel Offshore Holding AS (net of cash acquired of $8.1 million) |
— | 4,090 | ||||||
| Proceeds from sale of SPT Explorer L.L.C. and Navigator Spirit L.L.C. |
30,368 | — | ||||||
|
|
|
|
|
|||||
| Net investing cash flow |
(638,024 | ) | (169,578 | ) | ||||
|
|
|
|
|
|||||
| Increase in cash and cash equivalents |
6,335 | 33,012 | ||||||
| Cash and cash equivalents, beginning of the year |
252,138 | 219,126 | ||||||
|
|
|
|
|
|||||
| Cash and cash equivalents, end of the year |
258,473 | 252,138 | ||||||
|
|
|
|
|
|||||
| (1) | In accordance with GAAP, the Consolidated Statement of Cash Flows for the year ended December 31, 2015 includes the cash flows relating to the Knarr FPSO unit Dropdown Predecessor for the period from March 9, 2015 to July 1, 2015, when the vessel was under the common control of Teekay Corporation, but prior to its acquisition by the Partnership. |
- more -
11
Teekay Offshore Partners L.P.
Appendix A – Specific Items Affecting Net Income (Loss)
(in thousands of U.S. Dollars)
Set forth below is a reconciliation of the Partnership’s unaudited adjusted net income attributable to the partners, a non-GAAP financial measure, to net income (loss) attributable to the partners as determined in accordance with GAAP. The Partnership believes that, in addition to conventional measures prepared in accordance with GAAP, certain investors use this information to evaluate the Partnership’s financial performance. The items below are also typically excluded by securities analysts in their published estimates of the Partnership’s financial results. Adjusted net income attributable to the partners is intended to provide additional information and should not be considered a substitute for measures of performance prepared in accordance with GAAP.
| Three Months Ended | Year Ended | |||||||||||||||
| December 31, 2015 |
December 31, 2014 |
December 31, 2015 |
December 31, 2014 |
|||||||||||||
| (unaudited) | (unaudited) | (unaudited) | (unaudited) | |||||||||||||
| Net income (loss) – GAAP basis |
46,700 | (17,710 | ) | 100,143 | 17,656 | |||||||||||
| Adjustments: |
||||||||||||||||
| Net income attributable to non-controlling interests |
(2,829 | ) | (5,547 | ) | (13,911 | ) | (10,503 | ) | ||||||||
| Net income attributable to Dropdown Predecessor |
— | — | (10,100 | ) | — | |||||||||||
|
|
|
|
|
|
|
|
|
|||||||||
| Net income (loss) attributable to the partners |
43,871 | (23,257 | ) | 76,132 | 7,153 | |||||||||||
|
|
|
|
|
|
|
|
|
|||||||||
| Add (subtract) specific items affecting net income (loss): |
||||||||||||||||
| Foreign currency exchange (gains) losses(1) |
(2,140 | ) | 10,117 | 5,231 | 14,148 | |||||||||||
| Unrealized (gains) losses on derivative instruments(2) |
(34,886 | ) | 45,147 | (5,844 | ) | 86,615 | ||||||||||
| Realized loss on swap termination |
— | — | 10,876 | — | ||||||||||||
| Write-down and (gain) on sale of vessels(3) |
55,645 | (3,121 | ) | 69,998 | 1,638 | |||||||||||
| Deferred income tax recovery relating to Norwegian tax structure(4) |
(15,455 | ) | — | (21,289 | ) | — | ||||||||||
| Pre-operational costs(5) |
3,890 | — | 10,474 | — | ||||||||||||
| Business development fees and other(6) |
2,323 | 8,833 | 18,029 | 10,812 | ||||||||||||
| Non-controlling interests’ share of items above(7) |
437 | 2,387 | 2,088 | 3,480 | ||||||||||||
|
|
|
|
|
|
|
|
|
|||||||||
| Total adjustments |
9,814 | 63,363 | 89,563 | 116,693 | ||||||||||||
|
|
|
|
|
|
|
|
|
|||||||||
| Adjusted net income attributable to the partners(8) |
53,685 | 40,106 | 165,695 | 123,846 | ||||||||||||
|
|
|
|
|
|
|
|
|
|||||||||
| (1) | Foreign currency exchange (gains) losses primarily relate to the Partnership’s revaluation of all foreign currency-denominated monetary assets and liabilities based on the prevailing exchange rate at the end of each reporting period and unrealized gains or losses related to the Partnership’s cross currency swaps for outstanding Norwegian bonds of the Partnership and excludes the realized gains and losses relating to the cross currency swaps. |
| (2) | Reflects the unrealized (gains) losses due to changes in the mark-to-market value of interest rate swaps and foreign exchange forward contracts that are not designated as hedges for accounting purposes, including the unrealized mark-to-market value of the interest rate swaps within the Cidade de Itajai FPSO and Libra FPSO equity accounted joint ventures. |
| (3) | Please refer to footnote (3) of the summary consolidated statements of income (loss) about the write-down of vessels for the three months ended December 31, 2015. Results for the year ended December 31, 2015 also include the write-down of two of the Partnership’s 1990s-built shuttle tankers and a gain on the sale of a 1997-built shuttle tanker, the Navion Svenita. The write-down of one of these shuttle tankers was a result of the expected sale of the vessel and the vessel was classified as held for sale as at December 31, 2015. This vessel was subsequently sold in January 2016 for gross proceeds of $5.1 million. The write-down of the second shuttle tanker was a result of a change in the operating plan of the vessel. |
| (4) | Reflects the increase in the deferred income tax assets within the Partnership’s Norwegian tax group. |
| (5) | Reflects the realized losses on foreign currency forward contracts relating to upgrade costs on the Petrojarl I FPSO unit, depreciation and amortization expense relating to the Petrojarl I FPSO unit while undergoing conversion, and costs associated to the delivery deferral of the Stavanger Spirit UMS. |
| (6) | Other items for the three months ended December 31, 2015 include net early termination fees paid to Teekay Corporation of $1.8 million, a restructuring charge of $0.3 million relating to a seafarer redundancy accrual in the Partnership’s shuttle tanker fleet and a $0.3 million write-down of inventory assets. Other items for the year ended December 31, 2015 include one-time business development fees of $13.9 million paid to Teekay Corporation relating to the purchases of the Knarr FPSO unit, six towage vessels, and the Arendal Spirit UMS, the ineffective portion of losses on interest rate swaps designated and qualifying as cash flow hedges of $1.1 million, a $0.7 million write-down of inventory assets, and a restructuring charge of $0.6 million relating to seafarer redundancy in the Partnership’s shuttle tanker fleet. Other items for the three months and year ended December 31, 2014 include $4.7 million of mobilization costs related to the HiLoad DP unit, fees of $2.1 million paid to Teekay Corporation associated with the Partnership’s acquisition of the Petrojarl I FPSO unit, and a $2.0 million and $1.4 million charge, respectively, related to pension adjustments. Other items for the year ended December 31, 2014 also include fees of $2.6 million associated with the Partnership’s acquisition of ALP. |
| (7) | Items affecting net income (loss) include items from the Partnership’s consolidated non-wholly-owned subsidiaries. The specific items affecting net income (loss) are analyzed to determine whether any of the amounts originated from a consolidated non-wholly-owned subsidiary. Each amount that originates from a consolidated non-wholly-owned subsidiary is multiplied by the non-controlling interests’ percentage share in this subsidiary to arrive at the non-controlling interests’ share of the amount. The amount identified as “non-controlling interests’ share of items above” in the table above is the cumulative amount of the non-controlling interests’ proportionate share of items listed in the table. |
| (8) | For the year ended December 31, 2014, adjusted net income attributable to the partners excludes $3.5 million of indemnification payments from Teekay Corporation relating to the loss of revenues and certain unrecovered vessel operating expenses for the Voyageur Spirit FPSO. |
- more -
12
Teekay Offshore Partners L.P.
Appendix B – Reconciliation of Non-GAAP Financial Measure
Distributable Cash Flow
(in thousands of U.S. Dollars)
Distributable cash flow represents net income (loss) adjusted for depreciation and amortization expense, non-controlling interests, non-cash items, distributions relating to equity financing of newbuilding installments, distributions on our preferred units, vessel and business acquisition costs, estimated maintenance capital expenditures, write-down and gains on sale of vessels, unrealized gains and losses from derivatives, realized losses on termination of interest rate swaps, non-cash income taxes and unrealized foreign exchange related items. Maintenance capital expenditures represent those capital expenditures required to maintain over the long-term the operating capacity of, or the revenue generated by, the Partnership’s capital assets. Distributable cash flow is a quantitative standard used in the publicly-traded partnership investment community to assist in evaluating a partnership’s ability to make quarterly cash distributions. Distributable cash flow is not defined by GAAP and should not be considered as an alternative to net income (loss) or any other indicator of the Partnership’s performance required by GAAP. The table below reconciles distributable cash flow to net income (loss) for the quarters and years ended December 31, 2015 and December 31, 2014, respectively.
| Three Months Ended | Year Ended | |||||||||||||||
| December 31, | December 31, | |||||||||||||||
| 2015 | 2014 | 2015 | 2014 | |||||||||||||
| (unaudited) | (unaudited) | (unaudited) | (unaudited) | |||||||||||||
| Net income (loss) |
46,700 | (17,710 | ) | 100,143 | 17,656 | |||||||||||
| Net income attributable to Dropdown Predecessor |
— | — | (10,100 | ) | — | |||||||||||
|
|
|
|
|
|
|
|
|
|||||||||
| Net income attributable to the partners and non-controlling interests’ |
46,700 | (17,710 | ) | 90,043 | 17,656 | |||||||||||
| Depreciation and amortization |
71,974 | 51,832 | 252,269 | 198,553 | ||||||||||||
| Vessel and business acquisition costs(1) |
— | — | 13,920 | — | ||||||||||||
| Realized loss on termination of interest rate swap |
— | — | 10,876 | — | ||||||||||||
| Equity income from joint ventures |
(913 | ) | (1,764 | ) | (7,672 | ) | (10,341 | ) | ||||||||
| Distributions relating to equity financing of newbuildings and conversion costs |
3,034 | 2,824 | 19,210 | 8,393 | ||||||||||||
| Partnership’s share of equity accounted joint venture’s distributable cash flow net of estimated maintenance capital expenditures |
2,754 | 2,525 | 16,985 | 14,451 | ||||||||||||
| Write-down and (gain on sale) of vessels |
55,645 | (3,121 | ) | 69,998 | 1,638 | |||||||||||
| Distributions relating to preferred units |
(10,525 | ) | (2,719 | ) | (28,608 | ) | (10,876 | ) | ||||||||
| Estimated maintenance capital expenditures(2) |
(39,718 | ) | (28,240 | ) | (137,194 | ) | (114,338 | ) | ||||||||
| Unrealized (gains) losses on derivative instruments(3) |
(35,750 | ) | 44,435 | (9,976 | ) | 86,203 | ||||||||||
| Foreign currency exchange and other, net |
(21,484 | ) | 8,560 | (22,510 | ) | 11,342 | ||||||||||
|
|
|
|
|
|
|
|
|
|||||||||
| Distributable cash flow before non-controlling interests |
71,717 | 56,622 | 267,341 | 206,155 | ||||||||||||
| Non-controlling interests’ share of DCF |
(4,718 | ) | (6,667 | ) | (22,617 | ) | (19,842 | ) | ||||||||
|
|
|
|
|
|
|
|
|
|||||||||
| Distributable Cash Flow |
66,999 | 49,955 | 244,724 | 186,313 | ||||||||||||
| Amount attributable to the General Partner |
(240 | ) | (5,262 | ) | (19,174 | ) | (19,891 | ) | ||||||||
|
|
|
|
|
|
|
|
|
|||||||||
| Limited partners’ Distributable Cash Flow |
66,759 | 44,693 | 225,550 | 166,422 | ||||||||||||
| Weighted-average number of common units outstanding |
107,016,572 | 88,159,388 | 98,507,732 | 86,212,290 | ||||||||||||
|
|
|
|
|
|
|
|
|
|||||||||
| Distributable Cash Flow per limited partner unit |
0.62 | 0.51 | 2.29 | 1.93 | ||||||||||||
|
|
|
|
|
|
|
|
|
|||||||||
| (1) | Vessel and business acquisition costs relate to business development fees of $13.9 million paid to Teekay Corporation relating to the purchases of the Knarr FPSO unit, the six towage vessels and the Arendal Spirit UMS. |
| (2) | Estimated maintenance capital expenditures relating to the Partnership’s equity accounted joint venture for the three months ended December 31, 2015 and 2014 were $1.0 million and $1.0 million, respectively, and for the years ended December 31, 2015 and 2014 were $4.2 million and $4.2 million, respectively. |
| (3) | Derivative instruments include interest rate swaps and foreign exchange forward contracts. |
- more -
13
Teekay Offshore Partners L.P.
Appendix C – Reconciliation of Non-GAAP Financial Measure
Net Revenues
(in thousands of U.S. Dollars)
Net revenues represents revenues less voyage expenses, which comprise all expenses relating to certain voyages, including bunker fuel expenses, port fees, cargo loading and unloading expenses, canal tolls, agency fees and commissions. Net revenues is a non-GAAP financial measure used by certain investors to measure the financial performance of shipping companies, however, it is not required by GAAP and should not be considered as an alternative to revenues or any other indicator of the Partnership’s performance required by GAAP.
| Three Months Ended December 31, 2015 | ||||||||||||||||||||||||||||
| (unaudited) | ||||||||||||||||||||||||||||
| Shuttle Tanker Segment |
FPSO Segment |
FSO Segment |
Conventional Tanker Segment |
Towage Segment |
UMS Segment(1) |
Total | ||||||||||||||||||||||
| Revenues |
139,422 | 153,669 | 14,506 | 5,917 | 12,717 | 12,911 | 339,142 | |||||||||||||||||||||
| Voyage expenses |
(21,428 | ) | — | (413 | ) | (346 | ) | (4,420 | ) | — | (26,607 | ) | ||||||||||||||||
|
|
|
|
|
|
|
|
|
|
|
|
|
|
|
|||||||||||||||
| Net revenues |
117,994 | 153,669 | 14,093 | 5,571 | 8,297 | 12,911 | 312,535 | |||||||||||||||||||||
|
|
|
|
|
|
|
|
|
|
|
|
|
|
|
|||||||||||||||
| Three Months Ended December 31, 2014 | ||||||||||||||||||||||||||||
| (unaudited) | ||||||||||||||||||||||||||||
| Shuttle Tanker Segment |
FPSO Segment |
FSO Segment |
Conventional Tanker Segment |
Towage Segment |
UMS Segment(1) |
Total | ||||||||||||||||||||||
| Revenues |
142,065 | 94,595 | 15,120 | 8,527 | 154 | — | 260,461 | |||||||||||||||||||||
| Voyage expenses |
(22,764 | ) | — | (290 | ) | (1,110 | ) | (44 | ) | — | (24,208 | ) | ||||||||||||||||
|
|
|
|
|
|
|
|
|
|
|
|
|
|
|
|||||||||||||||
| Net revenues |
119,301 | 94,595 | 14,830 | 7,417 | 110 | — | 236,253 | |||||||||||||||||||||
|
|
|
|
|
|
|
|
|
|
|
|
|
|
|
|||||||||||||||
| Year Ended December 31, 2015 | ||||||||||||||||||||||||||||
| (unaudited) | ||||||||||||||||||||||||||||
| Shuttle Tanker Segment |
FPSO Segment |
FSO Segment |
Conventional Tanker Segment |
Towage Segment |
UMS Segment(1) |
Total | ||||||||||||||||||||||
| Revenues |
541,792 | 531,554 | 57,391 | 30,230 | 40,112 | 28,334 | 1,229,413 | |||||||||||||||||||||
| Voyage expenses |
(82,777 | ) | — | (851 | ) | (2,326 | ) | (12,052 | ) | — | (98,006 | ) | ||||||||||||||||
|
|
|
|
|
|
|
|
|
|
|
|
|
|
|
|||||||||||||||
| Net revenues |
459,015 | 531,554 | 56,540 | 27,904 | 28,060 | 28,334 | 1,131,407 | |||||||||||||||||||||
|
|
|
|
|
|
|
|
|
|
|
|
|
|
|
|||||||||||||||
| Year Ended December 31, 2014 | ||||||||||||||||||||||||||||
| (unaudited) | ||||||||||||||||||||||||||||
| Shuttle Tanker Segment |
FPSO Segment |
FSO Segment |
Conventional Tanker Segment |
Towage Segment |
UMS Segment(1) |
Total | ||||||||||||||||||||||
| Revenues |
577,064 | 354,518 | 53,868 | 33,566 | 523 | — | 1,019,539 | |||||||||||||||||||||
| Voyage expenses |
(105,562 | ) | — | (1,500 | ) | (5,373 | ) | (105 | ) | — | (112,540 | ) | ||||||||||||||||
|
|
|
|
|
|
|
|
|
|
|
|
|
|
|
|||||||||||||||
| Net revenues |
471,502 | 354,518 | 52,368 | 28,193 | 418 | — | 906,999 | |||||||||||||||||||||
|
|
|
|
|
|
|
|
|
|
|
|
|
|
|
|||||||||||||||
| (1) | The Partnership acquired 100% of the outstanding shares of Logitel during the third quarter of 2014 and operations began in the second quarter of 2015. |
- more -
14
Teekay Offshore Partners L.P.
Appendix D – Supplemental Segment Information
(in thousands of U.S. Dollars)
| Three Months Ended December 31, 2015 | ||||||||||||||||||||||||||||
| (unaudited) | ||||||||||||||||||||||||||||
| Shuttle Tanker Segment |
FPSO Segment |
FSO Segment |
Conventional Tanker Segment |
Towage Segment |
UMS Segment |
Total | ||||||||||||||||||||||
| Net revenues (See Appendix C) |
117,994 | 153,669 | 14,093 | 5,571 | 8,297 | 12,911 | 312,535 | |||||||||||||||||||||
| Vessel operating expenses |
(33,906 | ) | (55,148 | ) | (6,603 | ) | (1,726 | ) | (4,763 | ) | (6,774 | ) | (108,920 | ) | ||||||||||||||
| Time-charter hire expense |
(15,112 | ) | — | — | — | — | — | (15,112 | ) | |||||||||||||||||||
| Depreciation and amortization |
(25,666 | ) | (37,595 | ) | (2,584 | ) | (1,558 | ) | (2,874 | ) | (1,697 | ) | (71,974 | ) | ||||||||||||||
| General and administrative |
(3,535 | ) | (9,155 | ) | (159 | ) | (155 | ) | (781 | ) | (405 | ) | (14,190 | ) | ||||||||||||||
| Write-down on sale of vessel |
(51,248 | ) | — | — | (3,897 | ) | — | (500 | ) | (55,645 | ) | |||||||||||||||||
| Restructuring recovery |
(276 | ) | — | — | — | — | — | (276 | ) | |||||||||||||||||||
|
|
|
|
|
|
|
|
|
|
|
|
|
|
|
|||||||||||||||
| Income (loss) from vessel operations |
(11,749 | ) | 51,771 | 4,747 | (1,765 | ) | (121 | ) | 3,535 | 46,418 | ||||||||||||||||||
|
|
|
|
|
|
|
|
|
|
|
|
|
|
|
|||||||||||||||
| Three Months Ended December 31, 2014 | ||||||||||||||||||||||||||||
| (unaudited) | ||||||||||||||||||||||||||||
| Shuttle Tanker Segment |
FPSO Segment |
FSO Segment |
Conventional Tanker Segment |
Towage Segment |
UMS Segment |
Total | ||||||||||||||||||||||
| Net revenues (See Appendix C) |
119,301 | 94,595 | 14,830 | 7,417 | 110 | — | 236,253 | |||||||||||||||||||||
| Vessel operating expenses |
(40,386 | ) | (35,211 | ) | (7,275 | ) | (1,422 | ) | — | — | (84,294 | ) | ||||||||||||||||
| Time-charter hire expense |
(7,618 | ) | — | — | — | — | — | (7,618 | ) | |||||||||||||||||||
| Depreciation and amortization |
(28,300 | ) | (18,629 | ) | (3,059 | ) | (1,844 | ) | — | — | (51,832 | ) | ||||||||||||||||
| General and administrative |
(9,470 | ) | (8,516 | ) | (1,217 | ) | (497 | ) | (672 | ) | (203 | ) | (20,575 | ) | ||||||||||||||
| Gain on sale of vessel |
3,121 | — | — | — | — | — | 3,121 | |||||||||||||||||||||
|
|
|
|
|
|
|
|
|
|
|
|
|
|
|
|||||||||||||||
| Income (loss) from vessel operations |
36,648 | 32,239 | 3,279 | 3,654 | (562 | ) | (203 | ) | 75,055 | |||||||||||||||||||
|
|
|
|
|
|
|
|
|
|
|
|
|
|
|
|||||||||||||||
- more -
15
Teekay Offshore Partners L.P.
Appendix E – Reconciliation of Non-GAAP Financial Measure
Cash Flow From Vessel Operations From Consolidated Vessels
(in thousands of U.S. Dollars)
Cash flow from vessel operations from consolidated vessels represents (loss) income from vessel operations before depreciation and amortization expense, write-down and gain on sale of vessels, and amortization of the non-cash portion of revenue contracts, and includes the realized gains and losses on the settlement of foreign exchange forward contracts and adjusts for direct financing leases to a cash basis. Cash flow from vessel operations is included because certain investors use this data to measure a company’s financial performance. Cash flow from vessel operations is not required by GAAP and should not be considered as an alternative to net income (loss) or any other indicator of the Partnership’s performance required by GAAP.
| Three Months Ended | Year Ended | |||||||||||||||||||||||||||||||
| December 31, 2015 |
December 31, 2015 |
|||||||||||||||||||||||||||||||
| (unaudited) | (unaudited) | |||||||||||||||||||||||||||||||
| Shuttle Tanker Segment |
FPSO Segment |
FSO Segment |
Conventional Tanker Segment |
Towage Segment |
UMS Segment |
Total | Total | |||||||||||||||||||||||||
| Income (loss) from vessel operations (See Appendix D) |
(11,749 | ) | 51,771 | 4,747 | (1,765 | ) | (121 | ) | 3,535 | 46,418 | 260,620 | |||||||||||||||||||||
| Depreciation and amortization |
25,666 | 37,595 | 2,584 | 1,558 | 2,874 | 1,697 | 71,974 | 252,269 | ||||||||||||||||||||||||
| Realized losses from the settlements of non-designated foreign exchange forward contracts |
(1,942 | ) | (1,564 | ) | — | — | — | — | (3,506 | ) | (12,409 | ) | ||||||||||||||||||||
| Amortization of non-cash portion of revenue contracts |
— | (4,041 | ) | — | — | — | — | (4,041 | ) | (14,401 | ) | |||||||||||||||||||||
| Write-down of vessels |
51,248 | — | — | 3,897 | — | 500 | 55,645 | 69,998 | ||||||||||||||||||||||||
| Falcon Spirit revenue accounted for as direct financing lease |
— | — | (836 | ) | — | — | — | (836 | ) | (3,658 | ) | |||||||||||||||||||||
| Falcon Spirit cash flow from time-charter contracts |
— | — | 2,184 | — | — | — | 2,184 | 8,644 | ||||||||||||||||||||||||
|
|
|
|
|
|
|
|
|
|
|
|
|
|
|
|
|
|||||||||||||||||
| Cash flow from vessel operations from consolidated vessels |
63,223 | 83,761 | 8,679 | 3,690 | 2,753 | 5,732 | 167,838 | 561,063 | ||||||||||||||||||||||||
|
|
|
|
|
|
|
|
|
|
|
|
|
|
|
|
|
|||||||||||||||||
| Three Months Ended | Year Ended | |||||||||||||||||||||||||||||||
| December, 31 2014 |
December, 31 2014 |
|||||||||||||||||||||||||||||||
| (unaudited) | (unaudited) | |||||||||||||||||||||||||||||||
| Shuttle Tanker Segment |
FPSO Segment |
FSO Segment |
Conventional Tanker Segment |
Towage Segment |
UMS Segment |
Total | Total | |||||||||||||||||||||||||
| Income (loss) from vessel operations (See Appendix D) |
36,648 | 32,239 | 3,279 | 3,654 | (562 | ) | (203 | ) | 75,055 | 256,218 | ||||||||||||||||||||||
| Depreciation and amortization |
28,300 | 18,629 | 3,059 | 1,844 | — | — | 51,832 | 198,553 | ||||||||||||||||||||||||
| Realized losses from the settlements of non-designated foreign exchange forward contracts |
(1,114 | ) | (217 | ) | — | — | — | — | (1,331 | ) | (1,910 | ) | ||||||||||||||||||||
| Amortization of non-cash portion of revenue contracts |
— | (3,212 | ) | — | — | — | — | (3,212 | ) | (12,743 | ) | |||||||||||||||||||||
| Write-down and (gain) on sale of vessels |
(3,121 | ) | — | — | — | — | — | (3,121 | ) | 1,638 | ||||||||||||||||||||||
| Falcon Spirit revenue accounted for as direct financing lease |
— | — | (1,054 | ) | — | — | — | (1,054 | ) | (4,483 | ) | |||||||||||||||||||||
| Falcon Spirit cash flow from time-charter contracts |
— | — | 2,169 | — | — | — | 2,169 | 8,618 | ||||||||||||||||||||||||
|
|
|
|
|
|
|
|
|
|
|
|
|
|
|
|
|
|||||||||||||||||
| Cash flow from (used for) vessel operations from consolidated vessels |
60,713 | 47,439 | 7,453 | 5,498 | (562 | ) | (203 | ) | 120,338 | 445,891 | ||||||||||||||||||||||
|
|
|
|
|
|
|
|
|
|
|
|
|
|
|
|
|
|||||||||||||||||
- more -
16
Teekay Offshore Partners L.P.
Appendix F – Reconciliation of Non-GAAP Financial Measure
Cash Flow From Vessel Operations From Equity Accounted Vessels
(in thousands of U.S. Dollars)
Cash flow from vessel operations from equity accounted vessels represents income from vessel operations before depreciation and amortization expense. Cash flow from equity accounted vessel represents the Partnership’s proportionate share of cash flow from vessel operations from its equity-accounted vessels, the Cidade de Itajai FPSO unit and the Libra FPSO conversion project. Cash flow from vessel operations from equity accounted vessels is included because certain investors use cash flow from vessel operations to measure a company’s financial performance, and to highlight this measure for the Partnership’s equity accounted joint ventures. Cash flow from vessel operations from equity accounted vessels is not required by GAAP and should not be considered as an alternative to equity income or any other indicator of the Partnership’s performance required by GAAP.
| Three Months Ended | Three Months Ended | |||||||||||||||
| December 31, 2015 | December 31, 2014 | |||||||||||||||
| (unaudited) | (unaudited) | |||||||||||||||
| At | Partnership’s | At | Partnership’s | |||||||||||||
| 100% | 50% | 100% | 50% | |||||||||||||
| Voyage revenues |
19,254 | 9,627 | 19,166 | 9,583 | ||||||||||||
| Vessel and other operating expenses |
(9,071 | ) | (4,536 | ) | (9,018 | ) | (4,509 | ) | ||||||||
| Depreciation and amortization |
(3,901 | ) | (1,951 | ) | (2,226 | ) | (1,113 | ) | ||||||||
| General and administrative |
— | — | 118 | 59 | ||||||||||||
|
|
|
|
|
|
|
|
|
|||||||||
| Income from vessel operations of equity accounted vessels |
6,282 | 3,140 | 8,040 | 4,020 | ||||||||||||
|
|
|
|
|
|
|
|
|
|||||||||
| Net interest expense |
(1,720 | ) | (860 | ) | (1,884 | ) | (942 | ) | ||||||||
| Realized and unrealized losses on derivative instruments(1) |
(2,810 | ) | (1,405 | ) | (2,746 | ) | (1,373 | ) | ||||||||
|
|
|
|
|
|
|
|
|
|||||||||
| Total other items |
(4,530 | ) | (2,265 | ) | (2,746 | ) | (2,315 | ) | ||||||||
|
|
|
|
|
|
|
|
|
|||||||||
| Net income / equity income of equity accounted vessel before income tax recovery |
1,752 | 875 | 3,410 | 1,705 | ||||||||||||
| Income tax recovery |
76 | 38 | 118 | 59 | ||||||||||||
|
|
|
|
|
|
|
|
|
|||||||||
| Net income / equity income of equity accounted vessels |
1,828 | 913 | 3,528 | 1,764 | ||||||||||||
|
|
|
|
|
|
|
|
|
|||||||||
| Income from vessel operations of equity accounted vessels |
6,282 | 3,140 | 8,040 | 4,020 | ||||||||||||
| Depreciation and amortization |
3,901 | 1,951 | 2,226 | 1,113 | ||||||||||||
|
|
|
|
|
|
|
|
|
|||||||||
| Cash flow from vessel operations from equity accounted vessels |
10,183 | 5,091 | 10,266 | 5,133 | ||||||||||||
|
|
|
|
|
|
|
|
|
|||||||||
| (1) | Realized and unrealized losses on derivative instruments for the three months ended December 31, 2015 and 2014 include total unrealized losses of $1.7 million ($0.9 million at the Partnership’s 50% share) and unrealized losses of $1.4 million ($0.7 million at the Partnership’s 50% share), respectively, related to interest rate swaps for the Libra FPSO conversion project and the Cidade de Itajai FPSO unit. |
- more -
17
| Year Ended | Year Ended | |||||||||||||||
| December 31, 2015 | December 31, 2014 | |||||||||||||||
| (unaudited) | (unaudited) | |||||||||||||||
| At | Partnership’s | At | Partnership’s | |||||||||||||
| 100% | 50% | 100% | 50% | |||||||||||||
| Voyage revenues |
82,831 | 41,416 | 82,845 | 41,423 | ||||||||||||
| Vessel and other operating expenses |
(28,188 | ) | (14,095 | ) | (31,424 | ) | (15,712 | ) | ||||||||
| Depreciation and amortization |
(16,711 | ) | (8,356 | ) | (16,172 | ) | (8,086 | ) | ||||||||
| General and administrative |
(2 | ) | (1 | ) | 21 | 11 | ||||||||||
| Loss on sale of asset |
(579 | ) | (290 | ) | — | — | ||||||||||
|
|
|
|
|
|
|
|
|
|||||||||
| Income from vessel operations of equity accounted vessels |
37,351 | 18,674 | 35,270 | 17,636 | ||||||||||||
|
|
|
|
|
|
|
|
|
|||||||||
| Net interest expense |
(8,468 | ) | (4,234 | ) | (7,997 | ) | (3,999 | ) | ||||||||
| Realized and unrealized losses on derivative instruments(1) |
(13,214 | ) | (6,607 | ) | (6,656 | ) | (3,328 | ) | ||||||||
|
|
|
|
|
|
|
|
|
|||||||||
| Total other items |
(21,682 | ) | (10,841 | ) | (14,653 | ) | (7,327 | ) | ||||||||
|
|
|
|
|
|
|
|
|
|||||||||
| Net income / equity income of equity accounted vessel before income tax (expense) recovery |
15,669 | 7,833 | 20,617 | 10,309 | ||||||||||||
| Income tax (expense) recovery |
(321 | ) | (161 | ) | 63 | 32 | ||||||||||
|
|
|
|
|
|
|
|
|
|||||||||
| Net income / equity income of equity accounted vessels |
15,348 | 7,672 | 20,680 | 10,341 | ||||||||||||
|
|
|
|
|
|
|
|
|
|||||||||
| Income from vessel operations of equity accounted vessels |
37,351 | 18,674 | 35,270 | 17,636 | ||||||||||||
| Depreciation and amortization |
16,711 | 8,356 | 16,172 | 8,086 | ||||||||||||
| Loss on sale of asset |
579 | 290 | — | — | ||||||||||||
|
|
|
|
|
|
|
|
|
|||||||||
| Cash flow from vessel operations from equity accounted vessels |
54,641 | 27,320 | 51,442 | 25,722 | ||||||||||||
|
|
|
|
|
|
|
|
|
|||||||||
| (1) | Realized and unrealized losses on derivative instruments for the year ended December 31, 2015 and 2014 include total unrealized losses of $8.3 million ($4.1 million at the Partnership’s 50% share) and unrealized losses of $0.8 million ($0.4 million at the Partnership’s 50% share), respectively, related to interest rate swaps for the Libra FPSO conversion project and the Cidade de Itajai FPSO unit. |
- more -
18
Forward Looking Statements
This release contains forward-looking statements (as defined in Section 21E of the Securities Exchange Act of 1934, as amended) which reflect management’s current views with respect to certain future events and performance, including statements regarding: the Partnership’s use of internally generated cash flows to contribute to the funding of growth projects; the impact of cash distribution reductions on the Partnership’s financial position; the potential for future cash distribution changes; the pending sale of the Kilimanjaro Spirit and Fuji Spirit, including the impact on future liquidity; the stability and growth of the Partnership’s future cash flows; the impact of growth projects on the Partnership’s future distributable cash flow per unit; the expected redelivery date and potential redeployment of the Varg FPSO; the timing of newbuilding, conversion and upgrade vessel or offshore unit deliveries and commencement of their respective charter contracts; and the Partnership’s focus on the future redeployment of existing assets onto new contracts instead of new organic growth projects, implementing various cost saving initiatives, and addressing remaining funding needs. The following factors are among those that could cause actual results to differ materially from the forward-looking statements, which involve risks and uncertainties, and that should be considered in evaluating any such statement: vessel operations and oil production volumes; significant changes in oil prices; variations in expected levels of field maintenance; increased operating expenses; different-than-expected levels of oil production in the North Sea, Brazil and East Coast of Canada offshore fields; potential early termination of contracts; shipyard delivery or vessel conversion and upgrade delays and cost overruns; changes in exploration, production and storage of offshore oil and gas, either generally or in particular regions that would impact expected future growth; delays in the commencement of charter contracts; potential delays in the sale of the Kilimanjaro Spirit and Fuji Spirit; the Partnership’s ability to raise adequate financing for existing growth projects, refinance future debt maturities, and other financing requirements; failure by the Partnership to secure a contract for the Varg FPSO; and other factors discussed in Teekay Offshore’s filings from time to time with the SEC, including its Report on Form 20-F for the fiscal year ended December 31, 2014 and Form 6-K for the quarters ended March 31, 2015, June 30, 2015 and September 30, 2015. The Partnership expressly disclaims any obligation or undertaking to release publicly any updates or revisions to any forward-looking statements contained herein to reflect any change in the Partnership’s expectations with respect thereto or any change in events, conditions or circumstances on which any such statement is based.
- end -
19
| Exhibit 99.2
|

TEEKAY OFFSHORE PARTNERS
Q4-2015 EARNINGS AND BUSINESS OUTLOOK PRESENTATION
February 18, 2016
|
|
Forward Looking Statements
This presentation contains forward-looking statements (as defined in Section 21E of the Securities Exchange Act of 1934, as amended) which reflect management’s current views with respect to certain future events and performance, including statements regarding: expected growth in global oil demand, declines in production from conventional oilfields and an increasing role to be played by deepwater oil exploration and production; the number of FPSO projects expected to be awarded in future, deflation in field development and production costs and a preference of oil companies for lower cost and quick-to-market solutions; global increases in the utilization of shuttle tankers and the tightness of their supply; the Partnership’s use of internally generated cash flows to contribute to the funding of growth projects; the impact of cash distribution reductions on the Partnership’s financial position; the potential for future cash distribution changes; the pending sale of the Kilimanjaro Spirit and Fuji Spirit, including the impact on future liquidity; the stability and growth of the Partnership’s future cash flows; the Partnership’s expected fixed future revenues and weighted average remaining contract lengths; the impact of growth projects on the Partnership’s future distributable cash flow per unit; the expected redelivery date and potential redeployment of the Varg FPSO; the timing of newbuilding, conversion and upgrade vessel or offshore unit deliveries and commencement of their respective charter contracts; future employment of newbuilding assets and future redeployment of existing assets onto new contracts; implementing cost saving initiatives; and addressing the Partnership’s future funding needs through debt and hybrid financings, asset divestments, sale leasebacks, deferral of shipyard deliveries and CAPEX payments. The following factors are among those that could cause actual results to differ materially from the forward-looking statements, which involve risks and uncertainties, and that should be considered in evaluating any such statement: vessel operations and oil production volumes; significant changes in oil prices; variations in expected levels of field maintenance; increased operating expenses; different-than-expected levels of oil production in the North Sea, Brazil and East Coast of Canada offshore fields; potential early termination of contracts; shipyard delivery or vessel conversion and upgrade delays and cost overruns; changes in exploration, production and storage of offshore oil and gas, either generally or in particular regions that would impact expected future growth; delays in the commencement of charter contracts; potential delays in the sale of the Kilimanjaro Spirit and Fuji Spirit; the Partnership’s ability to raise adequate financing for existing growth projects, refinance future debt maturities, and meet other financing requirements; the Partnership’s ability to negotiate and conclude on asset divestments, sale leasebacks, deferral of shipyard deliveries and CAPEX payments; failure by the Partnership to secure a contract for the Varg FPSO; and other factors discussed in Teekay Offshore’s filings from time to time with the SEC, including its Report on Form 20-F for the fiscal year ended December 31, 2014 and Form 6-K for the quarters ended March 31, 2015, June 30, 2015 and September 30, 2015. The Partnership expressly disclaims any obligation or undertaking to release publicly any updates or revisions to any forward-looking statements contained herein to reflect any change in the Partnership’s expectations with respect thereto or any change in events, conditions or circumstances on which any such statement is based.
2
|
|
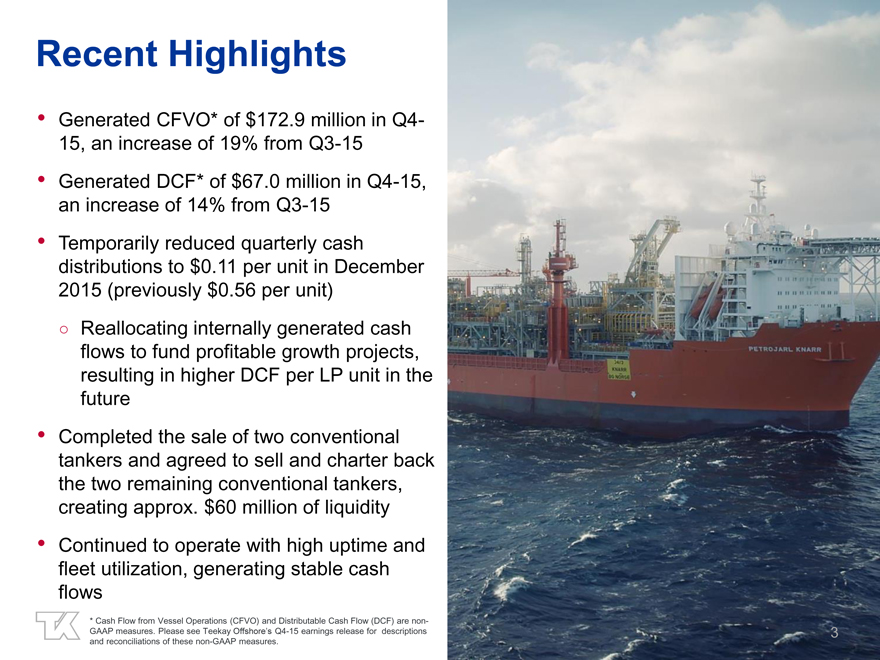
Recent Highlights
Generated CFVO* of $172.9 million in Q4-15, an increase of 19% from Q3-15
Generated DCF* of $67.0 million in Q4-15, an increase of 14% from Q3-15
Temporarily reduced quarterly cash distributions to $0.11 per unit in December 2015 (previously $0.56 per unit)
Reallocating internally generated cash flows to fund profitable growth projects, resulting in higher DCF per LP unit in the future
Completed the sale of two conventional tankers and agreed to sell and charter back the two remaining conventional tankers, creating approx. $60 million of liquidity
Continued to operate with high uptime and fleet utilization, generating stable cash flows
* Cash Flow from Vessel Operations (CFVO) and Distributable Cash Flow (DCF) are non-GAAP measures. Please see Teekay Offshore’s Q4-15 earnings release for descriptions and reconciliations of these non-GAAP measures.
3
|
|
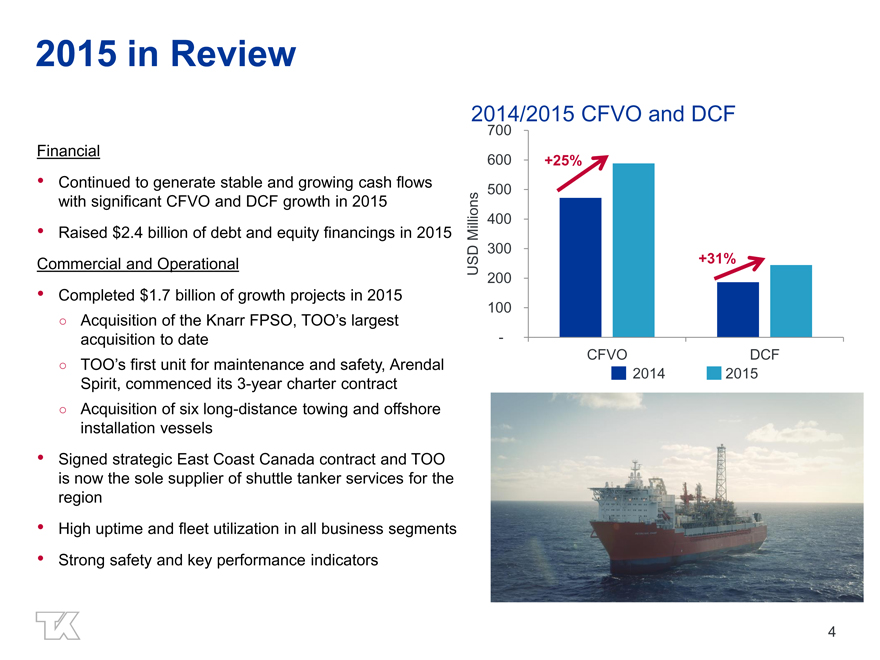
2015 in Review
Financial
Continued to generate stable and growing cash flows with significant CFVO and DCF growth in 2015
Raised $2.4 billion of debt and equity financings in 2015 Commercial and Operational
Completed $1.7 billion of growth projects in 2015
Acquisition of the Knarr FPSO, TOO’s largest acquisition to date
TOO’s first unit for maintenance and safety, Arendal
Spirit, commenced its 3-year charter contract
Acquisition of six long-distance towing and offshore installation vessels
Signed strategic East Coast Canada contract and TOO is now the sole supplier of shuttle tanker services for the region
High uptime and fleet utilization in all business segments
Strong safety and key performance indicators
2014/2015 CFVO and DCF
700
600 +25%
500
Millions 400
300
USD +31%
200
100
-
CFVO DCF
2014 2015
4
|
|
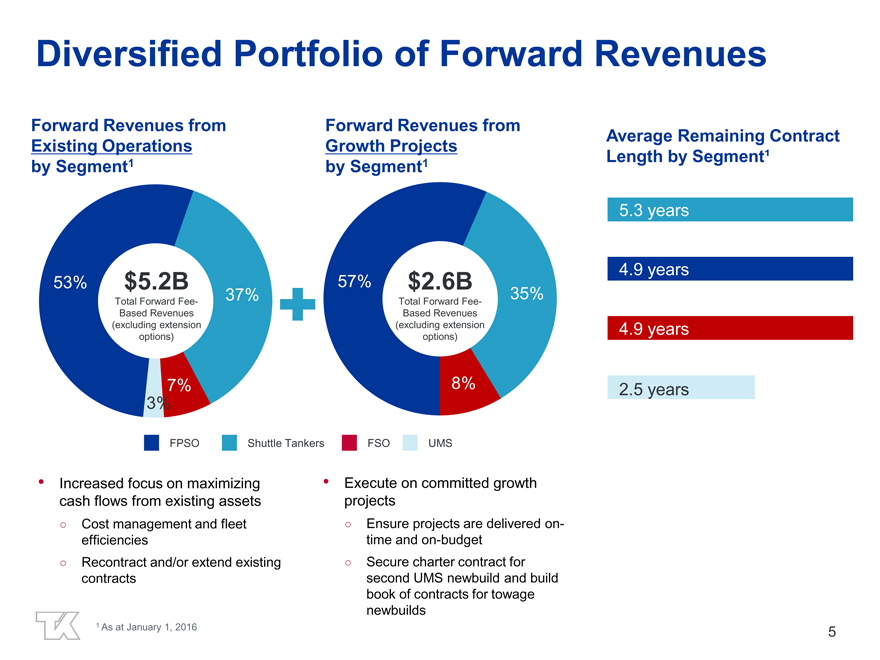
Diversified Portfolio of Forward Revenues
Forward Revenues from Forward Revenues from
Average Remaining Contract Existing Operations Growth Projects Length by Segment¹ by Segment1 by Segment1
53% $5.2B 57% $2.6B
37% 35%
Total Forward Fee- Total Forward Fee-Based Revenues Based Revenues (excluding extension (excluding extension options) options)
7% 8% 3%
FPSO Shuttle Tankers FSO UMS
5.3 years 4.9 years 4.9 years 2.5 years
Increased focus on maximizing cash flows from existing assets
Cost management and fleet efficiencies
Recontract and/or extend existing contracts
1 As at January 1, 2016
• Execute on committed growth projects
Ensure projects are delivered on- time and on-budget
Secure charter contract for second UMS newbuild and build book of contracts for towage newbuilds
5
|
|
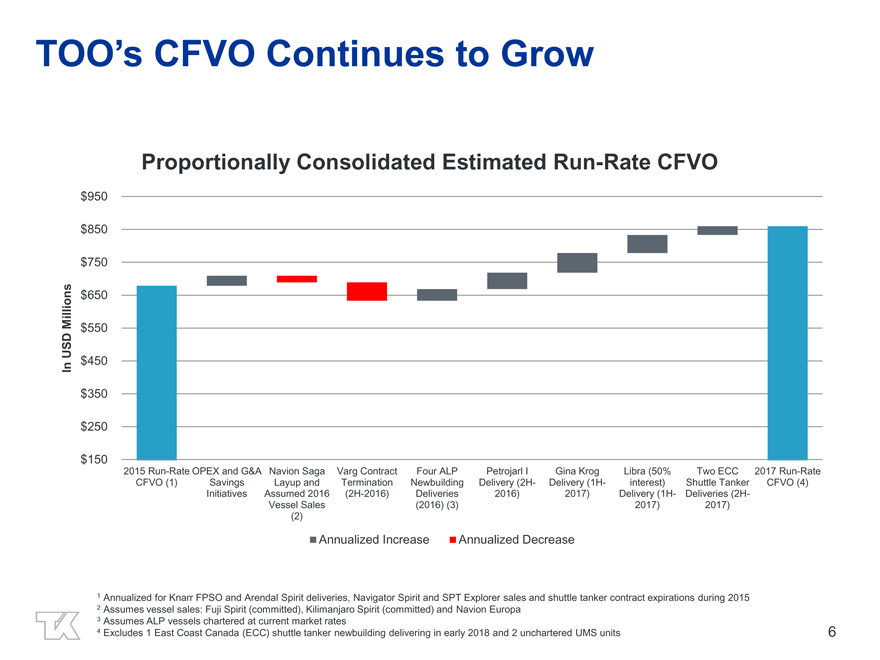
TOO’s CFVO Continues to Grow
Proportionally Consolidated Estimated Run-Rate CFVO
$950
$850
$750
Millions $650 $550
USD $450
In
$350
$250
$150
2015 Run-Rate OPEX and G&A Navion Saga Varg Contract Four ALP Petrojarl I Gina Krog Libra (50% Two ECC 2017 Run-Rate CFVO (1) Savings Layup and Termination Newbuilding Delivery (2H- Delivery (1H- interest) Shuttle Tanker CFVO (4) Initiatives Assumed 2016 (2H-2016) Deliveries 2016) 2017) Delivery (1H- Deliveries (2H-Vessel Sales (2016) (3) 2017) 2017) (2)
Annualized Increase Annualized Decrease
1 Annualized for Knarr FPSO and Arendal Spirit deliveries, Navigator Spirit and SPT Explorer sales and shuttle tanker contract expirations during 2015
2 Assumes vessel sales: Fuji Spirit (committed), Kilimanjaro Spirit (committed) and Navion Europa
3 Assumes ALP vessels chartered at current market rates
4 Excludes 1 East Coast Canada (ECC) shuttle tanker newbuilding delivering in early 2018 and 2 unchartered UMS units
6
|
|
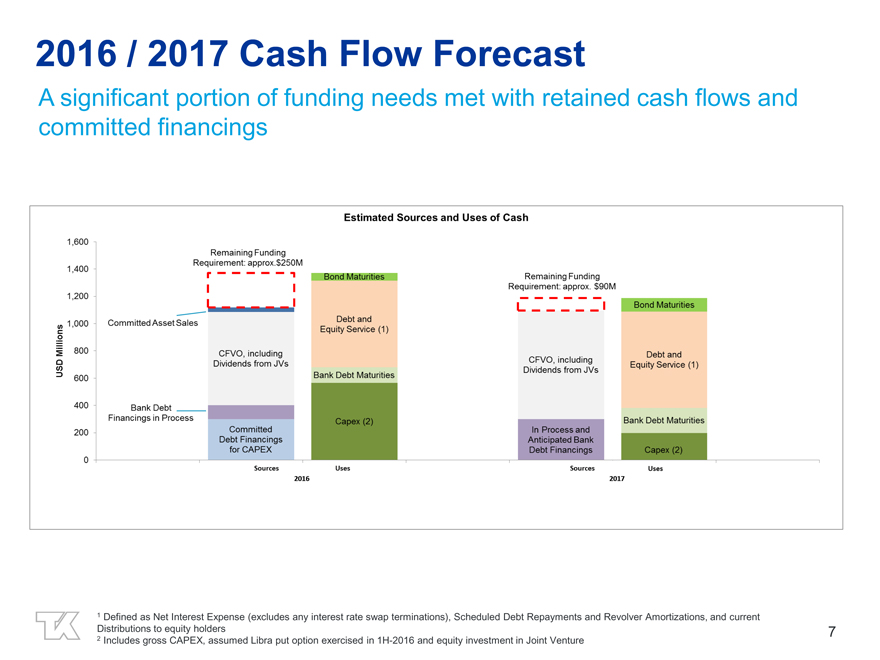
2016 / 2017 Cash Flow Forecast
A significant portion of funding needs met with retained cash flows and committed financings
Estimated Sources and Uses of Cash
1,600
1,400
1,200
1,000
800
600
400
200
0
Remaining Funding Requirement: approx.$250M
Commited Asset Sales
CFVO, including Dividends from JVs
Bank Debt Financings in Process
Committed Debt Financings for CAPEX
Bond maturities
Debt and Equity Service (1)
Bank Debt Maturities
Capex (2)
Sources Uses 2016
Remaining Funding Requirement: approx.$90M
CFVO, including Dividends from JVs
In Process and Anticipated bank Debt Financings
Bond Maturities
Debt and Equity Service (1)
Capex (2)
Sources Uses 2017
1 Defined as Net Interest Expense (excludes any interest rate swap terminations), Scheduled Debt Repayments and Revolver Amortizations, and current Distributions to equity holders
2 Includes gross CAPEX, assumed Libra put option exercised in 1H-2016 and equity investment in Joint Venture
7
|
|
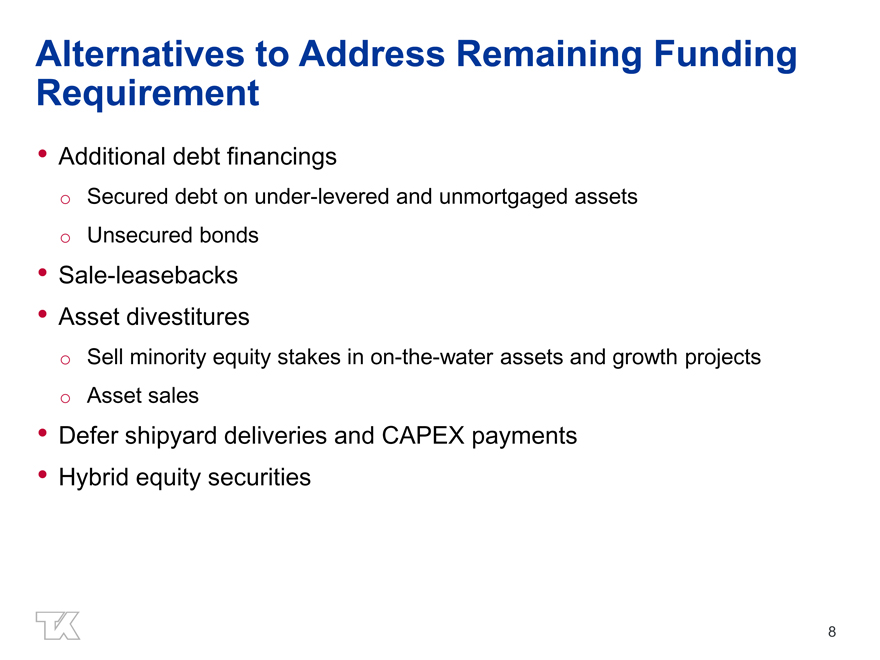
Alternatives to Address Remaining Funding Requirement
Additional debt financings
o Secured debt on under-levered and unmortgaged assets o Unsecured bonds
Sale-leasebacks
Asset divestitures
o Sell minority equity stakes in on-the-water assets and growth projects o Asset sales
Defer shipyard deliveries and CAPEX payments
Hybrid equity securities
8
|
|
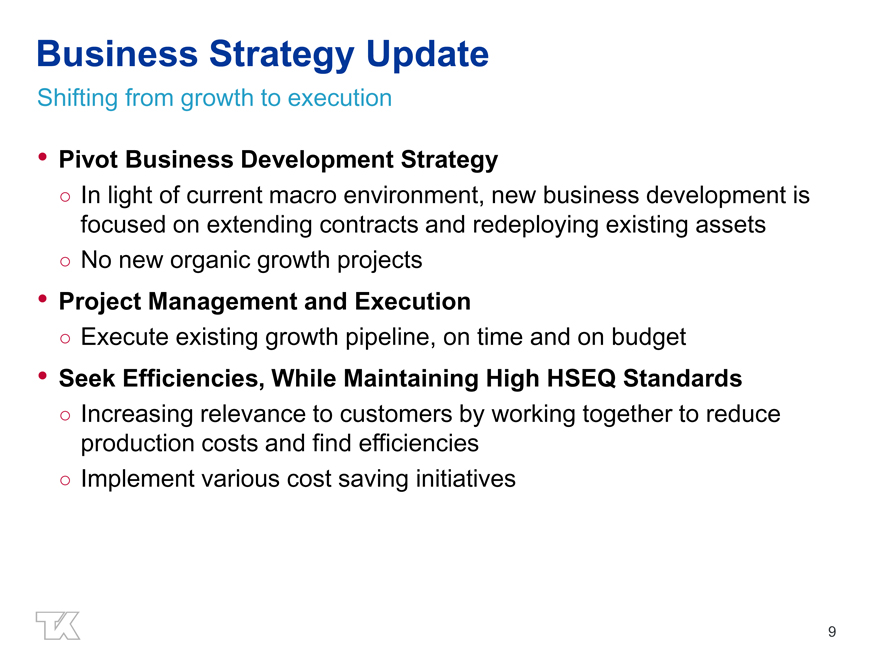
Business Strategy Update
Shifting from growth to execution
• Pivot Business Development Strategy
In light of current macro environment, new business development is focused on extending contracts and redeploying existing assets
No new organic growth projects
• Project Management and Execution
Execute existing growth pipeline, on time and on budget
• Seek Efficiencies, While Maintaining High HSEQ Standards
Increasing relevance to customers by working together to reduce production costs and find efficiencies
Implement various cost saving initiatives
9
|
|
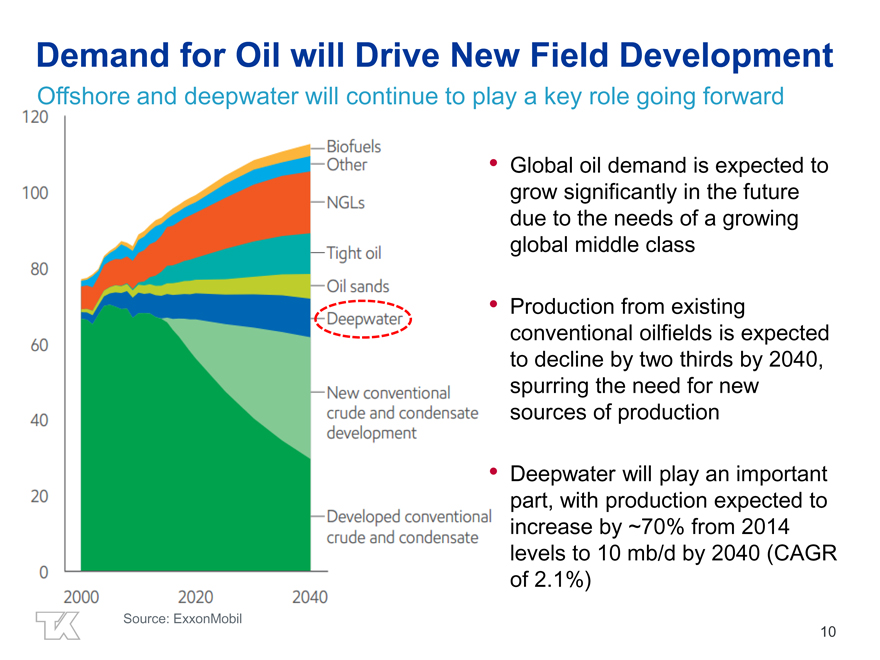
Demand for Oil will Drive New Field Development
Offshore and deepwater will continue to play a key role going forward
0 20 40 60 80 100 120
Biofuels Other NGLs Tight oil Oil Sands Deepwater New conventional crude and condensate development
Developed conventional crude and condensate
Global oil demand is expected to grow significantly in the future due to the needs of a growing global middle class
Production from existing conventional oilfields is expected to decline by two thirds by 2040, spurring the need for new sources of production
Deepwater will play an important part, with production expected to increase by ~70% from 2014 levels to 10 mb/d by 2040 (CAGR of 2.1%)
Source: ExxonMobil
10
|
|
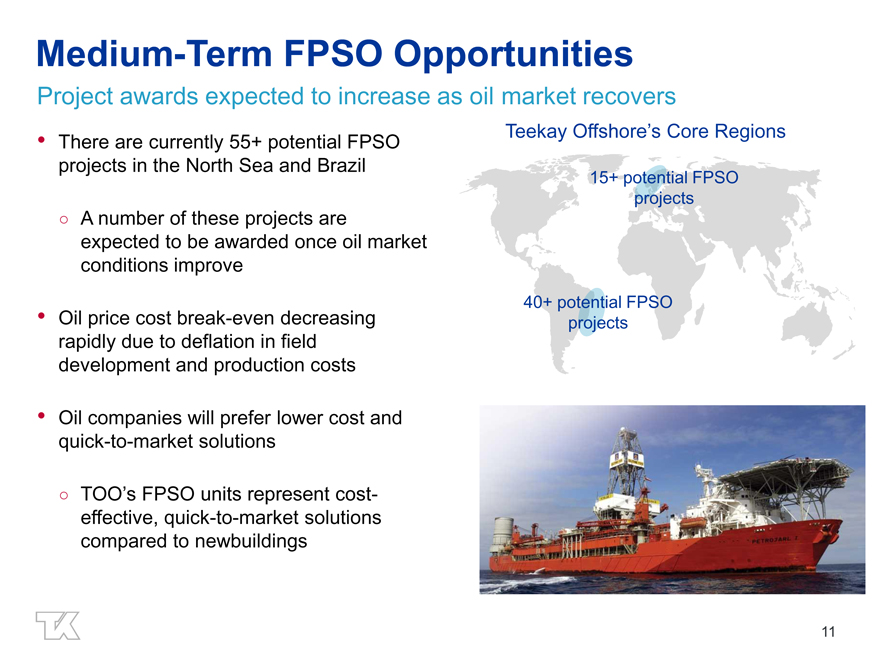
Medium-Term FPSO Opportunities
Project awards expected to increase as oil market recovers
There are currently 55+ potential FPSO projects in the North Sea and Brazil
A number of these projects are expected to be awarded once oil market conditions improve
Oil price cost break-even decreasing rapidly due to deflation in field development and production costs
Oil companies will prefer lower cost and quick-to-market solutions
TOO’s FPSO units represent cost-effective, quick-to-market solutions compared to newbuildings
Teekay Offshore’s Core Regions
15+ potential FPSO
projects
40+ potential FPSO
projects
11
|
|
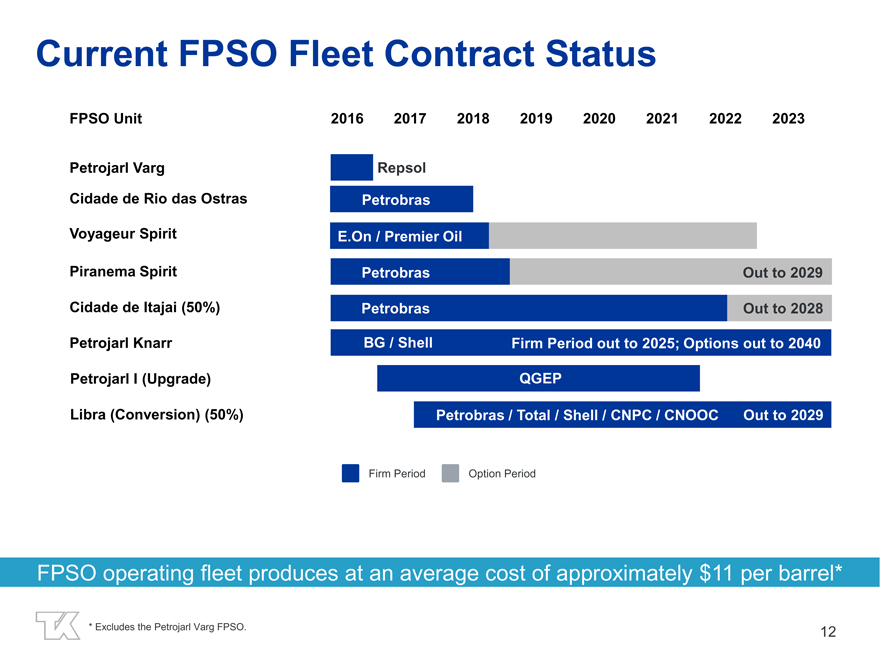
Current FPSO Fleet Contract Status
FPSO Unit
Petrojarl Varg
Cidade de Rio das Ostras Voyageur Spirit Piranema Spirit Cidade de Itajai (50%) Petrojarl Knarr Petrojarl I (Upgrade) Libra (Conversion) (50%)
2016 2017 2018 2019 2020 2021 2022 2023
Repsol Petrobras E.On / Premier Oil
Petrobras Out to 2029 Petrobras Out to 2028 BG / Shell Firm Period out to 2025; Options out to 2040 QGEP
Petrobras / Total / Shell / CNPC / CNOOC Out to 2029
Firm Period Option Period
FPSO operating fleet produces at an average cost of approximately $11 per barrel*
* Excludes the Petrojarl Varg FPSO. 12
|
|
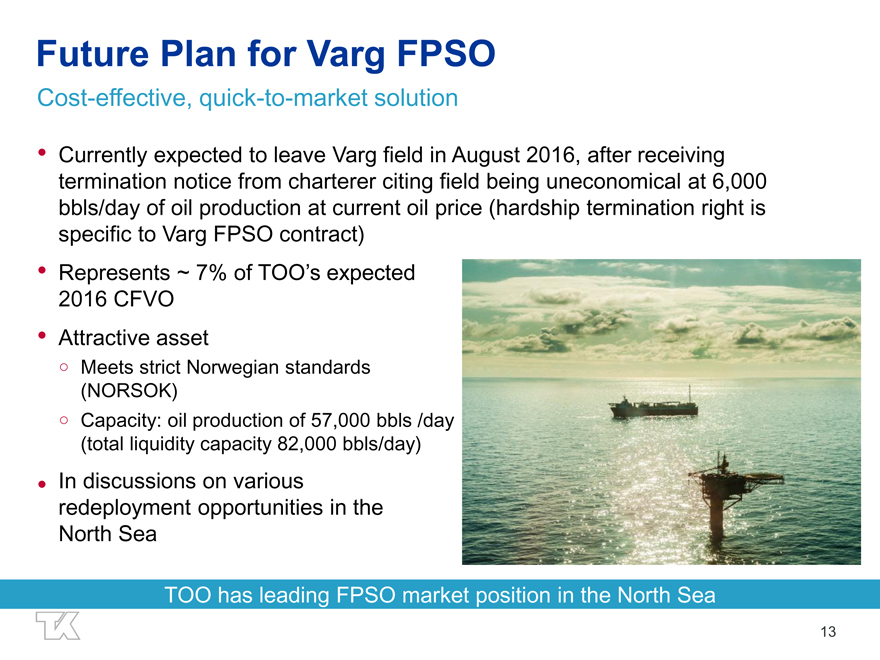
Future Plan for Varg FPSO
Cost-effective, quick-to-market solution
Currently expected to leave Varg field in August 2016, after receiving termination notice from charterer citing field being uneconomical at 6,000 bbls/day of oil production at current oil price (hardship termination right is specific to Varg FPSO contract)
Represents ~ 7% of TOO’s expected 2016 CFVO
Attractive asset
? Meets strict Norwegian standards (NORSOK)
? Capacity: oil production of 57,000 bbls /day (total liquidity capacity 82,000 bbls/day)
In discussions on various redeployment opportunities in the
North Sea
TOO has leading FPSO market position in the North Sea
13
|
|
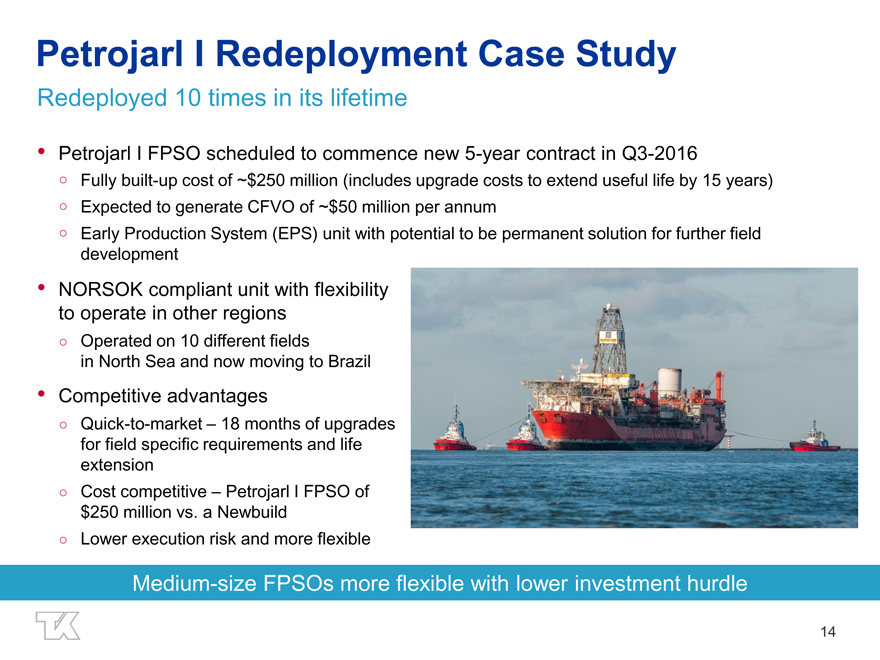
Petrojarl I Redeployment Case Study
Redeployed 10 times in its lifetime
Petrojarl I FPSO scheduled to commence new 5-year contract in Q3-2016
Fully built-up cost of ~$250 million (includes upgrade costs to extend useful life by 15 years)
Expected to generate CFVO of ~$50 million per annum
Early Production System (EPS) unit with potential to be permanent solution for further field development
NORSOK compliant unit with flexibility to operate in other regions
Operated on 10 different fields in North Sea and now moving to Brazil
Competitive advantages
Quick-to-market – 18 months of upgrades for field specific requirements and life extension
Cost competitive – Petrojarl I FPSO of $250 million vs. a Newbuild
Lower execution risk and more flexible
Medium-size FPSOs more flexible with lower investment hurdle
14
|
|
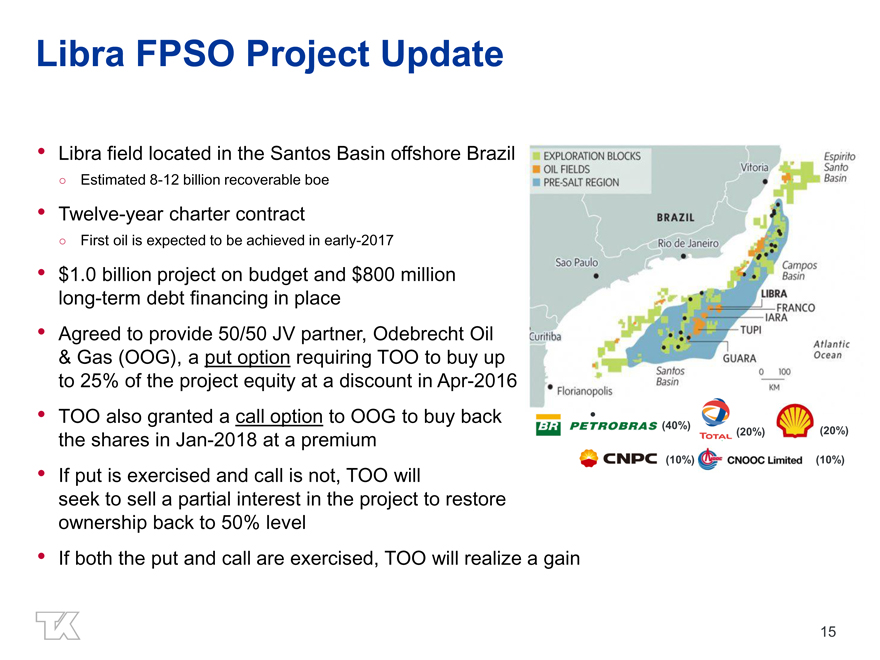
Libra FPSO Project Update
Libra field located in the Santos Basin offshore Brazil
Estimated 8-12 billion recoverable boe
Twelve-year charter contract
First oil is expected to be achieved in early-2017
$1.0 billion project on budget and $800 million long-term debt financing in place Agreed to provide 50/50 JV partner, Odebrecht Oil
& Gas (OOG), a put option requiring TOO to buy up to 25% of the project equity at a discount in Apr-2016 TOO also granted a call option to OOG to buy back the shares in Jan-2018 at a premium If put is exercised and call is not, TOO will seek to sell a partial interest in the project to restore ownership back to 50% level
If both the put and call are exercised, TOO will realize a gain
EXPLORATION BLOCKS
OIL FIELDS
PRE-SALT REGION
Vitoria
Espirito Santo basin
BRAGIL
Rio de Janeiro
Sao Paulo
Campos
Basin LIBRA
FRSNCO
IARA
TUPI
GUARA
Santos basin
Florianopolis
Atlantic Ocean
100 0 KM
PETROSBRAS (40%) Total (20%)
(20%)
CNPC (10%) CNOOC Limited (10%)
15
|
|
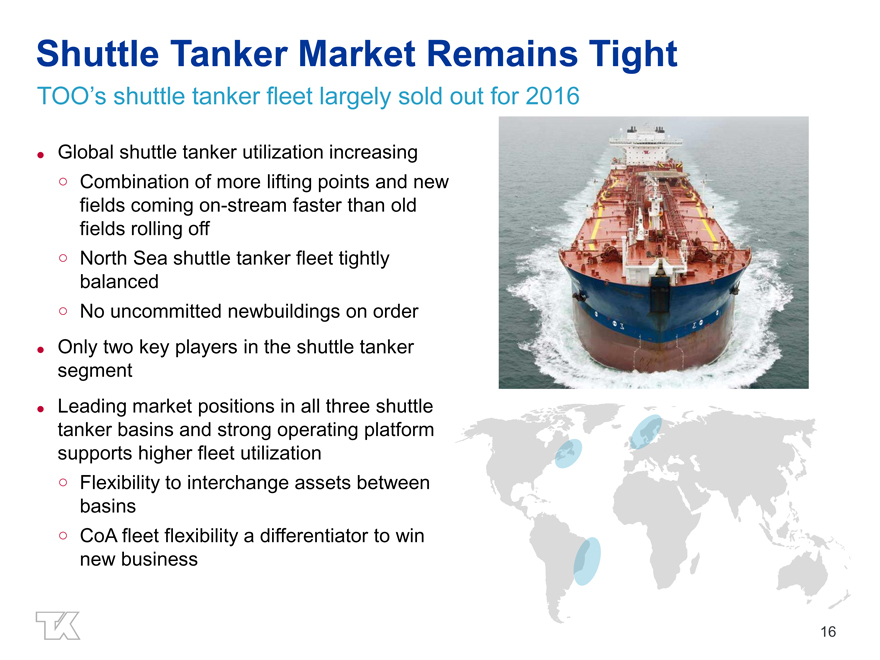
Shuttle Tanker Market Remains Tight
TOO’s shuttle tanker fleet largely sold out for 2016
Global shuttle tanker utilization increasing
Combination of more lifting points and new fields coming on-stream faster than old fields rolling off
North Sea shuttle tanker fleet tightly balanced
No uncommitted newbuildings on order Only two key players in the shuttle tanker segment Leading market positions in all three shuttle tanker basins and strong operating platform supports higher fleet utilization
Flexibility to interchange assets between basins
CoA fleet flexibility a differentiator to win new business
16
|
|
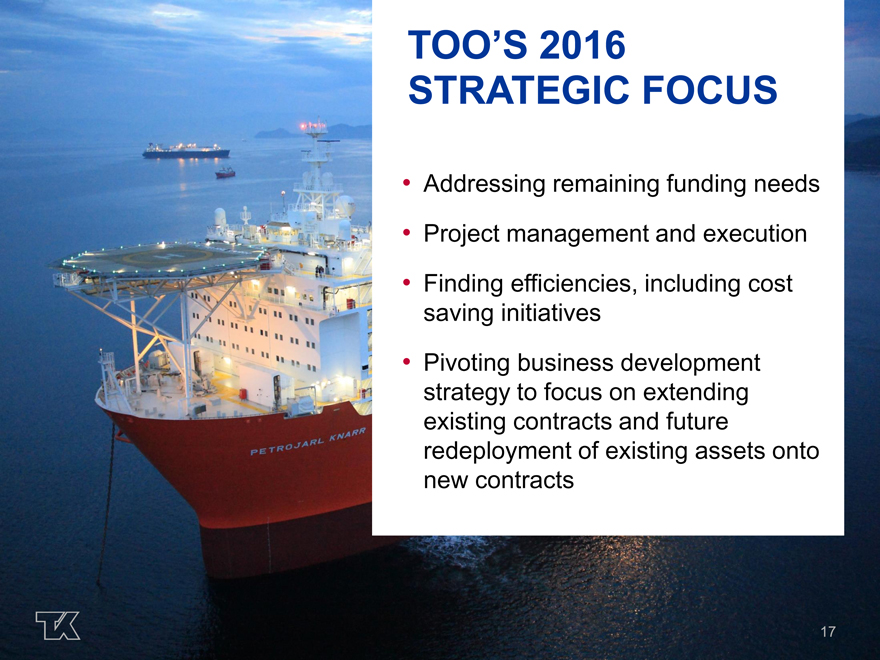
TOO’S 2016
STRATEGIC FOCUS
Addressing remaining funding needs
Project management and execution
Finding efficiencies, including cost saving initiatives
Pivoting business development strategy to focus on extending existing contracts and future redeployment of existing assets onto new contracts
17
|
|
Appendix
18
|
|
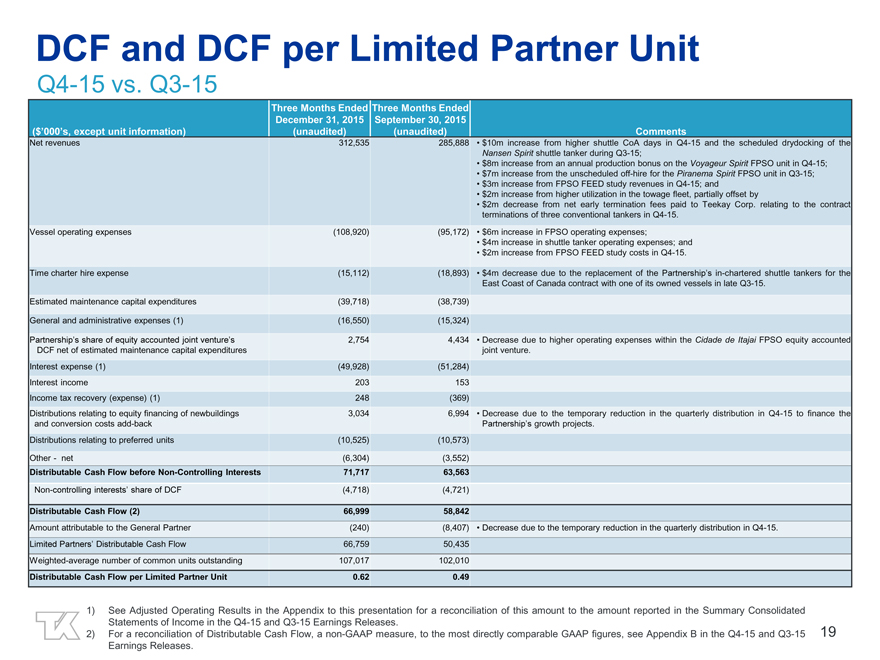
DCF and DCF per Limited Partner Unit
Q4-15 vs. Q3-15
Three Months Ended Three Months Ended
December 31, 2015 September 30, 2015
($’000’s, except unit information)(unaudited)(unaudited) Comments
Net revenues 312,535 285,888 • $10m increase from higher shuttle CoA days in Q4-15 and the scheduled drydocking of the
Nansen Spirit shuttle tanker during Q3-15;
• $8m increase from an annual production bonus on the Voyageur Spirit FPSO unit in Q4-15;
• $7m increase from the unscheduled off-hire for the Piranema Spirit FPSO unit in Q3-15;
• $3m increase from FPSO FEED study revenues in Q4-15; and
• $2m increase from higher utilization in the towage fleet, partially offset by
• $2m decrease from net early termination fees paid to Teekay Corp. relating to the contract
terminations of three conventional tankers in Q4-15.
Vessel operating expenses(108,920)(95,172) • $6m increase in FPSO operating expenses;
• $4m increase in shuttle tanker operating expenses; and
• $2m increase from FPSO FEED study costs in Q4-15.
Time charter hire expense(15,112)(18,893) • $4m decrease due to the replacement of the Partnership’s in-chartered shuttle tankers for the
East Coast of Canada contract with one of its owned vessels in late Q3-15.
Estimated maintenance capital expenditures(39,718)(38,739)
General and administrative expenses (1)(16,550)(15,324)
Partnership’s share of equity accounted joint venture’s 2,754 4,434 • Decrease due to higher operating expenses within the Cidade de Itajai FPSO equity accounted
DCF net of estimated maintenance capital expenditures joint venture.
Interest expense (1)(49,928)(51,284)
Interest income 203 153
Income tax recovery (expense) (1) 248(369)
Distributions relating to equity financing of newbuildings 3,034 6,994 • Decrease due to the temporary reduction in the quarterly distribution in Q4-15 to finance the
and conversion costs add-back Partnership’s growth projects.
Distributions relating to preferred units(10,525)(10,573)
Other—net(6,304)(3,552)
Distributable Cash Flow before Non-Controlling Interests 71,717 63,563
Non-controlling interests’ share of DCF(4,718)(4,721)
Distributable Cash Flow (2) 66,999 58,842
Amount attributable to the General Partner(240)(8,407) • Decrease due to the temporary reduction in the quarterly distribution in Q4-15.
Limited Partners’ Distributable Cash Flow 66,759 50,435
Weighted-average number of common units outstanding 107,017 102,010
Distributable Cash Flow per Limited Partner Unit 0.62 0.49
1) See Adjusted Operating Results in the Appendix to this presentation for a reconciliation of this amount to the amount reported in the Summary Consolidated Statements of Income in the Q4-15 and Q3-15 Earnings Releases.
2) For a reconciliation of Distributable Cash Flow, a non-GAAP measure, to the most directly comparable GAAP figures, see Appendix B in the Q4-15 and Q3-15 Earnings Releases.
19
|
|
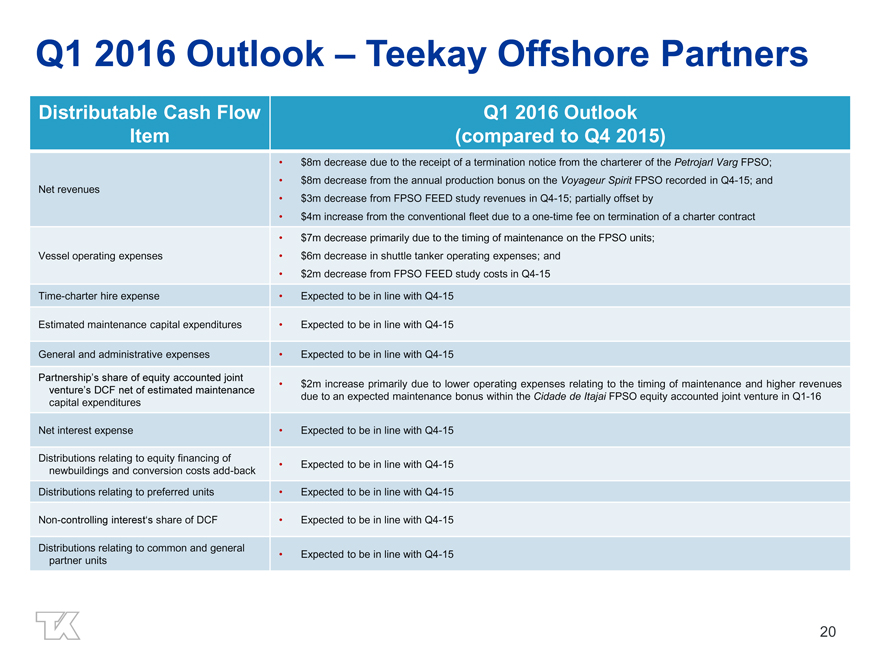
Q1 2016 Outlook – Teekay Offshore Partners
Distributable Cash Flow Q1 2016 Outlook Item (compared to Q4 2015)
$8m decrease due to the receipt of a termination notice from the charterer of the Petrojarl Varg FPSO; Net revenues $8m decrease from the annual production bonus on the Voyageur Spirit FPSO recorded in Q4-15; and
$3m decrease from FPSO FEED study revenues in Q4-15; partially offset by
$4m increase from the conventional fleet due to a one-time fee on termination of a charter contract
$7m decrease primarily due to the timing of maintenance on the FPSO units; Vessel operating expenses $6m decrease in shuttle tanker operating expenses; and
$2m decrease from FPSO FEED study costs in Q4-15 Time-charter hire expense Expected to be in line with Q4-15
Estimated maintenance capital expenditures • Expected to be in line with Q4-15
General and administrative expenses • Expected to be in line with Q4-15
Partnership’s share of equity accounted joint
$2m increase primarily due to lower operating expenses relating to the timing of maintenance and higher revenues venture’s DCF net of estimated maintenance due to an expected maintenance bonus within the Cidade de Itajai FPSO equity accounted joint venture in Q1-16 capital expenditures
Net interest expense • Expected to be in line with Q4-15
Distributions relating to equity financing of
Expected to be in line with Q4-15 newbuildings and conversion costs add-back
Distributions relating to preferred units • Expected to be in line with Q4-15
Non-controlling interest‘s share of DCF • Expected to be in line with Q4-15
Distributions relating to common and general
Expected to be in line with Q4-15 partner units
20
|
|
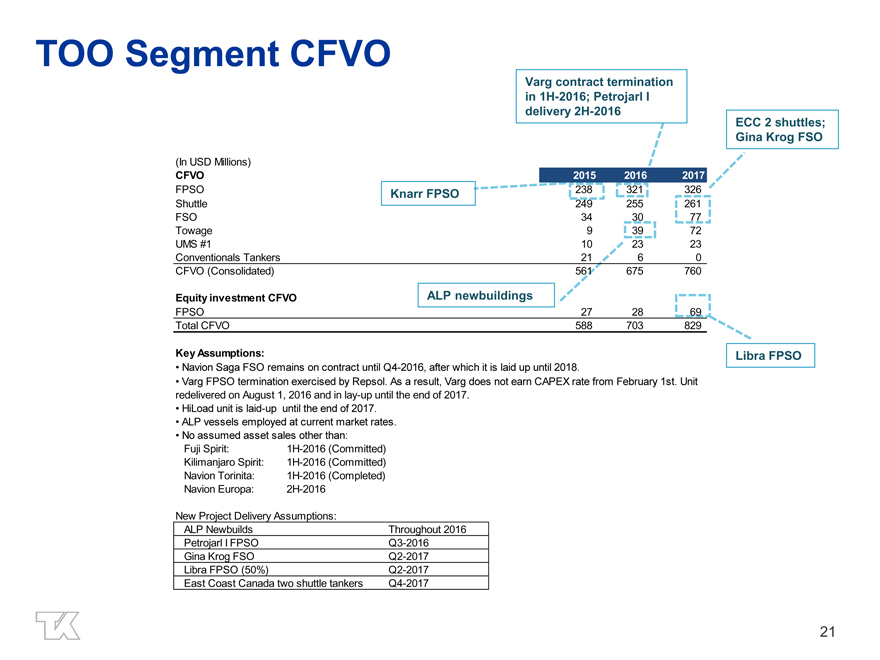
TOO Segment CFVO
Varg contract termination in 1H-2016; Petrojarl I delivery 2H-2016 ECC 2 shuttles; Gina Krog FSO
2015 2016 2017
Knarr FPSO 238 321 326 249 255 261
34 30 77
9 39 72
10 23 23
21 6 0 561 675 760
ALP newbuildings
27 28 69 588 703 829
(In USD Millions)
CFVO
FPSO Shuttle FSO Towage UMS #1
Conventionals Tankers CFVO (Consolidated)
Equity investment CFVO
FPSO Total CFVO
Key Assumptions:
Navion Saga FSO remains on contract until Q4-2016, after which it is laid up until 2018.
Varg FPSO termination exercised by Repsol. As a result, Varg does not earn CAPEX rate from February 1st. Unit redelivered on August 1, 2016 and in lay-up until the end of 2017.
HiLoad unit is laid-up until the end of 2017.
ALP vessels employed at current market rates.
No assumed asset sales other than:
Fuji Spirit: 1H-2016 (Committed) Kilimanjaro Spirit: 1H-2016 (Committed) Navion Torinita: 1H-2016 (Completed) Navion Europa: 2H-2016
New Project Delivery Assumptions:
ALP Newbuilds Throughout 2016 Petrojarl I FPSO Q3-2016 Gina Krog FSO Q2-2017 Libra FPSO (50%) Q2-2017 East Coast Canada two shuttle tankers Q4-2017
Libra FPSO
21
|
|
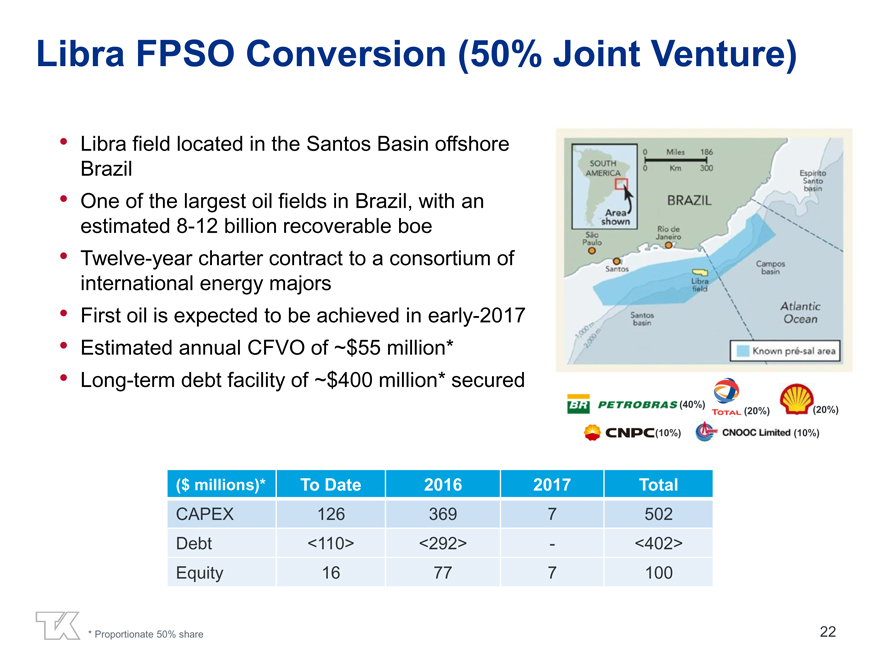
Libra FPSO Conversion (50% Joint Venture)
Libra field located in the Santos Basin offshore Brazil One of the largest oil fields in Brazil, with an estimated 8-12 billion recoverable boe Twelve-year charter contract to a consortium of international energy majors First oil is expected to be achieved in early-2017 Estimated annual CFVO of ~$55 million* Long-term debt facility of ~$400 million* secured
($ millions)* To Date 2016 2017 Total
CAPEX 126 369 7 502
Debt <110> <292>—<402>
Equity 16 77 7 100
Atlantic Ocean
PETROSBRAS (40%) Total (20%)
(20%)
CNPC (10%) CNOOC Limited (10%)
22
|
|
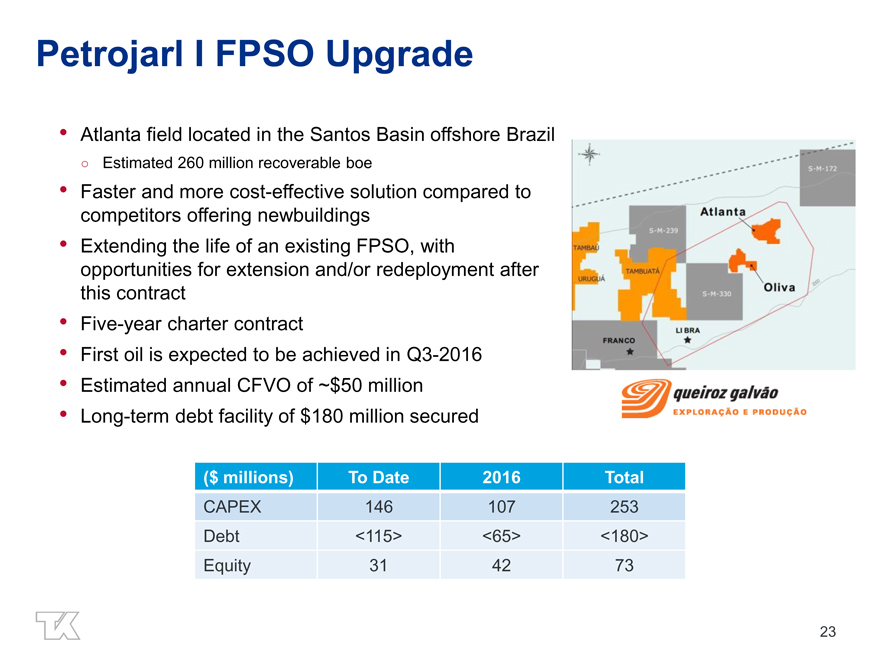
Petrojarl I FPSO Upgrade
Atlanta field located in the Santos Basin offshore Brazil
Estimated 260 million recoverable boe
Faster and more cost-effective solution compared to competitors offering newbuildings Extending the life of an existing FPSO, with opportunities for extension and/or redeployment after this contract Five-year charter contract First oil is expected to be achieved in Q3-2016 Estimated annual CFVO of ~$50 million Long-term debt facility of $180 million secured
($ millions) To Date 2016 Total
CAPEX 146 107 253
Debt <115> <65> <180>
Equity 31 42 73
23
|
|
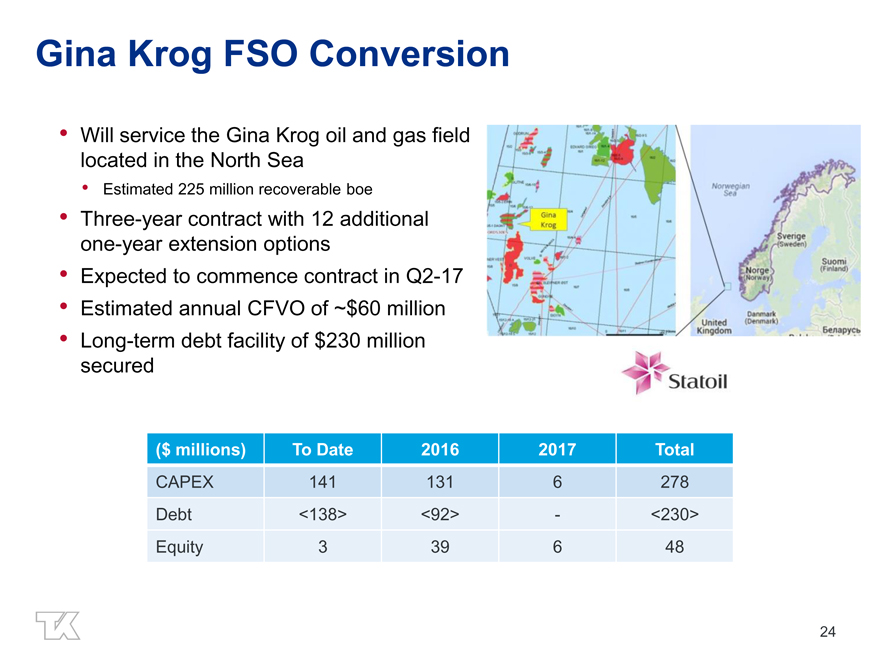
Gina Krog FSO Conversion
Will service the Gina Krog oil and gas field located in the North Sea
Estimated 225 million recoverable boe
Three-year contract with 12 additional one-year extension options Expected to commence contract in Q2-17 Estimated annual CFVO of ~$60 million Long-term debt facility of $230 million secured
($ millions) To Date 2016 2017 Total
CAPEX 141 131 6 278 Debt <138> <92>—<230> Equity 3 39 6 48
24
|
|
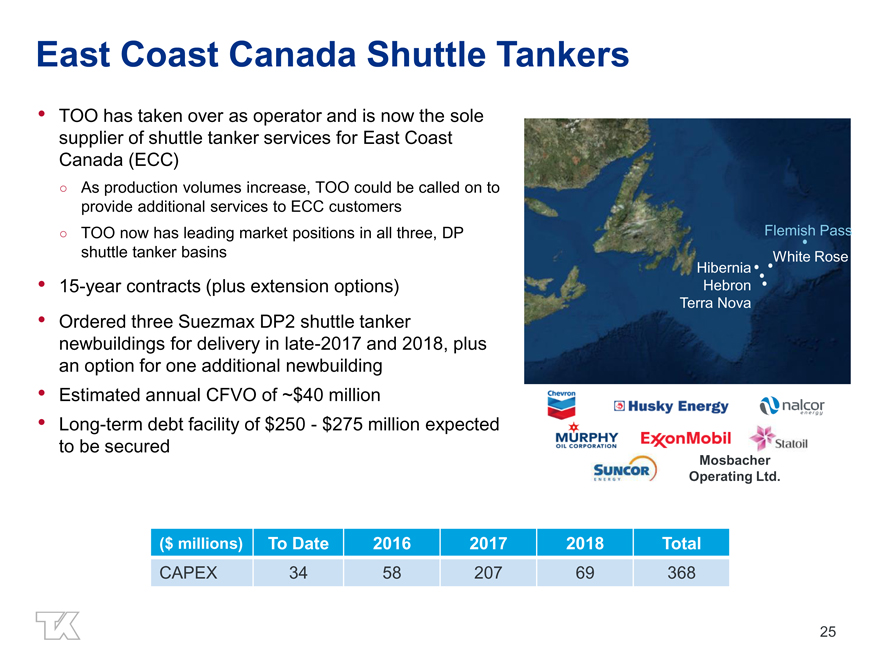
East Coast Canada Shuttle Tankers
TOO has taken over as operator and is now the sole supplier of shuttle tanker services for East Coast Canada (ECC)
As production volumes increase, TOO could be called on to provide additional services to ECC customers
TOO now has leading market positions in all three, DP shuttle tanker basins
15-year contracts (plus extension options) Ordered three Suezmax DP2 shuttle tanker newbuildings for delivery in late-2017 and 2018, plus an option for one additional newbuilding
Estimated annual CFVO of ~$40 million
Long-term debt facility of $250—$275 million expected to be secured
Flemish Pass White Rose Hibernia Hebron Terra Nova
Mosbacher
Operating Ltd.
($ millions) To Date 2016 2017 2018 Total
CAPEX 34 58 207 69 368
25
|
|
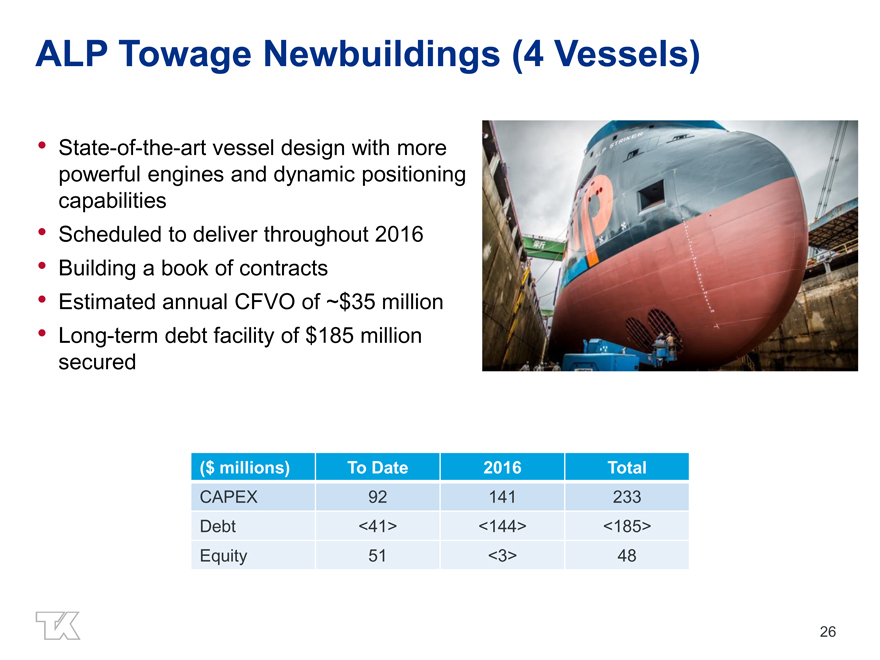
ALP Towage Newbuildings (4 Vessels)
State-of-the-art vessel design with more powerful engines and dynamic positioning capabilities Scheduled to deliver throughout 2016 Building a book of contracts Estimated annual CFVO of ~$35 million Long-term debt facility of $185 million secured
($ millions) To Date 2016 Total
CAPEX 92 141 233
Debt <41> <144> <185>
Equity 51 <3> 48
26
|
|
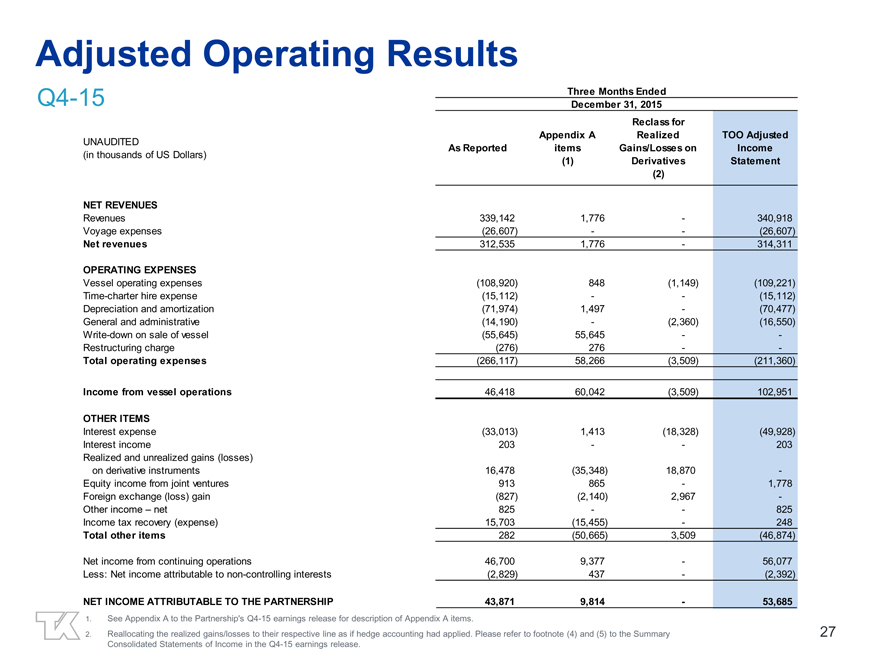
Adjusted Operating Results
Q4-15 Three Months Ended
December 31, 2015
Reclass for
Appendix A Realized TOO Adjusted
UNAUDITED As Reported items Gains/Losses on Income
(in thousands of US Dollars)(1) Derivatives Statement
(2)
NET REVENUES
Revenues 339,142 1,776—340,918
Voyage expenses(26,607) —(26,607)
Net revenues 312,535 1,776—314,311
OPERATING EXPENSES
Vessel operating expenses(108,920) 848(1,149)(109,221)
Time-charter hire expense(15,112) —(15,112)
Depreciation and amortization(71,974) 1,497 -(70,477)
General and administrative(14,190) -(2,360)(16,550)
Write-down on sale of vessel(55,645) 55,645 —
Restructuring charge(276) 276 —
Total operating expenses(266,117) 58,266(3,509)(211,360)
Income from vessel operations 46,418 60,042(3,509) 102,951
OTHER ITEMS
Interest expense(33,013) 1,413(18,328)(49,928)
Interest income 203 — 203
Realized and unrealized gains (losses)
on derivative instruments 16,478(35,348) 18,870 -
Equity income from joint ventures 913 865—1,778
Foreign exchange (loss) gain(827)(2,140) 2,967 -
Other income – net 825 — 825
Income tax recovery (expense) 15,703(15,455)—248
Total other items 282(50,665) 3,509(46,874)
Net income from continuing operations 46,700 9,377—56,077
Less: Net income attributable to non-controlling interests(2,829) 437 -(2,392)
NET INCOME ATTRIBUTABLE TO THE PARTNERSHIP 43,871 9,814—53,685
1. See Appendix A to the Partnership’s Q4-15 earnings release for description of Appendix A items.
2. Reallocating the realized gains/losses to their respective line as if hedge accounting had applied. Please refer to footnote (4) and (5) to the Summary 27
Consolidated Statements of Income in the Q4-15 earnings release.
|
|

Adjusted Operating Results
Q3-15 Three Months Ended
September 30, 2015
Reclass for
Appendix A Realized TOO Adjusted
As Reported items Gains/Losses on Income
(1) Derivatives Statement
(2)
NET REVENUES
Revenues 314,054 — 314,054
Voyage expenses(28,166) —(28,166)
Net revenues 285,888 — 285,888
OPERATING EXPENSES
Vessel operating expenses(95,172) -(1,715)(96,887)
Time-charter hire expense(18,893) —(18,893)
Depreciation and amortization(72,827) 1,497 -(71,330)
General and administrative(27,321) 13,920(1,923)(15,324)
Write-down on sale of vessel — —
Restructuring charge(157) 157 —
Total operating expenses(214,370) 15,574(3,638)(202,434)
Income from vessel operations 71,518 15,574(3,638) 83,454
OTHER ITEMS
Interest expense(33,645) 1,058(18,697)(51,284)
Interest income 153 — 153
Realized and unrealized (losses) gains
on derivative instruments(77,102) 57,607 19,495 -
Equity (loss) income from joint ventures(7,052) 9,475—2,423
Foreign exchange (loss) gain(10,257) 7,417 2,840 -
Other (loss) income – net(373) 436—63
Income tax recovery (expense) 5,465(5,834) -(369)
Total other items(122,811) 70,159 3,638(49,014)
Net (loss) income from continuing operations(51,293) 85,733—34,440
Less: Net income attributable to non-controlling interests(3,446) 1,058 -(2,388)
NET (LOSS) INCOME ATTRIBUTABLE TO THE PARTNERSHIP(54,739) 86,791—32,052
1. See Appendix A to the Partnership’s Q3-15 earnings release for description of Appendix A items.
2. Reallocating the realized gains/losses to their respective line as if hedge accounting had applied. Please refer to footnote (3) and (4) to the Summary 28
Consolidated Statements of Loss in the Q3-15 earnings release.
|
|
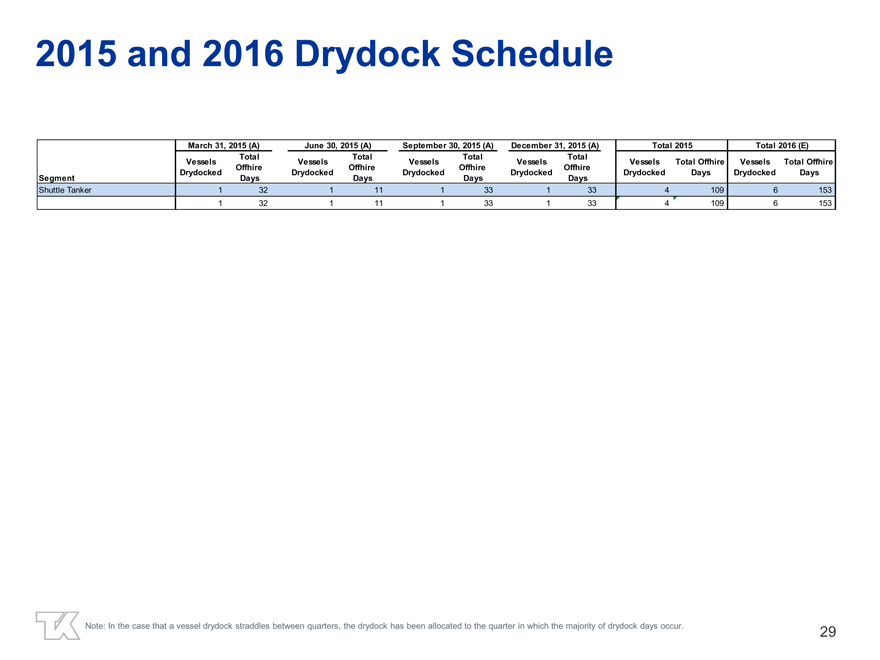
2015 and 2016 Drydock Schedule
March 31, 2015 (A) June 30, 2015 (A) September 30, 2015 (A) December 31, 2015 (A) Total 2015 Total 2016 (E)
Total Total Total Total
Vessels Vessels Vessels Vessels Vessels Total Offhire Vessels Total Offhire
Offhire Offhire Offhire Offhire
Drydocked Drydocked Drydocked Drydocked Drydocked Days Drydocked Days
Segment Days Days Days Days
Shuttle Tanker 1 32 1 11 1 33 1 33 4 109 6 153
1 32 1 11 1 33 1 33 4 109 6 153
Note: In the case that a vessel drydock straddles between quarters, the drydock has been allocated to the quarter in which the majority of drydock days occur.
29
|
|

BRINGING ENERGY TO THE WORLD
Serious News for Serious Traders! Try StreetInsider.com Premium Free!
You May Also Be Interested In
- Port Houston Regular Commission Meeting
- Ridgeline Minerals Announces Upsized Non-Brokered Private Placement to $2.2M
- Faraday Future Receives Letter from Nasdaq Regarding Form 10-K Filing
Create E-mail Alert Related Categories
SEC FilingsSign up for StreetInsider Free!
Receive full access to all new and archived articles, unlimited portfolio tracking, e-mail alerts, custom newswires and RSS feeds - and more!
