

Form 6-K TIM PARTICIPACOES SA For: Jul 26
 Tweet
Tweet Share
Share
Pursuant to Rule 13a-16 or 15d-16 of the
Barra da Tijuca - Rio de Janeiro, RJ, Brazil
Indicate by check mark whether the registrant by furnishing the information contained in this Form is also thereby furnishing the information to the Commission pursuant to Rule 12g3-2(b) under the Securities Exchange Act of 1934.
![[earningsrelease2q16_eng001.jpg]](http://www.streetinsider.com/images/secattach/20160726/11861943_earningsrelease2q16_eng001.jpg)
TIM PARTICIPAÇÕES S.A. Announces its Consolidated Results for the Second Quarter of 2016
·
Widening the gap in 4G coverage: 579 cities, more than 2x second player
·
Covering the country with 4G: 64% of urban population covered
·
4G users reached 11.2 million lines, or >17% of total subscribers. 4G traffic represented, in June, 24% of all data utilized
·
Smartphones penetration reached ~70% in May/16, well above 59% in 2Q15
·
Overall ARPU grew by 7% YoY, second consecutive quarter of growth
·
Innovative Revenues maintained a solid double digit growth of 19.1% YoY, driving Data Services to represent 45% of mobile service net revenues (+7pp from 2Q15)
·
Fixed Net Revenues maintained a solid performance, growing 15.1% in 2Q16
·
Normalized EBITDA Margin expanded to 31.5% in 2Q16 (vs. 29.5% in 2Q15)

Conference Call in English:
Conference Call in Portuguese:
July 26th, 2016, at:
July 26th, 2016, at:
11:30 AM Brasília time
09:30 AM Brasília time
10:30 AM US EDT
08:30 AM US EDT
Tel.: +1 888 700-0802 (USA)
Tel.: +55 11 3193-1001 or +55 11 2820-4001 (Brazil) +55 11 3193-1001 or +55 11 2820-4001 (Brazil) Code: TIM
+1 786 924-6977 (other countries)
Code: TIM
FINANCIAL PERFORMANCE
OPERATING REVENUES

Top line performance of -12% YoY shows a rebound when compared to 1Q16 (-15%) performance. The pace of revenues decrease is easing as traditional services and handset revenues reduce its pressure whilst VAS revenues maintain its solid trend. However, these improvements were not sufficient to overcome the overall business downward trends as (i) the economy continues to struggle although with early signs of recovery, (ii) a full quarter of MTR cut impact, (iii) ongoing revenue migration from voice-to-data. All in all, Net Revenues totaled R$3,820 million in 2Q16.
Net Revenues breakdown and other highlights are presented as follows:
Usage and monthly fee net revenues ended 2Q16 down 14.5% YoY, mostly impacted by a continue migration from voice towards data usage. Minutes of Use (MOU) came at 118 minutes in 2Q16, stable when compared to last year confirming the adherence of the new portfolio and its off-net allowance. On a sequential basis, this line was virtually flat versus 1Q16 and improved the YoY performance showed in 1Q16 (-18.2%).
+11%
VAS Revenues (YoY)
Value Added Services (VAS) net revenues rose 10.5% YoY in 2Q16 as innovative revenues (connectivity services + content & other VAS) became even more relevant in the business. Although short-message revenues continues to negatively impact on total Value-Added-Service line, Innovative Revenues rose 19.1% YoY in 2Q16, keeping a strong growth even with a more challenging comparative base. VAS revenues continues to improve its participation in both mobile services net revenues and business generated revenues reaching respectively 44.6% and 48.1%. VAS revenues growth represents a positive impact for the company's EBITDA margin as it has a higher contribution magin compared to voice.
TIM’s strategy to switch customers to 4G technology, increase smartphone penetration and also the launch of the new portfolio with larger data allowances are the drivers for Innovative revenues to grow. BOU (bytes of use) rose ~77% in May/2016 comparing to 2Q15.
+19%
Innovative Revenues
(YoY)

Long Distance is the most impacted line of traditional revenues as it is strongly exposed to the switch from voice-to-data. In 2Q16, this revenue stream was down by 21.0% YoY. The commoditization of LD services is speeding up and has impacted the performance in the past quarters.
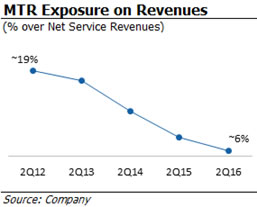
Interconnection net revenues dropped by 31.9% YoY in 2Q16 reflecting a quarter with full impact of MTR new price reduction, the continuous change in the dynamic of overall voice traffic and SMS reduction tendency. Interconnection revenues have declined by approximately R$114 million YoY in the second quarter, representing a relevant downtrend for mobile service revenues in the period. As a consequence of MTR cuts combined with migration from voice to data, the MTR incidence on net service revenues has been falling significantly every quarter, renewing its lowest level in 2Q16 at approximately 6%.
Excluding the MTR cut effects, Mobile Service Net Revenues would have fallen 3.4% instead of 6.8%.
Other Mobile net revenues showed a sound growth of 39.2% YoY in 2Q16, mainly driven by an increase in network sharing revenues.

ARPU (average revenue per user) stood at R$17.2 in 2Q16, up 7.0% YoY, and repeating the level shown in 1Q16. It’s a confirmation of the positive impacts coming from the new offer portfolio, as clients spend more in data and the value base continues to increase in all segments (prepaid, controle and postpaid). ARPU from VAS posted again a solid growth of ~27% YoY.
Fixed services net revenues rose 15.1% YoY, a solid second quarter. This result confirms fixed operations are maintaining a healthy performance despite a though macro environment.
Product net revenues were down by 56.1% in the period, but again with a better margin (product revenues - COGS) due to the change in handset strategy that focus more on value than volume.

Recent trends in handset volumes are a combination of this strategic move with macroeconomic headwinds and FX volatility. In the quarter, sales were down 77% YoY, to 358 thousand units, while average price increased by 83% YoY, in the same period. As we enter the second half of the year the comparative base will become less uneven, as shown on the chart on the left. Despite all, smartphone penetration reached 70% of total base in May/2016.
OPERATING COSTS AND EXPENSES

Total Normalized Opex continues to show improvements, despite some pressures against the overall downward trend. Main drivers for this quarter opex performance were: (i) uninterrupted actions under the scope of TIM’s Efficiency Program and (ii) handset business strategy change introduced in 2015.
Operating expenses analysis for 2Q16 is presented as follows:
Under the pillar of Organization Rightsizing & Efficiency of the Company’s Efficiency Plan, TIM started in 1Q16 a layoff program, which led to a workforce reduction of 6.4% versus 2Q15, reaching a total headcount of 12,104 people by the end of the quarter. This restructure process led Personnel Expenses to fall, in 2Q16, 16.9% YoY.
Selling & Marketing expenses fell 11.0% YoY in 2Q16, repeating the solid performance of 1Q16, despite increasing costs related to rebranding actions. This dynamic is a consequence of (i) robust reduction in commissioning expenses due to adjustments in remuneration strategies and lower gross additions (-19.3% YoY) and (ii) a reduction in installation FISTEL expenses, which came down 9.9%, following negative net additions in the quarter of 3.3 million lines.
Network & Interconnection costs grew 3.0% YoY in the quarter, illustrating the significant changes in dynamics of this line. As MTR (VU-M) loses its importance, underlain trends of other costs start to appear more pronouncedly, as becomes clear on the chart below.

Network related costs were up 3.9% YoY, despite another solid reduction in leased lines expenditures (-12.9% YoY). These costs are mainly explained by network sharing costs that accelerate together with the same line in revenues as mentioned above, and sites’ land rental expenses.
-13%
Leased lines costs (YoY)
Interconnection costs grew 1.7% YoY, while falling 7.3% compared to 1Q16. This performance is a consequence of (i) increase in costs related to content (Value Added Services) providers, which grows with the expansion of those data services and (ii) the increase in off-net traffic, amid a full impact of the MTR (VU-M) cut.
General & Administrative (G&A) expenses were up 10% YoY in 2Q16, despite a reduction in rental fees related to the completion of headquarter relocation. G&A performance is explained mainly by a low comparison base, specifically in 2Q15. Notwithstanding, in 2Q16, G&A was also impacted by consultancy services expenses. This line will continue to be a key area of efforts within TIM’s Efficiency Program to guarantee the materialization of savings.
As mentioned before, handset business strategy change implemented in 2015 along with macro environment continue to drive Cost of Goods Sold to a significantly decrease of -57.2% YoY in 2Q16, closing the first year half down by 59%.
In 2Q16, Bad Debt expenses increased by 16.2% YoY, while falling 3.1% QoQ. Despite the tough macro environment and growing efforts towards gaining postpaid clients, TIM is being able to sustain a percentage of Bad Debt/Gross Revenues at very healthy levels (1.2%), repeating the ratio of the first quarter.
Normalized Other Operational expenses were up 7.9% YoY in 2Q16 (excluding effects of the towers sale: R$918 mln in 2Q15 and R$37 mln in 2Q16, more details in subsequent section). The increase is a function of a low comparison base for FUST/FUNTTEL taxes specifically in 2Q15.
Subscriber Acquisition Costs (SAC = subsidy + commissioning + total advertising expenses) came at R$32.4 per gross addition in 2Q16, an increase of 5.0% YoY, due to higher advertising costs, regardless of the reduction in commissioning.
SAC/ARPU ratio (indicating the payback per customer) reached 1.9x in 2Q16, flat when compared to 2Q15.
FROM EBITDA TO NET PROFIT
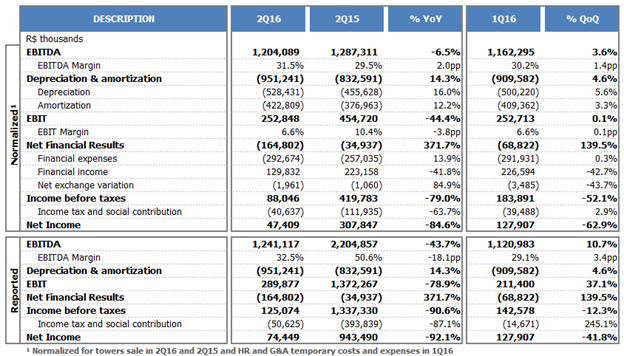
EBITDA
Normalized EBITDA (excluding towers sale impact) dropped 6.5% YoY in 2Q16, confirming 1Q16 was the bottom in yearly performance (-13.5% YoY). EBITDA decrease was a combination of effects that are still pressuring the short term performance: (i) traditional services and incoming revenues decline, (ii) more costs related to consultancy services and (iii) higher bad debt provisions. On the positive side, product’s margin keeps reducing its load (-R$23 mln in 2Q16 vs. -R$69 mln in 2Q15) and innovative services are at a solid pace, while traditional revenues are reducing the pressure.

Considering the ongoing efforts under TIM’s Efficiency Plan and the update of its targets, savings will become more pronouncedly. For instance, this quarter already showed savings in personnel expenses due to the layoff program occurred in 1Q16, additional savings were generated with HQ relocation.
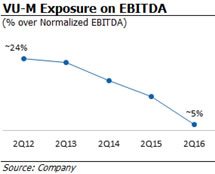
VU-M (MTR) incidence on normalized EBITDA fell once more, reaching its lowest level at ~5% in 2Q16. If we exclude the MTR cut effects, normalized EBITDA would have fallen 3.7% instead of 6.5%.
D&A / EBIT
In 2Q16, Depreciation and Amortization increased 14.3% YoY due to higher network equipment depreciation and higher software amortization. This performance follows our Capex deployment intensification in the last years, although we expect a softer increase in the coming quarters. As a consequence, normalized EBIT declined in 2Q16 to R$253 million.
NET FINANCIAL RESULT
In 2Q16, Net Financial Result worsened versus same period of last year (-R$165 million in 2Q16 versus -R$35 million in 2Q15), mainly due to (i) higher financial expenses affected by leaseback after towers sale and (ii) a decrease in financial income due to poor performance of USD investments (meant to cover USD indexed Capex) and a negative MTM effect.
INCOME AND SOCIAL CONTRIBUTION TAXES
In 2Q16, Normalized Income and Social Contribution decreased to R$40 million compared to R$112 million in 2Q15, basically due to the reduction of taxable profit.
NET INCOME
In 2Q16, Normalized Net Income decreased to R$48 million compared to R$308 million in 2Q15, while reported Net Income summed R$74 million. Normalized EPS (Earnings per Share) reached R$0.02 in 2Q16 (vs. R$0.13 in 2Q15).
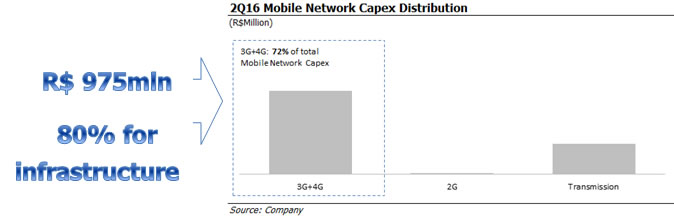
CAPEX
In 2Q16, Capex amounted to R$975 million, an acceleration versus 1Q16 (R$710 mln), but a decrease of 17.7% when compared to 2Q15. Considering 6 months of 2016, Capex summed R$1,685 million, a decrease of 20.1% compared to same period last year, explained by negotiations with vendors and projects optimization.
Capex cycle peaked in 2015 and as we start descending from this level, strong results are confirmed i.e. 4G coverage leadership using spectrum refarming and carrier aggregation, 3G coverage catch up and fiber network expansion.
DEBT, CASH AND FREE CASH FLOW
Gross Debt reached R$7,766 million by the end of June/2016, including the leasing recognition in a total value of R$1,545 million concerning towers sale and LT Amazonas project. Gross debt in Q2 had a moderate increase compared to R$7,494 million in the same period of last year.
Company's debt is concentrated in long-term contracts (88% of the total), composed mainly by financing from BNDES (Brazilian Economic and Social Development Bank) and EIB (European Investment Bank), as well as borrowings from other top international financial institutions.
Approximately 22% of total debt is denominated in foreign currency (USD), and it is 100% hedged in local currency. In 2Q16, average cost of debt was 12.48% vs. 11.56% in 2Q15.
Cash position totaled R$3,810 million by the end of June/2016, a decrease vs. R$4,842 million in 2Q15. Average cash yield (BRL investments) reached 14.24% in 2Q16, an increase compared to 13.25% in 2Q15.
Main movements that affected cash and securities in the last 12 months are demonstrated as follow:

The Company has an investment fund in foreign exchange of R$491.3 million, basically formed by highly liquid public securities. The investment is intended to reduce foreign exchange risk on payments made to suppliers in foreign currency.
Net Debt/EBITDA ratio reached 0.77x in 2Q16 compared to 0.48x in 2Q15. Due to the above mentioned payments, net debt increased to R$3,957 million by the end of June/16, up from R$2,652 million in the same period of last year.
In 2Q16, Normalized Operating Cash Flow came at R$174 million, a decrease compared to R$313 million in 2Q15, mainly due to lower revenues and a negative impact of the decrease in working capital. The latter is explained by lower deferred revenues due to a reduction in the exposure of prepaid credits with dealers in the period.
Normalized decrease in cash and cash equivalents came at -R$627 million in 2Q16 vs -R$235 million in 2Q15, mainly due to higher dividends and debt payments (principal and interests) in the period.
TOWERS SALE IMPACTS
In 2Q16, TIM concluded the fourth closing under the Tower Sale agreement signed in November 2014 with American Tower do Brasil (ATC) that comprised overall sale of 6,481 towers for ~R$3 billion cash.
·
First closing: On April 29, 2015, TIM transferred 4,176 towers to ATC and received ~R$1.9 billion.
·
Second closing: On September 30, 2015 TIM transferred 1,125 towers to ATC and received ~R$517 million.
·
Third closing: On December 16, 2015 TIM transferred 182 towers to ATC and received ~R$84 million.
·
Fourth closing: On June 9, 2016 TIM transferred 270 towers to ATC and received ~R$110 million.
The Master lease agreement (MLA) defines the leaseback of the transferred towers for a 20 years period. According to IAS17, this transaction should be registered as (1) sale and (2) leaseback and following its requirements, the leaseback registered as financial leasing.
Please find below the Financial Statements impacts conciliation and the related notes for further details concerning all four closings:

QUALITY AND NETWORK
QUALITY Developments
Assuming national coverage and quality had improved quite substantially over this period, Anatel is now shifting its focus from a broader state-oriented perspective to a more granular one, concentrating its efforts on smaller geographic areas and specially those where service is still considered poor.
In accordance to Anatel’s directions to monitor and evaluate quality on more specific geographic areas, from this quarter on we will disclosure our quality indicators based on the number of cities – rather than states – within the Agency’s targets. Such indicators are expected to be more assertive and better reflect customer’s experience.
In the last 12 months from March/16 (last data available), TIM kept its solid performance regarding Anatel’s network quality requirements, particularly on data (3G/4G) indicators. As for voice indicators, accessibility metric continues to be close to 100% cities within target, while drop voice indicator has shown an improving trend, reaching the second best performance among the top 4 largest telecom players. This achievement is a result of strong commitment to quality and our goal to accelerate infrastructure development, especially to support data expansion and deliver a better usage experience.

Instant Speed & Average Speed: Regarding Anatel’s metrics for instant speed (SMP10) and average speed (SMP11) we highlight both indicators remain above the Agency’s target. However, due to technical issues for a two week period in a few cities within the state of Parana (PR) both indicators were negatively affected in May/2016 – last available data. It’s important to note that such problems have been solved and both indicators are normalized.

NETWORK EVOLUTION: efficient investment allocation to improve quality, expand coverage and provide a better experience to customers in both 4G and 3G.
The company continues to focus on projects such as sites densification, hetnet coverage expansion, backhaul development, carrier aggregation and others. Coverage, capacity and quality continue to be the infrastructure main pillars for 2016 with approximately 80% of the capex distribution committed to infrastructure.
TIM hetnet project accelerated in the second quarter, with 275 new sites totaling almost 3.4 thousand in the entire country. When compared to 2Q15, number of sites increased by 64% or 1.3 thousand new hotspots in 2Q16.

The MBB project continues to prioritize investment allocation in the most critical areas, aiming to provide high quality experience in mobile broadband. In 2016 the MBB project has 20 clusters, totaling 268 cities planned to be covered in 2016-2017. The cluster concept expands the targeted zones to metropolitan areas of cities that were already included in the MBB project in 2015 prioritizing state capitals and their metropolitan areas, conurbation cities, major coastal cities and main primary access roads.
During the second quarter of 2016, TIM kept its leadership in cities covered with 4G technology, reaching 579 cities or 64% of urban population in the country. This remarkable result was accomplished through spectrum refarming that allows the expansion to new locations with 4G signal with less capex. The project uses the 1,800MHz band and reorganizes the frequency usage according to the spectrum availability together with coverage optimization.
As for the 3G, TIM expanded its coverage to 103 new cities in 2Q16, reaching 1,963 cities or 82.8% of urban population. GSM coverage stood at almost 95% of urban population.
OPERATIONAL, MARKETING AND CARING PERFORMANCE
MOBILE MARKET
Following the movement started in 2015, April and May (last data disclosed by Anatel) were marked by relevant clean-up actions from operators due to significant acceleration in multiple SIM card consolidation process driven by macroeconomic pressures and reduction in the community effect.
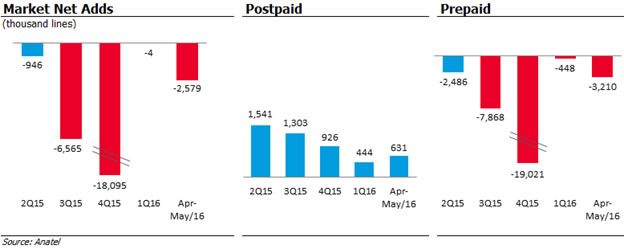
The prepaid segment posted strong disconnections in the period chiefly by TIM’s performance, in line with Company’s commitment to its efficiency plan. On the other hand, despite the macroeconomic pressures and high penetration of mobile services, postpaid base growth accelerated in the period, with TIM leading the segment net additions in May, as a result of its new offers that already accounts to 15% of the total customer base and network quality improvements.
TIM’s PERFORMANCE
TIM’s subscriber base reached 64.0 million lines by the end of 2Q16, internal figure of June/2016, down 14.2% when compared to June/2015 due to the prepaid disconnections mentioned before.
In 3G technology, total customer base reached 34.0 million users, down 17.8% YoY following an increasing penetration of 4G devices. 4G base reached 11.2 million users in 2Q16, an increase of 22.1% over 1Q16 and up by 193% when compared to 2Q15. In the quarter, 4G customer base grew by more than 2.0 million lines following Company’s ongoing efforts to attract users to the LTE technology, which has been concentrating investments in coverage and quality.
Overall smartphone penetration reached 70% of the customer base in May/16, an important increase of 102bps when compared to 2Q15, as a result of the Company’s strategy of equipping its customers in order to stimulate data services penetration among its users. Unique data users resumed growth in May/16, reaching 32.6 million lines (+3.0% vs. 2Q15). This is another good result of the new portfolio, which is gaining traction. As a percentage of the total base, unique data users reached an important milestone of 50% in May/16, compared to 42% in 2Q15.
50%
customer base already using data services
TIM disconnected 3.3 million lines in 2Q16, as a result of prepaid lines disconnections in the quarter (-3.5 million). Total gross additions fell 19% YoY totaling 7.1 million lines in 2Q16 due to tougher macro and industry scenario, while disconnections accelerated to 10.4 million lines in the period, following Company’s focus in its efficiency plan. Consequently, churn rate came at 15.6% in 2Q16, an increase when compared to 2Q15 (13.2%).
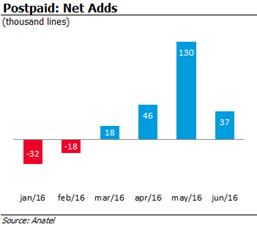
Postpaid customer base reached 13.7 million users by the end of 2Q16, up by 1.6% YoY. Postpaid base ex-M2M grew 2.2% YoY while M2M lines fell 3.6% in the same period. In the quarter, postpaid base posted an important growth of 213 thousand lines, which together with strong Mobile Number Portability (MNP) figures, point to a reversal in the last quarter negative trend.

In 2Q16, TIM expanded its positive results in postpaid MNP. Since the introduction of the new portfolio in November 2015, the Company has been posting positive MNP figures in all postpaid segments, reverting years of negative performance. Also in postpaid, gross adds grew 11% YoY in 2Q16.
As already mentioned, TIM disconnected 3.5 million lines in the prepaid segment, followed by the other operators. This is one of the many efforts made by the Company seeking to reduce significantly its costs. By the end of 2Q16, our prepaid base reached 50.2 million lines, down 17.7% YoY.
CORPORATE SOCIAL RESPONSIBILITY & GOVERNANCE
CSR - Energy Consumption
In line with its Environmental and Climate Change Management Policies guidelines, TIM considers the efficiency of energy consumption as one of its challenges that evolves according to the table below.
Energy Consumption | 2Q16 | 2Q15 | % YoY |
Electricity consumption in MWh | 110,379(*) | 123,330 | -10.5% |
Fuels consumption in liters | 280,594(*) | 362,957 | -22.7% |
(*) Data subject to change - after external verification closing
Energy efficiency is carried out through some actions such as Swap Project (replacing access equipment with more modern and efficient models), the RAN Sharing agreement (sharing model of network infrastructure with other telecom operators) and Freecooling (container ventilation system through the cooler installation in sites, which reduces the use of energy and refrigerants gases by air conditioning equipment). In environmental terms, the RAN Sharing agreement reduces electricity consumption and also has a positive urban impact as it implies in reducing the number of new Radio Base Stations (RBS), minimizing the inconvenience to population. (Indicators EN5 and EN6, GRI-G41).
Aware of the potential of Brazilian renewable energy sources, we are testing the implementation of photovoltaic panels on sites of Northeast and Southeast regions of Brazil. TIM intends to invest and operate in the energy generation market, providing a sustainable model that will secure prices. The investments and efficiency actions underway will leverage the company’s competitiveness, in addition to mitigating environmental impacts.
The currently increasing research for space for the installation of antennas and telecommunications equipment associated with rapid population growth provided a competition scenario that unleashed antennas agglomerations on top of buildings, facades and metal structures. In this context, the Biosite emerged, a structure with a significant reduction in visual impact that helps harmonize with the environment and urban infrastructure. Its multifunctionality can add beyond telecommunications transmission, contributing for lighting and security through surveillance cameras. At the end of June, the project reached a total of 139 activated Biosites (80 Biosites at the end of June 2015).
Moreover, TIM’s 2015 Sustainability Report was published in June, which provides information about our achievements, challenges and projects related to the commitment to sustainable development, embracing the economic, social and environmental dimensions. The document covers the period from 1st January to December 31th 2015 and was based on the international guidelines of the Global Reporting Initiative (GRI)1, G4 version. The main highlights of the publication are our goals in different spheres (training, recycling, energy and suppliers), profile and management of our human capital, our energy efficiency initiatives and the management of greenhouse gas (GHG). Learn more about TIM’s 2015 Sustainability Report clicking here.
Governance
Seeking to improve transparency and increase disclosure of governance themes TIM remains presenting the activities carried by its Board of Directors and Committees. Find below the highlights for 2Q16:
Board and Committees Activities
Board of Directors
o
Members: 10 members (3 independents);
o
Meetings: 2 meetings with average attendance of 90%;
o
Most relevant activities:
§
Analyze of the First Quarter Financial Report (“ITR”) of 2016;
§
Appreciation of the Innovation Projects and Business Development;
§
Election of the Statutory Directors of the Company and indication the Directors of TIM Celular S.A. and of Intelig Telecomunicações Ltda;
§
Resolution on the Execution of an Agreement between Related Parties.
Fiscal Council
o
Members: 3 members (3 independents);
o
Meetings: 1 meeting; average attendance of 100%;
o
Most relevant activities:
§
Analyze the Independent Audit, BDO RCS Auditores Independentes S.S., Report for the First Quarter Financial Report (“ITR”) of 2016;
§
Discussion on Labor, Civil, Tax and Regulatory contingencies;
§
Election of the Fiscal Council President for the fiscal year 2016/2017.
Statutory Audit Committee
o
Members: 3 members (3 independents);
o
Meetings: 5 meetings; average attendance of 100%;
o
Most relevant activities:
§
Analysis of Enterprise Risk Management Report (ERM);
§
Discussion on Labor, Civil, Tax and Regulatory contingencies;
§
Evaluate Due Diligence and status of TIM’s Anti-Corruption Program;
§
Monitor and Supervision of Annual SOx Certification Process & Internal Deficiencies Control;
§
Monitor and Supervision of 20-F Report and Formulário de Referência 2016;
§
Opinion on an Agreement between Related Parties;
§
Opinion on Financial Statements Report for the first quarter of 2016;
§
Opinion on the Chosen of the Independent Audit of the Company;
§
Supervision and Evaluation of Internal Audit Committee.
Compensation Board
o
Members: 3 members;
o
Meetings: 1 meeting; average attendance 100%;
o
Most relevant activities:
§
Discussion of the Proposal Management by Objectives (“MBO”) of the Company for the year.
Control and Risk Board
o
Members: 5 members (2 independent);
o
Meetings: 2 meetings; average attendance of 90%;
o
Most relevant activities:
§
Evaluate Due Diligence and status of TIM’s Anti-Corruption Program;
§
Monitor and Supervision of Annual SOx Certification Process & Internal Deficiencies Control;
§
Present the Sustainability Report of 2015;
§
Supervision and Evaluation of Internal Audit Committee.
STOCK PERFORMANCE
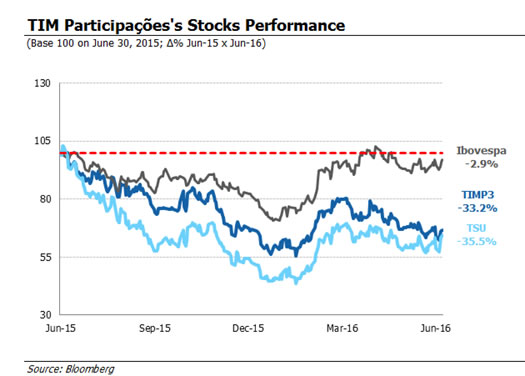
TIMP3 ended 2Q16 at R$6.84, down by 33.2% in the last 12 months mostly due to the pressured macroeconomic scenario, while the Bovespa Index (Ibovespa) was down 2.9% over the same period. The Company's ADRs closed 2Q16 at US$10.55, a decrease of 35.5% in the last 12 months.
DISCLAIMER
The financial and operating consolidated information disclosed in this document, except where otherwise indicated, is presented according to IFRS (International Financial Reporting Standards) and in Brazilian Reais (R$), pursuant to Brazilian Corporate Law. All comparisons refer to the second quarter of 2015 (2Q15) and first quarter of 2016 (1Q16), except when otherwise indicated.
This document may contain forward-looking statements. Such statements are not statements of historical fact and reflect the beliefs and expectations of the Company's management. The words "anticipates”, "believes”, "estimates”, "expects”, "forecasts”, "plans”, "predicts”, "projects”, "targets" and similar words are intended to identify these statements, which necessarily involve known and unknown risks and uncertainties foreseen, or not, by the Company. Therefore, the Company’s future operating results may differ from current expectations and readers of this release should not base their assumptions exclusively on the information given herein. Forward-looking statements only reflect opinions on the date on which they are made and the Company is not obliged to update them in light of new information or future developments.
INVESTOR RELATIONS CONTACTS
Telephones: (+55 21) 4109-3360 / 4109-4017 / 4112-6088 / 4112-5517
E-mail: [email protected]
Investor Relations Website: www.tim.com.br/ir
For more information about TIM please click on this link.
Twitter: @TIM_RI
TIM IR App:

ATTACHMENTS
Attachment 1:
Balance Sheet
Attachment 2: Income Statements
Attachment 3:
Cash Flow Statements
Attachment 4:
Operational Indicators
The Complete Financial Statements, including Explanatory Notes, are available at the Company’s Investor Relations Website.
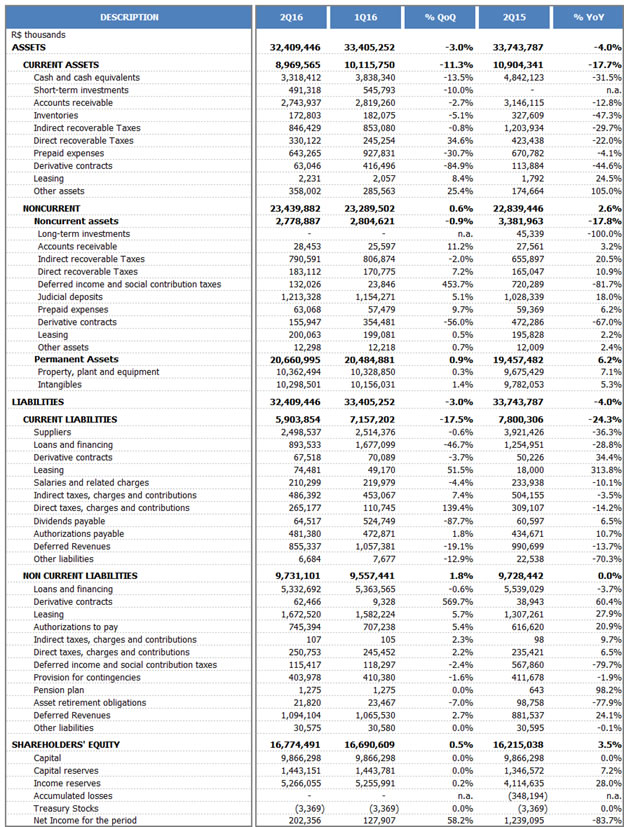
Attachment 1
TIM PARTICIPAÇÕES S.A.
Balance Sheet
(R$ Thousands)
Attachment 2
TIM PARTICIPAÇÕES S.A.
Income Statements
(R$ Thousands)

Attachment 3
TIM PARTICIPAÇÕES S.A.
Cash Flow Statements
(R$ Thousands)

Attachment 4
TIM PARTICIPAÇÕES S.A.
Operational Indicators

Footnotes
1 GRI: Global Reporting Initiative, an international reporting standard on performance indicators, used by TIM on its Sustainability Report.
SIGNATURE
Pursuant to the requirements of the Securities Exchange Act of 1934, the registrant has duly caused this report to be signed on its behalf by the undersigned, thereunto duly authorized.
| TIM PARTICIPAÇÕES S.A. | |||
| Date: July 25, 2016 | By: | /s/ Rogério Tostes | |
| Name: Rogério Tostes | |||
| Title: IRO | |||
This press release may contain forward-looking statements. These statements are statements that are not historical facts, and are based on management's current view and estimates offuture economic circumstances, industry conditions, company performance and financial results. The words "anticipates", "believes", "estimates", "expects", "plans" and similar expressions, as they relate to the company, are intended to identify forward-looking statements. Statements regarding the declaration or payment of dividends, the implementation of principal operating and financing strategies and capital expenditure plans, the direction of future operations and the factors or trends affecting financial condition, liquidity or results of operations are examples of forward-looking statements. Such statements reflect the current views of management and are subject to a number of risks and uncertainties. There is no guarantee that the expected events, trends or results will a ctually occur. The statements are based on many assumptions and factors, including general economic and market conditions, industry conditions, and operating factors. Any changes in such assumptions or factors could cause actual results to differ materially from current expectations.
Serious News for Serious Traders! Try StreetInsider.com Premium Free!
You May Also Be Interested In
- Trisura Announces Timing of First Quarter Results Release And Earnings Conference Call
- Melanie McFaddin with Wiley Bros – Aintree Capital &Partners, LLC Represents Theoris, Inc. in its Acquisition by CoreTech Consulting Group, LLC
- Catalight Practice Guidelines Reflect a Contemporary Research View of the Dosage Effect and Outcome Measures in Autism Care
Create E-mail Alert Related Categories
SEC FilingsSign up for StreetInsider Free!
Receive full access to all new and archived articles, unlimited portfolio tracking, e-mail alerts, custom newswires and RSS feeds - and more!
