

Form 6-K Silver Wheaton Corp. For: Mar 30
 Tweet
Tweet Share
ShareUNITED STATES
SECURITIES AND EXCHANGE COMMISSION
Washington, D.C. 20549
FORM 6-K
REPORT OF FOREIGN PRIVATE ISSUER PURSUANT TO RULE 13a-16
OR 15d-16
UNDER THE SECURITIES EXCHANGE ACT OF 1934
For the month of March, 2016
Commission File Number: 001-32482
SILVER WHEATON CORP.
(Translation of registrant's name into English)
Suite 3500, 1021 West Hastings Street
Vancouver, British Columbia
V6E 0C3
(604) 684-9648
(Address of principal executive offices)
Indicate by check mark whether the registrant files or will file annual reports under cover Form 20-F or Form 40-F.
[ ] Form 20-F [ x ] Form 40-F
Indicate by check mark if the registrant is submitting the Form 6-K in paper as permitted by Regulation S-T Rule 101(b)(1): [ ]
Indicate by check mark if the registrant is submitting the Form 6-K in paper as permitted by Regulation S-T Rule 101(b)(7): [ ]
SUBMITTED HEREWITH
Exhibits
| 99.1 | NI 43-101 Technical Report | |
SIGNATURES
Pursuant to the requirements of the Securities Exchange Act of 1934, the registrant has duly caused this report to be signed on its behalf by the undersigned, thereunto duly authorized.
| SILVER WHEATON CORP. | ||
| (Registrant) | ||
| Date: March 30, 2016 | By: | /s/ Curt Bernardi |
| Curt Bernardi | ||
| Title: | Senior Vice President, Legal and Corporate Secretary | |
 |
 |
Salobo Operations
Para State Brazil
NI 43-101 Technical Report

Prepared for:
Silver Wheaton Corp.
Prepared by:
Gerrit Vos, P.Eng.
Dr Georges Verly, P.Eng.
Dr Armando Simon, P.Geo.
Pierre Lacombe, P.Eng.
Donald Hickson, P.Eng.
Vikram Khera, P.Eng.
Stella Searston, RM SME
Effective Date: 31 December, 2015
Project Number: 179678

CERTIFICATE OF QUALIFIED PERSON
I, Gerrit Vos, P.Eng., am employed as Technical Director – Mining, Construction & Speciality Consulting with Amec Foster Wheeler plc. (Amec Foster Wheeler).
This certificate applies to the technical report titled “Salobo Operations, Para State, Brazil, NI 43-101 Technical Report” that has an effective date of 31 December, 2015 (the “technical report”).
I am a member of the Association of Professional Engineers and Geoscientists of British Columbia (APEGBC). I graduated in 1978 from the University of Technology in Delft, the Netherlands with a Masters degree in Mining Engineering.
I have practiced my profession for 37 years. I have been directly involved in various mines in Brazil including Sossego and other copper–gold projects such as Agua Rica in Argentina and Bisha in Eritrea, As a result of my experience and qualifications, I am a Qualified Person as defined in National Instrument 43–101 Standards of Disclosure for Mineral Projects (NI 43–101).
I visited the Salobo Operations from 20 to 26 June, 2015.
I am responsible for Sections 1.12, 1.13, 1.14, 1.16, 1.19, 1.20, 1.22, 1.23; Sections 2.2, 2.3, 2.4, 2.5; Section 3.1; Section 15; Section 16; Sections 18.1, 18.2, 18.5, 18.6, 18.7, 18.8, 18.9, 18.10; Section 20.3; Sections 21.1.1, 21.1.2, 21.1.4, 21.1.5, 21.2.1, 21.2.2, 21.2.4, 21.3; Sections 24.1.2, 24.2.1; Sections 25.6, 25.7, 25.9, 25.12, 25.13, 25.15; and Section 27 of the technical report.
I am independent of Silver Wheaton Corp as independence is described by Section 1.5 of NI 43–101.
I have been involved with the Salobo Operations during the preparation of the technical report, and I have no previous involvement with the operations.
I have read NI 43–101 and the sections of the technical report for which I am responsible have been prepared in compliance with that Instrument.
As of the effective date of the technical report, to the best of my knowledge, information and belief, the sections of the technical report for which I am responsible contain all scientific and technical information that is required to be disclosed to make those sections of the technical report not misleading.
Dated: 23 March 2016
| /s/ Gerrit Vos |
|
| Gerrit Vos, P.Eng. |
| Amec Foster Wheeler plc. | |
| International House, Dover Place, | |
| Ashford, Kent, TN23 1HU, UK | www.amecfw.com |
| Tel: +44 (0)1233 65 3600 |
CERTIFICATE OF QUALIFIED PERSON
I, Dr Georges Verly, P.Eng., am employed as the Chief Geostatistician with Amec Foster Wheeler Americas Limited (Amec Foster Wheeler).
This certificate applies to the technical report titled “Salobo Operations, Para State, Brazil, NI 43-101 Technical Report” that has an effective date of 31 December, 2015 (the “technical report”).
I am a member of the Association of Professional Engineers and Geoscientists of British Columbia. I graduated from École Polytechnique de Montréal with a B.Sc.A. degree in Geological Engineering in 1977 and an M.Sc.A. degree in Geostatistics in 1980. I graduated from Stanford University with a PhD degree in Applied Earth Sciences in 1984.
I have practiced my profession for 39 years. I have been directly involved in geostatistical resource estimation and simulation, and auditing of gold, copper, nickel and other mineral properties.
As a result of my experience and qualifications, I am a Qualified Person as defined in National Instrument 43–101 Standards of Disclosure for Mineral Projects (NI 43–101).
I visited the Salobo Operations on 29 June, 2015.
I am responsible for Sections 1.10, 1.11; Sections 2.2, 2.3, 2.4, 2.5; Sections 3.1, 3.2; Section 14; Sections 25.5, 25.15; and Section 27 of the technical report.
I am independent of Silver Wheaton Corp as independence is described by Section 1.5 of NI 43–101.
I have been involved with the Salobo Operations during the preparation of the technical report, and I have no previous involvement with the operations.
I have read NI 43–101 and the sections of the technical report for which I am responsible have been prepared in compliance with that Instrument.
As of the effective date of the technical report, to the best of my knowledge, information and belief, the sections of the technical report for which I am responsible contain all scientific and technical information that is required to be disclosed to make those sections of the technical report not misleading.
Dated: 23 March 2016
| /s/ Dr Georges Verly |
|
| Dr Georges Verly, P.Eng. |
| Amec Foster Wheeler Americas Limited | |
| 111 Dunsmuir Street, Suite 400 | |
| Vancouver, B.C. V6B 5W3 | www.amecfw.com |
| Tel (604) 664-4315 | |
| Fax (604) 669-9516 |
CERTIFICATE OF QUALIFIED PERSON
I, Dr Armando Simon, P.Geo, am employed as a Principal Geologist with Amec Foster Wheeler International Ingeniería y Construcción Limitada (Amec Foster Wheeler).
This certificate applies to the technical report titled “Salobo Operations, Para State, Brazil, NI 43-101 Technical Report” that has an effective date of 31 December, 2015 (the technical report).
I am a Registered Member of the Chilean Mining Commission (RM CMC #71), a Professional Geologist (PGeo; #1633) registered with the Association of Professional Geologists of Ontario (APGO), and a Registered Professional Geoscientist (RPGeo; #10053) with the Australian Institute of Geoscentists (AIG). I graduated from the University of Bucharest with a Bachelor of Engineering degree in Geology and Geophysics in 1974, and a Doctorate of Engineering with mention in Economic Geology in 1985.
Since 1974, I have continually been involved in mineral exploration projects for precious and base metals and industrial minerals in Algeria, Argentina, Australia, Brazil, Canada, Colombia, D.R. Congo, Cuba, Chile, Ecuador, Eritrea, Ethiopia, Guatemala, Guinea, Guyana, Jamaica, Kazakhstan, Madagascar, Mali, Mexico, Nicaragua, Pakistan, Peru, Portugal, Romania, Russia, South Africa, and Vietnam.
As a result of my experience and qualifications, I am a Qualified Person as defined in National Instrument 43–101 Standards of Disclosure for Mineral Projects (NI 43–101).
I visited the Salobo Operations from 20 to 26 June, 2015.
I am responsible for Sections 1.5, 1.6, 1.7, 1.8, 1.23, Sections 2.2, 2.3, 2.5; Sections 3.1, 3.2; Section 6; Section 7; Section 8; Section 9; Section 10; Section 11; Section 12; Section 24.1.1; Sections 25.2, 25.3, 25.15; Section 26 and Section 27 of the technical report.
I am independent of Silver Wheaton Corp. as independence is described by Section 1.5 of NI 43–101.
I have been involved with the Salobo Operations during the preparation of the technical report, and I have no previous involvement with the operations.
I have read NI 43–101 and the sections of the technical report for which I am responsible have been prepared in compliance with that Instrument.
As of the effective date of the technical report, to the best of my knowledge, information and belief, the sections of the technical report for which I am responsible contain all scientific and technical information that is required to be disclosed to make those sections of the technical report not misleading.
Dated: 23 March 2016
| /s/ Dr Armando Simon |
|
| Dr Armando Simon, P.Geo. |
| Amec Foster Wheeler International Ingeniería y Construcción Limitada | |
| Av. Apoquindo 3846, Piso 15, Las Condes, | |
| Santiago, Chile | www.amecfw.com |
| Tel: 56 2 2109500 | |
| Fax: 56 2 2109510 |
CERTIFICATE OF QUALIFIED PERSON
I, Pierre Lacombe, P.Eng., Ing., was a consultant to Amec Foster Wheeler Americas Limited (“Amec Foster Wheeler”) when the site visit, data gathering, report preparation and review process for the technical report were carried out.
This certificate applies to the technical report titled “Salobo Operations, Para State, Brazil, NI 43-101 Technical Report” that has an effective date of 31 December, 2015 (the “technical report”).
I am a member of Ordre des Ingénieurs du Québec (#39496), Professional Engineers Ontario (#100210593) and the Professional Engineers and Geoscientists of Newfoundland & Labrador (#08150). I graduated from École Polytechnique of Montréal, Canada, in 1984 with a B. Eng. in Mining Engineering.
I have practiced my profession for 32 years, during which I have been directly involved in the operations and management of mineral processing plants for base metals, in their design and commissioning in North, Central and South America.
As a result of my experience and qualifications, I am a Qualified Person as defined in National Instrument 43–101 Standards of Disclosure for Mineral Projects (NI 43–101).
I visited the Salobo Operations from 20 to 26 June, 2015.
I am responsible for Sections 1.9, 1.15; Sections 2.2, 2.3, 2.5; Sections 3.1, 3.2; Section 13; Section 17; Section 19.1; Sections 21.1.1, 21.1.3, 21.2.1, 21.2.3, 21.3; Sections 24.1.3, 24.2.2; and Sections 25.4, and 25.8 of the technical report. I am responsible for the aspects relevant to mineral processing in Sections 1.19, 1.20; Sections 25.12, 25.13, 25.15, and Section 27.
I am independent of Silver Wheaton Corp as independence is described by Section 1.5 of NI 43–101.
I have been involved with the Salobo Operations during the preparation of the technical report, and I have no previous involvement with the operations.
I have read NI 43–101 and the sections of the technical report for which I am responsible have been prepared in compliance with that Instrument.
As of the effective date of the technical report, to the best of my knowledge, information and belief, the sections of the technical report for which I am responsible contain all scientific and technical information that is required to be disclosed to make those sections of the technical report not misleading.
Dated: 23 March 2016
| /s/ Pierre Lacombe |
|
| Pierre Lacombe, P.Eng., Ing. |
| Amec Foster Wheeler Americas Limited | |
| 2020 Winston Park Drive, Suite 700 | |
| Oakville, ON, L6H 6X7 | |
| Canada | www.amecfw.com |
| Tel:+1 905 829 5400 | |
| Fax:+1 905 829 5401 |
CERTIFICATE OF QUALIFIED PERSON
I, Donald (Don) Hickson, am employed as E&I Division Manager / Principal Tailings Engineer with Amec Foster Wheeler (Perú) S.A. (Amec Foster Wheeler) (“Amec Foster Wheeler”).
This certificate applies to the technical report titled “Salobo Operations, Para State, Brazil, NI 43-101 Technical Report” that has an effective date of 31 December, 2015 (the “technical report”).
I am a registered professional engineer (P.Eng.) of Alberta, Canada (APEGGA). I graduated from the University of Waterloo, in 1991 with a Bachelor of Applied Science degree.
I have practiced my profession for 24 years. I have been directly involved in analysis and design related to Tailings, Groundwater, Environmental, and Mine Closure for multiple mining projects, carried out over several countries including Canada, United States, Peru, Chile, Brazil, Colombia, and Bolivia.
As a result of my experience and qualifications, I am a Qualified Person as defined in National Instrument 43–101 Standards of Disclosure for Mineral Projects (“NI 43–101”).
I have not visited the Salobo Operations.
I am responsible for Sections 1.17, 1.22, 1.23; Sections 2.2, 2.3, 2.5; Sections 3.1, 3.2; Sections 18.3, 18.4; Sections 20.1, 20.2, 20.4, 20.5, 20.6, 20.7, 20.8, 20.9; Section 24.2.3; Sections 25.10, 25.15; and Section 27 of the technical report.
I am independent of Silver Wheaton Corp as independence is described by Section 1.5 of NI 43–101.
I have no previous involvement with the Salobo Operations.
I have read NI 43–101 and the sections of the technical report for which I am responsible have been prepared in compliance with that Instrument.
As of the effective date of the technical report, to the best of my knowledge, information and belief, the sections of the technical report for which I am responsible contain all scientific and technical information that is required to be disclosed to make those sections of the technical report not misleading.
Dated: 23 March 2016
| /s/ Donald Hickson |
|
| Donald Hickson, P.Eng. |
| Amec Foster Wheeler (Perú) S.A. | |
| Calle Las Begonias 441, Piso 8 | |
| San Isidro, Lima 27, Perú | |
| Tel (511) 221-3130 | |
| Fax (511) 221-3143 | www.amecfw.com |
CERTIFICATE OF QUALIFIED PERSON
I, Vikram Khera, P.Eng., am employed as a Financial Analyst with Amec Foster Wheeler Americas Ltd (“Amec Foster Wheeler”).
This certificate applies to the technical report titled “Salobo Operations, Para State, Brazil, NI 43-101 Technical Report” that has an effective date of 31 December, 2015 (the “technical report”).
I am a member of the Professional Engineers Ontario. I graduated from the University of British Columbia in 2002 with a Bachelor of Applied Science degree.
I have practiced my profession for over 12 years.
As a result of my experience and qualifications, I am a Qualified Person as defined in National Instrument 43–101 Standards of Disclosure for Mineral Projects (“NI 43–101”).
I have not visited the Salobo Operations.
I am responsible for Sections 1.18, 1.21, 1.22, 1.23; Sections 2.2, 2.4, 2.5; Sections 3.3, 3.4; Section 19; Section 22; Section 24.1.4; Sections 25.11, 25.14, 25.15; and Section 27 of the technical report.
I am independent of Silver Wheaton Corp as independence is described by Section 1.5 of NI 43–101.
I have been involved with the Salobo Operations during the preparation of the technical report, and I have no previous involvement with the operations.
I have read NI 43–101 and the sections of the technical report for which I am responsible have been prepared in compliance with that Instrument.
As of the effective date of the technical report, to the best of my knowledge, information and belief, the sections of the technical report for which I am responsible contain all scientific and technical information that is required to be disclosed to make those sections of the technical report not misleading.
Dated: 23 March 2016
| /s/ Vikram Khera |
|
| Vikram Khera, P.Eng. |
| Amec Foster Wheeler Americas Ltd | |
| 2020 Winston Park Drive, Suite 700 | |
| Oakville, ON, L6H 6X7 | |
| Tel: (905) 829 5400 | |
| Fax: (905) 829 5401 | www.amecfw.com |
CERTIFICATE OF QUALIFIED PERSON
I, Stella Searston, RM SME, am employed as a Principal Geologist with Amec Foster Wheeler E&C Services Inc. (Amec Foster Wheeler).
This certificate applies to the technical report titled “Salobo Operations, Para State, Brazil, NI 43-101 Technical Report” that has an effective date of 31 December, 2015 (the “technical report”).
I am a Fellow of the Australasian Institute of Mining and Metallurgy (FAusIMM #111778), a Member of the Australian Institute of Geoscientists (MAIG #2406) and a Registered Member of the Society for Mining, Metallurgy and Exploration (RM SME #4168111). I graduated from James Cook University in Australia in 1987 with a Bachelor of Science degree in geology, and from the University of Tasmania in 1999 with a Master of Economic Geology degree. I have practiced professionally since graduation in 1987. In that time I have been directly involved in generation of, and review of, mineral tenure, surface and other property rights, geological, mineralization, exploration and drilling data, geological models, sampling, sample preparation, assaying and other resource-estimation related analyses, quality assurance-quality control databases, resource estimates, risk analyses, preliminary economic assessment, pre-feasibility, and feasibility studies, and due diligence studies in Australia, Southern Africa, the Pacific and North and South America.
As a result of my experience and qualifications, I am a Qualified Person as defined in National Instrument 43–101 Standards of Disclosure for Mineral Projects (NI 43–101).
I have not visited the Salobo Operations.
I am responsible for Sections 1.1, 1.2, 1.3, 1.4, 1.22, 1.23, 1.24; Section 2.1, 2.2, 2.4, 2.5, 2.6; Section 3; Section 4; Section 5; Section 23; Sections 24.1.1, 24.2.4; Sections 25.1, 25.15; Section 26; and Section 27 of the technical report.
I am independent of Silver Wheaton Corp as independence is described by Section 1.5 of NI 43–101.
I have been involved with the Salobo Operations during the preparation of the technical report, and I have no previous involvement with the operations.
I have read NI 43–101 and the sections of the technical report for which I am responsible have been prepared in compliance with that Instrument.
As of the effective date of the technical report, to the best of my knowledge, information and belief, the sections of the technical report for which I am responsible contain all scientific and technical information that is required to be disclosed to make those sections of the technical report not misleading.
Dated: 23 March 2016
| /s/ Stella Searston |
|
| Stella Searston, RM SME |
| Amec Foster Wheeler E&C Services Inc. | |
| Mining and Metals Consulting Group | |
| 961 Matley Lane, Suite 110 | |
| Reno, NV, 89502 | www.amecfw.com |
| Tel: +1 775 329-6123 | |
| Fax: 1 775 322 9380 |
IMPORTANT NOTICE
This report was prepared as National Instrument 43-101 Technical Report for Silver Wheaton Corp. (Silver Wheaton) by Amec Foster Wheeler Americas Limited (Amec Foster Wheeler). The quality of information, conclusions, and estimates contained herein is consistent with the level of effort involved in Amec Foster Wheeler’s services, based on i) information available at the time of preparation, ii) data supplied by outside sources, and iii) the assumptions, conditions, and qualifications set forth in this report. This report is intended for use by Silver Wheaton subject to terms and conditions of its contract with Amec Foster Wheeler. Except for the purposes legislated under Canadian provincial securities law, any other uses of this report by any third party is at that party’s sole risk
 |
Salobo Operations Para State, Brazil NI 43-101 Technical Report |
| C O N T E N T S | ||||
| 1.0 | SUMMARY | 1-1 | ||
| 1.1 | Introduction | 1-1 | ||
| 1.2 | Terms of Reference | 1-1 | ||
| 1.3 | Project Setting | 1-1 | ||
| 1.4 | Mineral Tenure, Surface Rights, Royalties and Agreements | 1-2 | ||
| 1.5 | Geology and Mineralization | 1-2 | ||
| 1.6 | History | 1-3 | ||
| 1.7 | Drilling and Sampling | 1-3 | ||
| 1.8 | Data Verification | 1-5 | ||
| 1.9 | Metallurgical Testwork | 1-6 | ||
| 1.10 | Mineral Resource Estimation | 1-7 | ||
| 1.11 | Mineral Resource Statement | 1-8 | ||
| 1.12 | Mineral Reserve Estimation | 1-10 | ||
| 1.13 | Mineral Reserve Statement | 1-10 | ||
| 1.14 | Mining Methods | 1-13 | ||
| 1.15 | Recovery Methods | 1-13 | ||
| 1.16 | Project Infrastructure | 1-14 | ||
| 1.17 | Environmental, Permitting and Social Considerations | 1-15 | ||
| 1.17.1 | Environmental Considerations | 1-15 | ||
| 1.17.2 | Tailings Storage Facility | 1-15 | ||
| 1.17.3 | Water Management | 1-16 | ||
| 1.17.4 | Closure and Reclamation Planning | 1-16 | ||
| 1.17.5 | Permitting Considerations | 1-16 | ||
| 1.17.6 | Social Considerations | 1-16 | ||
| 1.18 | Markets and Contracts | 1-16 | ||
| 1.19 | Capital Cost Estimates | 1-17 | ||
| 1.20 | Operating Cost Estimates | 1-17 | ||
| 1.21 | Economic Analysis | 1-18 | ||
| 1.22 | Risks and Opportunities | 1-18 | ||
| 1.23 | Interpretation and Conclusions | 1-19 | ||
| 1.24 | Recommendations | 1-19 | ||
| 2.0 | INTRODUCTION | 2-1 | ||
| 2.1 | Terms of Reference | 2-1 | ||
| 2.2 | Qualified Persons | 2-4 | ||
| 2.3 | Site Visits and Scope of Personal Inspection | 2-4 | ||
| 2.4 | Effective Dates | 2-4 | ||
| 2.5 | Information Sources and References | 2-5 | ||
| 2.6 | Previous Technical Reports | 2-5 | ||
| 3.0 | RELIANCE ON OTHER EXPERTS | 3-1 | ||
| 3.1 | Mineral Tenure, Surface Rights and Royalties | 3-1 | ||
| 3.2 | Environmental, Permitting and Social and Community Impacts | 3-1 | ||
| 3.3 | Taxation | 3-3 | ||
| March 2016
Project Number:179678 |
TOC i | |
|
Salobo Operations Para State, Brazil NI 43-101 Technical Report |
| 3.4 | Markets, Contracts and Commodity Pricing | 3-3 | ||
| 4.0 | PROPERTY DESCRIPTION AND LOCATION | 4-1 | ||
| 4.1 | Location | 4-1 | ||
| 4.2 | Property and Title in Brazil | 4-1 | ||
| 4.2.1 | Introduction | 4-1 | ||
| 4.2.2 | Mineral Tenure | 4-1 | ||
| 4.2.3 | Surface Rights | 4-3 | ||
| 4.2.4 | Royalties/Mining Taxes | 4-3 | ||
| 4.2.5 | Environmental Licencing | 4-3 | ||
| 4.2.6 | Social Licence | 4-4 | ||
| 4.2.7 | Water Rights | 4-5 | ||
| 4.2.8 | Fraser Institute Survey | 4-5 | ||
| 4.3 | Project Ownership | 4-6 | ||
| 4.4 | Mineral Tenure | 4-6 | ||
| 4.5 | Surface Rights | 4-6 | ||
| 4.6 | Royalties and Encumbrances | 4-6 | ||
| 4.7 | Property Agreements | 4-8 | ||
| 4.8 | Permits | 4-8 | ||
| 4.9 | Environmental Liabilities | 4-8 | ||
| 4.10 | Social License | 4-8 | ||
| 4.11 | Comments on Section 4 | 4-8 | ||
| 5.0 | ACCESSIBILITY, CLIMATE, LOCAL RESOURCES, INFRASTRUCTURE, AND PHYSIOGRAPHY | 5-1 | ||
| 5.1 | Accessibility | 5-1 | ||
| 5.2 | Climate | 5-1 | ||
| 5.3 | Local Resources and Infrastructure | 5-1 | ||
| 5.4 | Physiography | 5-3 | ||
| 5.5 | Comments on Section 5 | 5-3 | ||
| 6.0 | HISTORY | 6-1 | ||
| 6.1 | Exploration History | 6-1 | ||
| 6.2 | Production History | 6-2 | ||
| 7.0 | GEOLOGICAL SETTING AND MINERALIZATION | 7-1 | ||
| 7.1 | Regional Geology | 7-1 | ||
| 7.2 | Project Geology | 7-4 | ||
| 7.2.1 | Lithologies | 7-4 | ||
| 7.2.2 | Structure | 7-4 | ||
| 7.2.3 | Metamorphism | 7-7 | ||
| 7.2.4 | Alteration | 7-8 | ||
| 7.2.5 | Mineralization | 7-8 | ||
| 7.2.6 | Weathering | 7-10 | ||
| 7.2.7 | Mineralization Age | 7-11 | ||
| 7.3 | Deposit Descriptions | 7-11 | ||
| 7.4 | Comments on Section 7 | 7-18 | ||
| 8.0 | DEPOSIT TYPES | 8-1 | ||
| March 2016
Project Number:179678 |
TOC ii | |
|
Salobo Operations Para State, Brazil NI 43-101 Technical Report |
| 8.1 | Comments on Section 8 | 8-3 | ||
| 9.0 | EXPLORATION | 9-1 | ||
| 9.1 | Exploration History | 9-1 | ||
| 9.2 | Grids and Surveys | 9-1 | ||
| 9.3 | Geological Mapping | 9-1 | ||
| 9.4 | Geochemical Sampling | 9-2 | ||
| 9.5 | Geophysics | 9-2 | ||
| 9.5.1 | Gamma-Spectrometric Survey | 9-2 | ||
| 9.5.2 | Ground Magnetometric Survey | 9-3 | ||
| 9.5.3 | IP Survey | 9-3 | ||
| 9.5.4 | Ground Transient Electromagnetic Survey | 9-7 | ||
| 9.5.5 | Airborne Gravity Survey | 9-7 | ||
| 9.6 | Petrology, Mineralogy, and Research Studies | 9-7 | ||
| 9.7 | Exploration Potential | 9-11 | ||
| 9.8 | Comments on Section 9 | 9-11 | ||
| 10.0 | DRILLING | 10-1 | ||
| 10.1 | Drill Methods | 10-1 | ||
| 10.2 | Geological Logging | 10-1 | ||
| 10.2.1 | Legacy | 10-1 | ||
| 10.2.2 | SMSA (1997) | 10-1 | ||
| 10.2.3 | SMSA/CVRD (2002–2003) | 10-4 | ||
| 10.3 | Recovery | 10-5 | ||
| 10.4 | Collar Surveys | 10-5 | ||
| 10.5 | Downhole Surveys | 10-5 | ||
| 10.6 | Geotechnical and Hydrological Drilling | 10-5 | ||
| 10.7 | Metallurgical Drilling | 10-5 | ||
| 10.8 | Sample Length/True Thickness | 10-7 | ||
| 10.9 | Comments on Section 10 | 10-7 | ||
| 11.0 | SAMPLE PREPARATION, ANALYSES, AND SECURITY | 11-1 | ||
| 11.1 | Sampling Methods | 11-1 | ||
| 11.1.1 | Drill Core | 11-1 | ||
| 11.1.2 | Grade-Control Sampling | 11-1 | ||
| 11.2 | Metallurgical Sampling | 11-1 | ||
| 11.3 | Bulk Density and Specific Gravity Determinations | 11-3 | ||
| 11.4 | Analytical and Test Laboratories | 11-3 | ||
| 11.5 | Sample Preparation and Analysis | 11-5 | ||
| 11.5.1 | Legacy | 11-5 | ||
| 11.5.2 | CVRD (2002–2003) | 11-5 | ||
| 11.5.3 | Grade Control Samples | 11-6 | ||
| 11.6 | Quality Assurance and Quality Control | 11-10 | ||
| 11.6.1 | Legacy | 11-10 | ||
| 11.6.2 | Current Quality Control | 11-11 | ||
| 11.7 | Databases | 11-12 | ||
| 11.8 | Sample Security | 11-13 | ||
| 11.9 | Sample Storage | 11-13 | ||
| March 2016
Project Number:179678 |
TOC iii | |
|
Salobo Operations Para State, Brazil NI 43-101 Technical Report |
| 11.10 | Comments on Section 11 | 11-14 | ||
| 12.0 | DATA VERIFICATION | 12-1 | ||
| 12.1 | Major Mining Studies | 12-1 | ||
| 12.2 | External Audits and Reviews | 12-1 | ||
| 12.3 | Amec Foster Wheeler Reviews | 12-1 | ||
| 12.4 | Comments on Section 12 | 12-2 | ||
| 13.0 | MINERAL PROCESSING AND METALLURGICAL TESTING | 13-1 | ||
| 13.1 | Metallurgical Testwork | 13-1 | ||
| 13.1.1 | Variability Tests | 13-1 | ||
| 13.1.2 | High Pressure Grind Roll Trade-off Study (2006) | 13-5 | ||
| 13.1.3 | Mixed Ore Zone Copper Recovery Testwork | 13-6 | ||
| 13.2 | Recovery Estimates | 13-8 | ||
| 13.3 | Metallurgical Variability | 13-10 | ||
| 13.4 | Deleterious Elements | 13-10 | ||
| 13.5 | Actual Plant Results versus Budgeted Projections | 13-13 | ||
| 13.5.1 | Historical Metallurgical Results | 13-13 | ||
| 13.5.2 | Historical Plant Utilization | 13-16 | ||
| 13.6 | Comments on Section 13 | 13-21 | ||
| 14.0 | MINERAL RESOURCE ESTIMATES | 14-1 | ||
| 14.1 | Introduction | 14-1 | ||
| 14.2 | Geological Models | 14-1 | ||
| 14.3 | Grade Capping / Outlier Restrictions | 14-2 | ||
| 14.4 | Composites | 14-2 | ||
| 14.5 | Exploratory Data Analysis | 14-6 | ||
| 14.5.1 | Declustering | 14-6 | ||
| 14.5.2 | Original Sample Statistics | 14-6 | ||
| 14.5.3 | Composite Statistics | 14-6 | ||
| 14.5.4 | Contact Analysis | 14-7 | ||
| 14.6 | Variography | 14-7 | ||
| 14.6.1 | Block Model Dimensions | 14-7 | ||
| 14.7 | Block Model Assignments | 14-7 | ||
| 14.7.1 | Lithology | 14-7 | ||
| 14.7.2 | Mineralization/Grade Shells | 14-9 | ||
| 14.7.3 | Density | 14-9 | ||
| 14.8 | Estimation/Interpolation Method | 14-9 | ||
| 14.9 | Block Model Validation | 14-10 | ||
| 14.9.1 | Block Model Visual Validation | 14-10 | ||
| 14.9.2 | Global Grade Bias Check | 14-10 | ||
| 14.9.3 | Local Grade Bias Check | 14-10 | ||
| 14.9.4 | Selectivity Check | 14-15 | ||
| 14.9.5 | Reconciliation with Production | 14-15 | ||
| 14.10 | Classification of Mineral Resources | 14-15 | ||
| 14.11 | Reasonable Prospects of Eventual Economic Extraction | 14-19 | ||
| 14.12 | Mineral Resource Statement | 14-21 | ||
| 14.13 | Factors That May Affect the Mineral Resource Estimate | 14-21 | ||
| March 2016
Project Number:179678 |
TOC iv | |
|
Salobo Operations Para State, Brazil NI 43-101 Technical Report |
| 14.14 | Comments on Section 14 | 14-23 | ||
| 15.0 | MINERAL RESERVE ESTIMATES | 15-1 | ||
| 15.1 | Introduction | 15-1 | ||
| 15.2 | Mineral Reserves Statement | 15-1 | ||
| 15.3 | Factors That May Affect the Mineral Reserve Estimate | 15-1 | ||
| 15.4 | Pit Optimization | 15-4 | ||
| 15.4.1 | Selective Mining Unit Sizing | 15-5 | ||
| 15.4.2 | Surface Topography | 15-5 | ||
| 15.4.3 | Density and Moisture | 15-6 | ||
| 15.4.4 | Pit Slope Angles | 15-6 | ||
| 15.4.5 | Mining Costs | 15-7 | ||
| 15.4.6 | Consideration of Dilution, Mining Losses and Reconciliation | 15-7 | ||
| 15.4.7 | Plant Recovery | 15-12 | ||
| 15.5 | Pit and Phase Selection | 15-12 | ||
| 15.5.1 | Final Pit Design | 15-12 | ||
| 15.6 | Comments on Section 15 | 15-15 | ||
| 16.0 | MINING METHODS | 16-1 | ||
| 16.1 | Overview | 16-1 | ||
| 16.2 | Geotechnical Considerations | 16-1 | ||
| 16.3 | Consideration of Marginal Cutoff Grades and Dilution | 16-2 | ||
| 16.4 | Production Schedule | 16-4 | ||
| 16.5 | Grade Control | 16-9 | ||
| 16.6 | Mining Equipment | 16-9 | ||
| 16.7 | Blasting and Explosives | 16-11 | ||
| 16.8 | Comments on Section 16 | 16-12 | ||
| 17.0 | RECOVERY METHODS | 17-1 | ||
| 17.1 | Process Flowsheet | 17-1 | ||
| 17.2 | Plant Design | 17-2 | ||
| 17.3 | Energy, Water, and Process Materials Requirements | 17-6 | ||
| 17.4 | Comments on Section 17 | 17-6 | ||
| 18.0 | PROJECT INFRASTRUCTURE | 18-1 | ||
| 18.1 | Road and Logistics | 18-1 | ||
| 18.2 | Stockpiles and Waste Rock Storage Facilities | 18-1 | ||
| 18.3 | Tailings Storage Facilities | 18-4 | ||
| 18.4 | Water Management | 18-4 | ||
| 18.5 | Site Infrastructure | 18-4 | ||
| 18.6 | Power and Electrical | 18-4 | ||
| 18.7 | Fuel | 18-5 | ||
| 18.8 | General Waste | 18-5 | ||
| 18.9 | Water Supply | 18-5 | ||
| 18.10 | Comments on Section 18 | 18-6 | ||
| 19.0 | MARKET STUDIES AND CONTRACTS | 19-1 | ||
| 19.1 | Market Studies | 19-1 | ||
| 19.2 | Commodity Price Projections | 19-2 | ||
| March 2016
Project Number:179678 |
TOC v | |
|
Salobo Operations Para State, Brazil NI 43-101 Technical Report |
| 19.3 | Contracts | 19-2 | ||
| 19.4 | Comments on Section 19 | 19-3 | ||
| 20.0 | ENVIRONMENTAL STUDIES, PERMITTING, AND SOCIAL OR COMMUNITY | |||
| IMPACT | 20-1 | |||
| 20.1 | Baseline Studies | 20-1 | ||
| 20.1.1 | Atmospheric Conditions | 20-1 | ||
| 20.1.2 | Terrestrial Environment | 20-2 | ||
| 20.1.3 | Aquatic Environment | 20-4 | ||
| 20.1.4 | Socioeconomic | 20-4 | ||
| 20.1.5 | Heritage | 20-5 | ||
| 20.2 | Environmental Considerations | 20-5 | ||
| 20.2.1 | Air Quality | 20-5 | ||
| 20.2.2 | Waste Characterization | 20-5 | ||
| 20.2.3 | Environmental Control Plan | 20-6 | ||
| 20.3 | Stockpiles and Waste Rock Storage Facilities | 20-6 | ||
| 20.4 | Tailings Storage Facility | 20-8 | ||
| 20.4.1 | Site Investigation and Characterization | 20-8 | ||
| 20.4.2 | Tailings Characterization | 20-11 | ||
| 20.4.3 | Tailings Storage Facility Design Considerations | 20-12 | ||
| 20.4.4 | Tailings Storage Facility Water Management | 20-15 | ||
| 20.4.5 | Construction and Operations | 20-18 | ||
| 20.4.6 | Future Planning | 20-19 | ||
| 20.5 | Water Management | 20-19 | ||
| 20.6 | Closure Plan | 20-23 | ||
| 20.7 | Permitting | 20-23 | ||
| 20.8 | Considerations of Social and Community Impacts | 20-25 | ||
| 20.9 | Comments on Section 20 | 20-26 | ||
| 21.0 | CAPITAL AND OPERATING COSTS | 21-1 | ||
| 21.1 | Capital Cost Estimates | 21-1 | ||
| 21.1.1 | Basis of Estimate | 21-1 | ||
| 21.1.2 | Mine Capital Costs | 21-1 | ||
| 21.1.3 | Process Capital Costs | 21-1 | ||
| 21.1.4 | Sustaining Capital | 21-1 | ||
| 21.1.5 | Capital Cost Summary | 21-2 | ||
| 21.2 | Operating Cost Estimates | 21-2 | ||
| 21.2.1 | Basis of Estimate | 21-2 | ||
| 21.2.2 | Mine Operating Costs | 21-3 | ||
| 21.2.3 | Process Operating Costs | 21-3 | ||
| 21.2.4 | Operating Cost Summary | 21-6 | ||
| 21.3 | Comments on Section 21 | 21-6 | ||
| 22.0 | ECONOMIC ANALYSIS | 22-1 | ||
| 23.0 | ADJACENT PROPERTIES | 23-1 | ||
| 24.0 | OTHER RELEVANT DATA AND INFORMATION | 24-1 | ||
| 24.1 | Opportunities | 24-1 | ||
| March 2016
Project Number:179678 |
TOC vi | |
|
Salobo Operations Para State, Brazil NI 43-101 Technical Report |
| 24.1.1 | Exploration | 24-1 | ||
| 24.1.2 | Mining | 24-1 | ||
| 24.1.3 | Process | 24-1 | ||
| 24.1.4 | Economic Analysis | 24-1 | ||
| 24.2 | Risks | 24-2 | ||
| 24.2.1 | Mining | 24-2 | ||
| 24.2.2 | Process | 24-2 | ||
| 24.2.3 | Water Treatment and Tailings | 24-2 | ||
| 24.2.4 | Legislation | 24-2 | ||
| 25.0 | INTERPRETATION AND CONCLUSIONS | 25-1 | ||
| 25.1 | Mineral Tenure, Surface Rights, Royalties and Agreements | 25-1 | ||
| 25.2 | Geology and Mineralization | 25-1 | ||
| 25.3 | Exploration, Drilling and Analytical Data Collection in Support of Mineral Resource Estimation | 25-1 | ||
| 25.4 | Metallurgical Testwork | 25-2 | ||
| 25.5 | Mineral Resource Estimates | 25-3 | ||
| 25.6 | Mineral Reserve Estimates | 25-3 | ||
| 25.7 | Mining Plan | 25-4 | ||
| 25.8 | Recovery Plan | 25-4 | ||
| 25.9 | Infrastructure | 25-5 | ||
| 25.10 | Environmental, Permitting and Social Considerations | 25-5 | ||
| 25.11 | Markets and Contracts | 25-7 | ||
| 25.12 | Capital Cost Estimates | 25-7 | ||
| 25.13 | Operating Cost Estimates | 25-7 | ||
| 25.14 | Economic Analysis | 25-8 | ||
| 25.15 | Risks and Opportunities | 25-8 | ||
| 26.0 | RECOMMENDATIONS | 26-1 | ||
| 27.0 | REFERENCES | 27-1 | ||
| T A B L E S | ||
| Table 1-1: | Salobo Measured and Indicated Mineral Resources | 1-9 |
| Table 1-2: | Salobo Inferred Mineral Resources | 1-9 |
| Table 1-3: | Mineral Reserves Estimate | 1-12 |
| Table 6-1: | Salobo Production History (2012 to April 2015) | 6-3 |
| Table 7-1: | Project Stratigraphy | 7-6 |
| Table 9-1: | Exploration Summary 1978–2003 | 9-2 |
| Table 10-1: | Drill Hole Summary Table | 10-2 |
| Table 11-1: | Specific Gravity Determinations | 11-4 |
| Table 11-2: | Summary of Primary Laboratories Used for Assaying During Exploration Phase and Main Analysis Methods | 11-4 |
| Table 11-3: | Analytical Package used for Blast-Hole Samples | 11-8 |
| Table 11-4: | Adjustment for Copper Assays for pre-2002 Drilling Programs | 11-12 |
| Table 11-5: | Adjustment for Gold Assays for pre-2002 Drilling Programs | 11-12 |
| March 2016
Project Number:179678 |
TOC vii | |
|
Salobo Operations Para State, Brazil NI 43-101 Technical Report |
| Table 14-1: | Estimation Domains (Sulphide) | 14-6 |
| Table 14-2: | Composite Sharing During Estimation | 14-8 |
| Table 14-3: | Summary of Copper Variogram Parameters | 14-8 |
| Table 14-4: | Block Model Framework | 14-9 |
| Table 14-5: | Summary of the Block Grade Estimation Plan for Copper, Salobo | 14-11 |
| Table 14-6: | Global Bias Check | 14-14 |
| Table 14-7: | Salobo Long Term to Short Term Feed Ore Reconciliation (January 2014 to June 2015) | 14-16 |
| Table 14-8: | Salobo Mineral Resource Open Pit Optimization Technical and Economic Parameters Summary | 14-20 |
| Table 14-9: | Salobo Mineral Resource 0.286% CuEq Cutoff Grade Optimization Technical and Economic Parameters Summary | 14-20 |
| Table 14-10: | Salobo Measured and Indicated Mineral Resources | 14-22 |
| Table 14-11: | Salobo Inferred Mineral Resources | 14-22 |
| Table 15-1: | Mineral Reserves Estimate | 15-3 |
| Table 15-2: | Pit Optimization Parameters | 15-5 |
| Table 15-3: | Geotechnical Design Sectors | 15-8 |
| Table 15-4: | Mining Cost Assumptions | 15-10 |
| Table 15-5: | Mine Design Criteria | 15-16 |
| Table 15-6: | Production by Pit Phase | 15-17 |
| Table 16-1: | Mine Scheduling Capacity | 16-5 |
| Table 16-2: | LOMP Schedule | 16-6 |
| Table 16-3: | Low Grade Stockpile to Plant Schedule | 16-8 |
| Table 16-4: | Mine Fleet Requirements | 16-10 |
| Table 17-1: | Major Process Equipment | 17-7 |
| Table 19-1: | Commodity Price Projections | 19-3 |
| Table 19-2: | Exchange Rate Projections | 19-3 |
| Table 20-1: | Stockpile and Waste Rock Facility Design Parameters | 20-7 |
| Table 20-2: | Tailings Storage Facility Key Design Parameters | 20-9 |
| Table 20-3: | Tailings Characteristics | 20-12 |
| Table 20-4: | Salobo TSF Instrumentation | 20-20 |
| Table 20-5: | Salobo TSF Proposed Embankment Lifts | 20-20 |
| Table 20-6: | Water Capture Dam Key Design Criteria | 20-21 |
| Table 20-7: | Key Federal Environmental Permits | 20-25 |
| Table 21-1: | Sustaining Capital ($US M) | 21-3 |
| Table 21-2: | Sustaining Capital – Process ($US M) | 21-3 |
| Table 21-3: | Plant Operating Costs per Compilation in SAP – Q4 2014 | 21-5 |
| Table 21-4: | Projected Process Plant Operating Costs | 21-6 |
| Table 21-5: | Comparison of Historical and Adjusted Projected Processing Costs | 21-6 |
| F I G U R E S | ||
| Figure 1-1: | Life-of-Mine Mine Schedule | 1-11 |
| Figure 2-1: | Location Plan | 2-2 |
| Figure 2-2: | Longitudinal Section Showing Mineral Resources and Mineral Reserves | 2-3 |
| Figure 4-1: | Mineral Tenure Layout Plan | 4-7 |
| March 2016
Project Number:179678 |
TOC viii | |
|
Salobo Operations Para State, Brazil NI 43-101 Technical Report |
| Figure 5-1: | General Access Plan showing Locations of Key Regional Infrastructure | 5-2 |
| Figure 7-1: | Simplified Geology Map of the South American Platform (A), showing Location of the Carajás Province (B) | 7-2 |
| Figure 7-2: | Simplified Regional Geology of the Carajás Province Showing Major Deposits | 7-3 |
| Figure 7-3: | Tectonic Setting of the Carajás Region | 7-5 |
| Figure 7-4: | Major Lithological Units of the Salobo Deposit | 7-5 |
| Figure 7-5: | Copper Mineralization Styles at Salobo | 7-9 |
| Figure 7-6: | Oxide-Copper Mineralization Filling Fractures at the Transition Zone | 7-12 |
| Figure 7-7: | Mineralized Bodies after the 1997–1998 Geological Modeling | 7-12 |
| Figure 7-8: | Lithology Model showing Main Mineralized Units (BDX, XMT and DGRX) in Plan View -150 m | 7-13 |
| Figure 7-9: | Lithology Model showing Main Mineralized Units (BDX, XMT and DGRX) in Plan View -450 m | 7-14 |
| Figure 7-10: | Lithology Model showing Main Mineralized Units (BDX, XMT, and DGRX) in Cross- Section 750SE | 7-15 |
| Figure 7-11: | Lithology Model showing Main Mineralized Units (BDX, XMT, and DGRX) in Cross- Section 1450SE | 7-16 |
| Figure 7-12: | Lithology Model Codes and Colour Codes for Figure 7-8 to Figure 7-11 | 7-17 |
| Figure 8-1: | Cartoon Schematic, IOCG Deposit | 8-3 |
| Figure 9-1: | Ternary Radiometric Map | 9-4 |
| Figure 9-2: | Analytical Signal Map | 9-5 |
| Figure 9-3: | Chargeability Map | 9-6 |
| Figure 9-4: | TEM Resistivity Pseudo-Section along Line 1300 E | 9-8 |
| Figure 9-5: | Coincident Magnetic and Gravimetric Anomalies | 9-9 |
| Figure 9-6: | 3D Gravity Inversion with Current >0.5% Cu Block Model Outline | 9-10 |
| Figure 10-1: | Geological Drill-Hole Location Plan by Campaigns | 10-3 |
| Figure 10-2: | Geotechnical Drill-Hole Location Plan (1997 and 2002–2003 campaigns) | 10-6 |
| Figure 11-1: | Blast-Hole Sampling Pattern | 11-2 |
| Figure 11-2: | Blasthole Sampling at Salobo | 11-2 |
| Figure 11-3: | Sampling Flow Sheet | 11-6 |
| Figure 11-4: | Assay Room at the Salobo Laboratory | 11-8 |
| Figure 11-5: | Mettler-Toledo Ion-Selective Electrode Instrument for F Analysis | 11-9 |
| Figure 11-6: | Drill Core Storage | 11-13 |
| Figure 13-1: | Copper Recoveries in 2003–2004 Variability Testwork | 13-3 |
| Figure 13-2: | Gold Recoveries from Variability and LCT Testwork Programs | 13-3 |
| Figure 13-3: | Derivation of Copper Recovery Projection, 2003–2004 Variability Testwork | 13-4 |
| Figure 13-4: | Derivation of Gold Recovery Projection from Variability Testwork | 13-4 |
| Figure 13-5: | Testwork with Mixed Ore – Effect of Dispersant and Collector Dosage | 13-7 |
| Figure 13-6: | Expected Metallurgy of Various Sulphide-Mixed Ore Blends | 13-7 |
| Figure 13-7: | Test Results with Fresh and Mixed Ores with Modified Reagent Scheme | 13-9 |
| Figure 13-8: | Actual versus Projected Monthly Plant Copper Recovery | 13-9 |
| Figure 13-9: | Actual versus Projected Monthly Plant Gold Recovery | 13-10 |
| Figure 13-10: | Evolution of Fluorine Content in Cu Concentrate | 13-12 |
| Figure 13-11: | Evolution of Chlorine Content in Cu Concentrate | 13-12 |
| Figure 13-12: | Historical Plant Performance – Cu Recovery | 13-14 |
| Figure 13-13: | Historical Plant Performance – Au Recovery | 13-14 |
| March 2016
Project Number:179678 |
TOC ix | |
|
Salobo Operations Para State, Brazil NI 43-101 Technical Report |
| Figure 13-14: | Historical Plant Performance – Ag Recovery | 13-15 |
| Figure 13-15: | Historical Plant Performance – Concentrate Cu Grade | 13-15 |
| Figure 13-16: | Salobo I Plant Historical Availability and Operational Utilization | 13-17 |
| Figure 13-17: | Salobo II Plant Historical Availability and Operated Utilization | 13-18 |
| Figure 13-18: | Number of Unplanned Feed Interruptions to Grinding Lines | 13-20 |
| Figure 13-19: | Average Duration of Feed Interruptions to Grinding Lines | 13-20 |
| Figure 13-20: | Histogram of Daily Plant Throughput –2015 (Salobo I and II) | 13-21 |
| Figure 14-1: | Salobo Deposit Sectors | 14-3 |
| Figure 14-2: | Lithology Model – Section 950SE (looking west) | 14-4 |
| Figure 14-3: | Cu Grade Shell Model – Section 950SE (looking west) | 14-5 |
| Figure 14-4: | `Low Grade to High Grade Shell Cu and Au Contact Plots | 14-8 |
| Figure 14-5: | Copper Composites and Copper Block Grades in Plan View at 120 Elevation | 14-12 |
| Figure 14-6: | Copper composites and Copper Block Grades in Section at 1700SE (looking west) | 14-13 |
| Figure 14-7: | Copper Swath Plots for Sector 1 Low (1103) and High (1203) Grade Domains | 14-14 |
| Figure 14-8: | Mineral Resource Classification in Plan View at 0 Elevation | 14-17 |
| Figure 14-9: | Mineral Resource Classification in Section at 1200SE (looking northwest) | 14-18 |
| Figure 15-1: | Life of Mine Planning Sequence | 15-2 |
| Figure 15-2: | Sensitivity to Pit Optimization Input Variables | 15-4 |
| Figure 15-3: | Plan View of Geotechnical Design Sectors | 15-9 |
| Figure 15-4: | Basic Reconciliation Flow | 15-11 |
| Figure 15-5: | Detailed Reconciliation Scheme | 15-11 |
| Figure 15-6: | Pit by Pit Graph | 15-13 |
| Figure 15-7: | Location and Sections Final Pit and Condemnation/Resource Pit Limit | 15-14 |
| Figure 15-8: | Salobo Mining Expansion Phases | 15-16 |
| Figure 16-1: | Open Pit Wall, June, 2015 (looking northwest) | 16-3 |
| Figure 16-2: | Mining per Phase per Year | 16-5 |
| Figure 16-3: | Life-of-Mine Mine Schedule | 16-7 |
| Figure 17-1: | Simplified Process Flowsheet | 17-3 |
| Figure 18-1: | General Infrastructure Layout Plan | 18-2 |
| Figure 20-1: | Mine Location in Relation to Forest Reserves | 20-3 |
| Figure 20-2: | Salobo Tailings Storage Facility Final Footprint | 20-10 |
| Figure 20-3: | Volume and Area versus Elevation Curves | 20-14 |
| Figure 20-4: | Layout of Tailings Transport and Deposition Points | 20-14 |
| Figure 20-5: | Photograph Looking South from Dam Crest Displaying Spillway Chute, Downstream Face of the TSF Embankment and Geotechnical Drill Rig at the Toe | 20-16 |
| Figure 20-6: | Photograph from Dam Crest Looking North Displaying Water Reclaim Pumps | 20-17 |
| Figure 20-7: | Salobo TSF Water Balance Schematic | 20-17 |
| Figure 20-8: | Simplified Schematic of Mine Components and Water Flows at Salobo | 20-21 |
| Figure 20-9: | Water Capture Dam Volume/Area v Elevation Curve | 20-22 |
| Figure 20-10 | Water Capture Dam and Spillway General Layout Plan | 20-22 |
| March 2016
Project Number:179678 |
TOC x | |
|
Salobo Operations Para State, Brazil NI 43-101 Technical Report |
| 1.0 |
SUMMARY |
| 1.1 |
Introduction |
Silver Wheaton Corp. (Silver Wheaton) requested that Amec Foster Wheeler Americas Limited (Amec Foster Wheeler) prepare an independent technical report (the Report) in compliance with the requirements of National Instrument 43-101 Standards of Disclosure for Mineral Projects (NI 43-101) and Form 43–101F1 Technical Report on the Salobo open pit mining operations (Salobo Operations or the Project), located in northern Brazil, in the southeastern portion of Pará State.
The Salobo Operations comprise the Salobo open pit copper–gold mine (Salobo Mine).
| 1.2 |
Terms of Reference |
The corporate entity that conducts the mining operations is Salobo Metais SA (SMSA), an indirectly wholly-owned subsidiary of Vale SA. For the purposes of this Report, unless otherwise noted, Vale SA and Salobo Metais SA will be referred to interchangeably as Vale.
Silver Wheaton’s interest in the Salobo Operations is restricted to a metal streaming agreement that applies to 50% of the gold produced as a byproduct at the Salobo Mine for the life of the mine (the streaming agreement).
The Report was prepared to support Silver Wheaton’s scientific and technical disclosure on the Salobo Operations in their Annual Information Form for the year ending 31 December, 2015.
Mineral Resources and Mineral Reserves are reported with reference to the Canadian Institute of Mining, Metallurgy and Petroleum (CIM) Definition Standards for Mineral Resources and Mineral Reserves (May 2014; the 2014 CIM Definition Standards) and the CIM Estimation of Mineral Resources and Mineral Reserves
| 1.3 |
Project Setting |
The Salobo Operations are located approximately 90 km northwest of Carajás. An all-weather road network connects the mine site to the cities of Parauapebas (90 km), Marabá (240 km), and the commercial airport at Carajás. Railroads link Parauapebas with the port city of São Luis.
The Project is located in the Carajás mountain range in the eastern Amazon humid tropical rainforest. Temperatures range from 20.8°C to 37.8°C with an average relative humidity of 80.5% . Mean annual rainfall is 1,920 mm and evaporation is 1,500 mm. Winds are predominantly from the north and west. Mining operations are conducted year-round.
| March 2016
Project Number:179678 |
Page 1-1 | |
|
Salobo Operations Para State, Brazil NI 43-101 Technical Report |
| 1.4 |
Mineral Tenure, Surface Rights, Royalties and Agreements |
The Salobo Operations are owned by Vale SA.
The Salobo Operations consists of one mine, the Salobo Mine, which is located within one claim, Exploration Permit No. 1121, which was granted on 14 July, 1987 and encompasses 9,180.61 ha.
Brazilian legislation separates surface ownership from sub-surface ownership. A mining company can operate a mine even if does not own the surface; however, in this case a royalty has to be paid to the surface owner. The royalty is calculated as 50% of the Compensation for the Exploitation of Mineral Resources (Compensação Financeira pela Exploração de Recursos Minerais or CFEM) and is paid to the government. Silver Wheaton Corp (Silver Wheaton) has acquired 50% of the gold produced as a byproduct at the Salobo Mine for the life of the mine (the streaming agreement). Silver Wheaton will make ongoing payments of the lesser of US$400 (subject to a 1% annual inflation adjustment commencing in 2017) and the prevailing market price for each ounce of gold delivered under the streaming agreement.
There are no other property agreements relevant to the Salobo Operations.
| 1.5 |
Geology and Mineralization |
The deposit is considered to be an example of an iron oxide–copper–gold (IOCG) deposit. Global examples include Olympic Dam in Australia, Candelaria–Punta del Cobre in Chile, and Sossego in Brazil.
The Salobo deposit is hosted in the Carajás Mining District within Carajás Province, a sigmoidal-shaped, west–northwest–east–southeast-trending late Archean basin.
The Archean basin contains a basement assemblage that is dominated by granite–tonalitic ortho-gneisses of the Pium Complex, and amphibolite, gneisses and migmatites of the Xingu Complex. The basement rocks are overlain by volcanic and sedimentary rocks of the Itacaiúnas Supergroup, which includes the Igarapé Salobo Group, the Igarapé Pojuca Group, Grão Pará Group and the Igarapé Bahia Group. The Itacaiúnas Supergroup hosts all the Carajás IOCG deposits, including Salobo. Mineralization at the Salobo deposit is hosted by upper-greenschist-to-lower-amphibolite-metamorphosed rocks of the Igarapé Salobo Group. The major host units are biotite and magnetite schists. The Salobo hydrothermal system has a core of massive magnetite that is surrounded by less intensely altered rocks. Away from the massive magnetite, the magnetite content gradually diminishes, giving way to biotite–garnet schist and/or garnet–grunerite schist.
| March 2016
Project Number:179678 |
Page 1-2 | |
|
Salobo Operations Para State, Brazil NI 43-101 Technical Report |
The deposit extends over an area of approximately 4 km along strike (west–northwest), is 100–600 m wide, and has been recognized to depths of 750 m below the surface. The Salobo mineralization is limited in strike extent, but remains open at depth below the current design pit.
Sulphide mineralization typically consists of assemblages of magnetite–chalcopyrite–bornite and magnetite–bornite–chalcocite. Accessory minerals include hematite, molybdenite, ilmenite, uraninite, graphite, digenite, covellite, and sulphosalts.
| 1.6 |
History |
Copper mineralization was discovered by a Vale predecessor company in the Igarapé Salobo region in 1974. Detailed exploration commenced in 1977. Initial exploration efforts included stream sediment sampling, reconnaissance exploration, and ground induced polarization (IP) and magnetometer geophysical surveys. Follow-up work in 1978 identified the presence of copper sulphides in an outcrop of magnetite schists at Salobo. Subsequent work has included geological mapping, additional geophysical surveys, core drilling, exploration adits, Mineral Resource estimation, and metallurgical testwork.
A scoping study was completed in 1981, and pilot studies ran from 1985 to 1987, culminating in the grant of a mining concession. A prefeasibility study was concluded in 1988, an initial feasibility study was conducted in 1998, updates to the feasibility study were undertaken in 2001 and 2002, and a final study was completed in 2004.
The Salobo Mine commenced pre-stripping in 2009. Project ramp-up for Phase I of the Salobo Operations was completed three years later and the first concentrate was shipped in September 2012. In December 2013, the plant processed 898,000 t of ore, which represented 90% of the Phase I nameplate capacity (1 Mt run-of-mine (ROM) per month). Phase II, intended to double the nameplate capacity, was completed in 2014.
| 1.7 |
Drilling and Sampling |
Core drilling commenced in 1978 and was conducted through to 2003 in five different drilling campaigns, for a total of 416 holes (146,674 m) completed for exploration purposes, and an additional 14 drill holes (7,590 m) for geotechnical purposes. Most drill holes were vertical or oriented to the south–southwest, the latter with dips usually ranging from 60° to 70°. However, one campaign included holes with a north–northwest orientation and similar dips. Various holes were also drilled from an adit. No core drilling has occurred since 2003. Blastholes have been drilled since 2009; however, are only used for short-term mine planning purposes.
The drill core was collected, placed in boxes, and delivered by the drilling contractor to the core logging/storage area, where geological and geotechnical logging was carried out. Geologists recorded the major code for lithology, alteration, mineralization, and
| March 2016
Project Number:179678 |
Page 1-3 | |
|
Salobo Operations Para State, Brazil NI 43-101 Technical Report |
textural characteristic of each 1 m interval, with 10 cm as the definition unit. Geological contacts were logged with higher precision.
Drill collar coordinates were recorded. Collar verification was completed by plotting drill hole locations on plan and in cross-section and comparing with the topographic surface. Current collar surveying of grade-control holes is conducted by company surveyors using high-precision, differential global positioning system (GPS) equipment. Downhole surveys were performed at 3 m intervals downhole, using Reflex DDI (dip and direction pointer), Maxibor Reflex, and gyroscopic instruments.
Due to the subvertical orientation of the mineralized zones, the drill holes intersected them at low angles. As a result the mineralized thickness observed in drill holes does not correspond to the true thickness, which should be determined on a case-by-case basis. The true thickness is significantly smaller than the intersected thickness in most cases.
The quantity and quality of the lithological, geotechnical, collar and downhole survey data collected in the exploration and infill drill programs during the 1997 and later campaigns are sufficient to support Mineral Resource and Mineral Reserve estimation.
Exploration core sample intervals averaged 1 m in mineralized zones, and between 2 m and 4 m in barren zones. One half was bagged and submitted to the mine laboratory for analysis, and the remaining half was retained as backup in the same original boxes.
Blastholes are currently drilled on a 5 m x 5 m (or 5 m x 7 m) grid and are channel sampled. All blastholes located in ore zones are sampled; however, as the blasthole reaches the barren zones, the proportion of sampled holes decreases to include only those holes in the mineralized envelope.
The density determination methodology consisted of the water-displacement method. Specific gravity (SG) was measured on approximately 79,000 samples collected across the entire deposit.
A number of laboratories were used during the core drilling exploration and delineation phases. Copper analysis has consisted of assay of 0.5 g aliquots by multi-acid digestion and atomic absorption spectroscopy (AAS) at Docegeo, the Mineração Morro Velho (MMV) laboratory, and Lakefield Geosol. Gold was assayed by aqua regia leaching, with solvent extraction (MIBX) and AAS determination at Docegeo. MMV used the fire-assay (FA) method with gravimetric finish on 100 g aliquots (0.05 g/t Au detection limit). Lakefield Geosol used FA with AAS finish on 20 g aliquots. Other elements that were regularly analysed for have included carbon, sulphur, silver and fluorine. In the early stages of the exploration program platinum, palladium, nickel, molybdenum and uranium were also analyzed, however, these elements were later excluded from the analytical package.
| March 2016
Project Number:179678 |
Page 1-4 | |
|
Salobo Operations Para State, Brazil NI 43-101 Technical Report |
Blast-hole samples are prepared and assayed at the Salobo laboratory for copper, gold, iron and sulphur.
The quality control (QC) program implemented at the Salobo Operations varied considerably over time, depending on the primary analytical laboratory used for assaying. Initially, Salobo assigned the responsibility on the insertion of QC samples (standards, blanks and duplicates) to the laboratory. Due to the lack of appropriate QC results for the drilling campaigns prior to 2002, a re-assay campaign was initiated to validate the available analytical data. A total of 51,768 of the original 75,577 samples drilled prior to 2002 were re-assayed to corroborate the original results, and included pulp and coarse reject material whenever possible. Vale concluded that the external assay check review revealed bias for copper and gold assay results, and applied a correction factor to these values.
A total of 1,500 samples from the 2002–2003 drilling program were selected for re-assaying (lote especial) in order to validate the 2002–2003 assay data. Amec Foster Wheeler reviewed the lote especial QC data reported by CVRD (2003), and concluded that copper and gold check assays did not reveal significant biases, and that precision was within acceptable limits. Blanks did not show significant contamination during preparation.
A QC program has been implemented to monitor blast-hole sampling quality. This program includes the insertion of 5% twin samples, 5% field duplicates (Jones splits of the same original sample that are assayed separately) and 5% reference materials (RMs).
| 1.8 |
Data Verification |
Data verification was undertaken on the data collected at the time as part of third-party prepared prefeasibility and feasibility studies: Bechtel, 1988 (prefeasibility study); MRDI, 1997 (updated prefeasibility study); Minorca, 1998 (feasibility study); Aker Kvaerner, 2001 (updated feasibility study); and Fluor JPS, 2004 (final feasibility study). Vale also commissioned a number of third-party consultants to perform independent audits in support of Mineral Resource and Mineral Reserve estimates as follows: MRDI/AMEC, 1997, 2002, 2004; Pincock, Allen and Holt, 2007 and 2008; Snowden, 2009; and Golder Associates, 2010. Micon Consultants completed review of Mineral Resources and Mineral Reserves in support of a technical report filing n the Salobo Operations for Silver Wheaton in 2013.
In addition, Vale has regularly used various internal procedures to verify data quality.
| March 2016
Project Number:179678 |
Page 1-5 | |
|
Salobo Operations Para State, Brazil NI 43-101 Technical Report |
| 1.9 |
Metallurgical Testwork |
Five distinct phases of testwork have been completed and include CVRD (a predecessor company to Vale, from 1978–1981); CVRD and Anglo American (1986–1987); Salobo Metais S.A. (1993–1998; another Vale predecessor company); CVRD Research Centre (2003–2004 and 2005–2006). Work relevant to current operations included rougher flotation tests, locked cycle tests, modifications to reagent schemes, development of equations for predicting Cu and Au recoveries, evaluations of alternatives to standard semi-autogenous grind (SAG) milling, and assessments of blending requirements for the mixed ore stockpile and transition ore.
Recovery equations are currently used to project copper and gold recoveries in the Mineral Reserve estimate, cutoff grade calculations, and the life-of-mine financial model. These are underlying a fixed target copper grade in concentrate of 38% Cu. Within the 0.6 –1.5% Cu range of the data points retained for a regression analysis, the resulting equations are fairly insensitive to the actual feed grade encountered Some variability in the metallurgical results can be expected as the mixture of lithologies found in the plant feed change. Over monthly periods, the resulting blend is more likely to approach the Mineral Reserves profile and thus mitigate the variability that may be detected on a daily basis, versus projections.
Introduction of mixed material above a proportion of 30% of plant feed has been shown to lead to a degradation of the flotation results. Proper blending of such material, albeit representing only 1% of the Mineral Reserves, will be required.
There are three deleterious elements of potential concern in the copper concentrate, namely fluorine, chlorine and uranium. Of these, fluorine is the most significant. In general, smelters will tend to reject concentrates with high fluorine content due to problems in the smelter’s sulphuric acid plants. Vale has secured contracts with four smelters able to accept the copper concentrate, with an average fluorine content of about 2,000 ppm, and a maximum content of 4,000 ppm. Penalties are charged though starting below the actual content. Vale advised that, since concentrate lots are segregated by grade (lower, medium and high grades) at the Parauapebas transfer shed, blending of out-of-specification concentrate is possible, should it ever be necessary. Therefore, with the potential blending strategy and the securing of contracts with four smelters which accept concentrates with fluorine content of up to 4,000 ppm, the risk of concentrate rejection is significantly reduced. These smelters also placed the maximum acceptable chlorine content at 1,200 ppm but with a penalty drawn at the 550–650 ppm content seen in 2015 shipments. Uranium in the partial set of shipment assays reviewed indicated levels below the rejection threshold of 50 ppm, with values generally in the 25–35 ppm range. No penalties are drawn below the rejection level.
| March 2016
Project Number:179678 |
Page 1-6 | |
|
Salobo Operations Para State, Brazil NI 43-101 Technical Report |
The targeted operated throughput, set at 3,146 t/h in 2015 and 3,171 t/h thereafter, has been achieved on a daily basis. Reducing the frequency of feed interruptions should help in meeting the monthly throughput targets. The plant operational utilization is meeting expectations, whereas downward pressure on the actual utilization is brought mostly by the availability, which has been below expectations since inception of the operations. Realized modifications and upgrades throughout 2015, especially to some of the material handling equipment, have reduced the number of feed interruptions and unscheduled downtime events. The targeted long-term process plant availability of 88.9% for 2020 may still prove difficult to reach, given the lack of stand-by crushing and screening equipment in the tertiary crushing circuit as well as the reliance upon multiple single-line conveyors.
| 1.10 |
Mineral Resource Estimation |
The Mineral Resource estimate was prepared by Vale. Three-dimensional solid models of the lithology and copper grade shells were constructed using commercially-available Geovia software. The construction date of the resource model is 11 March, 2013. Compositing, exploratory data analysis including variography, interpolation, statistical validation and classification were done using Isatis. Visual validation was performed in Geovia.
The estimated elements are total copper, gold, silver, fluorine, carbon, molybdenum, sulphur, uranium and density. Grade capping was done by shell (high-grade or low-grade) and sector in two steps: top-cut of the original assay values; and high yield restriction on the composites during estimation.
The copper, gold, and density block grade values were interpolated within the grade shells using an ordinary kriging (OK) estimator. Outside the grade shells (waste), blocks were assigned zero copper and gold grades, and the mean bulk density of the corresponding lithology. Silver, fluorine, carbon, molybdenum, sulphur and uranium were also interpolated using an OK estimator.
The Mineral Resource is classified in accordance with the 2014 CIM Definition Standards. In addition to criteria such as sufficient geological continuity, grade continuity, and data integrity, Vale recommends the following benchmark criteria for resource classification:
| • |
Inferred Mineral Resource: a level of confidence of ±15% on the global recoverable metal content, tonnes, and grades | |
|
| ||
| • |
Indicated Mineral Resource: a level of confidence of ±15% on the recoverable metal content, tonnes, and grades over an area or volume corresponding to the footprint of one year of production for a given deposit type in a mine or project |
| March 2016
Project Number:179678 |
Page 1-7 | |
|
Salobo Operations Para State, Brazil NI 43-101 Technical Report |
| • |
Measured Mineral Resource: a level of confidence of ±15% on the recoverable metal content, tonnes, and grades over an area or volume corresponding to the footprint of one quarter of one year of production for a given deposit type in a mine or project. |
Classification was based on the estimation passes used for kriging, followed by some smoothing to reduce classification discontinuities.
Mineral Resources represent sulphide mineralization that is adjacent to the current Mineral Reserve pit plus Inferred Mineral Resources within the Mineral Reserve pit. There are no oxide Mineral Resources. Considerations of reasonable prospects of eventual economic extraction include metal prices; determination of the reasonableness of Mineral Resource pit extents, such as impact on planned mine infrastructure; cutoff grades; preparation of a provisional extension of the life-of-mine (LOM) production schedule to include material above this cutoff grade and demonstration of whether a positive cash flow can be generated; no external dilution or mining losses are included.
| 1.11 |
Mineral Resource Statement |
Mineral Resources considered amenable to open pit mining methods, which are reported exclusive of the Mineral Resources converted to Mineral Reserves, are constrained within a pit shell. Mineral Resources that are not Mineral Reserves do not have demonstrated economic viability. The estimate has an effective date of 31 December 2015. Mineral Resources have been classified using the 2014 CIM Definition Standards.
Estimates were prepared by Mr Joao Dirk V. Reuwsaat, an employee of Vale. Dr Georges Verly, P.Eng., an Amec Foster Wheeler employee, is the Qualified Person (QP) for the estimate. Table 1-2 and Table 1-3 show the estimated sulphide Mineral Resources reported at 0.286% copper equivalent (CuEq) cutoff grade. There are no oxide Mineral Resources.
| March 2016
Project Number:179678 |
Page 1-8 | |
|
Salobo Operations Para State, Brazil NI 43-101 Technical Report |
| Table 1-1: | Salobo Measured and Indicated Mineral Resources |
|
Confidence |
Tonnes | Cu | Au | ||
| Location |
Category |
(Mt) | (%) | (g/t) | |
|
|
|||||
| Adjacent to 2015 LOM |
Measured |
44.1 | 0.83 | 0.48 | |
| Mineral Reserve Pit |
Indicated |
185.0 | 0.72 | 0.37 | |
|
Subtotal Measured |
|||||
|
and Indicated |
229.1 | 0.74 | 0.39 |
| Table 1-2: | Salobo Inferred Mineral Resources |
|
Confidence |
Tonnes | Cu | Au | ||
| Location |
Category |
(Mt) | (%) | (g/t) | |
| Adjacent to 2015 LOM |
|
||||
| Mineral Reserve Pit |
Inferred |
132.7 | 0.6 | 0.3 | |
| Within 2015 LOM |
|
||||
| Mineral Reserve Pit |
Inferred |
16.0 | 0.5 | 0.3 | |
|
Total Inferred |
148.7 | 0.6 | 0.3 |
Notes to accompany Mineral Resource tables:
| 1. |
Mineral Resource estimates were prepared by Mr Joao Dirk V. Reuwsaat, a Vale employee. The Qualified Person for the estimate is Dr Georges Verly, P.Eng., an Amec Foster Wheeler employee. | |
|
| ||
| 2. |
Mineral Resources have an effective date of 31 December 2015. Mineral Resources are reported exclusive of Mineral Reserves. Mineral Resources that are not Mineral Reserves do not have demonstrated economic viability. | |
|
| ||
| 3. |
Mineral Resources were estimated assuming open pit mining methods and are reported at an approximate cutoff grade of 0.286% copper equivalent (CuEq). The CuEq grade incorporates the following: metal prices of US$3.67/lb Cu, US$1,500/oz Au; process recoveries of -2.3/Cu + 90.23% for Cu and 66% for Au; US$0.40/t mill feed to waste mining cost difference; US$11.48/t process cost; selling costs of US$0.669/lb for Cu and US$0.45/oz for Au; US$2.77/t general and administrative (G&A) and other costs; smelter recovery of 96.7% for Cu and 93.94% for Au; transport loss of 0.5%. | |
|
| ||
| 4. |
The pit shell constraining the estimate used the following assumptions: metal prices of US$3.67/lb Cu, US$1,500/oz Au; process percent recoveries of -2.3/Cu +90.23% for Cu and 2.56*Au + 64.9% for Au; US$3.84/t mining cost plus vertical component per bench of US$0.016/t (> 250 m elevation) and US$0.046/t (<250 m elevation); US$11.48/t process cost; selling costs of $US0.696/lb for Cu and $US0.45/oz for Au; US$2.9/t G&A, logistic and other costs; smelter recovery of 96.7% for Cu and 93.94% for Au; and inter-ramp pit slope angles that ranged from 48–52º. | |
|
| ||
| 5. |
No allowances for mining recovery and external dilution have been applied. Contact dilution between grade shells within 15 m x 15 m x 15 m blocks was considered. | |
|
| ||
| 6. |
Tonnage figures are reported as million metric tonnes (Mt); copper grade figures as percent (%) and gold grade figures as grams per tonne (g/t). | |
|
| ||
| 7. |
Tonnages are rounded to the nearest hundred thousand tonnes; grades are rounded to two decimal places for Measured and Indicated Mineral Resources, and one decimal place for Inferred Mineral Resources. | |
|
| ||
| 8. |
Rounding as required by reporting guidelines may result in apparent summation differences. |
| March 2016
Project Number:179678 |
Page 1-9 | |
|
Salobo Operations Para State, Brazil NI 43-101 Technical Report |
Factors which may affect the Mineral Resource estimates include changes to the assumptions in the parameters used in the Whittle pit shell design, changes to cutoff grades and CuEq values used to report the estimates, and any changes to the permitting, social, environmental, and political/legal assumptions.
| 1.12 |
Mineral Reserve Estimation |
Open pit optimization was performed using Whittle Four-XTMv4.4 software. A 5%, zero-grade material dilution factor was included and a 100% material recovery was assumed for pit optimization, to account for selectivity when mining at the contacts of the ore body. A mining cost adjustment factor (MCAF) was applied to account for incremental increases in haulage cost with depth. The size of the selective mining unit (SMU) was established as 15 m x 15 m x 15 m.
In addition to the above, a discount factor of 10% per year was included to account for the time value of money, assuming an annual drop-down rate of maximum five benches. Only Measured and Indicated Mineral Resources were used, all Inferred material is considered as waste in pit optimization and subsequently in the LOM planning.
An overall marginal cutoff grade of 0.253% CuEq was calculated.
After completion of the design, the mining phases were transformed into a yearly production plan with a steady production feed of 24 Mt/a to the mill. A stockpiling strategy is practiced, targeting the higher grades to feed the plant in the first years of operation. Initially only high-grade ore (>0.85% CuEq) will be delivered to the plant while medium-grade (0.60 to 0.85% CuEq) and low-grade (0.253 to 0.60% CuEq) ore will be stockpiled for later plant feed.
The open pit mine life spans approximately 29 years, ending in 2044. However, the process plant will continue operating, processing stockpiled material for another 21 years until 2065 (Figure 1-1).
| 1.13 |
Mineral Reserve Statement |
Mineral Reserve estimates were prepared by Mr Wellington F. de Paula, a Vale employee. Mr Gerrit Vos, P.Eng., an Amec Foster Wheeler employee, is the Qualified Person for the estimate.
Mineral Reserves have been classified using the 2014 CIM Definition Standards and have an effective date of 31 December, 2015.
Table 1-3 shows the estimated sulphide Mineral Reserves reported at a 0.253% CuEq cutoff grade. There are no oxide Mineral Reserves.
The 2014 Mineral Reserves were made current by subtracting the forecast production from the 2015 updated five-year mine plan.
| March 2016
Project Number:179678 |
Page 1-10 | |
|
Salobo Operations Para State, Brazil NI 43-101 Technical Report |

| March 2016
Project Number:179678 |
Page 1-11 |
|
Salobo Operations Para State, Brazil NI 43-101 Technical Report |
| Table 1-3: | Mineral Reserves Estimate |
| Tonnes | Cu | Au | |||
| Area | Classification | (Mt) | (%) | (g/t) | |
| Salobo Pit Phase 2 | 2.7 | 0.69 | 0.34 | ||
| Salobo Pit Phase 3 | 132.2 | 0.77 | 0.44 | ||
| Salobo Pit Phase 4 | 97.1 | 0.73 | 0.39 | ||
| Salobo Pit Phase 5 | Proven | 94.4 | 0.75 | 0.37 | |
| Salobo Pit Phase 6 | 126.0 | 0.65 | 0.40 | ||
| Salobo Pit Phase 7 | 159.1 | 0.72 | 0.36 | ||
| Stockpiles | 42.9 | 0.48 | 0.24 | ||
| Salobo Pit Phase 2 | 0.326 | 0.62 | 0.21 | ||
| Salobo Pit Phase 3 | 24.0 | 0.57 | 0.28 | ||
| Salobo Pit Phase 4 | 53.1 | 0.60 | 0.30 | ||
| Probable | |||||
| Salobo Pit Phase 5 | 45.8 | 0.56 | 0.24 | ||
| Salobo Pit Phase 6 | 170.9 | 0.61 | 0.34 | ||
| Salobo Pit Phase 7 | 208.2 | 0.64 | 0.30 | ||
| Total Proven and Probable | 1,156.8 | 0.67 | 0.35 | ||
Notes to accompany the Mineral Reserve Table
| 1. |
Mineral Reserve estimates were prepared by Mr Wellington F. de Paula, an employee of Vale. The Qualified Person for the estimate is Mr Gerrit Vos, P.Eng.., an Amec Foster Wheeler employee. | |
| 2. |
Mineral Reserves have an effective date of 31 December 2015. | |
| 3. |
Mineral Reserves are reported within the open pit design based on metal prices of $3.45/lb copper, and $1,250/oz gold, with variable recoveries by grade and ore type. A 5% dilution is included, and ore losses are considered to be 0%. Pit inter-ramp slope angles vary from 48–52º. | |
| 4. |
Mineral Reserves that are classified as amenable to direct processing are defined as mineralization above a lower cutoff grade that varies by year between 0.65–1.03% Cu and 0.36–0.64 g/t Au and represents ore that is to be mined and directly processed. | |
| 5. |
Mineral Reserves noted as “stockpiled” material consists of ore tonnage above 0.253% copper equivalent (CuEq) cutoff grade that was mined and stockpiled before being sent to the mill. This stockpiled tonnage includes ore mined before mill start-up, and lower-grade ore mined during pre-production commercial production phases. Stockpiling of low grade material will continue, but this ore will be fed to the plant at the end of the mine life. | |
| 6. |
Mineral Reserves are reported above a marginal cutoff grade of 0.253% CuEq. The CuEq value used for cutoff grades is based on $3.45/lb copper and $1,250/oz gold and based on the equation: CuEq(%) = Cu(%) + Au(g/t) x 0.40677651 / RecCu (%). | |
| 7. |
Tonnage figures are reported as million metric tonnes (Mt); copper grade figures as percent (%) and gold grade figures as grams per tonne (g/t). | |
| 8. |
Tonnages are rounded to the nearest million tonnes; grades are rounded to two decimal places. | |
| 9. |
Rounding as required by reporting guidelines may result in apparent summation differences. |
| March 2016
Project Number:179678 |
Page 1-12 |
|
Salobo Operations Para State, Brazil NI 43-101 Technical Report |
The following factors may affect the Mineral Reserve estimate: copper and gold price fluctuations, the US dollar exchange rate, the Brazilian inflation rate, geotechnical and hydrogeological assumptions, the ability of the mining operation to meet the annual production rate, process plant recoveries and maintenance of deleterious element levels within life-of-mine plan (LOMP) expectations, ability to meet permitting and environmental licence conditions, and maintain these licences, and the ability to maintain the social licence to operate.
| 1.14 |
Mining Methods |
Mining at the Salobo Operations utilizes standard open pit methods with drilling and blasting, loading and hauling, using 15 m benches in rock and 8 m loading benches in saprolites. Electrical cable shovels with 220 t and 327 t trucks are used for bulk mining, hydraulic shovels, and 220 t trucks are used in the saprolites with soft ground conditions and occasionally at pit bottoms to improve selectivity.
In order to improve the ore recovery at the bottom of the pit even further, the last six benches will be developed with 25 m wide, 12% ramps, and mining will be performed with a Cat 374 backhoe with a 4.5 m bucket and 8 x 4 40 t trucks. Although blasting will continue to be in 15 m benches, the mining will take place in 4 m slices.
Production drilling is done using Atlas Copco Pit Viper 351 and BE 49R drills, both with 12½ inch (31.75 cm) drill bits. The drill pattern varies depending on ore or waste. Smaller drills are used for pre-splitting and pit wall control.
A procedure is in place that includes periodic slope inspections for the open pits, waste rock facilities (WRFs), stockpiles, and the tailings storage facility (TSF).
Equipment availabilities, utilizations, productivities and equipment life are based on experience acquired from the nearby Sossego copper mine, where the same type of equipment has already been working under the same circumstances for many years. The considered availability is 85% for shovels and 80% for trucks and drills, while the estimated utilization is 80% for shovels, 78% for haul trucks and 74% for drills.
| 1.15 |
Recovery Methods |
The process flowsheet has evolved through the various study phases of the Project, incorporating the additional knowledge gained from metallurgical testwork and the relative importance of the identified lithologies in the Mineral Resource and Mineral Reserve estimates. High-pressure grind rolls (HPGR) were retained instead of semi-autogenous grind (SAG) mills because of the high magnetite (and copper) content of critical-size pebbles that would have been removed with the magnet protecting the pebble crushers, and therefore requiring additional re-handling (per Vale’s experience at Sossego). In addition, the relatively high ore hardness and its expected variability as different mixtures of ore lithologies are introduced as plant feed, would have caused
| March 2016
Project Number:179678 |
Page 1-13 |
|
Salobo Operations Para State, Brazil NI 43-101 Technical Report |
high-frequency variability in plant throughput in a typical SAG mill–ball mill–pebble crusher (SABC) circuit.
Phase I of the Salobo plant (Salobo I) was designed to process 12 Mt/a of ore, to produce approximately 100 kt of copper-in-concentrate annually. Production commenced in June, 2012. Salobo II started operation in June, 2014 and is basically a mirror-image of Salobo I, i.e. essentially two identical, parallel, production lines. Apart from the inclusion of HPGR for tertiary crushing duty, ahead of ball milling, the circuit is conventional, but with the flotation cleaning circuit making extensive use of flotation columns, to reduce entrainment of fluorine-bearing non-sulphide gangue minerals such as fluorite and biotite.
Concentrate produced at the Salobo Mine is transported 85 km by road to a rail load-out facility near the town of Parauapebas. There it is loaded onto cars for rail transport using the 892 km long Carajás Railroad Extension that links Carajás with the seaport of São Luis, where the sea port terminal is operated by Vale. At the port, there is one ship loading system that is shared by Vale’s Salobo and Sossego Operations.
| 1.16 |
Project Infrastructure |
Surface facilities include: central administrative facilities (administrative offices, restaurant, change rooms, training centre and a medical clinic); central maintenance facilities (a mine heavy equipment workshop including tyre changing facility, a light vehicle maintenance shop, a plant maintenance shop for component overhaul and repair, a warehouse and maintenance offices); mine facilities (mine operations change rooms and mine operations offices); mine heavy equipment fuelling facilities; a small vehicle fueling station main substation; a recycling centre; emergency services building and equipment, and a security/access control gate.
The mine does not have housing facilities, as employees live either in the Carajás urban centre or in Parauapebas.
Low-grade ore and waste rock from the mine are stored in three locations along the perimeter of the pit. The main WRF is to the west of the pit and contains both oxidized and fresh rock. Some higher-grade ore stockpiles with limited capacity are situated close to the crusher, and serve as buffers in case of production disruption in the mine or the crusher. The piles also have a blending function.
Electrical energy is supplied from Tucuruí, a 8,370 MW hydroelectric generating station on the Tocantins River, 200 km north of Marabá, and 250 km due north of Parauapebas. An overhead transmission line (230 kV) from the Carajás iron mine supplies the Salobo Mine.
Water collected from the pit and reclaim water from the tailings impoundment are used in the process plant.
| March 2016
Project Number:179678 |
Page 1-14 |
|
Salobo Operations Para State, Brazil NI 43-101 Technical Report |
Water is collected from Mirim and Salobo Creeks and either treated for use as potable water, used as make-up water for the process plant, reserved for fire suppression, or for other uses around site.
| 1.17 |
Environmental, Permitting and Social Considerations |
| 1.17.1 |
Environmental Considerations |
Baseline environmental studies were completed as part of mine permitting.
The mine site is within the Tapirapé–Aquiri National Forest, the access road crosses the Carajás National Forest, and lies adjacent to the Igarapé Gelado Protected Area. As a requirement of the mine installation licence, an agreement was signed between the Chico Mendes Biodiversity Conservation Institute and Salobo to provide payment and support towards management of the Tapirapé–Aquiri National Forest. Ongoing monitoring is conducted for flora and fauna in the mine’s area of influence. Special monitoring programs are implemented as required in areas where vegetation has to be cleared. Permanent wildlife monitoring sites are set up on the Project access routes.
Waste characterization studies were completed for ore, tailings, laterite, saprolite, transition and fresh rock. Static acid–base (AB) accounting and non-acid generating (NAG) test work concluded that all wastes were non-acid forming.
The Salobo Mine has an Environmental Control Plan that was formulated in 2003, which covers a number of sub-plans that detail best practices and incorporate Brazilian legislation to prevent and mitigate potential impacts and manage compliance. The Salobo Operations are located in a remote area, and there are no other significant sources of air and noise emissions other than those arising from the mining operations.
| 1.17.2 |
Tailings Storage Facility |
The Salobo Mine tailings storage facility (TSF) was constructed in Mirim Creek, close to the confluence with the Salobo Creek, and approximately 650 m from the plant site. The TSF is a cross-valley impoundment comprising a compacted earth and rock-fill embankment with internal drainage and transition zones, and a concrete-lined spillway. Tailings are deposited by gravity. Tailings have a tailings slurry solids content of 33.3%, and an estimated tailings dry density of 1.55 t/m3.
Two dam raises are planned to lift the current embankment crest from its present height to the final elevation.
The final capacity is currently designed at 565 Mm3 and the TSF will cover an area of about 13 km2.
| March 2016
Project Number:179678 |
Page 1-15 |
|
Salobo Operations Para State, Brazil NI 43-101 Technical Report |
| 1.17.3 |
Water Management |
Clean water is diverted around the Salobo Mine, TSF and WRFs where possible. Diversion channels, a 2.6 km tunnel, and dikes were constructed to transfer water from Salobo Creek to Mirim Creek via Mano Creek, and then back to its original watercourse to prevent this water from being affected by the mine.
Sediment control ponds were constructed on the Salobo and Cinzento Creeks to collect fine sediments from site runoff, stockpiles, and the WRFs prior to discharge to downstream waters.
| 1.17.4 |
Closure and Reclamation Planning |
There are no reclamation bonds required for the Salobo Mine. Rehabilitation and re-vegetation work is ongoing during operations. Closure costs have been estimated by Vale at approximately US$173 million, scheduled over a five-year closure period.
The mine Closure Plan assumes that there will be partial recovery of infrastructure for use by educational activities, research and tourism.
| 1.17.5 |
Permitting Considerations |
Although the Project is located in the Tapirapé–Aquiri National Forest, the forest management plan allows for mining, provided that the mining operation meets the required environmental protection objectives.
The Salobo Mine currently holds all required permits to operate. The Salobo Operations have a robust control and monitoring system to ensure that permits remain current, and to ensure that the requirements of each permit are monitored to comply with the relevant regulatory conditions imposed.
| 1.17.6 |
Social Considerations |
The closest municipalities within the socioeconomic area of influence of the Salobo Mine are Marabá, where the mine is located, and Parauapebas, which hosts the Sanção and Paulo Fonteles villages, 45 and 55 km respectively from the mine.
Vale’s stakeholder relations programs have been undertaken in compliance with Vale’s internal standards, and Vale advised Amec Foster Wheeler that the programs are acceptable to the relevant Brazilian authorities.
| 1.18 |
Markets and Contracts |
The market for copper concentrates is well developed with a large number of custom smelters located around the world who use the copper concentrate as feed. Higher levels of fluorine, higher copper grade and other specificities limit some of the processing
| March 2016
Project Number:179678 |
Page 1-16 |
|
Salobo Operations Para State, Brazil NI 43-101 Technical Report |
options for Salobo. However, customers for Salobo concentrate have been well established with deliveries to major smelters and a few blending facilities in Europe and Asia.
Vale has agreements at typical copper concentrate industry benchmark terms for metal payables, treatment charges and refining charges for concentrates produced. Treatment costs and refining costs vary depending on the concentrate type and the destination smelter. For all of Vale’s sales contracts, the risk of the concentrates transfers either at the load port or discharge port according the standard International Commercial Terms (Incoterms); whereas the title to the concentrates transfers either at the load port or discharge port according the standard Incoterms or upon payment.
Vale provided Amec Foster Wheeler with the metal price projections for use in the Report. Vale established the pricing using a consensus approach based on long-term analyst and bank forecasts prepared during 2014 and 2015.
| 1.19 | Capital Cost Estimates |
A total of $1,928 million will be spend over the life-of-mine (LOM), of which $1,673 million is projected between 2016 and 2044, when the mine is in full operation, and $255 million will be incurred from 2045 to 2065, when stockpile low-grade material is being fed to the plant.
A major part of the sustaining capital expenditure is earmarked for replacement of mining equipment.
The Salobo Project expansion (Salobo II, plant expansion for 24 Mt/a) construction was completed in 2014. Only $13.2 million in growth capital (in addition to the sustaining capital) remains to be spent in mining terms; the figure relates to mining equipment to accommodate the additional production; this equipment purchase had been deferred. From the process side, about $15 million of research and development is assigned to growth projects, and include additional costs to complete the Salobo II plant expansion, and completion of internal feasibility and prefeasibility technical studies.
Exploration costs, which are related to the Exploration Department and Strategic Business Development Department, are not considered as a part of the Salobo mining costs.
| 1.20 |
Operating Cost Estimates |
Mining costs over the life-of-mine (LOM) are estimated at an average US$8.30/t of dry ore. Process costs are US$8.14/t dry ore. Additional operating costs include, on a US$ per dry ore tonne basis, US$0.44 for logistics, US$1.30 for general and administrative (G&A) charges, US$0.56 of corporate overhead charges, US$0.49 of labour (AIP) charges and other expenses of US$0.39.
| March 2016
Project Number:179678 |
Page 1-17 |
|
Salobo Operations Para State, Brazil NI 43-101 Technical Report |
| 1.21 |
Economic Analysis |
Silver Wheaton is using the provision for producing issuers, whereby producing issuers may exclude the information required under Item 22 for technical reports on properties currently in production.
Mineral Reserve declaration is supported by a positive cashflow.
| 1.22 |
Risks and Opportunities |
A review of the risks and opportunities for the Salobo Operations noted the following:
| • | Opportunities | ||
| − |
Drilling is required to determine the source of a gravity anomaly at depth under the Salobo open pit; however, if it is Salobo-style mineralization, there is upside potential for possible mine life extensions | ||
| − |
Geometallurgical domaining may also provide additional upside if the plant and stockpile feed can be more consistently controlled. | ||
| − |
Copper and gold recoveries are currently higher than model-predicted. If higher recoveries can be demonstrated and supported, this is likely to provide some economic upside to the Project. | ||
| − |
Review of the operational pit slope angles through geotechnical examination of the pit wall execution and design phases may provide support for steepening of some of the pit walls. | ||
| − |
A sensitivity study should be performed to find out if the 50 m offset for WRFs is sufficient or if a 100 m distance would be a safer distance, in order to avoid sterilizing Mineral Resources in the future | ||
| − |
Silver is estimated in the block model, but is not reported in the economic analysis; however, silver represents a small economic upside potential for the Project | ||
| • | Risks | ||
| − |
The mine plan assumes an advance rate that has not been supported to date in operations. Achieving planned availability, utilization and productivity factors to support the advance rate may be challenging. | ||
| − |
The ore placed on the low-grade stockpile could potentially partly oxidize, which could lead to a reduction of the planned recoveries. | ||
| − |
The targeted long-term availability of 88.9% for 2020 may yet prove difficult to reach, given the lack of stand-by crushing and screening equipment in the tertiary crushing circuit as well as the reliance upon multiple single-line conveyors | ||
| March 2016
Project Number:179678 |
Page 1-18 |
|
Salobo Operations Para State, Brazil NI 43-101 Technical Report |
| − |
The processing facilities have a series of critical items that are not duplicated, the failure of which can curtail the complete plant operations if the failure is located after the plant stockpile where no more significant surge capacity exists. A total of 12 conveyors, including two with shuttle heads, are forming a critical path after the last available stockpile. This presents a risk for interruptions in plant operation | |
| − |
Proposed process cost reductions will partly rely on making personnel cutbacks once the plant commissioning phase is completed, and also rely on achieving the throughput ramp-up implied in the budget | |
| − |
The metallurgical recovery equations may be sufficient for predicting results over longer-term periods (e.g. yearly, maybe monthly), but may not be adequate for applying a daily target to the plant operations since variations in the lithological make-up of the plant feed over such a short period may have called for different target recoveries than indicated by the equations | |
| − |
Suspended particulate matter in water from the tailings dam is currently not meeting discharge limits. Studies are underway to better determine tailings mineralogy and to understand the chemical behaviors. Continued over-limits in tailings waters are likely to result in regulatory action | |
| − |
The long-term metal prices supporting the Mineral Resources, Mineral Reserves, and economic analysis in this Report are higher than the current market prices. If the assumed long-term metal prices are not realized, this could have a negative impact on the operation’s financial outcome. At the same time, higher than predicted metal prices could have a positive impact. | |
| − |
A decline in exchange rate below 3.5 R$/US$ could have a negative impact on the financial results | |
| − |
Some Brazilian legislative changes may have impacts on the operations as envisaged, including survey requirements for karstiform landforms, changes to the regulatory oversight for vegetation clearance permits |
| 1.23 |
Interpretation and Conclusions |
Under the assumptions in this Report, the Salobo Operations show a positive cash flow over the life-of-mine and support Mineral Reserves. The mine plan is achievable under the set of assumptions and parameters presented.
| 1.24 |
Recommendations |
The Salobo Operations are a producing mine where material exploration activities and engineering studies have largely concluded.
| March 2016
Project Number:179678 |
Page 1-19 |
|
Salobo Operations Para State, Brazil NI 43-101 Technical Report |
Silver Wheaton holds a royalty streaming interest in the Salobo Operations and has no day-to-day involvement in mining or management decisions for the operations. However, any upside potential for the Project also has upside potential for Silver Wheaton’s streaming agreement.
The QPs have recommended a single work phase to assess a gravity geophysical target. An initial reconnaissance drill program is suggested to test the gravity anomaly at depth. This initial testing should consist of two to three drill holes, each approximately 2,500 m long. Assuming all-in drilling and assaying costs of US$250/m, and including corporate overhead allocations, this program is estimated at US$1.25 –1.88 million.
| March 2016
Project Number:179678 |
Page 1-20 |
|
Salobo Operations Para State, Brazil NI 43-101 Technical Report |
| 2.0 |
INTRODUCTION |
Silver Wheaton Corp. (Silver Wheaton) requested that Amec Foster Wheeler Americas Limited (Amec Foster Wheeler) prepare an independent technical report (the Report) in compliance with the requirements of National Instrument 43-101 Standards of Disclosure for Mineral Projects (NI 43-101) and Form 43–101F1 Technical Report for Vale on the Salobo open pit mining operations (Salobo Operations or the Project), located in northern Brazil, in the southeastern portion of Pará State. The Salobo Operations comprise the Salobo open pit copper–gold mine (Salobo Mine).
The corporate entity that conducts the mining operations is Salobo Metais SA (SMSA), an indirectly wholly-owned subsidiary of Vale SA. For the purposes of this Report, unless otherwise noted, Vale SA and Salobo Metais SA will be referred to interchangeably as Vale.
Silver Wheaton’s interest in the Salobo Operations is restricted to a metal streaming agreement that applies to 50% of the gold produced as a byproduct at the Salobo Mine for the life of the mine (the streaming agreement).
The Project location is shown in Figure 2-1. Figure 2-2 is a long-section through the deposit illustrating the locations of the Mineral Resources and Mineral Reserves discussed in this Report. The Salobo Operations consist of an operating copper–gold open pit mine, currently producing at a rate of 24 Mt/a through a conventional crush–grind–float processing plant, producing copper concentrates.
| 2.1 |
Terms of Reference |
The Report was prepared to support scientific and technical disclosure on the Salobo Operations in Silver Wheaton’s Annual Information Form for the year ending 31 December, 2015.
Mineral Resources and Mineral Reserves are reported with reference to the Canadian Institute of Mining, Metallurgy and Petroleum (CIM) Definition Standards for Mineral Resources and Mineral Reserves (May 2014; the 2014 CIM Definition Standards) and the CIM Estimation of Mineral Resources and Mineral Reserves Best Practice Guidelines (November 2003; 2003 CIM Best Practice Guidelines).
All measurement units used in this Report are metric units and currency is expressed in US dollars (US$), unless stated otherwise. The Brazilian currency is the real (BRL R$ or R$). The Report uses Canadian English. Vale uses FEL nomenclature for its internal technical studies. An FEL 1 study is equivalent to a conceptual study, a FEL 2 study to a prefeasibility study, and a FEL 3 study to a feasibility study.
| March 2016
Project Number:179678 |
Page 2-1 | |
|
Salobo Operations Para State, Brazil NI 43-101 Technical Report |

| March 2016
Project Number:179678 |
Page 2-2 | |
|
Salobo Operations Para State, Brazil NI 43-101 Technical Report |

| March 2016
Project Number:179678 |
Page 2-3 | |
|
Salobo Operations Para State, Brazil NI 43-101 Technical Report |
| 2.2 |
Qualified Persons |
The following Amec Foster Wheeler staff served as Qualified Persons (QPs) as defined in NI 43-101:
| • | Mr Gerrit Vos, P.Eng., Technical Director, Mining | |
| • | Dr Georges Verly, P.Eng., Chief Geostatistician | |
| • | Dr Armando Simon, P.Geo., Principal Geologist | |
| • | Mr Pierre Lacombe, P.Eng., Consulting Metallurgist | |
| • | Mr Donald Hickson, P.Eng., Manager - E&I Division, Peru | |
| • | Mr Vikram Khera, P.Eng., Senior Financial Analyst | |
| • | Ms Stella Searston, RM SME, Principal Geologist. |
| 2.3 |
Site Visits and Scope of Personal Inspection |
Dr Armando Simon, Dr Georges Verly, Mr Gerrit Vos, and Mr Pierre Lacombe visited the Salobo Operations from 20 to 26 June, 2015. During that visit, the scope of personal inspection performed by the QPs included:
| • |
Dr Armando Simon reviewed data collection, database integrity, and geological model construction. Discussions on geology and mineralization were held with Vale personnel, and field site inspections were performed. Dr Simon visited active mining operations to review the geology of the deposits, inspected the main mine laboratory and mine rapid analytical laboratories and reviewed procedures. He worked with site geological personnel reviewing aspects of data storage (database) and analytical quality control | |
|
| ||
| • |
Dr Georges Verly reviewed data collection and database integrity and discussed geology and mineralization with Vale personnel. Dr Verly reviewed geological and block model construction, and reviewed Mineral Resource estimation procedures and some of the corporate protocols supporting the estimates. | |
|
| ||
| • |
Mr Gerrit Vos visited the open pit operations to observe mining procedures, vehicle workshops, and held discussions on mine operating practices with Vale staff | |
|
| ||
| • |
Mr Pierre Lacombe visted the process plant, and held discussions on plant operating practices with Vale staff |
| 2.4 |
Effective Dates |
There are a number of effective dates, as follows:
| • | Date of construction of the resource model: 11 March 2013 |
| March 2016
Project Number:179678 |
Page 2-4 | |
|
Salobo Operations Para State, Brazil NI 43-101 Technical Report |
| • | Date of the Mineral Resource estimate: 31 December, 2015 | |
| • | Date of the Mineral Reserve estimate for: 31 December, 2015 | |
| • | Date of supply of the last information on mineral tenure and permitting: 17 December, 2015 | |
| • | Date of letter regarding taxation considerations that supports the financial analysis: 8 December, 2015 | |
| • | Date of financial analysis: 8 December, 2015. |
The overall effective date of the Report is taken to be the date of the Mineral Resource and Mineral Reserve estimates, and is 31 December, 2015.
| 2.5 |
Information Sources and References |
Mr Joe Hinton and Mr Felipe Riquelme, Amec Foster Wheeler employees, participated in the 20 to 26 June, 2015 site visit to the Salobo Operations. During that visit:
| • |
Mr Joe Hinton visited the tailings storage facility and held discussions on tailings management practices with Vale staff | |
| • |
Mr Felipe Riquelme reviewed some of the current environmental practices in the field and held discussions on aspects of environmental, permitting and social operations with Vale staff. |
Mr Hinton and Mr Riquelme provided specialist input on aspects of tailings dam management, water management and environmental and social considerations to Mr Don Hickson.
The key information sources for the Report include the reports and documents listed in Section 2.6 (Previous Technical Reports), Section 3.0 (Reliance on Other Experts) and Section 27.0 (References) of this Report were used to support the preparation of the Report. Additional information was sought from Vale and Amec Foster Wheeler personnel where required.
| 2.6 | Previous Technical Reports |
In 2013, Silver Wheaton Corp. (Silver Wheaton) filed the following report on the Salobo Operations:
|
• |
Osmond, J.C., Foo, B., Turner, J., and Jacobs, C., 2013: Technical Report on the Mineral Reserves and Mineral Resources of the Salobo Copper-Gold Mine Carajás, Pará State, Brazil: technical report prepared by Micon Inc. for Silver Wheaton Corp., effective date 31 December 2012. |
| March 2016
Project Number:179678 |
Page 2-5 | |
|
Salobo Operations Para State, Brazil NI 43-101 Technical Report |
| 3.0 | RELIANCE ON OTHER EXPERTS |
The QPs have relied upon the following other expert reports, which provided information regarding mineral rights, surface rights, property agreements, royalties, taxation and marketing sections of this Report.
| 3.1 | Mineral Tenure, Surface Rights and Royalties |
The QPs have not independently reviewed ownership of the Project area and any underlying property agreements, mineral tenure, surface rights, or royalties. The QPs have fully relied upon, and disclaim responsibility for, information derived from Vale and legal experts retained by Vale for this information through the following documents:
| • |
Reuwsaat, J.D.V., Ribeiro, C., and de Paula, W.F., 2014: Vale Base Metals, South Atlantic, Salobo Operation, Carajás Mining District, Pará State, Brazil, Mineral Resource and Mineral Reserve Estimate, 2014 Technical Report: report prepared for Vale, 31 December, 2014, 105 p. | |
| • |
Silver Wheaton Corp., 2015: Silver Wheaton Acquires Additional Gold Stream from Vale's Salobo Mine: Silver Wheaton news release, 2 March, 2015. |
This information is used in Section 4 of the Report. The information is also used in support of the Mineral Resource estimate in Section 14, the Mineral Reserve estimate in Section 15, and the financial analysis in Section 22.
| 3.2 | Environmental, Permitting and Social and Community Impacts |
The QPs have fully relied upon, and disclaim responsibility for, information supplied by Vale staff and experts retained by Vale for information related to environmental, permitting and social and community impacts as follows:
| • |
Sete Soluções e Tecnologia Ambiental Ltda, 2014: Plano de Fechamento do Complexo Minerador do Salobo Marabá/PA: report prepared for Vale, December, 2014, 147 p. | |
|
| ||
| • |
Vale, 2015: Complexo Minerador Do Salobo Relatório De Avaliação De Desempenho Ambiental – Rada Ano Base 2014: Vale internal report, March 2015, 404 p. |
This information is used in Section 20 of the Report. This information is also used in support of the financial analysis in Section 22, the Mineral Resource estimate in Section 14, and the Mineral Reserve estimate in Section 15.
| March 2016
Project Number:179678 |
Page 3-1 | |
|
Salobo Operations Para State, Brazil NI 43-101 Technical Report |
The QPs have fully relied upon, and disclaim responsibility for, information supplied by Vale staff and experts retained by Vale for information related to stockpile and waste rock storage as follows:
| • |
BVP Engenharia, 2008c: Projeto Detalhado Pilha Pulmão Memorial Descritivo - Volume I: revision 10 August 2009, 65 p. | |
|
| ||
| • |
BVP Engenharia, 2014a: Salobo Projeto Basico Pilha de Esteril SE (Sudeste), Memorial Descritivo: 24 August, 2014, 49 p. | |
|
| ||
| • |
BVP Engenharia, 2014b: Salobo Projeto Basico Pilha de Esteril SE (Sudeste), Memorial Descritivo: 24 November, 2014, 65 p. | |
|
| ||
| • |
BVP Engenharia, 2014c: Projeto Executivo Pilha De Minério Temporária Memorial Descritivo: 5 November, 2014, 87 p. |
This information is used in Section 20 of the Report. It is also used in support of the financial analysis in Section 22, the Mineral Resource estimate in Section 14, and the Mineral Reserve estimate in Section 15.
The QPs have fully relied upon, and disclaim responsibility for, information supplied by Vale staff and experts retained by Vale for information related to tailings storage facilities and water management as follows:
| • |
BVP Engenharia, 2008a: Projeto Detalhado Dique De Contenção De Finos III, 27 May, 2008, 72 p. | |
|
| ||
| • |
BVP Engenharia, 2008b: Projeto Detalhado Barragem De Finos II: report prepared for Vale, 24 June, 2008, 72 p. | |
|
| ||
| • |
BVP Engenharia, 2009a: Projeto Detalhado Barragem De Captação: report prepared for Vale, 5 October, 2009, 83 p. | |
|
| ||
| • |
BVP Engenharia, 2009b: Projeto Detalhado Dique De Contenção De Finos II: report prepared for Vale, 14 October, 2009, 75 p. | |
|
| ||
| • |
BVP Engenharia, 2013: Projeto Detalhado Barragem De Rejeitos Reforço Da Fase 1: report prepared for Vale, 18 June 2013, 173 p. | |
|
| ||
| • |
Lawrence Consulting Ltd, 2005: A Model for the Prediction of Water Quality Resulting from Mining and Milling Operations at the Salobo Project: report prepared for Vale, 20 December, 2005, 49 p. | |
|
| ||
| • |
Lawrence Consulting Ltd, 2011: ARD and Metal Leaching at Salobo: report prepared for Vale, 25 March, 2011, 14 p. | |
|
| ||
| • |
Vale, 2015: Plano de Atendimento à Emergência Mina do Salobo: Vale internal report, 2 March, 2015, 122 p. |
| March 2016
Project Number:179678 |
Page 3-2 | |
|
|
Salobo Operations Para State, Brazil NI 43-101 Technical Report |
This information is used in Section 20 of the Report. It is also used in support of the financial analysis in Section 22, the Mineral Resource estimate in Section 14, and the Mineral Reserve estimate in Section 15.
| 3.3 |
Taxation |
The QPs have fully relied upon, and disclaim responsibility for, information supplied by Vale staff and experts retained by Vale for information related to taxation as applied to the financial model as follows:
| • |
PwC, 2015a: Review of the income and mineral tax portions of the economic analysis prepared by Amec Foster Wheeler in connection with the NI 43-101 technical report on Vale Canada Limited’s mining projects located in Brazil: letter prepared for Vale Canada Limited, 4 December, 2015. | |
|
| ||
| • |
PwC, 2015b: Vale Prefeasibility Study Technical Report Prepared for Vale Canada Limited – Taxation Narrative: letter prepared for Vale Canada Limited, 8 December, 2015. |
This information is used in support of the financial analysis in Section 22, and the Mineral Reserve estimation in Section 15.
| 3.4 |
Markets, Contracts and Commodity Pricing |
The QPs have not independently reviewed the marketing or metal price forecast information. The QPs have fully relied upon, and disclaim responsibility for, information derived from Vale experts for this information through the following documents:
| • | Vale, 2015: Contracts: 21 October, 2015 | |
| • | Vale, 2015: Metal Price Projections: 22 October, 2015 | |
| • | Vale, 2015: 2015 Salobo Marketing: 21 December, 2015. |
This information is used in Section 19 and in support of the financial analysis in Section 22 and the Mineral Reserves estimate in Section 15.
Metals marketing, global concentrate market terms and conditions, and metals forecasting are specialized businesses requiring knowledge of supply and demand, economic activity and other factors that are highly specialized and requires an extensive database that is outside of the purview of a QP. The QPs consider it reasonable to rely upon Vale for such information as the company is a major global supplier of copper concentrates to the market, and maintains a specialist marketing and contracts department that tracks the copper concentrate market.
| March 2016 | Page 3-3 | |
| Project Number:179678 |
|
|
Salobo Operations Para State, Brazil NI 43-101 Technical Report |
Vale also supplied Amec Foster Wheeler with third-party marketing specialist reports in support of Vale’s commodity price assumptions. These reports indicated metal price forecasts that bracketed the forecast estimates proposed by Vale.
| March 2016 | Page 3-4 | |
| Project Number:179678 |
|
|
Salobo Operations Para State, Brazil NI 43-101 Technical Report |
| 4.0 |
PROPERTY DESCRIPTION AND LOCATION |
| 4.1 |
Location |
The Salobo Operations are located approximately 90 km northwest of Carajás, Pará State, in northern Brazil. Geographic coordinates for the Project are 5°47’25” S latitude and 56°32’5” W longitude.
| 4.2 |
Property and Title in Brazil |
This section provides a general overview of mineral-related law and title in Para State, Brazil, sourced from public domain documentation, including Castro et al., (2012), Lagodourado.com (2015), and PwC, (2013) and has not been independently verified by the QPs.
| 4.2.1 |
Introduction |
Under Brazilian laws, the Federal Government owns all mineral resources.
Mining is regulated by Decree-Law 227, 1967 (the Mining Code), and Decree No. 62,934, 1968, together with rulings made by the National Department of Mineral Production (DNPM). The DNPM is part of the Ministry of Mines and Energy of Brazil (MME), and is responsible for: the administration of all mineral rights; planning and development of mineral exploitation; management of mineral resources; and control of mining activities throughout Brazil.
Under Article 176 of the Brazilian Constitution, all mineral fields (jazidas) belong to the Federal Government, whether or not the jazidas are in active production. Mineral rights are distinct from surface rights.
Brazil also has legislation and legal guarantees related to the exploitation and use of water rights.
| 4.2.2 |
Mineral Tenure |
There are two levels of mineral tenure:
| • | Exploration authorizations (autorização de pesquisa) | |
| • | Mining concessions (concessão de lavra). |
Exploration Authorizations
Exploration authorization applications must be accompanied by information on which minerals are to be explored for, the area and location of the area applied for, a “Research Work Plan” documenting the work that is intended to be performed, and an accompanying budget and work schedule.
| March 2016 | Page 4-1 | |
| Project Number:179678 |
|
|
Salobo Operations Para State, Brazil NI 43-101 Technical Report |
Exploration authorizations can be granted for a minimum one year period, and a maximum three year period, depending on the Research Work Plan proposed and DNPM approval. The authorization can be renewed once. Work must commence within 60 days of grant of the authorization.
A final report on the work completed must be provided to the DNPM, and be formally approved. On completion of a final report on the work conducted (termed a Final Research Report), the exploration authorization holder can apply for a mining concession.
Exploration authorization fees are set on a per hectare basis, and are payable annually.
Royalties (or more properly a mining tax) equivalent to 50% of the amount paid as Compensation for the Exploitation of Mineral Resources (Compensação Financeira pela Exploração de Recursos Minerais or CFEM; see Section 4.2.4) must be made to the surface rights holder.
Mining Concessions
The holder of an exploration authorization with an approved final report has a 12-month exclusion period in which to apply for a mining concession. After that date, any other party may apply for the ground. Depending on the minerals applied for, and the location, exploration authorizations can range in size from 50–10,000 ha.
Applications for a mining concession require documentary support, including the minerals are to be explored for, a description and location of the area applied for, a map showing the area, any easements, an “Economic Development Plan”, and evidence of sufficient funds to complete the plan. Mining concessions are considered granted when an ordinance (portaria) is published in the Official Gazette.
Within 90 days of the publication of the portaria, the holder must apply for possession (imissão na posse) of the surface area that is required to enact the Economic Development Plan. The DNPM will then draft an “Access Term” that must be signed by all stakeholders. The owner of the surface area is entitled to royalties that are equivalent to 50% of the amount paid as CFEM.
Work must commence within six months of the mining concession grant. Annual production reports must be filed. Assuming all other conditions are met, mining concessions remain valid until the deposit is depleted.
The holder can conduct mining activities only in the area covered under the lease agreement, and only after the agreement has been registered before the DNPM, and the appropriate operation license (licença de operação) has been issued. If additional minerals are discovered, the mining concession must be amended to include the new list of minerals.
Mining activities are regulated by the MME.
| March 2016 | Page 4-2 | |
| Project Number:179678 |
|
|
Salobo Operations Para State, Brazil NI 43-101 Technical Report |
| 4.2.3 |
Surface Rights |
Surface rights in Brazil are separate from mineral rights. Under the mining law, mining rights holders have the right to use and access areas that are planned for exploration or exploitation. Rights of way and easements can also be granted to mining rights holders over public and private lands.
Typically, the mining rights holder enters into an agreement with the affected surface rights holder in return for a compensation fee for the land use. Where disputes arise, a mining rights holder may apply for a local court order to allow a judge to establish the appropriate compensation fee to be paid to the surface rights holder.
| 4.2.4 |
Royalties/Mining Taxes |
The CFEM was enacted by legislation in 1989 and is based on a percentage of the holder’s net profit. The value of CFEM varies from 0.2 to 3% of the net sales of mineral products:
| • | 3%: aluminum ore, manganese, rock salt and potassium | |
| • | 2%: iron ore, fertilizer, coal and other substances | |
| • | 0.2%: precious stones, colored gemstones, carbonates and noble metals | |
| • | 1%: gold. |
The majority of minerals incur the 2% royalty.
Of the amount collected, 65% is paid to the municipalities where production is to take place, 23% is paid to the host state, and 12% to the Federal government.
| 4.2.5 |
Environmental Licencing |
Mining activities are subject to mandatory environmental licensing by the Federal or State Environmental Agency, depending on the potential environmental impact. Environmental licenses are granted prior to mine construction, installation, expansion or operation.
Generally, the environmental licensing is a three-stage process:
| • |
A Preliminary License (LP) must be obtained during planning stage evaluation. An Environment Impact Assessment (EIA) and a closure and remediation plan must be prepared during the LP stage. Public hearings are usually called to present the EIA to the communities and authorities. The LP usually imposes conditions that must be complied with by the mining company. The environmental authority will also set the amount of the environmental compensation, which is a minimum of 0.5% of the projected development investment |
| March 2016 | Page 4-3 | |
| Project Number:179678 |
|
|
Salobo Operations Para State, Brazil NI 43-101 Technical Report |
| • |
An Installation Licence (LI) is required prior to construction. The holder must present an Environmental Control Plan (PCA) for approval. Once the PCA is approved, the LI is granted and usually has conditions attached specific to the operation. A mining concession can only be granted by the Minister of Mines once the holder has obtained the LI | |
|
| ||
| • |
An Operations Licence (LO) is granted once construction is complete and inspection by the environmental authorities confirms that the conditions imposed in the LI and the commitments made in the PCA have been kept. |
Although the Brazilian legal system provides for two types of titles, one for exploration and one for mining, it does grant security that the holder of an exploration licence can mine any deposit that is discovered within the granted title. The government is required to grant a mining concession to an entity that has explored for, identified a Mineral Resource, obtained DNPM approval of the exploration report, filed applications for a mining concession in a timely manner, and obtained an LI.
Reasons for not granting a mining concession would be on the grounds of public interest, or if the Federal Government considers that it could have a negative effect on certain interests which are more important than mineral exploitation. In the latter instance, in those cases where a final exploration report has already been approved, a mining concession applicant is entitled to be indemnified by the Federal Government for any expenses incurred relating to the completed exploration work.
Brazil has a concept that is termed “environmental conservation units”, which can be created by either the Federal Government, States or Municipalities, and can be either total protection conservation units, where industrial activities such as mining cannot take place; or sustainable use conservation units, where some industrial activities (including mining) may be carried out as long as they comply with regulatory requirements. Every environmental conservation unit in Brazil must have its own management plan that sets out the regulations for the administration and occupation of the unit. The plan includes regulations applicable to the zone that surrounds the unit.
| 4.2.6 |
Social Licence |
Areas reserved for indigenous populations are designated as “restricted access” or “prohibited” access for mining. The Brazilian Constitution requires that any mining activities in indigenous areas requires prior approval of the Brazilian National Congress. Indigenous communities have the right to receive royalties from any mining in their areas.
In addition to the indigenous communities, there are other communities (Quilombolas) that have Constitutional rights to own and occupy specific lands. Mining is permitted in these areas; however, the communities are entitled to compensation, and if the
| March 2016 | Page 4-4 | |
| Project Number:179678 |
|
|
Salobo Operations Para State, Brazil NI 43-101 Technical Report |
| community needs to be relocated for mining purposes, the community must be relocated to land that has similar characteristics to the area that was previously occupied, or be fairly compensated. | |
| 4.2.7 |
Water Rights |
All waters are considered to be in the public domain, and are separated into:
| • |
Federal waters: lakes, rivers and any water courses on lands under Federal authority; those that flow through more than one State; those that serve as a frontier with another country, or flow into or originate in another other country; as well as marginal lands and riparian beaches | |
| • |
State waters: Groundwater and rivers located entirely within the territory of a single State, unless otherwise classified as a Federal water. |
Law 9,433 of 1997 established the National Water Resources Policy (NWRP), created the National Water Resources Management System (NWRMS), and defined a catchment (river) basin as the unit for water resource planning. The law includes the principle of multiple water uses, thereby putting all user categories on an equal footing for access to water resources.
The organizational framework administering water includes the National Water Resources Council (NWRC), State Water Resources Councils (SWRCs), River Basin Committees (RBCs), State Water Resources Management Institutions (SWRIs) and Water Agencies (WAs).
In 2003, to facilitate the management of Brazilian water resources, the country was divided into 12 hydrographic regions; however, these do not coincide with the 27 state political divisions. The NWRC is responsible for resolving disputes over use of water for basins at the Federal level, and for establishing guidelines necessary to implement the institutional framework and instruments contained in the NWRP. The SWRCs are responsible for basins at the State level. The SWRIs are responsible for implementing the guidelines set by the SWRCs. The RBCs and WAs cover the actual water regions, which may be part of more than one State.
| 4.2.8 |
Fraser Institute Survey |
Amec Foster Wheeler has used the Investment Attractiveness Index from the 2014 Fraser Institute Annual Survey of Mining Companies report (the Fraser Institute survey) as a credible source for the assessment of the overall political risk facing an exploration or mining project in Brazil.
Amec Foster Wheeler has relied on the Fraser Institute survey because it is globally regarded as an independent report-card style assessment to governments on how attractive their policies are from the point of view of an exploration manager or mining
| March 2016 | Page 4-5 | |
| Project Number:179678 |
|
|
Salobo Operations Para State, Brazil NI 43-101 Technical Report |
company, and forms a proxy for the assessment by industry of political risk in Brazil from the mining perspective.
The Fraser Institute annual survey is an attempt to assess how mineral endowments and public policy factors such as taxation and regulatory uncertainty affect exploration investment.
Overall, Brazil ranked 70th out of the 122 jurisdictions in the survey in 2014.
| 4.3 |
Project Ownership |
The Salobo Operations are indirectly wholly-owned by Vale SA.
| 4.4 |
Mineral Tenure |
The Salobo Mine is located within one claim (Figure 4-2). The area named Salobo (copper ore, DNPM 807.426/74) refers to Exploration Permit No. 1121, which was dated 14 July, 1987, and defined as a polygon covering 9,180.61 ha.
An annual report is required to be lodged with the DNPM, detailing the production for the year.
| 4.5 |
Surface Rights |
Brazilian legislation separates surface ownership from sub-surface ownership. A mining company can operate a mine even if does not own the surface; however, in this case a royalty is paid to the surface owner. The royalty is calculated as 50% of the CFEM and is paid to the government.
| 4.6 |
Royalties and Encumbrances |
The Project is subject to the CEFM (refer to discussion in Section 4.2.4) .
In February 2013, Vale entered into an agreement (the streaming agreement) with Silver Wheaton to sell 25% of the gold produced as a byproduct at the Salobo Mine for the life of the mine. In exchange, Vale received an initial cash payment of US$1.33 billion, warrants exercisable into Silver Wheaton shares, and ongoing payments dependent on the prevailing market price for each ounce of gold that Vale delivers under the streaming agreement.
In March 2015, Silver Wheaton acquired an additional 25% of the byproduct gold production, increasing the gold share to 50%. Under the amended 2015 streaming agreement, Silver Wheaton paid Vale a cash consideration of US$900 million for the increased gold stream. In addition, Silver Wheaton will make ongoing payments of the lesser of US$400 (subject to a 1% annual inflation adjustment commencing in 2017) and the prevailing market price for each ounce of gold delivered under the streaming agreement.
| March 2016 | Page 4-6 | |
| Project Number:179678 |
|
|
Salobo Operations Para State, Brazil NI 43-101 Technical Report |

| March 2016 | Page 4-7 | |
| Project Number:179678 |
|
|
Salobo Operations Para State, Brazil NI 43-101 Technical Report |
| 4.7 |
Property Agreements |
There are no property agreements relevant to the Salobo Operations.
| 4.8 |
Permits |
Permitting considerations for the Project are discussed in Section 20.
| 4.9 |
Environmental Liabilities |
The environmental status of the Project is discussed in Section 20.
| 4.10 |
Social License |
The social license considerations for the Project are discussed in Section 20.
| 4.11 |
Comments on Section 4 |
In the opinion of the QPs, the information discussed in this section supports the declaration of Mineral Resources and Mineral Reserves, based on the following:
| • |
Information provided by Vale supports that the mining tenure held is valid and is sufficient to support estimation of Mineral Resources and Mineral Reserves | |
|
| ||
| • |
Information provided by Vale supports that Vale holds sufficient surface rights in the Project area to support the mining operations envisaged in the life-of-mine plans, including access and power line easements | |
|
| ||
| • |
Vale currently holds the appropriate permits under local, Provincial and Federal laws to allow mining operations (refer to Section 20). Some permits will require renewal over the course of the planned life-of-mine | |
|
| ||
| • |
The appropriate environmental permits have been granted (refer to Section 20) | |
|
| ||
| • |
At the effective date of this Report, environmental liabilities are typical of an operating open pit mining area (refer to Section 20) | |
|
| ||
| • |
Vale is not aware of any significant environmental, social or permitting issues that would prevent continued exploitation other than those discussed in the Report | |
|
| ||
| • |
There is no active artisanal mining on or near the property | |
|
| ||
| • |
To the extent known, there are no other significant factors and risks known to Vale that may affect access, title, or the right or ability to perform work on the Project. |
| March 2016 | Page 4-8 | |
| Project Number:179678 |
|
|
Salobo Operations Para State, Brazil NI 43-101 Technical Report |
| 5.0 |
ACCESSIBILITY, CLIMATE, LOCAL RESOURCES, INFRASTRUCTURE, AND PHYSIOGRAPHY |
| 5.1 |
Accessibility |
The mine site is connected via an all-weather road network to the cities of Parauapebas (90 km), Marabá (240 km), and the commercial airport at Carajás. The Carajás airport is capable of accommodating large aircraft and is served by daily flights to Belém (Pará State major’s city) and other major Brazilian cities.
Railroads link Carajás with the port city of São Luis. Figure 5-1 shows the key regional infrastructure.
| 5.2 |
Climate |
The operations are located in the Carajás mountain range in the eastern Amazon humid tropical rainforest. Temperatures range from 20.8°C to 37.8°C with an average relative humidity of 80.5% . Mean annual rainfall is 1,920 mm and evaporation is 1,500 mm. Winds are predominantly from the north and west.
Mining operations are conducted year-round.
| 5.3 |
Local Resources and Infrastructure |
Mining is the primary industry of the area. As well as Salobo, Vale also operates the established Sossego copper mine, located 136 km by road to the south of Salobo. Vale operates a very large iron ore mine at Carajás.
Local housing is available for employees within the communities surrounding the mine. There are adequate schools, medical services and businesses to support the work force. The mine site has medical facilities to handle emergencies. In addition, medical facilities are available in Carajás to support the mine’s needs.
Vale has invested significantly in infrastructure in Carajás, building a 130 km paved road to Parauapebas and a 20 km sewage system, together with a school, hospital, and day care centre.
Project infrastructure and the infrastructure layout are discussed in detail in Section 18 of the Report.
| March 2016 | Page 5-1 | |
| Project Number:179678 |
|
|
Salobo Operations Para State, Brazil NI 43-101 Technical Report |

| March 2016 | Page 5-2 | |
| Project Number:179678 |
|
|
Salobo Operations Para State, Brazil NI 43-101 Technical Report |
| 5.4 |
Physiography |
Salobo is in the northwest of the Carajás Reserve within the 190,000 ha Flona de Tapirapé–Aquiri forest (see also discussion in Section 20). The area is heavily forested, and dominated by relative dense trees with substantial underbrush.
In the mine area the topography is fairly steep, varying between 190 to 520 m in elevation. The ridge where the Salobo deposit is located has a nominal slope of 2.5H:1.0V. The site is lower than the Carajás Ridge, which is 850 m above sea level.
The two drainages on either side of the Salobo Ridge are the Cinzento and Salobo Rivers which flow into the Itacaiúnas River. The Itacaiúnas River flows into the Tocantins River close to Marabá City. The long-term average unit runoff for the Project site is 13.5 L/s/km2.
| 5.5 |
Comments on Section 5 |
In the opinion of the QPs:
| • |
All necessary infrastructure has been built on site, is operational, and is sufficient for the projected life-of-mine (LOM) plan (LOMP), (see also Section 18) | |
| • |
There is sufficient suitable land available within the mineral tenure held by Vale for tailings disposal, mine waste disposal, and installations such as the process plant and related mine infrastructure. |
| March 2016 | Page 5-3 | |
| Project Number:179678 |
|
|
Salobo Operations Para State, Brazil NI 43-101 Technical Report |
| 6.0 |
HISTORY |
| 6.1 |
Exploration History |
The exploration division of CVRD (a predecessor company to Vale) discovered copper mineralization in the Igarapé Salobo region in 1974, and commenced detailed exploration in 1977. Work completed included stream sediment sampling, reconnaissance exploration, and ground induced polarization (IP) and magnetometer geophysical surveys. As a result, various targets were identified.
In 1978, the 1974 Salobo exploration targets were revisited and the presence of copper sulphides in an outcrop of magnetite schists at the Salobo 3 Alfa target was noted. Drilling of this target followed in conjunction with the development of two exploration adits. The Salobo 3 Alfa target is now referred to as Salobo.
Drilling was initially conducted on a 400 m by 200 m drill grid, subsequently reduced to 200 m by 200 m, and then to 200 m by 100 m. A total of 65 core drill holes (29,322 m) were drilled between March 1978 and May 1983.
A preliminary assessment of potential Project economics was performed in 1981, based on an initial resource estimate. The findings were encouraging, and the Carajás Copper Project team submitted an Exploitation Economical Plan for the Salobo deposit to the DNPM in June 1981.
A pilot-scale study was carried out from 1985 to 1987 to further define the mineralization style and geometry. This included additional drilling and an additional 1 km of exploration adits. The second drill campaign ran from January 1986 to June 1987, and reduced the grid spacing in the core of the deposit to 100 m by 100 m. Additional drilling was undertaken in the southeast of the deposit from the G-3 adit. This phase included 9,033 m of diamond drilling from 60 drill holes.
The MME granted CVRD mining rights in 1987 through Ordinance No. 1121. A prefeasibility study was completed by Bechtel in 1988.
Salobo Metais S.A. was incorporated on 29 June 1993 as a joint-venture vehicle between CVRD and Morro Velho Mining (a subsidiary of Anglo American Brasil Ltda., AABL).
In 1993, the third drill campaign was initiated. The primary objective was to investigate the best probable location in the deposit in which to commence mining and to optimize the first five years of production, as well as to investigate mineralized continuity at depth. Between July 1993 and February 1994, a total of 65 drill holes (14,585 m) were completed.
In 1997, the fourth drilling campaign was conducted, resulting in 25,491 m in 88 holes. Mineral Resources Development Inc. (MRDI) audited the drilling information that year.
| March 2016 | Page 6-1 | |
| Project Number:179678 |
|
|
Salobo Operations Para State, Brazil NI 43-101 Technical Report |
A feasibility study was undertaken by Minorco in 1998. This was subsequently revised and updated by Kvaerner in 2001. AMEC audited the drilling, sampling, assaying and databases that supported the Kvaerner study in 2002
In 2002, changes to the Exploitation Economic Plan allowing Salobo Metais to extract silver and gold were approved by DNPM. The original authorization had been for copper only.
In June 2002, the Brazilian Council for Economic Defense (Conselho Administrativo de Defesa Econômica) approved the acquisition by CVRD of the 50% of Salobo Metais that was held by AABL. CVRD thus became the largest shareholder in Salobo Metais.
The fifth drilling campaign comprised 190 drill holes (66,243 m) drilled in 2002 and a further 2,047 m of drilling in 2003, during which some areas were drilled a little more densely (50 m x 50 m), including the area around the G3 adit. The drilling was followed by completion of the final feasibility study update by Fluor JPS in 2004.
The Salobo Mine commenced pre-stripping in 2009. Project ramp-up for Phase I of the Salobo Operations was completed three years later and the first concentrate was shipped in September 2012. In December 2013, the plant processed 898,000 t of ore, which represented 90% of the Phase I nameplate capacity (1 Mt run-of-mine (ROM) per month). Phase II, intended to double the nameplate capacity and was completed in 2014.
| 6.2 |
Production History |
Production since mine start-up in 2012 is summarized in Table 6-1.
| March 2016 | Page 6-2 | |
| Project Number:179678 |
|
|
Salobo Operations Para State, Brazil NI 43-101 Technical Report |
Table 6-1: Salobo Production History (2012 to April 2015)
| Tonnage | Feed Grades | Concentrate | |||||
| Year | Cu | Au | Tonnage | Cu | Au | ||
| (kt) | (%) | (g/t) | (t) | (%) | (g/t) | ||
| 2012 | 1,872 | 1.13 | 0.74 | 32,231 | 40.8 | 20.42 | |
| 2013 | 7,578 | 1.09 | 0.76 | 165,471 | 39.4 | 21.92 | |
| 2014 | 12,755 | 0.97 | 0.62 | 255,511 | 38.5 | 19.51 | |
| 2015 | 20,688 | 0.88 | 0.57 | 402,592 | 38.6 | 19.41 | |
Note: annual production tonnes are reported as wet tonnes, and the concentrate tonnes are reported as dry tonnes
| March 2016 | Page 6-3 | |
| Project Number:179678 |
|
|
Salobo Operations Para State, Brazil NI 43-101 Technical Report |
| 7.0 |
GEOLOGICAL SETTING AND MINERALIZATION |
| 7.1 |
Regional Geology |
Information on the regional setting for the Project has been summarized primarily from Moreto et al., (2014, 2015), da Costa Silva et al., (2013), and Monteiro et al., (2007).
The Carajás Mining District, located in the southeast of Pará State, lies between the Xingu and Tocantins/Araguaia Rivers, and covers an area of about 300 km x 100 km. It is hosted in the Carajás Province, forming a sigmoidal-shaped, west–northwest–east–southeast-trending late Archean basin (Figure 7-1 and Figure 7-2).
The Archean basin contains a basement assemblage that is dominated by granite–tonalitic ortho-gneisses of the Pium Complex, and amphibolite, gneisses and migmatites of the Xingu Complex. The basement assemblage defines a broad, steeply dipping, east–west-trending ductile shear zone (Itacaiúnas shear zone) that experienced multiple episodes of reactivation during the Archean and Paleoproterozoic.
The metamorphic rocks are cut by Archean-age intrusions, including the calc-alkaline Plaquê Suite (2.73 Ga), and the alkaline Salobo and Estrela granites (2.57 Ga and 2.76 Ga respectively).
The basement rocks are overlain by volcanic and sedimentary rocks of the Itacaiúnas Supergroup (2.56 Ga to 2.77 Ga). The Itacaiúnas Supergroup is informally subdivided as follows (oldest to youngest):
| • |
The Igarapé Salobo Group: iron-rich sediments, quartzites and gneisses, metamorphosed to amphibolite facies; associated with copper–gold and copper– gold–silver mineralization, e.g. Salobo | |
|
| ||
| • |
Igarapé Pojuca Group: basic to intermediate volcanic rocks (frequently with cordierite–anthophyllite alteration), amphibolites, gneisses and chemical sediments (cherts), banded iron formation (BIF), and chert; associated with copper–zinc deposits, e.g. Pojuca. | |
|
| ||
| • |
Grão Pará Group: basal Parauapebas Formation, comprising bimodal volcanic rocks with various degrees of hydrothermal alteration, metamorphism and deformation; upper Carajás Formation, associated with various iron deposits, including all of the Carajás deposits. | |
|
| ||
| • |
Igarapé Bahia Group: mafic volcanics (lavas, tuffs and breccias), meta-sediments and BIF, associated with copper, copper–iron, copper–gold–silver deposits, e.g. Igarapé Bahia, Alemão/Bahia and Serra Pelada. |
| March 2016 | Page 7-1 | |
| Project Number:179678 |
|
|
Salobo Operations Para State, Brazil NI 43-101 Technical Report |

| March 2016 | Page 7-2 | |
| Project Number:179678 |
|
|
Salobo Operations Para State, Brazil NI 43-101 Technical Report |

| March 2016 | Page 7-3 | |
| Project Number:179678 |
|
|
Salobo Operations Para State, Brazil NI 43-101 Technical Report |
The Itacaiúnas Supergroup hosts all the Carajás iron ore–copper–gold (IOCG) deposits, including Salobo and Sossego, and is thought to have been deposited in a marine rift environment. The metamorphism and deformation has been attributed to the development of a sinistral strike-slip ductile shear zone (the 2.7 Ga Itacaiúnas Shear Zone) and to sinistral, ductile–brittle to brittle transcurrent fault systems (e.g. the Cinzento and Carajás Faults; Figure 7-3).
The Itacaiúnas Supergroup is overlain by an extensive succession of Archean marine to fluvial sandstones and siltstones known as the Rio Fresco Group or the Águas Claras Formation (2.68 Ga to 2.78 Ga). The non-deformed, Proterozoic Gorotire Formation, consisting of coarse arkoses and conglomerates with quartz, BIF, and basic rock clasts, overlies the older lithological units (Matos da Costa, 2012).
A Proterozoic suite (1.88 Ga) of anorogenic, alkaline granites, the Serra dos Carajás, the Cigano and the Pojuca granites, as well as several generations of younger mafic dykes, cross-cut the entire sequence.
| 7.2 |
Project Geology |
Information on the deposit is summarized from Vale internal documents.
Mineralization at the Salobo deposit is hosted by upper-greenschist-to-lower-amphibolite-metamorphosed rocks of the Igarapé Salobo Group. The group thickness varies from 300–600 m in the Project area, and may be weathered to depths of 30–100 m. The rocks strike approximately N70°W and have a subvertical dip.
| 7.2.1 |
Lithologies |
The major host units are biotite (BDX) and magnetite schists (XMT). Granitic intrusions (GR) occur adjacent to the north and southern sides of the BDX and XMT, and a series of much younger diorite dykes (DB) cross-cut the mineralization forming barren zones (Figure 7-4). Lithological descriptions of the major units are included in Table 7-1.
| 7.2.2 |
Structure |
The Salobo deposit is situated within the Cinzento strike-slip system (refer to Figure 7-3) which has been described as a set of Archean alignments that forms the Salobo transpressive duplex (or Salobo sidewall rip-out). This system post-dates the formation of the Itacaiúnas shear zone and was developed under ductile–brittle to brittle conditions.
The tectonic evolution of the Salobo area includes sinistral, transpressive, ductile deformation that developed under upper-amphibolite-facies conditions, followed by sinistral, transtensive, ductile–brittle-to-brittle shear deformation.
| March 2016 | Page 7-4 | |
| Project Number:179678 |
|
|
Salobo Operations Para State, Brazil NI 43-101 Technical Report |
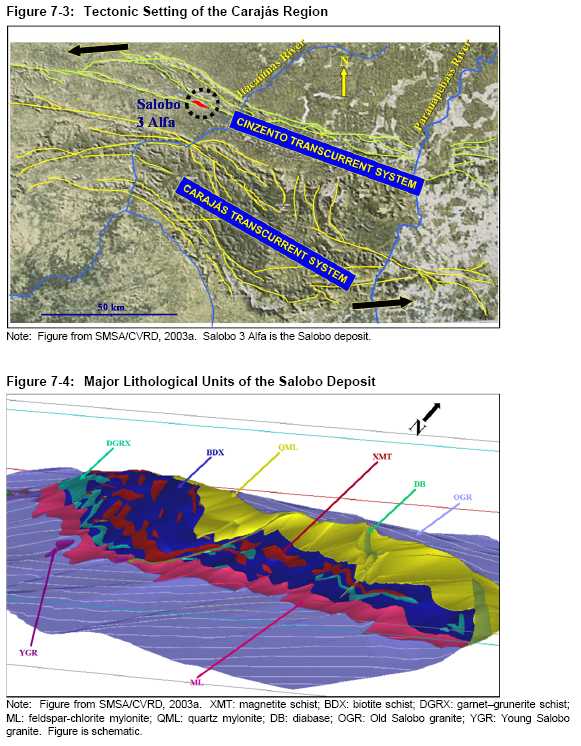
| March 2016 | Page 7-5 | |
| Project Number:179678 |
|
|
Salobo Operations Para State, Brazil NI 43-101 Technical Report |
Table 7-1: Project Stratigraphy
| Unit | Description | Comment |
| Magnetite schists (XMT) | Massive, foliated and banded
rocks, with predominant magnetite, fayalite, grunerite, almandine and secondary biotite. Iron–potassic alteration is common. |
Granoblastic textures with
polygonal contacts in magnetite and fayalite are common. The presence of fayalite is marked by the replacement of grunerite and greenalite, and transformation into magnetite and other sulphides. |
| Biotite schist (BDX) | Medium to coarse-grained with
anastomosed foliation. Characterized by biotite, garnet, quartz, magnetite and chlorite. |
The
garnet–magnetite–grunerite–biotite assemblage is partially replaced by a second generation of biotite and magnetite with chlorite, K feldspar, quartz, hematite and sulphides. Tourmaline, apatite, allanite, graphite and fluorite generally occur throughout this unit. |
| Garnet–grunerite schist (DGRX) |
Massive, but may show local
schistosity. Main constituents are almandine and cummingtonite– grunerite, with magnetite, hematite, ilmenite, biotite, quartz, chlorite, tourmaline and subordinate allanite. |
Fluorite and uraninite generally
occur in veinlets related to stilpnomelane, calcite and grunerite. |
| Feldspar–chlorite mylonite (ML) |
Feldspar–chlorite–quartz mylonite
characterized by mylonitic foliation. Secondary minerals include biotite, hastingsite, elongated quartz and saussuritized plagioclase. K- feldspar, epidote and muscovite alteration. |
Porphyroblastic garnet is
partially or totally replaced by chlorite and epidote. Allanite and apatite generally occur throughout this lithology. |
| Metavolcanic basic rock (MTB) |
Coarse grained. Characterized by
Fe-hastingsite and/or hornblende and plagioclase with chlorite alteration. |
It occurs irregularly in the
system, is concordant with other lithotypes, but contacts are abrupt. |
| Quartz mylonites (QML) | Grey–white–green to red. Fe-
oxides are medium to fine grained, foliated and composed predominantly of quartz, muscovite, sericite, sillimanite and chlorite. Accessory minerals, such as biotite, feldspar, magnetite, almandine, tourmaline, zircon and allanite are common. |
It is possible to differentiate:
(a) red quartz- feldspathic rocks formed by K-feldspar and quartz and which may be a product of shearing between the gneissic basement and the supracrustal rocks; and (b) chlorite schists, mainly composed of chlorite and quartz, that represent intense hydrothermal alteration. |
| Old Salobo Granite (GR) | Colorless, pink to grey, coarse- grained and with mylonitization in some areas. Consists of K- feldspar (orthoclase-microcline), oligoclase, quartz, augite, hornblende, chlorite and, rarely, magnetite. |
There is no evidence of contact metamorphism with the host rocks. |
| March 2016 | Page 7-6 | |
| Project Number:179678 |
|
|
Salobo Operations Para State, Brazil NI 43-101 Technical Report |
| Unit | Description | Comment |
| Young Salobo Granite (GR) |
The matrix may be aphanitic,
containing a porphyry of red albite (Fe-oxide in micro-fractures) and chlorite pseudomorphed by biotite; with fine to medium grained, equigranular, hypidiomorphic grains of albite/oligoclase, orthoclase, quartz, and chlorite, with minor epidote, zircon, fluorite, magnetite, chalcopyrite and pyrite. |
Small northwest-trending sills,
hosted by the supracrustal sequence and by the gneisses of basement. |
| Diabase (DB) | Consists of augite, plagioclase,
magnetite, ilmenite and quartz. |
The dykes are set within
shear/fault lateral geometries to (N70°E) and frontal geometries (N20°W), probably developed before the intrusions, in a compressional regime modified by an extensive regime. |
| Rhyolite (RIO) | Grey–reddish in colour, porphyritic in texture, within an aphanitic matrix. Consists of K-feldspars, plagioclase, quartz, amphibole in a matrix cut by quartz veinlets. |
In drill holes the occurrence is rare or an ultimate phase. |
Shear zones are characterized by a mylonitic, penetrative foliation that generates a compositional banding. Where deformation is more intense, S-C foliations are parallel, and a lenticular pattern develops.
The ductile deformation along the Itacaiúnas shear zone, which has affected the basement rocks and rocks of the Salobo Group, produced widespread, subvertical, northwest–southeast schistosity, which affects all lithologies in the deposit, except the Young Salobo Granite and the diabase dykes.
The transtensive deformation along the Cinzento strike-slip fault system reactivated old structures, and formed a subparallel ductile–brittle shear zone in the northern part of the deposit and a brittle shear zone in the south.
Brittle–ductile shear zone deformation has resulted in lenticular-shaped ore shoots that characteristically show close associations between copper mineralization and magnetite content.
| 7.2.3 |
Metamorphism |
Two phases of metamorphism have been recognized in the Project area:
| • |
Initial phase: associated with progressive amphibolite-facies metamorphism developed under ductile conditions of high temperature (650°C), low pressure (2– 3 kbar), and oxygen fugacities of -20 and -18. This caused partial substitution of chalcopyrite by bornite and chalcocite, accompanied by intense K-metasomatism |
| March 2016 | Page 7-7 | |
| Project Number:179678 |
|
|
Salobo Operations Para State, Brazil NI 43-101 Technical Report |
| • | Retrograde phase: developed under greenschist facies, with an average temperature of 340°C; characterized by intense chloritization and partial substitution of bornite by chalcocite. |
| 7.2.4 |
Alteration |
The Salobo hydrothermal system has a core of massive magnetite that is surrounded by less intensely altered rocks. Within the massive magnetite body there are small veins and irregular masses of secondary biotite. Garnet is completely replaced by magnetite, forming pseudomorphs. Away from the massive magnetite, the magnetite content gradually diminishes, giving way to biotite–garnet schist and/or garnet–grunerite schist. Alkali-metasomatism of the amphibolite facies rocks is expressed by weak sodium with intense, superimposed potassium alteration (≤4.6wt% of K2O).
K-feldspar, biotite and oligoclase are the main alteration minerals. A significant increase in the FeO content (≤35 wt%) accompanied the potassium alteration in amphibolite, and was marked by the replacement of calcium-amphibole (mostly magnesium-hornblende and hastingsite) by iron–magnesium amphibole (cummingtonite), and by formation of biotite and magnetite.
The chemistry of the meta-graywackes at the deposit indicates that they also underwent significant iron and potassium alteration. Alteration assemblages are characterized by almandine, garnet, biotite and grunerite, subordinate tourmaline and minor magnetite. The better-mineralized zones, located in the central part of the deposit, correspond to the most altered areas.
| 7.2.5 |
Mineralization |
The sulphide mineralization typically consists of assemblages of magnetite–chalcopyrite–bornite and magnetite–bornite–chalcocite. Accessory minerals include hematite, molybdenite, ilmenite, uraninite, graphite, digenite, covellite, and sulphosalts.
The mineral assemblages can be found in a number of styles: forming disseminations (Figure 7-5 A), stringers (Figure 7-5 B), stockworks, massive accumulations (Figure 7-5 C), filling fractures, or in veins (Figure 7-5 D) associated with local concentrations of magnetite and/or garnet filling the cleavages of amphiboles and platy minerals, and remobilized in shear zones.
There is a positive relationship between copper minerals and magnetite. Copper content is typically >0.8% in XMT and BIF, whereas in gneisses and schists it is <0.8% . A positive correlation between copper content and uranium contents has also been established.
| March 2016 | Page 7-8 | |
| Project Number:179678 |
|
|
Salobo Operations Para State, Brazil NI 43-101 Technical Report |
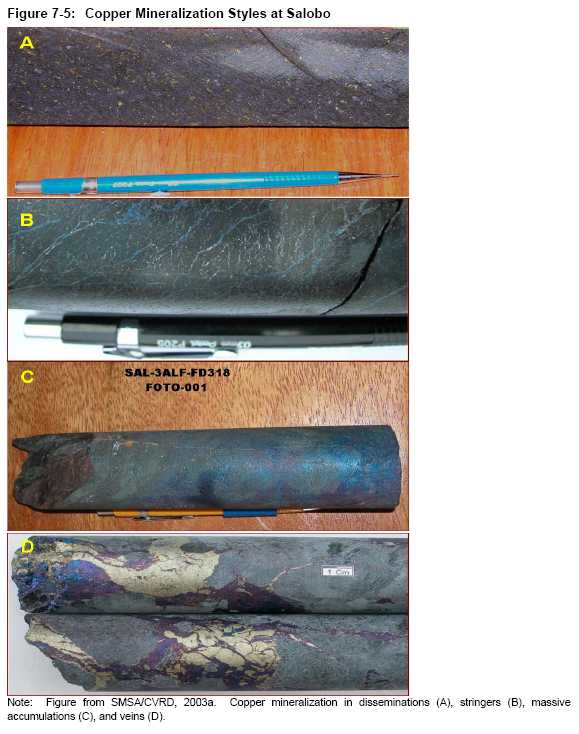
| March 2016 | Page 7-9 | |
| Project Number:179678 |
|
|
Salobo Operations Para State, Brazil NI 43-101 Technical Report |
Chalcopyrite, bornite, and chalcocite occur interstitially to silicate minerals. These sulphide minerals are commonly found filling cleavage planes of biotite and grunerite. Hematite is rare, but in places it can reach as much as 4% by volume. It exhibits tabular textures (specularite), with infilling bornite, and partial replacement by magnetite.
Native Au occurs as grains smaller than 10 μm in cobaltite, safflorite, magnetite and copper sulphides, or interstitial to magnetite and chalcopyrite grains. Native Au grains contain up to 10 wt% Cu, with subordinate silver, arsenic, and iron.
Molybdenite occurs interstitial to magnetite, and shows cleavage planes filled with chalcopyrite and bornite. In mylonitic samples, molybdenite forms kinked stringers.
Magnetite occurs mainly as idiomorphic to sub-idiomorphic grains, interstitial to silicate minerals or in fractures, or forms bands in mylonitic rocks.
The gangue minerals are almandine garnet, grunerite, and tourmaline, reflecting the intense iron-metasomatism. Minor amounts of fayalite and hastingsite are pseudomorphed by grunerite and magnetite. Tourmaline, with a dominant schörlitic (black-tourmaline) composition, occurs as idiomorphic crystals preferentially oriented parallel to mylonitic foliation, in association with biotite, garnet and grunerite. Ilmenite, uraninite, allanite, fluorite and apatite occur as accessory minerals.
Biotite sub-idiomorphic crystals, commonly kinked, are associated with potassic alteration, and spatially related to the copper–gold mineralization. Uraninite and zircon inclusions may be locally abundant in biotite.
Quartz is associated with biotite in ore-grade samples, and forms concordant veins within the host rocks.
Textural relationships indicate that mineralization was developed firstly as an oxide stage, with a second, subsequent, sulphide stage.
| 7.2.6 |
Weathering |
Near-surface weathering of the bedrock in the Project area has produced a humid, clayey, saprolitic surface layer, the composition of which ranges from predominantly argillaceous clays with lithic fragments over BDX to ferruginous–argillaceous clays over XMT, reflecting the source-rock mineralogy (SMSA/CVRD, 2003a).
The sulphide mineralization in the upper 20 m to 25 m of the saprolite has been oxidized. The lower 5 m to 10 m of the saprolite layer contains variable proportions of sulphides, and is transitional downward into fresh, sulphide-bearing bedrock.
The saprolite layer has been partially leached by groundwater, resulting in a significant reduction in the copper–gold content. The sulphide saprolite is a transitional unit, for which leaching has also reduced the copper–gold content, but to a lesser degree than
| March 2016 | Page 7-10 | |
| Project Number:179678 |
|
|
Salobo Operations Para State, Brazil NI 43-101 Technical Report |
| occurred in the oxide saprolite. Oxide copper minerals, such as azurite and malachite, can be found filling fractures in the transition zone (Figure 7-6 A and Figure 7-6 B show azurite and malachite, respectively). | |
| 7.2.7 |
Mineralization Age |
According to Tassinari et al. (2003), geochronological data obtained from Salobo are in agreement with a primary syngenetic origin for the mineralization (2.7 Ga), with late remobilization into brittle–ductile structures during the polycyclic evolution of the Carajás–Cinzento strike-slip system into a continental environment (2.6 Ga to 2.1 Ga). Low-grade metamorphism and anorogenic granitic plutonism affected the area at ca. 2.1 Ga to 1.8 Ga, respectively.
| 7.3 |
Deposit Descriptions |
The Salobo deposit extends over an area of approximately 4 km along strike (west–northwest), is 100–600 m wide, and has been recognized to depths of 750 m below the surface. Souza and Vieira (2000) outlined six mineralized bodies (1–6) in the deposit, based on the predominance of various hosting schists (Figure 7-7).
However, after SMSA/CVRD (2003b) formulated a new lithological model for the deposit, and in particular after separating the XMT, BDX and DGRX lithologies that represent the main mineralized units, the original division was abandoned.
The BDX represents the predominant lithology in the deposit, extending over its entire length, and being only locally interrupted by diabase dykes. The BDX thickness ranges from tens of metres to more than 500 m.
The XMT usually forms sigmoidal, relatively thin lenses within the BDX, and is mostly localized in the central portion of the deposit. Such lenses rarely extend over 500 m, and range from a few metres to as much as 120 m in thickness.
The DGRX usually forms thin, discontinuous bodies within the BDX, with few tens of metres thickness and less than 200 m length. However, a large body, over 1,100 m long and as much as 200 m thick, has been identified in the eastern end of the deposit.
The boundaries between the BDX, the XMT and the DGRX are conventionally established, based on the appearance and/or relative predominance of magnetite, biotite, garnet and grunerite. Representative plans and cross-sections are presented in Figure 7-8 to Figure 7-11. A colour legend for the figures is included as Figure 7-12, with the main lithological acronyms being those outlined in Table 7-1.
| March 2016 | Page 7-11 | |
| Project Number:179678 |
|
|
Salobo Operations Para State, Brazil NI 43-101 Technical Report |

| March 2016 | Page 7-12 | |
| Project Number:179678 |
|
|
Salobo Operations Para State, Brazil NI 43-101 Technical Report |

| March 2016 | Page 7-13 | |
| Project Number:179678 |
|
|
Salobo Operations Para State, Brazil NI 43-101 Technical Report |
![]()
| March 2016 | Page 7-14 | |
| Project Number:179678 |
|
|
Salobo Operations Para State, Brazil NI 43-101 Technical Report |
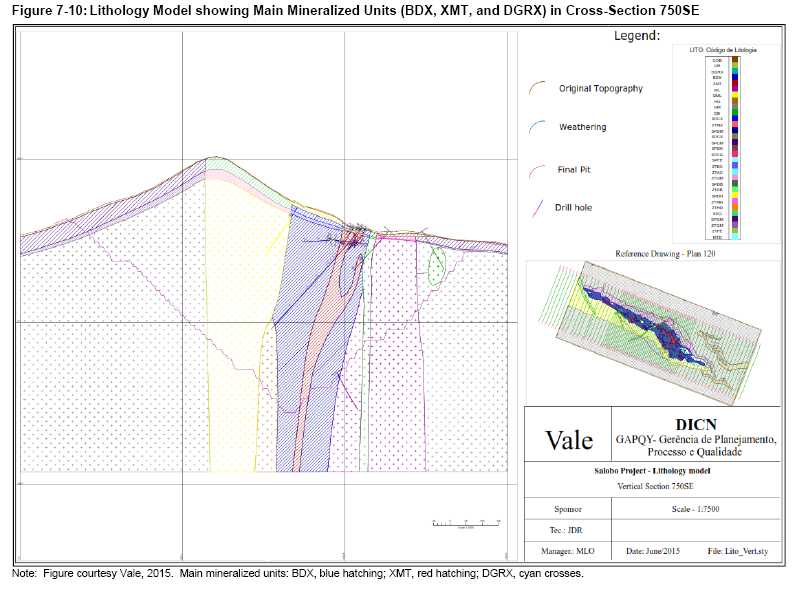
| March 2016 | Page 7-15 | |
| Project Number:179678 |
|
|
Salobo Operations Para State, Brazil NI 43-101 Technical Report |
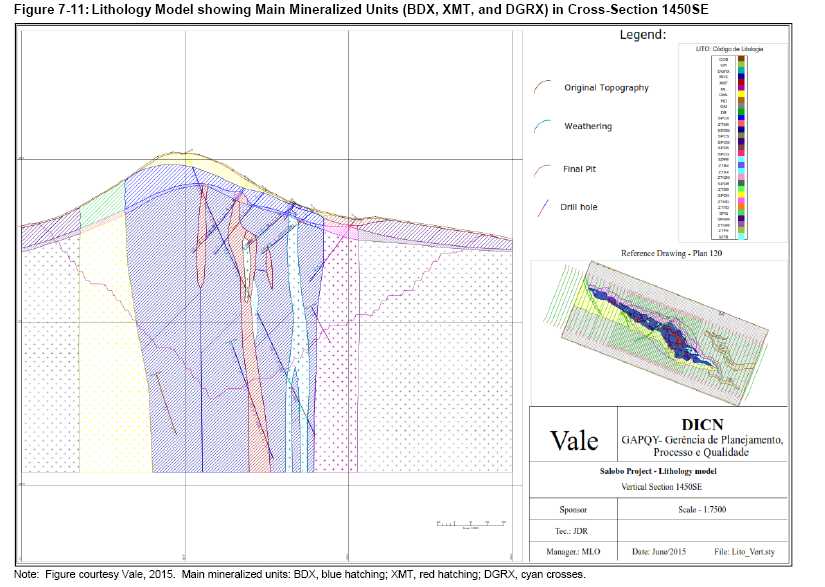
| March 2016 | Page 7-16 | |
| Project Number:179678 |
|
|
Salobo Operations Para State, Brazil NI 43-101 Technical Report |

| March 2016 | Page 7-17 | |
| Project Number:179678 |
|
|
Salobo Operations Para State, Brazil NI 43-101 Technical Report |
| 7.4 |
Comments on Section 7 |
In the opinion of the QPs, the knowledge of the deposit settings, lithologies, mineralization style and setting, ore controls, and structural and alteration controls on mineralization is sufficient to support Mineral Resource and Mineral Reserve estimation.
| March 2016 | Page 7-18 | |
| Project Number:179678 |
|
|
Salobo Operations Para State, Brazil NI 43-101 Technical Report |
| 8.0 |
DEPOSIT TYPES |
The Salobo deposit is considered to be an example of an IOCG deposit. Global examples include Olympic Dam in Australia, Candelaria–Punta del Cobre in Chile, and Sossego in Brazil.
The following general description of IOCG deposits is based on Williams et al. (2005). IOCG deposits as a group generally have the following characteristics:
| • | Copper ± gold, as the main elements of economic interest | |
| • | Hydrothermal mineralization styles | |
| • | Strong structural controls | |
| • | Abundant magnetite ± hematite | |
| • | Iron oxides with the iron:titanium ratio greater than those found in most igneous rocks or the bulk crust | |
| • | No obvious spatial association with igneous intrusions, whereas porphyry and skarn deposits do show such associations. |
IOCG deposits typically display the following:
| • |
Space–time association with Kiruna-type apatite-bearing iron oxide ores | |
|
| ||
| • |
Space–time association with granite batholiths | |
|
| ||
| • |
Occur in crustal settings that commonly display extensive and pervasive alkali metasomatism | |
| • |
Unusual minor element suite, including combinations of fluorine, phosphorus, cobalt, nickel, arsenic, molybdenum, silver, barium, lighter rare earth elements (LREE), and uranium | |
| • |
Wide age range from Archean to Jurassic–Cretaceous | |
|
| ||
| • |
Wide range of host rock settings, the most common of which include plutonic granitoids, volcanic and metavolcanic rocks, siliclastic–metabasic rocks and their metamorphic equivalents | |
| • |
Host rocks may be similar in age to the mineralization, or there may be a significant age gap such that host rocks predate mineralization and ore formation relates to a different geological event | |
| • |
Mineralization occurs over a wide depth range, from close to the surface to nearly 10 km depth |
| March 2016 | Page 8-1 | |
| Project Number:179678 |
|
|
Salobo Operations Para State, Brazil NI 43-101 Technical Report |
| • | Structural and stratigraphic controls are important; deposits frequently are located on fault bends and intersections, shear zones, rock contacts, breccia bodies. They can also occur as lithology-controlled replacements | |
| • | Can display strongly zoned mineral paragenesis | |
| • | Intense hydrothermal alteration is common | |
| • | Variable pressure and temperature conditions associated with alteration and mineralization can result in a deposit continuum. |
| − | Iron mineral is dominantly magnetite and biotite, K-feldspar and amphibole are the dominant alteration minerals | |
| − | Iron mineral is dominantly hematite, and sericite and chlorite are the dominant alteration minerals | |
| − | Where present, sodium and sodium–calcium alteration is more distal from the ore, is more extensive than potassium–iron alteration and pre-dates that event. |
Figure 8-1 is a schematic illustration of an IOCG deposit.
The subset of IOCG deposits found in the Carajás District display the following:
| • | Intense iron metasomatism leading to the formation of fayalite, grunerite, and/or iron oxides (magnetite and/or hematite) | |
| • | Extensive carbonate alteration (mainly siderite), at least in the lower temperature deposits | |
| • | Iron-rich sediments associated with quartzite and gneisses | |
| • | Amphibolite facies metamorphism | |
| • | Massive, foliated and banded rocks with predominant magnetite, fayalite, grunerite, almandine and subordinate biotite | |
| • | Hydrothermal alteration with areas affected by intense iron and potash metasomatism hosting most of the iron oxide copper–gold ore | |
| • | Sulphur-deficient nature of the ore sulphides (chalcopyrite, bornite, and primary chalcocite). |
| March 2016 | Page 8-2 | |
| Project Number:179678 |
|
|
Salobo Operations Para State, Brazil NI 43-101 Technical Report |

| • | Quartz-deficient nature of the gangue | |
| • | Extremely low rare earth element (REE) enrichment | |
| • | Enrichment in uranium and cobalt. |
| 8.1 |
Comments on Section 8 |
Genesis of the Carajás District deposits has been controversial, with a number of differing origins suggested, from porphyry copper styles to IOCG. The recent consensus within academia is that the deposits are best classified as examples of the IOCG style.
Mineralization in IOCG deposits typically has significant lateral extents and the associated zoned alteration patterns are diagnostic and extensive. Targeting of these regional systems typically uses a combination of remote predictive mapping, alteration mapping, geochemistry, and IOCG-type indicator mineral signatures.
The IOCG model is a valid model for exploration in the Salobo Operations area.
| March 2016 | Page 8-3 | |
| Project Number:179678 |
|
|
Salobo Operations Para State, Brazil NI 43-101 Technical Report |
| 9.0 |
EXPLORATION |
| 9.1 |
Exploration History |
The Salobo area has been the subject of exploration and development activities since 1977, and a considerable information database has developed as a result of both exploration and mining activities. The final exploration report (SMSA/CVRD, 2003a) has been the main source of information for this section of the Report. No exploration has been conducted outside the open pit area since 2003.
Table 9-1 summarizes the type of exploration work that has been completed (SMSA/CVRD, 2003a).
| 9.2 |
Grids and Surveys |
A topographic reference grid was established by ENGEVIX in 1978, and was later corrected by ESTEIO in 2003. Salobo surveyors use a local datum named P3201, which has a planimetric difference with the regular PSAD 56 (N: -9.7153 m; E: +2.8821) . The local elevations have a 0.6442 m difference relative to the IMBITUBA official datum.
During the 1997 campaign, surveying work was contracted to REDE and CONCREMAT. These companies used Wild T1 instruments for opening traverses and access to drill sites, and for determining the collar coordinates; total station instruments were used for other operations (preparing traverses and regular grids for geological mapping and geophysical surveys; De Souza and Vieira, 1998). Details on the pre-1997 surveying procedures were not available.
During the 2002–2003 campaign, the initial surveying work was conducted by SISTOP, a local contractor. Traverse lines were cut using the TOPCOM total station, and were referenced to two points (PB02 and AZPB02) that had been built by CONCREMAT, another surveying company, during the SMSA campaign. Preparation of an airborne topographic map, with 5 m contour lines, was contracted to ESTEIO in 2003.
| 9.3 |
Geological Mapping |
Geological mapping at different scales was conducted over the Project during the initial campaigns, usually following survey traverses. However, due to the fact that nearly 80% of the rocks in the Carajás regions are poorly exposed, most direct observations were made along access roads for drill sites, and were complemented with additional information such as interpretation of air-photo images, geophysical and geochemical maps, and correlation on surface of core logging data.
Current pit mapping is conducted twice a month. A geologist loads the long-term geologic map over the updated topographic map on a GPS, and establishes the actual position of the geological contacts in such points where access is possible.
| March 2016 | Page 9-1 | |
| Project Number:179678 |
|
|
Salobo Operations Para State, Brazil NI 43-101 Technical Report |
Table 9-1: Exploration Summary 1978–2003
| Activity | Details (unit) | Docegeo 1978 |
CVRD/GICOR
1986 |
SML 1993 |
SMSA 1997 |
CVRD/SMSA
2002–2003 |
Total |
| Surveying | Area (ha) | - | - | - | 3,091 | - | 3,091 |
| Lines (km) | 258.2 | 21.3 | - | 52.3 | - | 331.8 | |
| Geochemistry | Lines (km) | 3,230 | 138 | - | - | - | 3,368 |
| Samples | 3,433 | 2,616 | - | - | - | 6,049 | |
| Geophysics | I.P. (km) | 26.3 | 165.9 | - | - | 180.6 | 372.8 |
| Magnetometry (km) | 76.0 | 171.6 | - | 43.5 | 212.7 | 503.8 | |
| Scintillometry (km) | 52.3 | - | - | - | - | 52.3 | |
| TEM (loops) | 750 | 750 | |||||
| Gamma-spectrometry (km) | - | - | - | 26.3 | 214.5 | 240.8 | |
| Shafts | Amount | 18 | 23 | 6 | - | - | 47 |
| Length (m) | 54.0 | 377.2 | 93.5 | 524.7 | |||
| Adits | Amount | 2 | 1 | - | - | - | 3 |
| Length (km) | 450 | 950 | - | - | - | 1,400 | |
| Mapping | Lines (km) | 427.6 | 221.3 | 1.8 | 43.5 | - | 694.2 |
| 9.4 |
Geochemical Sampling |
Geochemical surveys were conducted by Docegeo and CVRD/GICOR during the initial exploration period (SMSA/CVRDa, 2003). However, none of the consulted historical reports provide details of the geochemical methods, sampling or results.
| 9.5 |
Geophysics |
Ground magnetometric (GM) and induced polarization (IP) surveys, using a 400 m x 40 m grid, were conducted by CVRD/GICOR in 1995. Various anomalies were identified at the Salobo and Mirim creeks and at the Planta Industrial sector. Detailed studies were conducted later on those anomalies during the 1997 campaign. Gamma-spectrometric (GS) and GM surveys on a 200 m x 20 m grid confirmed the mineralized nature of the sources. Additional details on the methods were not available.
Between July and December 2002, Fugro-Geomag S.A. (FugroG) conducted GS, GM, IP and ground transient electromagnetic (TEM) surveys in the Project area.
| 9.5.1 |
Gamma-Spectrometric Survey |
The GS survey used a GR-320 Envispec instrument with a 21 cubic-inch NaI sensor. Readings were always made 50 cm above ground level and with a 60 s integration time. Distance between reading points was 20 m. In total, 214.5 line km were surveyed with this method during the 2002–2003 campaign.
| March 2016 | Page 9-2 | |
| Project Number:179678 |
|
|
Salobo Operations Para State, Brazil NI 43-101 Technical Report |
As a result of the survey, the following maps were prepared: total count for potassium, uranium and thorium; equivalent potassium, uranium and thorium concentration; U:K, U:Th and Th:K ratios; and a ternary map (combining the U, Th and K channels; Figure 9-1).
| 9.5.2 |
Ground Magnetometric Survey |
The GM survey measured the total component of the magnetic field using two GSM-19 Overhauser (from GEM Systems) instruments, with 0.2 nT precision, 0.01 nT resolution, 20,000 nT to 120,000 nT dynamic range and over 10,000 nT/m tolerance.
One magnetometer was used as a mobile instrument, with readings spaced at 20 m intervals along traverses. The second magnetometer was used as a base station at a fixed location, and readings were made every 5 s. In both cases, sensors were placed 2 m above ground level. In total, 413 km of lines were surveyed during the 2002–2003 campaign with this method.
FugroG prepared contour maps of the total magnetic field, the vertical derivate and the analytical signal (a decomposition of the total magnetic field on the X, Y and Z axis; Figure 9-2).
| 9.5.3 |
IP Survey |
The IP survey used a time-domain IP system built by Iris Ltd., consisting of a VIP 4000 transmitter and a 20-channel ELREC-6 receptor, on a dipole-dipole array with 80 m electrode spacing. The receptor measured six electrodes simultaneously on 20 programmable chargeability windows, as well as potential differences used for calculating the apparent resistivity.
Chargeability measurements had 0.01 mV/V resolution and 0.6% precision, whereas resistivity measurements had 1 µV resolution and 0.3% precision. In total, 181 km of lines were surveyed during the 2002–2003 campaign with this method.
The results of the IP survey were presented in maps and pseudo-sections of chargeability, apparent resistivity, and metallic factor, calculated as a function of the chargeability:apparent resistivity ratio. Mineralized portions of the deposit are characterized by high chargeability values (Figure 9-3).
| March 2016 | Page 9-3 | |
| Project Number:179678 |
|
|
Salobo Operations Para State, Brazil NI 43-101 Technical Report |

| March 2016 | Page 9-4 | |
| Project Number:179678 |
|
|
Salobo Operations Para State, Brazil NI 43-101 Technical Report |

| March 2016 | Page 9-5 | |
| Project Number:179678 |
|
|
Salobo Operations Para State, Brazil NI 43-101 Technical Report |

| March 2016 | Page 9-6 | |
| Project Number:179678 |
|
|
Salobo Operations Para State, Brazil NI 43-101 Technical Report |
| 9.5.4 |
Ground Transient Electromagnetic Survey |
The ground TEM survey used a Geonics EM57 transmitter and a Geonics Protem receptor, with uniaxial coils for sequential readings of three components (X, Y and Z) on five frequencies: 0.3 Hz, 0.75 Hz, 3.0 Hz, 7.5 Hz and 30.0 Hz. In total, measurement on 750 loops were completed to cover the Project area.
The survey was interpreted in resistivity maps for five depth levels: 80 m, 120 m, 200 m, 300 m and 400 m. In addition, pseudo-sections were prepared for each measured line (Figure 9-4). Mineralized bodies were characterized by low apparent resistivity.
| 9.5.5 |
Airborne Gravity Survey |
A regional airborne gravity gradiometer survey was completed in 2012 over a portion of the Carajás Region, including the Salobo Operations area. It was designed to explore for new shallow copper–gold targets. The survey flight is typically at an altitude of 80 m or greater with a line spacing dependent on the target of investigation. The 2012 survey was flown on 100 and 200 m spaced lines.
The aero-gravity gradiometer method measures acceleration of gravity and gradients of the acceleration of gravity respectively. It is not a precise tool and is not robust below 500 m depth.
There are a number of viable interpretations of the gravity data, one of which is that there could be a vertical extension of the Salobo mineralization below the current planned open pit, as the geological data have already indicated. However, until drilled this depth extension is not certain. There are currently no drill holes in the area to substantiate or explain the anomaly, and a reconnaissance core drilling program is recommended.
Figure 9-5 shows the gravity gradiometer survey results in relation to the magnetic survey in the Salobo mine area. Figure 9-6 shows the gravity model, which has the current block model outline at a 0.5% Cu cutoff, superimposed.
| 9.6 |
Petrology, Mineralogy, and Research Studies |
Numerous research studies have been conducted over the years by Vale and third-party institutions on Salobo (e.g. Lindenmayer, 1990; Requia and Fontboté, 1999; Mesquita and Barbey, 2000; Tassinari et al., 2003; Monteiro et al., 2007; Matos de Costa, 2012).
| March 2016 | Page 9-7 | |
| Project Number:179678 |
|
|
Salobo Operations Para State, Brazil NI 43-101 Technical Report |

| March 2016 | Page 9-8 | |
| Project Number:179678 |
|
|
Salobo Operations Para State, Brazil NI 43-101 Technical Report |

| March 2016 | Page 9-9 | |
| Project Number:179678 |
|
|
Salobo Operations Para State, Brazil NI 43-101 Technical Report |
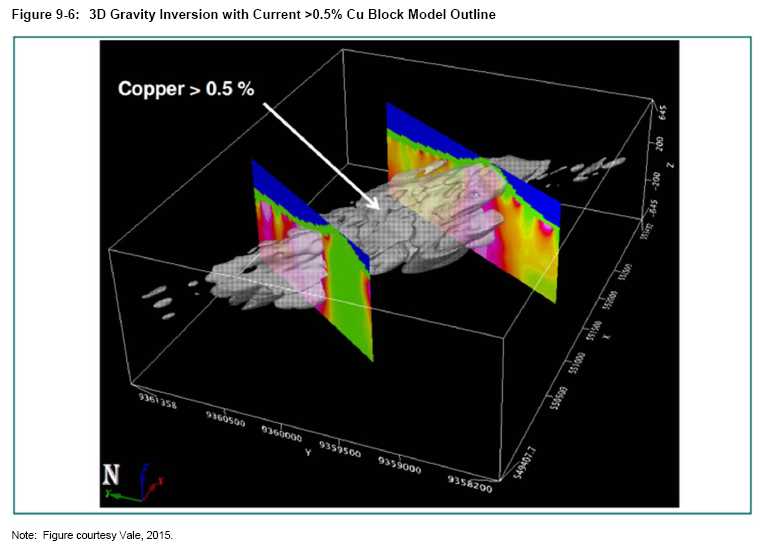
| March 2016
Project Number:179678 |
Page 9-10 |
|
|
Salobo Operations Para State, Brazil NI 43-101 Technical Report |
Between November 2002 and June 2003, CVRD conducted a petrographic and mineralogical characterization of the Salobo mineralized sequences for which 44 samples were collected from six representative sections. The study also addressed the evaluation of liberation sizes of copper sulphides and magnetite, and provided information on fluorine-, chlorine- and uranium-bearing minerals. Other mineralogical studies were focused on the plant-feed ore and the flotation concentrates (Fonseca, 2002; GGDT, 2004).
The structural interpretation and tectonic modeling of the deposit was conducted by Roberto Vizeu, from the University of Pará. The study concluded that the mineral deposit resulted from the intense hydrothermal alteration of the supracrustal Archean rocks, where relict mylonitic fabric favoured the circulation of hydrothermal fluids.
| 9.7 |
Exploration Potential |
The Salobo mineralization is limited in strike extent, but remains open at depth below the current pit (refer to Figure 7-10 and Figure 7-11).
| 9.8 |
Comments on Section 9 |
Comprehensive geophysical surveys were conducted in the area during the exploration stage. Ground magnetics, IP and TEM surveys suitably outline mineralization to guide drilling. The methods used were adequate for this particular type of deposit, and the results were instrumental in properly outlining the extent of the mineralized bodies and defining the drilling targets.
No details were available for the geochemical methods used during the initial exploration programs.
The Salobo deposit has been the subject of numerous petrological and mineralogical research studies, which has resulted in a reasonable understanding of the deposit genesis and geology.
The Salobo mineralization is limited in strike extent, but remains open at depth below the current pit.
| March 2016
Project Number:179678 |
Page 9-11 |
|
Salobo Operations Para State, Brazil NI 43-101 Technical Report |
| 10.0 |
DRILLING |
Details of the drilling, logging and sampling methods are primarily based on descriptions by De Souza and Vieira (1998) and CVRD/SMSA (2003b).
Core drilling commenced in 1978 and was conducted through to 2003 in five different drilling campaigns. Most drill holes were vertical or oriented to the south–southwest, the latter with dips usually ranging from 60° to 70°. However, one campaign included holes with a north–northwest orientation and similar dips. Various holes were also drilled from an adit. No core drilling has occurred since 2003.
Table 10-1 summarizes the drilling campaigns completed on the Project. Drill-collar locations are displayed in Figure 10-1.
| 10.1 |
Drill Methods |
The surface drilling was initiated with a diameter of HQ (63.5 mm core diameter) and usually continued with NQ diameter (47.6 mm). The minimum diameters were BX (36.6 mm) and BQ (36.5 mm). The underground drilling was carried throughout with BX diameter rods.
The drilling system included traditional and wireline methods.
Core makes up the majority sample type for geological modelling and Mineral Resource estimation at Salobo. Blastholes have been drilled since 2009; however, are only used for short-term mine planning purposes.
| 10.2 |
Geological Logging |
| 10.2.1 |
Legacy |
No written details on the logging procedures in place prior to the 1997 campaign were available to Amec Foster Wheeler.
| 10.2.2 |
SMSA (1997) |
During the 1997 campaign, core was collected in 1 m wooden boxes, and photographed in sets of two boxes each after transportation to the core shack. Logging was completed after sampling, and consisted of describing each individual lithologic package, as well as mineralogical variations within each one, the textures and structures, the ore minerals (including a visual assessment of volume percentage), the presence of deleterious minerals (mainly fluorite), the visible structures and the foliation angle with respect to the core axis. This information was recorded in drill-hole cards.
| March 2016
Project Number:179678 |
Page 10-1 | |
|
Salobo Operations Para State, Brazil NI 43-101 Technical Report |
| Table 10-1: | Drill Hole Summary Table |
| Total | |||||
| Meterage | Percentage of | ||||
| Campaign/Period | Purpose | Drill Hole ID | Drilled | Total Exploration Drilling | |
| (m) | (%) | ||||
| 1978 | Exploration | SAL-2ALF-FD001 to SAL-3ALF-FD 065 |
29,275 | 20 | |
| 1986 | Exploration | SAL-SALF-FD066 to SAL-3ALF-FD 125 |
9,033 | 6 | |
| 1993 | Exploration | SAL-3ALF-FD126 to SAL-3ALF-FD 189 |
14,585 | 10 | |
| 1997 | Exploration | SAL-3ALF-FD190 to SAL-3ALF-FD 277 |
25,491 | 17 | |
| 2002 | Exploration | SAL-3ALF-FD278 to SAL-3ALF-FD 410 |
66,243 | 45 | |
| 2003 | Exploration | SAL-3ALF-FD411 to SAL-3ALF-FD 416 |
2,047 | 1 | |
| Total exploration | 416 | 146,674 | |||
| 1997 | Geotechnical | SAL-3ALF-FG001 to SAL-3ALF-FG 007 |
3,847 | ||
| 2003 | Geotechnical | SAL-3ALF-FG008 to SAL-3ALF-FG 013 |
3,743 | ||
| 2004 | Geotechnical | SAL-3ALF-FG014 | |||
| Total geotechnical | 14 | 7,590 | |||
| Total drilling | 154,264 |
Note: Drill hole SAL-3ALF-FG014 was drilled for geotechnical purposes only, and was not sampled.
| March 2016
Project Number:179678 |
Page 10-2 | |
|
Salobo Operations Para State, Brazil NI 43-101 Technical Report |

| March 2016
Project Number:179678 |
Page 10-3 | |
|
Salobo Operations Para State, Brazil NI 43-101 Technical Report |
As part of the logging procedure, magnetic susceptibility was measured using Scintrex K2 and KT5C kappameters, with readings every 20 cm. This information was recorded in paper format (De Souza and Vieira, 1998).
In some of the early campaigns, uranium, thorium and potassium were directly determined in core using an Exploratium GR-320 gamma-spectrometer; however, this method was soon discarded. During the 2002–2003 campaign, uranium was chemically determined on 2 m intervals, which allowed this deleterious element to be modelled during Mineral Resource estimation.
Geotechnical logging of geological drill holes was conducted by geologists following the guidance of geotechnical engineers. Logging included simple descriptions of the weathered zones and the weathering and fracturing degrees of the mineralized schists, as well as visual determination of the rock-quality designation (RQD) and rock resistance, and descriptions of the fracture types. Point-load tests (PLT) were also conducted every 20 m.
Seven oriented holes, drilled mainly with geotechnical purposes, were logged in greater detail, including measurements of fracture and schistosity orientations, and characterization of fracture fill.
| 10.2.3 |
SMSA/CVRD (2002–2003) |
Core reception, handling and logging followed CVRD’s customary operational procedures. The diamond drill core was collected, placed in 1 m wooden boxes, and delivered by the drilling contractor to the core logging/storage area, where geological and geotechnical logging was carried out. The wooden core boxes were marked with wood blocks and metal plates. Before logging, all of the core boxes were photographed.
At the core logging facility, core recovery and physical properties were measured and recorded by Vale technicians and geologists.
Logging was carried out by Vale geologists using customized log sheets. The geologists recorded the major code for lithology, alteration, mineralization, and textural characteristic of each 1 m interval, with 10 cm as the definition unit. Geological contacts were logged with higher precision.
In addition to a general description including core recovery, colour, texture, mineralogy, and rock type, geologists also specified mineralized intervals and estimated the Cu grade for later comparison and assay data validation. All the logging information was then entered into the electronic database.
Geotechnical logging (and sampling) was performed at Salobo on a continual basis and included the determination of RQD. Additional information recorded has included degree of weathering, alteration intensity and geotechnical resistance. The geotechnical logging results were stored in the GEM drill-hole database.
| March 2016
Project Number:179678 |
Page 10-4 | |
|
Salobo Operations Para State, Brazil NI 43-101 Technical Report |
| 10.3 |
Recovery |
Micon (2013) noted that core recoveries of 80% in weathered rock and 90% in fresh rock were achieved by the drilling companies during the campaigns. The average core recovery of the 2002 campaign (drill holes SAL-3ALF-FD 278 to 410) was 97.6% .
Amec Foster Wheeler reviewed the recovery data for holes where the information was recorded and the data support Micon’s assessment of overall good recoveries.
| 10.4 |
Collar Surveys |
During the 1997 campaign, drill-hole collars were placed and resurveyed after completion using WILD T1 stations (refer to Section 9.1) .
During the 2002–2003 campaign, drill sites were placed and collar coordinates measured using total station equipment (before and after hole completion). The survey team also oriented the drill rigs, and provided proper initial alignment and inclination to the drilling rods. Collar verification was completed by plotting drill hole locations on plan and in cross-section and comparing with the topographic surface.
Current collar surveying of grade-control holes is conducted by company surveyors using high-precision, differential GPS equipment.
| 10.5 |
Downhole Surveys |
No written details on the down-hole survey procedure in place prior to the 1997 campaign were available to Amec Foster Wheeler.
During the 1997 campaign, down-hole survey readings taken on average every 3 m were conducted using the Reflex DDI (dip and direction pointer) and Maxibor units, to prevent errors in azimuth readings due to the influence of magnetite in the host rocks.
During the 2002–2003 campaign, down-hole survey measurements were conducted every 3 m using Reflex Maxibor and gyroscopic instruments.
| 10.6 |
Geotechnical and Hydrological Drilling |
Geotechnical drilling was conducted during the 1997, 2002–2003 and 2004 campaigns. Fourteen holes totaling 15,180 m were drilled. Figure 10-2 shows the location of the 13 geotechnical holes drilled during the 1997 and 2002–2003 campaigns.
| 10.7 |
Metallurgical Drilling |
Various large-diameter metallurgical holes were drilled in the Project area; however, no detailed information was available to Amec Foster Wheeler.
| March 2016
Project Number:179678 |
Page 10-5 |
|
Salobo Operations Para State, Brazil NI 43-101 Technical Report |
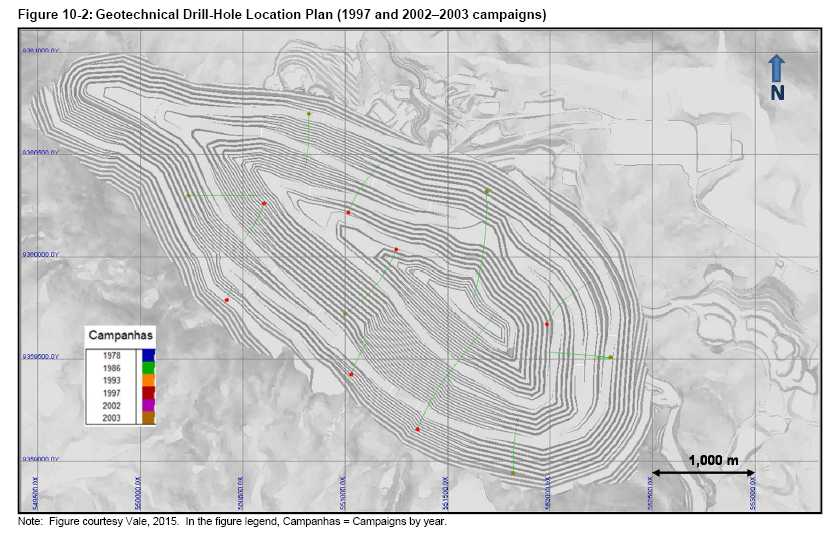
| March 2016
Project Number:179678 |
Page 10-6 |
|
Salobo Operations Para State, Brazil NI 43-101 Technical Report |
| 10.8 |
Sample Length/True Thickness |
Due to the subvertical disposition of the mineralized zones, the drill holes intersected them at low angles. As a result the mineralized thickness observed in drill holes does not correspond to the true thickness, which should be determined on a case-by-case basis. The true thickness is significantly smaller than the intersected thickness in most cases.
| 10.9 |
Comments on Section 10 |
In the opinion of the QPs, the quantity and quality of the lithological, geotechnical, collar and downhole survey data collected in the exploration and infill drill programs during the 1997 and later campaigns are sufficient to support Mineral Resource and Mineral Reserve estimation as follows:
| • |
Core logging meets industry standards for this type of deposit | |
| • |
Collar surveys have been performed using industry-standard instrumentation | |
| • |
Down-hole surveys were performed using industry-standard instrumentation | |
| • |
Recovery data from core drill programs are acceptable | |
| • |
Geotechnical logging of drill core meets industry standards for planned open pit operations | |
|
| ||
| • |
Drill orientations are appropriate for the mineralization style, and have been drilled at orientations that are acceptable for the orientation of mineralization for the bulk of the deposit area | |
|
| ||
| • |
Drill dips are oblique to the mineralized bodies; however, are considered reasonable for surface drilling on these conditions. The intersected thickness differs from true thickness which is usually significantly smaller | |
|
| ||
| • |
Drill orientations are shown in the example cross-sections included in Section 7, and can be seen to appropriately test the mineralization | |
|
| ||
| • |
No material defects were identified with the drill data collection from the 1997 and 2002–2003 drill programs that could affect Mineral Resource or Mineral Reserve estimation. |
| March 2016
Project Number:179678 |
Page 10-7 |
|
Salobo Operations Para State, Brazil NI 43-101 Technical Report |
| 11.0 |
SAMPLE PREPARATION, ANALYSES, AND SECURITY |
| 11.1 |
Sampling Methods |
| 11.1.1 |
Drill Core |
The core sampling procedure was similar during the 1997 and 2002–2003 campaigns. Sample intervals averaged 1 m in mineralized zones, and between 2 m and 4 m in barren zones. Sample lengths may vary depending on geological and lithological / structural criteria (such as geologic boundaries, lithological/mineralogical changes, and faults and shear zones).
Core was cut in half using diamond saws. One half was bagged and submitted to the mine laboratory for analysis, and the remaining half was retained as backup in the same original boxes.
| 11.1.2 |
Grade-Control Sampling |
Blastholes are currently drilled on a 5 m x 5 m or 5 m x 7 m grid. The blast-hole diameter is 12¼ inches. All blastholes located in ore zones are sampled; however, as the blasthole reaches the barren zones, the proportion of sampled holes decreases (one in two or even less), and the grade-control geologist determines which waste blastholes are sampled to ensure mineralization matches the interpretation in the geological model. This may reduce the confidence in definition of ore / waste contacts.
The sampling pattern depends on the shape of the cone. If it is well formed, then four channels are cut across the cone at 90° (Figure 11-1) using a small mattock, and the sample is collected using a jar from bottom to top of the inner channel wall (Figure 11-2).
If the cone has been partially damaged, then three channels are cut; however, if it is seriously damaged then the cone is not sampled. The average sample weight is 2 kg.
| 11.2 |
Metallurgical Sampling |
During the 2002–2003 campaign, four types of metallurgical samples were collected from core:
| • |
Samples for mini-pilot plant (MPP) on points representative of the northwest and south portions of the deposit within the five-year pit | |
| • | Samples for locked-cycle tests (LCT) on 6 m core intervals | |
| • | Samples for rougher flotation tests on 2 m core intervals | |
| • | Samples for ball-mill work-index (WI) tests on 2 m core intervals. |
| March 2016
Project Number:179678 |
Page 11-1 | |
|
Salobo Operations Para State, Brazil NI 43-101 Technical Report |
![]()
The sample locations were defined following specific vertical levels (every 100 m).
From February 2015, Vale has been implementing a geometallurgical modeling program. A ROK 18 drill rig is used for metallurgical sampling. This rig is provided with a 6½″ drilling tool. Samples weighing on average 25 kg are collected on a 15 m x 15 m grid whenever logistically possible, by channel sampling the detritus cone. A twin sample is collected every 10 samples.
A special laboratory has been setup for conducting geometallurgical tests. Samples are initially sieved to 1 mm and the retained fraction is homogenized and split in eight subsamples. One is submitted to X-ray diffraction (XRD) analysis to determine the
| March 2016
Project Number:179678 |
Page 11-2 |
|
Salobo Operations Para State, Brazil NI 43-101 Technical Report |
| mineralogical composition, a second is assayed for copper, soluble copper (CuSol), silver, iron, gold, fluorine, chlorine and sulphur, and the remaining subsamples are used for grindability and flotation tests. This information will be used for correcting the geological map, and for improving the short-term model. Preliminary results indicate that recoveries in the XMT unit are improved. | |
| 11.3 |
Bulk Density and Specific Gravity Determinations |
During the 1997 campaign, bulk density determinations were made with the water-displacement method. Tests were conducted on 20 cm to 40 cm long saprolite and bedrock core samples within intervals of approximately 10 m length.
Wet and dry bulk densities were determined on saprolite samples, which were weighed in air prior to and after drying (respectively), then coated with a thin plastic film, and submerged in water in a PVC recipient with a discharge opening. The sample volume was determined by measuring the water displaced through the discharge into a graduated cylinder. Core samples were assumed to be dried, so only dry density was determined. The bulk density (D) was determined as D = P/V, where P is the dry (or wet) weight, and V is the volume of displaced water.
During the 2002–2003 campaign, the specific gravity (SG) was determined on representative fragments from all sampling intervals using a standard procedure. Hard-rock samples were cleaned and dried in air, and then weighed in air and in water. Saprolite samples were dried using an oven, then coated with paraffin prior to submerging them in water.
SG was then estimated as follows:
SG = xA / (xA – xW)
Where:
xA = weight of core in air
xW = weight of core completely submerged in water
At Salobo, SG was measured on approximately 79,000 samples collected across the entire deposit (Table 11-1). Values for weathered waste rock and unweathered bedrock were categorized separately due to differences in permeability and porosity caused by weathering.
| 11.4 |
Analytical and Test Laboratories |
The main laboratories used for sample analysis during Project exploration and delineation phases (1978 to 2003) are included in Table 11-2. Amec Foster Wheeler has no information on the type of accreditation of the laboratories used during those exploration campaigns.
| March 2016
Project Number:179678 |
Page 11-3 |
|
Salobo Operations Para State, Brazil NI 43-101 Technical Report |
| Table 11-1: | Specific Gravity Determinations |
| Rock Type/Unit | Lithology | Number of | Average |
| Code | Samples | SG | |
| Cover | COB | 31 | 2.09 |
| Biotite schist | BDX | 36,930 | 3.28 |
| Diabase | DB | 1,319 | 2.99 |
| Garnet–grunerite schist | DGRX | 5,979 | 3.47 |
| Granitoid | GM | 2,162 | 2.75 |
| Rhyolite | RIO | 4 | 2.80 |
| Granite | GR | 134 | 2.72 |
| Hydrothermalite | HD | 3,571 | 2.98 |
| Chlorite schist | CX | 44 | 2.95 |
| Mylonite | ML | 5,826 | 2.90 |
| Metabasic | MTB | 286 | 3.04 |
| Quartz mylonite | QML | 3,711 | 2.86 |
| Quartzite | QZ | 29 | 2.66 |
| Magnetic schist | XMT | 12,041 | 3.75 |
| Saprolite | SP | 4,876 | 2.34 |
| Semi-weathered rock | ZT | 2,303 | 3.00 |
| 79,245 |
| Table 11-2: | Summary of Primary Laboratories Used for Assaying During Exploration Phase and Main Analysis Methods |
| Campaign | Number of Samples |
Cu | Au | |||
| Cu | Au | Laboratory | Method | Laboratory | Method | |
| Docegeo (1978–1981) |
28,582 | 28,582 | Docegeo, SUTEC | 0.5
g AAS, multi-acid digestion |
Docegeo, SUTEC | 10 g AR- MIBX-AAS |
| CVRD (1985–1987) |
8,890 | 8,890 | Docegeo, Salobo Pilot Plant |
0.5 g AAS, multi-acid digestion |
Docegeo, Salobo Pilot Plant |
10 g AR- MIBX-AAS |
| SML (1993–1994) |
13,281 | 13,281 | Mineração Morro Velho |
0.5 g AAS, multi-acid digestion |
Mineração Morro Velho |
100 g FA-GF |
| SMSA (1997) |
24,824 | 24,824 | Mineração Morro Velho |
0.5 g AAS, multi-acid digestion |
Mineração Morro Velho |
100 g FA-AAS |
| CVRD (2002–2003) |
37,358 | 37,358 | Lakefield Geosol | 0.5
g AAS, multi-acid digestion |
Lakefield Geosol | 20 g FA-AAS |
| Total | 112,935 | 112,935 |
Note: AAS: atomic absorption spectrographic determination; AR-MIBX: aqua regia leaching and MIBX collection; FA: fire assay; WF: gravimetric finish; AASM – atomic absorption; fire assay 20 g.
| March 2016
Project Number:179678 |
Page 11-4 |
|
Salobo Operations Para State, Brazil NI 43-101 Technical Report |
During the 2002–2003 campaign, Lakefield Geosol was used for the routine analysis of copper, gold, and silver, while Acme analyzed for molybdenum, uranium, fluorine, sulphur, and carbon. Vale’s Gamik laboratory was used as a secondary laboratory to check the results obtained from the primary laboratories. Amec Foster Wheeler does not have information about the type of official certification of these laboratories at that time; however, can confirm that they were, and still are, well-known and respected laboratories.
The Salobo mine laboratory, currently used for assaying the blast-hole samples, has current ISO 9001, 14001 and 18001 certification.
| 11.5 |
Sample Preparation and Analysis |
| 11.5.1 |
Legacy |
No details were available to Amec Foster Wheeler on sample-preparation procedures during the pre-2002 campaigns.
During the 1978 campaign, samples were assayed at the Docegeo laboratory in Belém, Pará, and at the SUTEC laboratory in Santa Luzia, Minas Gerais. Copper was assayed on 0.5 g aliquots by multi-acid digestion and atomic absorption spectroscopy (AAS). Iron, molybdenum, and silver were also determined using this method. Gold was assayed by aqua regia leaching, with solvent extraction (MIBX) and AAS determination.
During the 1986 campaign, CVRD assayed the samples at the Docegeo laboratory in Belém and at the pilot plant laboratory on the mine site, using the same analytical methods as in the previous campaign.
During the 1993 campaign, SML used the Mineração Morro Velho (MMV) laboratory. Copper was again assayed with multi-acid digestion and AAS reading on 0.5 g aliquots (0.002% detection limit), and gold was determined using the fire-assay method with gravimetric finish on 100 g aliquots (0.05 g/t detection limit). In addition, samples were assayed for sulphur and carbon by LECO, and fluorine by alkaline fusion with sodium carbonate and potassium nitrate, followed by ion-selective electrode determination. SMSA used the same analytical procedures during the 1997 campaign.
In the early stages of the exploration program platinum, palladium, nickel, molybdenum and uranium were also analyzed; however, these elements were later excluded from the analytical package.
| 11.5.2 |
CVRD (2002–2003) |
Sample preparation was conducted by Lakefield/Geosol laboratory at a local facility built at the Project site, and consisted of the steps outlined in Figure 11-3.
| March 2016
Project Number:179678 |
Page 11-5 |
|
Salobo Operations Para State, Brazil NI 43-101 Technical Report |
![]()
Samples were later assayed at Lakefield Geosol for gold (FA on 20 g aliquots with AAS finish), copper, silver and fluorine (multi-acid digestion on 0.5 g aliquots and AAS determination). Samples were also assayed by ACME for other elements. Routine chemical analysis was by atomic absorption spectrometry (AAS) for copper, silver and fluorine (on a 0.5 g aliquots and multi-acid digestion), while gold was assayed by FA with AAS finish on 20 g aliquots. Sample rejects are currently kept stored at the mine core shack.
| 11.5.3 |
Grade Control Samples |
Blast-hole samples are prepared and assayed at the Salobo laboratory. Amec Foster Wheeler visited the Salobo laboratory and reviewed the sample preparation and assay procedures.
| March 2016
Project Number:179678 |
Page 11-6 |
|
Salobo Operations Para State, Brazil NI 43-101 Technical Report |
The laboratory has independent areas for preparation of tailing, blast-hole and concentrate samples to avoid contamination. The preparation procedure implemented for blast-hole samples is as follows:
| • |
Drying in an electric oven at 105°C | |
|
| ||
| • |
Jaw-crushing to better than 95% passing -3 mm size; granulometric tests are carried to check particle size on one in 20 samples | |
|
| ||
| • |
Homogenization and splitting using rotary splitters to obtain 500 g splits | |
|
| ||
| • |
Pulverization using puck-and-bowl pulverizers to better than 95% passing -0.105 mm; granulometric and mass-loss checks are carried out on one in 20 samples on 100 g subsamples that are later discarded | |
|
| ||
| • |
The pulverized material is bagged and submitted for chemical assay. |
Blast-hole samples are assayed at the Salobo laboratory for copper, gold, iron, and sulphur. If directed by the geologists, samples from the weathered zone are also assayed for copper-soluble in acetic acid (CuSol). Samples located in a wider grid (1:4), and selected at the end of the month to be used in the short-term model, are assayed for silver, carbon, fluorine and chlorine (assay details are presented in Table 11-3).
The laboratory is well organized (Figure 11-4), and has modern equipment for preparation and analysis, including ESSA jaw crushers, rotary splitters and puck-and-bowl pulverizers, AAnalyst 400 Perkin Elmer AA spectrometers, CS230SH LECO instruments, Mettler-Toledo precision scales and ion-selective electrode instruments (Figure 11-5). A special, separated, scale room is used only for gold assays. The dust-extraction system is efficient and well designed.
Precision scales are certified once a year by a recognized organization (the last certification had been in November 2014). At the time of the QP site visit in 2015, the laboratory was planning to implement a daily verification program using certified weights. The most used laboratory-quality reagents are supplied by Anidrol, a Brazilian producer.
Fire assay crucibles are reused up to five times, with the laboratory keeping record of the samples assayed with each crucible. Crucibles are classified according to the Au grades of the samples assayed so that crucibles used on high-grade samples are not reused for low-grade samples (the geologists declare in advance if the samples are expected to yield low or high grades).
| March 2016
Project Number:179678 |
Page 11-7 |
|
Salobo Operations Para State, Brazil NI 43-101 Technical Report |
| Table 11-3: | Analytical Package used for Blast-Hole Samples |
| Element (Unit) | Aliquot (g) | Method | Detection Limit | Qualification Limit |
| Cu (%) | 0.25 | ARD-AAS | 0.005 | 0.012 |
| Au (g/t) | 30 | FA-AAS | 0.023 | 0.063 |
| Ag /g/t) | 10 | MAD-AAS | 0.078 | 0.202 |
| Fe (%) | 0.25 | ARD-AAS | 0.003 | 0.008 |
| C (%) | 0.5 | LECO | 0.003 | 0.010 |
| S (%) | 0.5 | LECO | 0.001 | 0.003 |
| F | NA | AF-ISE | NA | NA |
| Cl | NA | SAL-SNT | NA | NA |
| CuSol (%) | 1 | AcAL | 0.001 | 0.003 |
Note: ARD: aqua-regia digestion; AAS: atomic absorption spectrometry; FA: fire assay; MAD: multi-acid digestion; AcAL: acetic acid leach; AS-ISE: boric-acid/sodium-carbonate fusion and ion-selective electrode determination; SAL-SNT: sulphuric acid leach and silver-nitrate titration; NA: not available; CuSol – acid soluble copper.
![]()
| March 2016
Project Number:179678 |
Page 11-8 |
|
Salobo Operations Para State, Brazil NI 43-101 Technical Report |

All precision scales and assay instruments are linked to the Knowledge Management (KM) laboratory information management system (LIMS) to ensure the assay data are digitally transferred into the mine database. The KM LIMS is programmed to determine when readings comply with the required quality-control thresholds. Duly-authorized geologists may have access to the KM LIMS to obtain the assay data. The turnaround time is usually less than 24 hours for most elements, and four to five days for fluorine and chlorine.
Coarse and pulp rejects are stored for an unspecified time, after which they are discarded, unless requested by the geologists (which is not customary).
Assay batches are usually organized in 25 samples, not including the internal control samples. The quality control (QC) protocol includes the insertion of one reference material, one reactive blank (consisting of pure solution or flux in the case of FA), one coarse duplicate, and one pulp duplicate per batch.
The reference material (RM) was prepared by the laboratory, and has not been documented through a formal round-robin test. Although regularly checked against a certified RM (PIASAL15, with 0.861% Cu), the internal RM cannot be considered as such; however, the laboratory participates in a proficiency test with another 13 national and international laboratories four times per year. This test consists of assaying two blind samples, which are supplied in five aliquots each. The Salobo laboratory has
| March 2016
Project Number:179678 |
Page 11-9 |
|
Salobo Operations Para State, Brazil NI 43-101 Technical Report |
| obtained excellent results (|Z| score less than one) for copper on 83% of the tests, and for gold on 75% of the tests. | |
| 11.6 |
Quality Assurance and Quality Control |
The quality control program implemented at the Salobo Operations varied considerably over time, depending on the primary analytical laboratory used for assaying.
| 11.6.1 |
Legacy |
During the 1986 campaign, 402 samples were resubmitted to alternative laboratories for external checks as follows:
| • |
Geosol acted as secondary laboratory for the Docegeo laboratory for copper and gold assays | |
|
| ||
| • |
The pilot plant laboratory acted as secondary laboratory for Docegeo on copper assays | |
|
| ||
| • |
Docegeo acted as secondary laboratory for the pilot plant laboratory for gold assays. |
Results on Cu assays indicated good correlation between the three laboratories; however, poor correlation was obtained between Geosol and Docegeo on the gold assays.
During the 1993 campaign, the QC program included external checks of 5% of the samples at the Nomos laboratory (for Cu) and at Fazenda Brasileira (for Au), using the FA method. In total, copper checks were conducted on 664 samples, and gold checks on 2,168 samples. For both elements, the correlation between laboratories was assessed as good.
During 1997, SMSA implemented a QC program consisting of the insertion of 574 coarse duplicates and 14 reference materials, and the submission of 750 check samples to the Label laboratory for external checks.
Amec Foster Wheeler did not have access to the data; however, De Souza and Vieira (1998) concluded that the duplicates indicated good reproducibility. However, De Souza and Vieira (1998) did not comment on any results from other checks that may have been conducted.
Initially, Salobo Operations assigned the responsibility on the insertion of QC samples (standards, blanks and duplicates) to the laboratory. Due to the lack of appropriate QC results for the drilling campaigns prior to 2002, a re-assay campaign was initiated to validate the available analytical data.
| March 2016
Project Number:179678 |
Page 11-10 |
|
Salobo Operations Para State, Brazil NI 43-101 Technical Report |
Consequently, in the absence of robust QC data, and in an attempt to validate the results related to campaigns before 2002, a total of 51,768 of the original 75,577 samples drilled prior to 2002 were re-assayed to corroborate the original results.
The re-analysis considered pulps and coarse rejects material whenever possible; however, they are not identified separately as repeats or duplicates in order to evaluate precision and sample preparation respectively. Vale concluded that the external assay check review revealed bias for copper and gold assay results obtained by Nomos and Gamik laboratories. Based on the results obtained, Vale applied an adjustment factor to original sample grades (Table 11-4 and Table 11-5).
In-house RM samples used at Salobo during the 2002–2003 campaign (a total of nine) were derived from both the sulphide and oxide mineralization and incorporate a significant spread in the copper and gold grades. The recommended values for RMs were established from a set of analytical results provided by three laboratories (the former Bondar Clegg laboratory, Gamik and Lakefield/Geosol). Each laboratory analyzed 10 aliquots of each RM.
Two internal RM samples were also prepared; however, they became available only at the end of the drilling program. As a result, a total of 1,500 samples from the 2002–2003 drilling program were selected for re-assaying (‘lote especial’) in order to validate the 2002–2003 assay data. A total of 76 samples of Project-derived RMs were randomly inserted in the lot (5% frequency).
Amec Foster Wheeler reviewed the lote especial QC data reported by CVRD (2003), and concluded that Cu and Au check assays did not reveal significant biases, and that precision was within acceptable limits. Blanks did not show significant contamination during preparation. Bongarcon (2003) also reviewed the 2002–2003 QC data, and concluded similarly that the lote especial assays validated the 2002–2003 data for use in Mineral Resource estimation.
| 11.6.2 | Current Quality Control |
A QC program has been implemented to monitor blast-hole sampling quality. This program includes the insertion of 5% twin samples (obtained from repeating the sample process described in Section 11.1.2), 5% field duplicates (Jones splits of the same original sample that are assayed separately) and 5% RMs. Amec Foster Wheeler recommends discarding the field duplicates since no splitting actually takes place during the observed sampling procedure.
Amec Foster Wheeler reviewed partial QC data from January to June 2014 (Vale, 2014), and April to June 2015 (Vale, 2015) and observed that sampling precision for copper is within acceptable limits. Control plots for two copper RMs (with 0.424% Cu and 0.981% Cu) also indicate that accuracy is within control limits. No data were available for gold or other elements.
| March 2016
Project Number:179678 |
Page 11-11 |
|
Salobo Operations Para State, Brazil NI 43-101 Technical Report |
| Table 11-4: | Adjustment for Copper Assays for pre-2002 Drilling Programs |
| Holes | Number | Outliers | Interval | Regression | Correlation | ||
| Coefficient | |||||||
| Docegeo | D-001 to 065 | 10,833 | 126 | 1% | >0.01 | Cu adj = (1.029 * Cu) + 0.007 | 0.98 |
| CVRD | D-066 to 125 | 3,609 | 113 | 3% | >0.02 | Cu adj = (1.068 * Cu) – 0.02 | 0.98 |
| SML | D-126 to 189 | 400 | 46 | 12% | >0.01 | Cu adj = (0.98 * Cu) + 0.023 | 0.97 |
| SMSA | D-190 to 277 | 12,453 | 489 | 4% | >0.01 | Cu adj = (1.014 * Cu) – 0.005 | 0.97 |
| Lakefield
Geosol |
D-278 to 410 | 1,440 | 33 | 2% | >0.01 | Cu adj2 = (0.997 * Cu adj) – 0.003 | 0.99 |
| Table 11-5: | Adjustment for Gold Assays for pre-2002 Drilling Programs |
| Holes | Number | Outliers | Interval | Regression | Correlation
Coefficient | ||
| Docegeo + CVRD + SML |
D-001 to 189 | 26,760 | 522 | 2% | >0.01 | Au adj = (1.027 – Au) + 0.008 | 0.94 |
| SMSA | D-190 to 277 | 11,519 | 257 | 2% | >0.01 | Au adj = (1.018 – Au) + 0.005 | 0.85 |
| 11.7 |
Databases |
Drill-hole collar, survey, assay and lithology data are collated from the various sources.
| • |
Analytical data are provided digitally by the assay laboratories | |
| • |
Lithology and alteration data are entered into spreadsheets by the field geologists and checked by the database manager. Standard codes are used for the description of weathering, lithology, alteration and mineralization. Assay results are checked for compatibility with the logging codes and are also checked against hard copy data | |
|
| ||
| • |
The most important tables in the database are: Header (drill hole collar information), Survey (down-hole deviations), Assays, Lithology, Geotech, Oxi (weathering, oxidation and geotechnical classification of materials), Oxide (oxidation codes), Alteration and RQD. |
From August 2010, the evaluation of drilling and mine information has been uploaded to a Geovia Gems SQL database; this provides the geologists and mine engineers with a secure and more efficient access to information.
The primary database comprises Excel
spreadsheets containing 50 drill holes per file. Standard import procedures from
Excel to GEMS are used to transfer data. Special symbols (such as <, >,
NC, NS, IS, NE) are standardized and coded as appropriate within Gems.
A summary table within Gems is validated internally for basic errors, such as intervals out of sequence, overlaps, missing intervals, different lengths for different drill holes in
| March 2016
Project Number:179678 |
Page 11-12 |
|
Salobo Operations Para State, Brazil NI 43-101 Technical Report |
different tables, assay data out of detection limits, and undefined codes. Corrections are made to the Excel spreadsheet, which is then re-imported to Gems.
A copy of the Project database is kept secure.
| 11.8 |
Sample Security |
All drill core was brought from the drill site at the end of shift, and stored in a purpose built logging and storage facility.
Core underwent a standard logging procedure before being sawn at the adjacent diamond saw building. Mineralized sample boxes were returned to the storage facility where they are kept under lock and key. The core storage and logging facility was kept locked when unoccupied. Unshipped samples were also stored in a secure facility at the same location.
No pulps or rejects are currently routinely kept by the geologists, and the laboratory discards the rejects if they are not specifically requested.
| 11.9 | Sample Storage |
All drill core is stored in wooden boxes with proper numbering to indicate the drill-hole number and meterage (Figure 11-6).
Where requested for storage, pulps are stored in paper envelopes grouped in plastic bags, while the coarse rejects are stored in plastic bags. Both are organized in properly identified boxes.

Note: Photograph by Amec Foster Wheeler, 2015.
| March 2016
Project Number:179678 |
Page 11-13 |
|
Salobo Operations Para State, Brazil NI 43-101 Technical Report |
| 11.10 |
Comments on Section 11 |
In the opinion of the QPs, the 1997 and 2002–2003 sampling, sample preparation, assay and density data are suitable to support Mineral Resource and Mineral Reserve estimation, as follows:
| • |
Core sampling, sample preparation and assaying were conducted using industry- standard procedures | |
| • |
Limited QC protocols were implemented as early as in the 1986 campaign. Due to issues identified with pre-2002 campaigns, however, correction factors were applied to the assay data | |
| • |
During the 2002–2003 campaign, CVRD implemented a more coherent QC protocol, which resulted in more reliable data. Precision was within acceptable limits, and no significant biases or contamination were observed for copper and gold | |
| • |
Database maintenance practices are adequate, and ensure a good conservation of the data necessary for Mineral Resource estimation. | |
| • |
Core and sample rejects from legacy drilling campaigns have been kept in good condition, and are easily available for review. | |
| • |
Current blast-hole sampling is accompanied by a QC protocol. Reviewed data did not reveal significant precision or accuracy issues. Amec Foster Wheeler recommends that the practice of collecting field duplicates be discontinued. |
| March 2016
Project Number:179678 |
Page 11-14 |
|
Salobo Operations Para State, Brazil NI 43-101 Technical Report |
| 12.0 |
DATA VERIFICATION |
| 12.1 |
Major Mining Studies |
Prior to commencement of production, two prefeasibility studies and updates, and four feasibility studies and feasibility study updates were completed:
| • | Bechtel, 1988: Prefeasibility study | |
| • | Minorco, 1998: Feasibility study | |
| • | Aker Kvaerner, 2001: Updated feasibility study | |
| • | Fluor JPS, 2004: Final feasibility study. |
| 12.2 |
External Audits and Reviews |
Vale and its predecessor companies have commissioned a number of audits and third-party reviews of block models, Mineral Resources and Mineral Reserves:
|
• |
MRDI, 1997: Mineral Resource estimate audit | |
|
• |
AMEC, 2002: Mineral Resource estimate audit | |
|
• |
AMEC, 2004: Mineral Resource estimate audit | |
|
• |
Pincock, Allen and Holt, 2007: Mineral Reserve estimate audit | |
|
• |
Pincock, Allen and Holt, 2007: Due diligence audit | |
|
• |
Pincock, Allen and Holt, 2008: Mineral Reserve estimate audit | |
|
• |
Snowden, 2009: Mineral Resource estimate audit | |
|
• |
Golder Associates, 2010: Mineral Resource and Mineral Reserve audit. | |
|
A third-party review of data in support of a technical report prepared for Silver Wheaton was completed in 2013: | ||
|
• |
Micon Consultants, 2013: Review of Mineral Resources and Mineral Reserves in support of a technical report filing for Silver Wheaton. | |
| 12.3 |
Amec Foster Wheeler Reviews |
During the site visit conducted as part of this Report, Amec Foster Wheeler undertook various data verification procedures:
| • |
Review of drill-hole folders: Vale keeps ordered folders for each drill hole in the mine office. Amec Foster Wheeler reviewed 14 folders, corresponding to 10% of the drill holes from the 2002–2003 campaign. All reviewed folders were well organized, and included collar survey data (but not original documents), drill reports, down-hole survey data, original geological logs and copies of original assay certificates. Most folders also included geotechnical logs, and density, magnetic susceptibility and PLT measurements. Some folders corresponding to earlier campaigns (1981, 1986) only included original logs |
| March 2016
Project Number:179678 |
Page 12-1 | |
|
Salobo Operations Para State, Brazil NI 43-101 Technical Report |
| • |
Review of down-hole survey and assay data: Amec Foster Wheeler compared 2,245 down-hole survey data from original paper records with the digital records in the database and did not identify any errors. Spot checks on assay data corresponding to the reviewed folders did not reveal any differences between assay certificates and the digital database records | |
|
| ||
| • |
Interpretation of geology and mineralization: Amec Foster Wheeler reviewed the geometry of the interpreted polygons in all geological and mineralization vertical cross-sections in order to assess the spatial continuity and correlation to individual drill holes. The lithology cross-sections were represented at the 1:7,500 scale, and the mineralization sections were represented at the 1:2,000 scale. The sections were spaced at 50 m to 100 m. Amec Foster Wheeler also reviewed horizontal plans with 50 m spacing | |
|
| ||
| • |
Drill holes were represented with the projected trace, and included lithology polygons in the lithology cross-sections, and ore-zone polygons and copper and gold grades in the ore cross-sections. During the review, Amec Foster Wheeler did not find significant discrepancies. | |
|
| ||
| • |
Amec Foster Wheeler recognizes that the interpretation generally respects the data recorded in the logs, plans and cross-sections, as well as the interpretation from adjoining plans and sections, and is consistent with the known characteristics of this deposit type. The lithological and mineralization models have been diligently constructed in conformance to industry standard practices. | |
|
| ||
| • |
Core review: Amec Foster Wheeler reviewed selected core sections of three drill holes (FD-280, FD-296 and FD-360), and observed that the core was properly cut. The observed contacts between major units approximately matched the logged depths, although it was apparent that the boundaries between units was usually established mainly on the basis of a visual appreciation of the proportion of magnetite and garnets. Recovery in the reviewed core was excellent. |
| 12.4 |
Comments on Section 12 |
Data verification has been extensively conducted since 1988 by numerous consultants, and no material issues have been identified by those programs. In addition, Vale has regularly used various procedures to verify the quality of the data.
| March 2016
Project Number:179678 |
Page 12-2 | |
|
Salobo Operations Para State, Brazil NI 43-101 Technical Report |
These checks provide support to the QP that data at the time of the investigations noted above were acceptable for use in Mineral Resource and Mineral Reserve estimation.
The QP confirmed that key primary documentation corresponding to drill-hole folders from the 2002–2003 campaign is well conserved; however, primary records from previous campaigns are not always complete. Spot checks on various parameters (down-hole surveys and assay data) did not reveal errors.
The QP also reviewed selected core sections, and verified the quality of logging, sampling and core conservation.
The QP reviewed the interpretation of lithological and mineralization cross-sections and plans and concluded that the interpretation respects the data recorded in the logs, plans and cross-sections, as well as the interpretation from adjoining plans and sections. The interpretation is consistent with the known characteristics of this deposit type.
In the opinion of the QP, the lithological and mineralization models have been diligently constructed, and have been prepared using industry-standard practices.
The QP concludes that the drilling logging and sampling procedures are appropriate for the Salobo mineralization styles, that the assay data are reliable, and that the database is reasonably free of errors.
The information is suitable to support Mineral Resource and Mineral Reserve estimation and can be used for mine planning purposes
| March 2016
Project Number:179678 |
Page 12-3 | |
|
Salobo Operations Para State, Brazil NI 43-101 Technical Report |
| 13.0 |
MINERAL PROCESSING AND METALLURGICAL TESTING |
| 13.1 |
Metallurgical Testwork |
Five distinct phases of testwork have been completed:
| • | CVRD from 1978–1981 | |
| • | CVRD and Anglo American from 1986–1987 | |
| • | SMSA from 1993–1998, including a pilot-plant campaign carried out at the CVRD Research Centre (CRC) | |
| • | Locked-cycle flotation tests, flotation variability and grinding studies from 2003– 2004 | |
| • | Trade-off study using high-pressure grinding rolls (HPGR) for tertiary crushing as an alternative to conventional semi-autogenous grinding (SAG), from 2005–2006. |
The following sections summarize the most relevant programs indicated above, as they provided the basis of the plant design criteria and/or its metallurgical performance projections.
| 13.1.1 |
Variability Tests |
For the 2004 variability test programs, rougher flotation tests were conducted on 251 samples obtained from drill core representing a wide range of ore grades and lithologies. Approximately 47% were classified as XMT and 41% BDX, which are the two most important lithologies included in the latest Mineral Reserves statement (approximately 19% and 61% respectively).
In addition, 59 locked cycle tests were carried out at Minas Gerais Technological Centre (Cetec) in Belo Horizonte, involving 30 BDX samples and 16 XMT samples.
Two major metallurgical improvements were incorporated into these tests. Firstly, a reagent scheme was adopted using a blend of two collectors, A350 (potassium amyl xanthate) and A3477 (sodium di-isobutyl dithiophosphate). This resulted in improved metallurgy and stable flotation conditions. During the 1994 pilot plant trials only A350 was used, resulting in unstable flotation conditions and the evaluation of a two-stage grinding circuit. The addition of sodium sulphide during rougher/scavenger flotation was demonstrated as being important for the effective flotation of bornite, which tends to oxidize and tarnish quickly and requires higher collector addition.
U.I. Minerals (Uimin) consolidated the 1994 plant trial results and the variability study results in December 2003. During this process, a number of filters were applied to the results, leaving 71 tests carried out on what was then deemed to be representative samples of the lithologies.
| March 2016
Project Number:179678 |
Page 13-1 | |
|
Salobo Operations Para State, Brazil NI 43-101 Technical Report |
From this exercise, an average metallurgical recovery for copper is 90.7% and a mass recovery of 18.2% was projected. A total of 177 samples were analyzed with grades above 0.4% Cu. Results showed 87.6% of the samples with a copper recovery above 90%, 10.7% of samples had a recovery between 85 and 90%, and only 1.7% of samples were anomalous with recoveries less than 85%.
Copper recoveries for the 251 variability rougher tests are summarized in Figure 13-1.
There was a direct correlation between the copper recovery and mass recovery for each lithology. XMT samples had higher mass recoveries, which could be due to either higher grades and/or the presence of magnetite in the concentrates.
The average gold recovery for the deposit is 67.4% with a standard deviation of 14.4% . Approximately 64% of samples with initial gold grades above 0.4 g/t have gold recoveries of as up to 70%.
Gold recoveries for all the 251 variability rougher tests are summarized in Figure 13-2.
Based on the consolidated results, equations for predicting copper and gold recoveries were developed by UMIN, for use in mine planning and production forecasts.
| • | Rec Cu (%) = -0.023 / [%Cu in feed] + 0.9023 | {Equation 1} | |
| • | Rec Au (%) = 0.0256 * [g/t Au] + 0.6485 | {Equation 2} |
Uimin commented that “it should be stated that the curve fit is rather poor” for Equation 1, as exhibited by the spread of data in Figure 13-1.
A further comment that Equation 1 is applicable mostly in the 0.6 –1.5% Cu range, as head grade, was made given the test data fell outside this range.
Equation 1 is derived from using the data points represented by the yellow crosses in Figure 13-3 and subtracting 6.5% from these values. This deduction represents the losses expected in the cleaner-scavenger tails relative to what is recovered in the rougher-scavenger. The resulting overall recovery trend appears as the orange crosses in Figure 13-3.
The gold recovery projection represented by Equation 2 is illustrated by the red line in Figure 13-4 as the “best fit” for the locked-cycle tests as symbolized by the red circles.
Amec Foster Wheeler confirmed with plant personnel at the time of the 2015 site visit that these are the equations used in the Project justification studies and cross-referenced with the Geology and Mine Operations departments that these expressions were used for projecting recoveries, across all lithologies, even though the preproduction testwork data had already shown differential responses for the XMT, BDX and DGRX.
| March 2016
Project Number:179678 |
Page 13-2 | |
|
Salobo Operations Para State, Brazil NI 43-101 Technical Report |
![]()
| March 2016
Project Number:179678 |
Page 13-3 |
|
|
Salobo Operations Para State, Brazil NI 43-101 Technical Report |

| March 2016
Project Number:179678 |
Page 13-4 |
|
|
Salobo Operations Para State, Brazil NI 43-101 Technical Report |
| 13.1.2 |
High Pressure Grind Roll Trade-off Study (2006) |
The feasibility study conducted by Fluor Daniel in 2004 incorporated a conventional primary crushing circuit, a standard SAG mill/ball mill grinding circuit and a conventional copper flotation circuit.
However, several unique problems with Salobo ore led to the evaluation of an alternative to standard SAG mill grinding:
| • |
Firstly, the high magnetite content (potentially exceeding 20% at times) presents a difficulty in the SAG mill circuit due to the need to remove and crush the critical size pebbles in a pebble crusher. The use of a magnet to remove tramp steel ahead of the crusher would invariably remove magnetite pebbles with a resulting loss of the associated copper and gold values (the higher grade copper is associated with the magnetite schists). There would then be additional design and cost implications to re-handle and process the magnetite pebbles. | |
|
| ||
| • |
Secondly, significant variations in hardness and density were predicted for Salobo ore and conventional SAG milling circuits are sensitive to such variations, resulting in potential significant variability in mill throughput and performance. |
As a result of these concerns, an extensive evaluation of an alternative comminution circuit was conducted that included primary crushing, secondary cone crushing and tertiary HPGR crushing followed by conventional ball milling.
Polysius conducted two separate HPGR evaluations, in 2005 and 2006. The 2005 program tested pilot ore from the G3 adit at a top feed size of 32 mm and the 2006 program tested two samples to represent typical ore for the first five years of mining and hard ore. Top feed sizes tested were 25 mm and 32 mm. The Bond ball mill work index for the hard ore sample was 21.4 kWh/t.
General observations from this testwork program were that there was a decline in specific throughput as the roll speed increased and as the feed moisture content was increased. For the first five-year sample, there was an 18% reduction in specific throughput when the feed moisture content was increased from 0.1% to 4.0% . Abrasion testing and specific wear rates on all samples indicate that Salobo ore has low abrasion characteristics.
Grindability tests were conducted on samples of HPGR product at <6 mm and conventionally crushed material at <6 mm of the pilot ore sample from the 2005 program. The results indicated a very similar Bond ball mill work index for both samples (19.4 kWh/t and 19.2 kWh/t, respectively), indicating no micro-fracturing of the rock and therefore no grindability advantage was attributed to HPGR.
SMCC was retained as an independent reviewer of the Polysius test program and to size both the HPGR and ball mill units. Finally, Aker Kvaerner conducted a trade-off study using the results of the Polysius testwork programs and the SMCC review in 2006
| March 2016
Project Number:179678 |
Page 13-5 |
|
|
Salobo Operations Para State, Brazil NI 43-101 Technical Report |
After reviewing all the work, Vale decided to implement the HPGR option based on the technical and economic benefits compared to conventional SAG.
| 13.1.3 |
Mixed Ore Zone Copper Recovery Testwork |
A copper recovery study for the mixed ore stockpiled at the mine was commissioned in 2014. Figure 13-5 is indicative of the improved metallurgical response brought by much increased addition rates of the collectors currently used in the rougher flotation, as accompanied with the inclusion of sodium silicate, used as a dispersant (e.g. viscosity modifier).
Another study involved the transition ore, at the boundary between the oxide cap and the sulphide ore. The objective is to find the proportion of oxidized mineralization that can be added to the fresh, sulphide-bearing bedrock without impacting the overall copper recovery in the plant. As presented in Figure 13-6, such work provided an indication that a mixed ore component of up to 30% could be tolerated with limited impact on the results expected with fresh material only.
Work mostly carried out by the Vale Sheridan Park Research Centre (SPRC) in recent years resulted in development of a projected recovery curve for copper. SPRC also was involved in providing support towards the eventual processing of the mixed ore stockpile material. Figure 13-7 shows the recovery projection model, built by SPRC, and the results of testwork realized with fresh (ROM in the figure legend) and stockpiled ore samples.
The equation underlying the recovery projection model is expressed as follows:
| • | Rec Cu(@38%Cu) = 88.5 * (1 – exp(-3.5 * [Cu in feed]) | {Equation 3}. |
where [Cu in feed] is the copper feed grade and the resulting projected recovery is based on a standardized concentrate grade target of 38% Cu.
The testwork program completed included modified reagent schemes, relative to the plant operations (changing the xanthate used from potassium amyl xanthate (PAX) to sodium isopropyl xanthate (SIPX), removing the sodium sulphide as modifier), as well as testing the addition of a desliming stage, with a cyclone, of the mixed stockpile material in an attempt to remove the most oxidized component and reduce reagent consumptions.
| March 2016
Project Number:179678 |
Page 13-6 |
|
|
Salobo Operations Para State, Brazil NI 43-101 Technical Report |

| March 2016
Project Number:179678 |
Page 13-7 |
|
|
Salobo Operations Para State, Brazil NI 43-101 Technical Report |
As illustrated in Figure 13-7, the ROM sample response under the modified (e.g. without sodium sulphide) or SIPX processing scheme did not present a marked advantage from the design (e.g. current plant operations) scenario. The figure is also indicative of the large degradation in the metallurgical results that would result from processing the stockpile material with the design reagent scheme and then the marginal improvement expected under the approach where the flotation feed would have been first deslimed by cycloning.
On the basis of the current testwork knowledge, the approach retained would be not to provide the plant with more than 30% of its total feed tonnage from the mixed material accumulated on the stockpile.
| 13.2 |
Recovery Estimates |
Recovery projections for copper and gold (see Section 13.1.3) are based on Equation 1 and 2, respectively. These are underlying a fixed target copper grade in concentrate of 38% Cu. These equations are currently used to project these metals’ recoveries in the Mineral Reserve estimate, cutoff grade calculations, and the life-of-mine financial model.
Silver recovery was not tracked as diligently as copper and gold during the testwork phases.
Pre-production testwork, especially the large variability testwork program of 2003–2004, provided indications that the copper metallurgical response was variable, not only per the feed grade but also per the lithology of the ore. The adoption of a single equation to predict recovery, instead of drafting discrete equations for each lithology and using these to match the expected relative proportions provided in the mine plan as plant feed, is a simplification that may create daily discrepancies between expectations and actual results. However, this approach is likely, over monthly periods for instance, to provide a valid approximation of potential results. The shortfalls suffered during the commissioning periods of each plant are discounted. These would be the absence of sodium hydrosulphide (NaHS) as a modifier during the first six months of the Salobo I plant operations, the lack of a lime preparation system and associated safety concern related to the addition of NaHS in a low pH environment, and the high frequency of individual line shutdowns still encountered in the plant.
Figure 13-8 and Figure 13-9 present the actual monthly plant results against the projections (to May 2015, the latest month for which relevant data was provided by Vale), as established with Equation 1 and 2, showing copper and gold recovery, respectively.
| March 2016
Project Number:179678 |
Page 13-8 |
|
|
Salobo Operations Para State, Brazil NI 43-101 Technical Report |
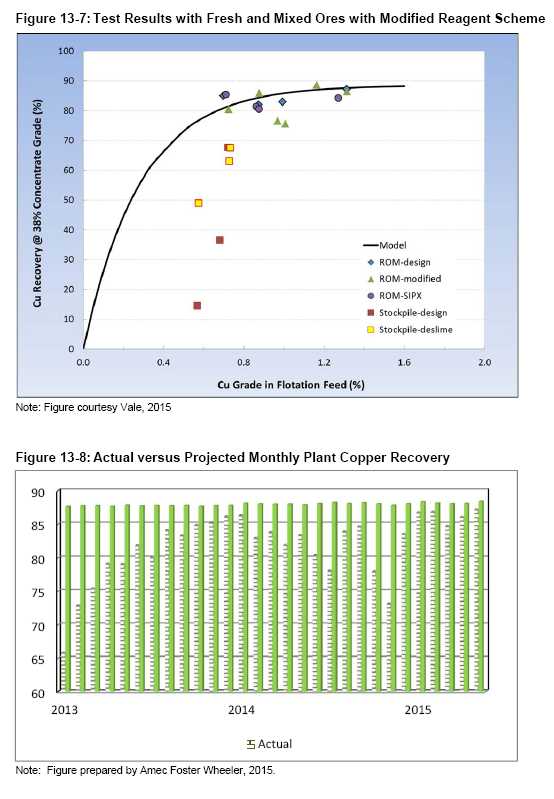
| March 2016
Project Number:179678 |
Page 13-9 |
|
|
Salobo Operations Para State, Brazil NI 43-101 Technical Report |

| 13.3 |
Metallurgical Variability |
As discussed in Section 13.2, some variability in the metallurgical results can be expected as the mixture of lithologies found in the plant feed change. Over monthly periods, the resulting blend is more likely to approach the Mineral Reserves profile and thus mitigate the variability that may be detected on a daily basis, versus projections.
Introduction of mixed material above a proportion of 30% of plant feed has been shown to lead to a degradation of the flotation results. Proper blending of such material, albeit representing only 1% of the Mineral Reserves, will be required.
| 13.4 |
Deleterious Elements |
There are three deleterious elements of potential concern in the copper concentrate, namely fluorine, chlorine and uranium. Of these, fluorine is the most significant. In general, smelters will tend to reject concentrates with high fluorine content due to problems that result in the smelter’s sulphuric acid plants.
Testwork was conducted as part of the 1994 pilot plant campaign and continued by CVRD in 1995 to evaluate the potential for acid leaching of the concentrate to reduce fluorine levels. This was apparently unsuccessful due to insufficient removal of fluorine, high dissolution of copper and difficulty in filtering the leach residue.
| March 2016
Project Number:179678 |
Page 13-10 |
|
|
Salobo Operations Para State, Brazil NI 43-101 Technical Report |
Mineralogical examination of the ore lithologies and concentrate samples have indicated a tendency for this element to be concentrated in fluorine and silicates, in particular the biotite. These gangue minerals are partially reporting to the concentrate stream mostly through partial liberation from sulphide-bearing mineral grains and mechanical entrainment in the froth phase of the flotation process. Regrinding of the scavenger concentrate, for incremental liberation, as well as cleaning in the flotation circuit with flotation columns, instead of conventional mechanically-agitated cells, was adopted to enhance liberation and provide a means for more effective froth washing, with water, of the final concentrate stream. These two approaches demonstrated a capability to improve rejection of the deleterious elements at levels acceptable to some smelters, albeit while still attracting penalties on fluorine and chlorine, for their high residual contents.
Vale has secured contracts with four smelters able to accept the copper concentrate, with an average fluorine content of about 2,000 ppm, and a maximum content of 4,000 ppm. Penalties are charged though starting below the actual content. Figure 13-10 illustrates the historical evolution of the fluorine content in the concentrate, as produced from the plant, up to the latest period for which Amec Foster Wheeler was provided with the relevant data.
These smelters also placed the maximum acceptable chlorine content at 1,200 ppm, but with a penalty drawn at the 550–650 ppm content seen in 2015 shipments. Figure 13-11 illustrates the historical evolution of the chlorine content in the concentrate, as produced at the plant.
Uranium, in the partial set of shipment assays reviewed by Amec Foster Wheeler, indicated levels below the rejection threshold of 50 ppm U, with values generally in the 25–35 ppm U range. No penalties are drawn below the rejection level.
Vale advised that, since concentrate lots are segregated by grade (lower, medium and high grades) at the Parauapebas transfer shed, blending of out-of-specification concentrate is possible, should it ever be necessary.
Amec Foster Wheeler concludes that with the potential blending strategy and the securing of contracts with four smelters which accept concentrates with fluorine content of up to 4,000 ppm, the risk of concentrate rejection has been significantly reduced. Penalty payments may still be levied.
| March 2016
Project Number:179678 |
Page 13-11 |
|
|
Salobo Operations Para State, Brazil NI 43-101 Technical Report |

| March 2016
Project Number:179678 |
Page 13-12 |
|
|
Salobo Operations Para State, Brazil NI 43-101 Technical Report |
| 13.5 |
Actual Plant Results versus Budgeted Projections |
Considering the accumulated historical data from the plant operations, it is relevant to assess how current results match expectations from the design stage and how they are integrated in the prediction of future results, both from the aspects of the metallurgy and of the throughput capability of the plant.
| 13.5.1 |
Historical Metallurgical Results |
Figure 13-8 and Figure 13-9 (included earlier) were indicative of the monthly plant performance to May 2015 in relation to the predicted recoveries based on testwork data and Equation 1 and Equation 2. Section 13.2 offered an overview of some of the events that may have contributed to the differentials shown in these figures over specific periods, with copper having apparently suffered more shortfalls than gold as a result of these.
Figure 13-12 to Figure 13-15 present in more detail the recent metallurgical results such as the 2015 monthly data.
The 2015 copper recovery target is set at 86.8% in the budget, exactly the level matched by the operations (refer to Figure 13-12). Using Equation 1, the 0.91% Cu head grade budgeted for the full year would have called for a projected recovery of 88.1% . The discount may reflect the anticipated effect of the Salobo II plant ramp-up and ongoing upgrades brought to Salobo I. For 2016, the budget recovery increases to 87.6% and is held there until 2027, when it is decreased to 85% to reflect the processing of lower-grade stockpiled material that may have weathered. The budgeted recovery prior to 2027 is typically leaving a small discount versus projected values, using Equation 1, in the order of 0.2 –0.4% .
The 2015 results for copper recovery represent a marked improvement both from 2014, which may have been negatively influenced by the commissioning of Salobo II, and from 2013, at 81.4% and 80.9%, respectively.
The 2015 gold recovery target is set at 64.2% in the budget, in comparison to the 67.3% achieved (refer to Figure 13-13). Using Equation 2, the 0.52 g/t Au head grade budgeted for the full year would have called for a projected recovery of 66.2% . As with the copper recovery, the discount placed in the budget relative to the projected value, (using Equation 2), may reflect in anticipation the ongoing Salobo II plant ramp-up on the metallurgical results. The target gold recovery is increased to 66% in 2016 and held at this level until 2020, when the values used in the financial model closely reflect the projected values from Equation 2. Meeting the long-term budget value of 66% recovery for gold is therefore not considered to be an issue.
| March 2016
Project Number:179678 |
Page 13-13 |
|
|
Salobo Operations Para State, Brazil NI 43-101 Technical Report |

| March 2016
Project Number:179678 |
Page 13-14 |
|
|
Salobo Operations Para State, Brazil NI 43-101 Technical Report |

| March 2016
Project Number:179678 |
Page 13-15 |
|
|
Salobo Operations Para State, Brazil NI 43-101 Technical Report |
The 2015 silver recovery target is set at 40% in the budget, well in line with the 41.3% realized in 2015 (refer to Figure 13-14). There was limited follow-up of the silver deportment through the testwork campaigns, and there is therefore no equation available to predict its recovery. The budget value of 40% is more or less aligned with the historical results reported in Figure 13-13, discounting the effect of Salobo II commissioning in 2014.
Equation 1 was derived on the premise of achieving a final copper concentrate grade of 38% Cu. This value is used in the budget and financial model, and by the operations personnel to decide whether to pull the flotation circuit harder or not. As shown in Figure 13-15, a very good performance from the plant has been achieved in this regard, and should be able to be upheld in the future.
| 13.5.2 |
Historical Plant Utilization |
The throughput capability of the plant has been increasing over time through improvements in the operated throughput (i.e. ore feed rate to the plant when in operation) and plant operated utilization (i.e. hours of operation versus hours available to operate, net of downtime for maintenance requirements). The actual utilization (obtained by multiplying availability by operated utilization, referred to as “rendimento” in Vale’s documents), on the other hand, has been stagnating and suffering setbacks brought by the commissioning of the Salobo II plant but, as well, from lingering design and process control issues in the Salobo I circuit. Integrating the two plants’ front end ore handling systems, with the commissioning of Salobo II, as well as extending improvements in the design used for Salobo II into the Salobo I plant have been ongoing tasks through most of 2015 but with marked improvements being achieved in the second half (H2) of 2015.
Figure 13-16 is indicative of the Salobo I plant availability and operated utilization while Figure 13-17 presents similar information for Salobo II.
The basal frames of Figure 13-16 and Figure 13-17 illustrate the high operational utilization achieved at both plants.
In contrast, reviewing the data in the top frames of the same figures, the realized plant availabilities were typically below the budgeted values indicated until H2 2015, even when consideration of the 2013 data for Salobo I and 2014 data for Salobo II are excluded, because both were affected to some extent by their respective commissioning progress. Since H2 2015, some monthly data show values above target.
| March 2016
Project Number:179678 |
Page 13-16 |
|
|
Salobo Operations Para State, Brazil NI 43-101 Technical Report |
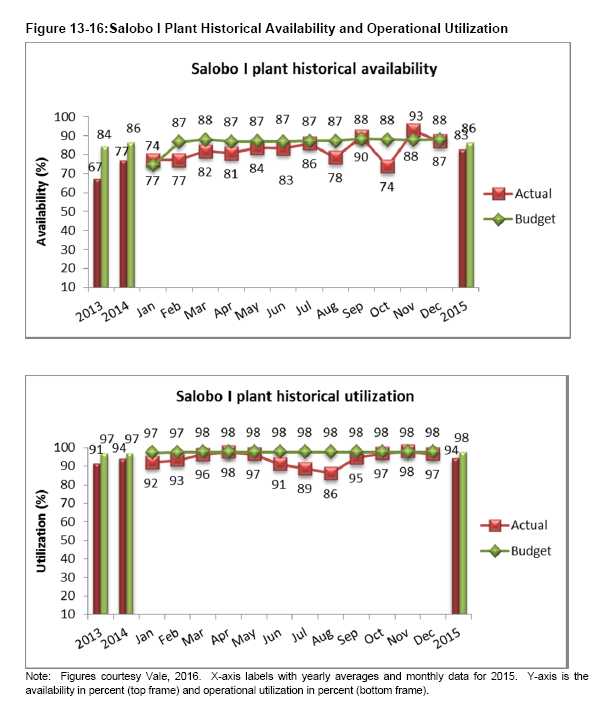
| March 2016
Project Number:179678 |
Page 13-17 |
|
|
Salobo Operations Para State, Brazil NI 43-101 Technical Report |

| March 2016
Project Number:179678 |
Page 13-18 |
|
|
Salobo Operations Para State, Brazil NI 43-101 Technical Report |
The past availability shortcomings have been largely attributed to under-powered shuttle heads for the conveyors filling the bins above the HPGRs and secondary screens, allowing the HPGRs to run without feed on a regular basis, and increasing the probability that their rolls will be damaged upon resumption. A series of conveyor pulley bearings also failed, causing unplanned maintenance. Feed chutes and transfer points also exhibited rapid wear rates. These sources heavily contributed to the high frequency of individual ball mill feed interruptions during H1 2015, as presented in Figure 13-18 and Figure 13-19.
Figure 13-18 indicates that each grinding line suffered, on average, over 200 feed interruptions per month, up from the 140–150 feed interruptions per month experienced in 2014; with nearly 70% said to be caused by the tripper conveyor’s shuttle heads. These interruptions are not including any downtime for planned maintenance. Physical modifications and changes to the control scheme to the displacement of the shuttle heads brought back the average for H2 2015 to 92 stoppages per line, with further improvements from September to EOY, with the average falling to 76 stoppages per line over this period.
Figure 13-19, in turn, shows that the average duration of these interruptions is about one hour long. This is also an improvement from 2014 figures with an overall average duration for the four lines of 2.0 hours.
With these types of high-frequency interruptions, repeated instability within the flotation circuits can be expected. Following a resolution of most of these, some additional metallurgical gains, as well as additional operated hours, could thus be garnered. The repeated ramping-up and down of the feed tonnage would also be attenuated, allowing for incremental throughput logged, while the plant is deemed as operating.
Rates of 3,200 t/h have been regularly registered on a daily basis (Figure 13-20), with a daily average of 3,052 t/h for 2015. This compares to budget figures of 3,146 t/h for 2015, increasing to 3,171 t/h for the balance of the 2016–2020 production plan.
The onus for achieving incremental processed tonnage is thus mostly placed on the maintenance group, as it is tasked with generating the availability improvement expected from the equipment, and on the process control group, with control tuning and strategic modifications. The 2016–2020 production plan requires that the availability target gradually increases from 86% in 2016 to 88.9% by 2020.
| March 2016
Project Number:179678 |
Page 13-19 |
|
|
Salobo Operations Para State, Brazil NI 43-101 Technical Report |

| March 2016
Project Number:179678 |
Page 13-20 |
|
|
Salobo Operations Para State, Brazil NI 43-101 Technical Report |
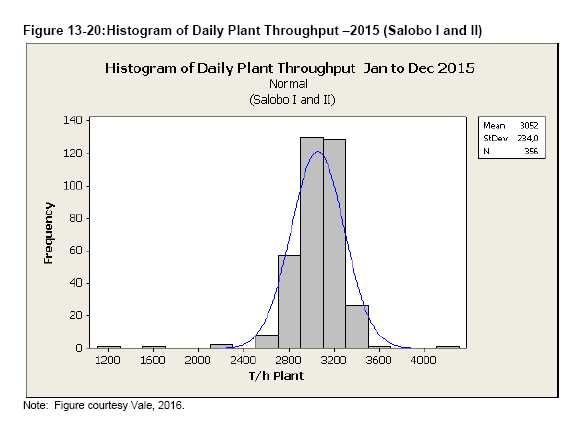
| 13.6 |
Comments on Section 13 |
Equations to project copper and gold recoveries used a large dataset from testwork. Within the 0.6 –1.5% Cu range of the data points retained for a regression analysis, the resulting equations are fairly insensitive to the actual feed grade encountered.
The “noisy” set of testwork data may have been divided by lithologies for analysis, in order to use this additional information as a projection tool. More recent testwork confirmed a better copper response for XMT than for BDX, for example. The potential variability of gold, as it relates to lithology, is less clear.
The recovery projection equations may therefore be sufficient for predicting results over longer-term periods (e.g. yearly, maybe monthly), but may not be adequate for applying a daily target to the plant operations since variations in the lithological makeup of the plant feed over such a short period may have called for different target recoveries than indicated by the equations.
A geometallurgical program initiated in June 2014 is expected to allow for building a database from which refinements to the projection tools, if deemed valid, could be made.
| March 2016
Project Number:179678 |
Page 13-21 |
|
|
Salobo Operations Para State, Brazil NI 43-101 Technical Report |
Results achieved to date from operations indicate that metallurgical targets are reasonable and fairly aligned with the projection tools in place, once consideration is made for ramp-up effects.
The targeted operated throughput, set at 3,146 t/h in 2015 and 3,171 t/h thereafter, has been achieved on a daily basis. Reducing the frequency of feed interruptions should help in meeting the monthly throughput targets.
The plant operational utilization is meeting expectations, whereas downward pressure on the actual utilization is brought mostly by the availability, which has been below expectations since inception of the operations. Realized modifications and upgrades throughout 2015, especially to some of the material handling equipment, have reduced the number of feed interruptions and unscheduled downtime events.
The targeted long-term availability of 88.9% for 2020 may yet prove difficult to reach though, given the lack of stand-by crushing and screening equipment in the tertiary crushing circuit, as well as the reliance upon multiple single-line conveyors.
| March 2016
Project Number:179678 |
Page 13-22 |
|
|
Salobo Operations Para State, Brazil NI 43-101 Technical Report |
| 14.0 |
MINERAL RESOURCE ESTIMATES |
| 14.1 |
Introduction |
Geological logging and results from sampling from 416 diamond drill holes totaling 146,645 m were used as the basis for preparation of three-dimensional (3D) models of lithology, mineralization envelopes, grades and density. The construction date for the resource model is 11 March, 2013. A table of the drill holes supporting the Mineral Resource estimate is given in Section 10.
The Mineral Resource estimate was prepared by Vale. The 3D solid models of the lithology and copper grade shells were constructed using Geovia. Compositing, exploratory data analysis including variography, interpolation, statistical validation and classification were done using Isatis. Visual validation was performed in Geovia. The estimated elements are total copper, gold, silver, fluorine, carbon, molybdenum, sulphur, uranium, and density.
The block model extends a total 5,220 m in the N117.5E direction by 2,250 m in the N21.5E direction and 1,005 m in the vertical direction. The block model is a percent block model with a regular block size of 15 m x 15 m x 15 m.
The Mineral Resource estimates were prepared by Vale staff with reference to the 2014 CIM Definitions Standards and the 2003 CIM Best Practice Guidelines.
| 14.2 |
Geological Models |
The geological model consists of two models, lithology and mineralization (or Cu grade shells). The lithology model is used to partially guide the copper grade shell interpretation and to assign the density where it is not directly estimated with density data points inside of grade shells. The copper grade shell model is used for the estimation of copper, gold, silver, fluorine and density.
The lithology model was constructed as follows. First an interpretation was completed on vertical southwest–northeast sections that were spaced 20 m to 40 m apart (80 m apart towards the edges). The interpretation was based on the original sample logs with a majority lithology code rule and a minimum width of 8 m and sometimes smaller to preserve continuity between drill holes. Traces of the vertical sectional interpretation were typically generated on 30 m horizontal plans and used for the horizontal interpretation (the 2013 long-term model also had interpretations at 15 m intervals from the surface topography to 210 level). The horizontal interpretation was reviewed and eventually modified to improve consistency with the vertical interpretation. The final horizontal interpretation was extruded 15 m above and below to constitute three-dimensional (3D) solids. The 3D solids were used to flag the 15 m x 15 m x 15 m blocks.
| March 2016
Project Number:179678 |
Page 14-1 |
|
|
Salobo Operations Para State, Brazil NI 43-101 Technical Report |
The mineralization model was built in a similar way, based on the original samples coded as waste, (<0.2% Cu), low-grade (0.2 to 0.6% Cu) and high-grade (≥0.6% Cu) and also considering the lithology model. The low-grade generally corresponds to disseminated mineralization in biotite schist while the high-grade is often associated to magnetite schist. Traces of the vertical sectional interpretation were generated on 15 m horizontal plans and the horizontal interpretation was extruded 7.5 m above and below to constitute 3D solids.
Two sectors were further identified to account for changes in the orientation of the mineralized zone along strike. Surfaces were defined to identify oxide, mixed, and sulphide material. Oxide and most of the mixed material is waste. Figure 14-1 shows the location of the two sectors. Figure 14-2 and Figure 14-3 show the lithology model and grade shell model on the same section. Table 14-1 lists the resulting estimation domains.
| 14.3 |
Grade Capping / Outlier Restrictions |
Grade capping was done by shell (high grade or low grade) and sector in two steps: top-cut of the original assay values; and high yield restriction on the composites during estimation.
The top-cut of the original assays was based on a statistical review of the grades and a visual review of the very high grades. The statistical review consisted in inspecting coefficients of variation, copper–gold scattergrams, and various high percentiles such as 95th, 97th, and 99th percentiles. Visual reviewing consisted of looking at the spatial distribution of the very high grades, and having a second look at the core to have a better understanding of the local context of the high grades. In all cases for copper and gold, capping was higher than the 99th percentile.
The impact of capping of the original assays is a reduction in metal of approximately 0.2% (relative) for copper and 2% (relative) for gold. The impact of high yield restriction during estimation is an additional reduction in metal of approximately 3% (relative) for copper and 7% (relative) for gold.
| 14.4 |
Composites |
The sample intervals are generally 1 m long, and may vary according to geological contacts. Two-metre down-hole composites were created for the estimation. This composite length was chosen to provide details within the mineralized zones and flexibility for the number of composites to use per estimated block. A small number of composite less or equal to 1.0 m in length were not used for the estimation.
| March 2016
Project Number:179678 |
Page 14-2 |
|
|
Salobo Operations Para State, Brazil NI 43-101 Technical Report |
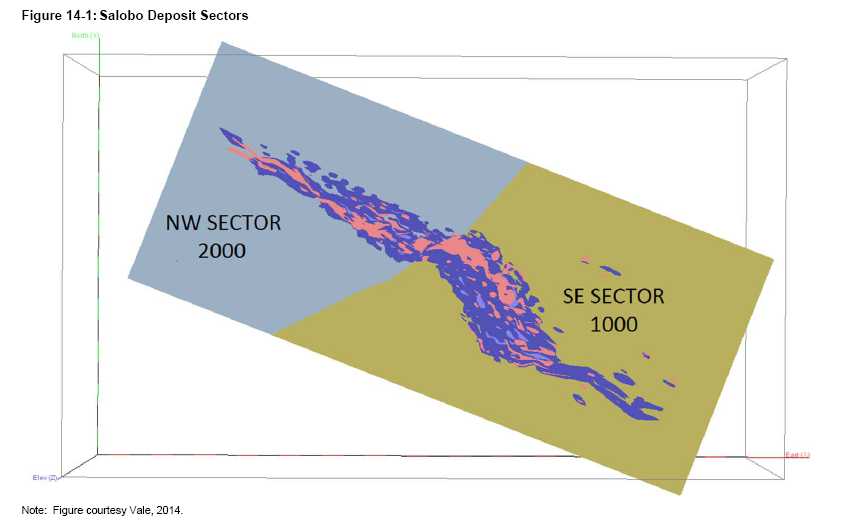
| March 2016
Project Number:179678 |
Page 14-3 |
|
|
Salobo Operations Para State, Brazil NI 43-101 Technical Report |

| March 2016
Project Number:179678 |
Page 14-4 |
|
|
Salobo Operations Para State, Brazil NI 43-101 Technical Report |

| March 2016
Project Number:179678 |
Page 14-5 |
|
|
Salobo Operations Para State, Brazil NI 43-101 Technical Report |
| Table 14-1: | Estimation Domains (Sulphide) |
| Sector | Mineralization | Domain | |
| Southeast | 1103 | ||
| Low grade (biotite schist) | |||
| Northwest | 1203 | ||
| Southeast | 2103 | ||
| High grade (magnetite schist) | |||
| Northwest | 2203 |
Samples were composited in Isatis using the “regularization” tool. Compositing is density weighted and considers breaks in the presence of non-assayed intervals or grade shell contacts. If a sample is undefined for a given variable, its value is not taken into account in the calculation of the composite value. Very few intervals were not assayed for copper or gold in the mineralization, or assessed for density.
| 14.5 |
Exploratory Data Analysis |
Exploratory data analysis (EDA) was completed on original sample values, composite values, and declustered composite values.
| 14.5.1 |
Declustering |
Cell declustering was used to decluster the 2 m composites per estimation domain. The cell sizes were selected such that the declustered means per domain reached a minimum. At the time of validation, the estimated block model was also compared to a nearest-neighbour (NN) model.
| 14.5.2 |
Original Sample Statistics |
The following statistics were computed by domain on the original samples grades and densities:
| • | Histograms (Cu, Au, Ag, F, C, Mo, S, U and density) | |
| • | Scattergrams (Ag, Au, F, Mo, S, U and density versus Cu) | |
| • | Correlation matrix (Cu, Au, Ag, F, C, Mo, S, U, Mag and density). |
All the grade distributions are positively skewed. Silver, fluorine, molybdenum, sulphur, and uranium are under-sampled with respect to copper and gold.
| 14.5.3 |
Composite Statistics |
The following statistics were computed by domain on the composite grades and densities: histograms, probability plots, and scattergrams of standard deviation versus mean (Cu, Au, Ag, F, C, Mo, S, U and density). These plots were used to assess the differences between the domains statistics and the possibility of grouping some domains for the estimation.
| March 2016
Project Number:179678 |
Page 14-6 |
|
|
Salobo Operations Para State, Brazil NI 43-101 Technical Report |
| 14.5.4 |
Contact Analysis |
Contact plots were prepared by domain for copper, gold, and sulphur original sample capped assays grouped inside the 0.6% Cu grade shell, inside the 0.2 –0.6% Cu shell, and inside the waste. The copper and gold low-grade and high-grade shell contacts are hard. Figure 14-4 is an example of contact plots between the low and high grade shells. Table 14-2 shows the composite sharing during estimation.
| 14.6 |
Variography |
Variograms maps, down-the-hole and directional correlograms for capped copper, capped gold, and density composites, were prepared in Isatis using the correlogram variographic option. The correlograms were computed from all data by domain (1103, 2103, 1203, and 2203) and by sector (1103+2103 and 1203+2203). Two spherical structures plus a nugget were fitted on the experimental correlograms. A summary of the copper variogram parameters is provided in Table 14-3.
Correlograms were also computed and fitted for the other elements.
The anisotropies apparent in the variograms for all metals are generally consistent with the anisotropy observed in the grade shells with the best spatial continuity generally along the down-dip direction, the intermediate spatial continuity along strike, and the poorest spatial continuity across strike. The nugget effect values are often high, due in part to the small composite lengths.
| 14.6.1 |
Block Model Dimensions |
The block model is a percent block model consisting of rotated regular blocks. The rotation is -21.27º clockwise such that the block model X axis lies along the general strike of N111.27E. The block model framework parameters are listed in Table 14-4.
| 14.7 |
Block Model Assignments |
| 14.7.1 |
Lithology |
Blocks were assigned lithology domain codes using the lithology solids prepared in Geovia. Block assignment was based on majority rule. This lithology model is used only to assign densities by lithology outside the mineralized domains.
| March 2016
Project Number:179678 |
Page 14-7 |
|
|
Salobo Operations Para State, Brazil NI 43-101 Technical Report |

| Table 14-2: | Composite Sharing During Estimation |
| Sector | Mineralization | Domain | Cu | Au | Ag | Density |
| Composite Sharing During Estimation | ||||||
| Southeast | 1103 | 1103 | ||||
| Low Grade (Biotite Schist) | 1103+2103 | |||||
| Northwest | 2103 | 2103 | ||||
| Southeast | 1203 | 1203 | ||||
| High Grade (Magnetite Schist) | ||||||
| Northwest | 2203 | 2203 | ||||
| Table 14-3: | Summary of Copper Variogram Parameters |
| Cu-Domain | Direction | Nugget | First Structure | Second Structure | ||||
| (Azim/Dip | Effect | Sill | Type | Range (m) | Sill | Type | Range (m) | |
| N130/90 | 10 | 100 | ||||||
| 1103 | N130/0 | 0.65 | 0.28 | Spherical | 10 | 0.007 | Spherical | 65 |
| N220/0 | 5 | 55 | ||||||
| N115/90 | 25 | 125 | ||||||
| 1203 | N115/0 | 0.4 | 0.4 | Spherical | 15 | 0.2 | Spherical | 75 |
| N205/0 | 10 | 40 | ||||||
| N110/90 | 10 | 130 | ||||||
| 2103 | N110/0 | 0.7 | 0.27 | Spherical | 15 | 0.03 | Spherical | 60 |
| N200/0 | 5 | 55 | ||||||
| N110/90 | 10 | 200 | ||||||
| 2203 | N110/0 | 0.45 | 0.3 | Spherical | 40 | 0.25 | Spherical | 120 |
| N200/0 | 5 | 80 | ||||||
| March 2016
Project Number:179678 |
Page 14-8 |
|
|
Salobo Operations Para State, Brazil NI 43-101 Technical Report |
| Table 14-4: | Block Model Framework. |
| Axis | Origin* | Block
Size (m) |
No. of Blocks | Model Extension
(m) |
| X | 548,540 | 15 | 348 | 5,220 |
| Y | 9,359,800 | 15 | 150 | 2,250 |
| Z | -457.5 | 15 | 67 | 1,005 |
Note: *Origin is defined as the bottom southwest corner of the model, located at the lowest combined northing and easting coordinates and the lowest elevation. The model extends from the -457.5 m elevation to a top elevation of 547.5 m.
| 14.7.2 |
Mineralization/Grade Shells |
Blocks were assigned grade shell percent volumes (waste, low grade, high grade) using the grade shell solids prepared in Geovia.
| 14.7.3 |
Density |
Blocks were assigned a dry bulk density outside the grade shells, based on the mean value of SG measurements of the main lithological domains. The SG was estimated by ordinary kriging (OK) inside the grade shells.
| 14.8 |
Estimation/Interpolation Method |
The copper, gold and density block grade values were interpolated within the grade shells using an OK estimator. Outside the grade shells (waste), blocks were assigned zero copper and gold grades, and the mean bulk density of the corresponding lithology.
A four-pass estimation approach with high yield restriction was used with each successive pass having greater search distances and less restrictive sample selection requirements. Hard boundaries were used between waste, low-grade and high-grade mineralization domains. Hard or soft boundaries were used between the two sectors (refer to Table 14-2). Final estimated block grades were volume-weighted averages of waste, low-grade, and high-grade estimated block grades.
The rotation angles of the search ellipses for an element are based on that element variogram model rotation and are the same for all passes. The size of the search ellipse for Pass 1 is based on the variogram distances corresponding 94% to 99.5% of the total sill for gold and silver (usually 99.5%), and 80% to 95% for density. The search ellipsoid size and high yield restriction parameters were set by domain such that the OK Pass 1+2 mean grades were closed to the cell declustered mean grades, and such that the highest grades influence just a few surrounding blocks without further capping.
The correlograms used for sample weighting during kriging are those modelled for each grade element. An anisotropic search with weighted distances was used for sample selection. The anisotropic weighting factors are the ratios of the distances in the major, semi-major and minor directions. A summary of the copper estimation plan is provided in Table 14-5 as an example. The estimation plans for the other elements follow the same principles.
| March 2016
Project Number:179678 |
Page 14-9 |
|
|
Salobo Operations Para State, Brazil NI 43-101 Technical Report |
Silver, fluorine, carbon, molybdenum, sulphur, and uranium were also interpolated using an OK estimator.
| 14.9 |
Block Model Validation |
| 14.9.1 |
Block Model Visual Validation |
Visual validation comprised inspection of composite grades and block grades on vertical sections and plan views. Copper grade 15 m long composites, block grades, 0.2% and 0.6% Cu grade shells, Mineral Resource and Mineral Reserve shells are shown in plan view in Figure 14-5 and on vertical section in Figure 14-6. The block model grades are well constrained within the grade shells and generally honour the composite data well. Grade extrapolation is controlled where sufficient data exist.
| 14.9.2 |
Global Grade Bias Check |
Block grade estimates were checked for global bias by comparing the average grades (with no cutoff) with those obtained from cell declustered composites and NN model estimates. The NN grade model is equivalent to another declustered composite grade distribution. The NN model was run with Pass 4 search size, orientation and high yield restriction.
Results summarized in Table 14-6 show percent changes in mean grade from declustered composites to OK well within ±2% per sector for copper. Percent changes for gold vary from -1% to -6%. Percent changes for density are within 0 to +1%. These percentage differences are acceptable.
| 14.9.3 |
Local Grade Bias Check |
Swath plots were prepared to compare grade profiles for the OK and NN block estimates, and composites in east-west, north-south, and vertical swaths or increments. Swath intervals are 50 m in both the northerly and easterly directions, and 30 m vertically. The comparison considered all blocks and composites. The grade profiles are in general good agreement. The swath plots indicate that no unexpected local bias has been introduced in the block grade estimate. An example of swath plots for Sector 1 Cu high and low grade shells are provided in Figure 14-7.
| March 2016
Project Number:179678 |
Page 14-10 |
|
|
Salobo Operations Para State, Brazil NI 43-101 Technical Report |
| Table 14-5: | Summary of the Block Grade Estimation Plan for Copper, Salobo |
| Search Ellipsoid Radii Azimuth/Dip | ||||
| Domain | Major | Semi-Major | Minor | |
| 1103 (LG) | 130/90 | 130/0 | 220/0 | |
| 1203 (HG) | 115/90 | 115/0 | 205/0 | |
| Domain | Pass | Search Ellipsoid Size | Min. No Comp |
No. of Angular Sectors |
Opt. No. Comp. per Sector |
Min. Dist. Between Two Comp. (m) |
Max Dist. w/o comp. (m) |
||||
| Major (m) | Semi-Major (m) | Minor (m) | |||||||||
| High Yield Restriction | |||||||||||
| Threshold (%Cu) |
Dist. (m) | ||||||||||
| 1 | 85 | 55 | 46 | 16 | 4 | 50 | 35 | ||||
| 2 | 2 times Pass 1 | 16 | 8 | 3 | 4 | 80 | 35 | ||||
| 1103 (LG) | 3 | 3 times Pass 1 | 4 | 4 | 2.58 | 50 | |||||
| 4 | 16 times Pass 1 | 2 | 50 | ||||||||
| 1 | 110 | 65 | 35 | 16 | 4 | 65 | 10 | ||||
| 1203 (HG) | 2 | 2 times Pass 1 | 16 | 8 | 3 | 4 | 100 | 10 | |||
| 3 | 3 times Pass 1 | 4 | 4 | 3.4 | 20 | ||||||
| 4 | 16 times Pass 1 | 2 | 20 | ||||||||
| March 2016
Project Number:179678 |
Page 14-11 |
|
|
Salobo Operations Para State, Brazil NI 43-101 Technical Report |

| March 2016
Project Number:179678 |
Page 14-12 |
|
|
Salobo Operations Para State, Brazil NI 43-101 Technical Report |

| March 2016
Project Number:179678 |
Page 14-13 |
|
|
Salobo Operations Para State, Brazil NI 43-101 Technical Report |
| Table 14-6: | Global Bias Check |
| Decl. Comp | Block Model | Percent Change | ||||
| Element | Sector | Mean | OK Mean | NN Mean | Comp. to OK |
NN to OK |
| Cu (%) | 1 2 |
0.70 0.73 |
0.71 0.73 |
0.72 0.74 |
1% 1% |
-1% -2% |
| Au (g/t) | 1 2 |
0.38 0.32 |
0.37 0.31 |
0.39 0.31 |
-2% -2% |
-6% -1% |
| Density (g/cm3) | 1 2 |
3.31 3.22 |
3.33 3.22 |
3.33 3.21 |
1% 0.10% |
0.00% 0.30% |
Note: Sector 1 = Domains 1103+1203; Sector 2 = Domains 2103+2203. Undiluted statistics weighted by number of blocks within low- and high-grade shells.

| March 2016
Project Number:179678 |
Page 14-14 |
|
|
Salobo Operations Para State, Brazil NI 43-101 Technical Report |
| 14.9.4 |
Selectivity Check |
No selectivity checks were performed but reconciliation with production data are available.
| 14.9.5 |
Reconciliation with Production |
The Salobo mine has been in operation since January 2012 with full production since the third-quarter (Q3), 2014. A significant low-grade area was mined from the fourth quarter (Q4) 2014 to the second quarter (Q2) of 2015 that had not been modelled. As a result, for that period the long-term to short-term ore control model reconciliation was poor with significantly more tonnes mined at a lesser grade than estimated in the long term model. If, however, only the feed ore is considered, reconciliation is much better.
Table 14-7 shows quarterly reconciliation between the 2013 long term block model and the short term ore control model from January 2014 to December 2014 for the feed ore. The F1 factors in the table are the ratios of the short term model depletion over the long term model depletion for grade (% Cu and Au g/t), tonnage, and metal (contained Cu and contained Au). A high value for an F1 factor indicates conservatism in the long-term model.
Table 14-7 shows that for the considered reconciliation period, the 2013 block model estimates are reasonably accurate for the feed ore tonnage and copper grade. The gold grade is higher in the long-term model than in the short-term model, but the difference is mostly related to an ore control gold sampling bias due to loss of fines. In actuality, the plant gets significantly more gold than predicted by the short-term model, and close to the amount of gold predicted by the long-term model.
Overall, the 2013 estimated long-term block model reconciliation are acceptable. More time is needed, however, to obtain additional reconciliation data and confirm the results that are currently available.
| 14.10 |
Classification of Mineral Resources |
The Mineral Resource is classified in accordance with the 2014 CIM Definition Standards.
In addition to criteria such as sufficient geological continuity, grade continuity, and data integrity, Vale recommends the following benchmark criteria for resource classification:
| • |
Inferred Mineral Resource: a level of confidence of ±15% on the global recoverable metal content, and tonnes, and grades | |
|
| ||
| • |
Indicated Mineral Resource: a level of confidence of ±15% on the recoverable metal content, and tonnes, and grades over an area or volume corresponding to the footprint of one year of production for a given deposit type in a mine or project |
| March 2016
Project Number:179678 |
Page 14-15 |
|
|
Salobo Operations Para State, Brazil NI 43-101 Technical Report |
| Table 14-7: | Salobo Long Term to Short Term Feed Ore Reconciliation (January 2014 to June 2015) |
| Year Long Term
Block Model Constructed |
Reconciliation Quarter |
Short Term / Long Term Model F1 Factors | ||||
| Tonnage | Cu Grade | Au Grade | Cu Metal | Au Metal | ||
| 2013 | Q1 14 Q2 14 Q3 14 Q4 14 |
1.10 0.93 1.04 1.11 |
1.03 1.01 1.06 0.96 |
0.88 0.97 1.03 0.91 |
1.13 0.94 1.10 1.06 |
0.97 0.90 1.08 1.01 |
| 2015 | Q1 15 Q2 15 |
0.99 1.00 |
0.97 0.93 |
0.91 0.79 |
0.96 0.93 |
0.89 0.80 |
Note: F1 = ratios of the short term model depletion over the long term model depletion for tonnage, Cu and Ag grades metal.
|
• |
Measured Mineral Resource: a level of confidence of ±15% on the recoverable metal content, and tonnes, and grades over an area or volume corresponding to the footprint of one quarter of one year of production for a given deposit type in a mine or project. |
Classification was based on the estimation passes used for kriging followed by some smoothing to reduce classification discontinuities:
| • | Measured Mineral Resources (open pit): Pass 1 estimated blocks | |
| • | Indicated Mineral Resources: (open pit): Pass 2 estimated blocks | |
| • | Inferred Mineral Resources: (open pit): Passes 3 and 4 estimated blocks |
The material mined from January 2014 to June 2015 was classified as 83% Measured and 17% Indicated. Table 14-7 showed that this material corresponds well to the Measured Mineral Resource category, with the copper feed production within ±15% of prediction on a quarterly basis. The gold metal is underestimated, but this is due to an ore control sampling bias. Gold also contributes a minor portion of the total value.
An illustration of the Mineral Resource classification is shown with the Mineral Reserve and Mineral Resource pits, and the drill hole traces in plan view in Figure 14-8 and on vertical section in Figure 14-9. The 0.2% and 0.6% Cu grade shells are also shown on the vertical section.
The figures show that some Measured mineralization would be better classified as Indicated and vice-versa. The Indicated category is sometimes over-projected at depth. The Inferred category is reasonable when limited by the resource pit. The classification is acceptable, although it could locally be improved.
| March 2016
Project Number:179678 |
Page 14-16 |
|
|
Salobo Operations Para State, Brazil NI 43-101 Technical Report |

| March 2016
Project Number:179678 |
Page 14-17 |
|
|
Salobo Operations Para State, Brazil NI 43-101 Technical Report |
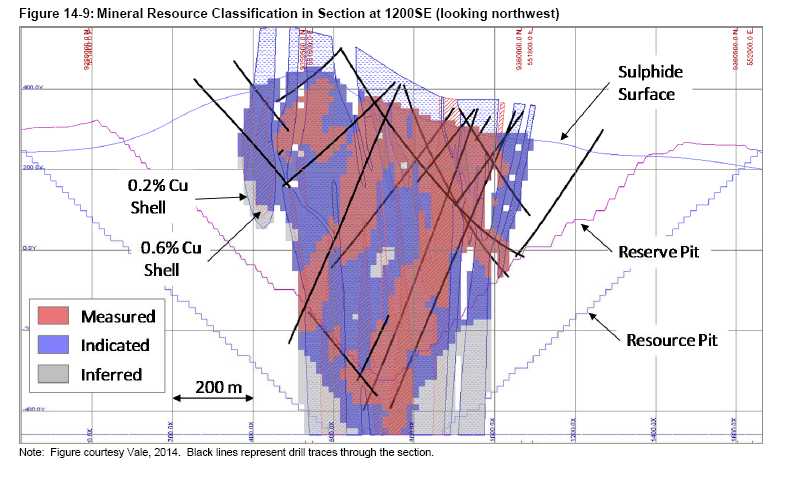
| March 2016
Project Number:179678 |
Page 14-18 |
|
|
Salobo Operations Para State, Brazil NI 43-101 Technical Report |
| 14.11 |
Reasonable Prospects of Eventual Economic Extraction |
Mineral Resources exclusive of Mineral Reserves that are amenable to open pit mining methods at Salobo represent sulphide mineralization that is adjacent to the current Mineral Reserve pit plus Inferred Mineral Resources within the Mineral Reserve pit. There are no oxide Mineral Resources.
The Mineral Resource estimates were prepared by Vale staff using the following approach:
| • |
Prices of US$3.67/lb for copper and US$1,500/oz for gold for Whittle optimization of the Mineral Resource pit | |
| • |
Determine reasonableness of Mineral Resource pit extents, such as impact on planned mine infrastructure (waste lay down areas, processing facilities); distribution of deleterious mineral; adequateness of current waste storage capacity | |
| • |
Consider a cutoff grade of 0.286% copper equivalent (CuEq), consistent with Salobo’s cutoff grade used for Mineral Reserves reported in 2012 | |
| • |
Prepare a provisional extension of the LOM production schedule to include material above this cutoff grade | |
| • |
Apply metal price and exchange rate assumptions to forecast cash flows, including appropriate provision for sustaining capital and operating costs | |
| • |
Scheduling waste and mineralized material | |
| • | Determine if the Mineral Resource estimates demonstrate a positive cash flow |
External mining dilution and mine loss were not applied. Table 14-8 summarizes the technical and economic parameters used for optimizing the Mineral Resource pit. Table 14-9 summarizes the technical and economic parameters used to calculate the Mineral Resource cutoff grade of 0.286% CuEq.
| March 2016
Project Number:179678 |
Page 14-19 |
|
|
Salobo Operations Para State, Brazil NI 43-101 Technical Report |
| Table 14-8: | Salobo Mineral Resource Open Pit Optimization Technical and Economic Parameters Summary |
| Item | Value | |
| Average pit slope angle (o) | 44.4 | |
| Mining cost ($US/t) | 3.84 | |
| Vertical component per bench ($US/t) | ||
| > 250 m Elev. | 0.016 | |
| < 250 m Elev. | 0.046 | |
| Processing cost ($US/t) | 11.48 | |
| G&A, logistic, and other costs | 2.896 | |
| Cu selling cost ($US/lb) | 0.696 | |
| Au selling cost ($US/g) | 0.013 | |
| Au selling cost ($US/oz) | 0.45 | |
| Cu process recovery | -2.3/Cu + 90.23 | |
| Au process recovery | 2.56*Au + 64.9 | |
| Cu smelter recovery (%) | 96.7 | |
| Au smelter recovery (%) | 93.94 | |
| Cu price ($US/lb) | 3.67 | |
| Au price ($US/oz) | 1,500 |
| Table 14-9: | Salobo Mineral Resource 0.286% CuEq Cutoff Grade Optimization Technical and Economic Parameters Summary |
| Item | Value | |
| Mill feed to waste mining cost difference ($US/t) | 0.4 | |
| Processing cost ($US/t) | 11.48 | |
| G&A, administrative, and mitigation | 2.77 | |
| Cu selling cost ($US/lb) | 0.669 | |
| Au selling cost ($US/oz) | 0.45 | |
| Cu process recovery (%) | -2.3/Cu + 90.23 | |
| Au process recovery (%) | 66 | |
| Cu smelter recovery (%) | 96.7 | |
| Au smelter recovery (%) | 93.94 | |
| transport loss (% | 0.5 | |
| Cu price ($US/lb) | 3.67 | |
| Au Price ($US/oz) | 1,500 |
| March 2016
Project Number:179678 |
Page 14-20 |
|
|
Salobo Operations Para State, Brazil NI 43-101 Technical Report |
| 14.12 |
Mineral Resource Statement |
Mineral Resources considered amenable to open pit mining methods are reported exclusive of Mineral Reserves and are constrained within a Whittle pit shell. The estimate has an effective date of 31 December 2015. Mineral Resources have been classified using the 2014 CIM Definition Standards.
Estimates were prepared by Mr Joao Dirk V. Reuwsaat, a Vale employee. Dr Georges Verly, P.Eng., an Amec Foster Wheeler employee, is the Qualified Person for the estimate. Table 14-10 shows the estimated Measured and Indicated sulphide Mineral Resources reported at a cutoff grade of 0.286% CuEq; Table 14-11 presents the Inferred Mineral Resource estimate using the same cutoff grade. There are no oxide Mineral Resources.
| 14.13 |
Factors That May Affect the Mineral Resource Estimate |
Risk factors that could potentially affect the Mineral Resources estimates include:
| • | Assumptions used to generate the conceptual data for consideration of reasonable prospects of eventual economic extraction including: | ||
| − | Long-term commodity price and exchange rate assumptions | ||
| − | Changes in local interpretations of mineralization geometry and continuity of mineralization zones | ||
| − | Density and domain assignments | ||
| − | Geotechnical and hydrogeological assumptions | ||
| − | Assumed mining methods and variations in methodologies | ||
| − | Operating and capital cost assumptions | ||
| − | Metal recovery assumptions | ||
| − | Concentrate grade and smelting/refining terms | ||
| − | Changes to cutoff grades and CuEq values used to report the estimates. | ||
| • | Changes to the permitting, social, environmental, and political/legal and royalty assumptions. | ||
| March 2016
Project Number:179678 |
Page 14-21 |
|
|
Salobo Operations Para State, Brazil NI 43-101 Technical Report |
| Table 14-10: | Salobo Measured and Indicated Mineral Resources |
| Location | Confidence
Category |
Tonnes (Mt) |
Cu (%) |
Au (g/t) | |
| Adjacent to
2015 LOM Mineral Reserve Pit |
Measured Indicated |
44.1 185.0 |
0.83 0.72 |
0.48 0.37 | |
| Subtotal Measured and Indicated |
229.1 | 0.74 | 0.39 |
| Table 14-11: | Salobo Inferred Mineral Resources |
| Location | Confidence
Category |
Tonnes (Mt) |
Cu (%) |
Au (g/t) | |
| Adjacent to 2015 LOM Mineral Reserve Pit |
Inferred | 132.7 | 0.6 | 0.3 | |
| Within 2015 LOM Mineral Reserve Pit |
Inferred | 16.0 | 0.5 | 0.3 | |
| Total Inferred | 148.7 | 0.6 | 0.3 |
Notes to accompany Mineral Resource tables:
| 1. |
Mineral Resource estimates were prepared by Mr Joao Dirk V. Reuwsaat, a Vale employee. The Qualified Person for the estimate is Dr Georges Verly, P.Eng., an Amec Foster Wheeler employee. | |
| 2. |
Mineral Resources have an effective date of 31 December 2015. Mineral Resources are reported exclusive of Mineral Reserves. Mineral Resources that are not Mineral Reserves do not have demonstrated economic viability. | |
| 3. |
Mineral Resources were estimated assuming open pit mining methods and are reported at an approximate cutoff grade of 0.286% copper equivalent (CuEq). The CuEq grade incorporates the following: metal prices of US$3.67/lb Cu, US$1,500/oz Au; process recoveries of -2.3/Cu + 90.23% for Cu and 66% for Au; US$0.4/t mill feed to waste mining cost difference; US$11.48/t process cost; selling costs of US$0.669/lb for Cu and US$0.45/oz for Au; US$2.77/t general and administrative (G&A) and other costs; smelter recovery of 96.7% for Cu and 93.94% for Au; transport loss of 0.5%. | |
| 4. |
The pit shell constraining the estimate used the following assumptions: metal prices of US$ 3.67/lb Cu, US$ 1,500/oz Au; process percent recoveries of -2.3/Cu +90.23% for Cu and 2.56*Au + 64.9% for Au; US$3.84/t mining cost plus vertical component per bench of US$0.016/t (> 250 m elevation) and US$0.046/t (<250 m elevation); US$11.48/t process cost; selling costs of $US0.696/lb for Cu and $US0.45/oz for Au; US$2.9/t G&A, logistic and other costs; smelter recovery of 96.7% for Cu and 93.94% for Au; and inter-ramp pit slope angles that ranged from 48–52º. | |
| 5. |
No allowances for mining recovery and external dilution have been applied. Contact dilution between grade shells within 15 m x 15 m x 15 m blocks was considered. | |
| 6. |
Tonnage figures are reported as million metric tonnes (Mt); copper grade figures as percent (%) and gold grade figures as grams per tonne (g/t). | |
| 7. |
Tonnages are rounded to the nearest hundred thousand tonnes; grades are rounded to two decimal places for Measured and Indicated Mineral Resources, and one decimal place for Inferred Mineral Resources. | |
| 8. |
Rounding as required by reporting guidelines may result in apparent summation differences. |
| March 2016
Project Number:179678 |
Page 14-22 |
|
|
Salobo Operations Para State, Brazil NI 43-101 Technical Report |
| 14.14 |
Comments on Section 14 |
Mineral Resources are classified using the 2014 CIM Definition Standards.
There are no other known environmental, legal, title, taxation, socioeconomic, marketing, political or other relevant factors that would materially affect the estimation of Mineral Resources that are not discussed in this Report.
The continuity of the grade shells is good along the sub-vertical direction, and the shells have reasonable continuity along strike. Mill feed reconciliation with open pit production from January 2014 to June 2015 was considered to be good.
| March 2016
Project Number:179678 |
Page 14-23 |
|
|
Salobo Operations Para State, Brazil NI 43-101 Technical Report |
| 15.0 |
MINERAL RESERVE ESTIMATES |
| 15.1 |
Introduction |
As this is an operating mine, the LOM planning process uses previous actual availabilities, utilizations and cost as a reference to initially develop a five-year plan that is subsequently updated and used as the basis for the pit optimization and LOMP. The planning sequence is shown in Figure 15-1.
| 15.2 |
Mineral Reserves Statement |
Mineral Reserve estimates were prepared by Mr Wellington F. de Paula, a Vale employee. Mr Gerrit Vos, P.Eng., an Amec Foster Wheeler employee, is the Qualified Person for the estimate.
Mineral Reserves have been classified using the 2014 CIM Definition Standards and have an effective date of 31 December, 2015.
Table 15-1 shows the estimated sulphide Mineral Reserves reported at 0.253% CuEq cutoff grade. There are no oxide Mineral Reserves.
The 2014 Mineral Reserves were made current by subtracting the forecast production from the 2015 updated five-year mine plan.
| 15.3 |
Factors That May Affect the Mineral Reserve Estimate |
Figure 15-2 shows the sensitivity of the discounted cash flow for different process and mining costs, as well as at different copper and gold prices.
The following factors may affect the Mineral Reserve estimate
| • | Copper and gold prices | |
| • | US dollar exchange rate | |
| • | Brazilian inflation rate | |
| • | Geotechnical and hydrogeological assumptions | |
| • | Ability of the mining operation to meet the annual production rate | |
| • | Process plant recoveries and the ability to control deleterious element levels within LOMP expectations | |
| • | Ability to meet and maintain permitting and environmental licences, and the ability to maintain social licence to operate. |
| March 2016
Project Number:179678 |
Page 15-1 |
|
|
Salobo Operations Para State, Brazil NI 43-101 Technical Report |

| March 2016
Project Number:179678 |
Page 15-2 |
|
|
Salobo Operations Para State, Brazil NI 43-101 Technical Report |
| Table 15-1: | Mineral Reserves Estimate |
| Area | Classification | Tonnes (Mt) |
Cu (%) |
Au (g/t) | |
| Salobo Pit Phase 2 | 2.7 | 0.69 | 0.34 | ||
| Salobo Pit Phase 3 | 132.2 | 0.77 | 0.44 | ||
| Salobo Pit Phase 4 | 97.1 | 0.73 | 0.39 | ||
| Salobo Pit Phase 5 | Proven | 94.4 | 0.75 | 0.37 | |
| Salobo Pit Phase 6 | 126.0 | 0.65 | 0.40 | ||
| Salobo Pit Phase 7 | 159.1 | 0.72 | 0.36 | ||
| Stockpiles | 42.9 | 0.48 | 0.24 | ||
| Salobo Pit Phase 2 | 0.326 | 0.62 | 0.21 | ||
| Salobo Pit Phase 3 | 24.0 | 0.57 | 0.28 | ||
| Salobo Pit Phase 4 | Probable | 53.1 | 0.60 | 0.30 | |
| Salobo Pit Phase 5 | 45.8 | 0.56 | 0.24 | ||
| Salobo Pit Phase 6 | 170.9 | 0.61 | 0.34 | ||
| Salobo Pit Phase 7 | 208.2 | 0.64 | 0.30 | ||
| Total Proven and Probable | 1,156.8 | 0.67 | 0.35 | ||
Notes to accompany the Mineral Reserve Table
| 1. |
Mineral Reserve estimates were prepared by Mr Wellington F. de Paula, an employee of Vale. The Qualified Person for the estimate is Mr Gerrit Vos, P.Eng.., an Amec Foster Wheeler employee. | |
| 2. |
Mineral Reserves have an effective date of 31 December 2015. | |
| 3. |
Mineral Reserves are reported within the open pit design based on metal prices of $3.45/lb copper, and $1,250/oz gold, with variable recoveries by grade and ore type. A 5% dilution is included, and ore losses are considered to be 0%. Pit inter-ramp slope angles vary from 48–52º. | |
| 4. |
Mineral Reserves that are classified as amenable to direct processing are defined as mineralization above a lower cutoff grade that varies by year between 0.65–1.03% Cu and 0.36–0.64 g/t Au and represents ore that is to be mined and directly processed. | |
| 5. |
Mineral Reserves noted as “stockpiled” material consists of ore tonnage above a 0.253% copper equivalent (CuEq) cutoff grade that was mined and stockpiled before being sent to the mill. This stockpiled tonnage includes ore mined before mill start-up, and lower-grade ore mined during pre-production commercial production phases. Stockpiling of low-grade material will continue but this ore will be fed to the plant at the end of the mine life. | |
| 6. |
Mineral Reserves are reported above a cutoff grade of 0.253% CuEq. The CuEq value used for cutoff grades is based on $3.45/lb copper and $1,250/oz gold and based on the equation: CuEq(%) = Cu(%) + Au(g/t) x 0.40677651 / RecCu (%). | |
| 7. |
Tonnage figures are reported as million metric tonnes (Mt); copper grade figures as percent (%) and gold grade figures as grams per tonne (g/t). | |
| 8. |
Tonnages are rounded to the nearest million tonnes; grades are rounded to two decimal places. | |
| 9. |
Rounding as required by reporting guidelines may result in apparent summation differences. |
| March 2016
Project Number:179678 |
Page 15-3 |
|
|
Salobo Operations Para State, Brazil NI 43-101 Technical Report |

| 15.4 |
Pit Optimization |
The most recent pit optimization was in 2014, and the most significant impacts on the pit design were due to changes in assumptions relating to operating costs, sales costs, and exchange rates.
Open pit optimization was performed using the commercially-available Whittle Four-XTMv4.4 software. A 5%, zero-grade material dilution factor was included, and a 100% material recovery was assumed for pit optimization to account for selectivity when mining at the ore body contacts. A mining cost adjustment factor (MCAF) was applied to account for incremental increases in haulage cost with depth.
In addition to the above, a discount factor of 10% per year was included to account for the time value of money, assuming an annual drop-down rate of a maximum of five benches. Only Measured and Indicated Mineral Resources were used, all Inferred material was considered as waste in pit optimization, and subsequently in LOM planning.
Optimization designs assumed the key parameters listed in Table 15-2. An expanded description of key optimization inputs is included in the sub-sections of the Report that follow.
| March 2016
Project Number:179678 |
Page 15-4 |
|
|
Salobo Operations Para State, Brazil NI 43-101 Technical Report |
| Table 15-2: | Pit Optimization Parameters |
| Area | Unit | Value | |
| Copper price | US$ | 3.45 | |
| Gold price | US$ | 1,250 | |
| Exchange rate | $R/$US | 2.61 | |
| Mining cost (includes sustaining) | US$/t (average) | 4.17 | |
| Mining reference cost | US$/t (average) | 3.76 | |
| Vertical component per bench, above 250 m bench | US$/t per bench | 0.0056 | |
| Vertical component per bench, below 250 m bench | US$/t per bench | 0.0566 | |
| Process cost (includes sustaining) | US$/t | 10.59 | |
| Logistics cost | US$/lb | 0.101 | |
| General and administrative cost (includes sustaining) | US$/t | 1.96 | |
| Copper selling cost | US$/lb | 0.577 | |
| Gold selling cost | US$/g | 0.017 | |
| Mining capacity | Mt/a | 126 | |
| Cutoff | %CuEq. | 0.253 | |
| Mining Recovery | % | 100 | |
| Dilution | % | 5 | |
| Mine production rate – ore | Mt/a | 40.00 | |
| Mine production rate – waste | Mt/a | 86.00 | |
| Plant capacity | Mt/a | 24 | |
| Copper recovery | % | 96.70 | |
| Gold recovery | % | 93.94 | |
| Concentrate grade | % | 38 | |
| Transport losses | % | 0.50 | |
| Moisture | % | 10 |
| 15.4.1 |
Selective Mining Unit Sizing |
The size of the selective mining unit (SMU) was established as 15 m x 15 m x 15 m, the main reason being its adequacy to the selected mining fleet. As the current blast-hole grid is 6.6 m x 4.8 m on average, each SMU is covered by about seven blastholes. Amec Foster Wheeler considers this to be reasonable for such a large operation as Salobo (65,000 t/d). From the geological point of view, the SMU size is coherent with the known dimensions of the mineralized bodies, and their relative continuity in plan and depth.
| 15.4.2 |
Surface Topography |
The surface used as the starting point of the 2015 reserve estimate was the surface, measured with a GPS topography instrument and provided on 12 August, 2014. This surface was then extrapolated to 31 December, 2015, and the monthly planning was updated using the 2015 monthly budget figures in order to define the mining faces and start surface as at 31 December, 2015.
| March 2016
Project Number:179678 |
Page 15-5 |
|
|
Salobo Operations Para State, Brazil NI 43-101 Technical Report |
| 15.4.3 |
Density and Moisture |
Density and moisture were determined during the exploration phase, which are discussed in Section 11.3. No additional testing has taken place afterwards. Experience from the nearby Sossego copper mine has shown that additional testing is not required.
| 15.4.4 |
Pit Slope Angles |
Early geotechnical studies, begun in the late 1980s, comprised primarily structural and discontinuity mapping. In 1993, Sergio Brito Consulting (SBC) in conjunction with Piteau and Associates were contracted to assess the rock mass and define bench face and overall slope angles at a prefeasibility level. This work identified several geotechnical slope domains for design in an open pit.
In 1997, a seven hole geotechnical drill program collected 3,847 m of NQ core for analysis. SBC conducted field-work, data collection and laboratory testwork to determine the intact rock mass strength characteristics. Golder Associates (Golder) was commissioned to oversee the data collection and data analysis to support a feasibility study.
SBC prepared a compilation of data and seven additional geotechnical holes were drilled between 2003 and 2004, comprising 3,743 m of oriented core. New stereographic interpretations were generated for 6,500 data points. Kinematic assessment identified the likely pit slope failure modes to be planar, toppling and discrete wedges
In 2007, the Brazilian engineering company BVP Engenharia e Projetos (BVP Engenharia) consolidated all available geotechnical information and provided recommendations for a 24 Mt/a pit design. BVP Engenharia reviewed the previous division of the pit into two structural domains; the northern area (footwall) and the south area (hanging wall). The review of structural data revealed the foliation to have a distinct general trend in the northwest and southeast areas of the pit, and thus the pit was divided into two new structural domains.
The intact rock was reported to be “strong”, with uniaxial compressive strength (UCS) results (excluding weathered material) ranging from 50 to 200 MPa. Shear resistance laboratory testing was performed and found friction angles of 33° for foliation, 38° for joint sets and approximately 27° for fault/shear zones after testing the various unweathered rock types.
Other geotechnical studies conducted included:
| March 2016
Project Number:179678 |
Page 15-6 |
|
|
Salobo Operations Para State, Brazil NI 43-101 Technical Report |
| • | Installing wells and completing pumping tests in fault systems | |
| • | Performing surface seismic refraction testing | |
| • | Geotechnical mapping in the exploration drift | |
| • | Outcrop mapping | |
| • | Kinematic analysis of rock discontinuity data | |
| • | Limit equilibrium analysis for pit slopes | |
| • | Hydrogeological modeling for evaluation of pit dewatering equipment. |
In 2009, an independent geotechnical review was performed by Peter Stacey of Stacey Mining Geotechnical Ltd (Stacey) for the Sossego and Salobo Operations. Stacey recommended additional on-site geotechnical data collection and investigations.
Table 15-3 displays the seven geotechnical design sectors developed by BVP Engenharia for Salobo Mine, which are then illustrated in Figure 15-2.
| 15.4.5 |
Mining Costs |
The mining costs were based on the 2013 LOM cost calculation, where some historical cost and the cost from the nearby Sossego mine were used (Table 15-4).
The parameters shown in Table 15-4 were used for pit optimization only. Final costs and parameters are detailed later in this Report.
| 15.4.6 |
Consideration of Dilution, Mining Losses and Reconciliation |
Since the start-up of the mine in 2012, a reconciliation program has been in place to reconcile the long-term block model, the short-term block model, the mine production, and the process plant data on a quarterly basis.
As part of the ore production is stockpiled until the pit is mined out, and only afterwards fed to the plant, the reconciliation process is complicated. In addition, during the startup, quantities were limited and factors are less reliable.
Experience and reconciliation has shown that no mining losses have to be considered, which means that 100% of the ore is recovered (i.e. 0% mining losses); however, a 5% dilution factor needs to be applied.
The basic reconciliation flow is shown in Figure 15-4, while the detailed reconciliation scheme is shown is Figure 15-5.
| March 2016
Project Number:179678 |
Page 15-7 |
|
|
Salobo Operations Para State, Brazil NI 43-101 Technical Report |
| Table 15-3: | Geotechnical Design Sectors |
| Sector | Vertical Berm | Face Angle | Berm Width | Inter Ramp | ||
| Spacing | (degree) | (m) | Angle | |||
| (m) | (degree) | |||||
| Saprolite and semi- | 7.5 or 15 | 52 | 10 | 35.0 | ||
| weathered material | ||||||
| Sector I | I | 15 | 70 | 8 | 48.1 | |
| IA | 15 | 70 | 8 | 48.1 | ||
| IB | 30 | 70 | 12.5 | 52.0 | ||
| IC | 30 | 70 | 12.5 | 52.0 | ||
| Sector II | II | 30 | 70 | 12.5 | 52.0 | |
| IIA | 15 | 70 | 8 | 48.1 | ||
| IIB | 30 | 70 | 12.5 | 52.0 | ||
| Sector III | III | 30 | 70 | 12.5 | 52.0 | |
| Sector IV | IV | 30 | 70 | 12.5 | 52.0 | |
| Sector V | V | 30 | 70 | 12.5 | 52.0 | |
| VA | 15 | 70 | 8 | 48.1 | ||
| Sector VI | VI | 30 | 70 | 12.5 | 52.0 | |
| VIA | 15 | 70 | 8 | 48.1 | ||
| VIB | 30 | 70 | 12.5 | 52.0 | ||
| VIC | 30 | 70 | 12.5 | 52.0 | ||
| VID | 15 | 70 | 8 | 48.1 | ||
| Sector VII | VII | 30 | 70 | 12.5 | 52.0 |
| March 2016
Project Number:179678 |
Page 15-8 |
|
|
Salobo Operations Para State, Brazil NI 43-101 Technical Report |

| March 2016
Project Number:179678 |
Page 15-9 |
|
|
Salobo Operations Para State, Brazil NI 43-101 Technical Report |
| Table 15-4: | Mining Cost Assumptions |
| Year | Tonnes Mined (kt) |
Drilling
(US$/t) |
Blasting
(US$/t) |
Loading (US$/t) |
Hauling
(US$/t) |
Aux Services
(US$/t) |
Dewatering
(US$/t) |
Management, Tech. Services, Cont (US$/t) |
Sustaining
Capital (US$/t) |
Mining Costs (US$/t) |
| 2014 | 68,924 | 0.265 | 0.380 | 0.279 | 0.819 | 0.4845 | 0.0113 | 0.9496 | 0.8877 | 4.08 |
| 2015 | 95,391 | 0.365 | 0.508 | 0.295 | 0.734 | 0.3539 | 0.0083 | 0.7888 | 1.7472 | 4.80 |
| 2016 | 116,228 | 0.324 | 0.451 | 0.277 | 0.737 | 0.3091 | 0.0069 | 0.6887 | 0.6446 | 3.44 |
| 2017 | 115,697 | 0.353 | 0.483 | 0.326 | 0.724 | 0.3271 | 0.0070 | 0.7062 | 0.2731 | 3.20 |
| 2018 | 116,388 | 0.323 | 0.431 | 0.327 | 0.776 | 0.3229 | 0.0070 | 0.6993 | 0.091 | 2.98 |
| 2019 | 115,479 | 0.356 | 0.469 | 0.327 | 0.818 | 0.3513 | 0.0071 | 0.7240 | 0.3725 | 3.43 |
| 2020 | 115,154 | 0.375 | 0.494 | 0.365 | 0.923 | 0.3544 | 0.0074 | 0.7524 | 0.2449 | 3.52 |
| 2021 | 116,413 | 0.330 | 0.428 | 0.352 | 0.905 | 0.3435 | 0.0076 | 0.7283 | 0.1568 | 3.25 |
| 2022 | 116,193 | 0.331 | 0.435 | 0.352 | 0.769 | 0.3403 | 0.0078 | 0.7124 | 0.0853 | 3.03 |
| 2023 | 116,349 | 0.334 | 0.432 | 0.370 | 0.864 | 0.3303 | 0.0080 | 0.7249 | 0.1817 | 3.24 |
| 2024 | 115,867 | 0.351 | 0.454 | 0.368 | 0.87 | 0.3449 | 0.0086 | 0.7349 | 0.1828 | 3.31 |
| 2025 | 115,608 | 0.357 | 0.458 | 0.367 | 0.961 | 0.3424 | 0.0086 | 0.7523 | 1.6504 | 4.90 |
| 2026 | 115,023 | 0.394 | 0.494 | 0.370 | 1.079 | 0.3438 | 0.0087 | 0.7834 | 0.7153 | 4.19 |
| 2027 | 111,034 | 0.409 | 0.516 | 0.392 | 1.106 | 0.3708 | 0.0090 | 0.8135 | 0.9251 | 4.54 |
| 2028 | 111,014 | 0.416 | 0.526 | 0.391 | 1.242 | 0.3644 | 0.0090 | 0.8331 | 1.0047 | 4.79 |
| 2029 | 111,367 | 0.402 | 0.504 | 0.342 | 1.295 | 0.3615 | 0.0090 | 0.8288 | 0.0711 | 3.81 |
| 2030 | 111,880 | 0.372 | 0.462 | 0.340 | 1.178 | 0.3482 | 0.0090 | 0.8033 | 0.3775 | 3.89 |
| 2031 | 111,624 | 0.392 | 0.479 | 0.379 | 1.141 | 0.3538 | 0.0094 | 0.8067 | 0.3689 | 3.93 |
| 2032 | 111,796 | 0.381 | 0.466 | 0.380 | 1.094 | 0.3217 | 0.0096 | 0.786 | 0.0579 | 3.50 |
| 2033 | 111,210 | 0.395 | 0.499 | 0.399 | 1.140 | 0.3173 | 0.0099 | 0.8013 | 0.7549 | 4.32 |
| 2034 | 111,016 | 0.414 | 0.518 | 0.381 | 1.293 | 0.3457 | 0.0100 | 0.8339 | 0.9342 | 4.73 |
| 2035 | 111,012 | 0.416 | 0.514 | 0.319 | 1.308 | 0.3438 | 0.0102 | 0.8273 | 0.6869 | 4.42 |
| 2036 | 111,016 | 0.419 | 0.521 | 0.317 | 1.491 | 0.3118 | 0.0102 | 0.8485 | 0.5356 | 4.45 |
| 2037 | 98,902 | 0.427 | 0.532 | 0.322 | 1.753 | 0.3470 | 0.0116 | 0.9441 | 1.9362 | 6.27 |
| 2038 | 92,723 | 0.434 | 0.541 | 0.287 | 1.913 | 0.3718 | 0.0126 | 0.9988 | 0.258 | 4.82 |
| 2039 | 80,363 | 0.445 | 0.561 | 0.320 | 2.044 | 0.4327 | 0.0146 | 1.1135 | 0.2286 | 5.16 |
| 2040 | 59,763 | 0.483 | 0.587 | 0.347 | 2.241 | 0.534 | 0.0198 | 1.3698 | 0.2708 | 5.85 |
| 2041 | 41,215 | 0.505 | 0.615 | 0.497 | 2.705 | 0.7377 | 0.0298 | 1.8427 | 0.12 | 7.05 |
| 2042 | 3,477 | 1.948 | 1.331 | 3.336 | 12.157 | 5.724 | 0.1396 | 15.7662 | 7.0089 | 47.41 |
| Average Cost US$/ton | 0.382 | 0.487 | 0.352 | 1.157 | 0.364 | 0.010 | 0.843 | 0.572 | 4.17 | |
Note: Hauling costs (US$/t): initial value = 0.8192; decreasing value = 0.7242; increasing value = 2.7046. Decreasing US$/banco = 0.00559; increasing US$/banco = 0.05658
| March 2016
Project Number:179678 |
Page 15-10 |
|
|
Salobo Operations Para State, Brazil NI 43-101 Technical Report |
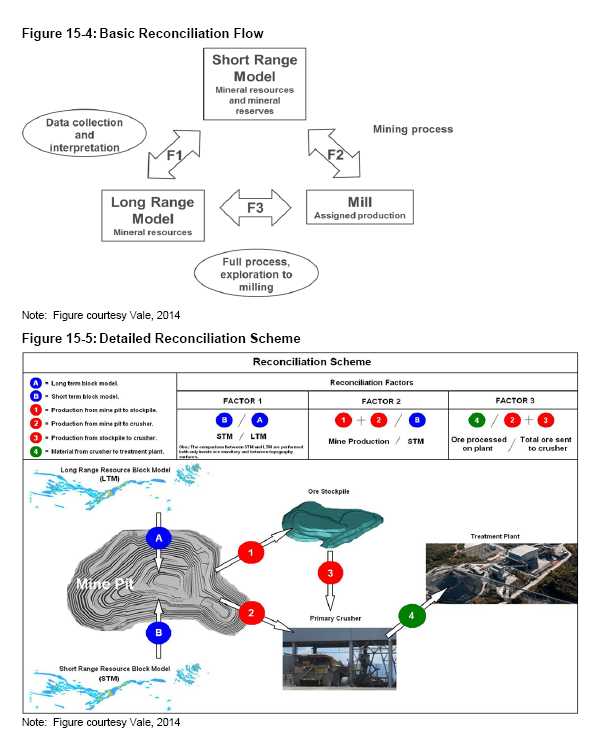
| March 2016
Project Number:179678 |
Page 15-11 |
|
|
Salobo Operations Para State, Brazil NI 43-101 Technical Report |
Experience in the nearby Sossego mine has shown that dilution can be reduced by using small hydraulic backhoe excavators (i.e. CAT 374 (3.8m 3 capacity) with 40 t 8 x 4 trucks) in narrow ore zones and deep portions of the pit, and this will also result in additional ore recovery that is already included in the updated mine design and mine plan.
Based on the results of F1 in 2013 and most of 2014, a 5% dilution factor was applied for pit optimization and LOM planning. The dilution factor needs to be reviewed on a regular basis.
| 15.4.7 |
Plant Recovery |
Plant recovery assumptions are discussed in Section 13.2.
| 15.5 |
Pit and Phase Selection |
Figure 15-6, which is a pit-by-pit graph, shows the different pits for different revenue factors, and illustrates why Pit 42, with a revenue factor of one, representing a copper price of US$3.45/lb and a gold price of US$1,250/oz, was selected as the base for further mine planning.
Vale has had a streaming agreement with Silver Wheaton for 25% of the gold produced since 2013. In early March 2015, the agreement amended so that Silver Wheaton was entitled to 50% of the gold produced. Vale received a capital injection up front, and Silver Wheaton will buy 50% of all gold produced during the LOM for US$400/oz, or when the gold price is lower than US$400/oz, will purchase gold at the actual gold price.
The influence of the streaming agreement with Silver Wheaton has not been considered in the 2014 pit optimization parameters. It has, however, been considered in the cash flow analysis, as discussed in Section 22. Any revenues from the gold byproduct is considered to be an operating cost credit.
| 15.5.1 |
Final Pit Design |
In order to provide reasonable operation flexibility, sustainable ore supply, and the maximization of operation value and net present value (NPV), the ultimate pit was split into phases. The phase selection was driven by the minimum mining width, the number of benches able to be mined per year, and the NPV optimization. The final pit design approximately follows the Whittle optimization pits, but uses bigger steps.
A minimum width of 60 m was considered between the expansion phases. Due to the size of the equipment, the required ramp widths were designed from 35–42 m with a maximum ramp gradient of 10%. In 2015 the pit design was optimized by using 25 m wide ramps for the last six benches, since these benches will be mined using smaller equipment.
| March 2016
Project Number:179678 |
Page 15-12 |
|
|
Salobo Operations Para State, Brazil NI 43-101 Technical Report |

After completion of the operational pit and mining phase designs, an annual mine production schedule was prepared by dividing each mining phase in smaller increments. The annual requirement for ore and waste production was taken into account. This included feeding the processing plant, stockpiling low-grade ore and mining of waste material at rates sufficient to maintain the required stripping ratio. Waste rock facilities (WRFs), low-grade stockpiles, and the associated haul roads were designed to ensure that there was sufficient capacity to accommodate storage for the different material types.
The plan is to provide an approximately steady production feed of an average of 24 Mt to the processing plant and a maximum mining movement of 126 Mt (combined ore and waste).
Figure 15-7 shows longitudinal and cross-section view of the open pit design for the final stage of operations. The condemnation pit, which is the same as the resource pit, is used to confirm that none of the infrastructure or operational facilities such as crushers, workshops, fuel tanks, waste management facilities or tailings storage facility fall within the pit shell. Only part of the low-grade stockpile, which is already part of the Mineral Reserves, is within the resource pit, but the low-grade stockpile will be fed to the plant after the reserve pit is mined out. This condemnation pit limit provides a buffer against unexpected costs arising in any future redesign of the open pit. The WRF is designed in a way that the distance between the WRF limit and the resource pit is at least 50 m.
| March 2016
Project Number:179678 |
Page 15-13 |
|
Salobo Operations Para State, Brazil NI 43-101 Technical Report |
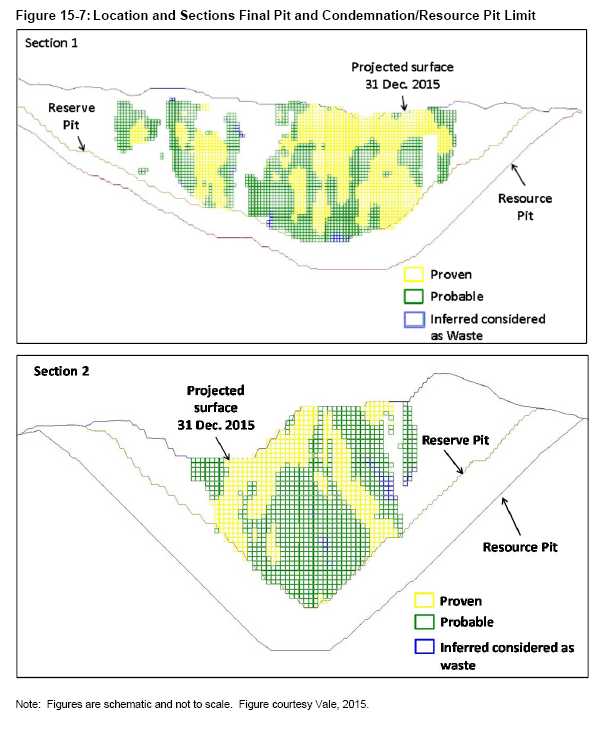
| March 2016
Project Number:179678 |
Page 15-14 |
|
Salobo Operations Para State, Brazil NI 43-101 Technical Report |
The general mine design criteria for the current and proposed mining methods are presented in Table 15-5.
The mine planning objective is to mine the ore sequentially in mining phases, considering the largest possible vertical spacing between phases. Each phase develops two different ramp systems in order to secure production during blasting and in case one ramp system can temporarily not be used. However, the last eight benches at the final pit bottom only have one access ramp.
Seven pit phases are planned. Phase I is already mined-out and mining currently takes place in Phase II and Phase III (the situation in 2015; Figure 15-8). Production by phase is summarized in Table 15-6.
| 15.6 |
Comments on Section 15 |
Mineral Reserves are classified using the 2014 CIM Definition Standards.
Amec Foster Wheeler reviewed the optimization and design work supporting the 2015 Mineral Reserves. The current Mineral Reserve estimates are based on the most current knowledge, permit status and engineering and operational constraints. Mineral Reserve declaration is supported by a positive cashflow.
Current mining practice utilizes a “rounded” cutoff grade of 0.3% CuEq. This rounding results in material that is between the actual marginal cutoff grade of 0.253% and 0.3% CuEq being sent to waste. Amec Foster Wheeler recommends ensuring that all material above 0.253% CuEq is stockpiled, and that the practice of working with the “rounded-up” value of 0.3% CuEq is discontinued for mine stockpiling purposes.
The ore placed on the low-grade stockpile could potentially partly oxidize, which could lead to a reduction of the planned recoveries. Amec Foster Wheeler recommends Vale investigate any potential degradation in copper or gold recoveries due to stockpiling.
| March 2016 | Page 15-15 | |
| Project Number:179678 |
|
Salobo Operations Para State, Brazil NI 43-101 Technical Report |
Table 15-5: Mine Design Criteria
| Criteria | Salobo | |
| Minimum mining width (m) | 60 | |
| Bench height (m) | 15 | |
| Berm (m) - Bedrock | 8–12.5 | |
| Ramp width (m) | 35–42 | |
| Ramp decline grade (%) | 10 | |
| Last 6 benches: | ||
| Ramp width (m) | 25 |
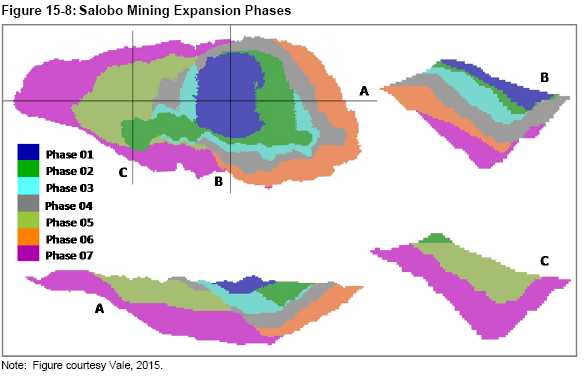
| March 2016 | Page 15-16 | |
| Project Number:179678 |
|
Salobo Operations Para State, Brazil NI 43-101 Technical Report |
Table 15-6: Production by Pit Phase
| Phase | Total Moved
(dry kt) |
Waste
Saprolite (dry kt) |
Waste
Saprolite Rock (dry kt) |
Waste
Fresh Rock (dry kt) |
Total
Waste (dry kt) |
Ore (dry kt) |
Cu (% dil) |
Aug (g/t dil) |
Strip Ratio |
| Phase I | Mined out | ||||||||
| Phase II | 32,532 | 111 | 164 | 12,955 | 13,231 | 19,301 | 0.7889 | 0.4127 | 0.69 |
| Phase III | 264,045 | 11,660 | 6,721 | 52,322 | 70,704 | 193,341 | 0.6961 | 0.3864 | 0.37 |
| Phase IV | 358,110 | 45,140 | 13,549 | 149,205 | 207,894 | 150,216 | 0.6825 | 0.3576 | 1.38 |
| Phase V | 350,846 | 51,982 | 17,286 | 141,331 | 210,559 | 140,247 | 0.6866 | 0.2390 | 1.50 |
| Phase VI | 724,456 | 63,208 | 18,725 | 345,585 | 427,518 | 296,938 | 0.6294 | 0.3366 | 1.44 |
| Phase VII | 1.023,880 | 87,132 | 23,836 | 545,638 | 656,606 | 367,274 | 0.6760 | 0.3248 | 1.79 |
| Total | 2,753,869 | 259,234 | 80,282 | 1,247,036 | 1,586,552 | 1,167,317 | 0.6715 | 0.3442 | 1.36 |
Note: Based on 2014 pit design, not adjusted for 2015 mining depletion.
| March 2016 | Page 15-17 | |
| Project Number:179678 |
|
Salobo Operations Para State, Brazil NI 43-101 Technical Report |
| 16.0 |
MINING METHODS |
| 16.1 |
Overview |
Mining at the Salobo Operations utilizes standard open pit methods with drilling and blasting, loading and hauling, using 15 m benches in rock and 8 m loading benches in saprolites.
Production drilling is done using Atlas Copco Pit Viper 351 and BE 49R drills, both with 12 ½ inch drill bits. The drill pattern varies depending on ore or waste. Smaller drills are used for pre-splitting and pit wall control.
Electrical cable shovels with 220 t and 327 t trucks are used for bulk mining, hydraulic shovels, and 220 t trucks are used in the saprolites with soft ground conditions and occasionally at pit bottoms to improve selectivity.
In order to improve the ore recovery at the bottom of the pit even further, the last six benches will be developed with 25 m wide, 12% ramps, and mining will be performed with a Cat 374 backhoe with a 4.5 m bucket and 8 x 4 40 t trucks. Although blasting will continue to be in 15 m benches, the mining will take place in 4 m slices.
The information presented in this sub-section is based on a 24 Mt/a mill feed and a maximum tonnage moved of 126 Mt/a (combined ore and waste).
| 16.2 |
Geotechnical Considerations |
A procedure is in place that includes periodic slope inspections for the open pits, WRFs, stockpiles, and tailings storage facility. The objectives of these inspections are to verify stability conditions, drain systems and ongoing workings. To minimize instability, there is a pit monitoring program whereby geotechnical staff evaluate the results of smooth blasting; and assess stability to prevent slope damage. These inspections are reported on a periodic basis.
Further to the inspections, Salobo Mine has installed an interferometric radar unit to monitor pit slopes real time. This system delivers constant monitoring of surface rock displacement and rock fall, allowing effective geotechnical risk management by creation of a historical database, and the definition of risk scales and alarms specific to the Salobo lithologies and geological structures.
A photograph of the open pit at the time of the site visit in June 2015 is presented in Figure 16-1.
| March 2016 | Page 16-1 | |
| Project Number:179678 |
|
Salobo Operations Para State, Brazil NI 43-101 Technical Report |
| 16.3 |
Consideration of Marginal Cutoff Grades and Dilution |
An analysis was undertaken to determine the break-even cutoff grade for defining ore and waste. The marginal cutoff grade is the minimum grade required to pay for the cost of processing the material. The equation is:
![]()
Where:
G(Cu): marginal cutoff grade
CTP: Total cost of processing, including costs of plant, G&A ($/t) and
additional cost mining ore
PrCu: price of copper ($/lb)
CvCu: cost of
sales of copper ($/lb)
RCCu: recovery from copper concentration (%)
RFCu: recovery from copper smelter (%)
PT: loss in concentrated
transport (%)
2,204.62: conversion factor tonne for pound.
An overall marginal cutoff grade of 0.253% Cu was calculated.
This marginal cutoff grade is not affected by the Silver Wheaton streaming agreement, as no gold prices are considered in the equation.
However, since ore value includes gold credits, a CuEq value should be used in place of a straight copper cutoff for the marginal cutoff grade used in operations. The following formula was developed for calculating (CuEq) grades with gold credits. The calculation is based on costs, prices and plant recoveries.
The general expression that was developed is:

Where: Cu = Copper grade (%)
Au = Gold grade (g/t)
PrAu = Gold selling price (US$/oz.)
CvAu = Gold
selling cost (US$/oz.)
RCAu= Gold flotation
recovery (%)
RFAu= Gold smelting recovery (%)
PrCu = Copper selling price (US$/lb.)
CvCu = Copper Selling cost (US$/lb.)
RCCu= Copper flotation recovery (%)
RFCu= Copper smelting recovery (%)
31.103 = Conversion factor: oz. (troy) to grams
2,204.62 = Conversion factor: ton to lb.
(avoirdupois).
| March 2016 | Page 16-2 | |
| Project Number:179678 |
|
Salobo Operations Para State, Brazil NI 43-101 Technical Report |

A 0.253% CuEq grade was used as the marginal cutoff for the initial reserve pit design.
In order to maximize the NPV, a procedure of decreasing cutoff grades has been developed, targeting the higher grades to feed the plant during operation.
During mining, initially only high-grade ore will be delivered to the plant. Medium-grade (0.60 to 0.85% CuEq) ore will be delivered either to the plant or to the stockpile. The cutoff varies year by year and depends how much high-grade ore is available, and any shortfall will be supplemented with medium-grade ore, which is already considered in the LOMP and any other, more detailed planning. The medium-grade ore, not used as plant feed, will be stockpiled together with low-grade ore (0.253 to 0.60% CuEq) for later plant feed. There is no physical separation between medium- and low- grade ore on the stockpile and these two ore categories are stockpiled together.
The pit optimization was carried out on a copper-equivalent basis, using the following formulae for the calculation of copper equivalent grade:
CuEq(%) = Cu(%) + Au(g/t) x 0.40677651 / RecCu(%)
based on a copper price of US$3.45/lb and a gold price of US$1,250/oz.
The CuEq grade was affected by the Silver Wheaton gold streaming agreement, whereby initially 25% of the gold was sold to Silver Wheaton for US$400/oz and as of March 2015, 50% of the gold is sold to Silver Wheaton for US$400/oz, while the remaining 50% will still be sold at market value.
The formula for CuEq changes to:
| March 2016 | Page 16-3 | |
| Project Number:179678 |
|
Salobo Operations Para State, Brazil NI 43-101 Technical Report |
CuEq(%) = Cu(%) + Au(g/t) x 0.2691 / RecCu(%),
based on a copper price of US$3.45/lb and a gold price of US$827/oz. This is, however, not used.
The consequence of the lower price received for half of the gold is that some low-grade material is still going to the low-grade stockpile, but should go to the WRF.
Given that the low-grade stockpile will only be fed to the plant after the cessation of mining in 2044, and because the Project discount rate is set at 10%, it is unlikely that the exclusion of gold in the marginal cutoff grade will have a material impact on Project economics.
| 16.4 |
Production Schedule |
The mining phases were incorporated into a yearly production plan with a steady production feed of 24 Mt/a to the mill. A stockpiling strategy is practiced, targeting the higher grades to feed the plant in the first years of operation. Initially only high-grade ore (>0.85% CuEq) will be delivered to the plant while medium-grade (0.60 to 0.85% CuEq) and low-grade (0.253 to 0.60% CuEq) ore will be stockpiled for later plant feed. Other parameters used are summarized in Table 16-1.
The open pit mine life spans approximately 29 years, ending in 2044. However, the process plant will continue operating, processing stockpiled material, for a further 21 years until 2065.
Phasing of the open pit development and application of the cutoff grade strategy allows higher-grade ore (>1.00% Cu) to be processed in the initial years of the operation. This is followed, from years 2025 to 2033, by the mining of progressively lower-grade material, averaging 0.48% Cu. The copper grade improves again during the final phases of pit development, then decreases as production ramps down towards the processing the lower-grade stockpile material.
During mining, the ore placed on the stockpiles is classified according to the following grade categories:
| • | Medium-grade: 0.60 to 0.85% CuEq | |
| • | Low-grade: 0.253 to 0.60% CuEq. |
There are no separate stockpiles for medium-grade and low-grade material, due to space restrictions, and for planning purposes, once the pit is mined out, it has been assumed that a blend of both will be fed to the plant.
The mining per phase per year, without “other movements” is shown in Figure 16-2, whereby no tonnage is shown for Phase 1, as that phase has already been mined out.
| March 2016 | Page 16-4 | |
| Project Number:179678 |
|
Salobo Operations Para State, Brazil NI 43-101 Technical Report |
Table 16-1: Mine Scheduling Capacity
| Rate/Capacity Assumption | Unit | Salobo | |
| Blasthole drilling | metres/day/drill | 157.3 | |
| Haulage truck capacity | tonnes/day/truck | 6,159 | |
| Shovel loading capacity | tonnes/day/shovel | 29,969 |

The mining schedule is illustrated in Table 16-2 and Figure 16-3. The figure also shows the CuEq grade to be processed in the plant. The “other movements”, noted in the figure, includes ore to be handled from the smaller, intermediate high-grade stockpiles to the crusher, as well as re-handling due to road construction and correcting bench levels. This number is in line with the actual tonnage reported for “other movements”.
Table 16-3 shows the low-grade to plant schedule.
| March 2016 | Page 16-5 | |
| Project Number:179678 |
|
Salobo Operations Para State, Brazil NI 43-101 Technical Report |
Table 16-2: LOMP Schedule
| Mine Plan | 2015 | 2016 | 2017 | 2018 | 2019 | 2020 | 2021 | 2022 | 2023 | 2024 | 2025 | 2026 | 2027 | 2028 | 2029 | |
| Total movements | kt | 118,794 | 126,009 | 125,646 | 126,018 | 126,160 | 126,000 | 126,000 | 126,000 | 126,000 | 126,000 | 126,000 | 126,000 | 126,000 | 126,000 | 126,000 |
| ROM | kt | 55,418 | 58,973 | 59,529 | 54,544 | 41,228 | 24,174 | 40,738 | 44,729 | 46,581 | 44,902 | 38,109 | 38,620 | 35,889 | 32,214 | 33,861 |
| Mine to crusher | kt | 20,351 | 20,510 | 22,884 | 24,305 | 22,818 | 24,000 | 24,000 | 24,000 | 24,000 | 24,000 | 24,000 | 24,000 | 24,000 | 24,000 | 24,000 |
| LG stock to crusher | kt | 2,375 | 3,157 | 1,206 | 10 | 1,945 | — | — | — | — | — | — | — | — | — | — |
| Total Waste | kt | 50,009 | 53,387 | 53,129 | 57,637 | 70,073 | 87,977 | 71,509 | 67,499 | 65,176 | 67,083 | 73,932 | 72,954 | 75,675 | 79,437 | 77,616 |
| Other movements | kt | 13,368 | 13,649 | 12,988 | 13,836 | 14,860 | 13,849 | 13,754 | 13,773 | 14,243 | 14,015 | 13,959 | 14,426 | 14,436 | 14,350 | 14,523 |
| Stripping ratio | % | 0.90 | 0.91 | 0.89 | 1.06 | 1.70 | 3.64 | 1.76 | 1.51 | 1.40 | 1.49 | 1.94 | 1.89 | 2.11 | 2.47 | 2.29 |
| Plant feed (wet basis) | kt | 23,489 | 23,677 | 24,090 | 24,314 | 24,763 | 24,823 | 24,000 | 24,000 | 24,000 | 24,000 | 24,000 | 24,000 | 24,000 | 24,000 | 24,000 |
| Plant feed (dry basis) | kt | 23,019 | 23,204 | 23,609 | 23,828 | 24,267 | 24,327 | 23,280 | 23,280 | 23,280 | 23,280 | 23,280 | 23,280 | 23,280 | 23,280 | 23,280 |
| Cu grade | % | 0.93 | 0.95 | 1.00 | 1.02 | 1.03 | 0.99 | 0.96 | 0.96 | 0.99 | 0.98 | 0.88 | 0.87 | 0.82 | 0.76 | 0.70 |
| Au grade | g/t | 0.52 | 0.60 | 0.62 | 0.61 | 0.59 | 0.52 | 0.50 | 0.52 | 0.54 | 0.55 | 0.49 | 0.49 | 0.46 | 0.42 | 0.37 |
| Mine Plan | 2030 | 2031 | 2032 | 2033 | 2034 | 2035 | 2036 | 2037 | 2038 | 2039 | 2040 | 2041 | 2042 | 2043 | 2044 | |
| Total movements | kt | 126,000 | 126,000 | 126,000 | 126,000 | 110,000 | 105,000 | 100,000 | 90,000 | 90,000 | 87,000 | 75,000 | 64,000 | 52,000 | 35,000 | 27,000 |
| ROM | kt | 34,113 | 39,485 | 39,443 | 36,151 | 32,165 | 32,164 | 31,845 | 31,755 | 36,677 | 38,781 | 41,091 | 41,778 | 40,304 | 28,229 | 13,311 |
| Mine to crusher | kt | 24,000 | 24,000 | 24,000 | 24,000 | 24,000 | 24,000 | 24,000 | 24,000 | 24,000 | 24,000 | 24,000 | 24,000 | 24,000 | 24,000 | 24,000 |
| LG stock to crusher | kt | — | — | — | — | — | — | — | — | — | — | — | — | — | — | 10,689 |
| Total Waste | kt | 77,321 | 71,958 | 72,190 | 75,094 | 65,707 | 61,073 | 56,087 | 47,577 | 43,685 | 38,491 | 25,882 | 14,894 | 6,068 | 2,694 | 1,503 |
| Other movements | kt | 14,565 | 14,557 | 14,367 | 14,754 | 12,128 | 11,763 | 12,068 | 10,668 | 9,638 | 9,728 | 8,027 | 7,328 | 5,628 | 4,077 | 1,497 |
| Stripping ratio | % | 2.27 | 1.82 | 1.83 | 2.08 | 2.04 | 1.90 | 1.76 | 1.50 | 1.19 | 0.99 | 0.63 | 0.36 | 0.15 | 0.10 | 0.11 |
| Plant feed (wet basis) | kt | 24,000 | 24,000 | 24,000 | 24,000 | 24,000 | 24,000 | 24,000 | 24,000 | 24,000 | 24,000 | 24,000 | 24,000 | 24,000 | 24,000 | 24,000 |
| Plant feed (dry basis) | kt | 23,280 | 23,280 | 23,280 | 23,280 | 23,280 | 23,280 | 23,280 | 23,280 | 23,280 | 23,280 | 23,280 | 23,280 | 23,280 | 23,280 | 23,280 |
| Cu grade | % | 0.69 | 0.79 | 0.88 | 0.88 | 0.82 | 0.84 | 0.86 | 0.85 | 0.92 | 0.94 | 0.90 | 0.89 | 0.90 | 0.79 | 0.65 |
| Au grade | g/t | 0.38 | 0.45 | 0.52 | 0.52 | 0.47 | 0.46 | 0.44 | 0.39 | 0.44 | 0.45 | 0.45 | 0.46 | 0.51 | 0.49 | 0.36 |
| March 2016 | Page 16-6 | |
| Project Number:179678 |
|
Salobo Operations Para State, Brazil NI 43-101 Technical Report |
![]()
| March 2016 | Page 16-7 | |
| Project Number:179678 |
|
Salobo Operations Para State, Brazil NI 43-101 Technical Report |
Table 16-3: Low Grade Stockpile to Plant Schedule
| LG stock to plant | 2045 | 2046 | 2047 | 2048 | 2049 | 2050 | 2051 | 2052 | 2053 | 2054 | 2055 | |
| Total movements | kt | 24,000 | 24,000 | 24,000 | 24,000 | 24,000 | 24,000 | 24,000 | 24,000 | 24,000 | 24,000 | 24,000 |
| LG stock to crusher | kt | 24,000 | 24,000 | 24,000 | 24,000 | 24,000 | 24,000 | 24,000 | 24,000 | 24,000 | 24,000 | 24,000 |
| Plant feed (wet basis) | kt | 24,000 | 24,000 | 24,000 | 24,000 | 24,000 | 24,000 | 24,000 | 24,000 | 24,000 | 24,000 | 24,000 |
| Plant feed (dry basis) | kt | 23,280 | 23,280 | 23,280 | 23,280 | 23,280 | 23,280 | 23,280 | 23,280 | 23,280 | 23,280 | 23,280 |
| Cu grade | % | 0.42 | 0.36 | 0.36 | 0.36 | 0.36 | 0.36 | 0.36 | 0.36 | 0.36 | 0.36 | 0.36 |
| Au grade | g/t | 0.18 | 0.15 | 0.15 | 0.15 | 0.15 | 0.15 | 0.15 | 0.15 | 0.15 | 0.15 | 0.15 |
| LG stock to plant | 2056 | 2057 | 2058 | 2059 | 2060 | 2061 | 2062 | 2063 | 2064 | 2065 | ||
| Total movements | kt | 24,000 | 24,000 | 24,000 | 24,000 | 24,000 | 24,000 | 24,000 | 24,000 | 24,000 | 22,996 | |
| LG stock to crusher | kt | 24,000 | 24,000 | 24,000 | 24,000 | 24,000 | 24,000 | 24,000 | 24,000 | 24,000 | 22,996 | |
| Plant feed (wet basis) | kt | 24,000 | 24,000 | 24,000 | 24,000 | 24,000 | 24,000 | 24,000 | 24,000 | 24,000 | 22,996 | |
| Plant feed (dry basis) | kt | 23,280 | 23,280 | 23,280 | 23,280 | 23,280 | 23,280 | 23,280 | 23,280 | 23,280 | 22,306 | |
| Cu grade | % | 0.36 | 0.36 | 0.36 | 0.36 | 0.36 | 0.36 | 0.36 | 0.36 | 0.36 | 0.59 | |
| Au grade | g/t | 0.15 | 0.15 | 0.15 | 0.15 | 0.15 | 0.15 | 0.15 | 0.15 | 0.15 | 0.32 |
| March 2016 | Page 16-8 | |
| Project Number:179678 |
|
|
Salobo Operations |
| Para State, Brazil | |
| NI 43-101 Technical Report |
It should be noted that the total plant feed for 2016 to 2065 is 1,165.9 Mt, compared to the declared Mineral Reserves of 1,156.8 Mt, which represents a slight tonnage increase of 0.8% . The difference can partly be explained by a small change in the open pit design, as adapting to smaller equipment on the lowest benches required smaller haul roads, making more ore available, and some lower benches can now be mined. In addition, as the actual mining rate for YTD2015 is slightly below the initial plan, some additional ore remains available for future mining. There is no difference in feed grade between the two tonnages.
| 16.5 |
Grade Control |
Grade control uses drill cuttings samples of collected from blastholes (the blasthole sampling procedure is described in Section 11.1.2) . Drilling is accomplished by a fleet of rotary blast-hole drills, both electric- and diesel-powered. The locations of these holes are obtained by the surveyors using high-precision GPS instruments.
Polygons are prepared by the Mine Planning group, and drilling patterns are variable, based on the predominant rock type in polygons prepared in the short-term model. For example, drill patterns range from 7.7 m x 8.4 m in saprolite, to 6.0 m x 7.4 m in schists, and 4.8 m x 6.6 m in ore.
The Geology Department is in charge of blast-hole sampling, and every week the geologists prepare a liberation plan (LP) for each polygon, based of assay results and taking into account where the blasted material was thrown. The LP is the basis of the detailed extraction program, which determines the polygon mining sequence and the destination the mined material, and allows estimating the daily feed grade and tonnage.
The LP is uploaded to the GPS units of the operating shovels and loaders to guide the mucking operations. A dispatch system is used to control the all mine equipment activities, and compliance to the mine plan is monitored on a monthly basis.
| 16.6 |
Mining Equipment |
The Salobo I mining operation started in 2012 with a plant feed production of 12 Mt/a and the Salobo II expansion started in 2014 with a plant feed production of 24 Mt/a and a total production of tonnes moved of 126 Mt/a (combined ore and waste). As a result, the Salobo mine has already a considerable mining fleet, which is shown in Table 16-4 together with the required fleet over the LOM. Data are provided on a yearly basis to 2020, then every five years to the end of the open pit mining operations in 2044. Low-grade stockpile recovery is planned from 2044 until 2065.
Diesel-powered hydraulic shovels are used to load oxide saprolite and transitional material, where a lower ground pressure and/or more mobility and flexibility is required.
| March 2016 | Page 16-9 | |
| Project Number:179678 |
|
Salobo Operations Para State, Brazil NI 43-101 Technical Report |
Table 16-4: Mine Fleet Requirements
| Equipment Types and No. of Units | Capacity | 2015 | 2016 | 2017 | 2018 | 2019 | 2020 | 2025 | 2030 | 2035 | 2040 | 2042 | 2043 | 2045 | 2050 | 2055 | 2060 | 2064 |
| Loading | actual | LOM planning |
end of mine |
stockpile recovery |
end of stockpile | |||||||||||||
| BE 495 HD electric shovel | 42 yd3 | 4 | 3 | 3 | 3 | 3 | 3 | 3 | 3 | 3 | 2 | — | — | — | — | — | — | — |
| BE 495 HR electric shovel | 63 yd3 | — | 2 | 2 | 2 | 2 | 2 | 2 | 2 | 2 | 1 | — | — | — | — | — | — | — |
| Komatsu PC5500 hydraulic excavator | 38 yd3 | 3 | 2 | 3 | 3 | 3 | 3 | 3 | 3 | 3 | 3 | 2 | 1 | — | — | — | — | — |
| LeTourneau L1850 wheel loader | 33 yd3 | 4 | 3 | 3 | 3 | 3 | 3 | 3 | 3 | 3 | 3 | 5 | 5 | 5 | 5 | 5 | 5 | 4 |
| Hauling | ||||||||||||||||||
| Komatsu 830E-AC / CAT 793D truck | 240 t | 29 | 29 | 29 | 29 | 29 | 29 | 29 | 29 | 29 | 29 | 22 | 22 | 22 | 13 | 13 | 11 | 11 |
| CAT 797F truck | 360 t | 10 | 16 | 16 | 16 | 17 | 20 | 25 | 28 | 34 | 34 | — | — | — | — | — | — | — |
| Drilling | ||||||||||||||||||
| Atlas Copco Pit Viper 351 prod. drill | 12 1/4" | 5 | 7 | 7 | 7 | 7 | 7 | 7 | 9 | 9 | 9 | 9 | — | — | — | — | — | — |
| BE 49 HR production drill | 12 1/4" | 5 | 7 | 7 | 7 | 9 | 9 | 9 | 9 | 9 | 7 | 7 | — | — | — | — | — | — |
| Atlas Copco T4 BH pre-split drill | 9 7/8" | 1 | 5 | 5 | 5 | 5 | 5 | 5 | 5 | 5 | 5 | 3 | 1 | — | — | — | — | — |
| Atlas Copco ROC-L8 pre-split drill | 6 1/2" | 5 | 3 | 3 | 3 | 3 | 3 | 3 | 3 | 3 | 3 | 2 | 1 | — | — | — | — | — |
| Auxiliary | ||||||||||||||||||
| Komatsu D475a-2 / CAT D11 trackdozer | 781 hp | 6 | 6 | 6 | 6 | 6 | 6 | 6 | 6 | 6 | 5 | 2 | 1 | 1 | 1 | 1 | 1 | 1 |
| Komatsu D375A / CAT D10 trackdozer | 605 hp | 9 | 9 | 9 | 9 | 10 | 10 | 10 | 10 | 4 | 4 | 2 | 1 | 1 | 1 | 1 | 1 | 1 |
| CAT D6R trackdozer | 189 hp | 2 | 3 | 3 | 3 | 3 | 3 | 3 | 3 | 3 | 3 | 3 | 1 | 1 | 1 | 1 | 1 | 1 |
| Komatsu WD 600 wheeldozer | 485 hp | 5 | 6 | 6 | 6 | 6 | 6 | 6 | 6 | 6 | 4 | 3 | 1 | 1 | 1 | 1 | 1 | 1 |
| Komatsu WD 900 / CAT 854K wheeldozer | 854 hp | 3 | 4 | 6 | 6 | 6 | 6 | 6 | 6 | 6 | 4 | 2 | 1 | 1 | 1 | 1 | 1 | 1 |
| Komatsu GD 825 / CAT 16 M grader | 280 hp | 9 | 9 | 10 | 10 | 10 | 10 | 10 | 10 | 10 | 8 | 6 | 4 | 4 | 4 | 4 | 4 | 4 |
| Komatsu 450-7 excavator | 310 hp | 10 | 10 | 10 | 10 | 10 | 10 | 10 | 10 | 10 | 10 | 10 | 2 | 2 | 1 | 1 | 1 | 1 |
| Komatsu WA 600-6 wheel loader | 33 yd3 | 1 | 1 | 1 | 1 | 1 | 1 | 1 | 1 | 1 | 1 | 1 | 1 | 1 | 1 | 1 | 1 | 1 |
| Atlas Copco ROC-D7 drill | 4 1/2" | 2 | 2 | 2 | 2 | 2 | 2 | 2 | 2 | 2 | 2 | 1 | 1 | — | — | — | — | — |
| Scania 6x4 highway truck | 30 t | 8 | 8 | 8 | 8 | 8 | 8 | 8 | 8 | 8 | 8 | 2 | 2 | 2 | 2 | 2 | 2 | 2 |
| Komatsu 785C water truck | 76 m3 | 3 | 3 | 3 | 3 | 3 | 3 | 3 | 3 | 3 | 4 | 2 | 2 | 2 | 2 | 2 | 2 | 2 |
| March 2016 | Page 16-10 | |
| Project Number:179678 |
|
Salobo Operations Para State, Brazil NI 43-101 Technical Report |
The electric-powered rope shovels are used for ore and waste rock loading, and as such loading the major quantities of material to be mined, but are less flexible.
Wheel loaders are used for miscellaneous clean-up jobs, stockpile re-handling and for backup of the shovels when needed. In particular, the wheel loaders are used in narrow working areas and to start opening of new accesses.
All loading equipment is equipped with high-precision GPS positioning indicators for grade control, and to maintain accurate bench levels.
A fleet of off-road 218 t (240 st) and 327 t (360 st) haul trucks are used to transport the material to either the WRF or the primary crusher stockpiles. Low–medium grade ore is stockpiled near the open pit. Cycle times for haulage calculations are determined for each mining period using “Mine Haul” software and verified with the “Dispatch” results of the actual mining operation. All trucks are equipped with weight scales connected to the “Despatch” system to provide accurate production figures.
The D11 and D10 type of track dozers are assigned to maintain the production areas, WRFs and cleaning up the benches. Wheel dozers, road graders and water trucks complete the remainder of the major auxiliary equipment fleet.
The shift rotation is based on eight-hour shifts with four crews. During the eight-hour shift, the operator has the right of a one hour lunch-break. In order to improve utilization during the dayshift, an additional small crew is scheduled to cover this lunch-break and the afternoon shift change.
Equipment is assumed to operate 365 days per year. Ten days per year without pit production are considered, due to weather related disruption such as heavy rainfall and fog.
Equipment availabilities, utilizations, productivities and equipment life are based on experience acquired from the nearby Sossego copper mine, where the same type of equipment has already been working under the same circumstances for many years.
The considered availability is 85% for shovels and 80% for trucks and drills, while the estimated utilization is 80% for shovels, 78% for haul trucks and 74% for drills.
| 16.7 |
Blasting and Explosives |
The electric and diesel powered production drills use 311 mm (12¼ inch) drill holes and the drill pattern depends on the material type.
Saprolites are drilled at a pattern of 7.7 by 8.4 m with 2 m sub-drill. Harder waste rock is drilled at a pattern of 6.0 by 7.4 m, with 1.8 m sub-drill.
The ore is planned to be drilled at a 4.8 by 6.6 with 1.4 m sub-drill. This pattern is, however, adjusted according to rock hardness and plant requirement, as the resulting high powder factors (500–750 g/t) result in fine fragmentation, improving mill throughput and off-setting crushing and grinding costs attributable to the abrasiveness and hardness of the ore.
| March 2016 | Page 16-11 | |
| Project Number:179678 |
|
Salobo Operations Para State, Brazil NI 43-101 Technical Report |
The smaller drills, used to drill 250mm (9⅞ inch) and 165mm (6½ inch) drill holes are used for pre-split drilling and pit wall control.
Heavy ANFO, a blend of ANFO and emulsion, is used as primary explosive.
| 16.8 |
Comments on Section 16 |
The influence of the steaming agreement with Silver Wheaton is not reflected in the pit optimization nor in the copper equivalent, which could mean that the cutoff grade is too low. This would mean that some material on the low-grade stockpile would be below the economic cutoff grade. However, given that the low-grade stockpile will only be fed to the plant after the cessation of mining in 2044, and because the Project discount rate is set at 10%, it is unlikely that the exclusion of gold in the marginal cutoff grade will have a material impact on Project economics.
Medium-grade and low-grade ore are now stockpiled together. It would be advisable to keep a better separation between the medium-grade and the low-grade to be able in a later stage of operations to focus only on the medium-grade material if required.
Although the resource pit is used as a method of ensuring that no permanent structures are being built within possible pit limits, the WRF is now planned to be 50 m away from the resource pit. A sensitivity study should be performed to find out if this is sufficient or if a 100 m distance would be a safer distance, in order to avoid sterilizing Mineral Resources in the future.
| March 2016 | Page 16-12 | |
| Project Number:179678 |
|
Salobo Operations Para State, Brazil NI 43-101 Technical Report |
| 17.0 |
RECOVERY METHODS |
| 17.1 |
Process Flowsheet |
The process flowsheet has evolved through the various study phases of the Project, incorporating the additional knowledge gained from metallurgical testwork and the relative importance of the identified lithologies in the Mineral Resource and Mineral Reserve estimates. In particular, the following stages of Project development contributed to the evolution of the retained flowsheet.
| • |
The CVRD and Anglo American testwork program, from 1986–1987, provided the basis for a prefeasibility study completed by Bechtel in 1988. At this stage, fluorine contamination of the concentrate was recognized | |
|
| ||
| • |
The SMSA testwork program, culminating in a pilot plant campaign at the CRC, performed between 1993 and 1998, provided additional data for a final feasibility study completed by Bechtel | |
|
| ||
| • |
Locked-cycle flotation tests, flotation variability, and grinding studies, completed in 2003 and 2004, were used by Fluor Daniel to complete a second feasibility study in 2004, which evaluated production scenarios at 12 M/ta and 24 Mt/a. | |
|
| ||
| • |
A trade-off study using high-pressure grinding rolls (HPGR) for tertiary crushing as an alternative to conventional semi-autogenous grinding (SAG), conducted from 2005–2006. The data thus collected were used by Kvaerner to prepare a trade-off study, from which the HPGR approach was adopted. |
HPGR were retained instead of SAG mills because of the high magnetite (and copper) content of critical-size pebbles that would have been removed with the magnet protecting the pebble crushers, and therefore requiring additional re-handling (per Vale’s experience at Sossego). In addition, the relatively high ore hardness and its expected variability as different mixtures of ore lithologies are introduced as plant feed, would have caused high-frequency variability in plant throughput in a typical SAG mill–ball mill–pebble crusher (SABC) circuit.
Phase I of the Salobo plant (Salobo I) was designed to process 12 Mt/a of ore, to produce approximately 100 kt of copper-in-concentrate annually. Production commenced in June, 2012.
The Salobo II plant permitted a doubling of the nominal plant throughput, to 24 Mt/a, with an annualized copper-in-concentrate production of approximately 200 kt. The Salobo II plant was commissioned in June 2014 and is basically a mirror-image of Salobo I, i.e. essentially two identical, parallel, production lines.
| March 2016 | Page 17-1 | |
| Project Number:179678 |
|
Salobo Operations Para State, Brazil NI 43-101 Technical Report |
Salobo I was designed to operate 365 days per year, 24 hours per day and with a targeted 90% of actual operating time, accounting for availability and utilization.
Salobo II started operation in June, 2014 and is designed for a targeted up-time of 90%.
The overall simplified process flow diagram is illustrated in Figure 17-1.
Apart from the inclusion of HPGR for tertiary crushing duty, ahead of ball milling, the circuit is conventional, but with the flotation cleaning circuit making extensive use of flotation columns, to reduce entrainment of F-bearing non-sulphide gangue minerals such as fluorite and biotite.
| 17.2 |
Plant Design |
The whole plant is extensively instrumented. All signals are provided to a distributed control system (DCS), allowing for the remote activation and stoppage of equipment, as well as the monitoring of the status of process equipment and of the metallurgical performance of the plant. A manned control room is used to implement changes to the circuit, with the instructions relayed from floor supervisors via radio.
Run-of-mine ore at 2.5 m top size is hauled in 220 t trucks and crushed in one of two 60” x 89” primary gyratory crusher (600 kW motor), rated for 1,826 t/h each, to a product size distribution with 80% of the mass passing 152 mm while operated with an open-side setting (OSS) of 140 mm. The dump pocket capacity is equivalent to the volume of 2.5 trucks. Primary crushed ore is conveyed to a common crushed ore stockpile which has a live capacity of approximately 24,800 t and a total capacity of 73,400 t.
Four coarse ore stockpile reclaim feeders are used to feed onto the primary screen feed conveyor which feeds two operating double-deck vibrating screens. The screens have a 100 mm aperture top deck and 55 mm aperture bottom deck to yield and underflow product sizing of 80% passing 38 mm. Screen oversize is crushed in two MP-1000 cone crushers (746 kW motors) in a standard closed circuit. A third screen and crusher were added to the original two units with the Salobo II plant. These units are typically on stand-by.
Secondary-crushed product is then conveyed in a 2 km long pipe conveyor running at a speed of 2.5 m/s to the secondary crushed ore stockpile. This stockpile has a total capacity of approximately 171,000 t and a live capacity of about 75,000 t.
Two parallel lines of four operating reclaim feeders each are then used to reclaim the crushed ore and deliver it to the HPGR circuit via the two stockpile reclaim conveyors merging into a single line of transfer conveyors leading to the HPGR silos feed conveyor, equipped with a shuttle head. This unit delivers ore into one of four concrete silos, providing approximately 20 min of surge at nominal capacity. A reversible feed belt conveyor and feed belt feeders then feed each of the four HPGR units.
| March 2016 | Page 17-2 | |
| Project Number:179678 |
|
Salobo Operations Para State, Brazil NI 43-101 Technical Report |

| March 2016 | Page 17-3 | |
| Project Number:179678 |
|
Salobo Operations Para State, Brazil NI 43-101 Technical Report |
Each HPGR unit has a drum 2.0 m diameter by 1.5 m wide. The maximum feed size is 55 mm and the HPGR product is exhibiting 80% passing 17 mm while operating with a 40 mm gap and at 150 bars of hydraulic pressure applied to the floating roll. The crushed HPGR product is discharged via the product collection conveyor and is then screened at 8 mm on the bottom deck of banana screens, with the top deck aperture set at 15 mm. There are a total of eight operating screens, with half dedicated to the HPGR of either Salobo I or Salobo II. The screen undersize, at 80% passing 6 mm, discharges directly into one dedicated ball mill discharge sump. The screen oversize is recirculated back via the screen oversize collection conveyor to the HPGR silos feed conveyor for further crushing. The circulating load is typically 110% around this circuit.
Slurry in the ball mill discharge sump is pumped to a battery of ten 660 mm hydrocyclones, of which seven are typically operating. Hydrocyclone underflow is fed by gravity to an overflow ball mill of 7.9 m diameter by 12.2 m long, equipped with a 17 MW gearless motor. There are four ball mills operating in closed circuit, each with a dedicated hydrocyclone cluster. Ball mill discharge feeds into the discharge sump for recirculation to the hydrocyclones. The design grinding circuit product is set at 80% passing 106 μm. Hydrocyclone overflow advances to the Rougher 1 flotation circuit at 45% solids by weight. The ball mills were designed to operate at a 30–35% ball charge using 76 mm diameter steel balls and with a circulating load of approximately 300%. These conditions were adjusted by the operations, now showing use of a 30% ball charge. Under these conditions, 15 MW are drawn from the mill motors. A higher ball charge would reportedly require the addition of a retainer ring at the mill discharge. The circulating load is about 200%.
The flotation circuit is of conventional design but the cleaning circuit is making extensive use of column flotation, in order to improve rejection of gangue contaminants carrying fluorine values. Lime is added at the front end of the circuit to raise the pH to about 10. Addition of NaHS is made ahead of roughing so as to clean the surfaces of the bornite and increase its recovery. PAX and a dithiophosphate are used as the primary and secondary collectors, respectively. Frothing is provided by propylene glycol and methyl isobutyl carbinol (MIBC).
Rougher 1 (e.g. rougher) flotation is carried out in four parallel lines (one for each ball mill) of two cells each. The cells are mechanically agitated units of 200 m3 capacity, providing six minutes of design retention time. The Rougher 1 concentrate advances to the cleaning circuit. The Rougher 1 tailings advance to the Rougher 2 (scavenger) circuit consisting of four lines, with each line containing six mechanically-agitated 200 m3 cells, for a nominal retention time of 39 min.
Rougher 2 tailings gravitate to the tailings storage facility (TSF), while the concentrate advances to the regrinding circuit.
| March 2016 | Page 17-4 | |
| Project Number:179678 |
|
Salobo Operations Para State, Brazil NI 43-101 Technical Report |
The cleaning circuit is divided into three upgrading stages and closed by a cleaner–scavenger bank of conventional agitated cells. The arrangement of each upgrading stage is typical, whereas the concentrate of one stage advances to the next one and the tailings are moved back to the previous stage. Exceptions are found with the Cleaner 1 tailings, proceeding to the cleaner–scavenger and Cleaner 3 concentrate, which is the final concentrate.
The Cleaner 1 circuit consists of 16 column cells, each 6 m diameter x 14 m height, arranged in four lines of four cells each. Design residence time is 39 min. The Cleaner 1 columns are fitted with a Microcel sparging system, introducing flotation air to recirculated slurry pumped through static mixers. All of the other columns only use more standard air spargers.
The concentrate from the Cleaner 1 circuit advances to the Cleaner 2 circuit, consisting of eight cells, in four lines of two columns each, of 4.3 m diameter x 14 m height, for a design retention time of 34 min. Concentrate from the Cleaner 2 circuit advances to the Cleaner 3 circuit, consisting of four cells, in four lines of one cell each, each column 4.3 m diameter x 14 m height for a design retention time of 39 min.
The tailings of Cleaner 1 are fed into the cleaner–scavenger section, made of four lines of four 200 m3 agitated cells each. The tailings of this stage join the Rougher 2 tailings to form the complete plant tailings stream, directed by gravity to the TSF. The cleaner–scavenger concentrate is combined with the Rougher 2 concentrate and undergoes regrinding in one of four vertical mills fitted with 1.1 MW motors. These mills, filled with 20 mm diameter steel grinding media, are operated in closed-circuit with one dedicated cyclone cluster per mill, ensuring a regrinding circuit product at 80% passing 20 µm.
The final concentrate exiting Cleaner 3 is pumped to one of two 15 m diameter high-capacity thickener, producing an underflow slurry at 65% solids. This slurry is transferred to a surge tank ahead of the concentrate filters.
The concentrate is dewatered further through the use of four pressure filters, each with a horizontal frame holding 50 plates of 1,500 mm x 1,500 mm. A typical filtration cycle lasts 18 minutes. The filtered concentrate has a residual moisture content of about 11%. It is stockpiled below the filters in a covered concentrate storage area holding 6,000 t.
Concentrate is reclaimed by front-end loader and loaded into trucks at a nominal rate of 1,500 wmt/d. The concentrate is weighed to about 27 wmt in the trucks using a static scale and delivered to a rail spur storage area at the town of Parauapebas, some 94 km away. The warehouse can hold 16 kt of concentrate, allowing for blending when required. The concentrate is reclaimed by front-end loader and loaded into 80–90 wmt railcars carrying it to the port of Itaqui, in São Luís, in trains of 100 railcars. The concentrate is stored there in an enclosure with a capacity of 50 kt, while awaiting loading into boats at a rate of 1,100 wmt/h. Sampling of the concentrate is carried out at the Port of Itaqui, in lots of 500 wmt, when the material is reclaimed by loader and placed on the conveyor system feeding it into ships. Shipment weights can vary from 13 kt to 45 kt, with two to three shipments completed per month.
| March 2016 | Page 17-5 | |
| Project Number:179678 |
|
Salobo Operations Para State, Brazil NI 43-101 Technical Report |
The combined flotation circuit tailings (Rougher 2 and cleaner–scavenger tailings) flow by gravity from the plant to the TSF, located directly north of the processing plant. Tailings are dumped from a single-point discharge and create a beach on the south side of the dam. Over the mine life, several phases of dam raising with mine waste will be required to provide the required storage volume. Vertical pumps installed on pontoons pump recycled tailings water back to the process plant, accounting for over 95% of the total process water requirements.
A summary of the main process equipment is provided in Table 17-1 for Salobo I and Salobo II.
| 17.3 |
Energy, Water, and Process Materials Requirements |
The plant is provided with electricity from the plant substation. Step-down transformers provide the various voltages used by the equipment.
The bulk of the process water needs are covered by the recirculation from the TSF. The consumption of fresh water is limited to systems requiring such a quality. Water is provided by vertical pumps installed in the Mirim and Salobo Creeks.
Reagent dosages, as budgeted for the 2015–2019 period, are 71 g/t for PAX, 60 g/t for dithiophosphate, 70 g/t for propylene glycol and 90 g/t for MIBC. NaHS and lime consumptions are at 120 g/t and 600 g/t, respectively.
The other major consumables are the grinding balls, with the ball mills calling for 600 g/t of the 76 mm balls, and the regrinding stage 50 g/t of 20 mm balls.
| 17.4 |
Comments on Section 17 |
Salobo II design primarily used the design criteria for Salobo I, although some required improvements identified since commissioning the initial phase were incorporated.
These improvements included:
| • |
Use of a different rotor-stator arrangement in the Rougher 1 and 2 flotation cells, to improve recovery of fine particles (retrofit in progress for Salobo I) | |
|
| ||
| • |
Addition of radial launders in the Rougher 1 cells, to improve the weight pull to the concentrate stream (retrofit in progress for Salobo I) | |
|
| ||
| • |
Use of variable speed peristaltic pumps with flowmeters to control the flow rate of reagent at each addition point (retrofit for Salobo I completed). |
| March 2016 | Page 17-6 | |
| Project Number:179678 |
|
Salobo Operations Para State, Brazil NI 43-101 Technical Report |
Table 17-1: Major Process Equipment
| Salobo I | Salobo II | |
| 1 Gyratory crusher – 60 in. x 89 in. | 1 Gyratory crusher – 60 in. x 89 in. | |
| 2 (* ) Cone crusher | 1 Cone crusher | |
| 2 (*) Vibrating screens 12 x 24 ft | 1 Vibrating screen 12 x 24 ft | |
| 1 Overland pipe conveyor ( 78.7 in.); 6,000 hp; | 1 Overland pipe conveyor ( 78.7 in.’); 6,000 hp; | |
| 1,700 m length; 4,600 t/h capacity | 1,700 m length; 4,600 t/h capacity | |
| 2 High pressure grinding rolls – Ø 2.0 x 1.5 m | 2 High pressure grinding rolls – Ø 2.0 x 1.5 m | |
| 2 Ball mills – Ø 26 ft x 40 ft | 2 Ball mills – Ø 26 ft x 40 ft | |
| 24 Flotation tank cells – 200 m3 | 24 Flotation tank cells – 200 m3 | |
| 14 Flotation columns – 14 m | 14 Flotation columns – 14 m | |
| 4 Vertimills – 1,500 hp | 4 Vertimills – 1,500 hp | |
| 1 Concentrate thickener – Ø 15 m | 1 Concentrate thickener – Ø 15 m | |
| 2 Pressure filters 1,500 x 1,500 / 50 chambers | 2 Pressure filters 1,500 x 1,500 / 50 chambers |
Note: * One cone crusher and one vibrating screen are common for both Salobo I and II plants, as stand-by equipment; Ø = effective grinding length.
Salobo I relied on a series of conveyors that were oversized for the design capacity of the 12 Mt/a plant, but were planned to cover the eventual addition of Salobo II and the total 24 Mt/a expanded capacity. The resulting processing facilities therefore have a series of critical items that are not duplicated, the failure of which can curtail the complete plant operations if the failure is located after the plant stockpile where no more significant surge capacity exists.
Figure 17-2 shows the process lines and highlights in grey the elements found as single-line items in the flowsheet. It shows in particular that 12 conveyors, including two with shuttle heads, are forming a critical path after the last available stockpile. This presents a risk for interruptions in plant operation
Raising the plant availability at the levels targeted from 2015 and onwards will require that reported issues related to the wear in chutes and transfer points, as well as failure of conveyors pulleys, be addressed in earnest.
| March 2016 | Page 17-7 | |
| Project Number:179678 |
|
Salobo Operations Para State, Brazil NI 43-101 Technical Report |

| March 2016 | Page 17-8 | |
| Project Number:179678 |
|
Salobo Operations Para State, Brazil NI 43-101 Technical Report |
| 18.0 |
PROJECT INFRASTRUCTURE |
A simplified Project infrastructure layout plan is presented as Figure 18-1.
| 18.1 |
Road and Logistics |
The area is well-served by railroads and highways that connect the towns and cities (see also Section 5). Regularly-scheduled air service is available in Marabá, and most flights connect to the capital, Brasilia. There are also flights from Belo Horizonte to Carajás.
Vale has a contract with a transportation company to transport regular employees and contractors in the Carajás, Parauapebas and Canaã dos Carajás city areas to the Salobo mine site. Employees also use a fleet of company-owned vehicles for transportation.
Concentrate produced at Salobo Mine is transported 85 km by road to a rail load-out facility near the town of Parauapebas. There the concentrate is loaded onto cars for rail transport over the 892 km long Carajás Railroad Extension that links Carajás northeast to the Ponta da Madeira Terminal in Maranhão at the seaport of São Luis. The sea port terminal Pier 2 is owned by Empresa Maranhense de Administração Portuária (EMAP) but operated by Vale. At the port, there is one ship-loading system that is shared by Vale’s Salobo and Sossego Operations. The ship-loader has a capacity of 1,350 t/h, and the average time take to load a ship ranges from 1.5 to three days, depending on ship capacity.
| 18.2 |
Stockpiles and Waste Rock Storage Facilities |
Low-grade ore and waste rock from the mine are stored in three locations along the perimeter of the pit (Figure 18-2). The main WRF is to the west of the pit, and contains both oxidized and fresh rock.
Additional information is included in Section 20.
| March 2016 | Page 18-1 | |
| Project Number:179678 |
|
Salobo Operations Para State, Brazil NI 43-101 Technical Report |
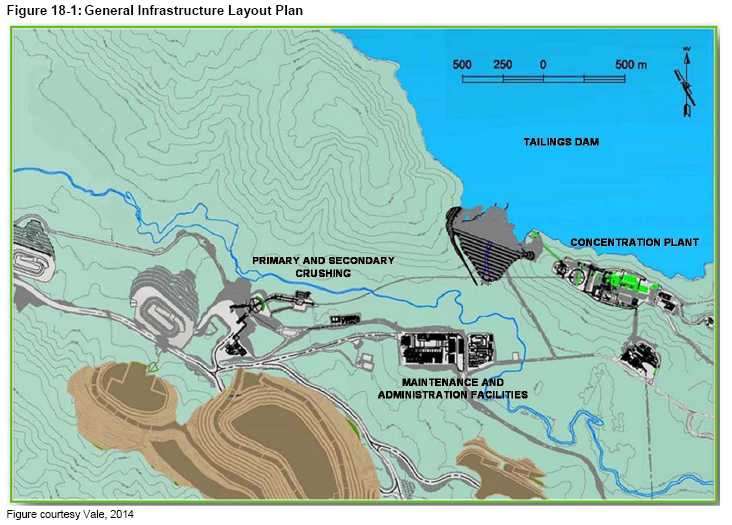
| March 2016 | Page 18-2 | |
| Project Number:179678 |
|
Salobo Operations Para State, Brazil NI 43-101 Technical Report |

| March 2016 | Page 18-3 | |
| Project Number:179678 |
|
Salobo Operations Para State, Brazil NI 43-101 Technical Report |
| 18.3 |
Tailings Storage Facilities |
The tailings storage facilities are discussed in Section 20.
| 18.4 |
Water Management |
Water management is included in Section 20.
| 18.5 |
Site Infrastructure |
Surface facilities include (see Figure 18-2 for the locations of the numbers referred to):
| • |
Central Administrative Facilities, (24), which includes administrative offices, restaurant, change rooms, training centre and a medical clinic | |
|
| ||
| • |
Central Maintenance Facilities, (26), which includes a mine heavy equipment workshop including tyre changing facility, a light vehicle maintenance shop, a plant maintenance shop for component overhaul and repair, a warehouse and maintenance offices | |
|
| ||
| • |
Mine facilities, (13), which includes mine operations change rooms and mine operations offices | |
|
| ||
| • |
Mine heavy equipment fuelling facilities, (10), which are located next to the primary crushers | |
|
| ||
| • |
Main substation (36) | |
|
| ||
| • |
Small vehicle fueling station (25) | |
|
| ||
| • |
Recycle centre (16) | |
|
| ||
| • |
Security/ access control gate (20) |
The mine does not have housing facilities, as employees use housing in the Carajás urban centre and in Parauapebas city.
Telephone communications are available over land-lines, and via a cellular network. Internet communications are also available at the mine site.
| 18.6 |
Power and Electrical |
In accordance with recent legislation governing the Brazilian electrical power sector, the Salobo Mine is supplied by the Eletronorte division of Eletrobras, which is responsible for the northern region of Brazil, operating and maintaining the system on behalf of the National Operator of the Electrical System (NOS).
Electrical energy is supplied from Tucuruí, a 8,370 MW hydroelectric generating station on the Tocantins River, 200 km north of Marabá, and 250 km due north of Parauapebas.
| March 2016 | Page 18-4 | |
| Project Number:179678 |
|
Salobo Operations Para State, Brazil NI 43-101 Technical Report |
Power is fed through two Eletronorte substations, Serra Norte and Integradora, both of which are rated at 230 kV. An overhead transmission line (230 kV) that originates from the Carajás iron mine supplies the Salobo Mine. There is no ring feed.
At present there is a contract for 120 MW of power usage, and the mine uses on average 110 MW with peaks of 117 MW, which will probably slightly increase due to the purchase of two additional BE 495 HR electrical cable shovels for the mine. The incoming transmission line has sufficient capacity to cope with an increase to 200–220 MW in case of future expansions.
The power consumption contract has a maximum of 66 MWh/month. The monthly actual consumption is slightly higher than this number, up to 8% higher. Additional power is therefore bought on the spot market. It is planned to contract a monthly consumption of 75 MWh/month for 2016 and onwards.
| 18.7 |
Fuel |
Heavy mining equipment fuel facilities are available at the mine site, close to the crusher locations. Less mobile mining equipment, such as track-mounted equipment and wheel loaders, are supplied by fuel trucks.
Road vehicle refueling is carried out at a purpose-built filling station. The area is equipped with drainage and spillage control.
| 18.8 |
General Waste |
All industrial, domestic, and hazardous wastes generated from the Salobo Mine are collected, classified, transported, and stored according to existing Brazilian technical standards and regulations.
Sewage from site is collected and treated in a sewage lagoon.
Oil traps are located in vehicle wash and fueling areas, and in hydrocarbon storage areas. Fueling and storage areas have impermeable foundations. Oil traps are cleaned out periodically, and contaminated material is stored in barrels and transferred together with used oil filters to a registered disposal facility.
Laboratory effluents are treated as necessary, depending on the source and quality. Some effluents are treated with flocculent, neutralized and filtered to remove metals and suspended solids.
Tailings samples are transferred to the
tailings impoundment.
| 18.9 |
Water Supply |
Water collected from the pit and reclaim water from the tailings impoundment are used in the process plant.
| March 2016 | Page 18-5 | |
| Project Number:179678 |
|
Salobo Operations Para State, Brazil NI 43-101 Technical Report |
Water is collected from Mirim and Salobo Creeks and either treated for use as potable water, used as make-up water for the process plant, reserved for fire suppression, or for other uses around site.
| 18.10 |
Comments on Section 18 |
The Salobo mine has been in operation since 2012, and at has been producing at a 24 Mt/a capacity since 2014. The infrastructure is well established and adequate for this production level.
Expansion scenarios are being discussed internally. If these are implemented, some areas, such as the capacity of administration buildings are likely to be adequate, but other, production-related infrastructure, such as workshop space and restaurant areas, might have to be adjusted.
| March 2016 | Page 18-6 | |
| Project Number:179678 |
|
Salobo Operations Para State, Brazil NI 43-101 Technical Report |
| 19.0 |
MARKET STUDIES AND CONTRACTS |
| 19.1 |
Market Studies |
Copper concentrate is transported by trucks to Parauapebas city. Concentrate is then transported to the copper terminal facilities close to Itaqui Port. In this location the following operations are carried out: unloading of the wagons, storage of concentrate, weighing, sampling, moisture determination, lot sample preparation, handling, and loading of vessels.
The typical grade of copper, gold, and silver in the final product is approximately 38%, 17 g/t and 30 g/t, respectively. The copper concentrate is used in copper smelting and refining operations to produce copper cathode and precious metals.
The market for copper concentrates is well developed with a large number of custom smelters located around the world who use the copper concentrate as feed. Higher levels of fluorine, higher copper grade and other specificities limit some of the processing options for Salobo. However, customers for Salobo concentrate have been well established with deliveries to major smelters and a few blending facilities in Europe and Asia.
Amec Foster Wheeler notes that there are three deleterious elements of potential concern in the Salobo copper concentrate, namely fluorine, chlorine and uranium. Of these, fluorine is the most significant.
In general, smelters will tend to reject concentrates with high fluorine content due to problems in the smelter’s sulphuric acid plants. However, there are some smelters that can accept high fluorine contents. Salobo has secured contracts with four smelters (in Poland, India, Sweden and Germany) which are able to accept concentrates with an anticipated average fluorine content of 1,800 ppm and a maximum content of 4,000 ppm. The last couple of years, the fluorine content was in general at approximately 2,200 ppm, and shipments did not have to be blended in order to lower the fluorine, although this options exists. The mine planning data indicate that in future there may be a tendency that fluorine contents will slowly reduce. This means that shipments may incur a penalty, but will not be rejected.
Chlorine is even less of a concern. Some shipments have occurred a penalty but other shipments did not even fall within the penalty threshold. Although chloride is not modelled, there is also a tendency indicated in the mine plan data that chlorine levels will reduce.
| March 2016 | Page 19-1 | |
| Project Number:179678 |
|
Salobo Operations Para State, Brazil NI 43-101 Technical Report |
| 19.2 |
Commodity Price Projections |
Vale provided Amec Foster Wheeler with the metal price projections for use in the Report. Vale established the pricing using a consensus approach based on long-term analyst and bank forecasts prepared during 2014 and 2015.
Amec Foster Wheeler reviewed the key input information, and considers that the data reflect a range of analyst predictions that are consistent with those in use by Amec Foster Wheeler and industry peers. Based on these sources, Amec Foster Wheeler agrees that Vale’s price projections are acceptable as long-term consensus prices for use in mine planning and financial analyses for the Salobo Operations in the context of this Report.
The long-term price forecasts that are applicable to the Salobo Operations are summarized in Table 19-1.
Vale has also provided Amec Foster Wheeler with corporate projections for exchange rates for the LOM. These are summarized in Table 19-2, and are also based on an industry consensus view.
| 19.3 |
Contracts |
Vale has agreements at typical copper concentrate industry benchmark terms for metal payables, treatment charges and refining charges for concentrates produced. Treatment costs and refining costs vary depending on the concentrate type and the destination smelter. For all of Vale’s sales contracts, the risk of the concentrates transfers either at the load port or discharge port according the standard International Commercial Terms (Incoterms); whereas the title to the concentrates transfers either at the load port or discharge port according the standard Incoterms or upon payment.
The terms contained within the sales contracts are typical and consistent with standard industry practice, and are similar to contracts for the supply of copper concentrate throughout the world. Depending on the specific contract, the terms for the copper concentrate sale are either annually negotiated, benchmark-based treatment and refining charges, or in the case of spot agreements are based on fixed treatment and refining charges based on market terms negotiated at the time of sale. The differences between the individual contracts are generally in relative quantity of concentrates that are covered under annually-negotiated treatment and refining charges.
Contracts also been utilized for goods and services required to operate underground mining operations. Many supplies contracts are in place with suppliers for purchase of various goods. The largest contracts include transportation, purchase of fuel, reagents and other process consumables, ground support and mining equipment leases. The terms contained within the contracts are typical of, and consistent with, standard industry practices.
| March 2016 | Page 19-2 | |
| Project Number:179678 |
|
Salobo Operations Para State, Brazil NI 43-101 Technical Report |
Table 19-1: Commodity Price Projections
| Commodity | Units | 2016 | 2017 | 2018 | 2019 | 2020 | Long-term | |
| Copper | US$/t | 5,000 | 5,250 | 5,750 | 6,250 | 6,500 | 6,500 | |
| Gold | US$/oz | 1,200 | 1,200 | 1,250 | 1,250 | 1,250 | 1,250 |
Table 19-2: Exchange Rate Projections
| Exchange Rage | 2016 | 2017 | 2018 | 2019 | 2020 | Long-term | |
| C$/US$ | $1.28 | $1.26 | $1.26 | $1.26 | $1.26 | $1.26 | |
| BRL R$/US$ | 3.37 | 3.50 | 3.50 | 3.50 | 3.50 | 3.50 |
On occasions, mining contractors may be employed for specific mine development projects.
The Silver Wheaton streaming agreement is discussed in Section 4.
| 19.4 |
Comments on Section 19 |
The QPs have reviewed the information provided by Vale on marketing, contracts, metal price projections and exchange rate forecasts, and note that the information provided is consistent with the source documents used, and that the information is consistent with what is publicly available on industry norms. The information can be used in mine planning and financial analyses for the Salobo Operations in the context of this Report.
Long-term metal price assumptions used in the Report are based on a consensus of price forecasts for those metals estimated by numerous analysts and major banks. The analyst and bank forecasts are based on many factors that include historical experience, current spot prices, expectations of future market supply, and perceived demand. The long-term metal prices supporting the Mineral Resources, Mineral Reserves, and economic analysis in this Report are higher than the current market prices. Over a number of years, the actual metal prices can change, either positively or negatively from what was earlier predicted. If the assumed long-term metal prices are not realized, this could have a negative impact on the operation’s financial outcome. At the same time, higher than predicted metal prices could have a positive impact.
Amec Foster Wheeler notes that the long term exchange rate predicted by Vale is 3.50 R$/US$. This rate is higher than the historical average of approximately 2.25 R$/US$ over the past five years; however, the current exchange rate is approximately 3.75 R$/US$. A decline in exchange rate below 3.5 R$/US$ could have a negative impact on the financial results.
Silver has historically reached payable levels in the concentrate. Although estimated in the block model, silver is not included in the Mineral Resource and Mineral Reserve estimates. It represents a minor upside potential for the Project economics.
| March 2016 | Page 19-3 | |
| Project Number:179678 |
|
Salobo Operations Para State, Brazil NI 43-101 Technical Report |
| 20.0 |
ENVIRONMENTAL STUDIES, PERMITTING, AND SOCIAL OR COMMUNITY IMPACT |
Information in this section in this section has been summarized from Brandt (2003) in regards to the baseline studies and social setting, SETE (2015) for closure data, and Vale (2015) for information relating to the 2014 environmental performance of the operations.
| 20.1 |
Baseline Studies |
Environmental and social baseline study areas were defined to characterize the current conditions in the areas potentially affected by mine components or activities. Results of work completed are included as summaries in the following subsections.
| 20.1.1 |
Atmospheric Conditions |
Salobo is located in a remote area, and there are no other significant sources of air and noise emissions other than those arising from mining operations.
Salobo has an appropriate monitoring program to control atmospheric emissions of the direct activities of the mine and its area of influence, allowing for a measure of control on the fixed and fugitive emissions. This monitoring program uses conventional measurement methods, and monitoring frequencies have been approved by the appropriate regulatory authority.
Amec Foster Wheeler reviewed the content of the 2014 performance report, as delivered to regulatory authorities. This report indicated that:
| • |
Total suspended particulates (TSP) did not exceed the daily norm of 240 µg/m3 | |
|
| ||
| • |
Total suspended particulates did not exceed the geometric annual mean concentration limits of 80 µg/m3 | |
|
| ||
| • |
The highest total suspended particulate counts occurred during June to August, and correspond with the dry season | |
|
| ||
| • |
Gaseous sulphur dioxide (SO2), nitrogen dioxide (NO2) and ozone (O3) emissions met compliance requirements | |
|
| ||
| • |
The measured noise levels in the area of operation were under 70 dBA, as required by applicable regulations for industrial areas. |
| March 2016 | Page 20-1 | |
| Project Number:179678 |
|
Salobo Operations Para State, Brazil NI 43-101 Technical Report |
| 20.1.2 |
Terrestrial Environment |
Flora and Fauna
Vegetation in the Project area is structurally complex, with a dense undergrowth and a variety of vegetative associations depending on the steepness of hill slopes and the soil moisture content. This provides a range of faunal habitats.
Baseline studies identified a number of bird species including 10 classified as endemic, four regionally rare, four in danger of extinction, and three vulnerable species.
Of the mammals identified, eight are considered threatened with extinction, including the giant armadillo, giant anteater, howler monkey, jaguar, puma and ocelot.
Baseline studies captured 105 species of fish in the local rivers, including four migratory species and 32 species of commercial value.
Various amphibians and reptiles inhabit the area, none of which are considered endemic or at risk.
Many insects occur in the area including species that can transmit malaria, yellow fever, dengue, leishmaniasis, chagas and other diseases.
Ongoing monitoring is conducted for flora and fauna in the area of influence of the mine. Special monitoring programs are implemented as required in areas where vegetation has to be cleared. Permanent wildlife monitoring sites are set up on the Project access routes.
Tapirapé–Aquiri National Forest
The Tapirapé–Aquiri National Forest has a registered area of 190,000 ha. The Tapirapé Biological Reserve, which covers an area of 103,000 ha, borders the National Forest (and mine area) to the north. The mine site is within the Tapirapé–Aquiri National Forest and the access road crosses the Carajás National Forest and lies adjacent to the Igarapé Gelado Protected Area. Figure 20-1 shows the location of the mine in relation to the forest areas.
| March 2016 | Page 20-2 | |
| Project Number:179678 |
|
Salobo Operations Para State, Brazil NI 43-101 Technical Report |

| March 2016 | Page 20-3 | |
| Project Number:179678 |
|
Salobo Operations Para State, Brazil NI 43-101 Technical Report |
As a requirement of the mine installation licence, an agreement was signed between the Chico Mendes Biodiversity Conservation Institute and the Salobo Mine to provide payment and support towards management of the Tapirapé–Aquiri National Forest (ICMBio, 2007).
The protected areas have distinct management categories that were established by Decree N° 97,720 dated 5 May 1989. Within these areas, a regular polygon outlining the mining zone Special Use Area was defined by the National Department of Mineral Production of Brazil. The polygon encompasses the mine area, roads, and supporting infrastructure, and incorporates a 100 m buffer zone. A second 10 km buffer surrounds the Special Use Area polygon.
Within the Special Use Area, Vale controls access to the area and the mine site, and access to the Tapirapé–Aquiri National Forest along the eastern boundary of the Special Use Area with the forest.
To the northwest of the Special Use Area is the Lindoeste settlement, developed on land in the São Felix do Xingu region, which currently covers about 120 ha; the mine site has no influence over forest access by this community.
The Salobo Operations also have a commitment to offset effects by planting seedlings in the Igarapé Gelado Protected Area (National Press, 2007).
| 20.1.3 |
Aquatic Environment |
Water quality at the Project site naturally has some constituents higher than CONAMA’s Class 2 criteria concentrations (Brandt, 2003).
Water in most creeks around the Project site has naturally elevated iron and aluminum concentrations typical of streams in areas with laterite soils. Coliform (particularly streptococcus) and nutrient concentrations are occasionally elevated, typical of a tropical rainforest where there are high densities of plant and animal life.
Baseline oil and grease levels were detectable; however, these were not in areas where machines or equipment are used and are likely from natural sources from seeds, vegetation and blue-green algae.
| 20.1.4 |
Socioeconomic |
The closest municipalities within the socioeconomic area of influence of the mine site Marabá and Parauapebas. The nearest settlements are the Sanção and Paulo Fonteles villages, 45 and 55 km respectively from the mine.
The village populations have significantly increased since mine development, with Sanção’s population more than doubling between 2007 and 2012, and the population of Paulo Fonteles tripling during the same period.
| March 2016 | Page 20-4 | |
| Project Number:179678 |
|
Salobo Operations Para State, Brazil NI 43-101 Technical Report |
Vale’s stakeholder relations programs have been undertaken in compliance with Vale’s internal standards, and Vale advised Amec Foster Wheeler that the programs are acceptable to the relevant Brazilian authorities.
| 20.1.5 |
Heritage |
Archaeological studies were completed prior to Project development and identified 12 ceramic artifacts resulting from indigenous populations, likely Tupi-Guarani. Of these, six were determined to be archaeological sites and two were archaeological occurrences: all of the sites were registered with National Institute of Historic and Artistic Heritage (IPHAN).
The Salobo Mine developed an archaeological protection and salvage management plan to protect these archaeological sites during construction and operations (Brandt, 2003).
Additional studies were performed in the mine’s area of influence during 2004–2008 by the Paraense Emilio Goeldi Museum and the Forest Development Institute. It was concluded that the studies completed satisfied the requirements of the Archaeological Rescue and Protection Program and supported the grant of the operating licence.
| 20.2 |
Environmental Considerations |
| 20.2.1 |
Air Quality |
The site maintains a monitoring program for total suspended particulates (TSPs). Control measures (e.g. water spraying to minimize dust) are implemented as required to meet legislative and permitting requirements for TSP emission.
| 20.2.2 |
Waste Characterization |
Waste characterization studies were completed by CVRD and BC Research for ore, tailings, laterite, saprolite, transition and fresh rock. Static acid base accounting and non-acid generating (NAG) test work concluded that all wastes were non-acid forming (CVRD, 1997).
Low-grade oxides are comingled with non-potentially acid-generating (PAG) waste rock within the centre of the WRF as a preventive measure to neutralize potential acid generation for low-grade oxides.
It is recommended that waste characterization studies be updated to verify the acid drainage potential of waste rock types in the latest mine plans and to further characterize neutral mine drainage to determine if any further water management measures should be employed, the results of these studies should be considered in the following upgrades of the mine closure plan.
| March 2016 | Page 20-5 | |
| Project Number:179678 |
|
Salobo Operations Para State, Brazil NI 43-101 Technical Report |
| 20.2.3 |
Environmental Control Plan |
The Salobo Mine has an Environmental Control Plan (Brandt, 2003) that includes the following components:
| • | Project description | |
| • | Environmental management system | |
| • | Vegetation clearing and stripping | |
| • | Erosion control | |
| • | Water and effluent management | |
| • | Waste management | |
| • | Atmospheric emissions | |
| • | Noise and vibration | |
| • | Environmental emergencies | |
| • | Disease control | |
| • | Archaeology protection and salvage | |
| • | Rehabilitation plan | |
| • | Environmental compensation and social inclusion | |
| • | Environmental education | |
| • | Environmental monitoring | |
| • | Closure plan. |
These social and environmental management plans detail best practices and Brazilian legislation to prevent and mitigate potential impacts and manage compliance specifically for the Salobo Mine.
| 20.3 |
Stockpiles and Waste Rock Storage Facilities |
Geotechnical investigations were conducted to develop the WRF design parameters. A 35% swell factor is used to compute the required storage volumes in the stockpiles and WRFs.
Material is end-dumped in 20 m high lifts with 10 m berms between lifts. The bench face angles are expected to range from 32–35°, depending on the angle of repose for the material (Table 20-1).
| March 2016 | Page 20-6 | |
| Project Number:179678 |
|
Salobo Operations Para State, Brazil NI 43-101 Technical Report |
Table 20-1: Stockpile and Waste Rock Facility Design Parameters
| Parameter | Units | Waste | Stockpile | |
| Lift Height | m | 20 | 10 | |
| Angle of Repose | degrees | 32–35 | 34 | |
| Berm Width | m | 10 | 15 | |
| Overall Slope | degrees | 20 | 25 |
Including the berms, the overall slope of the WRFs ranges from 2H:1V to 2.5H:1V. The resulting slopes were shown to have an estimated 1.5 factor of safety against large-scale circular-slip failures.
The resulting overall face angle of the WRFs is 20°, while low–medium-grade stockpiles have an overall slope angle of 25°. The WRF is estimated to have a capacity of 812 Mm³ with a maximum height of 297 m, and the low-grade stockpile has an estimated capacity of 203 Mm³ with a maximum height of 235 m.
The mine will produce in total 1,774 Mt of waste over the LOM. Assuming an in-situ density of 2.33 for saprolites, 2.77 for weathered waste, 2.83 for waste rock, and a swell factor of 35%, the total required space is 872 Mm³. At a swell factor of 30%, the required space is 839 Mm³, which is still slightly higher than the designed capacity of 812 Mm³. Additional space is potentially available, either by raising the WRF, or by expanding it towards the north. As the licensing procedure is a time-consuming process, the application to extend the WRF should be filed in sufficient time to ensure the permit is to hand before any expansion to the north is needed.
The mine requirements assume a stockpile of 525 Mt of low-grade ore. At a swell factor of 35%, the required space is 226 Mm³, and at swell factor of 30%, the required space is 218 Mm³, both of which are slightly higher than the designed capacity of 203 Mm³. If required, it is expected that additional low-grade stockpile space can be designed and licensed.
Although the WRF and the low-grade stockpile were designed assuming a swell factor of 35%, the actual swell factor is closer to 30% and as such, less additional space might be required. Experience, close monitoring, and changes in mining plan will indicate if, and how much, additional capacity will need to be designed and licensed.
Some higher-grade ore stockpiles with limited capacity are situated close to the crusher, and serve as buffers in case of production disruption in the mine or the crusher. The piles also have a blending function.
The waste materials and the low–medium-grade ore have been characterized as having low acid rock drainage (ARD) potential (Brandt, 2003). Lawrence Consulting (2011) confirmed this “very low” potential and indicated a bigger concern to be leaching of fluorine and manganese from finer-grained oxidized materials (saprolite).
| March 2016 | Page 20-7 | |
| Project Number:179678 |
|
Salobo Operations Para State, Brazil NI 43-101 Technical Report |
Accordingly, mineralized saprolite material is encapsulated within the WRF to control infiltration of surface water and minimize resultant leaching.
The long-term storage of the medium- and low-grade materials in a tropical environment may lead to some oxidation of contained sulphide minerals, which in turn may impact the percentage of metals that can be recovered during eventual processing of the stockpiles.
| 20.4 |
Tailings Storage Facility |
The Salobo Mine TSF was constructed in Mirim Creek close to the confluence of the Salobo River, and approximately 650 m from the plant site. Tailings are deposited by gravity.
The TSF is a cross-valley impoundment comprising a compacted earth and rock-fill embankment with internal drainage and transition zones, and a concrete lined spillway. The facility was designed by Brazilian engineering company BVP Engenharia and is proposed to have three implementation phases (starter dam and two raises); however, the potential to further divide the number of embankment raises, and thus reduce capital expenditure, is currently being evaluated. The TSF, when completed to a height of 285 m, will have sufficient capacity for the LOM.
Table 20-1 displays key design parameters for the Salobo TSF. A general view of the tailings dam at its final elevation is presented in Figure 20-2.
The impoundment spillway is located on the right shoulder of the embankment. The spillway system design adopted a return period of 10,000 years, and consists of an approach channel, gallery, chute, energy dissipation channel and basin.
| 20.4.1 |
Site Investigation and Characterization |
The TSF location was chosen as a function of favourable topography, allowing a small embankment volume to impound a large volume of tailings, and was also selected due to the proximity of the site to the plant.
As part of the site characterization, numerous drilling and test pitting campaigns were undertaken in the embankment foundations, borrow source areas and reservoir as part of the feasibility and detailed design phases between 2003 and 2010. These investigations were complemented by laboratory testing and analysis of selected samples.
| March 2016 | Page 20-8 | |
| Project Number:179678 |
|
Salobo Operations Para State, Brazil NI 43-101 Technical Report |
Table 20-2: Tailings Storage Facility Key Design Parameters
| Item | Value | |
| Tailings embankment crest elevation | 220 m | |
| Reservoir Volume (estimated at elev. 215 m) | 34 Mm3 | |
| Maximum embankment height | 37 m | |
| Current reservoir area | 3.13 km2 | |
| Crest width | 16 m | |
| Crest length | 152 m | |
| Spillway type | Open channel | |
| Spillway invert elevation | 215 m | |
| Embankment construction | Mixed earth and rock-fill | |
| Upstream embankment slope | 1V:2H | |
| Downstream embankment slope | 1V:1.7H | |
| Downstream berm height | 10 m | |
| Downstream berm width | 6 m | |
| Final embankment elevation | 285 m | |
| Final reservoir volume (estimated at elev. 280 m) | 565 Mm3 | |
| Final dam height | 102 m | |
| Final reservoir area (elev. 280 m) | 13.00 km2 | |
| Tailings slurry solids content | 33.3% | |
| Tailings dry density | 1.55 t/m3 |
| March 2016 | Page 20-9 | |
| Project Number:179678 |
|
Salobo Operations Para State, Brazil NI 43-101 Technical Report |

| March 2016 | Page 20-10 | |
| Project Number:179678 |
|
Salobo Operations Para State, Brazil NI 43-101 Technical Report |
Other Investigations
Due to “non-conformities during the construction phase and resulting geotechnical uncertainties”, BVP Engenharia undertook additional site and laboratory investigations with the aim of validating actual conditions of the constructed embankment (see Section 20.3.5) .
Geotechnical Model
From site geotechnical investigations the subsurface stratigraphy was broadly characterized into three units:
| • |
Soils: colluvial and residual (quartzite): In the area of the embankment a layer of colluvial and residual soils was defined generally between 2 m and 4 m thick, with the exception of drainage paths where the thickness was less than 2 m or non- existent. The other exception was the upstream area of the starter dam where residual soils were defined to a depth of 15 m and colluvial soils to 3 m | |
|
| ||
| • |
Quartzite: completely to moderately altered, highly fractured, medium strength with an average thickness between 10–15 m and maximum of 22 m | |
|
| ||
| • |
Quartzite: moderately to slightly altered, highly fractured to fractured, medium to high strength. |
Hydrogeological Model
Pumping tests undertaken in the area of the embankment which were statistically analysed to define the model for seepage analyses.
From these investigations, three horizons were defined between ground surface and a depth of 10 m, 10 m to 35 m, and 35 m and greater, showing a general decrease in permeability with depth. These hydrogeological units were defined on the basis of subsurface stratigraphy and hydraulic properties as determined from borehole investigations in the areas of interest.
| 20.4.2 |
Tailings Characterization |
Physical Characteristics
Tailings parameters adopted for design and operation of the Salobo tailings facility are displayed in Table 20-3.
| March 2016 | Page 20-11 | |
| Project Number:179678 |
|
Salobo Operations Para State, Brazil NI 43-101 Technical Report |
Table 20-3: Tailings Characteristics
| Item | Value | |
| Solids density | 3.53 | |
| Slurry density (t/m3) | 1.34 | |
| Slurry solids content (%) | 35 | |
| Density at 80% consolidation (t/m3) | 1.49 | |
| Tailings void ratio (e) | 1.36 | |
| Beach slope (%) | 1.0 |
Chemical Characteristics
Metals solubilized during the milling process, as estimated by locked cycle grinding tests, report to the tailings pond, with part of the solubilized metal load being retained in the solid tailings material. Solubilized metals will also enter the impoundment as part of the background load from Mirim Creek. An alkaline pH is observed for the impoundment during operation due to the high alkalinity of the tailings slurry. Even after mine closure, the water will approach a neutral pH, consistent with the pre-existing background conditions provided by Mirim Creek.
| 20.4.3 |
Tailings Storage Facility Design Considerations |
Tailings Containment Structure Stability
The following criterion was adopted in dam design: NBR nº 13.028 The Brazilian norm for “Elaboration and Presentation of Tailings Dam Projects, Sedimentation Dams and Water Reservoirs”, dated 4 October, 2006.
Upstream and downstream embankment slopes were defined based on the following safety factor values:
| • | FS > 1.5: | Long-term condition | |
| • | FS >1.3: | End of construction | |
| • | FS >1.2: | Seismic loading. |
Stability analyses carried out by BVP Engenharia exceeded these values in the Phase 1 detailed design stage and later in the design of the reinforcement of the downstream section of the embankment.
Foundation Treatment
The site investigation program showed that the embankment foundation area displays a subsurface profile of colluvium and residual quartzite. As part of the implantation of the dam, the embankment area was broadly divided into two areas for required foundation treatment:
| March 2016 | Page 20-12 | |
| Project Number:179678 |
|
Salobo Operations Para State, Brazil NI 43-101 Technical Report |
| • |
The region upstream of the centerline of the cutoff trench varying between 1.0 m and 3.0 m depth. | |
|
| ||
| • |
The region downstream of the centerline of the cutoff trench up to 2.0 m depth. |
Internal Drainage
Seepage analyses carried out by BVP Engenharia were utilized to define the internal drainage system, which is composed of a sand drain at the contact of the first phase of the dam and the reinforcement phase between elevations 202 m and 216 m which is then connected to the chimney drain. A blanket drain is placed at the base of the valley (0.6 m sand / 1.0 m gravel / 0.6 m sand) and extended up the embankment shoulders to an elevations of 195 m. This drain is then connected to the foot drain, which consists of rock fill and transitions.
Seepage Control
In terms of potential effects of seepage through the foundation and/or embankment on the stability of the dam, the design incorporated the following:
| • |
A cutoff trench and grout curtain were implanted to reduce seepage flows under the dam. The cutoff trench was excavated to approximately 2 m depth and 12 m in width with the objective to found the curtain in moderately altered, medium strength, extremely fractured rock | |
|
| ||
| • |
The grout curtain consists of three rows, configured such that the center line is constructed to a depth of 40 m with holes spaced at 3 m, and two secondary lines on either side of the centre were drilled to a depth of 25 m with holes spaced at 3 m | |
|
| ||
| • |
A drainage blanket of pervious, free draining, granular fill placed in the downstream area of the dam to prevent potential high seepage pressures from affecting pore pressures in the downstream shell fill. |
Tailings Deposition
Tailings disposal schemes were developed to meet total tailings storage requirements and to optimize management and location of the reclaim water pond. Figure 20-3 shows the relationship between volume and area of the impoundment versus the elevation of the embankment.
The tailings deposition plan is designed to maintain the location of the reclaim water pond at the southern end of the impoundment as shown in Figure 20-4. Tailings are currently transported by 32 inch pipeline from the plant and open channel for the final section of approximately 150 m length to Point 3.
| March 2016 | Page 20-13 | |
| Project Number:179678 |
|
Salobo Operations Para State, Brazil NI 43-101 Technical Report |


Note: Figure courtesy Vale, 2014. Barragem = dam wall, Usina Beneficamento = beneficiation plant, Ponto = deposition point, Tubulacao de Rejeito – reject pipe, Novo Tracado = new track.
| March 2016 | Page 20-14 | |
| Project Number:179678 |
|
Salobo Operations Para State, Brazil NI 43-101 Technical Report |
| 20.4.4 |
Tailings Storage Facility Water Management |
Hydrologic and Hydraulic Studies
Hydrological and hydraulic studies were developed by BVP Engenharia to define the maximum inflows and minimum outflows of Mirim Creek to determine the residual flow to be guaranteed downstream.
Spillway Design
The tailings facility spillway system is dimensioned to ensure safe operations for a 10,000 year rain event and consists of the following structures:
| • | Approach channel: trapezoidal in section with a length of approximate 44 m | |
| • | Gallery: pre-fabricated concrete with dimensions = 2.5 x 3.0 m (length x height) | |
| • | Open channel: rectangular section 2.5 x 3.0 m (length x height) of armoured concrete, 26.64 m in length inclined at 0.5% | |
| • | Chute: rectangular section 2.5 m x 3.0, of armoured concrete 10.32 m in length inclined at 30% | |
| • | Dissipation channel: armoured concrete section 124.28 m in length inclined at 20.83% | |
| • | Energy dissipation basin: armoured concrete 5 x 5 m at elevation 185.08 m | |
| • | Restitution channel: links spillway to Mirim Creek at an elevation of 185.58 m. |
A photo of the Salobo TSF downstream embankment slope and spillway chute taken at the time of the 2015 site visit is displayed in Figure 20-5.
Surface Water
The surface water drainage system was designed to evict the effects of erosion on the embankment, and includes the following:
| • | Rip-rap placed on the upstream slope | |
| • | Planting of gramineous species on the downstream embankment slopes | |
| • | Concrete-lined drainage channels located along berms to direct flow to stepped conduits | |
| • | Concrete-lined drainage channels along abutments. |
| March 2016 | Page 20-15 | |
| Project Number:179678 |
|
Salobo Operations Para State, Brazil NI 43-101 Technical Report |
![]()
Water Reclaim
The water reclaim system includes facilities to recover water from the tailings impoundment. The reclaim water barges are located in the southern area of the impoundment near the main embankment as displayed in Figure 20-6.
Water Balance
The TSF is one of the main installations that affect the water balance for the site. Predicted flows for all phases of the mine are based on a water balance model developed for the mine site. A schematic representation of the water balance for the TSF is shown in Figure 20-7.
Inflows include: the river, runoff, precipitation, slurry water flow, pit, waste rock and stockpile runoff. Losses include: reclaim water, evaporation, seepage, water release (spillway). The following data was considered for the water balance:
| • | Mirim Basin drainage area: 34.0 km2 | |
| • | Plant water demand of 3.378 m3/h and 6.756 m3/h for 12 Mt/a and 24 Mt/a throughput rates respectively. | |
| • | Series of average monthly flow data from the fluviometric station at Fazenda Alegria in the municipal of Marabá. |
| March 2016 | Page 20-16 | |
| Project Number:179678 |
|
Salobo Operations Para State, Brazil NI 43-101 Technical Report |


| March 2016 | Page 20-17 | |
| Project Number:179678 |
|
Salobo Operations Para State, Brazil NI 43-101 Technical Report |
| 20.4.5 |
Construction and Operations |
Embankment Construction and Remedial Works
The Salobo tailings storage facility was constructed and later reinforced as per the following summary of the construction and remedial works.
| • |
2010: December: completed initial construction | |
|
| ||
| • |
2011: January–February: rainy season spilled for first time as per design | |
|
| ||
| • |
2012: March–April (start of dry season): saturated areas noted in the downstream right shoulder and then left shoulder of the dam | |
|
| ||
| • |
2012: Workshops (Vale, and Pimenta de Avila) and investigations were carried out to identify the problem. It was found to be caused as a result of documented non- conformities during construction, in particular compaction of earth fill and drainage material placement | |
|
| ||
| • |
2012: May–June: started design of reinforcement of downstream slope, which included: |
| − |
Repair of existing and placement of new drainage material at the embankment shoulders | |
| − |
Enlargement of the dam crest | |
| − |
Placement and compaction of material to reinforce the downstream slope with inclined internal drainage placed between the original slope and the new reinforcement. |
| • | Remedial work started in December 2012 and concluded in January 2013, including installation of monitoring equipment. |
The reinforcement design was carried out by BVP Engenharia (a recognized Brazilian consultant with experience in the area of geotechnical engineering and tailings storage facility design). BVP Engenharia summarized the stability analyses carried out for the embankment which attained a factor of safety of “around 2”, which is stated as an appropriate result given the uncertainties in the stability modelling process and actual dam conditions.
Another recognized Brazilian consultant in the area of geotechnical engineering and tailings management, Pimenta de Avila, participated in workshops, consolidated existing data for the dam, and provided a peer review of the original design and as-builts, as well as an assessment of the corrective actions that were proposed by BVP Engenharia.
| March 2016 | Page 20-18 | |
| Project Number:179678 |
|
Salobo Operations Para State, Brazil NI 43-101 Technical Report |
Operations, Maintenance and Emergency Action Plan
The Operating and Maintenance Manual was prepared by BVP Engenharia with objective to establish the activities involved in monitoring the TSF to ensure the safety of the structure during its operation.
Table 20-4 displays the type and number of instruments installed in the Salobo TSF embankment. Mine site personal are currently considering the installation of a radar monitor the downstream embankment in real time.
Instruments installed in the structure are monitored three times a week geotechnical inspections are made every two weeks and recorded by the geotechnical team. Based on these reports, mine site personnel state that the dam is stable accordance with Law 12.334 / 2010 (National Policy for Dam Safety).
Pimenta de Avila, at the time of the Amec Foster Wheeler site visit (June, 2015), was updating the accident and emergency plan for the Salobo TSF, and is providing independent audits for the dam. In accordance with Brazilian law (Portaria No 526/2013) the accident and emergency plan must identify emergency situations may result in a risk to the integrity of the Salobo TSF. Further, the plan defines responsible personnel who are to be notified in such cases with the aim to negate minimize hazards to human life, the environment and infrastructure.
| 20.4.6 |
Future Planning |
Two dam raises are planned to lift the current embankment crest from its present height to the final elevation (Table 20-5).
At the time of the site visit a study was being undertaken to assess the potential to use mine waste rock in the planned downstream raises to increase the slope angle and reduce the total amount of material required in dam construction. Furthermore the possible subdivision of raises into smaller individual lifts was being considered as a potential measure to distribute capital expenditure.
| 20.5 |
Water Management |
The primary driver for water management is to ensure that the quality and quantity of water downstream of the Project site is not impacted by the mining operations.
In accordance with water licenses granted, the Salobo Operations have permission to capture water in the following water courses:
| • | Mamão Creek water dam: raw water captured and treated for human consumption | |
| • | Tailings dam (Mirim Creek): water returned to process plant | |
| • | Salobo Creek: water utilized for dust suppression |
| March 2016 | Page 20-19 | |
| Project Number:179678 |
|
Salobo Operations Para State, Brazil NI 43-101 Technical Report |
Table 20-4: Salobo TSF Instrumentation
| Instrument Type | Number | |
| Flow meter | 2 | |
| Reservoir level indicator | 1 | |
| Piezometer (casagrande) | 15 | |
| Piezometer (electric) | 3 | |
| Water level indicator | 5 | |
| Surface marker | 23 | |
| Inclinometer | 2 | |
| Magnetic settlement meter | 4 |
Table 20-5: Salobo TSF Proposed Embankment Lifts
| Average Water | ||||
| Phase | Crest Elevation (m) | Spillway Invert (m) | Level (m) | |
| 1 | 220 | 215 | 210 | |
| 2 | 255 | 250 | 245 | |
| 3 | 285 | 280 | 275 |
Clean water is diverted around the mine, tailings, stockpiles, and WRFs where possible. Diversion channels, a 2.6 km tunnel, and dikes were constructed to transfer water from Salobo Creek to Mirim Creek via Mano Creek, and then back to its original watercourse to prevent this water from being affected by the mine.
Three sediment control ponds (I, III and III) were constructed on Salobo and Cinzento Creeks to collect fine sediments from site runoff, stockpiles and the WRFs prior to discharge to downstream waters. Sediment dams are designed for a one in a thousand year rain event and to spill water in the wet season and not in the dry season.
A simplified schematic of water flows and mine components is presented in Figure 20-8.
The raw water capture dam, located in Mamão Creek, was designed by BVP Engenharia to provide water for human consumption and make up water for the process plant. The water dam is located approximately 2.5 km from the plant, and is a cross-valley dam consisting of a homogeneous earth fill embankment with vertical and horizontal filters and an open channel spillway near the left shoulder. Key design parameters are displayed in Table 20-6, the volume/area versus elevation curve in Figure 20-9, and a general layout plan in Figure 20-10.
| March 2016 | Page 20-20 | |
| Project Number:179678 |
|
Salobo Operations Para State, Brazil NI 43-101 Technical Report |

Table 20-6: Water Capture Dam Key Design Criteria
| Item | Value | |
| Crest elevation (m) | 199.58 | |
| Maximum water level | 195.58 | |
| Maximum volume (m3) | 380,000 | |
| Maximum height | 19.0 | |
| Crest length | 409 | |
| Crest width | 6.0 | |
| Drainage area (ha) | 420 | |
| Area occupied (ha) | 10 | |
| Spillway type | Open channel |
| March 2016 | Page 20-21 | |
| Project Number:179678 |
|
Salobo Operations Para State, Brazil NI 43-101 Technical Report |

| March 2016 | Page 20-22 | |
| Project Number:179678 |
|
Salobo Operations Para State, Brazil NI 43-101 Technical Report |
| 20.6 |
Closure Plan |
The mine Closure Plan assumes that there will be partial recovery of infrastructure for use by educational activities, research and tourism. The closure plan is included in the Environmental Control Plan and rehabilitation and re-vegetation work is ongoing during operations. The Closure Plan (SETE, 2015) outlines the steps to be taken for the progressive rehabilitation and ultimate closure of the open pit and concentrator facilities and the auxiliary components of the operation and all associated infrastructure and equipment. The overall objective is to return the Project area to a natural condition to support the local vegetation and wildlife biodiversity of the Tapirapé–Aquiri National Forest.
There are no reclamation bonds required for the mine. Rehabilitation and re-vegetation work is ongoing during operations.
Closure costs have been estimated by Vale at approximately US$172.5 million, scheduled over a five-year closure period. Closure costs are to be reviewed annually and are included as indirect costs in each operational centre for budgeting, expenditure tracking and financial planning (Vale, 2015).
Additional assessment and engineering work will be required in advance of implementing much of the Closure Plan to update and confirm reported conditions, verify technical and economic feasibility of the proposed measures, and to produce design specifications. The next update of the Closure Plan should provide data on hydrogeological and water management requirements to a greater level of accuracy. The plan should also incorporate results of current geochemical studies so that an integrated waste management strategy can be developed and implemented.
| 20.7 |
Permitting |
Brazil is a federal republic, and its legal system is based on Civil Law tradition, characterized by codification of legal requirements. The Federal Constitution (October, 1988) is the basis of the legal system.
Key applicable legislation for construction, operation and closure of the Project includes the following:
| • | Mining Code (Decree-Law No. 227, 28 February, 1967) and its Regulations (Decree No. 62934, 2 July, 1968) | |
| • | Forest Code (Law No. 4771, 15 September, 1965) | |
| • | National Environmental Policy Law (Law No. 6938, 31 August, 1981) | |
| • | CONAMA (National Environment Council) Resolutions Nos. 1/86, 23/86, 9/90, 10/90 and 237/97 |
| March 2016 | Page 20-23 | |
| Project Number:179678 |
|
Salobo Operations Para State, Brazil NI 43-101 Technical Report |
| • | National Water Resources Policy Law (Law No. 9433, 8 January, 1997). |
An Installation License is required for construction and an Operations License is required for mine operations. The operations permit is granted following review and approval of an environmental impact assessment (EIA/RIMA). The lead agency for environmental permitting is the Brazilian Institute for Environment and Renewable Resources (IBAMA). There are a number of other Federal, State and municipal permits governing forest clearing, water rights, natural resource protection, waste management, etc. that must also be obtained and maintained for operations. Table 20-7 summarizes the main Federal environmental permits required to support operations.
Although the Salobo Operations are located in the Tapirapé–Aquiri National Forest, the forest management plan allows for mining, provided that the mining operation meets the required environmental protection objectives.
Installation Licence No. 889/2012 for construction of the expansion to 24 Mt/a and Operations Licence No. 1096/2012 for the current operations were granted by IBAMA in November, 2012. Installation Licence No. 886/2012 was received in June, 2012 authorizing construction of an expansion of the fueling station for heavy machinery. Operating permits for the expanded operation were implemented in 2014. Each license includes a number of specific conditions, which give Vale ongoing monitoring obligations to ensure compliance.
Four vegetation removal permits were granted in 2012 authorizing clearing of a total of 1,947 ha for project development.
A water rights permit was received from the National Water Agency (ANA) in October, 2006, Resolution No. 427, that authorized construction and operation of the various components affecting waterways including the tailings dam and impoundment, dikes, diversions and sediment control ponds.
A second water rights permit was received from ANA in June, 2012, Resolution N° 233, that authorizes two treated effluent discharges (total discharge of 433,620 m3 meeting criteria for biological oxygen demand, phosphorus and temperature) and four water intake points (total annual uptake of 2,934,044 m3) for the Salobo Mine.
The Salobo Operations currently hold all required permits to operate. The mine has a robust control and monitoring system to ensure that permits remain current, and to ensure that the requirements of each permit are monitored to comply with the relevant regulatory conditions imposed.
| March 2016 | Page 20-24 | |
| Project Number:179678 |
|
Salobo Operations Para State, Brazil NI 43-101 Technical Report |
Table 20-7: Key Federal Environmental Permits
| Issuing Agency |
Permit Number | Purpose | Date Granted |
Duration/ Good To Date |
| IBAMA | N° 1096/2012 and N° 1096/2012 (rectification) |
Operations of the mining complex, called Salobo Copper Project (12 Mt/a) to till and benefit copper ore, gold and silver, including improvements requested by this IBAMA, as part of the environmental permitting process, producing copper concentrate | 05/11/2012 28/05/2014 |
4 years 5/11/2016 |
| IBAMA | N° 889/2012 | Physical installation of the mining complex, called Salobo Copper Project (24 Mt/a) to till and benefit copper ore, gold and silver, including improvements requested by this IBAMA, as part of the environmental permitting process | 05/11/2012 | 3 years |
| IBAMA | N° 966/2013 | Expansion of explosives plant | 25/10/2013 | 3 years |
| IBAMA | N° 1081/2012 | Operations of light vehicle fueling station | 20/06/2012 | 4 years |
| IBAMA | N° 1081/2012 (rectification) |
Operations of light vehicle fueling station | 22/05/2013 | 4 years |
| ANA | Resolution N° 167/2004 |
Authorization to the right over water resources for the implementation of road bridge over the Itacaiúnas River on the stretch that marks the border between the municipalities of Marabá and Parauapebas. | 05/04/2004 | 35 years |
| Authorization to the right over water resources: | ||||
| ANA | Resolution No. 427/2006 |
• Dam for tailings disposal and
water catchment • Catchment of water at any point inside the Mirim stream reservoir • Tailings disposal at any point within the Mirim stream reservoir • Fines I Dam • Other uses. |
16/10/2006 | 20 years |
| ANA | Resolution No. 233/2012 |
Dilution of treated wastewater: 1 - ETE Administrative Plateau (Salobo Stream); 2 - ETEQ Office Plateau (Salobo Stream) Water catchment: 1 - point 13 - Road (Gelado stream); 2 - point 14 - Road (unnamed watercourse); 3 - point 15 - Road (unnamed watercourse); 4 - point 17 - Road (Itacaiúnas River) | 20/06/2012 | 23/10/2026 |
| ANA | Resolution No. 505/2014 |
Catchment points: 5,6,12,14,15,16,17; Launching points; 1,2,4; Non-consumptive uses: 11,12,13,14,15,16 | 27/03/2014 | 23/10/2026 |
| SEMA/PA | Authorization No. 1210/2013 |
Dilution of release of treated effluents into the Esquecido stream | 21/11/2013 | 20/11/2017 |
| 20.8 |
Considerations of Social and Community Impacts |
The Salobo Mine’s area of influence is located in the southeast Paraense mesoregion, in the municipalities of Marabá and Parauapebas. These regions are considered to have moderate human development indices for the level of health, education and living conditions, based on data from 2000. The extractive industry accounts for 23.5% of the economic activity in the state of Pará, with 17.9% other industrial activities, 52.0% services and 6.6% farming and ranching based on 2010 data (IBGE, 2013).
| March 2016 | Page 20-25 | |
| Project Number:179678 |
|
Salobo Operations Para State, Brazil NI 43-101 Technical Report |
The Project is not located on indigenous lands. The nearest indigenous lands include the river Tapirapé Tuere, Trincheira Bacaja and Xicrin do Cateté, all located 25 km or more from the Project. The Xikrin indigenous peoples traditionally use the Project area for food collection.
CVRD signed an agreement with the Xicrin do Cateté indigenous community in 1989 (Convenio No. 453/89; FUNAI, 1989).
In 2001, a forest management program was implemented between the indigenous communities and government associations to sustainably harvest the forest in the Project area in a manner that benefitted the indigenous community in capacity building and financial resources.
Vale currently maintains a Communication Plan that commits to continued communication with the local indigenous to maintain community health and safety, cultural preservation, transparency of activities and harmony between the workers and the indigenous community. The terms of the Installation Licence require the company to allow access for the Xikrin to continue with food collection from January to April (Vale, 2012).
There are a number of social management plans carried out by the Social Communications Department. The Environmental Compensation and Social Inclusion plan objectives are to support sustainable development by capitalizing on the positive effects of project development and minimizing the potential negative effects. In addition, this plan is supported by a Social Communications program that facilitates information exchange and works to improve relations between the Salobo Operations and the diverse social segments of the surrounding communities.
An Environmental Education program was developed between the Department of Environment and Sustainable Development (DIAM), Vale Education and the municipality of Parauapebas. The program seeks to spread the principles of sustainability recognized as environmental, social and economic responsibility through educational activities geared towards Vale’s employees and contractors and the surrounding community. The program aims to strengthen and expand environmental education in the municipal education program and the community.
| 20.9 |
Comments on Section 20 |
Extensive environmental baseline studies were performed in support of mine permitting. From these, two major areas that require careful environmental management were identified:
| • | Effects on biodiversity because of the sensitivity of the area where the mine is located. Emphasis should be placed on maintaining a compact footprint for the project and ensuring that work is only carried out in areas that have been approved by the authorities |
| March 2016 | Page 20-26 | |
| Project Number:179678 |
|
Salobo Operations Para State, Brazil NI 43-101 Technical Report |
| • |
Effects on water quality. Operations should follow the environmental management plan to mitigate the effects of the operation (zero discharge), and maintain measures to control vegetation clearing and maintain an ongoing remediation/rehabilitation program. |
Hydrogeological and water management studies should be updated in the Closure Plan to a greater level of accuracy than is currently the case. Integration of geochemical studies to generate a comprehensive waste management plan should be conducted, and the results incorporated in the next Closure Plan update.
The permitting, environmental and social licence requirements to operate the Salobo Mine are well understood and supports Mineral Resource and Mineral Reserve estimation.
The permits needed to develop and operate the mine are known, the procedures and timeframes to obtain these are understood and the existing expiry date tracking system is acceptable.
The Closure Plan for the Salobo Mine includes the areas that will need decommissioning and rehabilitation, and has been designed to a conceptual level of detail. The Closure Plan meets Vale’s internal standards as well as the relevant Brazilian authority requirements. The 2015 closure and rehabilitation cost estimate appears reasonable.
The environmental, health and safety plans are written to satisfy Vale’s internal standards as well as the relevant Brazilian authority requirements.
The TSF design was by BVP Engenharia. However, due to non-conformities (compaction of earth fill and drainage material placement) during the construction phase and resulting geotechnical uncertainties, BVP Engenharia undertook additional site and laboratory investigations with the aim of validating actual conditions of the constructed embankment. Reinforcement of the TSF was undertaken, consisting of reinforcement of downstream slope. Pimenta de Avila participated in workshops, consolidated existing data for the dam, and provided a peer review of the original design and as-builts, as well as an assessment of the corrective actions that were proposed by BVP Engenharia.
| March 2016 | Page 20-27 | |
| Project Number:179678 |
|
Salobo Operations Para State, Brazil NI 43-101 Technical Report |
| 21.0 |
CAPITAL AND OPERATING COSTS |
| 21.1 |
Capital Cost Estimates |
The Salobo Project expansion (Salobo II, plant expansion for 24 Mt/a) construction was completed in 2014. Only US$13.2 million in growth capital (in addition to the sustaining capital) remains to be spent on this project, and will be expended on mining equipment to accommodate the additional production.
A total of $1,928 million will be spent over the LOM, of which US$1,673 million will be between 2016 and 2044, when the mine is in full operation and US$255 million from 2045 to 2065, when stockpile low-grade material is being fed to the plant. A major part of the sustaining capital cost is required for the replacement of mining equipment.
The exploration costs are related to the Exploration Department and Strategic Business Development Department which are not considered as a part of the Salobo mining costs.
The LOMP includes a total of US$15.45 million for research and development (R&D), including internal prefeasibility and feasibility studies on selected projects.
| 21.1.1 |
Basis of Estimate |
Capital costs are based on operational experience, Vale budgetary figures, and quotes provided by suppliers.
| 21.1.2 |
Mine Capital Costs |
As the Salobo Operations have reached the currently-planned production rate of 24 Mt/a mill feed and no further production increases are immediately contemplated, all capital costs are considered to be sustaining capital, except for the approximately $13 million that will be used for mining equipment required for the expansion and which has been delayed.
The mining sustaining capital cost for the 2015 budget was checked and was considered reasonable.
| 21.1.3 |
Process Capital Costs |
There are no process-related capital expenditures other than sustaining or growth capital estimates.
| 21.1.4 |
Sustaining Capital |
The main drivers that define the sustaining capital costs are the LOM planning and the associated mine equipment requirements.
| March 2016 | Page 21-1 | |
| Project Number:179678 |
|
Salobo Operations Para State, Brazil NI 43-101 Technical Report |
Other sustaining capital costs include costs to replace equipment when it has reached its estimated economic life, and replacements of major components. Costs for pumps and smaller equipment are also included. A major capital cost item is the removal of vegetation before mining a new area and vegetation removal that is required before using a new part of either the WRF or low-grade stockpile. A second key contributor to the capital costs are the retaining dams required to allow solids settling.
Small adjustments are made during the five-year budget planning process.
The total amount of sustaining capital estimated over the life of the Mineral Reserves is US$1,928 million. The majority of the sustaining capital (US$1,673 million) is allocated for the period between 2016 and 2044, when the mine is in full operation. An additional US$255 million is allocated from 2045 to 2065, when stockpile low-grade material is being fed to the plant.
A major part of the sustaining capital cost is required for the replacement of mining equipment.
An amount of US$13.2 million of growth capital is budgeted in 2016, to cover the cost of additional mining equipment, which was scheduled to be acquired earlier in the mine plan, but had been delayed. An amount of US$47.1 million is budgeted in 2015, to support internal exploration and engineering studies on selected projects.
Mine capital costs are included in Table 21-1, with process costs summarized in Table 21-2.
| 21.1.5 |
Capital Cost Summary |
A total of $1,928 million will be spent over the LOM.
| 21.2 |
Operating Cost Estimates |
| 21.2.1 |
Basis of Estimate |
Operating costs were estimated by Vale personnel, and are based on the 2015 LOM budget. The labour cost estimation is based on the applicable Vale salary scale and fringe benefits in force. The mining consumables are based on 2014 costs and contracts and the costs for future operation consumables, such as mill reagents, grinding media, etc., are based on recent supplier quotations.
| March 2016 | Page 21-2 | |
| Project Number:179678 |
|
Salobo Operations Para State, Brazil NI 43-101 Technical Report |
Table 21-1: Sustaining Capital ($US M)
| Salobo Operations | 2016 | 2017 | 2018 | 2019 | 2020 | |
| Total | 154.3 | 121.0 | 35.5 | 53.4 | 72.8 |
Table 21-2: Sustaining Capital – Process ($US M)
| Items | 2015 | 2016 | 2017 | 2018 | 2019 | |
| Metallurgical Samplers – Salobo I | 1.5 | |||||
| Improvements to Material Handling | 5.3 | |||||
| Xanthate and Flocculant Reception Infrastructure | 0.3 | |||||
| Spare Parts | 4.5 | 7.2 | 13.4 | 2.0 | ||
| Total | 6.8 | 4.8 | 7.2 | 13.4 | 2.0 |
| 21.2.2 |
Mine Operating Costs |
The mining operating cost for the 2016 LOMP is partly based on the 2014 LOMP with an update for the 2016 five-year plan, based on actualization of the production plan and actual operating costs.
One major adjustment is the change in exchange rate. Previously, an exchange rate of 2.61 R$/US$ was used; in the 2016 LOMP, an exchange rate of 3.5 R$/US$ is used. This increase in exchange rate seems reasonable given the exchange rate of approximately 3.75 in November 2015.
The mining operating cost for the 2014 LOMP is estimated from first principles, using experience from the previous production years for equipment already in use, and experience gained from the nearby Sossego mine from the equipment that is in use there. Operating costs include labour and salaries, energy, fuel and explosive costs and costs for wear and maintenance parts. All of these costs are based on estimated equipment hours.
However, beside the application of the change of exchange rate, which accounts for 78% of the costs, additional cost reduction was observed and justified as the expected result of cost reduction programs. The percentage of this cost reduction is relatively small. Although Amec Foster Wheeler has not seen the details of this cost reduction program, the reduction is considered to be achievable.
| 21.2.3 |
Process Operating Costs |
The processing plant operating costs estimate is derived from historical data, as it pertains to Salobo I, and then allowing for the growth in manpower and drawn power to cover the additional requirements brought by the addition of Salobo II in June 2014.As such, historical data are not reflecting the current situation, since Salobo II has yet to complete a full year of operations.
| March 2016 | Page 21-3 | |
| Project Number:179678 |
|
Salobo Operations Para State, Brazil NI 43-101 Technical Report |
The fixed costs are thus expected to trend downwards somewhat in 2016, while the variable cost component is adjusted to the incremental throughput envisioned.
The process operating costs are divided into three categories in the SAP-based reporting system: Operations, Process, and Services. Operations typically cover the direct manpower, consumables and spare parts required for the operation of the plant. Process includes engineering support services such as metallurgy, assay laboratory, QA/QC functions and maintenance planning. Under services, the main item is electrical power (price estimated at R$153/MW) but mobile equipment lease and contractors for clean-up (Ferrari) and maintenance tasks (RIP, Metso) also fall in this category.
The SAP report can further differentiate between cost types (manpower, materials, services and others) and between fixed or variable costs. This latter approach is useful to account for the differential feed throughput budgeted year over year.
In order to validate the projected costs, a comparison with the historical data is relevant. However, with the commissioning of the Salobo II plant in June 2014, yearly historical data in line with the operations of the two plants is not yet available.
The approach used by Amec Foster Wheeler was to look at fourth-quarter 2014 data only, to assess what a full year with both plants operating may yield, with the understanding that this period, as well as the 2015 and 2016 budgets, are bound to include additional manpower to complete the commissioning phase of the Salobo II plant and finalize required one-off modifications (some of which borne by operating costs, not sustaining capital). Some reduction of the operating cost estimate later on may thus be justified.
From the SAP data, Table 21-3 can be extracted. The table shows that October costs were credited by an amount of US$5.1 million, leaving a negative cost of US$4.9 million for the month. This reflects a transfer of costs associated with Salobo II infrastructure to the sustaining capital cost ledger. Adding back this amount to the fourth quarter 2014 totals shown in Table 21-3, the projected yearly processing operating costs would thus have been US$156.2 million. With a processed throughput of only 4.03 Mt in the fourth quarter of 2014 (or 16.1 Mt/a), this is equivalent to a unit cost of US$9.69/t, of which 23.8% was fixed.
| March 2016 | Page 21-4 | |
| Project Number:179678 |
|
Salobo Operations Para State, Brazil NI 43-101 Technical Report |
Table 21-3: Plant Operating Costs per Compilation in SAP – Q4 2014
| Row Labels | October | November | December | Adj, Q4 2014 | Adj. Yearly | |
| Process Plant | 6,230,071 | 17,061,004 | 10,660,044 | 39,051,120 | 156,204,479 | |
| Fixed | 2,109,338 | 3,571,605 | 2,724,416 | 9,286,683 | 37,146,731 | |
| Materials | 134,716 | 83,695 | 118,596 | 337,007 | 1,348,027 | |
| Others | 88,014 | 53,518 | 285,833 | 427,365 | 1,709,461 | |
| Manpower | 2,552,479 | 3,169,224 | 1,985,077 | 7,706,780 | 30,827,121 | |
| Services | 4,884,547 | 265,168 | 334,910 | 815,531 | 3,262,123 | |
| Variable | 8,339,409 | 13,489,399 | 7,935,629 | 29,764,437 | 119,057,747 | |
| Materials | 3,826,098 | 6,385,780 | 669,767 | 10,881,646 | 43,526,583 | |
| Services | 4,513,311 | 7,103,619 | 7,265,861 | 18,882,791 | 75,531,165 |
Increasing the underlying throughput to the nameplate capacity of 24 Mt/a, and using the same fixed costs proportion as found in the fourth quarter of 2014, an overall process cost of US$8.93/t is obtained. With only this value available to be used for comparison purpose against projected costs, it has to be recognized that this figure will provide an inflated estimate since burdened over the referenced production period with extra manpower, to carry through the final commissioning phase of Salobo II, and some materials expenditures devoted to fix one-off construction-related issues and not appropriately added to the capital costs ledger. The fixed cost component is shown as marginally decreasing from the 23.8% registered in Q4 2014 towards 21.8% in the financial model.
Table 21-4 shows the projected production rates and costs used in the financial model over the 2016–2021 period. The unit processing cost is shown as fairly stable, in the US$7.95 –$8.07/t range to 2019 and increasing to US$8.37/t in 2020, before being fixed at US$8.21/t thereafter. This increase comes from fixing the yearly throughput at 23.28 Mt, versus the higher values forecasted in the previous years.
Table 21-5 reconciles the projected processing costs with those of Q4 2014, which is the only historical dataset available over which both plants were in operation. However, Salobo II was still in commissioning mode at the time of the comparison. The adjustments are reflecting the effect of the fixed costs component on the yearly throughput as well as the effect of a more favourable exchange rate, when operating costs are converted to US dollars from Brazilian reals. This exchange rate variable has a major influence since 93% of the plant operating costs are indicated as being denominated in Brazilian reals. The foreign exchange rate considered for the reference period of Q4 2014 is 2.547 R$/US$, on the basis of the average daily cash rates over the period, as per the statistics of the Bank of Canada.
| March 2016 | Page 21-5 | |
| Project Number:179678 |
|
Salobo Operations Para State, Brazil NI 43-101 Technical Report |
Table 21-4: Projected Process Plant Operating Costs
| 2016 | 2017 | 2018 | 2019 | 2020 | 2021 | ||
| Cash Cost ($ M) | 186.24 | 187.68 | 193.87 | 195.89 | 194.77 | 191.17 | |
| Throughput (dry Mt/a) | 23.21 | 23.61 | 23.83 | 24.27 | 23.28 | 23.28 | |
| Unit Cost ($/t processed) | 8.03 | 7.95 | 8.14 | 8.07 | 8.37 | 8.21 |
Table 21-5: Comparison of Historical and Adjusted Projected Processing Costs
| Yearly Actual | Financial Model | ||||||||
| Units | Q4 2014-basis | 2016 | 2017 | 2018 | 2019 | 2020 | 2021 | ||
| Total processing operating costs | M$ | 156.204 | 186.238 | 187.679 | 193.867 | 195.892 | 194.773 | 191.172 | |
| Actual / projected operating costs | $/t | 9.69 | 8.03 | 7.95 | 8.14 | 8.07 | 8.37 | 8.21 | |
| Exchange rate (R$/US$) | 2.547 | 3.50 | 3.50 | 3.50 | 3.50 | 3.50 | 3.50 | ||
| % of cost in US$ | 7% | 7% | 7% | 7% | 7% | 7% | 7% | ||
| $/t at fixed foreign exchange rate | 3.5 | 7.24 | 8.03 | 7.95 | 8.14 | 8.07 | 8.37 | 8.21 | |
| 2013 $/t adjusted for production in t/a and exchange rate | 7.24 | 6.76 | 6.74 | 6.73 | 6.71 | 6.75 | 6.75 | ||
| Variation vs. adjusted value | -19% | -18% | -21% | -20% | -24% | -22% | |||
The projected processing costs are found to be high, with an increment of about 20% over what the adjusted Q4 2014 cost basis would indicate, in comparison with the limited historical records reviewed. This is especially true when the situation of a plant commissioning and ramp-up at Salobo II over this reference period is duly taken into account, with the associated expectations that personnel reduction will be completed once the commissioning issues associated with plant ramp-up will have been dealt with.
The 20% differential could be explained if the foreign exchange of 2.547 for Q4 2014 had been set at about 3.100, in order to match the expected projections made on the basis of a foreign exchange rate of 3.5 R$L/US$.
| 21.2.4 |
Operating Cost Summary |
The operating costs were significantly reduced in comparison to the 2015 LOMP, partly due to the change in exchange rate from 2.61 R$/US$, to 3.5 R$/US$, but also partly due to the planned implementation of a cost-cutting program.
| 21.3 |
Comments on Section 21 |
The reduction of operating cost due to the change in exchange rate seems reasonable. The expectations of achieving the results forecast in the planned cost-cutting program are reasonable. These reductions are only a small portion of the lower mining costs
| March 2016 | Page 21-6 | |
| Project Number:179678 |
|
Salobo Operations Para State, Brazil NI 43-101 Technical Report |
projected; the major decrease in costs comes from a change in the R$:US$ exchange rate assumptions.
The basis for estimating the process costs was found to be adequate. Compliance with the numbers provided will partly rely on making personnel cutbacks once the plant commissioning phase is completed, and also rely on achieving the throughput ramp-up implied in the budget.
| March 2016 | Page 21-7 | |
| Project Number:179678 |
|
Salobo Operations Para State, Brazil NI 43-101 Technical Report |
| 22.0 |
ECONOMIC ANALYSIS |
Silver Wheaton is using the provision for producing issuers, whereby producing issuers may exclude the information required under Item 22 for technical reports on properties currently in production.
Mineral Reserve declaration is supported by a positive cashflow.
| March 2016 | Page 22-1 | |
| Project Number:179678 |
|
Salobo Operations Para State, Brazil NI 43-101 Technical Report |
| 23.0 |
ADJACENT PROPERTIES |
This section is not relevant to this Report.
| March 2016 | Page 23-1 | |
| Project Number:179678 |
|
Salobo Operations Para State, Brazil NI 43-101 Technical Report |
| 24.0 |
OTHER RELEVANT DATA AND INFORMATION |
| 24.1 |
Opportunities |
Amec Foster Wheeler and Vale staff reviewed the opportunities available to the Salobo Operations, and note that a number of opportunities remain to improve the Project economics and to potentially extend the current LOM.
| 24.1.1 |
Exploration |
Geophysical surveys recently completed by the Exploration department at the Salobo Operations has identified a significant gravity anomaly below the current Salobo open pit. Drilling is required to determine what the anomaly source is; however, if it is Salobo-style mineralization, there is upside potential for possible mine life extensions.
| 24.1.2 |
Mining |
Review of the operational pit slope angles through geotechnical examination of the pit wall execution and design phases may provide support for steepening of some of the pit walls.
| 24.1.3 |
Process |
Copper and gold recoveries are currently higher than model-predicted. However, increases in recovery predictions require support from a full metallurgical balance process, and the sampling processes to provide the data for such a balance are not fully implemented. If higher recoveries can be demonstrated and supported, this is likely to provide some economic upside to the project.
Geometallurgical domaining may also provide additional upside if the plant and stockpile feed can be more consistently controlled.
Vale is currently conducting internal studies to determine if a further expansion of the processing capacity to 36 Mt/a (an additional increase of 12 Mt/a over the Salobo II throughput rate) is feasible. The current intent is to feed the expanded plant with medium- and lower-grade material, and no additional material movement is currently contemplated in the Salobo III concept.
| 24.1.4 |
Economic Analysis |
Silver is estimated in the block model, but is not reported in the economic analysis; however, silver represents a small economic upside potential for the Project.
| March 2016 | Page 24-1 | |
| Project Number:179678 |
|
Salobo Operations Para State, Brazil NI 43-101 Technical Report |
| 24.2 |
Risks |
Vale corporate staff reviewed the risk register maintained by the Salobo Operations and noted to Amec Foster Wheeler a number of risks that could affect the Project. These risks are in addition to, or complement, risks already identified by the QPs in their various Report subsections.
| 24.2.1 |
Mining |
The mine plan assumes an advance rate that has not been supported to date in operations. Achieving planned availability, utilization and productivity factors to support the advance rate may be challenging. It will be important to ensure that the newly-acquired production equipment is brought on line with the minimum of commissioning delays. Considerable attention will need to be paid by operations staff to operational efficiency. During 2015, the actual material movement was about 10 Mt less than budgeted. The annual mine plan for 2016 incorporated this material, and also assumes an increase in dilution from 5% to 11%. However, dilution remains at more optimistic assumptions for the remainder of the mine plan post 2016, and will need to be closely monitored, particularly in the period 2017–2018.
| 24.2.2 |
Process |
The Salobo Operations processing plant availability, utilization and feeding rate have been systematically underperforming annual planned values due to unstable plant performance. The planned processing performance may continue to be misrepresentative of the actual executed values during the ramp-up process, and lower copper concentrate grades may occur in some months. During November 2015, the plant did come close to matching predicted values with actual performance. Attention to ongoing bottlenecks will be required. In particular the plant operators will need to resolve issues with single circuit availability, variations in hardness in mill feed, and oversize ore being sent to the mill from the mining operations.
| 24.2.3 |
Water Treatment and Tailings |
Suspended particulate matter in water from the tailings dam is currently not meeting discharge limits. The tailings dam spillway has been closed to avoid out-of-specifications chemical components reaching the environment. Studies are underway to better determine tailings mineralogy and to understand the chemical behaviors. Continued over-limits in tailings waters are likely to result in regulatory action.
| 24.2.4 |
Legislation |
Some Brazilian legislative changes may have impacts on the operations as envisaged. There is a requirement that mining companies perform a survey to determine if any karstiform features can be impacted by the operations. While no caves or cavities have been encountered during mining to date, such a survey still has to be completed. If karstiform features are identified, additional costs may be incurred. These could range from changes to infrastructure locations, operating methods and operating cost assumptions, to additional environmental-related costs.
| March 2016 | Page 24-2 | |
| Project Number:179678 |
|
Salobo Operations Para State, Brazil NI 43-101 Technical Report |
The responsibility for granting of vegetation clearance permits has been assumed by Federal authorities, and is no longer managed at the State level. In practice, this is likely to lead to additional regulatory steps that must be met when applying for such permits, increases in the timeframe taken to prepare permits, and increases in the time that must be allocated for the application reviews to obtain the required regulatory approval. The mining advance and tailings dam lift schedules could be impacted significantly if the permit application and grant process is delayed.
| March 2016 | Page 24-3 | |
| Project Number:179678 |
|
Salobo Operations Para State, Brazil NI 43-101 Technical Report |
| 25.0 |
INTERPRETATION AND CONCLUSIONS |
The QPs note the following interpretations and conclusions in their respective areas of expertise, based on the review of data available for this Report.
| 25.1 |
Mineral Tenure, Surface Rights, Royalties and Agreements |
Legal opinion supports that Vale holds the appropriate mineral tenure and surface rights to support mining operations. A CFEM is payable on copper production, at 2%.
| 25.2 |
Geology and Mineralization |
The IOCG model is a valid model for exploration in the Salobo area.
Knowledge of the deposit settings, lithologies, mineralization style and setting, and structural and alteration controls on mineralization is sufficient to support Mineral Resource and Mineral Reserve estimation.
The Salobo mineralization is limited in strike but remains open at depth below the current pit.
| 25.3 |
Exploration, Drilling and Analytical Data Collection in Support of Mineral Resource Estimation |
The quantity and quality of the lithological, geotechnical, collar and downhole survey data collected in the exploration and infill drill programs during the 1997 and later campaigns are sufficient to support Mineral Resource and Mineral Reserve estimation. No core drilling has been performed since 2003. Current drill programs are restricted to grade control drilling.
Drill orientations are appropriate for the mineralization style, and have been drilled at orientations that are acceptable for the orientation of mineralization for the bulk of the deposit area. Drill dips are oblique to the mineralized bodies; however, are considered reasonable for surface drilling on these conditions. The intersected thickness differs from true thickness, with the true thickness generally being significantly smaller.
The 1997 and 2002–2003 assay data are sufficiently reliable to be used in Mineral Resource and Mineral Reserve estimation.
Sample security procedures met industry standards at the time the samples were collected. Current sample storage procedures and storage areas are consistent with industry standards.
Data verification has been extensively conducted since 1988 by numerous consultants, and no material issues have been identified by those programs. In addition, Vale has regularly used various procedures to verify the quality of the data. The lithological and mineralization models have been diligently constructed, and have been prepared using industry-standard practices.
| March 2016 | Page 25-1 | |
| Project Number:179678 |
|
Salobo Operations Para State, Brazil NI 43-101 Technical Report |
Data collected has been sufficiently verified that they can support Mineral Resource and Mineral Reserve estimation and be used for mine planning purposes.
| 25.4 |
Metallurgical Testwork |
Metallurgical testwork completed from 1978–2006 provided the basis of the Salobo I plant design criteria and/or its metallurgical performance projections.
The copper recovery in the LOMP is set at 87.6% from 2016–2027, after which it decreases to 85% to reflect the processing of lower-grade stockpiled material that may have weathered. The target gold recovery increases to 66% in 2016 and held at this level until 2020 when the values used in the financial model reflect closely the projected value from recovery Equation 2.
Equations to project copper and gold recoveries used a large data set from testwork. Within the 0.6 –1.5% Cu range of the data points retained for a regression analysis, the resulting equations are fairly insensitive to the actual feed grade encountered. The equations may be sufficient for predicting results over longer-term periods (e.g. yearly, maybe monthly) but may not be adequate for applying a daily target to the plant operations since variations in the lithological make-up of the plant feed over such a short period may have called for different target recoveries than indicated by the equations.
Some variability in the metallurgical results can be expected as the mixture of lithologies found in the plant feed change. Over monthly periods, the resulting blend is more likely to approach the Mineral Reserves profile and thus mitigate the variability that may be detected on a daily basis, versus projections.
Introduction of mixed material above a proportion of 30% of plant feed has been shown to lead to a degradation of the flotation results. Proper blending of such material, albeit representing only about 1% of the Mineral Reserves, will be required.
There are three deleterious elements of potential concern in the copper concentrate, namely fluorine, chlorine and uranium. Of these, fluorine is the most significant. Vale has secured contracts with four smelters able to accept Cu concentrates with F contents of up to 4,000 ppm. Vale advised that, since concentrate lots are segregated by grade (lower, medium and high grades) at the Parauapebas transfer shed, blending of out-of-specification concentrate is possible, should it ever be necessary. Vale therefore proposes to manage elevated F contents in mill feed through blending so that the risk of concentrate rejection is significantly reduced.
The targeted operated throughput set at 3,146 t/h in 2015 and 3,171 t/h thereafter, has been achieved on a daily basis. Reducing the frequency of feed interruptions should help in meeting the monthly throughput targets.
| March 2016 | Page 25-2 | |
| Project Number:179678 |
|
Salobo Operations Para State, Brazil NI 43-101 Technical Report |
The operated utilization of the plant is meeting expectations whereas downward pressure on the actual utilization is brought mostly by the availability, which has been below expectations since inception of the operations, up to H2 2015. Completed modifications and upgrades during 2015, especially to some of the material handling equipment and related control strategies, have reduced the number of feed interruptions and unscheduled downtime.
The targeted long-term availability of 88.9% for 2020 may yet prove difficult to reach though, given the lack of stand-by crushing and screening equipment in the tertiary crushing circuit as well as the reliance upon multiple single-line conveyors.
| 25.5 |
Mineral Resource Estimates |
Geological logging and results from sampling from 416 diamond drill holes totaling 146,645 m were used as the basis for preparation of three dimensional (3D) models of lithology, mineralization envelopes, grades and density. The construction date for the resource model was 11 March, 2013.
The Mineral Resource estimate was prepared by Vale staff. 3D solid models of the lithology and copper grade shells were constructed, and compositing, exploratory data analysis including variography, interpolation, statistical validation and classification were completed. Visual validation of the resulting model was performed. The estimated elements in the model, using an OK estimator, are total copper, gold, silver, fluorine, carbon, molybdenum, sulphur, uranium, and density.
Mineral Resources that have an effective date of 31 December, 2015, are stated exclusive of Mineral Reserves on an in situ basis, and exclude application of planned and unplanned contact dilution and mining recovery factors. Mineral Resources have had reasonable prospects of eventual economic extraction considerations applied. Mineral Resources amenable to open pit mining methods at Salobo represent sulphide mineralization that is adjacent to the current Mineral Reserve pit plus Inferred Mineral Resources within the Mineral Reserve pit.
| 25.6 |
Mineral Reserve Estimates |
The mine plan is based on Measured and Indicated Mineral Resources. The LOM planning process uses previous actual availabilities, utilizations and cost as a reference to initially develop a five-year plan, which is then updated and used as the basis for the pit optimization and LOMP. The most recent pit optimization was in 2014 and the most significant impacts on the pit design were due to changes in costs, sale costs and exchange rates.
The 2014 Mineral Reserves were made current by subtracting the forecast production from the 2015 updated five-year mine plan.
| March 2016 | Page 25-3 | |
| Project Number:179678 |
|
Salobo Operations Para State, Brazil NI 43-101 Technical Report |
The current Mineral Reserve estimates are based on the most current knowledge, permit status and engineering and operational constraints. Mineral Reserves have been estimated using standard practices for the industry, and conform to the 2014 CIM Definition Standards.
| 25.7 |
Mining Plan |
Mining at the Salobo Operations utilizes standard open pit methods with drilling and blasting, loading and hauling.
The mining phases were transformed in a yearly production plan with a steady production feed of 24 Mt/a to the mill. A stockpiling strategy is practiced, targeting the higher grades to feed the plant in the first years of operation.
The influence of the steaming agreement with Silver Wheaton is not reflected in the pit optimization nor in the copper equivalent, which could mean that the cutoff grade is too low. This would mean that some material on the low-grade stockpile would be below the economic cutoff grade. However, given that the low-grade stockpile will only be fed to the plant after the cessation of mining in 2044, and because the Project discount rate is set at 10%, it is unlikely that the exclusion of gold in the marginal cutoff grade will have a material impact on Project economics.
Medium-grade and low-grade ore are now stockpiled together. It would be advisable to keep a better separation between the medium-grade and the low-grade to be able in a later stage of operations to focus only on the medium-grade material if required.
Although the resource pit is used as a method of ensuring that no permanent structures are being built within possible pit limits, the WRF is now planned to be 50 m away from the resource pit. A sensitivity study should be performed to find out if this is sufficient or if a 100 m distance would be a safer distance, in order to avoid sterilizing resources in the future.
The open pit mine life spans approximately 29 years, ending in 2044. However, the process plant will continue operating, processing stockpiled material for another 21 years until 2065.
The Salobo mine has already a considerable mining fleet; some additional fleet will be required to support the current LOM. Equipment availabilities, utilizations, productivities and equipment life are based on experience acquired from the nearby Sossego copper mine, where the same type of equipment has already been working under the same circumstances for many years.
| 25.8 |
Recovery Plan |
The process flowsheet has evolved through the various study phases of the Project, incorporating the additional knowledge gained from metallurgical testwork and the
| March 2016 | Page 25-4 | |
| Project Number:179678 |
|
Salobo Operations Para State, Brazil NI 43-101 Technical Report |
relative importance of the identified lithologies in the Mineral Resource and Mineral Reserve estimates.
Apart from the inclusion of HPGR for tertiary crushing duty, ahead of ball milling, the circuit is conventional, but with the flotation cleaning circuit making extensive use of flotation columns, to reduce entrainment of F-bearing non-sulphide gangue minerals such as fluorite and biotite.
Salobo II design has upheld the design criteria used for Salobo I, although some required improvements identified since commissioning the initial phase have also been incorporated.
Salobo I relied on a series of conveyors that were oversized for the design capacity of the 12 Mt/a plant, but were planned to cover the eventual addition of Salobo II and the total 24 Mt/a expanded capacity. The resulting processing facilities are therefore featuring a series of critical items that are not duplicated, the failure of which can curtail the complete plant operations, especially if occurring after the plant stockpile where no more significant surge capacity exists. Raising the plant availability at the levels targeted from this year and onwards relies in particular in resolving issues related to the wear in chutes and transfer points, as well as failure of conveyors pulleys.
| 25.9 |
Infrastructure |
The Salobo mine has been in operation since 2012, and at has been producing at a 24 Mt/a capacity since 2014. The infrastructure is well established and adequate for this production level.
Expansion scenarios are being discussed internally. If these are implemented, some areas, such as the capacity of administration buildings are likely to be adequate, but other, production-related infrastructure, such as workshop space and restaurant areas, might have to be adjusted.
| 25.10 |
Environmental, Permitting and Social Considerations |
Extensive environmental baseline studies were performed in support of mine permitting. From these, two major areas that require careful environmental management were identified:
| • | Effects on biodiversity because of the sensitivity of the area where the mine is located. Emphasis should be placed on maintaining a compact footprint for the project and ensuring that work is only carried out in areas that have been approved by the authorities | |
| • | Effects on water quality. Operations should follow the environmental management plan to mitigate the effects of the operation (zero discharge), and maintain measures to control vegetation clearing and maintain an ongoing remediation/rehabilitation program. |
| March 2016 | Page 25-5 | |
| Project Number:179678 |
|
Salobo Operations Para State, Brazil NI 43-101 Technical Report |
Hydrogeological and water management studies should be updated in the Closure Plan to a greater level of accuracy than is currently the case. Integration of geochemical studies to generate a comprehensive waste management plan should be conducted, and the results incorporated in the next Closure Plan update.
The permitting, environmental and social licence requirements to operate the Salobo Mine are well understood and supports Mineral Resource and Mineral Reserve estimation.
The permits needed to develop and operate the mine are known, the procedures and timeframes to obtain these are understood and the existing expiry date tracking system is acceptable.
The Closure Plan for the Salobo Mine includes the areas that will need decommissioning and rehabilitation, and has been designed to a conceptual level of detail. The Closure Plan meets Vale’s internal standards as well as the relevant Brazilian authority requirements. The 2015 closure and rehabilitation cost estimate appears reasonable.
The environmental, health and safety plans are written to satisfy Vale’s internal standards as well as the relevant Brazilian authority requirements.
The TSF was designed by BVP Engenharia and is proposed to have three implementation phases (starter dam and two raises); however, the potential to further divide the number of embankment raises, and thus reduce capital expenditure, is currently being evaluated. The TSF, when completed to a height of 285 m, will have sufficient capacity for the LOM.
In 2012, saturated areas were noted in the downstream right shoulder and then left shoulder of the TSF. BVP Engenharia, in conjunction with Vale and Pimenta de Avila completed investigations as to the seepage source, and implemented remedial actions later that year. Pimenta de Avila provided a peer review of the original design and as-builts, as well as an assessment of the corrective actions proposed by BVP Engenharia. Mine site personal are currently considering the installation of a radar to monitor the downstream embankment in real time.
Clean water is diverted around the mine, tailings and waste rock facilities where possible. Diversion channels, a 2.6 km tunnel, and dikes were constructed to transfer water from Salobo Creek to Mirim Creek via Mano Creek, and then back to its original watercourse to prevent this water from being affected by the mine.
Sediment control ponds were constructed on Salobo and Cinzento Creeks to collect fine sediments from site runoff, stockpiles and the waste rock dump prior to discharge to downstream waters.
| March 2016 | Page 25-6 | |
| Project Number:179678 |
|
Salobo Operations Para State, Brazil NI 43-101 Technical Report |
| 25.11 |
Markets and Contracts |
The information provided by Vale on marketing, contracts, metal price projections and exchange rate forecasts has been reviewed. The information provided is consistent with the source documents used, and the information is consistent with what is publicly available on industry norms. The information can be used in mine planning and financial analyses for the Salobo Operations in the context of this Report.
Long-term metal price assumptions used in the Report are based on a consensus of price forecasts for those metals estimated by numerous analysts and major banks. The analyst and bank forecasts are based on many factors that include historical experience, current spot prices, expectations of future market supply, and perceived demand. The long-term metal prices supporting the Mineral Resources, Mineral Reserves, and economic analysis in this Report are higher than the current market prices. Over a number of years, the actual metal prices can change, either positively or negatively from what was earlier predicted. If the assumed long-term metal prices are not realized, this could have a negative impact on the operation’s financial outcome. At the same time, higher than predicted metal prices could have a positive impact.
Amec Foster Wheeler notes that the long term exchange rate predicted by Vale is 3.50 R$/US$. This rate is higher than the historical average of approximately 2.25 R$/US$ over the past five years; however, the current exchange rate is approximately 3.75 R$/US$. A decline in exchange rate below 3.5 R$/US$ could have a negative impact on the financial results.
| 25.12 |
Capital Cost Estimates |
As the Salobo Mine has reached the currently-planned production rate of 24 Mt/a mill feed and no further production increases are immediately contemplated, all capital costs are considered to be sustaining or growth capital.
| 25.13 |
Operating Cost Estimates |
Operating costs appear reasonable. A decrease in costs from those reviewed at the time of the site visits is primarily due to changes in the assumed R$ to US$ exchange rate.
Additional minor reductions are incorporated as a result of planned cost-cutting measures. Amec Foster Wheeler has not seen the details of this cost reduction program; however, the reduction is considered to be achievable.
The basis for estimating the process costs was found to be adequate. Compliance with the numbers provided will partly rely on making personnel cutbacks once the plant commissioning phase is completed, and also rely on achieving the throughput ramp-up implied in the budget.
| March 2016 | Page 25-7 | |
| Project Number:179678 |
|
Salobo Operations Para State, Brazil NI 43-101 Technical Report |
| 25.14 |
Economic Analysis |
Silver Wheaton is using the provision for producing issuers, whereby producing issuers may exclude the information required under Item 22 for technical reports on properties currently in production.
Mineral Reserve declaration is supported by a positive cashflow.
| 25.15 |
Risks and Opportunities |
A number of risks and opportunities were identified by Vale and Amec Foster Wheeler staff, and have been discussed in the Report in the relevant discipline areas, and in Section 24.
These include:
| • | Opportunities |
| − |
Drilling is required to determine the source of a gravity anomaly at depth under the Salobo open pit; however, if it is Salobo-style mineralization, there is upside potential for possible mine life extensions | |
| − |
Geometallurgical domaining may also provide additional upside if the plant and stockpile feed can be more consistently controlled | |
| − |
Copper and gold recoveries are currently higher than model-predicted. If higher recoveries can be demonstrated and supported, this is likely to provide some economic upside to the Project | |
| − |
Review of the operational pit slope angles through geotechnical examination of the pit wall execution and design phases may provide support for steepening of some of the pit walls | |
| − |
A sensitivity study should be performed to find out if the 50 m offset for WRFs is sufficient or if a 100 m distance would be a safer distance, in order to avoid sterilizing Mineral Resources in the future | |
| − |
Silver is estimated in the block model, but is not reported in the economic analysis; however, silver represents a small economic upside potential for the Project |
| • | Risks |
| − |
The mine plan assumes an advance rate that has not been supported to date in operations. Achieving planned availability, utilization and productivity factors to support the advance rate may be challenging | |
| − |
The ore placed on the low-grade stockpile could potentially partly oxidize, which could lead to a reduction of the planned recoveries |
| March 2016 | Page 25-8 | |
| Project Number:179678 |
|
Salobo Operations Para State, Brazil NI 43-101 Technical Report |
| − |
The targeted long-term availability of 88.9% for 2020 may yet prove difficult to reach, given the lack of stand-by crushing and screening equipment in the tertiary crushing circuit as well as the reliance upon multiple single-line conveyors | |
| − |
The processing facilities have a series of critical items that are not duplicated, the failure of which can curtail the complete plant operations if the failure is located after the plant stockpile where no more significant surge capacity exists. A total of 12 conveyors, including two with shuttle heads, are forming a critical path after the last available stockpile. This presents a risk for interruptions in plant operation | |
| − |
Proposed process cost reductions will partly rely on making personnel cutbacks once the plant commissioning phase is completed, and also rely on achieving the throughput ramp-up implied in the budget | |
| − |
The metallurgical recovery equations may be sufficient for predicting results over longer-term periods (e.g. yearly, maybe monthly), but may not be adequate for applying a daily target to the plant operations since variations in the lithological make-up of the plant feed over such a short period may have called for different target recoveries than indicated by the equations | |
| − |
Suspended particulate matter in water from the tailings dam is currently not meeting discharge limits. Studies are underway to better determine tailings mineralogy and to understand the chemical behaviors. Continued over-limits in tailings waters are likely to result in regulatory action | |
| − |
The long-term metal prices supporting the Mineral Resources, Mineral Reserves, and economic analysis in this Report are higher than the current market prices. If the assumed long-term metal prices are not realized, this could have a negative impact on the operation’s financial outcome. At the same time, higher than predicted metal prices could have a positive impact. | |
| − |
A decline in exchange rate below 3.5 R$/US$ could have a negative impact on the financial results | |
| − |
Some Brazilian legislative changes may have impacts on the operations as envisaged, including survey requirements for karstiform landforms, changes to the regulatory oversight for vegetation clearance permits |
| March 2016 | Page 25-9 | |
| Project Number:179678 |
|
Salobo Operations Para State, Brazil NI 43-101 Technical Report |
| 26.0 |
RECOMMENDATIONS |
The Salobo Operations are a producing mine where material exploration activities and engineering studies have largely concluded.
Silver Wheaton holds a royalty streaming interest in the Salobo Operations and has no day-to-day involvement in mining or management decisions for the operations. However, any upside potential for the Project also has upside potential for Silver Wheaton’s streaming agreement.
The QPs have recommended a single work phase to assess the geophysical target discussed in Section 9.
An initial reconnaissance drill program is suggested to test the gravity anomaly at depth. This initial testing should consist of two to three drill holes, each approximately 2,500 m long. Assuming all-in drilling and assaying costs of US$250/m, and including corporate overhead allocations, this program is estimated at US$1.25 –1.88 million.
| March 2016 | Page 26-1 | |
| Project Number:179678 |
|
Salobo Operations Para State, Brazil NI 43-101 Technical Report |
| 27.0 |
REFERENCES |
Bongarçon, D.F, 2003. Memorandum-Salobo QA-QC. Internal report prepared by Agoratek International for Companhia Vale do Rio Doce, 26 September, 2006.
BVP Engenharia, 2007: Relatório de Escavabilidade Projeto Salobo: report prepared for Companhia Vale do Rio Doce.
BVP Engenharia, 2007: Revisão dos taludes da cava: report prepared for Companhia Vale do Rio Doce.
Canadian Institute of Mining, Metallurgy and Petroleum (CIM), 2003: Estimation of Mineral Resources and Mineral Reserves, Best Practice Guidelines: Canadian Institute of Mining, Metallurgy and Petroleum, November 23, 2003.
Canadian Institute of Mining, Metallurgy and Petroleum (CIM), 2014: CIM Standards for Mineral Resources and Mineral Reserves, Definitions and Guidelines: Canadian Institute of Mining, Metallurgy and Petroleum, May, 2014.
Canadian Securities Administrators (CSA), 2011: National Instrument 43-101, Standards of Disclosure for Mineral Projects, Canadian Securities Administrators.
Cassuto, D., and Sampaio, R., 2011: Water Law in the U.S. & Brazil – Two Approaches to Emerging Water Poverty: http://digitalcommons.pace.edu/lawfaculty/774/.
Castro, C., de Freitas, P.A. and Garcia, P., 2012: Mining Law Juridictional Comparisons, Brazil: report prepared by Veirano Advogados, first edition, 2012.
Companhia Vale do Rio Doce, 2003: Projeto Salobo. Validação de Resultados Analíticos de Projeto: internal report prepared by Companhia Vale do Rio Doce, September 2003.
Companhia Vale do Rio Doce, 2006: Plano De Manejo Para Uso Múltiplo Da Floresta Nacional Do Tapirapé-Aquiri: report prepared by Companhia Vale do Rio Doce, September, 2006.
Companhia Vale do Rio Doce and Salobo Metais S.A., 2003a: Salobo 3 Alfa Deposit Geological Model: internal PowerPoint presentation prepared by Companhia Vale do Rio Doce and Salobo Metais S.A.
Companhia Vale do Rio Doce and Salobo Metais S.A., 2003b: Relatório Final do Depósito Salobo 3 Alfa: internal report prepared by Companhia Vale do Rio Doce and Salobo Metais S.A.
| March 2016 | Page 27-1 | |
| Project Number:179678 |
|
Salobo Operations Para State, Brazil NI 43-101 Technical Report |
De Souza, L. H. and Vieira, E. A., 1998: Jazida de Cobre Salobo/Ouro/Prata, Pará, Brasil, Relatório Final de Geologia, Fase Salobo Metais S.A. (1997–1998): internal report prepared by Salobo Metais S.A., Rio de Janeiro, April, 1998.
Equipe de Geometalurgia, 2015: Projeto de Geometalurgia, Mina do Salobo: report prepared by Vale, May 2015.
Fonseca, E., 2002: Caracterização Mineralógico-Textural Da Amostra Inicial De Minério De Cobre Sulfatado De Salobo: report prepared by Gerência Geral de Desenvolvimento e Tecnologia (GGDT), for Companhia Vale do Rio Doce, 29 August, 2002.
Gerência Geral de Desenvolvimento e Tecnologia, 2004: Projeto Salobo. Caracterização Mineralógica De Produtos Da Flotação Do Minério De Cobre Sulfatado. Variabilidade De Flotação LCT: Report prepared by Gerência Geral de Desenvolvimento e Tecnologia (GGDT), for Companhia Vale do Rio Doce, 29 August 2004.
Golder Associates, 2010: Salobo Copper Gold External Resource and Reserves Audit 2011: report prepared for Vale.
Groves, D.I., Bierlein, F.P., Meinert, L.D. and Hitzman, M.W., 2010: Iron Oxide Copper-Gold (IOCG) Deposits through Earth History: Implications for Origin, Lithospheric Setting, and Distinction from Other Epigenetic Iron Oxide Deposits: Economic Geology, Vol 105, pp. 641–654.
Hitzman, M.W. and Valenta, R.K., 2005: Uranium in Iron Oxide-Copper-Gold (IOCG) Systems: Economic Geology, Vol 100, pp. 1657–1661.
Lagodourado.com, date unknown: Summary of Brazilian Mining Legislation: accessed 30 June, 2015: godourado.com/pdfs/articles/Summary_of_Brazilian_Mining_Legislation.pdf
Lindenmayer, Z.G., 1990: Salobo Sequence, Carajas, Brazil: Geology, Geochemistry and Metamorphism: Digitized Theses Paper 1950, Scholarship@Western, accessed 30 June, 2015.
Matos da Costa, M.A., 2012: Proveniência Dos Arenitos da Formação Águas Claras, Província Mineral de Carajás, Se do Cráton Amazônico: M.Sc. Thesis, Instituto de Geociência, Universidade Federal do Pará.
Mesquita, C.E. and Barbey, P., 2000: Significance of Garnet-Bearing Metamorphic Rocks in the Archean Supracrustal Series of the Carajás Mining Province, Northern Brazil: Revista Brasileira de Geociências, Vol 30, pp. 367–370.
Monteiro, L.V., Xavier, R.P., de Carvalho, E.R., Hitzman, M.W., Johnson, C.A., de Souza Filho, C.R., and Torresi, I., 2007: Spatial and Temporal Zoning of Hydrothermal Alteration and Mineralization in the Sossego Iron Oxide–Copper–
| March 2016 | Page 27-2 | |
| Project Number:179678 |
|
Salobo Operations Para State, Brazil NI 43-101 Technical Report |
Gold Deposit, Carajás Mineral Province, Brazil: Paragenesis and Stable Isotope Constraints: Mineralum Deposita Vol. 43, pp. 129–159.
Monteiro, L.V., Moreto, C.P., Pestilho, A.L., Juliani, C., Xavier, R.P. and Fallick, A.E., 2011: Evolution of Iron Oxide-Copper-Gold Deposits from the Southern Copper Belt, Carajás Mineral Province, Brazil: Geophysical Research Abstracts, Vol. 13.
Moreto, C.P., Monteiro, L.V., Xavier, R.P., Creaser, R.A., DuFrane, S.A., Melo, G.H., Delinardo da Silva, M.A., Tassinari, C.C. and Sato, K., 2014: Timing of Multiple Hydrothermal Events in the Iron Oxide–Copper–Gold Deposits of the Southern Copper Belt, Carajas Province, Brazil: Minera Deposita, Vol 50, pp. 517–546.
Moreto, C.P., Monteiro, L.V., Xavier, R.P., Creaser, R.A., DuFrane, S.A., Tassinari, C.C. and Sato, K., Kemp, A.I., and Amaral, W.S., 2015: Neoarchean and Paleoproterozoic Iron Oxide-Copper-Gold Events at the Sossego Deposit, Carajás Province, Brazil: Re-Os and U-Pb Geochronological Evidence: Economic Geology, vol. 110 pp. 809–835.
Micon International Limited, 2013: Technical Report on the Mineral Reserves and Mineral Resources of the Salobo Copper-Gold Mine Carajas, Pará State, Brazil: technical report prepared by Micon for Silver Wheaton Corp., effective date 31 December, 2012.
NCL Brasil, 2006: Estudio para Ingenieria Basica - Proyecto Salobo - Selección y calculo de equipos: report prepared for CVRD.
Pincock, Allen and Holt, 2007: Salobo Copper Gold Project, Full Due Diligence Audit, Para State, Brazil: report prepared for CVRD, 9 March, 2007.
PKF International Limited, 2014: Brazil Tax Guide, 2014: http://www.pkf.com/publications/tax-guides/brazil-tax-guide-2014
PwC, 2013: Doing Business and Investing in Brazil: accessed 30 June, 2015: https://www.pwc.de/de/internationale-maerkte/assets/doing-business-and-investing-in-brazil.pdf.
Requia, K., and Fonbote, L., 1999: Hydrothermal Alkali Metasomatism in the Salobo Iron Oxide Cu (-Au) Deposit, Carajás Mineral Province, Northern Brazil: in Mineral Deposits: Processes to Processing, ed. C.J. Stanley et al.: Balkema, Amsterdam, pp. 1025–1028.
Requia, K, Stein, H., Fontbote, L., and Chiaradia, M., 2003: Re-Os and Pb-Pb Geochronology of the Archean Salobo Iron Oxide Copper-Gold Deposit, Carajas Mineral Province, Northern Brazil: Springer Verlag, Mineralum Deposita, Vol 38, pp.727–738.
| March 2016 | Page 27-3 | |
| Project Number:179678 |
|
Salobo Operations Para State, Brazil NI 43-101 Technical Report |
Reuwsaat, J.D.V., Ribeiro, C., and de Paula, W.F., 2014: Vale Base Metals, South Atlantic Salobo Operations, Carajás Mining District, Pará State, Brazil, Mineral Resource and Mineral Reserve Estimate, 2014 Technical Report: internal Vale report, 31 December, 2014.
Richards, J.P. and Mumin, A.H., 2013: Magmatic-Hydrothermal Processes within an Evolving Earth: Iron Oxide-Copper-Gold and Porphyry Cu ± Mo ± Au Deposits: Geology, Vol. 41 No. 7, pp.767–770.
Snowden, 2009: Salobo Copper Gold External Resource Audit 2009: report prepared for CVRD.
Souza, L.H., and Viera, E.A.P., 2000: Salobo 3 Alpha deposit: Geology and mineralization: in Hydrothermal iron oxide copper-gold and related deposits: A global perspective: ed T.M. Porter, Australian Mineral Foundation, pp. 213–224.
Stacey Mining Geotechnical Ltd., 2009: Mining Geotechnical Review, report prepared for Vale, document DIOC LR 01-09.
Tassinari, C.C., Mellito, K.M. and Babinski, M. 2003: Age And Origin Of The Cu (Au-Mo-Ag) Salobo 3A Ore Deposit, Carajás Mineral Province, Amazonian Craton, Northern Brazil: Episodes, Vol 26(1), pp. 2–9.
Tavares, A., Couto, D., Hilario, F., 2014: Estudos de processo para aproveitamento do mineria de transicao do Salobo: report prepared by Tecnologia Exploracao de Projetos Minerais; Vale, 10 September, 2014.
U.I. Minerals, 2004: Consolidation of Data On Variability Rougher Campaign Locked-Cycle-Tests, Mini-Pilot-Plant, 1994 Pilot Plant Campaign, and Proposed Process Criteria For Salobo Flotation Plant: internal report prepared by U.I. Minerals, revision 2, February 2004.
Vale, 2009a: Mina do Salobo – Plano de Pré-Produção e Primeiro Ano de Produção 2009–2012. rev. 01: internal Vale document.
Vale, 2009b: Desenho de Fases e Plano Plurianual de Produção – 24 Mtpa, Relatório Técnico 2009. rev. 01: internal Vale document.
Vale, 2013: Analyst and Investor Tour, 2013: PowerPoint presentation posted to Vale website, accessed 30 June, 2015.
Vale, 2014a: Vale Base Metals Guidelines and Standards for Mineral Resource Mineral Reserve Reporting: internal Vale document prepared by the Resource Management Group, revised 21 March, 2014.
Vale, 2014b: Salobo Copper / Gold Operations: PowerPoint presentation posted to Vale website, accessed 30 June, 2015.
Vale, 2015a: various internal Excel spreadsheet files:
| March 2016 | Page 27-4 | |
| Project Number:179678 |
|
Salobo Operations Para State, Brazil NI 43-101 Technical Report |
Vale 2015b: various internal pdf files: “Flotacao Minero Misto e de Transicao Salobo”; “Flotacao Sulfetado, Misto e Blends”;
Vale, 2015c: various internal PowerPoint files: “2015 Salobo Metallurgy Evaluation (20150430)”; “Book Performance 2012-Apr15”; “Total – General Presentation”; “2014 QAQC’s Amostras Salobo”; “2015 QAQC Presentation”.
Veiga, L., and Magrini, A., 2013: The Brazilian Water Resources Management Policy: Fifteen Years of Success and Challenges: Water Resources Management Vol 27, pp. 2287–2302.
Williams, P.J., Barton, M.D. Johnson, D.A., Fontbote, L., de Haller, A., Mark, G., Oliver, N.H., and Marschik, R., 2003: Iron Oxide Copper Gold Deposits: Geology, Space-Time Distribution and Possible Modes of Origin: Economic Geology 100th Anniversary Volume, pp. 371–405.
| March 2016 | Page 27-5 | |
| Project Number:179678 |
Serious News for Serious Traders! Try StreetInsider.com Premium Free!
You May Also Be Interested In
- Diana Shipping Inc. Announces Time Charter Contract for m/v P. S. Palios
- First Quarter In The Bag: A Look At All The Milestones 1847 Holdings Hit So Far This Year
- Cordless Power Tools Market to Reach USD 40.73 Billion by 2031 Driven by Advancements in Li-ion Batteries.
Create E-mail Alert Related Categories
SEC FilingsSign up for StreetInsider Free!
Receive full access to all new and archived articles, unlimited portfolio tracking, e-mail alerts, custom newswires and RSS feeds - and more!
