

Form 6-K NORDIC AMERICAN TANKERS For: Nov 30
 Tweet
Tweet Share
ShareUNITED STATES
SECURITIES AND EXCHANGE COMMISSION
Washington, D.C. 20549
| � |
FORM 6-K
| � |
REPORT OF FOREIGN PRIVATE ISSUER
PURSUANT TO RULE 13A-16 OR 15D-16 OF
THE SECURITIES EXCHANGE ACT OF 1934
For the month of November 2014
Commission File Number: 001-13944
| � |
NORDIC AMERICAN TANKERS LIMITED
(Translation of registrant's name into English)
| � |
LOM Building, 27 Reid Street, Hamilton, HM 11, Bermuda
(Address of principal executive office)
| � |
Indicate by check mark whether the registrant files or will file annual reports under cover of Form 20-F or Form 40-F.
Form 20-F x�����������Form 40-F��o
Indicate by check mark if the registrant is submitting the Form 6-K in paper as permitted by Regulation S-T Rule 101(b)(1): �o
Note: Regulation S-T Rule 101(b) (1)�only permits the submission in paper of a Form 6-K if submitted solely to provide an attached annual report to security holders.
Indicate by check mark if the registrant is submitting the Form 6-K in paper as permitted by Regulation S-T Rule 101(b)(7):� o.
Note: Regulation S-T Rule 101(b)(7) only permits the submission in paper of a Form 6-K if submitted to furnish a report or other document that the registrant foreign private issuer must furnish and make public under the laws of the jurisdiction in which the registrant is incorporated, domiciled or legally organized (the registrant's "home country"), or under the rules of the home country exchange on which the registrant's securities are traded, as long as the report or other document is not a press release, is not required to be and has not been distributed to the registrant's security holders, and, if discussing a material event, has already been the subject of a Form 6-K submission or other Commission filing on EDGAR.
�
�
�
INFORMATION CONTAINED IN THIS FORM 6-K REPORT
Attached to this Report on Form 6-K as Exhibit 1 is a copy of the press release of Nordic American Tankers Ltd. (the "Company") dated November 10, 2014 containing the Company's earnings report for the third quarter of 2014.
This Report on Form 6-K is hereby incorporated by reference into the Company's Registration Statement on Form F-3 (Registration No. 333-187400), declared effective on November 6, 2013.
SIGNATURES
Pursuant to the requirements of the Securities Exchange Act of 1934, the registrant has duly caused this report to be signed on its behalf by the undersigned, thereunto duly authorized.
�
| � | � | � | � | � | � | � |
| � |
�
|
� |
�
|
NORDIC AMERICAN TANKERS LIMITED
|
||
| � |
�
|
� |
�
|
(registrant)
|
||
| � | � | � | � | |||
|
Dated:�November 18, 2014
|
�
|
� |
�
|
By:
|
�
|
/s/����Herbj�rn Hansson��������
|
| � |
�
|
� |
�
|
� |
�
|
Herbj�rn Hansson
|
| � |
�
|
� |
�
|
� |
�
|
Chairman, Chief Executive Officer and President
|
Exhibit 1

Nordic American Tankers Limited (NYSE: NAT) 3Q2014 Report� Cash dividend of $0.14 per share. Sound operational performance for a top quality Suezmax fleet.
Hamilton, Bermuda, November 10, 2014
Rates improved in 3Q2014 compared with the preceding quarter and the same quarter last year. This is a reflection of improving fundamentals driven by increased tanker demand and flat supply. During 3Q2014 we had cashflow from operations1 of $21.7m, compared with $4.3m in 2Q2014, and $2.5m in 3Q2013.
On October 7, 2014, NAT declared a cash dividend of $0.14 per share payable to shareholders of record as of October 22, 2014. The dividend was paid November 5, 2014.� Since NAT commenced operations in the fall of 1997, the Company has paid a dividend 69 times, with total dividend payments over the period amounting to $45.16 per share, including the dividend paid in November 2014.
In June 2014 the startup company Nordic American Offshore Ltd. (NAO) completed a successful public offering of shares and was listed on the NYSE. NAT participated in the $100m NAO IPO with $5.6m. Following the share distribution of NAO shares to NAT shareholders, NAT owns about 17.1% of NAO. NAT has received a total of $5.7m in dividends from NAO in 2014 including the NAO dividend to be paid on November 21, 2014. Our investment in NAO has a positive impact on NAT in terms of both accounting and cash.
Key points to consider:
|
�
|
Tanker rates achieved on average for 3Q2014 were $21,000 per day per vessel for our trading fleet, as against $12,100 per day achieved in 2Q2014.
|
|
�
|
Earnings per share in 3Q2014 were $0.01, compared with -$0.19 in 2Q2014, and -$0.29 for 3Q2013.
|
|
�
|
The undrawn part of our credit facility plus net working capital stood at about $329m at the end of 3Q2014.
|
|
�
|
NAT will receive a dividend of about $1.8m from its investment in NAO on November 21.
|
|
�
|
The Company took delivery of the acquisitions Nordic Sprinter and Nordic Skier in July and August, increasing the fleet to 22 vessels.
|
|
�
|
We continue to focus on cost efficiency - both in administration and onboard our vessels.
|
|
�
|
16 vessels were vetted (inspected by customers) during 3Q2014. NAT came out with 3.7 observations on average per inspection, an excellent result reflecting the quality of our fleet.
|
Nordic American Tankers is very different from other tanker companies
Nordic American Tankers has an operating model that is sustainable in both a weak and a strong tanker market. Accretive fleet growth and quarterly dividend payments are central elements� of the strategy. NAT has one type of vessel the Suezmax vessel that can carry one million barrels of oil.� A homogenous fleet reduces our costs, which helps to keep our cash-breakeven down at about $12,000 per day per vessel, which is considered low for the industry.� Net asset value (NAV) is a measure that is linked to the steel value of each individual ship, and has no relevance when it comes to valuation of NAT as an ongoing business. The key for the Company is to generate returns for its shareholders.
�
1 of 9
Financial Information
The Company declared a cash dividend of $0.14 on October 7, 2014, which was paid November 5, 2014 to shareholders of record as of October 22, 2014. The number of NAT shares outstanding at the time of this report is 89,182,001.
We believe that Nordic American Offshore will strengthen Nordic American Tankers. We see cost synergies for both NAT and NAO, in particular as regards general and administrative costs. The G&A costs of NAT benefit from resource sharing with NAO. Further growth should result in lower costs on a per vessel basis.
Our shareholding in NAO has been booked as a capital asset. The dividend from the shareholding is credited to the profit and loss account.
Earnings per share in 3Q2014 were $0.01, compared with -$0.19 in 2Q2014, and -$0.29 for 3Q2013.
The Company's operating cash flow in 3Q2014 was $21.7m, compared with $4.3m in 2Q2014, and $2.5m in 3Q2013.
On August 12, 2014, NAT distributed about $14m worth of stock in NAO to shareholders of NAT, thereby increasing the number of shareholders in NAO to about 35,000.
We are pleased to observe that operating costs for the vessels have decreased following our focus on cost efficiency.
One vessel is expected to enter drydock in 4Q2014 slightly ahead of schedule in order to optimising the trading pattern.
As a matter of policy, NAT has always kept a strong balance sheet with low net debt and a focus on limiting the Company's financial risk.� This policy will continue. At the end of 3Q2014 the Company had net debt of $105m or $4.8m per vessel.
It is a prerequisite for any expansion of the fleet that our dividend and earnings capacity per share increase following such a transaction.
Our primary objective is to enhance total return2 for our shareholders, including maximizing our quarterly dividend.
The Company has in place a non-amortizing credit facility of $430m maturing in November 2017, of which $250m has been drawn. Cash on hand is about $89m. Net working capital and undrawn amounts of the credit facility amount to $329m.
For further details on our financial position for 3Q2014, 2Q2014 and 3Q2013, please see later in this release.
2 of 9
The Fleet
Earlier this year the Company agreed to buy two secondhand vessels. The vessels were delivered to us July 16, 2014 and August 4, 2014. Now the Company has a fleet of 22 vessels.� By way of comparison, in the autumn of 2004, the Company had three vessels. Our vessels are in excellent technical condition.� In the arbitration involving the Suezmax vessel Gulf Scandic (now named Nordic Harrier) NAT was awarded $10.2m. Gulf Navigation Holding PJSC (GulfNav) was the other party in the arbitration. At this time, the claim has not been paid to us. We are working to collect the award.
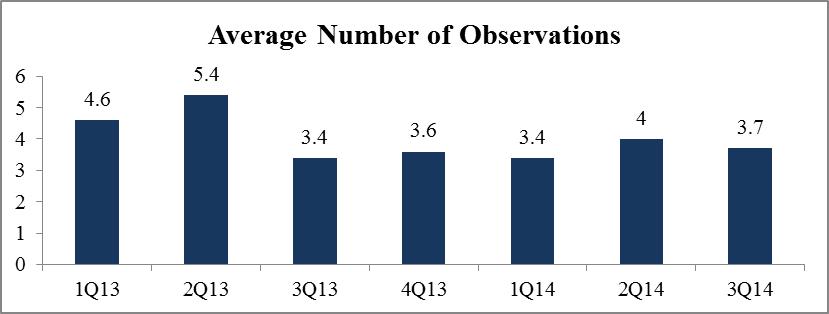
Sound Operational Performance and a Top Quality Fleet
NAT is focused on maintaining the technical quality of the fleet, and our operational performance remains at the forefront of the industry. The chart above shows the development in observations per inspection for the year. 3Q2014 inspections had an average of 3.7 observations which is an excellent result. NAT's performance can be considered industry best practice.
World Economy and the Tanker Market
The development of the world economy affects the tanker industry. Seaborne imports of crude oil into the US have decreased over the recent past. �Going forward, shale oil and tar sand oil projects are expected to affect the US and Canadian oil sector. These projects are vulnerable to reduced oil prices as we see at the time of this report. In terms of transportation work (ton miles), the reduced imports to the US are more than outweighed by the increased imports to the Far East. European economies continue to run significant fiscal deficits. The economies of the Far East generally show continuing growth, although at a slower pace than before.
Tanker market rates are also affected by newbuildings that enter the markets, increasing the supply of vessels. Scrapping impacts supply in the other direction.�
The Suezmax fleet (excl. shuttle tankers) counts 445 vessels at the end of 3Q2014, meaning the fleet has decreased this year.
Following a number of orders made in recent months, the current orderbook stands at 54 vessels from now to mid-2017. This represents about 12% of the Suezmax fleet.�In 2009, the orderbook was over 50% of the existing fleet. At the time of this report, the orderbook for the remainder of 2014 counts nine Suezmax vessels. However, we expect the real number of deliveries for the rest of this year to be lower. Five Suezmax vessels were delivered in the first nine months of 2014.
�
So far this year five vessels have been scrapped. In 2013 six Suezmaxes were scrapped compared to 21 in 2012 and eight during the year 2011.
1�Operating cash flow�is a non-GAAP number. Please see later in this announcement for a reconciliation of operating cash flow to income from vessel operations.
2�Total Return is defined as stock price plus dividends, assuming dividends are reinvested in the stock
3 of 9
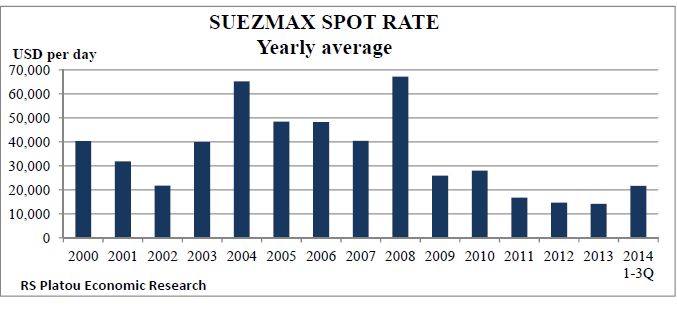
The graph below shows the average yearly spot rates since 2000 as reported by R.S. Platou Economic Research a.s. The daily rates as reported by shipbrokers and by Imarex may vary significantly from the actual rates we achieve in the market, but these rates are in general an indication of the level of the market and its direction.
�
�
�
�
In the recent past bunker prices have fallen by 25% to 30%, impacting our results positively.
Corporate Governance/Conflict of Interests�
It is vital for NAT to ensure that there is no conflict of interests among shareholders, management, affiliates and related parties.� Interests must be aligned.� We will work to ensure that transactions with affiliates and/or related parties are transparent.
Strategy going forward
Our objective is to have a strategy that is flexible and has benefits in both a strong tanker market and a weak one.� When the market improves, higher earnings and dividends can be expected.��If rates do remain low, the Company is in a position to buy secondhand vessels or newbuildings, which are inexpensive by historical standards. Therefore, the Company is able to improve its relative position in a weak market and will be able to reap the benefits of stronger markets thereafter. Over the recent past the Company has improved its relative position. In an opportunistic way NAT is now assessing investments that further builds up the position of the Company.
�
After an acquisition of vessels or other forms of expansion, the Company should be able to pay a higher dividend per share and produce higher earnings per share than had such an acquisition not taken place.
�
Our dividend policy will continue to enable us to achieve a competitive, risk adjusted cash yield over time compared with that of other tanker companies.
�
NAT is firmly committed to protecting its underlying earnings and dividend potential.
�
Our Company is well positioned in this marketplace. We shall endeavor to safeguard and further strengthen this position for our shareholders in a deliberate, predictable and transparent way.
�
We encourage prospective investors interested in the crude tanker sector to consider buying shares in NAT. �
* * * * *
4 of 9
�
�
�
|
NORDIC AMERICAN TANKERS LIMITED
|
� | � | � | � | � | � | � | � | � | |||||||||||
| � | � | � | � | � | � | � | � | � | � | � | ||||||||||
|
CONSOLIDATED CONDENSED STATEMENTS OF OPERATION
|
� | � | � | � | � | � | � | |||||||||||||
| � | � |
Three Months Ended
|
� | � |
Nine Months Ended
|
� | ||||||||||||||
| � | � |
Sep. 30, 2014 (unaudited)
|
� | � |
Jun. 30, 2014 (unaudited)
|
� | � |
Sep. 30, 2013 (unaudited)
|
� | � |
Sep 30, 2014 (unaudited)
|
� | � |
Sep 30, 2013 (unaudited)
|
� | |||||
|
Amounts in USD '000
|
� | � | � | � | � | � | � | � | � | � | ||||||||||
| � | � | � | � | � | � | � | � | � | � | � | ||||||||||
|
Net Voyage Revenue
|
� | � |
40,908
|
� | � | � |
22,618
|
� | � | � |
22,512
|
� | � | � |
108,546
|
� | � | � |
49,807
|
� |
| � | � | � | � | � | � | � | � | � | � | � | � | � | � | � | � | � | � | � | � | � |
|
Vessel Operating Expenses
|
� | � |
(16,011
|
)
|
� | � |
(15,342
|
)
|
� | � |
(16,869
|
)
|
� | � |
(46,372
|
)
|
� | � |
(49,818
|
)
|
|
General and Administrative Expenses
|
� | � |
(3,220
|
)*
|
� | � |
(3,220
|
)*
|
� | � |
(3,877
|
)*
|
� | � |
(10,350
|
)**
|
� | � |
(14,811
|
)**
|
|
Depreciation Expenses
|
� | � |
(20,514
|
)
|
� | � |
(19,710
|
)
|
� | � |
(18,464
|
)
|
� | � |
(59,916
|
)
|
� | � |
(55,096
|
)
|
|
Settlement Loss
|
� | � |
0
|
� | � | � |
0
|
� | � | � |
0
|
� | � | � |
0
|
� | � | � |
(5,000
|
)
|
|
Operating Expenses
|
� | � |
(39,746
|
)
|
� | � |
(38,273
|
)
|
� | � |
(39,210
|
)
|
� | � |
(116,638
|
)
|
� | � |
(124,726
|
)
|
|
Net Operating Gain (Loss)
|
� | � |
1,162
|
� | � | � |
(15,654
|
)
|
� | � |
(16,698
|
)
|
� | � |
(8,093
|
)
|
� | � |
(74,919
|
)
|
| � | � | � | � | � | � | � | � | � | � | � | � | � | � | � | � | � | � | � | � | � |
|
Interest Income
|
� | � |
51
|
� | � | � |
67
|
� | � | � |
35
|
� | � | � |
137
|
� | � | � |
118
|
� |
|
Interest Expense
|
� | � |
(3,250
|
)
|
� | � |
(3,220
|
)
|
� | � |
(2,717
|
)
|
� | � |
(9,668
|
)
|
� | � |
(8,351
|
)
|
|
Other Financial Income (Expense)
|
� | � |
3,317
|
� | � | � |
2,272
|
� | � | � |
139
|
� | � | � |
6,359
|
� | � | � |
(178
|
)
|
|
Total Other Expenses
|
� | � |
118
|
� | � | � |
(881
|
)
|
� | � |
(2,543
|
)
|
� | � |
(3,172
|
)
|
� | � |
(8,410
|
)
|
|
Net Gain (Loss)
|
� | � |
1,281
|
� | � | � |
(16,535
|
)
|
� | � |
(19,241
|
)
|
� | � |
(11,264
|
)
|
� | � |
(83,329
|
)
|
|
Basic Gain (Loss) per Share
|
� | � |
0.01
|
� | � | � |
-0.19
|
� | � | � |
-0.29
|
� | � | � |
(0.13
|
)
|
� | � |
(1.34
|
)
|
|
Basic Weighted Average Number of Common Shares Outstanding
|
� | � |
89,182,001
|
� | � | � |
87,665,517
|
� | � | � |
66,038,251
|
� | � | � |
84,127,056
|
� | � | � |
62,114,566
|
� |
|
Common Shares Outstanding
|
� | � |
89,182,001
|
� | � | � |
89,182,001
|
� | � | � |
66,038,251
|
� | � | � |
89,182,001
|
� | � | � |
66,038,251
|
� |
�
| *) | The G&A for the three months ended September 30, 2014, June 30, 2014 and September 30, 2013 include non-cash charges of $0.1m $0.3m and $0.7m respectively which are charges related to share based compensation and pension cost. |
| **) | The G&A for the nine months ended September 30, 2014 and September 30, 2013 include non-cash charges of $1.4m and $0.7m which are charges related to share based compensation and pension cost. Additionally, the G&A for the nine months ended September 30, 2013 includes non-recurring items of $3.6m related to the acquisition of Scandic American Shipping Ltd. |
�
�
�
|
CONSOLIDATED CONDENSED BALANCE SHEET
|
� |
�
|
� | � |
�
|
� | � |
�
|
� | |||
|
Amounts in USD '000
|
� |
Sep 30, 2014 (unaudited)
|
� | � |
Sep 30, 2013 (unaudited)
|
� | � |
Dec. 31, 2013
|
� | |||
| � | � | � | � | � | � | � | ||||||
|
Cash and Cash Equivalents
|
� | � |
89,258
|
� | � | � |
90,471
|
� | � | � |
65,675
|
� |
|
Accounts Receivable, net
|
� | � |
17,316
|
� | � | � |
11,482
|
� | � | � |
18,801
|
� |
|
Prepaid Expenses
|
� | � |
3,340
|
� | � | � |
3,390
|
� | � | � |
5,436
|
� |
|
Inventory
|
� | � |
30,617
|
� | � | � |
31,123
|
� | � | � |
24,281
|
� |
|
Voyages in Progress
|
� | � |
24,923
|
� | � | � |
10,990
|
� | � | � |
14,953
|
� |
|
Other Current Assets
|
� | � |
2,133
|
� | � | � |
3,533
|
� | � | � |
2,251
|
� |
|
Total current assets
|
� | � |
167,588
|
� | � | � |
150,989
|
� | � | � |
131,396
|
� |
|
Vessels, Net
|
� | � |
928,415
|
� | � | � |
926,832
|
� | � | � |
911,429
|
� |
|
Goodwill
|
� | � |
18,979
|
� | � | � |
18,979
|
� | � | � |
18,979
|
� |
|
Investment in Nordic American Offshore Ltd.
|
� | � |
59,226
|
� | � | � |
0
|
� | � | � |
64,128
|
� |
|
Other Non-current Assets
|
� | � |
10,093
|
� | � | � |
9,985
|
� | � | � |
10,504
|
� |
|
Total non-current assets
|
� | � |
1,016,714
|
� | � | � |
955,797
|
� | � | � |
1,005,040
|
� |
|
Total Assets
|
� | � |
1,184,303
|
� | � | � |
1,106,786
|
� | � | � |
1,136,437
|
� |
| � | � | � | � | � | � | � | � | � | � | � | � | � |
|
Accounts Payable
|
� | � |
8,358
|
� | � | � |
5,282
|
� | � | � |
6,447
|
� |
|
Accrued Voyage Expenses
|
� | � |
3,576
|
� | � | � |
11,444
|
� | � | � |
6,249
|
� |
|
Other Current Liabilities
|
� | � |
6,413
|
� | � | � |
10,779
|
� | � | � |
6,604
|
� |
|
Total Current liabilities
|
� | � |
18,347
|
� | � | � |
27,505
|
� | � | � |
19,300
|
� |
|
Long-term Debt
|
� | � |
250,000
|
� | � | � |
250,000
|
� | � | � |
250,000
|
� |
|
Deferred Compensation Liability
|
� | � |
12,473
|
� | � | � |
11,408
|
� | � | � |
12,154
|
� |
|
Total Non-current Liabilities
|
� | � |
262,473
|
� | � | � |
261,408
|
� | � | � |
262,154
|
� |
|
Shareholders' Equity
|
� | � |
903,482
|
� | � | � |
817,873
|
� | � | � |
854,983
|
� |
|
Total Liabilities and Shareholders' Equity
|
� | � |
1,184,303
|
� | � | � |
1,106,786
|
� | � | � |
1,136,437
|
� |
�
�
�
�
5 of 9
�
�
�
�
|
NORDIC AMERICAN TANKERS LIMITED
|
� | � | � | � | � | � | ||||||
| � | � | � | � | � | � | � | ||||||
|
�
CONSOLIDATED CONDENSED STATEMENTS OF CASH FLOW
|
� |
Nine months ended
|
� | � |
Twelve
|
� | ||||||
| � | � | � | � | � | � |
Months ended
|
� | |||||
| � | � |
Sep. 30, 2014
|
� | � |
Sep. 30, 2013
|
� | � |
Dec. 31, 2013
|
� | |||
|
Amounts in USD '000
|
� |
(unaudited)
|
� | � |
(unaudited)
|
� | � | � | ||||
| � | � | � | � | � | � | � | ||||||
|
Net Cash Provided by (Used in) Operating Activities
|
� | � |
29,641
|
� | � | � |
(29,012
|
)
|
� | � |
(47,266
|
)
|
| � | � | � | � | � | � | � | � | � | � | � | � | � |
|
Proceeds from Sale of Marketable Securities
|
� | � |
0
|
� | � | � |
600
|
� | � | � |
600
|
� |
|
Investment in Vessels
|
� | � |
(73,747
|
)
|
� | � |
(6,817
|
)
|
� | � |
(6,983
|
)
|
|
Repayment of Deposit
|
� | � |
0
|
� | � | � |
5,475
|
� | � | � |
5,475
|
� |
|
Investment in Nordic American Offshore Ltd
|
� | � |
(5,640
|
)
|
� | � |
0
|
� | � | � |
(65,004
|
)
|
|
Investment in Orion Tankers Ltd.
|
� | � |
0
|
� | � | � |
(271
|
)
|
� | � |
(271
|
)
|
|
Cash arising from obtaining control of Orion Tankers Ltd
|
� | � |
0
|
� | � | � |
6,544
|
� | � | � |
6,544
|
� |
|
Investment in Scandic American Shipping Ltd.
|
� | � |
0
|
� | � | � |
(7,641
|
)
|
� | � |
(7,641
|
)
|
|
Investment in Scandic Assets Held for Sale
|
� | � |
0
|
� | � | � |
(5,467
|
)
|
� | � |
(5,467
|
)
|
|
Proceeds from Sale of Scandic Assets held for Sale
|
� | � |
0
|
� | � | � |
5,467
|
� | � | � |
5,467
|
� |
|
Transfer to restricted account
|
� | � |
0
|
� | � | � |
(5,000
|
)
|
� | � |
(5,000
|
)
|
|
Other
|
� | � |
(325
|
)
|
� | � |
(790
|
)
|
� | � |
(973
|
)
|
|
Return on investments
|
� | � |
3,993
|
� | � | � |
0
|
� | � | � |
0
|
� |
|
Net Cash Provided by (Used in) Investing Activities
|
� | � |
(75,719
|
)
|
� | � |
(7,900
|
)
|
� | � |
(73,253
|
)
|
| � | � | � | � | � | � | � | � | � | � | � | � | � |
|
Net Proceeds from Issuance of Common Stock
|
� | � |
113,433
|
� | � | � |
101,831
|
� | � | � |
172,611
|
� |
|
Proceeds from Use of Credit Facility
|
� | � |
0
|
� | � | � |
0
|
� | � | � |
0
|
� |
|
Cash Dividends Paid to Shareholders, 1st and 2nd Quarter
|
� | � |
(43,713
|
)
|
� | � |
(29,893
|
)
|
� | � |
(41,756
|
)
|
|
Net Cash Provided by (Used in) Financing Activities
|
� | � |
69,720
|
� | � | � |
71,938
|
� | � | � |
130,855
|
� |
| � | � | � | � | � | � | � | � | � | � | � | � | � |
|
Net Increase (Decrease) in Cash and Cash Equivalents
|
� | � |
23,642
|
� | � | � |
35,026
|
� | � | � |
10,336
|
� |
|
Effect of exchange rate changes on Cash
|
� | � |
(58
|
)
|
� | � |
(66
|
)
|
� | � |
(172
|
)
|
|
Cash and Cash Equivalents at Beginning of Period
|
� | � |
65,675
|
� | � | � |
55,511
|
� | � | � |
55,511
|
� |
|
Cash and Cash Equivalents at End of Period
|
� | � |
89,258
|
� | � | � |
90,471
|
� | � | � |
65,675
|
� |
�
�
�
6 of 9
�
�
|
NORDIC AMERICAN TANKERS LIMITED
|
� | � | � | � | � | � | � | � | � | |||||||||||
| � | � | � | � | �� | � | � | � | � | � | |||||||||||
|
RECONCILIATION OF NON-GAAP FINANCIAL MEASURES
|
� |
Three Months Ended��
|
� | � |
Nine Months ended
|
� | ||||||||||||||
|
Amounts in USD '000
|
� |
Sep 30, 2014
(unaudited)
|
� | � |
Jun 30, 2014
(unaudited)
|
� | � |
Sep 30, 2013
(unaudited)
|
� | � |
Sep. 30, 2014
(unaudited)
|
� | � |
Sep. 30, 2013
�(unaudited)
|
� | |||||
|
Voyage Revenue
|
� | � |
94,946
|
� | � | � |
66,134
|
� | � | � |
63,126
|
� | � | � |
255,758
|
� | � | � |
178,229
|
� |
|
Voyage Expense
|
� | � |
(54,037
|
)
|
� | � |
(43,516
|
)
|
� | � |
(40,614
|
)
|
� | � |
(147,212
|
)
|
� | � |
(128,422
|
)
|
|
Net Voyage Revenue (1)
|
� | � |
40,908
|
� | � | � |
22,618
|
� | � | � |
22,512
|
� | � | � |
108,546
|
� | � | � |
49,807
|
� |
| � | � | � | � | � | � | � | � | � | � | � | � | � | � | � | � | � | � | � | � | � |
�
�
�
| � | � |
Three Months Ended��
|
� | � |
Twelve Months ended
|
� | ||||||||||
| � | � |
Sep 30, 2014
(unaudited)
|
� | � |
Jun 30, 2014
(unaudited)
|
� | � |
Sep 30, 2013
(unaudited)
|
� | � |
Dec 31, 2013
|
� | ||||
|
Net Operating Gain (Loss)
|
� | � |
1,162
|
� | � | � |
(15,654
|
)
|
� | � |
(16,698
|
)
|
� | � |
(93,608
|
)
|
|
Depreciation Expense
|
� | � |
20,514
|
� | � | � |
19,710
|
� | � | � |
18,464
|
� | � | � |
74,375
|
� |
|
Settlement Loss
|
� | � |
0
|
� | � | � |
0
|
� | � | � |
0
|
� | � | � |
5,000
|
� |
|
Share Based Compensation and Pension Cost
|
� | � |
81
|
� | � | � |
286
|
� | � | � |
722
|
� | � | � |
3,116
|
� |
|
Operating Cash Flow (2)
|
� | � |
21,757
|
� | � | � |
4,342
|
� | � | � |
2,488
|
� | � | � |
(11,118
|
)
|
�
�
|
(1)
|
Net voyage revenues represents voyage revenues less voyage expenses such as bunker fuel, port fees, canal tolls and brokerage commissions. Net voyage revenues is included because certain investors use this data to measure a shipping company's financial performance. Net voyage revenues is not required by accounting principles generally accepted in the United States and should not be considered as an alternative to net income or any other indicator of the Company's performance required by accounting principles generally accepted in the United States.
�
|
|
(2)
|
Operating cash flow represents income from vessel operations before depreciation and non-cash administrative charges. Operating cash flow is included because certain investors use this data to measure a shipping company's financial performance. Operating cash flow is not required by accounting principles generally accepted in the United States and should not be considered as an alternative to net income or any other indicator of the Company's performance required by accounting principles generally accepted in the United States.
|
�
�
7 of 9
CAUTIONARY STATEMENT REGARDING FORWARD-LOOKING STATEMENTS
Matters discussed in this press release may constitute forward-looking statements. �The Private Securities Litigation Reform Act of 1995 provides safe harbor protections for forward-looking statements in order to encourage companies to provide prospective information about their business. Forward-looking statements include statements concerning plans, objectives, goals, strategies, future events or performance, and underlying assumptions and other statements, which are other than statements of historical facts.
The Company desires to take advantage of the safe harbor provisions of the Private Securities Litigation Reform Act of 1995 and is including this cautionary statement in connection with this safe harbor legislation. The words "believe," "anticipate," "intend," "estimate," "forecast," "project," "plan," "potential," "will," "may," "should," "expect," "pending" and similar expressions identify forward-looking statements.
The forward-looking statements in this press release are based upon various assumptions, many of which are based, in turn, upon further assumptions, including without limitation, our management's examination of historical operating trends, data contained in our records and other data available from third parties. �Although we believe that these assumptions were reasonable when made, because these assumptions are inherently subject to significant uncertainties and contingencies which are difficult or impossible to predict and are beyond our control, we cannot assure you that we will achieve or accomplish these expectations, beliefs or projections. �We undertake no obligation to update any forward-looking statement, whether as a result of new information, future events or otherwise.
Important factors that, in our view, could cause actual results to differ materially from those discussed in the forward-looking statements include the strength of world economies and currencies, general market conditions, including fluctuations in charter rates and vessel values, changes in demand in the tanker market, as a result of changes in OPEC's petroleum production levels and world wide oil consumption and storage, changes in our operating expenses, including bunker prices, drydocking and insurance costs, the market for our vessels, availability of financing and refinancing, changes in governmental rules and regulations or actions taken by regulatory authorities, potential liability from pending or future litigation, general domestic and international political conditions, potential disruption of shipping routes due to accidents or political events, vessels breakdowns and instances of off-hires and other important factors described from time to time in the reports filed by the Company with the Securities and Exchange Commission, including our Annual Report on Form 20-F, and our reports on Form 6-K.
For questions related to this message, please contact Nordic American Tankers Limited.:
Jacob Ellefsen,
Manager, Investor Relations and Research
Nordic American Tankers Limited
Tel: + 33�678 631�959 or + 377 93 25 89 07
Rolf Amundsen, Advisor,
Nordic American Tankers Limited
Nordic American Tankers Limited
Tel: +1 800 601 9079 or + 47 908 26�906
Turid M. S�rensen, CFO & EVP
Nordic American Tankers Limited
Tel: +47 33 42 73 00 or +47 90 57 29 27
Gary J. Wolfe
Seward & Kissel LLP, New York, USA
Tel: +1 212 574 1223
*� *� *� *� *� *� *� *� *� *� *� *� *� *� *� *� *� *� *� *� *� *� *� *� *� *� *� *� *� *� *� *� *� *� *� *� *
8 of 9
For questions related to the newly established separate company, Nordic American Offshore Ltd., please contact:
Tor-�yvind Bj�rkli, Chief Executive Officer
Nordic American Offshore Ltd.
Tel: +47 90 62 70 14 or +47 21 99 24 81
Herbj�rn Hansson, Executive Chairman
Nordic American Offshore Ltd.
Tel: +1 866 805 9504 or + 47 901 46 291
Jacob Ellefsen,
Manager, Investor Relations and Research
Nordic American Offshore Ltd.
Tel: + 33�678 631�959 or + 377 93 25 89 07
Gary J. Wolfe
Seward & Kissel LLP, New York, USA
Tel: +1 212 574 1223
�
�
�
9 of 9
Serious News for Serious Traders! Try StreetInsider.com Premium Free!
You May Also Be Interested In
- Irish Residential Properties Sub-Fund 1: Form 8.3 - Irish Residential Properties REIT PLC
- QPR Software Plc Interim report January–March 2024
- Groupama Assurances Mutuelles calls for redemption of its undated subordinated bond (FR0011896513)
Create E-mail Alert Related Categories
SEC FilingsSign up for StreetInsider Free!
Receive full access to all new and archived articles, unlimited portfolio tracking, e-mail alerts, custom newswires and RSS feeds - and more!
