

Form 6-K Itau Unibanco Holding For: May 05
 Tweet
Tweet Share
Share
SECURITIES AND EXCHANGE COMMISSION
Washington, D.C. 20549
FORM 6-K
Report of Foreign Issuer
Pursuant to Rule 13a-16 or 15d-16 of
the Securities Exchange Act of 1934
For the month of
May 2016
Commission File Number: 001-15276
Itaú Unibanco Holding S.A.
(Exact name of registrant as specified in its charter)
Itaú Unibanco Holding S.A.
(Translation of Registrant’s Name into English)
Praça Alfredo Egydio de Souza Aranha, 100-Torre Conceicao - CEP
04344-902 São Paulo, SP, Brazil
(Address of principal executive offices)
Indicate by check mark whether the registrant files or will file annual reports under cover Form 20-F or Form 40-F.
Form 20-F: x Form 40-F: ¨
Indicate by check mark if the registrant is submitting the Form 6-K in paper as permitted by Regulation S-T Rule 101(b)(1):
Yes: ¨ No: x
Indicate by check mark if the registrant is submitting the Form 6-K in paper as permitted by Regulation S-T Rule 101(b)(7):
Yes: ¨ No: x
Indicate by check mark whether by furnishing the information contained in this Form, the registrant is also thereby furnishing information to the Commission pursuant to Rule 12g3-2(b) under the Securities Exchange Act of 1934.
Yes: ¨ No: x
If
“Yes” is marked, indicate below the file number assigned to the registrant in connection with Rule 12g3-2(b):
82-___________________.
SIGNATURES
Pursuant to the requirements of the Securities Exchange Act of 1934, the registrant has duly caused this report to be signed on its behalf by the undersigned, thereunto duly authorized.
| Itaú Unibanco Holding S.A. | ||||
| (Registrant) | ||||
| Date: May 5, 2016 | By: | /s/ Marcelo Kopel | ||
| Name: | Marcelo Kopel | |||
| Title: | Investor Relations Officer | |||
| By: | /s/ Eduardo Mazzilli de Vassimon | |||
| Name: | Eduardo Mazzilli de Vassimon | |||
| Title: | Chief Financial Officer | |||
EXHIBIT INDEX
| 99.1 |
1st quarter of 2016 Management Discussion & Analysis |
Exhibit 99.1

(This page was intentionally left blank)
| Itaú Unibanco Holding S.A. | 04 |
| Management Discussion & Analysis | Executive Summary | |
Itaú Unibanco Holding S.A. (Itaú Unibanco) information and financial indicators are presented below.
Highlights
| In R$ millions (except where indicated), end of period | 1Q16 | 4Q15 | 1Q15 | |||||||||
| Results | ||||||||||||
| Recurring Net Income | 5,235 | 5,773 | 5,808 | |||||||||
| Net Income | 5,184 | 5,698 | 5,733 | |||||||||
| Operating Revenues (1) | 25,867 | 26,680 | 24,946 | |||||||||
| Managerial Financial Margin (2) | 16,557 | 16,764 | 15,963 | |||||||||
| Shares | ||||||||||||
| Recurring Net Income per share (R$) (3) | 0.88 | 0.97 | 0.97 | |||||||||
| Net Income per share (R$) (3) | 0.88 | 0.96 | 0.95 | |||||||||
| Number of Outstanding Shares at the end of period – in thousands (4) | 5,928,684 | 5,921,351 | 6,015,886 | |||||||||
| Average price of non-voting share on the last trading day of the period (R$) (4) | 31.27 | 26.30 | 32.03 | |||||||||
| Book Value per Share (R$) | 17.99 | 17.98 | 16.12 | |||||||||
| Dividends and Interest on Own Capital net of taxes (5) | 1,012 | 3,429 | 1,319 | |||||||||
| Dividends and Interest on Own Capital net of taxes (5) per share (R$) (*) | 0.17 | 0.58 | 0.22 | |||||||||
| Market Capitalization (6) | 185,390 | 155,732 | 192,672 | |||||||||
| Market Capitalization (6) (US$ millions) | 52,092 | 39,882 | 60,060 | |||||||||
| Performance | ||||||||||||
| Recurring Return on Average Equity – Annualized (7) | 19.9 | % | 22.3 | % | 24.5 | % | ||||||
| Return on Average Equity – Annualized (7) | 19.7 | % | 22.0 | % | 24.2 | % | ||||||
| Recurring Return on Average Assets – Annualized (8) | 1.6 | % | 1.7 | % | 1.9 | % | ||||||
| Return on Average Assets – Annualized (8) | 1.6 | % | 1.7 | % | 1.8 | % | ||||||
| Solvency Ratio - Prudential Conglomerate (BIS Ratio) | 17.7 | % | 17.8 | % | 15.3 | % | ||||||
| Common Equity Tier I | 14.3 | % | 14.0 | % | 11.6 | % | ||||||
| Estimated BIS III (Common Equity Tier I) - Full Implementation of BIS III (9) | 12.6 | % | 13.6 | % | 11.4 | % | ||||||
| Annualized Net Interest Margin of Spread-Sensitive Operations (10) | 11.1 | % | 11.0 | % | 10.6 | % | ||||||
| Annualized Net Interest Margin with Clients (10) | 10.9 | % | 10.9 | % | 10.5 | % | ||||||
| Annualized Net Interest Margin of Spread-Sensitive Operations after Provision for Credit Risk (10) | 5.5 | % | 7.1 | % | 6.7 | % | ||||||
| Annualized Net Interest Margin with Clients after Provision for Credit Risk (10) | 6.1 | % | 7.5 | % | 7.0 | % | ||||||
| Nonperforming Loans Index (NPL over 90 days) | 3.9 | % | 3.5 | % | 3.0 | % | ||||||
| Nonperforming Loans Index (NPL 15 to 90 days) | 3.1 | % | 2.6 | % | 2.9 | % | ||||||
| Coverage Ratio (Provision for Loan Losses/NPL over 90 days) | 210 | % | 208 | % | 200 | % | ||||||
| Efficiency Ratio (ER) (11) | 43.0 | % | 45.5 | % | 43.2 | % | ||||||
| Risk-Adjusted Efficiency Ratio (RAER) (11) | 69.9 | % | 64.5 | % | 62.7 | % | ||||||
| Balance Sheet | ||||||||||||
| Total Assets | 1,283,071 | 1,359,172 | 1,294,613 | |||||||||
| Total Credit Portfolio, including Sureties and Endorsements | 517,484 | 548,073 | 543,394 | |||||||||
| Loan Portfolio (A) | 445,467 | 473,829 | 468,105 | |||||||||
| Sureties, Endorsements and Guarantees | 72,017 | 74,244 | 75,289 | |||||||||
| Deposits + Debentures + Securities + Borrowings and Onlending (B) (12) | 610,234 | 648,664 | 584,649 | |||||||||
| Loan Portfolio/Funding (A/B) | 73.0 | % | 73.0 | % | 80.1 | % | ||||||
| Stockholders' Equity | 106,647 | 106,462 | 96,954 | |||||||||
| Other | ||||||||||||
| Assets Under Administration | 807,267 | 765,102 | 694,824 | |||||||||
| Total Number of Employees | 89,627 | 90,320 | 92,757 | |||||||||
| Brazil | 82,871 | 83,481 | 85,773 | |||||||||
| Abroad | 6,756 | 6,839 | 6,984 | |||||||||
| Branches and CSBs – Client Service Branches | 4,921 | 4,985 | 5,032 | |||||||||
| ATM – Automated Teller Machines (13) | 26,145 | 26,412 | 27,458 | |||||||||
| Indicators | ||||||||||||
| EMBI Brazil Risk | 409 | 517 | 319 | |||||||||
| CDI rate – In the Period (%) | 3.2 | % | 3.4 | % | 2.8 | % | ||||||
| Dollar Exchange Rate – Quotation in R$ | 3.5589 | 3.9048 | 3.2080 | |||||||||
| Dollar Exchange Rate – Change in the Period (%) | -8.9 | % | -1.7 | % | 20.8 | % | ||||||
| Euro Exchange Rate – Quotation in R$ | 4.0539 | 4.2504 | 3.4457 | |||||||||
| Euro Exchange Rate – Change in the Period (%) | -4.6 | % | -4.2 | % | 6.8 | % | ||||||
| IGP-M – In the Period (%) | 3.0 | % | 3.9 | % | 2.0 | % | ||||||
(*) The number of outstanding shares was adjusted to reflect the share bonus of 10% granted on June 05, 2014 and July 17, 2015.
Note: (1) Operating Revenues are the sum of Managerial Financial Margin, Commissions and Fees, Other Operating Income and Result from Insurance, Pension Plan and Premium Bonds Operations Before Retained Claims and Selling Expenses; (2) Described on pages 16 to 17; (3) Calculated based on the weighted average number of outstanding shares; (4) The number of outstanding shares was adjusted to reflect the share bonus of 10% granted on June 05, 2014 and July 17, 2015; (5) IOC – Interest on Capital. Declared amounts paid/accrued; (6) Total number of outstanding shares (common and non-voting shares) multiplied by the average price of non-voting share on the last trading day in the period; (7) Annualized Return was calculated by dividing Net Income by Average Stockholders’ Equity. The quotient of this division was multiplied by the number of periods in the year to derive the annualized rate. The calculation bases of returns were adjusted by the amount of dividends that has not yet been approved at shareholders’ or Board meetings, proposed after the balance sheet closing date; (8) Return was calculated by dividing Net Income by Average Assets. The quotient of this division was multiplied by the number of periods in the year to derive the annualized rate; (9) Takes into consideration the use of tax credit; (10) Does not include financial margin with the market. See details on page 17; (11) For further details on the calculation methodology of both Efficiency and Risk-Adjusted Efficiency ratios, please refer to page 34; (12) As described on page 38; (13) Includes ESBs (electronic service branches) and service points at third parties’ establishments.
| Itaú Unibanco Holding S.A. | 05 |
| Management Discussion & Analysis | Executive Summary | |
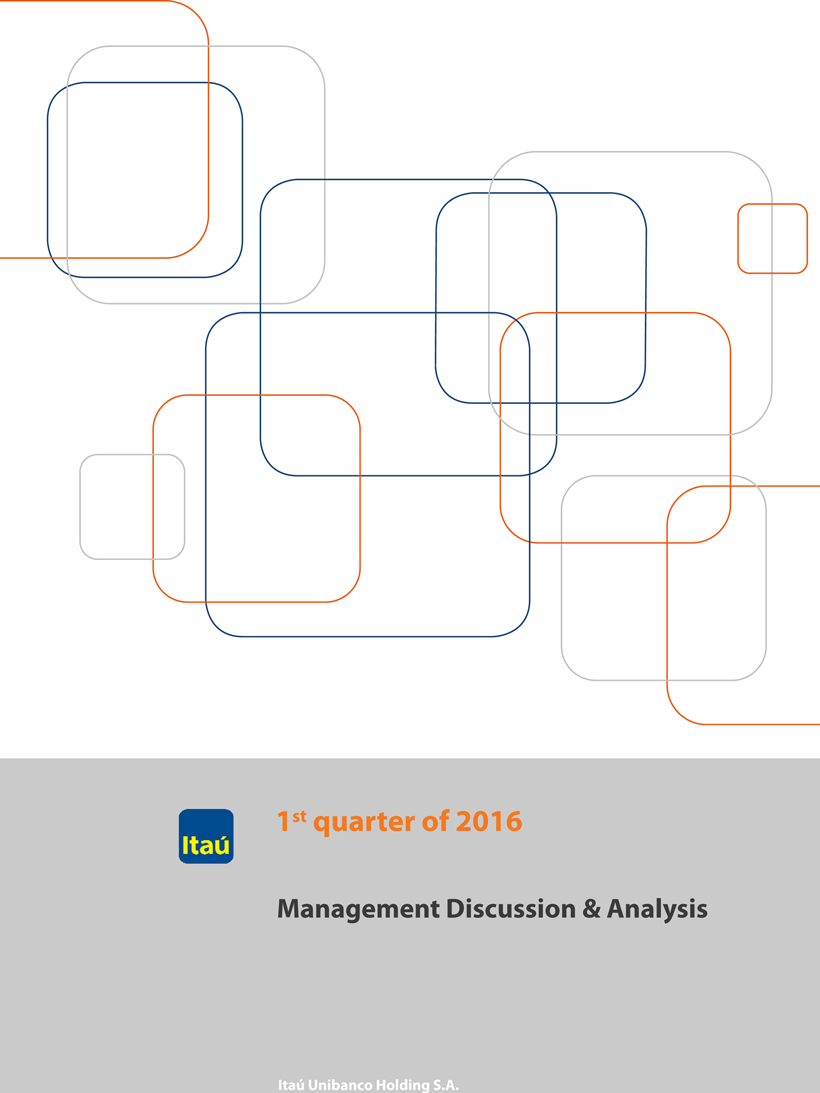
Net Income and Recurring Net Income
Our recurring net income totaled R$5,235 million in the first quarter of 2016 as a result of the elimination of non-recurring events, which are presented in the table below, from net income of R$5,184 million for the period.
Non-Recurring Events Net of Tax Effects
| In R$ millions | 1Q16 | 4Q15 | 1Q15 | |||||||||
| Recurring Net Income | 5,235 | 5,773 | 5,808 | |||||||||
| Non-Recurring Events | (51 | ) | (75 | ) | (75 | ) | ||||||
| Contingencies Provision (a) | (25 | ) | (28 | ) | (42 | ) | ||||||
| Goodwill Amortization (b) | (32 | ) | (32 | ) | (60 | ) | ||||||
| Program for Settlement or Installment Payment of Taxes (c) | 12 | (4 | ) | 27 | ||||||||
| Impairment (d) | - | (7 | ) | - | ||||||||
| Porto Seguro (e) | - | 17 | - | |||||||||
| Other | (6 | ) | (20 | ) | - | |||||||
| Net Income | 5,184 | 5,698 | 5,733 | |||||||||
Note: The impacts of the non-recurring events, described above, are net of tax effects – further details are presented in Note 22-K of the Financial Statements.
Non-Recurring Events
(a) Contingencies Provision: Recognition of provisions for tax and social security lawsuits and losses arising from economic plans in effect in Brazil during the 1980's.
(b) Goodwill Amortization: Effect of the goodwill amortization generated by acquisitions made by the Conglomerate.
(c) Program for the Settlement or Installment Payment of Taxes: Effects of our adherence to the Program for the Settlement or Installment Payment of Federal and Municipal Taxes.
(d) Impairment: Adjustment in the carrying amount of assets in order to reflect its fair value.
(e) Porto Seguro: Effect on the balance of the social contribution tax credit resulting from the rate increase in proportion to our stake in the company.
Managerial Income Statement
We apply consolidation criteria for the managerial results that affect only the breakdown of accounts and, therefore, do not affect net income. These effects are shown in the table on the following page ("Accounting and Managerial Statements Reconciliation"). Additionally, we adjusted the tax effects of the hedges of investments abroad - originally accounted for as tax expenses (PIS and COFINS) and income tax and social contribution on net income and then reclassified to the financial margin - and non-recurring events.
Our strategy for the foreign exchange risk management of the capital invested abroad is aimed at mitigating, through financial instruments, the effects resulting from foreign exchange variations and takes into consideration the impact of all tax effects. In the first quarter of 2016, the Brazilian real appreciated 8.9% against the U.S. dollar and 4.6% against the Euro, compared with appreciations of 1.7% and 4.2%, respectively, in the previous quarter.
Highlights
On April 1st, 2016, pursuant the agreement disclosed to the market as material information on January 29, 2014, we announced the consummation of the merger of operations between Banco Itaú Chile and CorpBanca, after obtaining all the corporate and regulatory approvals required. Accordingly, we now hold the control of the resulting bank (Itaú CorpBanca) with a 33.58% stake in its capital.
The completion of the merger represents an important step in our internationalization process and in our purpose of being a leading bank in Latin America.
| Itaú Unibanco Holding S.A. | 06 |
| Management Discussion & Analysis | Executive Summary | |
Accounting and Managerial Income Statements reconciliation for the past two quarters is presented below.
Accounting and Managerial Statements Reconciliation | 1st Quarter of 2016
| In R$ millions | Accounting | Non-recurring Events | Tax Effect of Hedge | Managerial Reclassifications | Managerial | |||||||||||||||
| Operating Revenues | 29,234 | 53 | (3,093 | ) | (326 | ) | 25,867 | |||||||||||||
| Managerial Financial Margin | 19,573 | 64 | (3,093 | ) | 14 | 16,557 | ||||||||||||||
| Financial Margin with Clients | 14,743 | 64 | - | 14 | 14,820 | |||||||||||||||
| Financial Margin with the Market | 4,830 | - | (3,093 | ) | - | 1,737 | ||||||||||||||
| Commissions and Fees | 7,729 | - | - | (560 | ) | 7,169 | ||||||||||||||
| Result from Insurance, Pension Plan and Premium Bonds Operations Before Retained Claims and Selling Expenses | 1,584 | - | - | 557 | 2,141 | |||||||||||||||
| Other Operating Income | 200 | (11 | ) | - | (189 | ) | - | |||||||||||||
| Equity in Earnings of Affiliates and Other Investments | 132 | - | - | (132 | ) | - | ||||||||||||||
| Non-operating Income | 16 | - | - | (16 | ) | - | ||||||||||||||
| Result from Loan Losses | (6,364 | ) | - | - | (38 | ) | (6,402 | ) | ||||||||||||
| Provision for Loan Losses | (7,193 | ) | - | - | (38 | ) | (7,231 | ) | ||||||||||||
| Recovery of Loans Written Off as Losses | 829 | - | - | 0 | 829 | |||||||||||||||
| Retained Claims | (394 | ) | - | - | - | (394 | ) | |||||||||||||
| Other Operating Income/(Expenses) | (12,660 | ) | 52 | 370 | 312 | (11,926 | ) | |||||||||||||
| Non-interest Expenses | (10,607 | ) | 52 | - | 340 | (10,215 | ) | |||||||||||||
| Tax Expenses for ISS, PIS, Cofins and Other Taxes | (1,857 | ) | - | 370 | (28 | ) | (1,515 | ) | ||||||||||||
| Insurance Selling Expenses | (196 | ) | - | - | - | (196 | ) | |||||||||||||
| Income before Tax and Profit Sharing | 9,816 | 105 | (2,722 | ) | (53 | ) | 7,145 | |||||||||||||
| Income Tax and Social Contribution | (4,529 | ) | (53 | ) | 2,722 | 14 | (1,846 | ) | ||||||||||||
| Profit Sharing | (39 | ) | - | - | 39 | - | ||||||||||||||
| Minority Interests | (64 | ) | - | - | - | (64 | ) | |||||||||||||
| Net Income | 5,184 | 51 | - | - | 5,235 | |||||||||||||||
Accounting and Managerial Statements Reconciliation | 4th Quarter of 2015
| In R$ millions | Accounting | Non-recurring Events | Tax Effect of Hedge | Managerial Reclassifications | Managerial | |||||||||||||||
| Operating Revenues | 27,543 | (202 | ) | (499 | ) | (162 | ) | 26,680 | ||||||||||||
| Managerial Financial Margin | 17,051 | 23 | (499 | ) | 189 | 16,764 | ||||||||||||||
| Financial Margin with Clients | 15,283 | 23 | - | 189 | 15,495 | |||||||||||||||
| Financial Margin with the Market | 1,768 | - | (499 | ) | - | 1,269 | ||||||||||||||
| Commissions and Fees | 8,201 | - | - | (556 | ) | 7,645 | ||||||||||||||
| Result from Insurance, Pension Plan and Premium Bonds Operations Before Retained Claims and Selling Expenses | 1,849 | (205 | ) | - | 627 | 2,271 | ||||||||||||||
| Other Operating Income | 277 | (3 | ) | - | (274 | ) | - | |||||||||||||
| Equity in Earnings of Affiliates and Other Investments | 194 | (17 | ) | - | (177 | ) | - | |||||||||||||
| Non-operating Income | (30 | ) | - | - | 30 | - | ||||||||||||||
| Result from Loan Losses | (4,384 | ) | - | - | (250 | ) | (4,634 | ) | ||||||||||||
| Provision for Loan Losses | (5,866 | ) | - | - | (250 | ) | (6,116 | ) | ||||||||||||
| Recovery of Loans Written Off as Losses | 1,482 | - | - | - | 1,482 | |||||||||||||||
| Retained Claims | (406 | ) | - | - | - | (406 | ) | |||||||||||||
| Other Operating Income/(Expenses) | (13,699 | ) | 312 | 80 | 349 | (12,959 | ) | |||||||||||||
| Non-interest Expenses | (11,782 | ) | 302 | - | 361 | (11,119 | ) | |||||||||||||
| Tax Expenses for ISS, PIS, Cofins and Other Taxes | (1,660 | ) | 10 | 80 | (13 | ) | (1,582 | ) | ||||||||||||
| Insurance Selling Expenses | (258 | ) | - | - | - | (258 | ) | |||||||||||||
| Income before Tax and Profit Sharing | 9,053 | 110 | (419 | ) | (64 | ) | 8,680 | |||||||||||||
| Income Tax and Social Contribution | (3,191 | ) | (35 | ) | 419 | (8 | ) | (2,815 | ) | |||||||||||
| Profit Sharing | (72 | ) | - | - | 72 | - | ||||||||||||||
| Minority Interests | (92 | ) | - | - | - | (92 | ) | |||||||||||||
| Net Income | 5,698 | 75 | - | - | 5,773 | |||||||||||||||
| Itaú Unibanco Holding S.A. | 07 |
| Management Discussion & Analysis | Executive Summary | |
We present below the income statement from a standpoint that highlights Operating Revenues, which is composed by the sum of the main accounts in which revenues from banking, insurance, pension plan and premium bonds operations are recorded.
Income Statement | Operating Revenues Perspective
| In R$ millions | 1Q16 | 4Q15 | change | 1Q15 | change | |||||||||||||||||||||||
| Operating Revenues | 25,867 | 26,680 | (812 | ) | -3.0 | % | 24,946 | 921 | 3.7 | % | ||||||||||||||||||
| Managerial Financial Margin | 16,557 | 16,764 | (207 | ) | -1.2 | % | 15,963 | 594 | 3.7 | % | ||||||||||||||||||
| Financial Margin with Clients | 14,820 | 15,495 | (675 | ) | -4.4 | % | 14,092 | 728 | 5.2 | % | ||||||||||||||||||
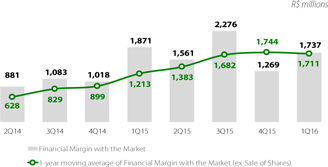
| Financial Margin with the Market | 1,737 | 1,269 | 468 | 36.9 | % | 1,871 | (134 | ) | -7.1 | % | ||||||||||||||||||
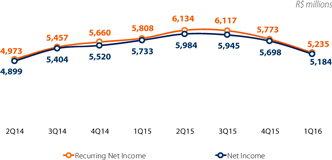
| Commissions and Fees | 7,169 | 7,645 | (476 | ) | -6.2 | % | 6,867 | 303 | 4.4 | % | ||||||||||||||||||
| Result from Insurance, Pension Plan and Premium Bonds Operations Before Retained Claims and Selling Expenses | 2,141 | 2,271 | (130 | ) | -5.7 | % | 2,117 | 25 | 1.2 | % | ||||||||||||||||||
| Result from Loan Losses | (6,402 | ) | (4,634 | ) | (1,768 | ) | 38.1 | % | (4,455 | ) | (1,947 | ) | 43.7 | % | ||||||||||||||
| Provision for Loan Losses | (7,231 | ) | (6,116 | ) | (1,115 | ) | 18.2 | % | (5,515 | ) | (1,716 | ) | 31.1 | % | ||||||||||||||
| Recovery of Loans Written Off as Losses | 829 | 1,482 | (652 | ) | -44.0 | % | 1,060 | (231 | ) | -21.8 | % | |||||||||||||||||
| Retained Claims | (394 | ) | (406 | ) | 12 | -3.0 | % | (368 | ) | (26 | ) | 7.0 | % | |||||||||||||||
| Operating Margin | 19,071 | 21,639 | (2,568 | ) | -11.9 | % | 20,123 | (1,052 | ) | -5.2 | % | |||||||||||||||||
| Other Operating Income/(Expenses) | (11,926 | ) | (12,959 | ) | 1,033 | -8.0 | % | (11,602 | ) | (324 | ) | 2.8 | % | |||||||||||||||
| Non-interest Expenses | (10,215 | ) | (11,119 | ) | 904 | -8.1 | % | (9,881 | ) | (334 | ) | 3.4 | % | |||||||||||||||
| Tax Expenses for ISS, PIS, Cofins and Other Taxes | (1,515 | ) | (1,582 | ) | 67 | -4.2 | % | (1,455 | ) | (60 | ) | 4.1 | % | |||||||||||||||
| Insurance Selling Expenses | (196 | ) | (258 | ) | 62 | -24.1 | % | (266 | ) | 70 | -26.4 | % | ||||||||||||||||
| Income before Tax and Minority Interests | 7,145 | 8,680 | (1,535 | ) | -17.7 | % | 8,520 | (1,375 | ) | -16.1 | % | |||||||||||||||||
| Income Tax and Social Contribution | (1,846 | ) | (2,815 | ) | 969 | -34.4 | % | (2,607 | ) | 761 | -29.2 | % | ||||||||||||||||
| Minority Interests in Subsidiaries | (64 | ) | (92 | ) | 28 | -30.4 | % | (105 | ) | 41 | -39.2 | % | ||||||||||||||||
| Recurring Net Income | 5,235 | 5,773 | (538 | ) | -9.3 | % | 5,808 | (573 | ) | -9.9 | % | |||||||||||||||||
We present below the income statement from the standpoint that highlights the Managerial Financial Margin.
Income Statement | Managerial Financial Margin Perspective
| In R$ millions | 1Q16 | 4Q15 | change | 1Q15 | change | |||||||||||||||||||||||
| Managerial Financial Margin | 16,557 | 16,764 | (207 | ) | -1.2 | % | 15,963 | 594 | 3.7 | % | ||||||||||||||||||
| Financial Margin with Clients | 14,820 | 15,495 | (675 | ) | -4.4 | % | 14,092 | 728 | 5.2 | % | ||||||||||||||||||
| Financial Margin with the Market | 1,737 | 1,269 | 468 | 36.9 | % | 1,871 | (134 | ) | -7.1 | % | ||||||||||||||||||
| Result from Loan Losses | (6,402 | ) | (4,634 | ) | (1,768 | ) | 38.1 | % | (4,455 | ) | (1,947 | ) | 43.7 | % | ||||||||||||||
| Provision for Loan Losses | (7,231 | ) | (6,116 | ) | (1,115 | ) | 18.2 | % | (5,515 | ) | (1,716 | ) | 31.1 | % | ||||||||||||||
| Recovery of Loans Written Off as Losses | 829 | 1,482 | (652 | ) | -44.0 | % | 1,060 | (231 | ) | -21.8 | % | |||||||||||||||||
| Net Result from Financial Operations | 10,155 | 12,130 | (1,975 | ) | -16.3 | % | 11,508 | (1,353 | ) | -11.8 | % | |||||||||||||||||
| Other Operating Income/(Expenses) | (3,010 | ) | (3,450 | ) | 439 | -12.7 | % | (2,988 | ) | (22 | ) | 0.7 | % | |||||||||||||||
| Commissions and Fees | 7,169 | 7,645 | (476 | ) | -6.2 | % | 6,867 | 303 | 4.4 | % | ||||||||||||||||||
| Result from Insurance, Pension Plan and Premium Bonds Operations | 1,551 | 1,607 | (55 | ) | -3.5 | % | 1,482 | 69 | 4.7 | % | ||||||||||||||||||
| Non-interest Expenses | (10,215 | ) | (11,119 | ) | 904 | -8.1 | % | (9,881 | ) | (334 | ) | 3.4 | % | |||||||||||||||
| Tax Expenses for ISS, PIS, Cofins and Other Taxes | (1,515 | ) | (1,582 | ) | 67 | -4.2 | % | (1,455 | ) | (60 | ) | 4.1 | % | |||||||||||||||
| Income before Tax and Minority Interests | 7,145 | 8,680 | (1,535 | ) | -17.7 | % | 8,520 | (1,375 | ) | -16.1 | % | |||||||||||||||||
| Income Tax and Social Contribution | (1,846 | ) | (2,815 | ) | 969 | -34.4 | % | (2,607 | ) | 761 | -29.2 | % | ||||||||||||||||
| Minority Interests in Subsidiaries | (64 | ) | (92 | ) | 28 | -30.4 | % | (105 | ) | 41 | -39.2 | % | ||||||||||||||||
| Recurring Net Income | 5,235 | 5,773 | (538 | ) | -9.3 | % | 5,808 | (573 | ) | -9.9 | % | |||||||||||||||||
| Itaú Unibanco Holding S.A. | 08 |
| Management Discussion & Analysis | Executive Summary | |
Net Income
The recurring net income for the first quarter of 2016 amounted to R$5,235 million, representing a decrease of 9.3% from the previous quarter and of 9.9% from the same period of the previous year.
The main positive highlights in the quarter when compared to the previous quarter were the 36.9% increase in our financial margin with the market and the 8.1% decrease in non-interest expenses.
These positive highlights were more than offset by the 18.2% increase in provision for loan losses and by the 44.0% decrease in income from recovery of loans written off as losses.
Return on Average Equity

The annualized recurring return on average equity reached 19.9% in the first quarter of 2016. Stockholders’ equity reached R$106.6 billion, a 0.2% increase from the previous quarter. In this quarter, stockholders’ equity was impacted by the payment of additional interest on capital in the amount of R$2,697 million.
Annualized recurring return on average assets reached 1.6% in the first quarter of 2016, decreasing 10 basis points from the previous quarter.
Operating Revenues
In the first quarter of 2016, operating revenues, representing revenues from banking, and insurance, pension plan and premium bonds operations, totaled R$25,867 million, a 3.0% decrease from the previous quarter and a 3.7% increase from the same period of the previous year. The main components of operating revenues and other items of income statement are presented ahead.

Managerial Financial Margin
The managerial financial margin for the first quarter of 2016 totaled R$16,557 million, a decrease of R$207 million compared to the previous quarter, mainly due to the decrease of R$675 million in our financial margin with clients, basically as a result of lower volumes and lower number of calendar days. Our financial margin with the market increased R$468 million in the quarter.

Compared to the first quarter of 2015, our managerial financial margin increased 3.7%. This growth was due to the increase of R$728 million in financial margin with clients and to the reduction of R$134 million in financial margin with the market.
Financial Margin of Spread-Sensitive Operations, net of the Provision from Loan Losses
Our financial margin of spread-sensitive operations, net of provision for loan losses and recovery of loans written off as losses, decreased 24.4% from the previous quarter. The ratio of the provision for loan losses, net of recovery of loans written off as losses, to the spread-sensitive operations financial margin reached 48.5% this quarter, increasing 1,450 basis points compared to the previous quarter.

| Itaú Unibanco Holding S.A. | 09 |
| Management Discussion & Analysis | Executive Summary | |
Result from Loan Losses

The result from loan losses, net of recovery of credits, grew 38.1% compared to the previous quarter, totaling R$6,402 million in the quarter. This increase was due to the 18.2% (R$1,115 million) increase in provision for loan losses, partially due to provisions for non-overdue operations (generic allowance), as a result of a more challenging economic scenario. Furthermore, our income from recovery of loans written off as losses decreased 44.0% (R$652 million), due to the positive effect in the previous quarter related to the restructuring of one operation of a specific group in the corporate segment which had been written off as a loss.
Commissions and Fees
Commissions and fees increased 4.4% when compared to the same quarter of the previous year, mainly driven by higher revenues from credit card and current account services. The reduction in the first quarter of 2016 compared to the prior quarter was mainly due to the typical seasonality of the period.
Result from Insurance, Pension Plan and Premium Bonds

In the first quarter of 2016, the result from insurance, pension plan and premium bonds from core activities, which consist of mass-market products related to life, property, credit, pension plan and premium bonds reached R$1,446 million, practically stable when compared to the previous quarter and an increase of 3.5% when compared to the first quarter of 2015. The loss ratio of core activities reached 29.3% this quarter.
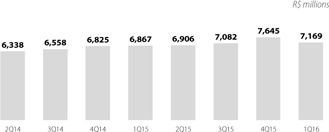
Non-Interest Expenses
In the first quarter of 2016, non-interest expenses decreased 8.1% when compared to the fourth quarter of 2015. Personnel expenses were 3.0% lower, mainly driven by the larger number of employees in vacations in the first quarter of 2016, which reduces compensation expenses, whereas administrative expenses were 11.1% lower than in the previous quarter, mainly due to expenses related to third-party services, data processing and telecommunications.
Compared to the first quarter of 2015, non-interest expenses increased 3.4%. Excluding operations abroad expenses, this increase would have been 1.9% in the period.
Efficiency Ratio and Risk-Adjusted Efficiency Ratio (*)

(*) Calculation criteria are detailed on page 34.
In the first quarter of 2016, the efficiency ratio, according to the criteria that include all expenses except result from loan losses, reached 43.0%, an improvement of 250 basis points from the previous quarter, mainly driven by the decrease in non-interest expenses (8.1%). In the 12-month period, efficiency ratio reached 43.9%, improving 10 basis points from the previous quarter and 180 basis points from the same period of the previous year.
In the first quarter of 2016, the risk-adjusted efficiency ratio, which also includes the result from loan losses, reached 69.9%, an increase of 540 basis points from the previous quarter, as a result of a higher result from loan losses (38.1%). In the 12-month period, risk-adjusted efficiency ratio reached 64.8%.
| Itaú Unibanco Holding S.A. | 10 |
| Management Discussion & Analysis | Executive Summary | |
Balance Sheet | Assets
| In R$ millions, end of period | 1Q16 | 4Q15 | change | 1Q15 | change | |||||||||||||||
| Current and Long-term Assets | 1,263,779 | 1,340,483 | -5.7 | % | 1,274,667 | -0.9 | % | |||||||||||||
| Cash and Cash Equivalents | 18,384 | 18,544 | -0.9 | % | 18,687 | -1.6 | % | |||||||||||||
| Short-term Interbank Investments | 237,642 | 280,944 | -15.4 | % | 225,076 | 5.6 | % | |||||||||||||
| Securities and Derivative Financial Instruments | 338,997 | 338,391 | 0.2 | % | 324,060 | 4.6 | % | |||||||||||||
| Interbank and Interbranch Accounts | 70,858 | 67,373 | 5.2 | % | 67,001 | 5.8 | % | |||||||||||||
| Loan, Lease and Other Loan Operations | 445,467 | 473,829 | -6.0 | % | 468,105 | -4.8 | % | |||||||||||||
| (Allowance for Loan Losses) | (36,036 | ) | (34,078 | ) | 5.7 | % | (28,354 | ) | 27.1 | % | ||||||||||
| Other Assets | 188,467 | 195,480 | -3.6 | % | 200,092 | -5.8 | % | |||||||||||||
| Foreign Exchange Portfolio | 63,795 | 68,909 | -7.4 | % | 83,050 | -23.2 | % | |||||||||||||
| Other | 124,672 | 126,571 | -1.5 | % | 117,042 | 6.5 | % | |||||||||||||
| Permanent Assets | 19,292 | 18,689 | 3.2 | % | 19,947 | -3.3 | % | |||||||||||||
| Investments | 4,342 | 3,939 | 10.2 | % | 3,539 | 22.7 | % | |||||||||||||
| Real Estate in Use | 6,756 | 7,055 | -4.2 | % | 7,521 | -10.2 | % | |||||||||||||
| Intangible Assets and Goodwill | 8,194 | 7,695 | 6.5 | % | 8,887 | -7.8 | % | |||||||||||||
| Total Assets | 1,283,071 | 1,359,172 | -5.6 | % | 1,294,613 | -0.9 | % | |||||||||||||
At the end of the first quarter of 2016, our assets totaled R$1.28 trillion, a decrease of 5.6% (R$76.1 billion) from the previous quarter. The main changes are presented below:
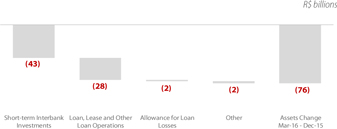
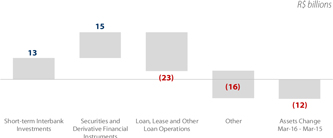
Compared to the previous year, the decrease of 0.9% (R$11.5 billion) was mainly driven by a reduction in our loan operations.
Balance Sheet | Liabilities and Equity
| In R$ millions, end of period | 1Q16 | 4Q15 | change | 1Q15 | change | |||||||||||||||
| Current and Long-Term Liabilities | 1,172,779 | 1,248,995 | -6.1 | % | 1,194,447 | -1.8 | % | |||||||||||||
| Deposits | 266,318 | 292,610 | -9.0 | % | 298,652 | -10.8 | % | |||||||||||||
| Demand Deposits | 58,557 | 61,092 | -4.1 | % | 56,660 | 3.3 | % | |||||||||||||
| Savings Deposits | 107,292 | 111,319 | -3.6 | % | 117,357 | -8.6 | % | |||||||||||||
| Interbank Deposits | 8,552 | 14,949 | -42.8 | % | 28,135 | -69.6 | % | |||||||||||||
| Time Deposits | 91,916 | 105,250 | -12.7 | % | 96,500 | -4.8 | % | |||||||||||||
| Deposits Received under Securities Repurchase Agreements | 318,964 | 350,954 | -9.1 | % | 330,858 | -3.6 | % | |||||||||||||
| Fund from Acceptances and Issue of Securities | 74,352 | 75,590 | -1.6 | % | 50,753 | 46.5 | % | |||||||||||||
| Interbank and Interbranch Accounts | 9,823 | 6,926 | 41.8 | % | 9,365 | 4.9 | % | |||||||||||||
| Borrowings and Onlendings | 95,352 | 104,589 | -8.8 | % | 96,265 | -0.9 | % | |||||||||||||
| Derivative Financial Instruments | 28,917 | 31,116 | -7.1 | % | 30,997 | -6.7 | % | |||||||||||||
| Technical Provisions for Insurance, Pension Plans and Premium Bonds | 137,677 | 132,053 | 4.3 | % | 116,737 | 17.9 | % | |||||||||||||
| Other Liabilities | 241,377 | 255,155 | -5.4 | % | 260,819 | -7.5 | % | |||||||||||||
| Subordinated Debt | 57,919 | 65,785 | -12.0 | % | 59,527 | -2.7 | % | |||||||||||||
| Foreign Exchange Portfolio | 64,240 | 68,466 | -6.2 | % | 84,030 | -23.6 | % | |||||||||||||
| Other | 119,218 | 120,905 | -1.4 | % | 117,262 | 1.7 | % | |||||||||||||
| Deferred Income | 1,847 | 1,960 | -5.8 | % | 1,513 | 22.1 | % | |||||||||||||
| Minority Interest in Subsidiaries | 1,799 | 1,755 | 2.5 | % | 1,700 | 5.8 | % | |||||||||||||
| Stockholders' Equity | 106,647 | 106,462 | 0.2 | % | 96,954 | 10.0 | % | |||||||||||||
| Total Liabilities and Equity | 1,283,071 | 1,359,172 | -5.6 | % | 1,294,613 | -0.9 | % | |||||||||||||
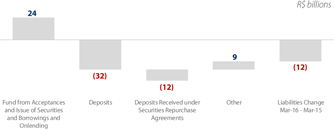
The main changes in liabilities at the end of the first quarter of 2016, compared to the previous quarter, are presented in the chart below:

Compared to the previous year, the main changes are highlighted as follows:
| Itaú Unibanco Holding S.A. | 11 |
| Management Discussion & Analysis | Executive Summary | |
Credit Portfolio with Endorsements, Sureties and Private Securities
At the end of the first quarter of 2016, our total credit portfolio (including sureties, endorsements and private securities) reached R$554,252 million, reducing 5.3% from the previous quarter and 4.2% from the same period of the previous year. Excluding the effect of the foreign exchange variation, our loan portfolio would have decreased 3.5% in the quarter and 5.5% in the 12-month period.
In the individuals segment, the highlight was the growth of the low-risk loan portfolios: payroll loans, with a 2.9% increase in the quarter and 4.8% in 12 months (mainly driven by INSS beneficiaries), and mortgage loans, with increases of 2.1% and 17.1%, respectively, whereas the vehicles portfolio decreased 9.4% in the quarter and 31.2% in 12 months, due to a lower volume of credit origination.
The companies segment, excluding private securities, decreased 8.1% in the quarter and 9.9% in the 12-month period. The corporate portfolio decreased 9.2% from the previous quarter and 9.8% in the 12-month period, whereas the very small, small and middle-market companies portfolio decreased 4.9% in the quarter and 9.9% in 12 months. Excluding the effect of the foreign exchange variation, the corporate portfolio would have decreased 6.8% from the previous quarter and 12.5% in the 12-month period.
Our operations in Latin America decreased 5.2% in the quarter, but increased 9.8% in the 12-month period. Excluding the effect of the foreign exchange variation, the growth of this portfolio would have been 1.4% compared to the previous quarter and the same 9.8% when compared to the previous year.
The balance of endorsements and sureties reached R$72,017 million at the end of the first quarter of 2016, with decreases of 3.0% from the previous quarter and of 4.3% in the past 12 months, mainly driven by changes in the corporate portfolio, which decreased 3.1% from the previous quarter and 4.8% in the 12-month period.
| In R$ millions, end of period | 1Q16 | 4Q15 | change | 1Q15 | change | |||||||||||||||
| Individuals | 184,226 | 187,556 | -1.8 | % | 187,286 | -1.6 | % | |||||||||||||
| Credit Card Loans | 54,867 | 58,542 | -6.3 | % | 56,331 | -2.6 | % | |||||||||||||
| Personal Loans | 29,159 | 28,961 | 0.7 | % | 29,822 | -2.2 | % | |||||||||||||
| Payroll Loans (1) | 46,742 | 45,437 | 2.9 | % | 44,608 | 4.8 | % | |||||||||||||
| Vehicle Loans | 18,105 | 19,984 | -9.4 | % | 26,331 | -31.2 | % | |||||||||||||
| Mortgage Loans | 35,353 | 34,631 | 2.1 | % | 30,194 | 17.1 | % | |||||||||||||
| Companies | 264,896 | 288,393 | -8.1 | % | 293,862 | -9.9 | % | |||||||||||||
| Corporate Loans (2) | 199,273 | 219,418 | -9.2 | % | 221,026 | -9.8 | % | |||||||||||||
| Very Small, Small and Middle Market Loans (2)(3) | 65,622 | 68,974 | -4.9 | % | 72,836 | -9.9 | % | |||||||||||||
| Latin America (4) | 68,362 | 72,125 | -5.2 | % | 62,246 | 9.8 | % | |||||||||||||
| Total with Endorsements and Sureties | 517,484 | 548,073 | -5.6 | % | 543,394 | -4.8 | % | |||||||||||||
| Corporate - Private Securities (5) | 36,768 | 37,431 | -1.8 | % | 35,202 | 4.4 | % | |||||||||||||
| Total with Endorsements, Sureties and Private Securities | 554,252 | 585,504 | -5.3 | % | 578,596 | -4.2 | % | |||||||||||||
| Total with Endorsements, Sureties and Private Securities (6) ex-foreign exchange rate variation) | 554,252 | 574,163 | -3.5 | % | 586,654 | -5.5 | % | |||||||||||||
| Endorsements and Sureties | 72,017 | 74,244 | -3.0 | % | 75,289 | -4.3 | % | |||||||||||||
| Individuals | 514 | 550 | -6.6 | % | 478 | 7.5 | % | |||||||||||||
| Corporate | 65,095 | 67,152 | -3.1 | % | 68,407 | -4.8 | % | |||||||||||||
| Very Small, Small and Middle Market | 3,210 | 2,891 | 11.1 | % | 3,249 | -1.2 | % | |||||||||||||
| Latin America (4) | 3,198 | 3,650 | -12.4 | % | 3,156 | 1.3 | % | |||||||||||||
(1) Includes operations originated by the institution and acquired operations. (2) In the 1Q16, the Very Small, Small and Middle-Market companies segment started to include clients with sales from R$30 million up to R$200 million (previously up to R$300 million). For this reason, certain clients (those with sales above R$200 million) were reclassified to the Corporate segment and, for comparison purposes, previous periods were also reclassified. (3) Includes Rural Loans to Individuals. (4) Includes Argentina, Chile, Colombia, Paraguay and Uruguay. (5) Includes Debentures, CRI and Commercial Papers. (6) Calculated based on the conversion of the foreign currency portfolio (U.S. dollar and currencies of Latin America). Note: Mortgage and Rural Loan portfolios from the companies segment are allocated according to the client’s size. For further details, please refer to page 18.
Credit Portfolio – Currency Breakdown

On March 31, 2016, R$132.8 billion of our total credit assets were denominated in or indexed to foreign currencies. This portion decreased 9.7% in the quarter, mainly due to the appreciation of the Brazilian real against the U.S. dollar and the currencies of the Latin American countries.
NPL Ratio (90 days overdue)

At the end of the first quarter of 2016, the NPL ratio for operations overdue for more than 90 days (NPL 90) increased 40 basis points from the previous quarter and 90 basis points from the same period of 2015. Excluding the effect of the foreign exchange variation, the NPL 90 days increase would have been 30 basis points in the quarter.
| Itaú Unibanco Holding S.A. | 12 |
| Management Discussion & Analysis | Executive Summary | |
2016 Forecast (*)
Below, we reiterate our 2016 forecast:
| Consolidated | Brazil 3 | |||
| Total Credit Portfolio 1 | from -0.5% to 4.5% | from -1.0% to 3.0% | ||
| Financial Margin with Clients | Growth of 2.0% to 5.0% | Growth of 1.0% to 4.0% | ||
| Provision for Loan Losses Net of Recovery of Loans | Between R$22 billion and R$25 billion | Between R$21 billion and R$24 billion | ||
| Commissions and Fees and Result from Insurance Operations2 | Growth of 6.0% to 9.0% | Growth of 4.5% to 7.5% | ||
| Non-Interest Expenses | Growth of 5.0% to 7.5% | Growth of 4.0% to 6.5% |
| (1) | Includes endorsements, sureties and private securities; |
| (2) | Commissions and Fees (+) Income from Insurance, Pension Plan and Premium Bonds Operations (-) Expenses for Claims (-) Insurance, Pension Plan and Premium Bonds Selling Expenses; |
| (3) | Includes units abroad ex-Latin America. |
| (*) | Does not include the effect of CorpBanca´s transaction. |
Although the growth plans and projections of results presented above are based on management assumptions and information available in the market to date, these expectations involve inaccuracies and risks that are difficult to anticipate and there may be, therefore, results or consequences that differ from those anticipated. This information is not a guarantee of future performance. The use of these expectations should take into consideration the risks and uncertainties that involve any activities and that are beyond our control. These risks and uncertainties include, but are not limited to, our ability to perceive the dimension of the synergies projected and their timing, political and economic changes, volatility in interest and foreign exchange rates, technological changes, inflation, financial disintermediation, competitive pressures on products, prices and changes in tax legislation, among others.
| Itaú Unibanco Holding S.A. | 13 |
(This page was intentionally left blank)
| Itaú Unibanco Holding S.A. | 14 |

| Management Discussion & Analysis | Income Statement Analysis | |
Managerial Financial Margin
In the first quarter of 2016, the managerial financial margin totaled R$16,557 million, a 1.2% decrease compared to the previous quarter.
Compared to the same period of the previous year, the managerial financial margin increased 3.7%.
The main drivers of these variations are presented below:
| In R$ millions | 1Q16 | 4Q15 | change | 1Q15 | change | |||||||||||||||||||||||
| Financial Margin with Clients | 14,820 | 15,495 | (675 | ) | -4.4 | % | 14,092 | 728 | 5.2 | % | ||||||||||||||||||
| Spread-Sensitive Operations | 13,198 | 13,629 | (431 | ) | -3.2 | % | 12,658 | 539 | 4.3 | % | ||||||||||||||||||
| Working Capital and Other | 1,622 | 1,866 | (244 | ) | -13.1 | % | 1,434 | 189 | 13.2 | % | ||||||||||||||||||
| Financial Margin with the Market | 1,737 | 1,269 | 468 | 36.9 | % | 1,871 | (134 | ) | -7.1 | % | ||||||||||||||||||
| Total | 16,557 | 16,764 | (207 | ) | -1.2 | % | 15,963 | 594 | 3.7 | % | ||||||||||||||||||
Managerial Financial Margin with Clients
The managerial financial margin with clients consists of revenues generated by the use of financial products by clients, including both account and non-account holders.
For clarity purposes, we classify these operations into two different groups: i) financial margin of spread-sensitive operations and ii) working capital and other.
In the first quarter of 2016, the managerial financial margin with clients totaled R$14,820 million, a 4.4% decrease from the previous quarter. Compared to the same period of the previous year, the financial margin with clients increased 5.2% driven by higher margins with spread-sensitive operations and working capital and other.
Spread-Sensitive Operations
In the first quarter of 2016, the financial margin of spread-sensitive operations, which includes the results from credit assets, non-credit assets and liabilities, totaled R$13,198 million, a decrease of 3.2% or R$431 million from the previous period, mainly driven by lower volumes and lower number of calendar days in this quarter compared to the previous one.
Compared to the first quarter of 2015, the financial margin of spread variation-sensitive operations increased R$539 million, an increase of 4.3% from the previous year.
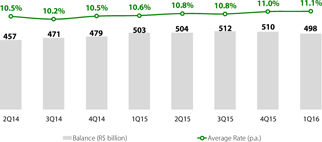
Annualized Rate of Spread-Sensitive Operations
| In R$ millions | 1Q16 | 4Q15 | change | |||||||||||||
| Average Balance | 497,892 | 510,263 | (12,371 | ) | -2.4 | % | ||||||||||
| Financial Margin | 13,198 | 13,629 | (431 | ) | -3.2 | % | ||||||||||
| Average Rate ( p.a. ) | 11.1 | % | 11.0 | % | 10 | bps | ||||||||||
Working Capital and Other
In the first quarter of 2016, our financial margin of working capital and other totaled R$1,622 million, with a 13.1% decrease from the last quarter of 2015, as a result of a 12.0% reduction in the average balance. This reduction was mainly due to the higher allocation of capital to treasury, related to the application of BIS III rules to our managerial capital allocation model.
Annualized Rate of Working Capital and Other
| In R$ millions | 1Q16 | 4Q15 | change | |||||||||||||
| Average Balance | 68,096 | 77,412 | (9,316 | ) | -12.0 | % | ||||||||||
| Financial Margin | 1,622 | 1,866 | (244 | ) | -13.1 | % | ||||||||||
| Average Rate ( p.a. ) | 9.9 | % | 9.9 | % | 0 | bps | ||||||||||
| CDI - Annualized Quarterly Rate | 14.1 | % | 14.1 | % | 0 | bps | ||||||||||

Managerial Financial Margin with the Market
The financial margin with the market consists of treasury transactions that include Asset and Liability Management (ALM) and proprietary trading operations.
In the quarter, the financial margin with the market totaled R$1,737 million, mainly driven by the management of proprietary and structural positions in Brazil and abroad.
Financial Margin with the Market
| Itaú Unibanco Holding S.A. | 16 |
| Management Discussion & Analysis | Income Statement Analysis | |
Managerial Financial Margin with Clients
In the first quarter of 2016, as a result of the previously mentioned changes, the annualized rate of managerial financial margin with clients, which excludes the financial margin with the market, reached 10.9%, remaining stable compared to the fourth quarter of 2015.
In this quarter, the annualized average rate of the risk-adjusted financial margin with clients reached 6.1%, a reduction of 140 basis points from the fourth quarter of 2015, mainly driven by higher provision for loan losses.
In this quarter, the annualized average rate of the financial margin with spread-sensitive operations reached 11.1%, an increase of 10 basis points from the previous quarter.
In the first quarter of 2016, the annualized average rate of the financial margin with spread-sensitive operations reached 5.5%, a reduction of 160 basis points from the previous quarter, mainly driven by higher provisions for loan losses.
| 1Q16 | 4Q15 | |||||||||||||||||||||||
| Average | Financial | Average Rate | Average | Financial | Average Rate | |||||||||||||||||||
| In R$ millions, end of period | Balance | Margin | (p.a.) | Balance | Margin | (p.a.) | ||||||||||||||||||
| Spread-Sensitive Operations | 497,892 | 13,198 | 11.1 | % | 510,263 | 13,629 | 11.0 | % | ||||||||||||||||
| Working Capital and Other | 68,096 | 1,622 | 9.9 | % | 77,412 | 1,866 | 9.9 | % | ||||||||||||||||
| Financial Margin with Clients | 565,988 | 14,820 | 10.9 | % | 587,675 | 15,495 | 10.9 | % | ||||||||||||||||
| Provision for Loan Losses | (7,231 | ) | (6,116 | ) | ||||||||||||||||||||
| Recovery of Loans Written Off as Losses | 829 | 1,482 | ||||||||||||||||||||||
| Financial Margin of Spread-Sensitive Operations after Provisions for Credit Risk | 497,892 | 6,796 | 5.5 | % | 510,263 | 8,994 | 7.1 | % | ||||||||||||||||
| Financial Margin with Clients after Provisions for Credit Risk | 565,988 | 8,418 | 6.1 | % | 587,675 | 10,861 | 7.5 | % | ||||||||||||||||
Financial Margin with Clients and Spread-Sensitive Operations before and after Provisions for Credit Risk

Composition of the Change in the Financial Margin with Clients
For a better understanding of the changes in our financial margin with clients, we segregated effects from changes in the volume of spread-sensitive operations, the mix of products, clients and spread, and working capital and other effects.
In the first quarter of 2016, the 4.4% decrease in our financial margin with clients was mainly driven by lower volumes of spread-sensitive operations, and by the decrease in the financial margin with working capital and other.
Financial Margin with Clients Change

(*) Balances do not include the effects of foreign exchange rate variations.
| Itaú Unibanco Holding S.A. | 17 |
| Management Discussion & Analysis | Income Statement Analysis | |
Credit Portfolio
Credit Portfolio by Product
In the table below, the loan portfolio is split into two groups: individuals and companies. For a better understanding of the performance of these portfolios, the main product groups of each segment are presented below.
| In R$ millions, end of period | 1Q16 | 4Q15 | change | 1Q15 | change | |||||||||||||||
| Individuals | 204,965 | 209,319 | -2.1 | % | 205,850 | -0.4 | % | |||||||||||||
| Credit Card | 54,867 | 58,542 | -6.3 | % | 56,331 | -2.6 | % | |||||||||||||
| Personal Loans | 28,645 | 28,411 | 0.8 | % | 29,344 | -2.4 | % | |||||||||||||
| Payroll Loans (1) | 46,742 | 45,437 | 2.9 | % | 44,608 | 4.8 | % | |||||||||||||
| Vehicles | 18,105 | 19,984 | -9.4 | % | 26,331 | -31.2 | % | |||||||||||||
| Mortgage Loans | 35,353 | 34,631 | 2.1 | % | 30,194 | 17.1 | % | |||||||||||||
| Rural Loans | 250 | 258 | -3.2 | % | 275 | -9.1 | % | |||||||||||||
| Latin America (2) | 21,003 | 22,055 | -4.8 | % | 18,768 | 11.9 | % | |||||||||||||
| Companies | 240,501 | 264,511 | -9.1 | % | 262,255 | -8.3 | % | |||||||||||||
| Working Capital (3) | 96,087 | 107,850 | -10.9 | % | 110,880 | -13.3 | % | |||||||||||||
| BNDES/Onlending | 43,293 | 48,559 | -10.8 | % | 53,490 | -19.1 | % | |||||||||||||
| Export / Import Financing | 33,241 | 37,071 | -10.3 | % | 33,835 | -1.8 | % | |||||||||||||
| Vehicles | 3,945 | 4,253 | -7.3 | % | 5,595 | -29.5 | % | |||||||||||||
| Mortgage Loans | 10,980 | 10,966 | 0.1 | % | 10,337 | 6.2 | % | |||||||||||||
| Rural Loans | 8,796 | 9,393 | -6.4 | % | 7,795 | 12.8 | % | |||||||||||||
| Latin America (2) | 44,161 | 46,419 | -4.9 | % | 40,322 | 9.5 | % | |||||||||||||
| Total without Endorsements and Sureties | 445,467 | 473,829 | -6.0 | % | 468,105 | -4.8 | % | |||||||||||||
| Endorsements and Sureties | 72,017 | 74,244 | -3.0 | % | 75,289 | -4.3 | % | |||||||||||||
| Total with Endorsements and Sureties | 517,484 | 548,073 | -5.6 | % | 543,394 | -4.8 | % | |||||||||||||
| Corporate Private Securities (4) | 36,768 | 37,431 | -1.8 | % | 35,202 | 4.4 | % | |||||||||||||
| Total Risk | 554,252 | 585,504 | -5.3 | % | 578,596 | -4.2 | % | |||||||||||||
(1) Includes operations originated by the institution and acquired operations. (2) Includes Argentina, Chile, Colombia, Paraguay and Uruguay. (3) Also includes Overdraft, Receivables, Hot Money, Leasing, and other; (4) Includes Debentures, CRI and Commercial Paper.
At the end of the first quarter of 2016, our total credit portfolio (including sureties, endorsements and private securities) reached R$554,252 million, decreasing 5.3% from the previous quarter and 4.2% compared to the first quarter of 2015. Excluding the effect of the foreign exchange variation and corporate private securities, the loan portfolio, without endorsements and sureties, would have decreased 3.8% compared to the previous quarter and 6.3% in the 12-month period.
Individuals loan portfolio reached R$204,965 million at the end of the first quarter of 2016, with a 2.1% decrease from the previous quarter. In the quarter, the highlight was the growth in low-risk loan portfolios: 2.9% in payroll loans (mainly loans to INSS beneficiaries) and 2.1% in mortgage loans. On the other hand, vehicle portfolio decreased 9.4% due to a lower demand, and the credit card portfolio, with more conservative credit standards, decreased 6.3%. The Latin America portfolio decreased 4.8%, and reached R$21,003 million.
The companies loan portfolio decreased 9.1% in the first quarter of 2016, totaling R$240,501 million. The change in this portfolio is mainly driven by the decreases of 10.9% in working capital, of 10.8% in BNDES/Onlending, and of 10.3% in export-import financing. These decreases were due to a lower demand from companies, as a result of a more challenging economic scenario and by the appreciation of the Brazilian real against the U.S. dollar. The companies portfolio – Latin America decreased 4.9%, and reached R$44,161 million.
Credit Portfolio by Business Sector (including endorsements and sureties)
The changes in the companies loans portfolio, including the Latin America portfolio, are listed below:
| In R$ millions, end of period | 1Q16 | 4Q15 | change | |||||||||||||
| Public Sector | 4,507 | 4,648 | (141 | ) | -3.0 | % | ||||||||||
| Private Sector | Companies | 303,475 | 329,428 | (25,953 | ) | -7.9 | % | ||||||||||
| Real Estate | 21,202 | 21,124 | 78 | 0.4 | % | |||||||||||
| Vehicles and auto parts | 19,505 | 21,867 | (2,361 | ) | -10.8 | % | ||||||||||
| Food and beverage | 19,029 | 20,484 | (1,454 | ) | -7.1 | % | ||||||||||
| Agribusiness and fertilizers | 15,652 | 16,403 | (751 | ) | -4.6 | % | ||||||||||
| Transportation | 15,267 | 16,695 | (1,428 | ) | -8.6 | % | ||||||||||
| Energy and water treatment | 12,777 | 13,750 | (973 | ) | -7.1 | % | ||||||||||
| Steel and metallurgy | 11,887 | 13,234 | (1,347 | ) | -10.2 | % | ||||||||||
| Sugar and Alcohol | 10,553 | 11,028 | (475 | ) | -4.3 | % | ||||||||||
| Telecommunications | 9,680 | 9,614 | 65 | 0.7 | % | |||||||||||
| Banks and other financial institutions | 9,350 | 10,255 | (905 | ) | -8.8 | % | ||||||||||
| Petrochemical and chemical | 9,010 | 9,977 | (968 | ) | -9.7 | % | ||||||||||
| Capital Assets | 7,946 | 9,366 | (1,420 | ) | -15.2 | % | ||||||||||
| Mining | 7,521 | 8,214 | (693 | ) | -8.4 | % | ||||||||||
| Construction Material | 7,125 | 7,457 | (332 | ) | -4.5 | % | ||||||||||
| Infrastructure work | 6,301 | 6,745 | (444 | ) | -6.6 | % | ||||||||||
| Pharmaceutical and cosmetics | 6,272 | 6,791 | (519 | ) | -7.6 | % | ||||||||||
| Oil and gas | 5,965 | 6,497 | (533 | ) | -8.2 | % | ||||||||||
| Electronic and IT | 5,952 | 6,267 | (315 | ) | -5.0 | % | ||||||||||
| Clothing and footwear | 4,643 | 5,312 | (668 | ) | -12.6 | % | ||||||||||
| Services - Other | 29,096 | 31,397 | (2,301 | ) | -7.3 | % | ||||||||||
| Commerce - Other | 16,603 | 19,208 | (2,605 | ) | -13.6 | % | ||||||||||
| Industry - Other | 8,556 | 9,547 | (991 | ) | -10.4 | % | ||||||||||
| Other | 43,582 | 48,195 | (4,613 | ) | -9.6 | % | ||||||||||
| Total | 307,983 | 334,076 | (26,094 | ) | -7.8 | % | ||||||||||
| Itaú Unibanco Holding S.A. | 18 |
| Management Discussion & Analysis | Income Statement Analysis | |
Credit Concentration
Our loan, lease and other credit operations, including endorsements and sureties, are spread over our loan portfolio in a way that only 22.1% of the credit risk was concentrated on the 100 largest debtors at the end of the first quarter of 2016. The credit concentration of the 100 largest debtors (group consolidated) is as follows:
| In R$ millions, end of period | Risk | % of total credits | % of total Assets | |||||||||
| Largest Debtor | 4,155 | 0.8 | 0.3 | |||||||||
| 10 Largest Debtors | 33,084 | 6.4 | 2.4 | |||||||||
| 20 Largest Debtors | 50,638 | 9.8 | 3.7 | |||||||||
| 50 Largest Debtors | 85,397 | 16.5 | 6.3 | |||||||||
| 100 Largest Debtors | 114,344 | 22.1 | 8.4 | |||||||||
Renegotiated Loan Operations
According to the rules of CMN Resolution No. 2,682/99, balances of all contracts that have had changes to their original contractual terms should be reported as renegotiated loans. We segregate renegotiated loans, taking into account all types of renegotiation, either non overdue, overdue, or coming from the recovery of loans written off as losses, by overdue period measured at the moment of renegotiation, as shown below:
The NPL 90 days of total renegotiated loans operations reached 20.4% at the end of the first quarter of 2016, and the coverage ratio of these loans overdue for more than 90 days reached 184%. The evolution of these ratios is as follows:

On march 31, 2016, total renegotiated credit reached R$22,708 million, remaining relatively stable compared to the previous quarter.
| In R$ millions, end of period | Portfolio | LLP | % | |||||||||
| Total Renegotiated Loans Operations | 22,708 | (8,527 | ) | 37.5 | % | |||||||
| Loan Operations Renegotiated when up to 90 days overdue* | 14,098 | (3,529 | ) | 25.0 | % | |||||||
| Loan Operations Renegotiated when over 90 days overdue * | 8,610 | (4,997 | ) | 58.0 | % | |||||||
* Measured at the moment of renegotiation.
Further information on Note 8-d to our financial statements.
Loan operations renegotiated when over 90 days overdue reached R$8,610 million, an increase of R$328 million in the quarter. The ratio of allowance for loan losses to the total portfolio for these operations reached 58.0%.
Loan Portfolio by Origination Period
The chart below shows the evolution of our loan portfolio, excluding endorsements and sureties, by origination period (vintages).
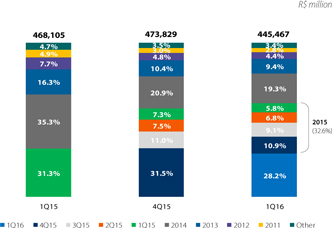
The reduction of 330 basis points in the origination volume in the quarter is driven by a lower credit demand from clients, as a result of a more challenging economic scenario and a seasonally larger volume of credit card products in the last quarter of the year.
| Itaú Unibanco Holding S.A. | 19 |
| Management Discussion & Analysis | Income Statement Analysis | |
Loan Portfolio Mix Evolution in Brazil (excluding endorsements and sureties)
Our loan portfolio mix presented below highlights its major components and their share in past quarters.
Loan Portfolio Mix - Companies
In the first quarter of 2016, the proportion of credits to very small, small and middle-market companies increased compared to credits to large companies in our loan portfolio mix. This increase was mainly driven by the impact of the appreciation of the Real against the U.S. dollar on the corporate loan portfolio.

Loan Portfolio Mix – Individuals
The evolution of our loan portfolio mix for individuals in past periods shows the growth of the payroll loan and mortgage loan portfolios, which currently represent the second and third largest balances in our individuals portfolio. The decrease in the share of vehicle financing is a result of the nominal balance reduction of this portfolio.

We present below additional information about Payroll Loans, Mortgage Loans and Vehicle Financing.
Payroll Loans
We operate in the payroll loans market through two different distribution channels: directly through our own distribution network (branches, CSBs and electronic channels) and through Banco Itaú BMG Consignado S.A., a financial institution controlled by us aimed at offering, distributing and marketing payroll loans. This operation started in December 2012 and enables us to expand our business in this segment, based on our values and transparency principles, following our good management practices and policies.
Evolution of the Payroll Loan Portfolio and NPL
At the end of March 2016, total payroll loans reached R$46,742 million, a 4.8% increase in twelve months. The highlight is the 16,0% increase in the portfolio of loans to retirees and pensioners of the INSS compared to the end of March 2015.
Payroll loans originated by the branch network totaled R$16,554 million on March 31, 2016, a 10.7% increase in twelve months, whereas payroll loans originated by other channels reached R$30,187 million, a 1.8% increase from the same period of the previous year.
Evolution of Payroll Loan Portfolio

Our strategy of higher growth in the INSS Beneficiaries segment, combined with the credit policies adopted, allowed the portfolio growth to be followed by a low delinquency levels over the last two years. A slower pace of the portfolio growth drove the recent increase in 90-day NPL ratio.
90-day NPL ratio (Mar -12 = 100) | Total Payroll Loan Portfolio

Note: Comparable to the National Financial System information disclosed by the Brazilian Central Bank.
Evolution of the Share of Payroll Loans in Personal Loans
The increase in the payroll loans balance allowed for a higher share of the personal loans, which reached 61.6% in this period from 59.9% in March 2015, a 170 basis point increase in twelve months.

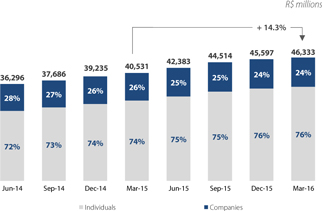
Mortgage Loans
Our mortgage portfolio reached R$46,333 million at the end of March 2016. Our portfolio increased 1.6% in the quarter and 14.3% in the past twelve months. The individuals portfolio, totaling R$35,353 million at the end of this quarter, increased 2.1% from the previous quarter and 17.1% in twelve months. At the end of March 2016, the companies portfolio totaled R$10,980 million, up 0.1% and 6.2%, respectively, from the previous quarter and the past twelve months.
Evolution of the Mortgage Portfolio
| Itaú Unibanco Holding S.A. | 20 |
| Management Discussion & Analysis | Income Statement Analysis | |
In the first quarter of 2016, the volume of new mortgage loan financing contracts for individuals was R$1,892 million, whereas financing to companies amounted to R$154 million, totaling R$2,046 million.
Origination Volume
| In R$ millions | 1Q16 | 4Q15 | change | 1Q15 | change | |||||||||||||||
| Individuals | 1,892 | 2,384 | -20.6 | % | 2,527 | -25.1 | % | |||||||||||||
| Companies | 154 | 702 | -78.0 | % | 614 | -74.9 | % | |||||||||||||
| Total | 2,046 | 3,086 | -33.7 | % | 3,142 | -34.9 | % | |||||||||||||
Source: ABECIP.
At the end of the first quarter of 2016, our individual mortgage loan portfolio collaterals, under the legal framework of fiduciary lien (alienação fiduciária), accounted for 99.6% of the portfolio. Since 2007, we have been using this framework for 100% of our contracts.
Our new financing contracts use the Equal Amortization System, through which decreasing installments lead to faster balance amortization, reducing the loan-to-value ratio (ratio of the amount of the financing to the value of the real estate property) at a faster pace than other amortization systems.
The portfolio loan-to-value (LTV) reached 43.9% at the end of March 2016. The average quarterly LTV of originated vintages reached 54.8%, down 50 basis points from the LTV of vintages originated in the fourth quarter of 2015 and down 470 basis points from the first quarter of 2015.
Loan–to-value | Vintage and Portfolio

In the current period, the 90-day NPL of the vintage originated in September 2015 reached 0.09%, remaining at levels that demonstrate the high quality of the portfolio.
NPL over 90 (%) | Six months after origination

Note: Loan portfolio to individuals.
Vehicle Financing
Our portfolio of vehicle financing to individuals amounted to R$18,105 million and to companies, R$3,945 million, totaling R$22,050 million on March 31, 2016.
This quarter, the average amount of vehicle financing to individuals originated by the branch network, dealerships and car retailers was R$24.7 thousand, with an average term of 39 months and average down payment of 42%. Both the average down payment and the financing term remained relatively stable in the past quarters, continuing at conservative levels.
Average Term and Down Payment - Individuals

New loans granted to individuals through our branches, dealerships and car retailers totaled R$1,807 million, whereas new loans granted to companies totaled R$353 million in the first quarter of 2016.
The loan-to-value of our vehicle portfolio reached 70.3% at the end of March 2016, continuing the declining trend of the past few quarters.
Loan–to-value | Portfolio (*)

(*) Loans originated by dealerships and car retailers to individuals and companies.
The 90-day NPL of vintages originated in November 2015 reached 0.32% in March 2016.
NPL over 90 (%) | Four months after origination

In this quarter, we received a monthly average of 14.8 million visits through iCarros, a classified ads website that facilitates the purchase and sale of new and used vehicles, a 6.4% increase compared to the month average of the previous quarter.
| Itaú Unibanco Holding S.A. | 21 |
| Management Discussion & Analysis | Income Statement Analysis | |
Result from Loan Losses
| In R$ millions | 1Q16 | 4Q15 | change | 1Q15 | change | |||||||||||||||||||||||
| Provision for Loan Losses | (7,231 | ) | (6,116 | ) | (1,115 | ) | 18.2 | % | (5,515 | ) | (1,716 | ) | 31.1 | % | ||||||||||||||
| Recovery of Loans Written Off as Losses | 829 | 1,482 | (652 | ) | -44.0 | % | 1,060 | (231 | ) | -21.8 | % | |||||||||||||||||
| Result from Loan Losses | (6,402 | ) | (4,634 | ) | (1,768 | ) | 38.1 | % | (4,455 | ) | (1,947 | ) | 43.7 | % | ||||||||||||||
In the first quarter of 2016, the result from loan losses (provision, net of recovery of loans written off as losses) totaled R$6,402 million, a 38.1% increase compared to the previous quarter, mainly due to the increase in provision for loan losses.
Provision for loan losses was up 18.2% compared to the previous quarter, partially driven by the increase in the generic allowance for specific economic groups, as a result of the challenging economic scenario.
Recovery of loans written off as losses decreased 44.0% from the fourth quarter of 2015. This decrease was mainly due to the recovery of loans written off as losses of a specific group of the corporate segment in the amount of R$488 million recognized in the fourth quarter of 2015. Excluding the effect of this operation in the previous quarter, income from recovery of loans written off as losses would have decreased 16.5% compared to the fourth quarter of 2015, due to typical seasonal effects early in the year.
Compared to the first quarter of 2015, result from loan losses recorded a 43.7% increase, mainly driven by a higher provision for loan losses, as a result of the challenging economic scenario. Additionally, income from recovery of loans written off as losses decreased 21.8% from the same period of the previous year.
Provision for Loan Losses by Segment

Note: Retail Banking includes loan loss provisions expenses of Corporation segment.
In the first quarter of 2016, provision for loan losses totaled R$4,323 million in the Retail segment, a 6.4% decrease from the previous quarter, and totaled R$2,908 million in the Wholesale segment, a 94.5% increase from the previous quarter. The increase in the Wholesale segment is mainly due to higher provisions for specific economic groups due to the challenging economic scenario.
Provision for Loan Losses and Loan Portfolio
In the first quarter of 2016, the ratio of the provision for loan losses to the loan portfolio reached 6.3%, an increase of 110 basis points from the previous quarter.
The ratio of the result from loan losses to loan portfolio reached 5.6% in this quarter, an increase of 160 basis points compared to the previous quarter.
Result from Loan Losses and Loan Portfolio

(*) Average balance of the Loan Portfolio of the two previous quarters.
Allowance for Loan Losses and Loan Portfolio

At the end of March 2016, the loan portfolio decreased 6.0% when compared to December 2015, totaling R$445,467 million, whereas the allowance for loan losses increased 5.7% in the quarter. The observed growth in the allowance for loan losses was mainly a result of the increase of 13.0% in the generic allowance. With this increase, related to specific economic groups, the ratio between the total allowance for loan losses to the loan portfolio went from 7.2% at the end of December 2015 to 8.1% at the end of March 2016, an increase of 90 basis points in the period.
The complementary allowance remained at R$10,985 million at the end of the first quarter of 2016. This amount includes provisions recognized for endorsements and sureties, which totaled R$713 million.
The ratio of the allowance for loan losses without the complementary allowance to the loan portfolio reached 5.6% on March 31, 2016, an increase of 70 basis points from December 2015.
| Itaú Unibanco Holding S.A. | 22 |
| Management Discussion & Analysis | Income Statement Analysis | |
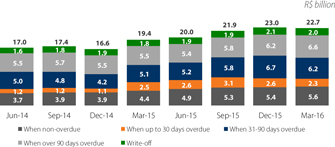
Delinquency Ratios
Nonperforming Loans
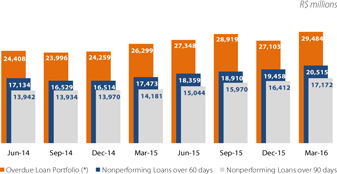
(*) Overdue loans are loan operations having at least one installment more than 14 days overdue, irrespective of collateral provided.
The overdue loan portfolio increased 8.8% from the fourth quarter of 2015 and 12.1% from March 2015. At the end of March 2016, the coverage ratio, which is the ratio of the allowance for loan losses to the total overdue loan portfolio, reached 122%, up 1,400 basis points compared to March 2015, mainly due to the increased complementary allowance for loan losses.
The portfolio of credits overdue for over 90 days increased 4.6% from the previous quarter, practically stable for individuals and up 14.0% for companies. Compared to March 2015, this portfolio increased 21.1%, up 21.7% for individuals and 19.9% for companies.
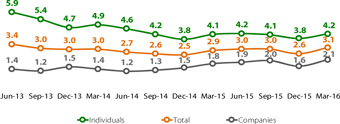
NPL Ratio (%) | over 90 days

The NPL ratio of credits overdue for over 90 days increased 40 basis points (or 30 basis points excluding the effect of foreign exchange variation) compared to the previous quarter and reached 3.9% in the end of March 2016. Compared to the same period of 2015, it recorded an increase of 90 basis points.
For individuals, this ratio increased 20 basis points (foreign exchange rate variation had no significant impact in the quarter) from the previous quarter, mainly due to the reduction of the credit card portfolio. Compared to March 2015, this ratio grew 110 basis points, mainly due to increased delinquency rates for personal loans and credit card products.
For companies, this ratio increased 50 basis points (or 40 basis points excluding the effect of foreign exchange variation) from December 2015, mainly in the industry and commerce and services.
NPL Ratio (%) | over 90 days
Corporate, Very Small, Small and Middle Market Companies

In this quarter, the 90-day NPL for large companies reached 1.3%, up 30 basis points (foreign exchange rate variation had no significant impact in the quarter) from the previous quarter.
The ratio for very small, small and middle-market companies increased 70 basis points (or 60 basis points excluding the effect of foreign exchange variation) from the previous quarter and reached 4.3% at the end of March 2016.
NPL Ratio (%) | 15 to 90 days
Short-term delinquency, measured based on the balance of operations overdue from 15 to 90 days (NPL 15-90), increased 50 basis points compared to December 2015.
In the quarter, the ratio for individuals increased 40 basis points and the highlight was the increase in personal loans and credit cards, due to the typical seasonal effects of the period.
For companies, the ratio increased 50 basis points from the previous quarter, mainly due to the increases in the industry and commerce and services sectors.
NPL Ratio by Activity Sector
| In R$ millions, end of | NPL 15-90 days | NPL Over 90 days | ||||||||||||||
| March 2016 | 1Q16 | 4Q15 | 1Q16 | 4Q15 | ||||||||||||
| Public Sector | 0.0 | % | 0.0 | % | 0.0 | % | 0.0 | % | ||||||||
| Private Sector | 3.1 | % | 2.6 | % | 3.9 | % | 3.5 | % | ||||||||
| Companies | 2.1 | % | 1.6 | % | 2.4 | % | 1.9 | % | ||||||||
| Industry and Commerce | 1.9 | % | 1.5 | % | 2.7 | % | 2.0 | % | ||||||||
| Services | 2.5 | % | 1.7 | % | 2.2 | % | 1.7 | % | ||||||||
| Primary Sector | 1.7 | % | 1.8 | % | 1.6 | % | 2.5 | % | ||||||||
| Other | 0.6 | % | 0.6 | % | 0.6 | % | 0.6 | % | ||||||||
| Individuals | 4.2 | % | 3.8 | % | 5.6 | % | 5.4 | % | ||||||||
| Total | 3.1 | % | 2.6 | % | 3.9 | % | 3.5 | % | ||||||||
Regarding the NPL by activity sector in March 2016, the 90-day NPL for industry and commerce was 2.7%, for services it was 2.2% and for the primary sector it was 1.6%. For further information on NPL Ratios by Activity, please refer to the Risk Management Report required by Circular No. 3,678 of the Brazilian Central Bank, of October 31, 2013, which is available on our Investor Relations website.
| Itaú Unibanco Holding S.A. | 23 |
| Management Discussion & Analysis | Income Statement Analysis | |
Coverage Ratio | 90 days
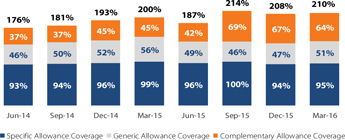
Note: Coverage ratio is derived from the division of the allowance for loans losses balance by the balance of operations more than 90 days overdue.
On March 31, 2016, the 90-day coverage ratio reached 210%, a 200 basis point increase compared to the previous quarter, mainly driven by the generic allowance, which was increased as a result of the challenging economic scenario.
Compared to March 2015, the 90-day coverage ratio increased 1,000 basis points, mainly due to the increased complementary allowance of R$4,655 million recognized in the third quarter of 2015.
Loan Portfolio Risk Level
Our credit risk management is aimed at maintaining the quality of the loan portfolio at levels appropriate for each market segment in which we operate.
We improved the guarantee control system to capture the updated market values for these individual operations. Therefore, operations with guarantees where the updated amount exceeds the debt balance are classified at better risk levels. On the other hand, operations with guarantees where the updated amount is insufficient to mitigate the entire risk are classified at worse risk levels.
On March 31, 2016, the portfolios rated “AA” and “A” accounted for 77.8% of the total loan portfolio, compared to 79.6% in December 2015.
Total loans rated from "D" and "H" accounted for 9.6% of total loans, 90 basis points higher than that recorded in the previous quarter.
Loan Portfolio Evolution by Risk Level

Note: Does not include endorsements and sureties.
Loan Portfolio Write-Off
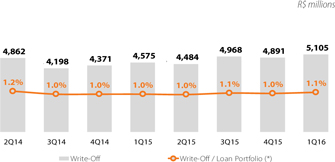
(*) Loan portfolio average balance for the previous two quarters.
In the first quarter of 2016, the loan portfolio write-off totaled R$5,105 million, a 4.4% increase compared to the previous quarter.
The ratio of written-off operations to the average balance of the credit portfolio reached 1.1%, practically unchanged from the fourth quarter of 2015.
Recovery of Loans Written off as Losses

In the first quarter of 2016, income from recovery of loans written off as losses decreased R$652 million, or 44.0%, from the previous quarter, mainly due to the recovery of loans written off as losses of a specific group of the corporate segment, in the amount of R$488 million, recognized in the fourth quarter of 2015.
Compared to the first quarter of 2015, income from recovery of loans written off as losses decreased R$231 million, or 21.8%, mainly due to the challenging economic scenario.
| Itaú Unibanco Holding S.A. | 24 |
| Management Discussion & Analysis | Income Statement Analysis | |
Commissions and Fees and Result from Insurance, Pension Plan and Premium Bonds
| In R$ millions | 1Q16 | 4Q15 | change | 1Q15 | change | |||||||||||||||||||||||
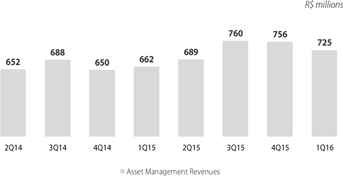
| Asset Management | 725 | 756 | (31 | ) | -4.1 | % | 662 | 63 | 9.5 | % | ||||||||||||||||||
| Current Account Services | 1,607 | 1,623 | (16 | ) | -1.0 | % | 1,405 | 203 | 14.4 | % | ||||||||||||||||||
| Credit Operations and Guarantees Provided | 766 | 840 | (74 | ) | -8.8 | % | 800 | (35 | ) | -4.3 | % | |||||||||||||||||
| Collection Services | 371 | 382 | (11 | ) | -2.8 | % | 365 | 6 | 1.5 | % | ||||||||||||||||||
| Credit Cards | 2,998 | 3,204 | (206 | ) | -6.4 | % | 2,884 | 114 | 3.9 | % | ||||||||||||||||||
| Other | 702 | 840 | (138 | ) | -16.4 | % | 750 | (48 | ) | -6.4 | % | |||||||||||||||||
| Commissions and Fees | 7,169 | 7,645 | (476 | ) | -6.2 | % | 6,867 | 303 | 4.4 | % | ||||||||||||||||||
| Result from Insurance, Pension Plan and Premium Bonds | 1,551 | 1,607 | (55 | ) | -3.5 | % | 1,482 | 69 | 4.7 | % | ||||||||||||||||||
| Total | 8,720 | 9,251 | (531 | ) | -5.7 | % | 8,349 | 372 | 4.5 | % | ||||||||||||||||||
| (-) Result from Other Insurance Activities(*) | 105 | 152 | (47 | ) | -31.1 | % | 85 | 20 | 23.8 | % | ||||||||||||||||||
| Total excluding Other Insurance Activities(*) | 8,616 | 9,099 | (484 | ) | -5.3 | % | 8,264 | 352 | 4.3 | % | ||||||||||||||||||
In the first quarter of 2016, commissions and fees amounted to R$7,169 million, a 6.2% decrease compared to the previous quarter. Compared to the first quarter of 2015, these revenues increased 4.4%, mainly driven by higher revenues from current account services and credit card.
In the first quarter of 2016, these revenues, combined with the result from insurance, pension plan and premium bonds, totaled R$8,720 million, a 5.7% decrease from the previous quarter and a 4.5% increase from the same period of the previous year.
Excluding the result from other insurance activities(*), our revenues reached R$8,616 million in the quarter, a decrease of 5.3% from the fourth quarter of 2015 and an increase of 4.3% from the same period of the previous year.
(*) Other insurance activities include extended warranty, health insurance, other products and our stake in IRB.
Asset Management
Asset management revenues totaled R$725 million in the first quarter of 2016, a decrease of 4.1% from the previous quarter, mainly driven by the smaller number of business days in the quarter.
Compared to the first quarter of 2015, these revenues recorded a 9.5% increase mainly driven by the higher volume of consortium and fund management operations.
Asset Administration
In the first quarter of 2016, fund management fees amounted to R$555 million, a 4.0% decrease compared to the fourth quarter of 2015, mainly due to the smaller number of business days in the quarter.
In March 2016, assets under administration totaled R$807 billion, with increases of 5.5% from the previous quarter and of 16.2% from the same period of the previous year.
According to the ANBIMA ranking, in March 2016 we were second in the fund management and managed portfolio* ranking, with a 21.5% market share.
* Includes Itaú Unibanco and Intrag.

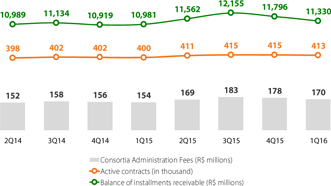
Consortia Administration Fees
Consortia administration fees totaled R$170 million in the first quarter of 2016, decreasing 4.4% from the fourth quarter of 2015. Compared to the same period of the previous year, a 10.6% increase was recorded, mainly driven by the growth in the consortia market and campaigns carried out internally.
In March 2016, we reached approximately 413 thousand active contracts, a 3.2% increase from the same period of the previous year.
In March 2016, the balance of installments receivable reached R$11.3 billion, a 4.0% decrease from December 2015 and a 3.2% increase from March 2015.
| Itaú Unibanco Holding S.A. | 25 |
| Management Discussion & Analysis | Income Statement Analysis | |
Current Account Services
In the first quarter of 2016, revenues from current account services totaled R$1,607 million, remaining relatively stable compared to the previous period.
These fees increased 14.4% compared to the same period of the previous year. This increase in revenues from current account services are mainly due to the offering of differentiated products and services aimed at adding more value to our clients’ experience with the bank. These products include differentiated current account service packages for individuals and the convenience and versatility of the “Conta Certa” products offered to companies.

Loan Operations and Guarantees Provided
In the first quarter of 2016, revenues from loan operations and guarantees provided totaled R$766 million, a decrease of 8.8% from the fourth quarter of 2015, mainly due to the lower volume of loan operations, and to the typical seasonality of the period. Compared to the same period of the previous year, the decrease was 4.3%.

In the first quarter of 2016, the ratio of annual revenues from loan operations to the loan portfolio without endorsement and sureties reached 0.4% p.a.
The ratio of annual revenues from guarantees provided to the endorsements and sureties portfolio reached 1.8% p.a.
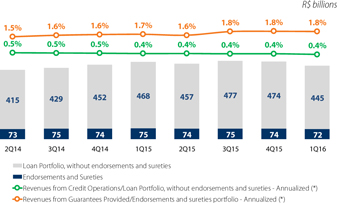
(*) Loan portfolio average balance from two previous quarters.
Collection Services
Revenues from collection services reached R$371 million in the first quarter of 2016, decreasing 2.8% from the fourth quarter of 2015, due to the typical seasonality of the period. Compared to the same period of the previous year, these revenues increased 1.5%.
Credit Cards
Credit card revenues totaled R$2,998 million in the first quarter of 2016, a 6.4% decrease from the previous quarter, as a result of the favorable seasonality for the fourth quarter, which is marked by higher interchange revenues from the year-end sales.
Compared to the same period of the previous year, these revenues increased 3.9%, mainly driven by higher transaction volume and higher revenues from equipment rented.
The proportion of credit card revenues related to card issuance corresponds to 52.4% of total revenues.

Transaction Volume and Card Accounts | Credit and Debit Cards
Through proprietary and partnership operations, we offer a wide range of credit and debit cards to approximately 59.1 million current account holders and non-account holders (in number of accounts). In the first quarter of 2016, the volume of transactions amounted to R$82.0 billion, a 4.3% increase from the same period of 2015.
We are the leading player in the Brazilian credit card market, through Itaucard, Hipercard, Hiper, Credicard, joint ventures and commercial agreements with leading companies in sectors such as telecom, vehicles, retail and aviation in the Brazilian market, totaling 33.2 million client accounts, including both account and non-account holders.
In the first quarter of 2016, the volume of credit card transactions amounted to R$60.3 billion, a 2.2% increase from the same period of the previous year.
In the debit card segment, which includes current account holders only, we have 26.0 million accounts. The volume of debit card transactions amounted to R$21.6 billion in the first quarter of 2016, a 10.4% increase from the same period of the previous year.
| Itaú Unibanco Holding S.A. | 26 |
| Management Discussion & Analysis | Income Statement Analysis | |
Transaction Volume and Card Accounts | Credit and Debit Cards

Acquiring Services
Our merchant acquiring business comprises the process of capturing transactions through the affiliation, management and relationship with commercial establishments through the company REDE.
In the first quarter of 2016, the transaction volume totaled R$92.9 billion, an 11.1% decrease from the previous quarter, mainly due to the favorable seasonality of the fourth quarter. Compared to the same period of the previous year, the increase in volume was 1.9%.
Transaction Volume | Credit and Debit Cards
In the first quarter of 2016, the volume of credit card transactions was R$60.0 billion, representing 64.6% of the total volume of transactions generated by the acquiring services, a 10.6% decrease from the fourth quarter of 2015 and a 1.8% increase from the same period of the previous year.
In addition to the transaction volume mentioned above, we captured and processed over R$1.3 billion in transactions within our retail partners and joint ventures in the first quarter of 2016.
In the first quarter of 2016, the volume of debit card transactions was R$32.9 billion, accounting for 35.4% of the total transaction volume, an 11.9% decrease from the fourth quarter of 2015 and a 2.1% increase from the same period of the previous year.
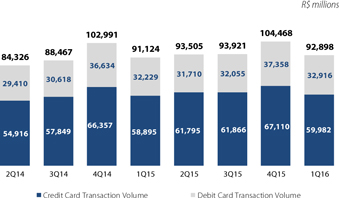
Equipment Base(*)
At the end of the first quarter of 2016, our base of active installed equipment reached 1,755 thousand units, with decreases of 6.4% from the previous quarter and of 3.9% from the first quarter of 2015.

(*)100% of REDE’s equipment base is able to capture Hiper brand transactions.
Other
| In R$ millions | 1Q16 | 4Q15 | change | |||||||||
| Foreign Exchange Services | 22 | 23 | (0 | ) | ||||||||
| Brokerage and Securities Placement | 85 | 93 | (7 | ) | ||||||||
| Custody Services and Portfolio Management | 83 | 86 | (3 | ) | ||||||||
| Economic and Financial Advisory Services | 99 | 198 | (99 | ) | ||||||||
| Other Services | 413 | 440 | (28 | ) | ||||||||
| Total | 702 | 840 | (138 | ) | ||||||||
Compared to the previous quarter, revenues from economic and financial advisory services decreased due to lower revenues from investment banking, and revenues from other services reduced, as a result of the foreign exchange rate variation in the foreign units.
Commissions and Fees and Result from Insurance, Pension Plan and Premium Bonds
In the first quarter of 2016, the ratio of total commissions and fees added to the result from insurance, pension plan and premium bonds, divided by these total revenues added to the managerial financial margin, reached 34.5%.
In this quarter, the operational coverage ratio, which represents the extent to which non-interest expenses were covered by commissions and fees added to the result from insurance, pension plans and premium bonds, reached 85.4%, an increase of 220 basis points compared to the previous quarter, mainly driven by lower non-interest expenses.
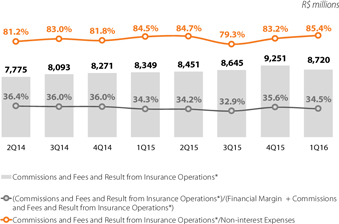
(*) Insurance Operations include insurance, pension plan and premium bonds.
| Itaú Unibanco Holding S.A. | 27 |
| Management Discussion & Analysis | Itaú Insurance, Pension Plan and Premium Bonds | |
Itaú Insurance, Pension Plan and Premium Bonds
The Pro Forma financial statements below were prepared based on Itaú Unibanco’s managerial information and are intended to explain the performance of the insurance-related business.
The disclosure of the results from Itaú Insurance, Pension Plan and Premium Bonds is broken down into Core Activities and Other Activities.
The capital allocation criteria for insurance, pension plan and premium bonds operations used in the managerial model is based on the BACEN regulatory model. As of the first quarter of 2016, we have started to allocate the effect of the of Basel III rules schedule anticipation to the lines of business.
Sales Cost Model
Itaú Unibanco’s practice is to allocate the selling costs to all of our products and services based on the corresponding utilization of each channel (full allocation method). For that reason, the selling costs related to insurance, pension plan and premium bonds products in our branch network and other electronic or physical distribution channels are recorded in our income statement for the insurance segment. This practice has both accounting and managerial effects.
Pro Forma Recurring Income Statement of Insurance Operations
| 1Q16 | 4Q15 | change | 1Q15 | change | ||||||||||||||||||||||||||||||||||||||||||||||||
| In R$ millions | Total | Core Activities | Other Activities | Total | Core Activities | Other Activities | Total | Core Activities | Total | Core Activities | Other Activities | Total | Core Activities | |||||||||||||||||||||||||||||||||||||||
| Earned Premiums | 1,299 | 1,000 | 298 | 1,359 | 1,009 | 350 | -4.4 | % | -0.9 | % | 1,416 | 1,035 | 381 | -8.3 | % | -3.3 | % | |||||||||||||||||||||||||||||||||||
| Revenues from Pension Plan and Premium Bonds | 260 | 260 | - | 247 | 247 | - | 5.1 | % | 5.1 | % | 202 | 202 | - | 28.2 | % | 28.2 | % | |||||||||||||||||||||||||||||||||||
| Retained Claims | (394 | ) | (298 | ) | (97 | ) | (406 | ) | (309 | ) | (98 | ) | -3.0 | % | -3.6 | % | (368 | ) | (257 | ) | (111 | ) | 7.0 | % | 15.7 | % | ||||||||||||||||||||||||||
| Selling Expenses | (196 | ) | (25 | ) | (170 | ) | (258 | ) | (46 | ) | (212 | ) | -24.1 | % | -45.0 | % | (266 | ) | (41 | ) | (225 | ) | -26.4 | % | -38.6 | % | ||||||||||||||||||||||||||
| Result from Insurance, Pension Plan and Premium Bonds | 969 | 937 | 31 | 942 | 901 | 40 | 2.8 | % | 4.0 | % | 984 | 939 | 45 | -1.5 | % | -0.2 | % | |||||||||||||||||||||||||||||||||||
| Managerial Financial Margin | 290 | 233 | 56 | 270 | 203 | 68 | 7.1 | % | 15.1 | % | 196 | 156 | 40 | 47.7 | % | 49.5 | % | |||||||||||||||||||||||||||||||||||
| Commissions and Fees | 435 | 433 | 3 | 443 | 443 | (1 | ) | -1.6 | % | -2.3 | % | 394 | 393 | 1 | 10.6 | % | 10.2 | % | ||||||||||||||||||||||||||||||||||
| Earnings of Affiliates | 90 | 62 | 27 | 121 | 70 | 51 | -25.8 | % | -11.3 | % | 66 | 61 | 5 | 35.8 | % | 2.3 | % | |||||||||||||||||||||||||||||||||||
| Non-interest Expenses | (430 | ) | (397 | ) | (33 | ) | (526 | ) | (449 | ) | (77 | ) | -18.2 | % | -11.4 | % | (470 | ) | (428 | ) | (42 | ) | -8.5 | % | -7.2 | % | ||||||||||||||||||||||||||
| Tax Expenses for ISS, PIS and Cofins and other taxes | (83 | ) | (72 | ) | (11 | ) | (85 | ) | (70 | ) | (16 | ) | -2.5 | % | 3.9 | % | (83 | ) | (69 | ) | (15 | ) | -0.4 | % | 5.0 | % | ||||||||||||||||||||||||||
| Income before Tax and Minority Interests | 1,270 | 1,196 | 74 | 1,165 | 1,100 | 65 | 9.0 | % | 8.8 | % | 1,086 | 1,052 | 34 | 17.0 | % | 13.7 | % | |||||||||||||||||||||||||||||||||||
| Income Tax/Social Contribution and Minority Interests | (493 | ) | (482 | ) | (10 | ) | (498 | ) | (503 | ) | 5 | -1.2 | % | -4.1 | % | (398 | ) | (388 | ) | (10 | ) | 23.7 | % | 24.3 | % | |||||||||||||||||||||||||||
| Recurring Net Income | 778 | 714 | 64 | 667 | 597 | 70 | 16.7 | % | 19.6 | % | 688 | 664 | 24 | 13.1 | % | 7.5 | % | |||||||||||||||||||||||||||||||||||
| Allocated Capital | 4,083 | 3,676 | 408 | 1,913 | 1,729 | 184 | 113.4 | % | 112.6 | % | 2,109 | 1,892 | 217 | 93.6 | % | 94.3 | % | |||||||||||||||||||||||||||||||||||
| Recurring Return on Allocated Capital | 103.7 | % | 105.6 | % | 86.6 | % | 142.2 | % | 140.5 | % | 158.9 | % | -3,850 | bps | -3,480 | bps | 111.0 | % | 131.5 | % | 20.9 | % | -730 | bps | -2,590 | bps | ||||||||||||||||||||||||||
| Efficiency Ratio (ER) | 25.3 | % | 24.9 | % | 30.6 | % | 31.1 | % | 29.0 | % | 54.1 | % | -580 | bps | -400 | bps | 30.2 | % | 28.9 | % | 55.3 | % | -490 | bps | -400 | bps | ||||||||||||||||||||||||||
| Combined Ratio | 68.1 | % | 57.4 | % | 104.0 | % | 74.0 | % | 59.7 | % | 114.9 | % | -590 | bps | -240 | bps | 68.2 | % | 55.4 | % | 103.2 | % | -10 | bps | 200 | bps | ||||||||||||||||||||||||||
Note: Combined Ratio for insurance activities. Non-interest Expenses comprise Personnel Expenses, Other Administrative Expenses and Other Operating Expenses.
Our core activities consist of mass-market products related to Life, Property, Credit Life, Pension Plan and Premium Bonds. Other insurance activities correspond to Extended Warranty, Health Insurance, our stake in IRB and other.
We continue to concentrate efforts on distribution through our own channels, giving priority to sales through the most efficient channels, which positively affects our profitability. Sales of insurance products and premium bonds through bankfone, bankline/internet, ATMs and teller terminals accounted for 47.3% of sales to account holders in the quarter. Sales of premium bonds through these channels accounted for 72.6% of total sales in the period. In the first quarter of 2016, the amount of sales of insurance products and premium bonds to clients of the Digital Branches accounted for 7.5% of total sales.
Recurring net income from Insurance Operations reached R$778 million in the first quarter of 2016, increasing 16.7% from the previous quarter and 13.1% from the same period of the previous year.
Recurring net income from core activities was R$714 million in the first quarter of 2016, a 19.6% increase from the fourth quarter of 2015, mainly due to the increase in the managerial financial margin and the decrease in non-interest expenses. Compared to the same period of the previous year, the increase was 7.5%.
Recurring net income for other insurance activities reached R$64 million in the quarter, a decrease of 8.4% from the previous quarter, mainly driven by the lower earnings from affiliates due to our stake in IRB, and the reduction of earned premiums, partially offset by lower selling expenses.
The annualized recurring return for insurance operations reached 103.7% in the period, a decrease of 3,850 basis points compared to the previous quarter, due to the increase in allocated capital(1). The insurance ratio, which represents the ratio of recurring net income from insurance, pension plan and premium bonds operations to Itaú Unibanco’s recurring net income, reached 14.9%, a 330 basis points increase from December 2015.
Insurance Ratio(2) and ROE | Insurance Operations

(1) As of the first quarter of 2016, we have started to allocate the effect of the of Basel III rules schedule anticipation to the lines of business.
(2) Insurance Ratio (%) = Recurring net income from Insurance, Pension Plan and Premium Bonds operations / Itaú Unibanco’s recurring net income.
| Itaú Unibanco Holding S.A. | 28 |
| Management Discussion & Analysis | Itaú Insurance, Pension Plan and Premium Bonds | |
Breakdown of Recurring Net Income | Insurance Operations

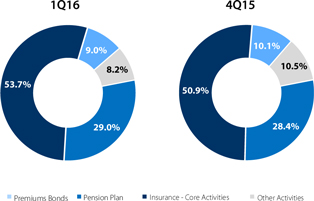
In the first quarter of 2016, the ratio of the result of core activities to the recurring net income from Itaú Insurance, Pension Plan and Premium Bonds reached 91.8%.
Combined Ratio | Insurance Activities

Note: The combined ratio of insurance activities is the sum of retained claims, selling expenses, administrative expenses, other operating income and expenses, tax expenses for ISS, PIS and Cofins and other taxes on earned premiums.
The combined ratio, which reflects the operating cost as a percentage of income from earned premiums, reached 68.1% in the period, a decrease of 590 basis points from the previous quarter, mainly driven by the decrease in non-interest expenses and selling expenses. Compared to the same period of the previous year, this ratio decreased 10 basis points.
Extended Combined Ratio | Insurance Activities
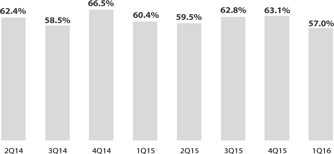
Note: The extended combined ratio is the sum of retained claims, selling expenses, administrative expenses, other operating income and expenses, tax expenses for ISS, PIS and Cofins and other taxes on the sum of earned premiums, managerial financial margin and commissions and fees.
The extended combined ratio, which reflects the operating cost as a percentage of income from earned premiums, managerial financial margin and commissions and fees, reached 57.0% in the first quarter of 2016, a decrease of 610 basis points from the previous quarter, mainly driven by the decrease in non-interest expenses and selling expenses.
Efficiency Ratio

The efficiency ratio was 25.3% in the first quarter of 2016, a decrease of 580 basis points from the previous quarter. Considering only our core activities, the efficiency ratio reached 24.9% in the period.
Breakdown of Technical Provisions | Insurance Operations

Technical provisions, including insurance, pension plan and premium bonds, totaled R$137.7 billion in the period, representing increases of 4.3% from the previous quarter and of 17.9% from the first quarter of 2015.
| Itaú Unibanco Holding S.A. | 29 |
| Management Discussion & Analysis | Insurance Core Activities | |
Pro Forma Recurring Income Statement of the Insurance Segment | Core Activities
| In R$ millions | 1Q16 | 4Q15 | change | 1Q15 | change | |||||||||||||||||||||||
| Earned Premiums | 1,000 | 1,009 | (9 | ) | -0.9 | % | 1,035 | (35 | ) | -3.3 | % | |||||||||||||||||
| Retained Claims | (293 | ) | (296 | ) | 4 | -1.2 | % | (253 | ) | (40 | ) | 15.8 | % | |||||||||||||||
| Selling Expenses | (25 | ) | (47 | ) | 22 | -46.9 | % | (40 | ) | 15 | -37.8 | % | ||||||||||||||||
| Underwriting Margin | 683 | 666 | 17 | 2.5 | % | 742 | (60 | ) | -8.0 | % | ||||||||||||||||||
| Managerial Financial Margin | 95 | 63 | 33 | 52.2 | % | 40 | 55 | 136.3 | % | |||||||||||||||||||
| Commissions and Fees | 97 | 103 | (6 | ) | -5.7 | % | 103 | (5 | ) | -5.3 | % | |||||||||||||||||
| Earnings of Affiliates | 62 | 70 | (8 | ) | -11.3 | % | 61 | 1 | 2.3 | % | ||||||||||||||||||
| Non-interest Expenses | (215 | ) | (219 | ) | 5 | -2.2 | % | (237 | ) | 22 | -9.3 | % | ||||||||||||||||
| Tax Expenses for ISS, PIS and Cofins and other taxes | (42 | ) | (41 | ) | (1 | ) | 3.0 | % | (44 | ) | 2 | -4.8 | % | |||||||||||||||
| Income before Tax and Minority Interests | 681 | 642 | 39 | 6.1 | % | 666 | 15 | 2.3 | % | |||||||||||||||||||
| Income Tax/Social Contribution and Minority Interests | (264 | ) | (303 | ) | 39 | -12.9 | % | (239 | ) | (25 | ) | 10.3 | % | |||||||||||||||
| Recurring Net Income | 418 | 339 | 78 | 23.0 | % | 427 | (9 | ) | -2.2 | % | ||||||||||||||||||
| Efficiency Ratio (ER) | 23.9 | % | 25.5 | % | -150 | bps | 26.2 | % | -230 | bps | ||||||||||||||||||
Our insurance core activities consist of mass-market products related to Life, Property and Credit Life. These products are offered in synergy in retail channels - branch network, partnership with retailers, credit card clients, mortgage loans, vehicle financing, personal and payroll loans - and in the wholesale channel. These products have characteristics such as low loss ratio, low volatility in the result and less use of capital, making them strategic and increasingly relevant in the diversification of the conglomerate’s revenues.
Net Income | Insurance Core Activities

In the first quarter of 2016, recurring net income from core activities was R$418 million, a 23.0% increase from the previous quarter, mainly driven by the increase in the managerial financial margin and the decrease in insurance selling expenses.
Earned Premiums Breakdown | Insurance Core Activities
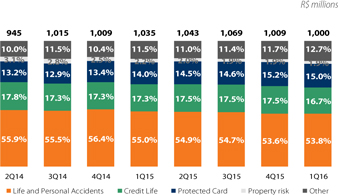
In the first quarter of 2016, earned premiums from core insurance activities reached R$1,000 million, a 0.9% decrease from the previous quarter, partially driven by the credit life product, mainly related to decrease in the credit volume.
Considering only our core activities, which include our 30% stake in Porto Seguro, the earned premiums market share of the total core insurance market reached 13.5% in the 2016 year-to-date(*). Regarding the technical result of insurance core activities, our market share reached 17.7% in the 2016 year-to-date(*).
Retained Claims Breakdown | Insurance Core Activities

In the first quarter of 2016, retained claims from insurance core activities amounted to R$293 million, a 1.2% decrease from the previous quarter, mainly driven by life products.
Underwriting Margin | Insurance Core Activities

In the first quarter of 2016, the underwriting margin from our insurance core activities amounted to R$683 million, a 2.5% increase from the previous quarter, mainly driven by lower selling expenses. In the first quarter of 2016, the ratio of underwriting margin to earned premiums reached 68.3%, up 230 basis points from the fourth quarter of 2015.
(*) Most recent data available on February 29, 2016, based on information disclosed by SUSEP.
| Itaú Unibanco Holding S.A. | 30 |
| Management Discussion & Analysis | Insurance Core Activities and Pension Plan | |
Combined Ratio | Insurance Core Activities
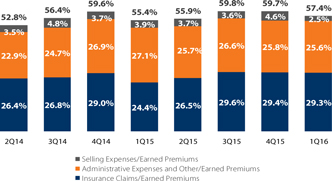
Note: The combined ratio is the sum of retained claims, selling expenses, administrative expenses, other operating income and expenses, tax expenses for ISS, PIS and Cofins and other taxes on earned premiums.
The combined ratio, which reflects the operating cost as a percentage of income from earned premiums, reached 57.4% in the period, a decrease of 240 basis points from the previous quarter, mainly driven by the decrease in insurance selling expenses.
The extended combined ratio, which reflects the operating cost as a percentage of income from earned premiums, managerial financial margin and commissions and fees, reached 48.1% in the first quarter of 2016, a decrease of 320 basis points from the previous quarter, mainly driven by the increase in the managerial financial margin.
Extended Combined Ratio | Insurance Core Activities
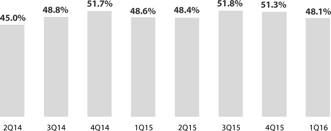
Note: The extended combined ratio is the sum of retained claims, selling expenses, administrative expenses, other operating income and expenses, tax expenses for ISS, PIS and Cofins and other taxes on the sum of earned premiums, managerial financial margin and commissions and fees.
Efficiency Ratio | Insurance Core Activities

In the first quarter of 2016, the efficiency ratio reached 23.9%, a decrease of 150 basis points from the previous quarter.
Pro Forma Recurring Income Statement of the Pension Plan Segment
| In R$ millions | 1Q16 | 4Q15 | change | 1Q15 | change | |||||||||||||||||||||||
| Revenues from Pension Plan | 110 | 88 | 22 | 25.3 | % | 76 | 34 | 45.3 | % | |||||||||||||||||||
| Retained Claims | (5 | ) | (12 | ) | 7 | -60.9 | % | (4 | ) | (0 | ) | 9.9 | % | |||||||||||||||
| Selling Expenses | (1 | ) | (1 | ) | 0 | -1.8 | % | (2 | ) | 1 | - | |||||||||||||||||
| Result from Pension Plan | 104 | 75 | 30 | 39.5 | % | 70 | 35 | 49.8 | % | |||||||||||||||||||
| Managerial Financial Margin | 78 | 67 | 11 | 16.5 | % | 62 | 16 | 25.0 | % | |||||||||||||||||||
| Commissions and Fees | 336 | 340 | (4 | ) | -1.2 | % | 291 | 45 | 15.5 | % | ||||||||||||||||||
| Non-interest Expenses | (108 | ) | (127 | ) | 19 | -14.6 | % | (110 | ) | 1 | -1.4 | % | ||||||||||||||||
| Tax Expenses for ISS, PIS and Cofins and other taxes | (23 | ) | (20 | ) | (2 | ) | 11.1 | % | (18 | ) | (4 | ) | 24.5 | % | ||||||||||||||
| Income before Tax and Minority Interests | 388 | 335 | 53 | 15.8 | % | 295 | 92 | 31.3 | % | |||||||||||||||||||
| Income Tax/Social Contribution and Minority Interests | (162 | ) | (145 | ) | (17 | ) | 11.6 | % | (113 | ) | (49 | ) | 43.3 | % | ||||||||||||||
| Recurring Net Income | 225 | 190 | 36 | 18.9 | % | 182 | 43 | 23.8 | % | |||||||||||||||||||
| Efficiency Ratio (ER) | 21.8 | % | 27.5 | % | -560 | bps | 27.1 | % | -530 | bps | ||||||||||||||||||
Product and advisory service innovation has played a significant role in the sustainable growth of our pension plan operations for individuals. For companies, we offer specialized advisory services and develop customized solutions. We establish long-term partnerships with our corporate clients, keeping a close relationship with the human resources departments and adopting a communication strategy designed for the financial education of their employees.
In the first quarter of 2016, the Pension Plan segment’s recurring net income reached R$225 million, an increase of 18.9% from the previous quarter, mainly driven by higher net pension plan contribution and lower non-interest expenses.
When compared to the same period of the previous year, it recorded a 23.8% increase, mainly driven by higher net pension plan contributions and revenues from administration fees.
Revenues from Administration Fees
In the first quarter of 2016, revenues from administration fees totaled R$336 million, which represented a 1.2% decrease from the previous quarter and a 15.5% increase from the first quarter of 2015.

| Itaú Unibanco Holding S.A. | 31 |
| Management Discussion & Analysis | Pension Plan and Premium Bonds | |
Pension Plan Technical Provisions and Redemption Rate

On March 31, 2016, technical provisions for pension plan totaled R$130.1 billion, with increases of 4.8% from December 31, 2015 and of 20.3% compared to the same period of the previous year.
According to the National Federation of Pension and Life Insurance (FENAPREVI), in February 2016 our market share in total technical provisions was 23.5%, whereas our market share in plans for individuals was 23.7%, decreasing 40 and 50 basis points, respectively, from the same period of the previous year.
The redemption rate, which represents the ratio of redemptions to the balance of technical provisions for pension plans, reached 2.1%, remaining stable compared to the fourth quarter of 2015.
Total and Net Pension Plan Contributions(1)
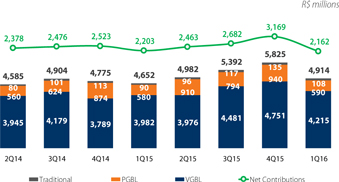
In the quarter, total pension plan contributions reached R$4,914 million, decreasing 15.6% from the previous quarter, mainly driven by typically seasonable effects of the period. Compared to the same period of the previous year, there was an increase of 5.6%. In the first quarter of 2016, net pension plan contributions reached R$2,162 million, a 31.8% decrease from the fourth quarter of 2015.
(1) Total pension plan contributions = Contributions (+) Portability requests accepted. Net pension plan contributions = Contributions (+) Portability requests accepted (-) Redemptions (-) Portability requests assigned.
Pro Forma Recurring Income Statement of the Premium Bonds Segment
| In R$ millions | 1Q16 | 4Q15 | change | 1Q15 | change | |||||||||||||||||||||||
| Revenues from Premium Bonds | 150 | 159 | (10 | ) | -6.0 | % | 127 | 23 | 18.0 | % | ||||||||||||||||||
| Managerial Financial Margin | 60 | 73 | (13 | ) | -17.9 | % | 54 | 7 | 12.6 | % | ||||||||||||||||||
| Non-interest Expenses | (74 | ) | (102 | ) | 28 | -27.2 | % | (82 | ) | 7 | -8.9 | % | ||||||||||||||||
| Tax Expenses for ISS, PIS and Cofins and other taxes | (8 | ) | (9 | ) | 1 | -9.2 | % | (7 | ) | (1 | ) | 16.3 | % | |||||||||||||||
| Income before Tax and Minority Interests | 127 | 122 | 5 | 3.7 | % | 91 | 36 | 40.2 | % | |||||||||||||||||||
| Income Tax/Social Contribution and Minority Interests | (57 | ) | (55 | ) | (2 | ) | 3.1 | % | (36 | ) | (21 | ) | 56.9 | % | ||||||||||||||
| Recurring Net Income | 70 | 68 | 3 | 4.2 | % | 54 | 16 | 29.2 | % | |||||||||||||||||||
| Efficiency Ratio (ER) | 37.0 | % | 45.5 | % | -850 | bps | 47.5 | % | -1,050 | bps | ||||||||||||||||||
The PIC Premium Bonds product is targeted at clients who are interested in competing for prizes. This product can be purchased through single payment or monthly payment modality, in accordance with the profile and segment of each client. The premium bonds business serves a large public demand and, at the end of the first quarter of 2016, had issued 13.7 million certificates.
In line with our sustainability principles, we have a partnership with Ayrton Senna Institute, a non-profit organization that works to improve the quality of education at public schools in Brazil. Part of the revenues from the monthly payments for premium bonds certificates is transferred to projects of this Institute.
In the first quarter of 2016, 605 clients received prizes in the aggregate amount of R$15.7 million. Total sales of premium bonds under the traditional mode to account holders decreased 28.8% from the previous quarter, mainly driven by fewer campaigns in the period. Compared to the same period of the previous year, there was an increase of 44.0%. Total sales of premium bonds to clients of Digital Branches accounted for 5.4% of total sales to account holders in the first quarter of 2016, with increases of 120 basis points from the fourth quarter of 2015 and of 500 basis points from the same period of the previous year.
In the first quarter of 2016, the Premium Bonds segment’s recurring net income reached R$70 million, a 4.2% increase from the previous quarter, mainly driven by lower non-interest expenses.
Compared to the same period of the previous year, it recorded a 29.2% increase, mainly driven by higher net revenues from premium bonds.
Our business model helps us to retain the leadership in terms of technical result(*), including the total premium bonds market, with a market share of 30.8% in the year, based on information disclosed by SUSEP.
Premium Bonds Technical Provisions
On March 31, 2016, technical provisions for premium bonds reached R$3,026 million, with decreases of 0.6% from the previous quarter and of 1.7% from the first quarter of 2015.

(*) Most recent data available on February 29, 2016. Technical Result = Net Collection from Cancellation Fees (-) Variation of Provision for Redemption and Deferred Income
(+) Income from Raffles (-) Acquisition Costs (+) Revenues from Redemptions of Securities.
| Itaú Unibanco Holding S.A. | 32 |
| Management Discussion & Analysis | Income Statement Analysis | |
Non-interest Expenses
| In R$ millions | 1Q16 | 4Q15 | change | 1Q15 | change | |||||||||||||||||||||||
| Personnel Expenses | (4,751 | ) | (4,899 | ) | 148 | -3.0 | % | (4,514 | ) | (237 | ) | 5.2 | % | |||||||||||||||
| Administrative Expenses | (4,051 | ) | (4,558 | ) | 507 | -11.1 | % | (3,927 | ) | (124 | ) | 3.2 | % | |||||||||||||||
| Operating Expenses | (1,285 | ) | (1,530 | ) | 245 | -16.0 | % | (1,274 | ) | (11 | ) | 0.8 | % | |||||||||||||||
| Other Tax Expenses (*) | (128 | ) | (131 | ) | 3 | -2.6 | % | (165 | ) | 37 | -22.5 | % | ||||||||||||||||
| Total | (10,215 | ) | (11,119 | ) | 904 | -8.1 | % | (9,881 | ) | (334 | ) | 3.4 | % | |||||||||||||||
| ( - ) Operations Abroad | (1,180 | ) | (1,239 | ) | 59 | -4.8 | % | (1,016 | ) | (164 | ) | 16.2 | % | |||||||||||||||
| Total (ex-operations abroad) | (9,035 | ) | (9,880 | ) | 844 | -8.5 | % | (8,865 | ) | (170 | ) | 1.9 | % | |||||||||||||||
(*) Does not include ISS, PIS and Cofins.
Non-interest expenses totaled R$10,215 million in the first quarter of 2016, decreasing 8.1% from the fourth quarter of 2015. This decrease was basically driven by the reductions of 11.1% in administrative expenses, 16.0% in operating expenses, and 3.0% in personnel expenses.
When compared to the first quarter of 2015, non-interest expenses increased 3.4%. Excluding operations abroad, non-interest expenses would have increased 1.9%.
Personnel Expenses
| In R$ millions | 1Q16 | 4Q15 | change | |||||||||
| Compensation, Charges and Social Benefits | (3,151 | ) | (3,280 | ) | 130 | |||||||
| Profit Sharing (*) | (918 | ) | (869 | ) | (49 | ) | ||||||
| Employee Terminations and Labor Claims | (646 | ) | (687 | ) | 41 | |||||||
| Training | (36 | ) | (62 | ) | 26 | |||||||
| Total | (4,751 | ) | (4,899 | ) | 148 | |||||||
(*) Includes variable compensation, stock option plans and shares.
Personnel expenses totaled R$4,751 million in the first quarter of 2016, a 3.0% decrease when compared to the previous period. This decrease was mainly due to the larger number of employees in vacation in the first quarter of 2016, which results in lower expenses on compensation, social benefits and charges by 4.0%. This decrease was also caused by lower expenses on terminations and labor claims.
Number of Employees
The total number of employees decreased to 89,627 at the end of the first quarter of 2016, from 90,320 in the previous quarter.
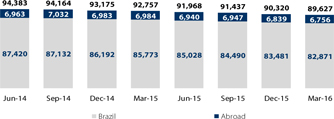
Note: For companies under our control, 100% of the total number of employees is considered. No employees are considered for companies not controlled by us.
Administrative Expenses
| In R$ millions | 1Q16 | 4Q15 | change | |||||||||
| Third-Party Services | (951 | ) | (1,130 | ) | 180 | |||||||
| Data Processing and Telecommunications | (933 | ) | (1,088 | ) | 155 | |||||||
| Facilities | (708 | ) | (721 | ) | 12 | |||||||
| Depreciation and Amortization | (519 | ) | (523 | ) | 4 | |||||||
| Advertising, Promotions and Publications | (208 | ) | (294 | ) | 86 | |||||||
| Security | (177 | ) | (168 | ) | (8 | ) | ||||||
| Financial System Services | (163 | ) | (145 | ) | (18 | ) | ||||||
| Transportation | (99 | ) | (111 | ) | 12 | |||||||
| Materials | (63 | ) | (75 | ) | 12 | |||||||
| Travel | (39 | ) | (53 | ) | 14 | |||||||
| Other | (192 | ) | (251 | ) | 59 | |||||||
| Total | (4,051 | ) | (4,558 | ) | 507 | |||||||
Administrative expenses totaled R$4,051 million, an 11.1% decrease from the fourth quarter of 2015. The reduction in expenses on third-party services was mainly driven by a decrease in expenses on advisory and consulting services and lower legal fees. Lower expenses on data processing are mainly due to decreased development and maintenance expenses and lower expenses on rental and maintenance of softwares. The decrease in advertising, promotion and publication expenses were also a highlight.
Operating Expenses
| In R$ millions | 1Q16 | 4Q15 | change | |||||||||
| Provision for Contingencies | (337 | ) | (399 | ) | 62 | |||||||
| Selling - Credit Cards | (450 | ) | (682 | ) | 232 | |||||||
| Claims | (65 | ) | (48 | ) | (18 | ) | ||||||
| Other | (433 | ) | (402 | ) | (32 | ) | ||||||
| Total | (1,285 | ) | (1,530 | ) | 245 | |||||||
Operating expenses decreased R$245 million in the first quarter of 2016 from the previous quarter, basically due to lower selling expenses related to credit cards and lower provisions for contingencies.
Other Tax Expenses (*)
Other tax expenses totaled R$128 million in the first quarter of 2016, practically stable compared to the fourth quarter of 2015.
(*) Does not include ISS, PIS or Cofins.
| Itaú Unibanco Holding S.A. | 33 |
| Management Discussion & Analysis | Income Statement Analysis | |
Efficiency Ratio and Risk-Adjusted Efficiency Ratio
We present the efficiency ratio and the risk-adjusted efficiency ratio, which includes the risk portions associated with banking transactions (result from loan losses).
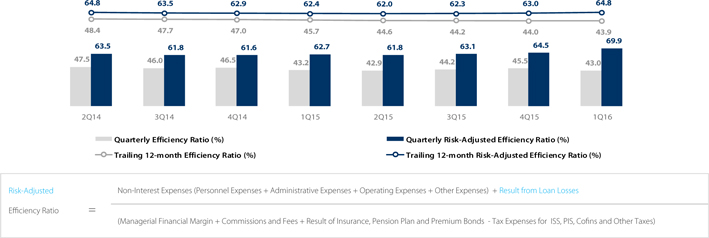
Efficiency Ratio
In the first quarter of 2016, efficiency ratio reached 43.0%, a decrease of 250 basis points compared to the fourth quarter of 2015. This decrease was mainly due to the decrease in non-interest expenses by 8.1%.
In the 12-month period, the efficiency ratio reached 43.9%, an improvement of 10 basis points from the previous quarter. When compared to the first quarter of 2015, this ratio improved 180 basis points.
Risk-Adjusted Efficiency Ratio
The risk-adjusted efficiency ratio, in the criteria including all expenses and also the result from loan losses, reached 69.9% in the first quarter of 2016, an increase of 540 basis points compared to the previous quarter, mainly as a result of the increase in provision for loan losses and the 3.0% decrease in operating revenues.
When compared to the first quarter of 2015, the risk-adjusted efficiency ratio increased 720 basis points mainly due to the increase of 31.1% in allowance for loan losses.
In the 12-month period, the risk-adjusted efficiency ratio reached 64.8%, an increase of 240 basis points from the same period of 2015.
Operating Revenues Distribution
The chart below shows the portions of operating revenues used to cover non-interest expenses and result from loan losses.
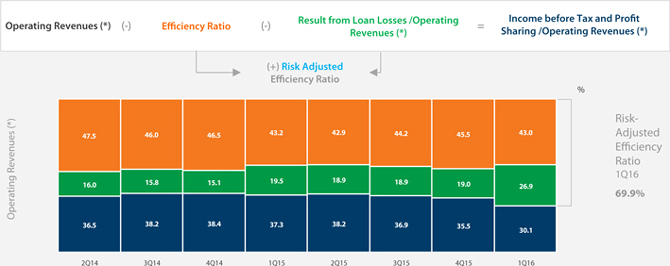
(*) Net of Tax Expenses for ISS, PIS, Cofins and Other (taxes on revenues), Claims and Insurance Selling Expenses.
| Itaú Unibanco Holding S.A. | 34 |
| Management Discussion & Analysis | Income Statement Analysis | |
Points of Service
Automated Teller Machines (ATMs) | Brazil and Abroad
At the end of the first quarter of 2016, the number of ATMs totaled 26,145, a decrease of 267 units compared to the fourth quarter of 2015. This decrease is mainly a result of the shareholders’ agreement with Tecban and its shareholders, announced on July 18, 2014, which provides for the substitution of part of the external ATMs network for Banco24Horas ATMs.
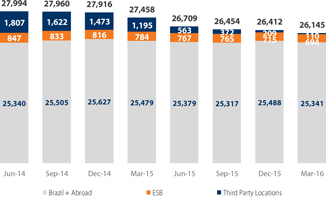
Note: (i) Includes Banco Itaú Argentina and companies in Chile, Uruguay and Paraguay.
(ii) Includes ESBs (Electronic Service Branches) and points of service in third-parties’ establishments.
(iii) Does not include points of sale and ATMs of Banco 24h.
Branches and Client Service Branches (CSB)(i) | Brazil and Abroad
We ended the first quarter of 2016 with 4,921 branches and client service branches (CSBs), including Brazil and abroad.
In Brazil, the movement observed in the number of branches is related to the profile of our clients, which has been increasingly demanding services through digital channels.

(i) Points of service include only Client Service Branches (CSBs).
Note: Includes Banco Itaú BBA, Banco Itaú Argentina and companies in Chile, Uruguay and Paraguay.
Our service network covers the entire Brazilian territory and adopts a segmentation strategy including structures, products and services developed to meet the specific needs of our many different clients. Our segments are: Itaú, Itaú Uniclass, Itaú Personnalité and Itaú Private Bank.
Geographical Distribution of Service Network (*)
Number of Branches and Client Service Branches (CSBs)

(1) Does not include branches and points of service abroad and Itaú BBA.
Tax Expenses for ISS, PIS, Cofins and Other
Tax expenses amounted to R$1,515 million in the first quarter of 2016, a 4.2% decrease from the previous quarter and a 4.1% increase from the same period of 2015.
Income Tax and Social Contribution on Net Income
In the first quarter of 2016, income tax and social contribution on net income (CSLL) expenses totaled R$1,846 million and the effective tax rate reached 25.8%.
| Itaú Unibanco Holding S.A. | 35 |
| Management Discussion & Analysis | Balance Sheet | |
Assets
On March 31, 2016, total assets amounted to R$1.3 trillion, a decrease of 5.6% compared to the end of the previous quarter and a 0.9% decrease in 12 months.
The breakdown of our assets and details on their main components are presented below:
Total Assets

Asset Breakdown | March 31, 2016

Short-term Interbank Investments and Securities Portfolio
On March 31, 2016, the balance of our short-term interbank investments and securities portfolio, including derivative financial instruments, totaled R$576.6 billion, a 6.9% decrease when compared to the previous quarter, mainly due to the decrease in short-term interbank investments.
| In R$ millions, end of period | 1Q16 | % | 4Q15 | % | change | 1Q15 | % | change | ||||||||||||||||||||||||
| Short-term Interbank Investments | 237,642 | 41.2 | % | 280,944 | 45.4 | % | -15.4 | % | 225,076 | 41.0 | % | 5.6 | % | |||||||||||||||||||
| Total Public Securities | 109,671 | 19.0 | % | 123,360 | 19.9 | % | -11.1 | % | 124,222 | 22.6 | % | -11.7 | % | |||||||||||||||||||
| Public Securities - Domestic | 98,671 | 17.1 | % | 112,272 | 18.1 | % | -12.1 | % | 112,397 | 20.5 | % | -12.2 | % | |||||||||||||||||||
| Public Securities - Foreign | 11,000 | 1.9 | % | 11,087 | 1.8 | % | -0.8 | % | 11,825 | 2.2 | % | -7.0 | % | |||||||||||||||||||
| Denmark | 2,548 | 0.4 | % | 2,548 | 0.4 | % | 0.0 | % | 2,835 | 0.5 | % | -10.1 | % | |||||||||||||||||||
| United States | 1,880 | 0.3 | % | 2,154 | 0.3 | % | -12.7 | % | 945 | 0.2 | % | 99.0 | % | |||||||||||||||||||
| Korea | 2,172 | 0.4 | % | 1,626 | 0.3 | % | 33.6 | % | 2,953 | 0.5 | % | -26.5 | % | |||||||||||||||||||
| Paraguay | 780 | 0.1 | % | 980 | 0.2 | % | -20.4 | % | 976 | 0.2 | % | -20.1 | % | |||||||||||||||||||
| Chile | 1,766 | 0.3 | % | 1,442 | 0.2 | % | 22.5 | % | 1,300 | 0.2 | % | 35.8 | % | |||||||||||||||||||
| Spain | 753 | 0.1 | % | 1,060 | 0.2 | % | -29.0 | % | 1,089 | 0.2 | % | -30.8 | % | |||||||||||||||||||
| Argentina | 592 | 0.1 | % | 701 | 0.1 | % | -15.6 | % | 810 | 0.1 | % | -26.9 | % | |||||||||||||||||||
| Uruguay | 249 | 0.0 | % | 233 | 0.0 | % | 6.7 | % | 339 | 0.1 | % | -26.6 | % | |||||||||||||||||||
| Other | 261 | 0.0 | % | 343 | 0.1 | % | -24.0 | % | 578 | 0.1 | % | -54.8 | % | |||||||||||||||||||
| Corporate Securities | 78,563 | 13.6 | % | 71,038 | 11.5 | % | 10.6 | % | 72,481 | 13.2 | % | 8.4 | % | |||||||||||||||||||
| PGBL/VGBL - Fund Quotas | 122,899 | 21.3 | % | 117,128 | 18.9 | % | 4.9 | % | 101,508 | 18.5 | % | 21.1 | % | |||||||||||||||||||
| Derivative Financial Instruments | 27,864 | 4.8 | % | 26,865 | 4.3 | % | 3.7 | % | 25,849 | 4.7 | % | 7.8 | % | |||||||||||||||||||
| Total | 576,639 | 100.0 | % | 619,335 | 100.0 | % | -6.9 | % | 549,136 | 100.0 | % | 5.0 | % | |||||||||||||||||||
Evolution of Short-Term Interbank Investments and Securities Portfolio
The breakdown of short-term interbank investments and securities in the past few quarters is presented below:
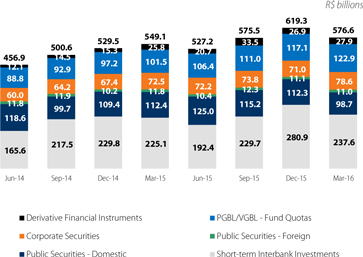
Securities by Category
Our securities portfolio is classified into three categories: trading, available-for-sale and held-to-maturity. On March 31, 2016, the securities portfolio totaled R$311,133 million. The distribution of the securities portfolio remained relatively stable when compared to the previous quarter.
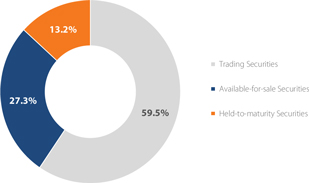
| Itaú Unibanco Holding S.A. | 36 |
| Management Discussion & Analysis | Balance Sheet | |
Funding
| In R$ millions, end of period | 1Q16 | 4Q15 | change | 1Q15 | change | |||||||||||||||
| Demand Deposits | 58,557 | 61,092 | -4.1 | % | 56,660 | 3.3 | % | |||||||||||||
| Savings Deposits | 107,292 | 111,319 | -3.6 | % | 117,357 | -8.6 | % | |||||||||||||
| Time Deposits | 91,916 | 105,250 | -12.7 | % | 96,500 | -4.8 | % | |||||||||||||
| Debentures (Linked to Repurchase Agreements and Third Parties’ Operations) | 148,139 | 152,215 | -2.7 | % | 136,714 | 8.4 | % | |||||||||||||
| Funds from Bills (1) and Structured Operations Certificates | 51,921 | 50,808 | 2.2 | % | 32,743 | 58.6 | % | |||||||||||||
| (1) Total - Funding from Account Holders and Institutional Clients (*) | 457,827 | 480,684 | -4.8 | % | 439,975 | 4.1 | % | |||||||||||||
| Onlending | 35,336 | 38,804 | -8.9 | % | 44,082 | -19.8 | % | |||||||||||||
| (2) Total – Funding from Clients | 493,162 | 519,488 | -5.1 | % | 484,057 | 1.9 | % | |||||||||||||
| Assets Under Administration | 807,267 | 765,102 | 5.5 | % | 694,824 | 16.2 | % | |||||||||||||
| Technical Provisions for Insurance, Pension Plan and Premium Bonds | 137,677 | 132,053 | 4.3 | % | 116,737 | 17.9 | % | |||||||||||||
| (3) Total – Clients | 1,438,107 | 1,416,643 | 1.5 | % | 1,295,618 | 11.0 | % | |||||||||||||
| Interbank deposits | 8,552 | 14,949 | -42.8 | % | 28,135 | -69.6 | % | |||||||||||||
| Funds from Acceptance and Issuance of Securities | 22,431 | 24,782 | -9.5 | % | 18,010 | 24.5 | % | |||||||||||||
| Total Funds from Clients + Interbank Deposits | 1,469,089 | 1,456,374 | 0.9 | % | 1,341,762 | 9.5 | % | |||||||||||||
| Repurchase Agreements (2) | 170,825 | 198,739 | -14.0 | % | 194,144 | -12.0 | % | |||||||||||||
| Borrowings | 60,016 | 65,786 | -8.8 | % | 52,183 | 15.0 | % | |||||||||||||
| Foreign Exchange Portfolio | 64,240 | 68,466 | -6.2 | % | 84,030 | -23.6 | % | |||||||||||||
| Subordinated Debt | 57,919 | 65,785 | -12.0 | % | 59,527 | -2.7 | % | |||||||||||||
| Collection and Payment of Taxes and Contributions | 4,227 | 239 | - | 4,661 | -9.3 | % | ||||||||||||||
| Working Capital (3) | 89,153 | 89,529 | -0.4 | % | 78,707 | 13.3 | % | |||||||||||||
| Working Capital and Other | 446,379 | 488,543 | -8.6 | % | 473,252 | -5.7 | % | |||||||||||||
| Total Funds (Working Capital, Raised and Managed Assets) | 1,915,468 | 1,944,917 | -1.5 | % | 1,815,014 | 5.5 | % | |||||||||||||
(*) Funds from Institutional Clients totaled R$39,024 million, which corresponds to 8.5% of the total raised with Account Holders and Institutional Clients.
(1) Includes funds from Real Estate, Mortgage, Financial, Credit and Similar Notes. (2) Does not include own issued debentures classified as funding. (3) Equity + Non-Controlling Interest – Permanent Assets.
At the end of the first quarter of 2016, total funds from clients, including interbank deposits, amounted to R$1.5 trillion, corresponding to an increase of R$12,715 million compared to the fourth quarter of 2015. This increase was mainly determined by the 5.5% growth in assets under administration, which more than offset the loss in other funding products. Contributed to this movement the increase in market interest rates, which led to migration of savings deposits to funds in search for better remuneration.
On the other hand, there was a 12.7% reduction in time deposits, mainly because of the exchange rate effect in deposits in our foreign units.
Debentures issued by leasing companies of the conglomerate, after being purchased by the bank (the Conglomerate’s parent company), are negotiated with similar characteristics as those of CDBs and other time deposits, although they are classified as deposits received under securities repurchase agreements. Therefore, these deposits are reclassified in the table above as deposits from account holders. At the end of the first quarter of 2016, this type of funding totaled R$148,139 million.
Total funds (working capital, raised and managed assets) amounted to R$1.9 trillion at the end of the first quarter of 2016, a decrease of R$29,449 million compared to the end of the fourth quarter of 2015, mainly driven by the non-renewal of the maturities of the subordinated debt and by the exchange rate effect.
Funds from clients (1)

(1) Includes institutional clients in the proportion of each type of product invested in by them.
| Itaú Unibanco Holding S.A. | 37 |
| Management Discussion & Analysis | Balance Sheet | |
Loans to Funding Ratio
| In R$ millions, end of period | 1Q16 | 4Q15 | change | 1Q15 | change | |||||||||||||||
| Funding from Clients | 493,162 | 519,488 | -5.1 | % | 484,057 | 1.9 | % | |||||||||||||
| Funds from Acceptance and Issuance of Securities Abroad | 22,431 | 24,782 | -9.5 | % | 18,010 | 24.5 | % | |||||||||||||
| Borrowings | 60,016 | 65,786 | -8.8 | % | 52,183 | 15.0 | % | |||||||||||||
| Other (1) | 34,624 | 38,608 | -10.3 | % | 30,400 | 13.9 | % | |||||||||||||
| Total (A) | 610,234 | 648,664 | -5.9 | % | 584,649 | 4.4 | % | |||||||||||||
| (-) Reserve Required by Brazilian Central Bank | (71,312 | ) | (72,412 | ) | -1.5 | % | (70,593 | ) | 1.0 | % | ||||||||||
| (-) Cash (Currency) (2) | (18,384 | ) | (18,544 | ) | -0.9 | % | (18,687 | ) | -1.6 | % | ||||||||||
| Total (B) | 520,538 | 557,708 | -6.7 | % | 495,369 | 5.1 | % | |||||||||||||
| Loan Portfolio (C) (3) | 445,467 | 473,829 | -6.0 | % | 468,105 | -4.8 | % | |||||||||||||
| C/A | 73.0 | % | 73.0 | % | 0 | bps | 80.1 | % | -710 | bps | ||||||||||
| C/B | 85.6 | % | 85.0 | % | 60 | bps | 94.5 | % | -890 | bps | ||||||||||
(1) Includes installments of subordinated debt that are not included in the Tier II Referential Equity.
(2) Includes cash, bank deposits of institutions without reserve requirements, foreign currency deposits in Brazil, foreign currency deposits abroad, and cash and cash equivalents in foreign currency.
(3) The loan portfolio balance does not include endorsements and sureties.
The loans to funding ratio before deduction of compulsory deposits and cash and cash equivalents reached 73.0% at the end of the first quarter of 2016, the same level as the previous quarter.
Excluding reserve requirements and cash and cash equivalents, this ratio reached 85.6% at the end of the first quarter of 2016 compared to 85.0% at the end of the fourth quarter of 2015.
Loan to Funding Ratio

(*) Gross funding, ex-deductions of reserve requirements and cash and cash equivalents.
External Funding - Securities (1)
The table below highlights the main securities issued by Itaú Unibanco abroad in effect on March 31, 2016.
In US$ millions
| Instrument | Issuer | Balance
at Dec 31,15 | Issuances | Amortization | Exchange Variation | Balance
at Mar 31,16 | Issue Date | Maturity Date | Coupon % p.a. | |||||||||||||||||||||
| Fixed Rate Notes (2) | Itaú Chile | 97 | 97 | 7/24/2007 | 7/24/2017 | UF(4)+3.79 | % | |||||||||||||||||||||||
| Fixed Rate Notes (3) | Itaú Chile | 98 | 98 | 10/30/2007 | 10/30/2017 | UF(4)+3.44 | % | |||||||||||||||||||||||
| Medium Term Notes | Itaú Unibanco Holding S.A., Grand Cayman Branch | 1,000 | 1,000 | 4/15/2010 | 4/15/2020 | 6.20 | % | |||||||||||||||||||||||
| Medium Term Notes | Itaú Unibanco Holding S.A., Grand Cayman Branch | 1,000 | 1,000 | 9/23/2010 | 1/22/2021 | 5.75 | % | |||||||||||||||||||||||
| Medium Term Notes | Itaú Unibanco Holding S.A., Grand Cayman Branch | 250 | 250 | 1/24/2011 | 1/22/2021 | 5.75 | % | |||||||||||||||||||||||
| Medium Term Notes | Itaú Unibanco Holding S.A., Grand Cayman Branch | 500 | 500 | 6/15/2011 | 12/21/2021 | 6.20 | % | |||||||||||||||||||||||
| Medium Term Notes | Itaú Unibanco Holding S.A., Grand Cayman Branch | 550 | 550 | 1/24/2012 | 12/21/2021 | 6.20 | % | |||||||||||||||||||||||
| Medium Term Notes | Itaú Unibanco Holding S.A., Grand Cayman Branch | 1,250 | 1,250 | 3/19/2012 | 3/19/2022 | 5.65 | % | |||||||||||||||||||||||
| Medium Term Notes | Itaú Unibanco Holding S.A., Grand Cayman Branch | 1,375 | 1,375 | 8/6/2012 | 8/6/2022 | 5.50 | % | |||||||||||||||||||||||
| Medium Term Notes | Itaú Unibanco Holding S.A., Grand Cayman Branch | 1,870 | 1,870 | 11/13/2012 | 5/13/2023 | 5.13 | % | |||||||||||||||||||||||
| Medium Term Notes | Itaú Unibanco Holding S.A., Grand Cayman Branch | 1,050 | 1,050 | 5/26/2015 | 5/26/2018 | 2.85 | % | |||||||||||||||||||||||
| Structured Notes (5) | 2,335 | (212 | ) | 2,123 | ||||||||||||||||||||||||||
| Total | 11,375 | - | (212 | ) | - | 11,163 | ||||||||||||||||||||||||
(1) The balances refer to principal amounts; (2) and (3) Amounts in US$ equivalent on the issuance dates to CHP 46.9 billion and CHP 48.5 billion, respectively; (4) Development Financial Unit; (5) Structured Notes.
On March 31, 2016, funds obtained abroad totaled US$11,163 million, corresponding to a decrease of US$212 million compared to the fourth quarter of 2015 (presented in the “Funding” table in the previous section as Foreign Borrowings through Securities and Subordinated Debt).
| Itaú Unibanco Holding S.A. | 38 |
| Management Discussion & Analysis | Balance Sheet by Currency | |
We adopted a management policy for foreign exchange risk associated with our asset and liability positions primarily intended to mitigate impacts from fluctuations in foreign exchange rates on consolidated results.
Brazilian tax legislation determines that gains and losses from exchange rate variation on permanent foreign investments must not be included in the tax basis. On the other hand, gains and losses arising from financial instruments used to hedge such asset positions are affected by tax effects. Therefore, in order not to expose net income to exchange rate variations, a liability position must be built at a higher volume than the hedged assets. The Balance Sheet by Currency shows our assets and liabilities denominated in local and foreign currencies. On March 31, 2016, the net exchange position was a liability of US$10,842 million.
Assets | March 31, 2016
| In R$ millions, end of period | Consolidated | Business in Brazil | Local Currency | Foreign Currency | Business Abroad | |||||||||||||||
| Cash and Cash Equivalents | 18,384 | 7,419 | 6,191 | 1,228 | 11,001 | |||||||||||||||
| Short - Term Interbank Investments | 237,642 | 212,261 | 212,261 | 0 | 25,538 | |||||||||||||||
| Securities and Derivative Instruments | 338,997 | 275,487 | 271,544 | 3,943 | 102,089 | |||||||||||||||
| Loans, Leases and Other Loan Operations | 409,431 | 300,798 | 286,518 | 14,280 | 161,751 | |||||||||||||||
| Loans | 445,467 | 334,916 | 320,636 | 14,280 | 163,668 | |||||||||||||||
| (Allowance for Loan Losses) | (36,036 | ) | (34,118 | ) | (34,118 | ) | 0 | (1,917 | ) | |||||||||||
| Other Assets | 259,324 | 208,041 | 190,397 | 17,644 | 76,586 | |||||||||||||||
| Foreign Exchange Portfolio | 63,795 | 33,552 | 16,068 | 17,484 | 55,341 | |||||||||||||||
| Other | 195,530 | 174,489 | 174,329 | 160 | 21,245 | |||||||||||||||
| Permanent Assets | 19,292 | 83,608 | 18,185 | 65,424 | 1,108 | |||||||||||||||
| Total Assets | 1,283,071 | 1,087,614 | 985,095 | 102,519 | 378,073 | |||||||||||||||
| Derivatives - Purchased Positions | 335,656 | |||||||||||||||||||
| Total Assets After Adjustments (a) | 438,175 | |||||||||||||||||||
Liabilities | March 31, 2016
| In R$ millions, end of period | Consolidated | Business in Brazil | Local Currency | Foreign Currency | Business Abroad | |||||||||||||||
| Deposits | 266,318 | 170,385 | 169,896 | 489 | 96,117 | |||||||||||||||
| Funds Received under Securities Repurchase Agreements | 318,964 | 294,841 | 294,841 | 0 | 24,123 | |||||||||||||||
| Funds from Acceptances and Issue of Securities | 74,352 | 90,868 | 53,635 | 37,233 | 20,593 | |||||||||||||||
| Borrowings and Onlendings | 95,352 | 91,251 | 36,470 | 54,780 | 57,219 | |||||||||||||||
| Interbank and Interbranch Accounts | 9,823 | 9,440 | 5,783 | 3,657 | 383 | |||||||||||||||
| Derivative Financial Instruments | 28,917 | 18,096 | 18,084 | 12 | 10,822 | |||||||||||||||
| Other Liabilities | 241,377 | 165,081 | 145,249 | 19,832 | 103,078 | |||||||||||||||
| Foreign Exchange Portfolio | 64,240 | 33,811 | 14,050 | 19,761 | 55,527 | |||||||||||||||
| Other | 177,137 | 131,270 | 131,199 | 71 | 47,551 | |||||||||||||||
| Technical Provisions of Insurance, Pension Plan | ||||||||||||||||||||
| and Premium Bonds | 137,677 | 137,595 | 137,593 | 2 | 82 | |||||||||||||||
| Deferred Income | 1,847 | 1,613 | 1,009 | 605 | 233 | |||||||||||||||
| Minority Interest in Subsidiaries | 1,799 | 1,798 | 1,798 | - | 0 | |||||||||||||||
| Stockholders' Equity of Parent Company | 106,647 | 106,647 | 106,647 | - | 65,424 | |||||||||||||||
| Capital Stock and Reserves | 101,463 | 101,778 | 101,778 | - | 65,063 | |||||||||||||||
| Net Income | 5,184 | 4,869 | 4,869 | - | 360 | |||||||||||||||
| Total Liabilities and Equity | 1,283,071 | 1,087,614 | 971,005 | 116,609 | 378,073 | |||||||||||||||
| Derivatives - Sold Positions | 360,152 | |||||||||||||||||||
| Total Liabilities and Equity After Adjustments (b) | 476,760 | |||||||||||||||||||
| Net Foreign Exchange Sold Position Itaú Unibanco (c = a - b) | (38,585 | ) | ||||||||||||||||||
| Net Foreign Exchange Sold Position Itaú Unibanco (c) in US$ | (10,842 | ) | ||||||||||||||||||
Note: Does not include eliminations of operations between local and foreign units.
Assets and liabilities denominated in foreign currencies
We present below the net exchange position, a liability position at a higher volume than the balance of hedged assets, which, when including the tax effects on the net balance of other assets and liabilities denominated in foreign currency, reflects the mitigation of the exposure to foreign exchange variations.
| In R$ millions, end of period | 1Q16 | 4Q15 | change | |||||||||||||
| Investments Abroad | 65,424 | 67,297 | (1,873 | ) | -2.8 | % | ||||||||||
| Net Foreign Exchange Position (Except Investments Abroad) | (104,009 | ) | (110,506 | ) | 6,497 | -5.9 | % | |||||||||
| Total | (38,585 | ) | (43,209 | ) | 4,624 | -10.7 | % | |||||||||
| Total in US$ | (10,842 | ) | (11,066 | ) | 224 | -2.0 | % | |||||||||
| Itaú Unibanco Holding S.A. | 39 |
| Management Discussion & Analysis | Capital Ratios (BIS) | |
Solvency Ratios | Prudential Conglomerate(*)
| In R$ millions, end of period | 1Q16 | 4Q15 | 1Q15 | |||||||||
| Stockholders' equity of the parent company | 106,647 | 106,462 | 96,954 | |||||||||
| Consolidated stockholders’ equity (BACEN) | 110,962 | 111,061 | 102,393 | |||||||||
| Deductions from core capital | (11,742 | ) | (10,107 | ) | (10,942 | ) | ||||||
| Core Capital | 99,220 | 100,955 | 91,451 | |||||||||
| Additional capital | 70 | 46 | 50 | |||||||||
| Tier I | 99,290 | 101,001 | 91,501 | |||||||||
| Tier II | 23,582 | 27,464 | 29,402 | |||||||||
| Referential Equity (Tier I and Tier II) | 122,872 | 128,465 | 120,903 | |||||||||
| Required Referential Equity | 68,621 | 79,471 | 86,773 | |||||||||
| Risk-weighted Assets (RWA) | 694,899 | 722,468 | 788,844 | |||||||||
| Excess Capital | 54,250 | 48,994 | 34,130 | |||||||||
| Amount Required for Additional Common Equity Tier I Capital (ACPRequired) | 4,343 | - | - | |||||||||
| Ratios (%) | ||||||||||||
| Tier I | 14.3 | 14.0 | 11.6 | |||||||||
| Tier II | 3.4 | 3.8 | 3.7 | |||||||||
| BIS (Referential Equity / Total Risk-weighted Exposure) | 17.7 | 17.8 | 15.3 | |||||||||
Our minimum capital requirements follow the set of rules disclosed by the Brazilian Central Bank, which implement the Basel III global capital requirements standards in Brazil. These requirements are expressed as ratios of available capital - stated by the Referential Equity, or of Total Capital, composed of Tier I Capital and Tier II Capital - and the risk-weighted assets, or RWA.
Minimum Total Capital requirement corresponds to 9.875% from January to December 2016, decreasing gradually to 8% in January 2019. To counteract this, the Brazilian Central Bank rules established the Additional Common Equity Tier I Capital (ACP), comprised of the sum of ACPConservation, ACPCountercyclical and ACPSistemic, which, combined with minimum Total Capital, increase capital requirements over time. Any insufficiency in connection with these ACP requirements will result in restrictions detailed in CMN Resolution No. 4,193.
In conformity with CMN Resolution No. 4,193, the sum of the amounts ACPConservation and ACPCountercyclical will gradually increase, from 0.625% as of January 2016 to 2.5% as of January 2019. In conformity with BACEN Circular No. 3,769, however, at present the amount calculated for the ACPCountercyclical is equivalent to zero, and in the case of increases in this amount, the new percentage will become effective 12 months after it is disclosed. According to Circular No. 3,768 of the Brazilian Central Bank, the ACPSistemic currently applicable to Itaú Unibanco is 0%, and will gradually increase from 0.25% as of January 2017 to 1% as of January 2019.
On March 31, 2016, ACP amounted to R$4,343 million, which did not result in restrictions to Itaú Unibanco in connection with any insufficient Additional Common Equity Tier I Capital.
Referential Equity | Prudential Conglomerate
On March 31, 2016, our Referential Equity reached R$122,872 million, a decrease of R$5,594 million compared to December 31, 2015 mainly driven by a lower Tier II Capital, which reached R$23,582 million at the end of the first quarter of 2016, R$3,883 million less compared to December 31, 2015, due to the Basel III schedule. At the end of the first quarter of 2016, Tier I Capital totaled R$99,290 million, a decrease of R$1,711 million from December 31, 2015.
(*) Includes not only the financial institutions, but also consortium managers, payment institutions, companies that acquire operations or directly or indirectly assume credit risk, and investment funds in which the conglomerate substantially retains risks and benefits.
Taking into consideration our current capital base, if we immediately fully applied the Basel III rules established by the Brazilian Central Bank, our core capital (Common Equity Tier I) would be 12.6% on March 31, 2016, including the consolidation of CorpBanca (estimated impact based on preliminary information) and use of tax credits. This scenario is presented in the following chart.
Estimated Core Capital Ratio according to Full Basel III Rules
(Common Equity Tier I)
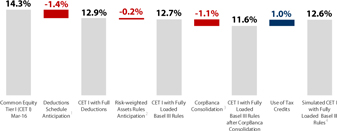
¹ Includes deductions of Goodwill, Intangible Assets (generated before and after October 2013), Tax Credits from Temporary Differences and Tax Loss, Pension Fund Assets, Equity Investments in Financial Institutions, Insurance and similar companies. 2 Includes the increase of the multiplier of the amounts of market risk, operational risk and certain credit risk accounts. This multiplier, which is at 10.1 nowadays, will be 12.5 in 2019. 3 Estimated impact based on preliminary information. 4 Does not include any reversal of the complementary allowance for loan losses.
Solvency Ratios | Prudential Conglomerate
On March 31, 2016, the BIS ratio reached 17.7%, a decrease of 10 basis points from December 31, 2015. Contributed to this result the impact of Basel III schedule applied to Tier II instruments and to deductions capital, and also the distribution of interest on capital and dividends in the period.
Our BIS ratio exceeds by 720 basis points the sum of the minimum requirements of the Reference Equity and the Additional Common Equity Tier I Capital established by the Brazilian Central Bank for 2016 (equivalent to 10.5%).
In addition to the minimum capital requirements, Circular No. 3,748 of the Brazilian Central Bank added a Leverage Ratio to the Basel III framework, which is defined as the ratio of Tier I Capital to Total Exposure (calculated based on this Circular). On March 31, 2016, the Leverage Ratio reached 8.3%.
| Itaú Unibanco Holding S.A. | 40 |
| Management Discussion & Analysis | Capital Ratios (BIS) | |
Risk Exposure
| In R$ millions, end of period | 1Q16 | 4Q15 | 1Q15 | |||||||||
| Credit Risk-weighted Assets (RWACPAD) | 637,179 | 679,593 | 728,559 | |||||||||
| FPR at 2% | 149 | 179 | 136 | |||||||||
| FPR at 20% | 6,484 | 7,000 | 6,291 | |||||||||
| FPR at 35% | 11,888 | 11,695 | 8,579 | |||||||||
| FPR at 50% | 46,622 | 46,025 | 46,681 | |||||||||
| FPR at 75% | 129,244 | 136,104 | 145,250 | |||||||||
| FPR at 85% | 117,929 | 129,884 | 147,950 | |||||||||
| FPR at 100% | 267,515 | 288,057 | 305,875 | |||||||||
| FPR at 250% | 36,973 | 37,858 | 34,294 | |||||||||
| FPR at 300% | 9,066 | 10,751 | 18,002 | |||||||||
| FPR up to 1250% ¹ | 1,305 | 1,990 | 1,688 | |||||||||
| Derivatives – future potential gain and variation of the counterparty credit quality | 10,005 | 10,050 | 13,812 | |||||||||
| Operational Risk-weighted Assets (RWAopad) | 37,364 | 28,623 | 35,509 | |||||||||
| Market Risk-weighted Assets (RWAmpad) | 20,356 | 14,252 | 24,776 | |||||||||
| Gold, foreign currency and operations subject to exchange rate variation (RWACAM) | 3,040 | 1,536 | 11,198 | |||||||||
| Operations subject to interest rate variation (RWAJUR) | 15,779 | 11,291 | 12,046 | |||||||||
| Operations subject to commodity price variations (RWACOM) | 624 | 473 | 921 | |||||||||
| Operations subject to stock price variation (RWAACS) | 913 | 952 | 610 | |||||||||
| Total Risk-weighted Exposure (RWA) [RWACPAD+ RWAOPAD+RWAMPAD] | 694,899 | 722,468 | 788,844 | |||||||||
Note: FPR - Risk Weighting Factor.
¹ Includes the application of the “F” factor, as required by Article 29 of Circular No. 3,644/13.
On March 31, 2016, total risk-weighted exposure amounted to R$694,899 million, a decrease of R$27,569 million compared to December 31, 2015, driven by the reduction of the credit risk-weighted assets (RWACPAD), which reached R$637,179 million on March 31, 2016. This change was mainly due to the decrease in the balance of loan operations.
In the first quarter of 2016, the operational risk-weighted assets (RWAOPAD) reached R$37,364 million, an increase of R$8,741 million compared to December 31, 2015. The RWAOPAD is calculated every six months, according to Circulars Nos. 3,640, 3,675, and 3,739 of the Brazilian Central Bank.
On March 31, 2016, market risk-weighted assets (RWAMPAD) totaled R$20,356 million, an increase of R$6,105 million compared to December 31, 2015, mainly due to the higher amount required for operations subject to interest rate variation (RWAJUR).
Evolution of the Composition of the Risk-weighted Exposure

Credit Risk-weighted Exposure

Risk-weighted ROA

In the first quarter of 2016, annualized recurring return on average assets reached 1.6%, a decrease of 30 basis points compared to the first quarter of 2015.
The annualized recurring return on risk-weighted assets reached 3.0% in the quarter, remaining stable compared to the same period of the previous year.
In this period, the risk-weighted leverage was 5.7, remaining relatively stable compared to the previous quarter.
| Itaú Unibanco Holding S.A. | 41 |
| Management Discussion & Analysis | Risk Management | |
Corporate Principles of Risk and Capital Management
We regard risk and capital management as essential instruments for optimizing the use of resources and selecting the best business opportunities in order to create value for our shareholders.
Risk management covers the entire institution and is in line with the guidelines of the Board of Directors and Senior Management, which, through Superior Committees, determine the overall goals, expressed as targets and limits for the risk management business units. Meanwhile, the control and capital management units support Itaú Unibanco’s management through monitoring processes and risk and capital analysis.
In order to strengthen our values and align our employee’s behavior to the guidelines established by our risk management, we have several initiatives aimed at encouraging compliance with our risk culture. In addition to policies, procedures and processes, the risk culture strengthens the individual and collective responsibility of our employees in connection with management of risks inherent in activities carried out on an individual basis, complying with our ethical business management.
We adopt a prospective approach regarding capital management, and, through the internal Capital Adequacy Assessment Process (ICAAP), we assess the sufficiency of regulatory capital to cover our risks, represented by the regulatory capital for credit, market and operational risks, as well as the capital required to cover other risks. The ICAAP process comprises the following phases: identification of material risks, definition of additional capital requirement to material risks and of internal methodologies for capital quantification; preparation of the capital plan, for normal and stress situations, and structuring the capital contingency plan. The result of the last ICAAP – conducted at the December 2015 base date – indicated that, in addition to capital to face all material risks, we have significant capital surplus, thus assuring the institution’s equity soundness.
For further information on the risk and capital management structure, please refer to the Investor Relations website at www.itau.com.br/ investor-relations Corporate Governance >> Risk and Capital Management – Pillar 3.
Credit Risk
Our credit risk management is aimed at keeping the level of the loan portfolio quality consistent with our risk appetite for each market segment in which we operate.
The credit risk control is centralized and carried out by a department independent from the business units and responsible for risk control. The main responsibilities include monitoring and controlling the performance of loan portfolios, and managing the process of development, review and approval of institutional credit risk policies. Our centralized process for approving policies and validating models ensures the synchronization of credit actions.
Operational Risk
Our operational risk management structure is composed of operational risk management and control activities aimed at supporting the organization of decision-making processes, always aiming at the proper identification and evaluation of risks, the creation of value for shareholders, as well as the protection of our assets and image.
Liquidity Risk
The liquidity risk measurement comprises all financial operations of our companies, as well as possible contingent or unexpected exposures, such as those arising from settlement services, provision for endorsements and sureties and lines of credit raised but not used. Liquidity risk management and control is carried out on a daily basis, through a governance approved in Superior Committees, that establishes, among others, the adoption of minimum liquidity limits, sufficient to absorb possible cash losses in stress scenarios, measured by internal and also regulatory methodologies.
Market Risk
Our market risk is controlled by a department which is independent of the business units and responsible for carrying out, on a daily basis: (i) risk measurement and assessment, (ii) monitoring of stress scenarios, limits and alerts, (iii) applying, analyzing and testing of stress scenarios, (iv) reporting of risk results to those accountable for in the business units, in accordance with our governance, (v) monitoring of the actions required to adjust positions and/or risk levels to make them feasible, and (vi) supporting the safe launch of new financial products. To this end, Itaú Unibanco has a structured communication and information process that provides feedback for the monitoring of Superior Committees and compliance with the requirements of Brazilian and foreign regulatory bodies.
VaR of Itaú Unibanco Holding
The Consolidated VaR of Itaú Unibanco is calculated based on the Historical Simulation methodology, which fully reprices all its positions based on historical series of asset prices. During the first quarter of 2016, we choose to incorporate the exposures of each external unit to calculate our consolidated VaR, in order to also include the risk of these units, thereby improving the methodology used.
Maintaining our conservative management and portfolio diversification, we follow our policy of operating within low limits in connection with our capital in the period. The Average VaR in the quarter remained lower than 1% of our stockholders’ equity.
VaR by Risk Factor (1)
| In R$ millions, end of period | 1Q16(2) | 1Q16(3) | 4Q15(3) | |||||||||
| Itaú Unibanco | ||||||||||||
| Brazilian Interest rates | 165.4 | 160.1 | 121.2 | |||||||||
| Other Foreign Interest rates | 102.0 | 101.7 | 108.6 | |||||||||
| FX rates | 20.7 | 18.0 | 13.1 | |||||||||
| Brazilian Inflation Indexes | 140.2 | 139.0 | 108.9 | |||||||||
| Equities and Commodities | 62.5 | 62.5 | 59.3 | |||||||||
| Diversification Effect | (315.8 | ) | (309.0 | ) | (233.3 | ) | ||||||
| Total VaR | 174.9 | 200.9 | 204.0 | |||||||||
| Maximum VaR in the Quarter | 208.5 | 230.3 | 327.6 | |||||||||
| Average VaR in the Quarter | 174.1 | 197.2 | 213.6 | |||||||||
| Minimum VaR in the Quarter | 155.1 | 174.6 | 170.8 | |||||||||
(1) The Values represented above consider 1 day as time horizon and 99% confidence.
(2) The VaR by risk factors includes foreign units. (3) The VaR by risk factors does not include foreign units.
Evolution of Itaú Unibanco’s VaR

| Itaú Unibanco Holding S.A. | 42 |

(This page was intentionally left blank)
| Itaú Unibanco Holding S.A. | 44 |
| Management Discussion & Analysis | Segment Analysis | |
Pro Forma Adjustments
Adjustments made to the balance sheet and income statement for the year are based on managerial information from the business units.
The financial statements were adjusted in order to replace the accounting stockholders’ equity with funding at market prices. Subsequently, the financial statements were adjusted to include revenues linked to allocated capital at each segment. The cost of subordinated debt and the respective remuneration at market prices were allocated to segments on a pro rata basis, in accordance with the economic allocated capital.
As of the first quarter of 2015, we changed the presentation of our segments in order to reflect the bank’s current organizational structure. We report on the following segments: (a) Retail Banking, (b) Wholesale Banking and (d) Activities with the Market + Corporation. Retail Banking include the previous Commercial Banking – Retail and Consumer Credit – Retail segments, with the transfer of the Private Bank and Latam operations to the Wholesale Banking.
The Activities with the Market + Corporation column presents the result from excess capital, excess subordinated debt and the net balance of tax assets and liabilities. It also shows the financial margin with the market, costs of Treasury operations, the equity pickup of companies not linked to each segment and our stake in Porto Seguro.
Allocated Capital
Impacts related to capital allocation are included in the Pro Forma financial statements. To this end, adjustments were made to the financial statements, using a proprietary model.
The economic allocated capital model (EAC) was adopted for the Pro Forma financial statements by segment and, as of 2015, we changed our calculation methodology. In addition to the Tier I allocated capital, the EAC model includes the effects of the calculated expected loan losses, complementary to that required by the Brazilian Central Bank through CMN Circular No. 2,682/99.
Accordingly, the allocated capital includes the following components: credit risk (including expected losses), operational risk, market risk, and insurance underwriting risk.
Based on Tier I capital measure we determined the Return on Allocated Capital, which corresponds to an operational performance ratio consistently adjusted to the required capital needed to support the risks of the financial positions assumed in accordance with our risk appetite.
As of the first quarter of 2016, we have adopted the Basel III rules in our managerial capital allocation model.
Income Tax Rate
We adopt the full income tax rate, net of the tax effect of payment of interest on capital, for the Retail Banking, Wholesale Banking and Activities with the Market + Corporation segments. The difference between the income tax amount determined for each segment and the effective income tax amount, as stated in the consolidated financial statements, is stated in the column Activities with the Market + Corporation.
| Itaú Unibanco Holding S.A. | 45 |
| Management Discussion & Analysis | Segment Analysis | |
The Pro Forma financial statements of Retail Banking, Wholesale Banking and Activities with the Market + Corporation presented below are based on managerial information derived from internal models to more accurately reflect the activities of the business units.
Pro Forma Balance Sheet by Segment | On March 31, 2016
| In R$ millions | Retail Banking | Wholesale Banking | Activities with the Market + Corporation | Itaú Unibanco | ||||||||||||
| Assets | ||||||||||||||||
| Current and Long-Term Assets | 827,012 | 503,144 | 109,403 | 1,263,779 | ||||||||||||
| Cash and Cash Equivalents | 13,088 | 5,302 | - | 18,384 | ||||||||||||
| Short-term Interbank Investments | 296,895 | 90,281 | - | 237,642 | ||||||||||||
| Securities and Derivative Financial Instruments | 181,478 | 146,949 | 28,748 | 338,997 | ||||||||||||
| Interbank and Interbranch Accounts | 67,058 | 5,193 | - | 70,858 | ||||||||||||
| Loan, Lease and Other Credit Operations | 218,337 | 227,129 | - | 445,467 | ||||||||||||
| (Allowance for Loan Losses) | (17,303 | ) | (7,748 | ) | - | (25,051 | ) | |||||||||
| (Complementary Expected Loss Provisions) | - | - | (10,985 | ) | (10,985 | ) | ||||||||||
| Other Assets | 67,458 | 36,037 | 91,639 | 188,467 | ||||||||||||
| Foreign Exchange Portfolio | 8,093 | 17,458 | 43,960 | 63,795 | ||||||||||||
| Others | 59,366 | 18,579 | 47,679 | 124,672 | ||||||||||||
| Permanent Assets | 15,116 | 2,313 | 1,863 | 19,292 | ||||||||||||
| Total Assets | 842,128 | 505,457 | 111,266 | 1,283,071 | ||||||||||||
| Liabilities and Equity | ||||||||||||||||
| Current and Long-Term Liabilities | 805,621 | 457,140 | 85,798 | 1,172,779 | ||||||||||||
| Deposits | 221,115 | 145,086 | - | 266,318 | ||||||||||||
| Deposits Received under Securities Repurchase Agreements | 288,772 | 59,527 | - | 318,964 | ||||||||||||
| Funds from Acceptances and Issue of Securities | 66,240 | 46,063 | - | 74,352 | ||||||||||||
| Interbank and Interbranch Accounts | 5,000 | 4,825 | - | 9,823 | ||||||||||||
| Borrowings and Onlendings | 9,003 | 86,349 | - | 95,352 | ||||||||||||
| Derivative Financial Instruments | 20 | 31,317 | - | 28,917 | ||||||||||||
| Other Liabilities | 108,648 | 53,119 | 85,798 | 241,377 | ||||||||||||
| Foreign Exchange Portfolio | 8,483 | 17,332 | 44,142 | 64,240 | ||||||||||||
| Others | 100,165 | 35,787 | 41,656 | 177,137 | ||||||||||||
| Technical Provisions for Insurance, Pension Plans and Premium Bonds | 106,823 | 30,854 | - | 137,677 | ||||||||||||
| Deferred Income | 1,519 | 328 | - | 1,847 | ||||||||||||
| Minority Interest in Subsidiaries | 1,694 | - | 105 | 1,799 | ||||||||||||
| Economic Allocated Capital - Tier I (*) | 33,294 | 47,990 | 25,363 | 106,647 | ||||||||||||
| Total Liabilities and Equity | 842,128 | 505,457 | 111,266 | 1,283,071 | ||||||||||||
(*) The Economic Capital allocated to the Activities with the Market + Corporation column contains all the excess capital of the institution in order to arrive at the accounting net equity.
Pro Forma Income Statement by Segment | 1st quarter of 2016
| In R$ millions | Retail Banking | Wholesale Banking | Activities with the Market + Corporation | Itaú Unibanco | ||||||||||||
| Operating Revenues | 17,074 | 6,822 | 1,971 | 25,867 | ||||||||||||
| Managerial Financial Margin | 9,646 | 4,947 | 1,964 | 16,557 | ||||||||||||
| Financial Margin with Clients | 9,646 | 4,947 | 227 | 14,820 | ||||||||||||
| Financial Margin with the Market | - | - | 1,737 | 1,737 | ||||||||||||
| Commissions and Fees | 5,422 | 1,744 | 2 | 7,169 | ||||||||||||
| Result from Insurance, Pension Plans and Premium Bonds Operations before Retained Claims and Selling Expenses | 2,006 | 130 | 5 | 2,141 | ||||||||||||
| Result from Loan Losses | (3,633 | ) | (2,859 | ) | 90 | (6,402 | ) | |||||||||
| Provision for Loan Losses | (4,413 | ) | (2,908 | ) | 90 | (7,231 | ) | |||||||||
| Recovery of Loans Written Off as Losses | 780 | 49 | - | 829 | ||||||||||||
| Retained Claims | (379 | ) | (15 | ) | - | (394 | ) | |||||||||
| Operating Margin | 13,062 | 3,948 | 2,061 | 19,071 | ||||||||||||
| Other Operating Income/(Expenses) | (8,652 | ) | (2,763 | ) | (511 | ) | (11,926 | ) | ||||||||
| Non-interest Expenses | (7,394 | ) | (2,459 | ) | (362 | ) | (10,215 | ) | ||||||||
| Tax Expenses for ISS, PIS, Cofins and Other Taxes | (1,065 | ) | (303 | ) | (147 | ) | (1,515 | ) | ||||||||
| Insurance Selling Expenses | (193 | ) | (0 | ) | (2 | ) | (196 | ) | ||||||||
| Income before Tax and Minority Interests | 4,410 | 1,185 | 1,550 | 7,145 | ||||||||||||
| Income Tax and Social Contribution | (1,580 | ) | (144 | ) | (123 | ) | (1,846 | ) | ||||||||
| Minority Interests in Subsidiaries | (58 | ) | - | (6 | ) | (64 | ) | |||||||||
| Recurring Net Income | 2,772 | 1,042 | 1,421 | 5,235 | ||||||||||||
| Recurring Return on Average Allocated Capital | 34.2 | % | 9.0 | % | 21.3 | % | 19.9 | % | ||||||||
| Efficiency Ratio (ER) | 47.9 | % | 37.8 | % | 19.9 | % | 43.0 | % | ||||||||
| Risk-Adjusted Efficiency Ratio (RAER) | 71.4 | % | 81.8 | % | 14.9 | % | 69.9 | % | ||||||||
Note: Non-interest Expenses considers Personnel Expenses, Administrative Expenses, Other Tax Expenses and Operating Expenses.
Consolidated figures do not represent the sum of the parts, because there are transactions between the companies that were eliminated only in the Consolidated figures.
| Itaú Unibanco Holding S.A. | 46 |
| Management Discussion & Analysis | Segment Analysis | |
The Pro Forma financial statements of Retail Banking, Wholesale Banking and Activities with the Market + Corporation presented below are based on managerial information derived from internal models to more accurately reflect the activities of the business units.
Pro Forma Balance Sheet by Segment | On December 31, 2015
| In R$ millions | Retail Banking | Wholesale Banking | Activities with the Market + Corporation | Itaú Unibanco | ||||||||||||
| Assets | ||||||||||||||||
| Current and Long-Term Assets | 858,630 | 544,908 | 125,927 | 1,340,483 | ||||||||||||
| Cash and Cash Equivalents | 13,884 | 4,678 | - | 18,544 | ||||||||||||
| Short-term Interbank Investments | 323,182 | 110,480 | - | 280,944 | ||||||||||||
| Securities and Derivative Financial Instruments | 180,287 | 147,553 | 38,334 | 338,391 | ||||||||||||
| Interbank and Interbranch Accounts | 63,760 | 4,938 | - | 67,373 | ||||||||||||
| Loan, Lease and Other Credit Operations | 222,774 | 251,056 | - | 473,829 | ||||||||||||
| (Allowance for Loan Losses) | (16,852 | ) | (6,241 | ) | - | (23,093 | ) | |||||||||
| (Complementary Expected Loss Provisions) | - | - | (10,985 | ) | (10,985 | ) | ||||||||||
| Other Assets | 71,596 | 32,445 | 98,578 | 195,480 | ||||||||||||
| Foreign Exchange Portfolio | 8,742 | 18,858 | 47,485 | 68,909 | ||||||||||||
| Others | 62,855 | 13,588 | 51,093 | 126,571 | ||||||||||||
| Permanent Assets | 14,571 | 2,328 | 1,790 | 18,689 | ||||||||||||
| Total Assets | 873,202 | 547,236 | 127,716 | 1,359,172 | ||||||||||||
| Liabilities and Equity | ||||||||||||||||
| Current and Long-Term Liabilities | 838,508 | 502,452 | 97,017 | 1,248,995 | ||||||||||||
| Deposits | 235,282 | 172,998 | - | 292,610 | ||||||||||||
| Deposits Received under Securities Repurchase Agreements | 301,607 | 72,503 | - | 350,954 | ||||||||||||
| Funds from Acceptances and Issue of Securities | 73,610 | 42,906 | - | 75,590 | ||||||||||||
| Interbank and Interbranch Accounts | 2,127 | 4,802 | - | 6,926 | ||||||||||||
| Borrowings and Onlendings | 10,529 | 94,060 | - | 104,589 | ||||||||||||
| Derivative Financial Instruments | 25 | 33,737 | - | 31,116 | ||||||||||||
| Other Liabilities | 113,087 | 51,634 | 97,017 | 255,155 | ||||||||||||
| Foreign Exchange Portfolio | 9,041 | 18,472 | 47,128 | 68,466 | ||||||||||||
| Others | 104,046 | 33,162 | 49,889 | 186,690 | ||||||||||||
| Technical Provisions for Insurance, Pension Plans and Premium Bonds | 102,241 | 29,813 | - | 132,053 | ||||||||||||
| Deferred Income | 1,525 | 435 | - | 1,960 | ||||||||||||
| Minority Interest in Subsidiaries | 1,663 | - | 92 | 1,755 | ||||||||||||
| Economic Allocated Capital - Tier I (*) | 31,506 | 44,350 | 30,607 | 106,462 | ||||||||||||
| Total Liabilities and Equity | 873,202 | 547,236 | 127,716 | 1,359,172 | ||||||||||||
(*) The Economic Capital allocated to the Activities with the Market + Corporation column contains all the excess capital of the institution in order to arrive at the accounting net equity.
Pro Forma Income Statement by Segment | 4th quarter of 2015
| In R$ millions | Retail Banking | Wholesale Banking | Activities with the Market + Corporation | Itaú Unibanco | ||||||||||||
| Operating Revenues | 17,972 | 7,143 | 1,565 | 26,680 | ||||||||||||
| Managerial Financial Margin | 10,138 | 5,082 | 1,544 | 16,764 | ||||||||||||
| Financial Margin with Clients | 10,138 | 5,082 | 275 | 15,495 | ||||||||||||
| Financial Margin with the Market | - | - | 1,269 | 1,269 | ||||||||||||
| Commissions and Fees | 5,699 | 1,935 | 11 | 7,645 | ||||||||||||
| Result from Insurance, Pension Plans and Premium Bonds Operations before Retained Claims and Selling Expenses | 2,135 | 126 | 10 | 2,271 | ||||||||||||
| Result from Loan Losses | (3,770 | ) | (902 | ) | 38 | (4,634 | ) | |||||||||
| Provision for Loan Losses | (4,659 | ) | (1,495 | ) | 38 | (6,116 | ) | |||||||||
| Recovery of Loans Written Off as Losses | 889 | 593 | - | 1,482 | ||||||||||||
| Retained Claims | (391 | ) | (15 | ) | - | (406 | ) | |||||||||
| Operating Margin | 13,811 | 6,225 | 1,603 | 21,639 | ||||||||||||
| Other Operating Income/(Expenses) | (9,518 | ) | (3,005 | ) | (436 | ) | (12,959 | ) | ||||||||
| Non-interest Expenses | (8,059 | ) | (2,635 | ) | (425 | ) | (11,119 | ) | ||||||||
| Tax Expenses for ISS, PIS, Cofins and Other Taxes | (1,202 | ) | (371 | ) | (9 | ) | (1,582 | ) | ||||||||
| Insurance Selling Expenses | (257 | ) | 1 | (2 | ) | (258 | ) | |||||||||
| Income before Tax and Minority Interests | 4,293 | 3,220 | 1,168 | 8,680 | ||||||||||||
| Income Tax and Social Contribution | (1,562 | ) | (1,157 | ) | (97 | ) | (2,815 | ) | ||||||||
| Minority Interests in Subsidiaries | (85 | ) | - | (7 | ) | (92 | ) | |||||||||
| Recurring Net Income | 2,646 | 2,063 | 1,064 | 5,773 | ||||||||||||
| Recurring Return on Average Allocated Capital | 32.4 | % | 19.4 | % | 15.0 | % | 22.3 | % | ||||||||
| Efficiency Ratio (ER) | 50.0 | % | 39.0 | % | 27.3 | % | 45.5 | % | ||||||||
| Risk-Adjusted Efficiency Ratio (RAER) | 73.4 | % | 52.3 | % | 24.9 | % | 64.5 | % | ||||||||
Note: Non-interest Expenses considers Personnel Expenses, Administrative Expenses, Other Tax Expenses and Operating Expenses.
Consolidated figures do not represent the sum of the parts, because there are transactions between the companies that were eliminated only in the Consolidated figures.
| Itaú Unibanco Holding S.A. | 47 |
| Management Discussion & Analysis | Segment Analysis | |
Retail Banking
The revenues from Retail Banking come from the offer of banking products and services to retail and high-income clients and very small and small companies, in addition to financial products and services offered to our non-account holder clients, including vehicle financing and credit cards offered outside the branch network, and Itaú BMG Consignado operations.
In the first quarter of 2016, recurring net income for the segment totaled R$2,772 million, a 4.8% increase from the previous quarter.
The increase in net income for the quarter was mainly due to reductions of 8.3% in non-interest expenses and of 5.3% in provision for loan losses, which were partially offset by the 5.0% decrease in operating revenues.
The decrease in operating revenues was due to decreases of 4.9% in the financial margin with clients, 4.8% in commissions and fees and 6.0% in the result from insurance, pension plans and premium bond operations before retained claims and selling expenses.
The Retail Banking annualized return on allocated capital reached 34.2% in the first quarter of 2016. The efficiency ratio was 47.9% and the risk-adjusted efficiency ratio reached 71.4%.
Loan Portfolio – Retail Banking
At the end of March 2016, loan portfolio reached R$218,337 million, a 2.0% decrease from December 31, 2015.
Coverage ratio for NPL over 90 days (without complementary allowance) was 124% on March 31, 2016, remaining stable compared to December 31, 2015.
Allowance for Loan Losses and Coverage Ratio

Wholesale Banking
The revenues from the Wholesale Banking segment come from: i) activities of Itaú BBA, the unit responsible for commercial operations with large companies and for investment banking services, ii) the result from our units abroad, and iii) products and services offered to middle market companies, high-net worth clients (Private Banking) and institutional clients.
In the first quarter of 2016, operating revenues amounted to R$6,822 million, a decrease of 4.5%, or R$320 million, from the previous quarter, mainly due to the decrease of 9.8% in commissions and fees and of 2.7% in financial margin with clients.
Result from loan losses totaled R$2,859 million in the first quarter of 2016, a 216.8% increase from the previous quarter, mainly due to higher provisions for loan losses for specific economic groups due to the challenging economic scenario.
Non-interest expenses decreased 6.7% from the fourth quarter of 2015 and totaled R$2,459 million in the current period.
Net income of the Wholesale Banking segment decreased 49.5% from the previous quarter, totaling R$1,042 million in the first quarter of 2016.
In the first quarter of 2016, return on allocated capital reached 9.0% per year, the efficiency ratio was 37.8%, and the risk-adjusted efficiency ratio reached 81.8%.
Loan Portfolio – Wholesale Banking
The loans portfolio reached R$227,129 million at March 31, 2016, down 9.5% compared to December 31, 2015.
Coverage ratio for NPL over 90 days (without complementary allowance) reached 238% at the end of the first quarter of 2016, 2,000 basis points higher than the previous quarter. In the quarter, the 24.1% increase in the allowance for loan losses was due to higher provisions for loan losses mentioned before.
Allowance for Loan Losses and Coverage Ratio

| Itaú Unibanco Holding S.A. | 48 |
| Management Discussion & Analysis | Segment Analysis | |
Middle Market
This sub-segment serves approximately 29 thousand clients (economic groups) with sales between R$30 million and R$200 million.
Our result is well balanced between earnings from loans and services. Our risk appetite continues to focus on high-rating clients, and 69% of loans are granted to B2 and higher ratings (internal rating).
Our credit portfolio (including sureties and endorsements) decreased 4.9% from the fourth quarter of 2015.
Large Companies
Our clients are approximately 5,800 large corporate groups, 187 financial institutions and 723 institutional clients. We offer them a broad portfolio of banking products and services, from cash management to structured operations and transactions in capital markets.
The credit portfolio (including endorsements and sureties) decreased 9.2% from the fourth quarter of 2015, and the highlight is the decrease in foreign currency products. In our loan portfolio, 86% of credits are rated “AA”, “A” and “B”, according to criteria set forth in Resolution No. 2,682 of the National Monetary Council.
For derivatives, we maintained our relevant position in CETIP (Clearing House for the Custody and Financial Settlement of Securities). We focused on operations that hedge our clients’ exposures to foreign currencies, interest rates and commodities.
Investment Banking
Fixed Income: we took part in local operations with debentures, promissory notes and securitization, which totaled R$1,519 million up to March 2016.
Mergers and Acquisitions: in the period from January to March 2016, our Merger and Acquisition operation provided financial advisory on 7 transactions in Latin America, totaling US$516 million, and reached the leadership in the Thomson Reuters ranking.
Project Finance: We were the exclusive financial advisor to the financing operations of the project related to the wind power plant of the energy utility company CPFL Renováveis (Projeto Eólico Campo dos Ventos da CPFL Renováveis) with 231 MW installed capacity, the largest power generation project of the company. The energy is sold in the free market and the wind parks are located in the State of Rio Grande do Norte. It was the first time that CPFL Renováveis managed to be funded by Project Finance for projects contracted in the free market. The project is expected to start commercial operation in April 2016 and to be fully operational in December 2016. Total long-term financing from BNDES was R$764.1 million.
Wealth Management and Services
Asset Management
In March 2016, we reached R$489.7 billion(*) in managed assets, accounting for 15.8% of the market. In the last 12 months, the volume of managed assets grew 18.8% in the aggregate, and noteworthy were fixed income and pension plan funds. In addition to a strong local presence, we are present in the world’s major financial centers, with strategically allocated professionals, searching for opportunities and investment solutions appropriate for different customer profiles.
(*)Source: ANBIMA (Brazilian Financial and Capital Markets Association) – March 2016. Considers Itaú Unibanco and Intrag.
Securities Services
With four lines of business, the Securities Services area serves both publicly and closely-held companies, pension funds, asset management and international investors, totaling 3,418 clients in 22 countries. We closed March with a custody market share of 23.6% and a total of R$1,125 billion in assets under custody, an 11.7% increase from the same period of 2015. Our business lines are:
Local Custody and Fiduciary Administration: we offer custody and accounting services for portfolios, investment, mutual and pension funds, services of fund administration, rebalancing fund services and contracting of service providers. We ended March with a total of R$975 billion under custody, 15.9% up from the same period of 2015.
International Custody: we offer services of custody and representation to investors outside Brazil, custody of ADR programs and depositary services for Brazilian Depositary Receipts (BDR) programs. We closed March with R$150 billion under custody, a decrease of 9.4% from the volume under custody in the same period of 2015.
Corporate Solutions: we offer many solutions for capital markets, such as control of stock option programs, bookkeeping of shares, debentures, settlement and custody of promissory notes and bank credit notes. We also work as guarantee agents in operations of Project Finance, Escrow Accounts, and loan and financing contracts. We are leaders in the bookkeeping of shares, providing services to 221 companies listed on the BM&F Bovespa, representing 61.7% of the total, and we are also the leaders in the bookkeeping of debentures, acting as bookkeeper of 460 issues as of March 2016.
Source: Itaú Unibanco, ANBIMA (Brazilian Financial and Capital Markets Association) and BM&F Bovespa – March 2016.
Private Bank
With a full global wealth management platform, we are market leaders in Brazil and one of the main players in Latin America. Our multidisciplinary team, which comprises private bankers, investment advisers and product experts, serves our clients from our seven offices in Brazil and in our offices located in Zurich, Miami, New York, Santiago, Asuncion and Nassau.
Activities Abroad
Our activities abroad include business with retail clients and large companies, and investment banking activities in eighteen countries outside Brazil.
Additional information is available on the next pages.
| Itaú Unibanco Holding S.A. | 49 |
| Management Discussion & Analysis | Activities Abroad | |

In Argentina, Chile, Paraguay and Uruguay, we serve the retail banking, companies, corporate and treasury segments, with commercial banking as our main focus. In Peru, we have an Itaú BBA representation office.
On April 1st, 2016, after obtaining all the corporate and regulatory approvals required, the merger of operations between Banco Itaú Chile and CorpBanca was completed. Accordingly, we now hold the control of the resulting bank (Itaú CorpBanca) with a 33.58% stake in its capital. From the second quarter of 2016 on, we will consolidate the financial statements from Itaú CorpBanca.
With this operation, we now rank 4th, from a previous 7th place, among the largest private banks in Chile in terms of loans and we have entered the financial retail market in Colombia through Banco CorpBanca Colombia S.A., the 5th largest bank in terms of loans, which will also operate under the “Itaú” brand.
We consider this operation an important step in our internationalization process, with the creation of this platform aiming at the development of and search for new business opportunities in the financial sector.
Additionally, we have operations in Europe (Portugal, United Kingdom, Spain, France, Germany and Switzerland), in the United States (Miami and New York), in the Caribbean (Cayman Islands and Bahamas), in the Middle East (Dubai), and in Asia (Hong Kong, Shanghai and Tokyo), mainly serving institutional, investment banking, corporate and private banking clients.
Information about the number of employees abroad and the international service network is presented below:
| Employees Abroad | International Service Network | |
 |
 |
| Itaú Unibanco Holding S.A. | 50 |
| Management Discussion & Analysis | Activities Abroad | |
Latin America
Our operations in Latin America are mainly focused on commercial banking and are concentrated in the Southern Cone (Argentina, Chile, Paraguay and Uruguay). Besides these operations we also operate in Colombia in the investment banking and corporate segments. In Peru, we operate in the corporate segment through a representation office.
Latin America is a priority for our international expansion due to the geographic and cultural proximity to Brazil. Our purpose is to be recognized as the “Latin American Bank”, becoming a reference in the region for all financial services provided to individuals or companies.
We have expanded our business in the region in a sustainable way over the past years and, our priority now is to gain economies of scale, to maintain a strong presence in the local retail markets and to strengthen our relationships with local companies.

We are presenting the consolidated results for Latin America as well as for its respective countries in constant currency(1) and, using the managerial concept, which includes the allocation of costs from the structure in Brazil and the impact of Brazilian income tax.
Income Statement | Latin America (2)
| 1Q16 | 4Q15 | |||||||||||||||||||||||||||
| In R$ millions | Nominal Currency | Exchange Rate Effect (1) | Constant Currency | Nominal Currency | Exchange Rate Effect (1) | Constant Currency | Change in Constant Currency | |||||||||||||||||||||
| Operating Revenues | 1,397 | (89 | ) | 1,308 | 1,580 | (149 | ) | 1,431 | -8.6 | % | ||||||||||||||||||
| Managerial Financial Margin | 932 | (63 | ) | 869 | 1,048 | (82 | ) | 966 | -10.1 | % | ||||||||||||||||||
| Financial Margin with Clients | 810 | (40 | ) | 770 | 935 | (107 | ) | 828 | -7.0 | % | ||||||||||||||||||
| Financial Margin with the Market | 122 | (23 | ) | 98 | 113 | 25 | 138 | -28.7 | % | |||||||||||||||||||
| Commissions and Fees | 426 | (25 | ) | 402 | 501 | (66 | ) | 434 | -7.5 | % | ||||||||||||||||||
| Insurance, Pension Plan and Premium Bonds | 38 | (1 | ) | 37 | 31 | (0 | ) | 31 | 20.5 | % | ||||||||||||||||||
| Result from Loan Losses | (165 | ) | 5 | (159 | ) | (112 | ) | 9 | (103 | ) | 54.5 | % | ||||||||||||||||
| Provision for Loan Losses | (180 | ) | 6 | (174 | ) | (133 | ) | 10 | (123 | ) | 41.6 | % | ||||||||||||||||
| Recovery of Loans Written Off as Losses | 15 | (1 | ) | 15 | 21 | (1 | ) | 20 | -25.7 | % | ||||||||||||||||||
| Retained Claims | (11 | ) | 0 | (10 | ) | (11 | ) | 0 | (10 | ) | -1.4 | % | ||||||||||||||||
| Other Operating Expenses | (944 | ) | 38 | (906 | ) | (1,006 | ) | 129 | (877 | ) | 3.3 | % | ||||||||||||||||
| Non-Interest Expenses | (921 | ) | 42 | (879 | ) | (966 | ) | 120 | (846 | ) | 3.9 | % | ||||||||||||||||
| Tax Expenses for ISS, PIS, Cofins and Other Taxes | (23 | ) | (4 | ) | (27 | ) | (40 | ) | 9 | (31 | ) | -12.3 | % | |||||||||||||||
| Insurance Selling Expenses | 0 | (0 | ) | 0 | 0 | (0 | ) | 0 | -98.1 | % | ||||||||||||||||||
| Income before Tax and Minority Interests | 277 | (45 | ) | 232 | 452 | (11 | ) | 441 | -47.3 | % | ||||||||||||||||||
| Income Tax and Social Contribution | (71 | ) | 18 | (52 | ) | (155 | ) | 1 | (154 | ) | -66.0 | % | ||||||||||||||||
| Recurring Net Income | 207 | (27 | ) | 180 | 296 | (9 | ) | 287 | -37.3 | % | ||||||||||||||||||
| Return on Average Equity - Annualized | 11.8 | % | 11.3 | % | 17.2 | % | 17.9 | % | - 660 | bps | ||||||||||||||||||
| Efficiency Ratio | 67.6 | % | 69.2 | % | 63.2 | % | 60.9 | % | 830 | bps | ||||||||||||||||||
(1) Consists of the elimination of foreign exchange variation, which is obtained by the application of the average foreign exchange rate of March 2016 to all periods analyzed and hedge adjustments.
(2) Includes our operations in Argentina, Chile, Paraguay, Uruguay, Colombia, Peru and Mexico.
Net income for the first quarter of 2016 totaled R$180 million, a 37.3% reduction from the fourth quarter of 2015. The financial margin decreased 10.1% in the period, mainly because of the sale of the student loan portfolio in Chile in the previous quarter (impact of R$79 million). Commissions and fees decreased 7.5% mainly due to commissions in the corporate segment (investment structuring) in Chile.
Provision for loan losses increased 41.6% in the first quarter, mainly due to higher provisions in the companies segments in Chile as a result of client ratings review. Non-interest expenses increased 3.9%, in line with the previous quarter.
| Itaú Unibanco Holding S.A. | 51 |
| Management Discussion & Analysis | Activities Abroad | |
Argentina
Net income in Argentina reached R$47 million in the first quarter of 2016. The financial margin decreased 8.2% in the quarter, mainly due to higher treasury results of the last quarter of 2015 (higher market volatility).
Commissions and fees totaled R$90 million, a 10.6% increase compared to the previous quarter, mainly due to better results from fees related to current accounts and foreign trade.
The provision for loan losses reached R$16 million in the quarter due to the higher default levels in corporate and companies segments. Non-interest expenses reached R$197 million, an increase of 10.7% from the previous quarter, mainly due to marketing, promotion and personnel expenses.
Income Statement | Argentina
| In R$ millions | 1Q16 | 4Q15 | change | |||||||||
| Operating Revenues | 312 | 324 | -3.5 | % | ||||||||
| Managerial Financial Margin | 223 | 243 | -8.2 | % | ||||||||
| Financial Margin with Clients | 189 | 169 | 11.8 | % | ||||||||
| Financial Margin with the Market | 34 | 74 | -53.8 | % | ||||||||
| Commissions and Fees | 90 | 81 | 10.6 | % | ||||||||
| Result from Loan Losses | (15 | ) | (4 | ) | 225.9 | % | ||||||
| Provision for Loan Losses | (16 | ) | (6 | ) | 159.3 | % | ||||||
| Recovery of Loans Written Off as Losses | 1 | 2 | -24.0 | % | ||||||||
| Other Operating Expenses | (223 | ) | (207 | ) | 7.5 | % | ||||||
| Non-Interest Expenses | (197 | ) | (178 | ) | 10.7 | % | ||||||
| Tax Expenses for ISS, PIS, Cofins and Other Taxes | (26 | ) | (29 | ) | -11.9 | % | ||||||
| Income before Tax and Minority Interests | 75 | 112 | -33.1 | % | ||||||||
| Income Tax and Social Contribution | (28 | ) | (46 | ) | -39.5 | % | ||||||
| Recurring Net Income | 47 | 66 | -28.6 | % | ||||||||
| Return on Average Equity - Annualized | 30.1 | % | 51.6 | % | -2150 | bps | ||||||
| Efficiency Ratio | 68.8 | % | 60.4 | % | 830 | bps | ||||||
Chile
In Chile, we operate in the commercial bank (retail), including high-income clients segments, in addition to operations in the companies and corporate segments.
Net income was R$18 million this quarter. The financial margin decreased 25.9%, mainly due to the sale of the student loan portfolio, with a positive impact of R$79 million in the previous quarter, associated with lower results with treasury (commercial operation and derivatives).
Commissions and fees decreased 14.6% in the quarter due to lower commissions in the corporate segment (investment structuring).
The provision for loan losses reached R$122 million, up 63.3% compared to the previous quarter, mainly due to the ratings review of corporate clients.
Non-interest expenses grew 5.9%, mainly driven by expenses with CorpBanca integration and technology expenses.
Income Statement | Chile
| In R$ millions | 1Q16 | 4Q15 | change | |||||||||
| Operating Revenues | 434 | 548 | -20.9 | % | ||||||||
| Managerial Financial Margin | 296 | 400 | -25.9 | % | ||||||||
| Financial Margin with Clients | 300 | 379 | -21.0 | % | ||||||||
| Financial Margin with the Market | (3 | ) | 21 | -116.6 | % | |||||||
| Commissions and Fees | 100 | 117 | -14.6 | % | ||||||||
| Insurance, Pension Plan and Premium Bonds | 37 | 31 | 20.5 | % | ||||||||
| Result from Loan Losses | (110 | ) | (62 | ) | 77.1 | % | ||||||
| Provision for Loan Losses | (122 | ) | (74 | ) | 63.3 | % | ||||||
| Recovery of Loans Written Off as Losses | 11 | 12 | -6.9 | % | ||||||||
| Retained Claims | (10 | ) | (10 | ) | -1.4 | % | ||||||
| Other Operating Expenses | (335 | ) | (317 | ) | 5.6 | % | ||||||
| Non-Interest Expenses | (334 | ) | (315 | ) | 5.9 | % | ||||||
| Tax Expenses for ISS, PIS, Cofins and Other Taxes | (0 | ) | (0 | ) | -6.6 | % | ||||||
| Insurance Selling Expenses | (1 | ) | (2 | ) | -52.2 | % | ||||||
| Income before Tax and Minority Interests | (22 | ) | 158 | -113.8 | % | |||||||
| Income Tax and Social Contribution | 40 | (46 | ) | -187.8 | % | |||||||
| Recurring Net Income | 18 | 113 | -83.9 | % | ||||||||
| Return on Average Equity - Annualized | 4.0 | % | 12.3 | % | -830 | bps | ||||||
| Efficiency Ratio | 79.1 | % | 58.8 | % | 2020 | bps | ||||||
| Itaú Unibanco Holding S.A. | 52 |
| Management Discussion & Analysis | Activities Abroad | |
Paraguay
Our strategy for the commercial (retail) and companies segments over the past few years, allowed the consolidation of our position in the market. We hold the leading position among banks in Paraguay in terms of results and deposits (data provided by the Central Bank of Paraguay, December 2015).
Net income in Paraguay totaled R$47 million this quarter, a 12.5% decrease from the previous quarter, mainly due to the increase in marketing and personnel expenses.
Income Statement | Paraguay
| In R$ millions | 1Q16 | 4Q15 | change | |||||||||
| Operating Revenues | 191 | 195 | -2.0 | % | ||||||||
| Managerial Financial Margin | 138 | 137 | 0.3 | % | ||||||||
| Financial Margin with Clients | 108 | 118 | -8.5 | % | ||||||||
| Financial Margin with the Market | 30 | 20 | 53.3 | % | ||||||||
| Commissions and Fees | 54 | 58 | -7.5 | % | ||||||||
| Result from Loan Losses | (14 | ) | (14 | ) | 0.4 | % | ||||||
| Provision for Loan Losses | (16 | ) | (15 | ) | 0.9 | % | ||||||
| Recovery of Loans Written Off as Losses | 1 | 1 | 6.7 | % | ||||||||
| Other Operating Expenses | (102 | ) | (94 | ) | 8.5 | % | ||||||
| Non-Interest Expenses | (102 | ) | (94 | ) | 8.5 | % | ||||||
| Tax Expenses for ISS, PIS, Cofins and Other Taxes | 0 | 0 | 37.4 | % | ||||||||
| Income before Tax and Minority Interests | 75 | 87 | -13.6 | % | ||||||||
| Income Tax and Social Contribution | (29 | ) | (34 | ) | -15.5 | % | ||||||
| Recurring Net Income | 47 | 54 | -12.5 | % | ||||||||
| Return on Average Equity - Annualized | 20.9 | % | 23.6 | % | -280 | bps | ||||||
| Efficiency Ratio | 53.2 | % | 48.0 | % | 510 | bps | ||||||
Uruguay
We are the third largest private bank in Uruguay in terms of loan portfolio (data provided by the Central Bank of Uruguay - BCU, December 2015) and in 2015 we were recognized as the best bank in Uruguay by Euromoney magazine. We are also the leading player in the credit card segment through our credit card operator OCA.
Net income of our operations in Uruguay was R$58 million, an increase of 59.8% compared to the previous quarter. The financial margin increased 11.6% due to better results from treasury operations. The provision for loan losses reduced 38.5% this quarter, mainly because of the lower default rate in the retail segment.
Non-Interest Expenses decreased 5.1% during the period, mainly due to the decrease in marketing and personnel expenses.
Income Statement | Uruguay
| In R$ millions | 1Q16 | 4Q15 | change | |||||||||
| Operating Revenues | 318 | 301 | 5.7 | % | ||||||||
| Managerial Financial Margin | 164 | 147 | 11.6 | % | ||||||||
| Financial Margin with Clients | 132 | 126 | 4.7 | % | ||||||||
| Financial Margin with the Market | 32 | 21 | 52.5 | % | ||||||||
| Commissions and Fees | 154 | 154 | 0.0 | % | ||||||||
| Result from Loan Losses | (15 | ) | (25 | ) | -39.0 | % | ||||||
| Provision for Loan Losses | (16 | ) | (25 | ) | -38.5 | % | ||||||
| Recovery of Loans Written Off as Losses | 1 | 1 | -25.0 | % | ||||||||
| Other Operating Expenses | (209 | ) | (220 | ) | -5.0 | % | ||||||
| Non-Interest Expenses | (209 | ) | (220 | ) | -5.1 | % | ||||||
| Tax Expenses for ISS, PIS, Cofins and Other Taxes | (1 | ) | (0 | ) | 26.7 | % | ||||||
| Income before Tax and Minority Interests | 94 | 56 | 66.6 | % | ||||||||
| Income Tax and Social Contribution | (36 | ) | (20 | ) | 79.2 | % | ||||||
| Recurring Net Income | 58 | 37 | 59.8 | % | ||||||||
| Return on Average Equity - Annualized | 23.6 | % | 17.8 | % | 580 | bps | ||||||
| Efficiency Ratio | 65.7 | % | 73.1 | % | -740 | bps | ||||||
Colombia
Our presence in Colombia will be expanded with the merger with CorpBanca.
Peru
In Peru, we have a representation office and we are considering increasing our activities in corporate and investment banking segments, following the same strategy as in Colombia, in order to take advantage of the country’s strong growth.
Mexico
As part of the restructuring of our activities in Latin America, Itau BBA is resizing its presence in the country.
| Itaú Unibanco Holding S.A. | 53 |
(This page was intentionally left blank)
| Itaú Unibanco Holding S.A. | 54 |
| Management Discussion & Analysis | Ownership Structure | |
Itaú Unibanco Holding’s capital stock is comprised of common shares (ITUB3) and non-voting shares (ITUB4), both traded on the BM&FBOVESPA. The non-voting shares are also traded as depositary receipts on the NYSE (New York) and BCBA (Argentina) as ADRs and CEDEARs, respectively.

Outstanding Shares | Itaú Unibanco Holding S.A.
| In thousands | Common Shares | Non-voting Shares | Total | |||||||||
| Number of Shares (1) | 3,047,040 | 2,936,876 | 5,983,916 | |||||||||
| Treasury Shares | ||||||||||||
| On 12/31/2015 | 2.8 | 162,563 | 162,565 | |||||||||
| Purchases of treasury shares | - | 7,990 | 7,990 | |||||||||
| Exercised options - Granting of stock options | - | (7,840 | ) | (7,840 | ) | |||||||
| Disposals - Stock option plan | - | (7,484 | ) | (7,484 | ) | |||||||
| On 03/31/2016 (2) | 2.8 | 155,229 | 155,232 | |||||||||
| Cancellation of Shares (approved in the Stockholders’ Meeting on 04/27/2016) (1) | - | (100,000 | ) | (100,000 | ) | |||||||
| After Cancellation of Shares | 2.8 | 55,229 | 55,232 | |||||||||
| Total Shares (-) Treasury Shares (1) | 3,047,037 | 2,881,647 | 5,928,684 | |||||||||
(1) Considering the effect of the cancellation of shares, which is still pending approval of the Central Bank. (2) The average cost of non-voting treasury shares was R$26.70 and of the common treasury shares was R$7.25. For further information, including information on the “Stock Option Plan”, see Note 16 to the financial statements.
Our ownership structure aims to optimize capital allocation among the many segments that compose the conglomerate. Itaú Unibanco Holding is controlled by IUPAR, which is jointly controlled by Itaúsa and Cia. E. Johnston. Itaúsa is controlled by the members of the Egydio de Souza Aranha family while Cia. E. Johnston is controlled by the members of the Moreira Salles family.
The organizational chart below summarizes the current ownership structure as at March 31, 2016:

Note: The percentages do not include treasury shares.
(1) Besides the treasury stocks, the percentages do not consider the participation of controlling stockholders.
Shares Buyback Program
In the first quarter of 2016, we acquired 7.99 million non-voting shares, in the total amount of R$200.2 million, at the average price of R$25.06 per share. In March 2016, the balance of treasury shares reached 155.2 million non-voting shares, equivalent to 5.4% of outstanding shares of the same class (free float).
On April 27, the Extraordinary Stockholders’ Meeting approved the proposal to cancel 100 million non-voting treasury shares(1), without capital stock change, resulting in a balance of 55.2 million shares
(1) Pending approval of the Brazilian Central Bank.
Free Float - Non-voting Shares | on 03/31/2016
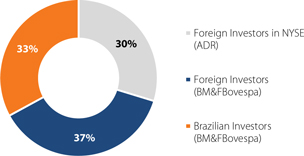
| Itaú Unibanco Holding S.A. | 56 |
| Management Discussion & Analysis | Stock Market Performance | |
Stock Market Performance | 1Q16
Our common and non-voting shares were traded on all BM&FBOVESPA´s sessions during the first quarter of 2016. Additionally, our non-voting shares are included in several Stock Exchange indexes on which financial institutions shares may be listed.
| (R$) | (R$) | (US$) | ||||||||||
| Non-voting Shares | Common Shares | ADRs | ||||||||||
| ITUB4 | ITUB3 | ITUB | ||||||||||
| Closing Price at 03/31/2016 | 31.21 | 26.71 | 8.59 | |||||||||
| Maximum price in the quarter | 33.56 | 28.70 | 9.20 | |||||||||
| Average price in the quarter | 26.89 | 24.09 | 6.91 | |||||||||
| Minimum price in the quarter | 22.81 | 21.49 | 5.48 | |||||||||
| Closing Price at 12/31/2015(1) | 26.33 | 24.58 | 6.51 | |||||||||
| Maximum price in 12 months(2)(3) | 35.91 | 32.66 | 12.12 | |||||||||
| Average price in 12 months (2) | 28.98 | 26.78 | 8.21 | |||||||||
| Minimum price in 12 months(2)(4) | 22.81 | 21.49 | 5.48 | |||||||||
| Closing Price at 03/31/2015 | 32.10 | 29.25 | 10.05 | |||||||||
| Change in 1Q16 | 18.5 | % | 8.7 | % | 32.0 | % | ||||||
| Change in the last 12 months | -2.8 | % | -8.7 | % | -14.6 | % | ||||||
| Average daily trading financial volume - in 12 months (million)(2) | 479.7 | 3.3 | 146.1 | |||||||||
| Average daily trading financial volume in 1Q16 (million) | 480.4 | 4.7 | 143.4 | |||||||||
(1) On 12/31/2015 no trading session was held at the BM&FBOVESPA. Therefore, the amounts presented refer to 12/30/2015.
(2) From 04/01/15 to 03/31/16;
(3) Prices on 04/27/15 for non-voting shares, on 04/24/15 for common shares and on 04/28/15 for ADRs;
(4) Prices on 01/22/16 for non-voting shares, on 01/26/16 for common shares and on 01/21/16 for ADRs.
Closing price at the end of each period (1)
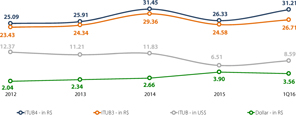
(1) ITUB4, ITUB3 and ITUB historical information of 2014, 2013 and 2012 was adjusted by the July 2015, June 2014 and May 2013 bonuses.
Liquidity of our shares
| 1Q16 | 4Q15 | 1Q15 | ||||||||||
| BM&FBovespa (ITUB4) | ||||||||||||
| Total Financial Volume Traded in the spot market (R$ million) | 28,823 | 29,042 | 28,077 | |||||||||
| Volume of Transactions (thousand) | 2,125.3 | 2,101.5 | 1,751.5 | |||||||||
| Average volume by transaction (R$ thousand) | 13.6 | 13.8 | 16.0 | |||||||||
| Negotiability Index (1) | 4.68 | % | 5.07 | % | 4.53 | % | ||||||
| NYSE (ADR) | ||||||||||||
| Total Financial Volume Traded (R$ million) | 33,522 | 33,975 | 30,070 | |||||||||
| Volume of Transactions (thousand) | 2,547.9 | 2,316.6 | 2,416.6 | |||||||||
| Average volume by transaction (R$ thousand) | 13.2 | 14.7 | 12.4 | |||||||||
| Total outstanding ADRs (million) | 856.4 | 873.9 | 911.1 | |||||||||
| Ratio of Total Outstanding ADRs to Total Outstanding Non-Voting Shares | 29.7 | % | 30.4 | % | 33.8 | % | ||||||
(1) The negotiation index represents the percentage of share trading in relation to all shares traded in the spot market on BM&FBovespa. For calculation purposes, it considered the trading in the three last months of each period. Source: Economática.
Market Capitalization vs. Ibovespa Index
On March 31, 2016, our market capitalization was R$185.4 billion, and the compound annual growth rate (CAGR) was 6.6% since 2012. The Ibovespa index reached 50.1 thousand points in the same period and its CAGR was 5.9% negative. According to information provided by Bloomberg, on March 31, 2016 we were the 2nd largest company by market capitalization in Brazil and the largest among financial institutions.
Market Indicators
| · | Price / Earnings1 – represents the ratio of price to net income per share. |
| · | Price / Book Value2 – represents the ratio of market capitalization to stockholders' equity. |
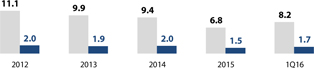
(1): Closing price of non-voting share at the period end/Earnings per share. For calculation purposes, the retained earnings of the last 12 months were considered. (2): Closing price of non-voting share at the period-end/Book value per share.
Average Daily Trading Volume (BM&FBovespa + NYSE)

Financial trading profile by investor
Foreign investors accounted for 72.6% of the financial volume of our shares traded on stock exchanges in the first quarter of 2016.
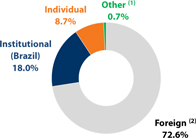
(1) Cooperatives, public companies, limited-liability companies, municipal/state/federal governments, financial entities, churches and charities and/or non-profit organizations, among others.
(2) Includes foreign investors trading on the BM&FBOVESPA, as well those trading on the NYSE.
Dividends and Interest on Capital
We remunerate our stockholders by means of monthly and complementary payments of dividends and interest on capital. In the first quarter of 2016, we paid or recognized a provision of R$1.0 billion in dividends and interest on capital, net of taxes.
Dividend Yield (Dividends and Interest on Capital Distributed / Average Price1) It is the ratio of total dividends/interest on capital distributed to the share price, which indicates the return on investment to the stockholder through profit sharing during each period.
Payout (Net Dividends and Interest on Capital Distributed / Net Income)
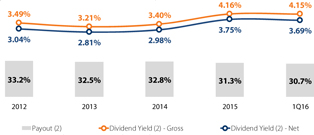
(1): Average price on the first day of each period.
(2): For calculation purposes, it was considered the total Dividends/Interest on capital distributed in the last 12 months of each period.
| Itaú Unibanco Holding S.A. | 57 |
| Management Discussion & Analysis | Stock Market Performance | |
Market Consensus
Major market analysts periodically issue recommendations on the shares that are the subject matter of their analysis. These recommendations help many investors choose the best option in which to invest their capital.
Based on information provided by Thomson Analytics and Bloomberg on March 31, 2016, we present in the table below a summary of the recommendations on Itaú Unibanco Holding’s non -voting shares.
| Thomson | Bloomberg | ||
| Buy | 10 | 12 | |
| Hold | 5 | 6 | |
| Sell | 4 | 5 | |
| Number of Analysts | 19 | 23 |
Based on the information provided by Thomson, the average estimated target price for 2016 was R$29.78. According to Bloom-berg, the average estimated target price was R$30.35.
Main Market Index
The weights of our common and non-voting shares in the BM&FBOVESPA’s indexes of the current portfolios from January to April 2016 are shown in the chart below.
| ITUB3 | ITUB4 | |||||||||
| Weights | Weights and Ranking 1 | |||||||||
| Ibovespa (Bovespa Index) | - | 10.69 | % | 1st | ||||||
| IBrX - 50 (Brazil Index 50) | - | 10.42 | % | 2nd | ||||||
| IBrX - 100 (Brazil Index 100) | - | 9.23 | % | 2nd | ||||||
| IBrA (Brazil Broad-Based Index) | 0.84 | % | 9.03 | % | 2nd | |||||
| IFNC (Financial Index) 2 | 1.71 | % | 18.30 | % | 1st | |||||
| IGCT (Corporate Governance Trade Index) | 1.05 | % | 11.22 | % | 1st | |||||
| ITAG (Special Tag Along Stock Index) | - | 11.91 | % | 1st | ||||||
| IGCX (Special Corporate Governance Stock Index) | 0.63 | % | 6.73 | % | 2nd | |||||
| MLCX (Mid-Large Cap Index) | 0.93 | % | 9.98 | % | 2nd | |||||
| ICO2 (Carbon Efficient Index) | - | 14.11 | % | 1st | ||||||
| ISE (Corporate Sustainability Index) 3 | 0.57 | % | 6.08 | % | 5th | |||||
(1) Position of the ITUB4 share when the components of the index are ordered based on their weights.
(2) The weight of the companies’ shares in the index (including all types of shares) cannot exceed 20%.
(3) The weight of one economic sector in the Corporate Sustainability Index (ISE), including all types of shares, cannot exceed 15%.
Net Income per Share1 and Recurring Net Income per Share1
In the twelve-month period before March 31, 2016, 1.7% treasury shares issued were acquired, with a positive impact on recurring net income per share for the 12 months of R$0.07.

(1) For calculation purposes, the retained earnings of the last 12 months were considered.
(2) ITUB4, ITUB3 and ITUB historical information of 2014, 2013 and 2012 was adjusted by the July 2015, June 2014 and May 2013 bonus.
Credit Risk Assessment by Rating Agencies
As a result of Moody’s downgrade of Brazil’s sovereign credit rating and the changes arising from the ceilings for debt and deposit in Brazil, in February 2016 this rating agency announced changes in the ratings of 31 financial institutions, including Itaú Unibanco S.A. and Itaú Unibanco Holding S.A.
As a consequence of the sovereign credit rating downgrade, announced by Standard & Poor’s in February 2016, this rating agency also reviewed the ratings of 44 Brazilian financial institutions, including Itaú Unibanco S.A. and Itaú Unibanco Holding S.A.
To learn more about these ratings, please visit (www.itau.com.br/ investor-relations) in Itaú Unibanco > Market Opinion > Ratings.
Non-voting Shares (ITUB4) Appreciation
The chart below shows the simulation of R$100 invested on March 31, 2006 through March 31, 2016, by comparing the amounts with and without the reinvestment of dividends to the performance of Ibovespa and the CDI (Interbank Deposit Certificate).

| Itaú Unibanco Holding S.A. | 58 |
| Management Discussion & Analysis | Stock Market Performance | |
Mergers, Acquisitions and Partnerships
Merger of Itaú Chile and CorpBanca Operations – On April 1st, 2016, we consummated the merger of Banco Itaú Chile and CorpBanca, and now we hold the control of the resulting entity – named Itaú CorpBanca – with a 33.58% stake in its capital. On the same date, we entered into the Itaú CorpBanca’s Shareholders’ Agreement, which entitles us to appoint, together with Corp Group*, the majority of members for the Board of Directors of Itaú CorpBanca. These members are appointed in accordance with the ownership interest of each party, and we are entitled to elect the majority of this block.
With the consummation of this operation, we now rank 4th, from a previous 7th place, among the largest banks in Chile in terms of loans and we have entered the financial retail market in Colombia through Banco CorpBanca Colômbia S.A., the 5th largest bank in terms of loans, which also operate under the “Itaú” brand.
We estimate that gains from business opportunities and operating synergies will effectively be generated in the coming years, with no relevant financial impact in 2016. As from April 1, 2016, Itaú CorpBanca is consolidated in Itaú Unibanco’s financial statements, thus adding approximately R$117 billion (December 2015) of assets to the balance sheet.
On the same date, we launched a new Investor Relations website for Itaú Corpbanca.
(*)Corp Group is a diversified holding company controlled by the Saieh Family, with investments in the financial, retail, real estate, hotel and media sectors.
Control Acquisition – Recovery – In March 2016, after obtaining required regulatory authorizations and complying with related suspension conditions, we completed the purchase of an 89.08% stake in Recovery do Brasil Consultoria S.A., of which 81.94% for Banco BTG Pactual S.A. (BTG) and 7.14% for other shareholders, and of approximately 70% of a R$38 billion portfolio in credit rights held by BTG. The operation is not expect to have significant accounting effects on Itaú Unibanco’s results in 2016.
Decision not to Register a Public Offering for the Secondary Distribution of Shares - IRB – In February 2016, our subsidiaries Itaú Seguros S.A. and Itaú Vida e Previdência S.A., as shareholders of IRB-Brasil Resseguros S.A. (IRB), announced that they had decided not to register a Public Offering for the Secondary Distribution of IRB common shares, as a result of the unfavorable market scenario for such offering.
Annual and Extraordinary Stockholders’ Meetings
On April 27, 2016, we held Annual and Extraordinary Stockholders’ Meetings for our shareholders to resolve mainly on:
| · | Approval of the financial statements for the year ended December 31, 2015 and of the allocation of net income for this period; |
| · | Election of members for the Board of Directors and Fiscal Council; |
| · | Cancellation of 100 million non-voting shares – as mentioned before. |
The Stockholders’ Meeting Manual, which was made available 30 days in advance of the meeting, and the main resolutions are available on our Investor Relations website www.itau.com.br/ relacoes-com-investidores and on the websites of CVM, BM&FBOVESPA, SEC and BCBA.
Digital Stockholders’ Meeting – For the fifth consecutive year we made available to our stockholders the Electronic Voting Platform, which mainly aims at encouraging and expediting their participation in the Meeting. We were the first financial institution to provide this mechanism in Brazil, thus allowing our stockholders to exercise their right to vote from any part of the world, without having to attend the Meeting in person.
2016 Agenda
| May | ||||
| 04 | Conference Call – 1st Quarter Result | |||
| 30 |
APIMEC - Rio de Janeiro / RJ
Venue: Sofitel Rio de Janeiro Copacabana |
Time: 8:00 a.m. | ||
| 31 |
APIMEC - Fortaleza / CE
Venue: Hotel Gran Marquise |
Time: 7:00 p.m. | ||
| June | ||||
| 02 |
APIMEC - Brasília / DF
Venue: Windsor Plaza Brasília Hotel |
Time: 12:00 p.m. | ||
| 09 |
APIMEC - Porto Alegre / RS
Venue: Sheraton Porto Alegre Hotel |
Time: 7:00 p.m. | ||
| 26 |
APIMEC - Belo Horizonte / MG
Venue: Mercure Belo Horizonte Lourdes Hotel |
Time: 12:00 p.m. | ||
| August | ||||
| 02 | 2nd Quarter Result | |||
| October | ||||
| 31 | 3rd Quarter Result | |||
| November | ||||
| 17 |
APIMEC – São Paulo / SP
Local: Hotel Unique |
Time: 2:00 p.m. |
| Itaú Unibanco Holding S.A. | 59 |
| Management Discussion & Analysis | Stock Market Performance | |
(This page was intentionally left blank)
| Itaú Unibanco Holding S.A. | 60 |

(A free translation of the original in Portuguese)
Report of independent auditors on supplementary information
To the Board of Directors and Stockholders
Itaú Unibanco Holding S.A.
Introduction
In connection with our review of the financial statements of Itaú Unibanco Holding S.A. (Bank) and Itaú Unibanco Holding S.A. and its subsidiary companies (Consolidated) as of March 31, 2016, on which we issued a report without exceptions dated May, 2, 2016, we performed a review of the accounting information contained in the supplementary information included in the Management Discussion and Analysis Report of Itaú Unibanco Holding S.A. and its subsidiaries for the three month period ended March 31, 2016.
Scope of the Review
We conducted our review in accordance with Brazilian standards issued by the Federal Accountancy Council. Our review mainly comprised: (a) inquiry of, and discussion with, management responsible for the accounting, financial and operational areas of the Bank and its subsidiaries with regard to the main criteria adopted for the preparation of the accounting information presented in the supplementary information and (b) review of the significant information and of the subsequent events which have, or could have, significant effects on the financial position and the operations of the Bank and its subsidiaries. The supplementary information included in the Management Discussion and Analysis Report is presented to permit additional analysis. Notwithstanding, this information should not be considered an integral part of the financial statements.
Conclusion
Based on our review, we are not aware of any material modifications that should be made to the accounting information contained in this supplementary information, in order for it to be adequately presented, in all material respects, in relation to the financial statements at March 31, 2016, taken as a whole, prepared in accordance with the accounting practices adopted in Brazil applicable to institutions authorized to operate by the Brazilian Central Bank (BACEN).
| São Paulo, May, 2, 2016 | |
 |
 |
| PricewaterhouseCoopers | WashingtoirLuiz Pereira Cavalcanti |
| Auditores Independentes | Contador CRC 1SP173647/O-5 |
| CRC 2SP000160/O-5 |
| Itaú Unibanco Holding S.A. | 61 |
(This page was intentionally left blank)
| Itaú Unibanco Holding S.A. | 62 |
Serious News for Serious Traders! Try StreetInsider.com Premium Free!
You May Also Be Interested In
- ITAÚ UNIBANCO - Interactive Meeting 1Q24
- Dogs Thrive on Vegan Diets, Demonstrates the Most Comprehensive Study So Far
- Telehealth and Telemedicine Market to Surpass USD 818.87 Billion by 2031 Driven by Soaring Demand for Digital Healthcare Solutions
Create E-mail Alert Related Categories
SEC FilingsSign up for StreetInsider Free!
Receive full access to all new and archived articles, unlimited portfolio tracking, e-mail alerts, custom newswires and RSS feeds - and more!
