

Form 6-K Itau Unibanco Holding For: Mar 31
 Tweet
Tweet Share
Share
SECURITIES AND EXCHANGE COMMISSION
Washington, D.C. 20549
FORM 6-K
Report of Foreign Issuer
Pursuant to Rule 13a-16 or 15d-16 of
the Securities Exchange Act of 1934
For the month of
May 2016
Commission File Number: 001-15276
Itaú Unibanco Holding S.A.
(Exact name of registrant as specified in its charter)
Itaú Unibanco Holding S.A.
(Translation of Registrant’s Name into English)
Praça Alfredo Egydio de Souza Aranha, 100-Torre Conceicao - CEP
04344-902 São Paulo, SP, Brazil
(Address of principal executive offices)
Indicate by check mark whether the registrant files or will file annual reports under cover Form 20-F or Form 40-F.
Form 20-F: x Form 40-F: ¨
Indicate by check mark if the registrant is submitting the Form 6-K in paper as permitted by Regulation S-T Rule 101(b)(1):
Yes: ¨ No: x
Indicate by check mark if the registrant is submitting the Form 6-K in paper as permitted by Regulation S-T Rule 101(b)(7):
Yes: ¨ No: x
Indicate by check mark whether by furnishing the information contained in this Form, the registrant is also thereby furnishing information to the Commission pursuant to Rule 12g3-2(b) under the Securities Exchange Act of 1934.
Yes: ¨ No: x
If
“Yes” is marked, indicate below the file number assigned to the registrant in connection with Rule 12g3-2(b):
82-___________________.
SIGNATURES
Pursuant to the requirements of the Securities Exchange Act of 1934, the registrant has duly caused this report to be signed on its behalf by the undersigned, thereunto duly authorized.
| Itaú Unibanco Holding S.A. | ||||
| (Registrant) | ||||
| Date: May 5, 2016 | By: | /s/ Marcelo Kopel | ||
| Name: | Marcelo Kopel | |||
| Title: | Investor Relations Officer | |||
| By: | /s/ Eduardo Mazzilli de Vassimon | |||
| Name: | Eduardo Mazzilli de Vassimon | |||
| Title: | Chief Financial Officer | |||
EXHIBIT INDEX
| 99.1 |
Risk and Capital Management Pillar 3 - 1st quarter of 2016 |
Exhibit 99.1

| Risk and Capital Management – Pillar 3 |
| OBJECTIVE | 4 | |
| KEY INDICATORS | 4 | |
| 1 | RISK AND CAPITAL MANAGEMENT | 5 |
| 1.1 | Organizational Structure | 5 |
| 1.2 | Risk and Capital Governance | 6 |
| 2 | CAPITAL | 7 |
| 2.1 | Capital Management | 7 |
| 2.2 | Capital Requirements in Place and in Progress | 7 |
| 2.3 | Capital Composition | 9 |
| 2.4 | Risk-Weighted Asset (RWA) | 10 |
| Risk-Weighted Assets for Credit Risk (RWACPAD) | 11 | |
| Risk-Weighted Assets for Market Risk (RWAMPAD) | 11 | |
| Risk-Weighted Assets for Operational Risk (RWAOPAD) | 11 | |
| 2.5 | Additional Common Equity Tier I | 12 |
| 2.6 | Capital Adequacy | 12 |
| 2.7 | Leverage Ratio | 14 |
| 3 | BALANCE SHEET | 15 |
| Balance Sheet | 15 | |
| Institutions that comprises the Financial Statements of Itaú Unibanco Holding | 17 | |
| Material entities | 18 | |
| 4 | INVESTMENTS IN OTHER ENTITIES | 19 |
| 4.1 | Investments in other entities not classified in the trading book | 19 |
| 5 | CREDIT RISK | 20 |
| 5.1 | Framework and Treatment | 20 |
| 5.2 | Credit Portfolio Analysis | 22 |
| Operations with Credit Granting Characteristics by Brazil Geographic Regions and by Countries | 22 | |
| Operations with Credit Granting Characteristics by Economic Sector | 23 | |
| Remaining maturity of loan transactions | 24 | |
| Concentration on the Major Debtors | 24 | |
| Overdue Amounts | 25 | |
| Allowance for Loan Losses | 25 | |
| Mitigating Instruments | 26 | |
| Counterparty Credit Risk | 27 | |
| Acquisitions, Sale or Transfer of Financial Assets | 28 | |
| Operations of Securitization | 29 | |
| Credit Derivatives | 30 | |
| 6 | MARKET RISK | 31 |
| 6.1 | Framework and Treatment | 31 |
| 6.2 | Portfolio Analysis | 34 |
| Interest rate risk in the non-trading book | 34 | |
| Evolution of the Trading Portfolio | 35 | |
| Evolution of the Derivatives Portfolio | 35 | |
| VaR - Consolidated Itaú Unibanco | 36 | |
| VaR - Trading Portfolio | 36 | |
| Backtesting | 37 | |
| Itaú Unibanco |
| Risk and Capital Management – Pillar 3 |
| 7 | OPERATIONAL RISK | 38 |
| 7.1 | Framework and Treatment | 38 |
| 7.2 | Crisis Management and Business Continuity | 39 |
| 8 | LIQUIDITY RISK | 40 |
| 8.1 | Framework and Treatment | 40 |
| 8.2 | Primary Sources of Funding | 41 |
| 9 | OTHER RISKS | 41 |
| Insurance products, pension plans and “capitalização” risks | 41 | |
| Social and Environmental Risk | 42 | |
| Risk Regulatory Risk | 42 | |
| Model Risk | 42 | |
| Country Risk | 43 | |
| Business and Strategy Risk | 43 | |
| Reputational Risk | 43 | |
| 10 | ENTERPRISE RISK MANAGEMENT AND ALIGNMENT OF INCENTIVES | 45 |
| Risk Appetite | 45 | |
| Stress Test | 45 | |
| Risk-adjusted Compensation | 45 | |
| 11 | APPENDIX I | 47 |
| 12 | GLOSSARIES | 50 |
| 12.1 | Glossary of Acronyms | 50 |
| 12.2 | Glossary of Regulations | 52 |
| Itaú Unibanco |
| Risk and Capital Management – Pillar 3 |
Objective
This document aims at submitting Itaú Unibanco Holding S.A. (Itaú Unibanco) information required by the Central Bank of Brazil (BACEN) through Circulars 3,678 and 3,716, which address the disclosure of information on risks management, calculation of risk-weighted assets (RWA), and calculation of the Referential Equity (PR), consistently with the capital rules and in accordance with Itaú Unibanco’s institutional standards.
For other information than the contained on this document, please visit http://www.itau.com.br/investor-relations.
Key indicators
Itaú Unibanco’s risk and capital management focuses on maintaining the institution’s risk profile in line with the risk strategy and guidelines approved by the Board of Directors. The main metrics of the Prudential Conglomerate, on March 31, 2016, are summarized below.
| BIS Ratio | Common Equity Tier I Ratio | Tier II Ratio | ||
| 17.7% | 14.3% | 3.4% | ||
| December 31, 2015: 17.8% | December 31, 2015: 14.0% | December 31, 2015: 3.8% | ||
| Referential Equity | Common Equity Tier I | Tier II | ||
| R$ 122,872 million | R$ 99,220 million | R$ 23,582 million | ||
| December 31, 2015: R$ 128,465 million | December 31, 2015: R$ 100,955 million | December 31, 2015: R$ 27,464 million |
| RWA | Credit Risk Exposure | |
| R$ 694,899 million | R$ 637,179 million | |
| December 31, 2015: R$ 722,468 million | December 31, 2015: R$ 679,593 million | |
 |
 |
| 4 | |
| Itaú Unibanco |
| Risk and Capital Management – Pillar 3 |
| 1 | Risk and Capital Management |
Itaú Unibanco understands risk and capital management as essential to optimize the use of resources and to select the best business opportunities, seeking to maximize value creation for its shareholders.
The Risk Management process at Itaú Unibanco:
| · | Identifies and measures existing and potential risks to Itaú Unibanco’s positions; |
| · | Aligns risk management and control institutional policies, procedures and methodologies with the directives from, and approved by, the Board of Directors; |
| · | Seeks the best risk-return ratios for Itaú Unibanco’s portfolio management. |
The risk identification process purpose is to map internal and external risk threats that may affect the business’ and support units’ strategies, potentially impacting Itaú Unibanco’s results, capital, liquidity and reputation.
The risk management processes permeate the entire institution and are aligned with the Board of Directors and the Senior Management directives, which define the overall objectives by setting targets and limits for business units through its corporate bodies. The capital management and control units support Itaú Unibanco’s management through monitoring and analyzing risk and capital processes.
Itaú Unibanco, aiming at strengthening its values and aligning its employees' behavior with the guidelines established in risk management, adopts a number of initiatives to stimulate the risk culture. In addition to policies, procedures and processes, risk culture strengthens the individual and collective responsibility of employees in the management of risks inherent in the activities performed individually, respecting the ethical way of managing business.
Itaú Unibanco’s four risk culture principles are conscious risk-taking, discussion of the risks the institution faces, the corresponding action taken and the management of risks by the entire staff. With these principles disseminated throughout the institution, there is an incentive for risk to be widely understood and openly debated, to be kept within the levels indicated by the risk appetite, and to be taken as the individual responsibility of each employee of Itaú Unibanco, irrespective of their position, area or function. There are also other mechanisms to help communicate concepts of risk culture, such as training incentives, surveys, team conduct assessments and recording of risk events.
According to National Monetary Council (CMN) Resolution 3,988, BACEN Circular 3,547 and BACEN Circular Letter 3,685, Itaú Unibanco implemented a capital management structure and the Internal Capital Adequacy Assessment Process (ICAAP), adopting a prospective capital management attitude.
| 1.1 | Organizational Structure |
Itaú Unibanco’s risk management organizational structure complies with Brazilian and international regulations in place and is aligned with the market’s best practices. Responsibilities for risk management at Itaú Unibanco are structured according to the concept of three lines of defense, namely:
| · | in the first line of defense, the business and corporate support areas to have the role of managing the risks they themselves give rise to, by identifying, assessing, controlling and reporting the risks; |
| · | in the second line of defense, an independent unit provides central control, so as to ensure that Itaú Unibanco’s risk is managed according to the risk appetite and established policies and procedures. This centralized control provides the Board and executives with a global overview of Itaú Unibanco’s exposure, to ensure correct and speedy corporate decisions; |
| · | the role of the third line of defense, internal audit, is to provide an independent assessment of the institution’s activities, so that senior management can see that controls are adequate, risk management is effective and that internal controls and regulatory requirements are being complied with. |
Itaú Unibanco uses information technology (IT) systems, managed to fully comply with Central Bank’s requirements on capital adequacy and risk measurement, in accordance with regulatory models and requirements in place. It also monitors adherence to the qualitative and quantitative regulators’ minimum capital and risk management requirements.
| 5 | |
| Itaú Unibanco |
| Risk and Capital Management – Pillar 3 |
| 1.2 | Risk and Capital Governance |
Itaú Unibanco has established risk and capital management committees that report directly to the Board of Directors, with members being elected or appointed by the Board. At the executive level, risk is managed by corporate bodies.
A detailed description of the structure can be found in the Consolidated Annual Report in session Our Risk Management. The Consolidated Annual Report can be found in the website www.itau.com.br/investor-relations, section “Financial Information”.
| 6 | |
| Itaú Unibanco |
| Risk and Capital Management – Pillar 3 |
| 2 | Capital |
| 2.1 | Capital Management |
The Board of Directors is the main body in the Itaú Unibanco’s capital management and it is responsible for approving the capital management institutional policy and guidelines regarding the capitalization level of the conglomerate. The Board is also involved in approving the ICAAP report, a process which is intended to assess the adequacy of Itaú Unibanco’s capital by identifying material risks; by defining the need for additional capital for such risks and the internal means of quantifying it; by preparing a capital plan, both for normal and stress situations; and by structuring a capital contingency plan.
The result of the latest ICAAP – which was dated December 2015 – shows that, in addition to the capital required to cover material risks, Itaú Unibanco has a significant capital surplus, thus ensuring the organization’s soundness.
At the executive level, corporate bodies are responsible for approving risk assessment and capital calculation methodologies, as well as reviewing, monitoring and recommending capital-related documents and topics to the Board of Directors. As for the corporate bodies governance, Itaú Unibanco has a dedicated structure for capital management, which consolidates information and coordinates related processes, all of which subject to verification by the independent validation, internal controls and audit areas.
In order to provide the necessary information for supporting decision taking by the Executives and the Board of Directors, management reports are prepared and presented at corporate bodies, informing about Itau Unibanco’s capital adequacy, as well as about the projections of future capital levels in normal and stress situations.
The guidelines of the institutional capital management policy can be accessed at www.itau.com.br/investor-relations, under “Corporate Governance, Regulations and Policies, Public Access Report – Capital Management”.
| 2.2 | Capital Requirements in Place and in Progress |
Itaú Unibanco’s minimum capital requirements follow the set of resolutions(2) and circulars disclosed by the Central Bank of Brazil (BACEN) that implemented, in Brazil, the global capital requirement standards known as Basel III. These are expressed as ratios of the capital available stated by the Referential Equity (PR), or Total Capital, composed by the Tier I Capital (which comprises the Common Equity and Additional Tier I Capital) and Tier II Capital, and the risk-weighted assets, or RWA.
The Total Capital, Tier I Capital and Common Equity Tier I Capital ratios are calculated on a consolidated basis, applied to institutions included in Prudential Conglomerate(3), which comprises not only financial institutions but also collective financing plans (“consórcios”), payment entities, factoring companies or companies that directly or indirectly assume credit risk, and investment funds in which the conglomerate retains substantially all risks and rewards.
For purposes of calculating these minimum capital requirements, the total RWA is determined as the sum of the risk-weighted asset amounts for credit risk, market risk, and operational risk. Itaú Unibanco uses the standardized approaches to calculate these risk-weighted asset amounts described in section “2.4 Risk-weighted Assets”.
The required minimum Total Capital ratio is 11% between October 1, 2013, and December 31, 2015, reducing gradually to 8% on January 1, 2019. To counteract this, the BACEN rules call for Additional Common Equity Tier I Capital (ACP), corresponding to the sum of the components ACPConservation, ACPCountercyclical and ACPSystemic, which, in conjunction with the requirements mentioned in the preceding paragraph, increase capital requirements over time. Under CMN Resolution 4,193, the sum of the values of the components ACPConservation and ACPCountercyclical will increase gradually from 0.625%, as from January 1, 2016, to 2.5% as from January 1, 2019. However, nowadays, according to BACEN Circular 3,769, the value required for component ACPCountercyclical is zero, and if this portion should increase, the new percentage takes effect twelve months after the announcement. In the case of component ACPSystemic, the current requirement applicable to Itaú Unibanco under BACEN Circular 3,768 is 0%, increasing gradually from 0.25%, as from January 1, 2017, to 1% as from January 1, 2019, since the ratio between the amount of Itaú Unibanco’s Total Exposure and Brazil’s Gross Domestic Product (GDP) is more than ten percent (10%) and less than fifty percent (50%).
(2) The standards that implemented the Basel III rules in Brazil were disclosed on March 1, 2013 through Resolutions No. 4,192 to No. 4,195 of the National Monetary Council (CMN) (Resolution No. 4,195 was revoked by Resolution No. 4,280), together with 15 Circulars published by BACEN on March 4, 2013, as amended.
(3)Further details of Prudential Conglomerate can be found in BACEN Circular No. 3,701, CMN Resolution No. 4,280 or in the link: http://www.bcb.gov.br/?BRPRUDENTIALFINREG.
| 7 | |
| Itaú Unibanco |
| Risk and Capital Management – Pillar 3 |
New requirements were redefined to qualify instruments eligible for Tier I or Tier II Capital. Additionally, it was established a gradual reduction of the eligibility of the instrument inventory issued pursuant to CMN Resolution 3,444.
The table below shows Basel III implementation calendar, set by the BACEN. The percentages refer to the portion of risk-weighted asset by Itaú Unibanco.
| Basel III - Schedule | From January 1st | |||||||||||||||||||
| 2015 | 2016 | 2017 | 2018 | 2019 | ||||||||||||||||
| Common Equity Tier I | 4.5 | % | 4.5 | % | 4.5 | % | 4.5 | % | 4.5 | % | ||||||||||
| Tier I | 6.0 | % | 6.0 | % | 6.0 | % | 6.0 | % | 6.0 | % | ||||||||||
| Total Capital | 11 | % | 9.875 | % | 9.25 | % | 8.625 | % | 8.0 | % | ||||||||||
| Additional Common Equity Tier I (ACP) | 0.0 | % | 0.625 | % | 1.50 | % | 2.375 | % | 3.5 | % | ||||||||||
| conservation | 0 | % | 0.625 | % | 1.25 | % | 1.875 | % | 2.5 | % | ||||||||||
| countercyclical (1) | 0 | % | 0 | % | 0 | % | 0 | % | 0 | % | ||||||||||
| systemic | 0 | % | 0 | % | 0.25 | % | 0.5 | % | 1.0 | % | ||||||||||
| Common Equity Tier I + ACP | 4.5 | % | 5.1 | % | 6.0 | % | 6.9 | % | 8.0 | % | ||||||||||
| Total Capital + ACP | 11.0 | % | 10.5 | % | 10.8 | % | 11.0 | % | 11.5 | % | ||||||||||
| Prudential adjustments deductions | 40 | % | 60 | % | 80 | % | 100 | % | 100 | % | ||||||||||
(1) According to Circular Bacen no 3,769, the ACP countercyclical requirement is zero.
In addition to the minimum capital requirements, BACEN Circular No. 3,748 has been in force since the fourth quarter of 2015. It incorporates the Leverage Ratio (the ratio between Tier I Capital and Total Exposure, calculated as indicated in this Circular) in the Basel III framework in Brazil. More details are given in section “2.7 Leverage Ratio” in this report.
Additionally, in March 2015, Circular BACEN No. 3,751 came into force. It provides for the calculation of the relevant indicators for assessing the Global Systemically Important Banks (G-SIBs) of financial institutions in Brazil. Information on the values of the G-SIBs indicators can been found at www.itau.com.br/investor-relations, section “Corporate Governance, Pillar 3- Spreadsheet Support”, “Annex I- IAISG”.
The compliance of BACEN to the standards recommended by the Basel Committee was assessed at the end of 2013, under the Regulatory Consistency Assessment Programme (RCAP)(4). The rules effective in Brazil were considered compliant—pursuant to the BIS, Brazil is a compliant jurisdiction—i.e., the capital standards established in Brazil also consistent with the internationally accepted minimum requirements. The pointed out discrepancies were considered immaterial.
Minimum capital requirement for Insurance
In July 2015, the National Council of Private Insurance (CNSP) issued CNSP Resolution 321, which, among other things, deals with the minimum capital requirements for underwriting, credit, operating and market risks for insurers, open private pension entities, premium bonds companies and reinsurers. Upon publication of this resolution, CNSP Resolutions 228, 280, 283, 284, 316 and 317 are cancelled.
(4) Regulatory Consistency Assessment Programme (RCAP). Assessment of Basel III regulations in Brazil, December 2013, updated in March 2015 with no additional material points.
| 8 | |
| Itaú Unibanco |
| Risk and Capital Management – Pillar 3 |
| 2.3 | Capital Composition |
The Referential Equity (PR), used to monitor compliance with the operational limits imposed by BACEN, is the sum of three levels, where:
| · | Common Equity Tier I: the sum of social capital, reserves and retained earnings, less deductions and prudential adjustment; |
| · | Additional Tier I Capital: consists of instruments of a perpetual nature, which meet eligibility requirements. Together with Common Equity Tier I it makes up Tier I; |
| · | Tier II: consists of subordinated debt instruments with defined maturity dates that meet eligibility requirements. Together with Common Equity Tier I and Additional Tier I Capital, makes up Total Capital. |
The table below presents the composition of the referential equity and its components (Common Equity Tier I, Additional Tier I Capital and Tier II Capital), taking into consideration their respective deductions and prudential adjustments, as per Resolutions mentioned.
| Composition of Referential Equity | R$ million | |||||||||||
| 03/31/2016 | 12/31/2015 | 03/31/2015 | ||||||||||
| Stockholders’ equity Itaú Unibanco Holding S.A. (Consolidated) | 106,647 | 106,462 | 96,954 | |||||||||
| Minority Interest in Subsidiaries | 937 | 916 | 860 | |||||||||
| Changes in ownership interest in a subsidiary in capital transactions | 3,378 | 3,683 | 4,579 | |||||||||
| Consolidated Stockholders’ Equity (BACEN) | 110,962 | 111,061 | 102,393 | |||||||||
| Preferred shares with clause of redemption excluded from Tier I | - | - | - | |||||||||
| Deductions | (11,742 | ) | (10,107 | ) | (10,942 | ) | ||||||
| Common Equity Tier I | 99,220 | 100,955 | 91,451 | |||||||||
| Instruments eligible to comprise Additional Tier I | - | - | - | |||||||||
| Additional Tier I deductions | 70 | 46 | 50 | |||||||||
| Additional Tier I Capital | 70 | 46 | 50 | |||||||||
| Tier I (Common Equity Tier I + Additional Tier I Capital) | 99,290 | 101,001 | 91,501 | |||||||||
| Instruments eligible to comprise Tier II (1) | 23,488 | 27,403 | 29,354 | |||||||||
| Tier II deductions | 93 | 61 | 48 | |||||||||
| Tier II | 23,582 | 27,464 | 29,402 | |||||||||
| Reference Equity (Tier I + Tier II) | 122,872 | 128,465 | 120,903 | |||||||||
(1) The Instruments eligible to comprise Tier II also includes R$ 194 million of Preferred Shares.
Appendix I (“Breakdown of the Referential Equity and Information on its adequacy”) hereto breaks down in detail the Referential Equity as required by BACEN Circulars 3,678 and 3,716.
Funds obtained through the issue of subordinated debts that compose Tier II capital, for the purpose of the Basel ratio between capital and risk-weighted assets, are described below:
| Subordinated Debt and Referential Equity Tier II | R$ million |
| Maturities | 03/31/2016 | 12/31/2015 | 03/31/2015 | |||||||||||||||||||||||||||||||||
| Name of instrument | <1 year | 1-2 years | 2-3 years | 3-4 years | 4-5 years | > 5 years | Total | Total | Total | |||||||||||||||||||||||||||
| Bank Deposit Certificate (CDB) | 2,125 | - | - | - | - | - | 2,125 | 7,463 | 7,618 | |||||||||||||||||||||||||||
| Financial Bills | 5,657 | 9,251 | 8,553 | 120 | - | 3,636 | 27,217 | 26,912 | 26,043 | |||||||||||||||||||||||||||
| Euronotes | 392 | - | - | - | 7,917 | 19,485 | 27,794 | 30,486 | 25,047 | |||||||||||||||||||||||||||
| Subordinated Debt (Mar/16) | 8,173 | 9,251 | 8,553 | 120 | 7,917 | 23,121 | 57,136 | 64,861 | 58,708 | |||||||||||||||||||||||||||
| Subordinated Debt Not Elegible to Capital | 38 | 31 | 30 | 28 | 97 | 560 | 783 | 923 | 820 | |||||||||||||||||||||||||||
| Subordinated Debt - Total (Mar/16) | 8,210 | 9,282 | 8,583 | 148 | 8,014 | 23,682 | 57,919 | |||||||||||||||||||||||||||||
| Subordinated Debt after Reducer (Mar/16) | - | 1,850 | 3,421 | 72 | 6,334 | 23,121 | 34,799 | |||||||||||||||||||||||||||||
| Subordinated Debt Elegible to Capital (Dec/12) | - | 990 | 290 | 4,198 | 6,993 | 26,352 | 38,824 | |||||||||||||||||||||||||||||
| Threshold (1) Subordinated debt (Dec/12) | - | 594 | 174 | 2,519 | 4,196 | 15,811 | 23,294 | |||||||||||||||||||||||||||||
| Subordinated Debt Elegible to Capital (Mar/16) (2) | - | 594 | 174 | 2,519 | 4,196 | 15,811 | 23,294 | |||||||||||||||||||||||||||||
(1) Subordinated debt with application of threshold in accordance with the current rules (Resolution 4,192/13 - Art 28).
(2) According to current legislation, the accounting balance of subordinated debt as of December 2012 was used for the calculation of referential equity as of March, 2016.
| 9 | |
| Itaú Unibanco |
| Risk and Capital Management – Pillar 3 |
Details concerning maturities, compensation, principal amount, accounting balance and subordinated debt balance are described next:
| Subordinated Debts Elegibles to Capital - Details | R$ million | ||||||||||||||||||||||||||||||||
| 03/31/2016 | 12/31/2015 | 03/31/2015 | Mar/16-Dec/15 | Mar/16-Mar/15 | 03/31/2016 | ||||||||||||||||||||||||||||
| Name of instrument/ Currency | Issue | Maturity | Compensation p.a. | Principal Value | Principal Variation | Accouting Balance |
|||||||||||||||||||||||||||
| Subordinated CDB (1)(2) - BRL | |||||||||||||||||||||||||||||||||
| 2008 | 2015 | 119.8% of CDI (1) | - | - | 400 | - | (400 | ) | - | ||||||||||||||||||||||||
| 2010 | 2015 | 113% of CDI | - | - | 50 | - | (50 | ) | - | ||||||||||||||||||||||||
| 2006 | 2016 | 100% of CDI + 0.7% | 466 | 466 | 466 | - | - | 1,278 | |||||||||||||||||||||||||
| 2010 | 2016 | 110% to 114% of CDI | - | 2,665 | 2,665 | (2,665 | ) | (2,665 | ) | - | |||||||||||||||||||||||
| IPCA (2) + 7.21% to 7.33% | - | 123 | 123 | (123 | ) | (123 | ) | - | |||||||||||||||||||||||||
| 2010 | 2017 | IPCA + 7.21% to 7.33% | 367 | 367 | 367 | - | - | 847 | |||||||||||||||||||||||||
| Total | 833 | 3,621 | 4,071 | (2,788 | ) | (3,238 | ) | 2,125 | |||||||||||||||||||||||||
| Subordinated Financial Bills - BRL | |||||||||||||||||||||||||||||||||
| 2010 | 2016 | 100% of CDI + 1.35% to 1.36% | 365 | 365 | 365 | - | - | 371 | |||||||||||||||||||||||||
| 112% to 112.5% of CDI | 1,874 | 1,874 | 1,874 | - | - | 1,904 | |||||||||||||||||||||||||||
| IPCA + 7% | 30 | 30 | 30 | - | - | 62 | |||||||||||||||||||||||||||
| 2010 | 2017 | IPCA + 6.95% to 7.2% | 206 | 206 | 206 | - | - | 327 | |||||||||||||||||||||||||
| 2011 | 2017 | 108% to 112% of CDI | 3,224 | 3,224 | 3,224 | - | - | 3,467 | |||||||||||||||||||||||||
| 100% of CDI + 1.29% to 1.52% | 3,650 | 3,650 | 3,650 | - | - | 3,765 | |||||||||||||||||||||||||||
| IPCA + 6.15% to 7.8% | 352 | 352 | 352 | - | - | 600 | |||||||||||||||||||||||||||
| IGPM (2) + 6.55% to 7.6% | 138 | 138 | 138 | - | - | 252 | |||||||||||||||||||||||||||
| 2012 | 2017 | 100% of CDI + 1.12% | 500 | 500 | 500 | - | - | 524 | |||||||||||||||||||||||||
| 2011 | 2018 | IGPM + 7% | 42 | 42 | 42 | - | - | 59 | |||||||||||||||||||||||||
| IPCA + 7.53% to 7.7% | 30 | 30 | 30 | - | - | 47 | |||||||||||||||||||||||||||
| 2012 | 2018 | 108% to 113% of CDI | 6,373 | 6,373 | 6,373 | - | - | 7,155 | |||||||||||||||||||||||||
| IPCA + 4.4% to 6.58% | 461 | 461 | 461 | - | - | 700 | |||||||||||||||||||||||||||
| 100% of CDI + 1.01% to 1.32% | 3,782 | 3,782 | 3,782 | - | - | 3,963 | |||||||||||||||||||||||||||
| 9.95% to 11.95% | 112 | 112 | 112 | - | - | 162 | |||||||||||||||||||||||||||
| 2011 | 2019 | 109% to 109.7% of CDI | 2 | 2 | 2 | - | - | 3 | |||||||||||||||||||||||||
| 2012 | 2019 | 110% of CDI | 1 | 1 | 1 | - | - | 2 | |||||||||||||||||||||||||
| 11.96% | 12 | 12 | 12 | - | - | 19 | |||||||||||||||||||||||||||
| IPCA + 4.7% to 6.3% | 101 | 101 | 101 | - | - | 155 | |||||||||||||||||||||||||||
| 2012 | 2020 | 111% to CDI | 1 | 1 | 1 | - | - | 2 | |||||||||||||||||||||||||
| IPCA + 6% to 6.17% | 20 | 20 | 20 | - | - | 34 | |||||||||||||||||||||||||||
| 2011 | 2021 | 109.25% to 110.5% of CDI | 6 | 6 | 6 | - | - | 10 | |||||||||||||||||||||||||
| 2012 | 2022 | IPCA + 5.15% to 5.83% | 2,307 | 2,307 | 2,307 | - | - | 3,608 | |||||||||||||||||||||||||
| IGPM + 4.63% | 20 | 20 | 20 | - | - | 26 | |||||||||||||||||||||||||||
| Total | 23,609 | 23,609 | 23,609 | - | - | 27,217 | |||||||||||||||||||||||||||
| Subordinated Euronotes - USD | |||||||||||||||||||||||||||||||||
| 2010 | 2020 | 6.2% | 990 | 990 | 990 | - | - | 3,630 | |||||||||||||||||||||||||
| 2010 | 2021 | 5.75% | 1,000 | 1,000 | 1,000 | - | - | 3,533 | |||||||||||||||||||||||||
| 2011 | 2021 | 5.75% to 6.2% | 730 | 730 | 730 | - | - | 2,725 | |||||||||||||||||||||||||
| 2012 | 2021 | 6.2% | 550 | 550 | 550 | - | - | 1,957 | |||||||||||||||||||||||||
| 2012 | 2022 | 5.5% to 5.65% | 2,600 | 2,600 | 2,600 | - | - | 9,231 | |||||||||||||||||||||||||
| 2012 | 2023 | 5.13% | 1,851 | 1,851 | 1,851 | - | - | 6,718 | |||||||||||||||||||||||||
| Total USD | 7,721 | 7,721 | 7,721 | ||||||||||||||||||||||||||||||
| Total BRL | 27,794 | ||||||||||||||||||||||||||||||||
| Grand Total | 57,136 | ||||||||||||||||||||||||||||||||
| Subordinated Debt after Reducer | 34,799 | ||||||||||||||||||||||||||||||||
| Subordinated Debts Elegibles to Capital (Mar/16) | 23,294 | ||||||||||||||||||||||||||||||||
(1) CDB is Bank Deposit Certificate and CDI is Interbank Deposit Certificate.
(2) IPCA and IGP-M are Brazilian Inflation Indexes.
For information on each instrument that is part of the Referential Equity as required by BACEN Circulars 3,678 and 3,716, please visit the website www.itau.com.br/investor-relations, section “Corporate Governance, Pillar 3 – Spreadsheet Support”, “Appendix I and II – Pillar 3”, “Appendix II – Main Features of the Referential Equity Instruments (PR)”.
| 2.4 | Risk-Weighted Asset (RWA) |
According to CMN Resolutions 4,193 and 4,281, for assessing the minimum capital requirements, the RWA must be calculated by adding the portions, as shown below:

| · | RWACPAD = portion related to exposures to credit risk; |
| · | RWACAM = portion related to the exposures in gold, foreign exchange rate and assets subject to foreign exchange rate variations; |
| · | RWAJUR = portion related to exposures subjects to variations of interest rates, interest coupons and coupon rates and classified in the Trading Portfolio; |
| · | RWACOM = portion related to exposures subjects to variations in commodity prices; |
| · | RWAACS = portion related to exposures subjects to variations in equities prices and classified in the Trading Portfolio; |
| 10 | |
| Itaú Unibanco |
| Risk and Capital Management – Pillar 3 |
| · | RWAOPAD = portion relating to the calculation of operational risk capital requirements. |
The table below presents the consolidated evolution of RWA composition of Itaú Unibanco. Each of the portions mentioned above will be presented in detail in the following topics.
| Composition of Risk-Weighted Asset | R$ million | |||||||||||||||||||||||
| Risk exposures | 03/31/2016 | 12/31/2015 | 03/31/2015 | |||||||||||||||||||||
| Risk-Weighted Assets for Credit Risk (RWACPAD) | 637,179 | 92 | % | 679,593 | 94 | % | 728,559 | 92 | % | |||||||||||||||
| Risk-Weighted Assets for Market Risk (RWAMPAD) | 20,356 | 3 | % | 14,252 | 2 | % | 24,776 | 3 | % | |||||||||||||||
| Risk-Weighted Assets for Operational Risk (RWAOPAD) | 37,364 | 5 | % | 28,623 | 4 | % | 35,509 | 5 | % | |||||||||||||||
| Risk-Weighted Assets (RWA) | 694,899 | 100 | % | 722,468 | 100 | % | 788,844 | 100 | % | |||||||||||||||
Risk-Weighted Assets for Credit Risk (RWACPAD)
The table below presents the credit risk-weighted assets (RWACPAD) separated by risk weighting factor and asset type:
| Composition of Risk-Weighted Assets for Credit Risk (RWACPAD) | R$ million | |||||||||||
| 03/31/2016 | 12/31/2015 | 03/31/2015 | ||||||||||
| Risk exposures | ||||||||||||
| Risk-Weighted Assets for Credit Risk (RWACPAD) | 637,179 | 679,593 | 728,559 | |||||||||
| a) Per Risk Weighting Factor (FPR): | ||||||||||||
| FPR at 2% | 149 | 179 | 136 | |||||||||
| FPR at 20% | 6,484 | 7,000 | 6,291 | |||||||||
| FPR at 35% | 11,888 | 11,695 | 8,579 | |||||||||
| FPR at 50% | 46,622 | 46,025 | 46,681 | |||||||||
| FPR at 75% | 129,244 | 136,104 | 145,250 | |||||||||
| FPR at 85% | 117,929 | 129,884 | 147,950 | |||||||||
| FPR at 100% | 267,515 | 288,057 | 305,875 | |||||||||
| FPR at 250% | 36,973 | 37,858 | 34,294 | |||||||||
| FPR at 300% | 9,066 | 10,751 | 18,002 | |||||||||
| FPR up to 1250%(1) | 1,305 | 1,990 | 1,688 | |||||||||
| Derivatives – Future potential gain and Variation of the counterparty credit quality | 10,005 | 10,050 | 13,812 | |||||||||
| b) Per Type: | ||||||||||||
| Securities | 45,130 | 51,085 | 55,102 | |||||||||
| Loan operations - Retail | 102,840 | 109,882 | 119,257 | |||||||||
| Loan operations - Non-retail | 218,141 | 237,365 | 232,035 | |||||||||
| Joint liabilities - Retail | 202 | 242 | 324 | |||||||||
| Joint liabilities - Non-retail | 44,451 | 46,655 | 65,499 | |||||||||
| Loan commitments - Retail | 26,199 | 25,972 | 25,651 | |||||||||
| Loan commitments - non-retail | 11,464 | 12,924 | 17,629 | |||||||||
| Other exposures | 188,752 | 195,468 | 213,063 | |||||||||
(1) Taking into consideration the application of the “F” factor required by Article 29 of BACEN Circular 3,644, 2013.
Risk-Weighted Assets for Market Risk (RWAMPAD)
The amount of RWAMPAD is obtained by adding the portions terms: RWACAM, RWAJUR, RWACOM, RWAACS. The table below presents the risk weighted assets for Market Risk:
| Composition of Risk-Weighted Assets for Market Risk (RWAMPAD) | R$ million | |||||||||||
| 03/31/2016 | 12/31/2015 | 03/31/2015 | ||||||||||
| Risk-Weighted Assets for Market Risk (RWAMPAD) | 20,356 | 14,252 | 24,776 | |||||||||
| Trades subject to interest rate variation (RWAJUR) | 15,779 | 11,291 | 12,046 | |||||||||
| Fixed income interest rate denominated in reais (RWAJUR1) | 5,051 | 2,127 | 3,995 | |||||||||
| Foreign exchange linked interest rate (RWAJUR2) | 7,622 | 6,700 | 4,858 | |||||||||
| Price index linked interest rate (RWAJUR3) | 3,107 | 2,464 | 3,194 | |||||||||
| Interest rate linked interest rate (RWAJUR 4) | 0 | 0 | 0 | |||||||||
| Operations subject to commodity price variation (RWACOM) | 624 | 473 | 921 | |||||||||
| Operations subject to stock price variation (RWAACS) | 913 | 952 | 610 | |||||||||
| Operations subject to the risk of exposures in gold, foreign currency and foreign exchange rate variations (RWACAM) | 3,040 | 1,536 | 11,198 | |||||||||
| Referential equity calculated for covering the interest rate risk of trades of the banking book (RBAN) | 1,026 | 1,275 | 1,216 | |||||||||
Risk-Weighted Assets for Operational Risk (RWAOPAD)
BACEN Circulars 3,640, 3,675 and 3,739 establish the criteria for determining the portion of risk-weighted assets related to the capital required for operational risk (RWAOPAD). In accordance with current regulation, the exposure of RWAOPAD is calculated on a semiannual basis, related to June 30th and December 31st.
| 11 | |
| Itaú Unibanco |
| Risk and Capital Management – Pillar 3 |
The RWA for operational risk is presented below:
| Composition of Risk-Weighted Assets for Operational Risk (RWAOPAD) | R$ million | |||||||||||
| 03/31/2016 | 12/31/2015 | 03/31/2015 | ||||||||||
| Risk-Weighted Assets for Operational Risk (RWA OPAD) | 37,364 | 28,623 | 35,509 | |||||||||
| Retail | 6,899 | 7,470 | 6,946 | |||||||||
| Commercial | 19,496 | 16,491 | 16,653 | |||||||||
| Corporate finance | 1,526 | 1,380 | 1,370 | |||||||||
| Negotiation and sales | 577 | (4,927 | ) | 2,581 | ||||||||
| Payments and settlements | 3,419 | 3,074 | 3,070 | |||||||||
| Financial agent services | 3,070 | 2,873 | 2,756 | |||||||||
| Asset management | 2,375 | 2,145 | 2,132 | |||||||||
| Retail brokerage | 2 | 118 | 1 | |||||||||
| 2.5 | Additional Common Equity Tier I |
As per CMN Resolution 4,193 and Central Bank Circulars 3,768 and 3,769, the Additional Common Equity Tier I requirement comes into effect as of the first quarter of 2016. Details of its portions are shown below:
| Additional Common Equity Tier I (ACP) | R$ million | |||
| 03/31/2016 | ||||
| Additional Common Equity Tier I requirement (ACPrequirement) | ||||
| conservation | 4,343 | |||
| countercyclical | - | |||
| systemic | - | |||
As required by Central Bank Circular No. 3,769, more details of the portion of ACPcountercyclical are shown below, including RWA for non-banking private sector credit risk exposures and percentage ACPcountercyclical for Itaú Unibanco’s main jurisdictions with their activation dates and duration of this portion.
| Additional Common Equity Tier I countercyclical (ACPcountercyclical) | R$ million | |||||||||||||||
| 03/31/2016 | ||||||||||||||||
| RWA (1) | ACCP(2) | date of announcement | date of effectiveness | |||||||||||||
| Brazil | 377,617 | 0 | % | oct/15 | jan/16 | |||||||||||
| Chile (3) | 33,352 | 0 | % | - | - | |||||||||||
| Total | 410,969 | - | - | - | ||||||||||||
(1) portion of the RWA balance for credit risk exposure to the non-banking private sector in the relevant jurisdictions.
(2) percentage amount of the Additional Common Equity Tier I countercyclical in the relevant jurisdictions.
(3) method of calculating countercyclical portion of the increase not announced in this jurisdiction. According to Article 2 of BACEN Circular No. 3,769 the ACCP of Brazil value should be used.
| 2.6 | Capital Adequacy |
Itaú Unibanco, through the ICAAP, assesses the adequacy of its capital to face the incurred risks. For ICAAP, capital is composed by regulatory capital for credit, market and operational risks and by the necessary capital to face other risks.
In order to ensure the robustness of Itaú Unibanco and the availability of capital to support business growth, Itaú Unibanco maintains PR levels above the minimum levels, according to the Basel ratio, Common Equity Tier I, Additional Tier I Capital and Tier II.
On March 31, 2016, the PR reached R$ 122,872 million, R$ 99,290 million of Tier I and R$ 23,582 million of Tier II.
| Composition of Referential Equity (PR) | R$ million | |||||||||||
| 03/31/2016 | 12/31/2015 | 03/31/2015 | ||||||||||
| Tier I | 99,290 | 101,001 | 91,501 | |||||||||
| Common Equity Tier I | 99,220 | 100,955 | 91,451 | |||||||||
| Additional Tier I Capital | 70 | 46 | 50 | |||||||||
| Tier II | 23,582 | 27,464 | 29,402 | |||||||||
| Referential Equity (PR) | 122,872 | 128,465 | 120,903 | |||||||||
| Required Referential Equity (PRE) | 68,621 | 79,471 | 86,773 | |||||||||
| Excess capital in relation to Required Referential Equity | 54,250 | 48,994 | 34,130 | |||||||||
| Additional Common Equity Ti I requirement er (ACPrequirement) | 4,343 | - | - | |||||||||
| 12 | |
| Itaú Unibanco |
| Risk and Capital Management – Pillar 3 |
As at March 31, 2016, the BIS ratio reached 17.7%, a decrease of 10 basis points from December 31, 2015. Contributed to this result the impact of Basel III schedule applied to Tier II instruments and to deductions capital, and also the distribution of interest on capital and dividends in the period.
Itaú Unibanco has a R$ 54,250 million excess for Required Referential Equity, higher than the ACP of R$ 4,343, and will not be subject to any restrictions due to insufficient Additional Common Equity Tier I.
In what regards the fixed asset ratio, (the level of adjusted PR committed to adjusted permanent assets), Itaú Unibanco is within the maximum limit of 50% of the adjusted PR, as established by BACEN.
The Basel and Fixed asset ratios are presented in the table below.
| Basel and Fixed Asset Ratios | R$ million | |||||||||||
| 03/31/2016 | 12/31/2015 | 03/31/2015 | ||||||||||
| Basel ratio | 17.7 | % | 17.8 | % | 15.3 | % | ||||||
| Tier I | 14.3 | % | 14.0 | % | 11.6 | % | ||||||
| Common Equity Tier I | 14.3 | % | 14.0 | % | 11.6 | % | ||||||
| Additional Tier I Capital | 0.0 | % | 0.0 | % | 0.0 | % | ||||||
| Tier II | 3.4 | % | 3.8 | % | 3.7 | % | ||||||
| Fixed assets ratio | 27.4 | % | 27.7 | % | 47.5 | % | ||||||
| Excess Capital in Relation to Fixed Assets | 27,813 | 28,616 | 3,054 | |||||||||
Considering Itaú Unibanco´s current capital base, and if the Basel III rules were fully implemented, the core capital (Common Equity Tier I) would be 12.6% on March 31, 2016, taking into consideration the consolidation of CorpBanca (estimated impact with preliminary information) and the use of tax credits. This scenario is presented in the following chart.
Simulated Common Equity TierI with Fully Loaded Basel III Rules
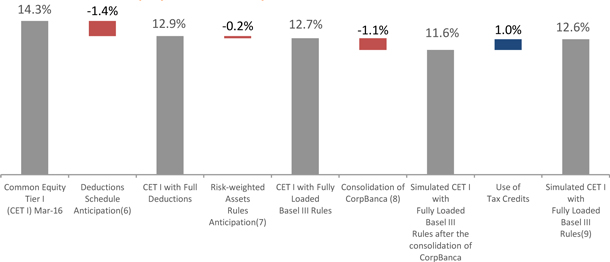
(6) Includes deductions of Goodwill, Intangible Assets (before and after October/13), Tax Credits from Temporary Differences and Tax Loss, Pension Fund Assets, Equity Investments in Financial Institutions, Insurance and similar companies.
(7) Includes the increase of the multiplier of the market risk, operational risk and certain credit risk accounts. This multiplier, which is at 10.1 nowadays, will be to 12.5 in 2019.
(8) Estimated impact based on preliminary information.
(9) Does not include any reversal of the complementary allowance for loan losses.
| 13 | |
| Itaú Unibanco |
| Risk and Capital Management – Pillar 3 |
| 2.7 | Leverage Ratio |
The following information is based on the methodology and standard format introduced by BACEN Circular 3,748. As of March 31, 2016 Itaú Unibanco’s Leverage Ratio stood at 8.3%.
| Comparative Summary of Published Financial Statements and Leverage Ratio | ||||||||||
| R$ Thousand | ||||||||||
| 03/31/2016 | 12/31/2015 | |||||||||
| 1 | Total assets according to published financial statements | 1,283,071,018 | 1,359,172,441 | |||||||
| 2 | Adjustment for differences in consolidation of accounts | (127,750,594 | ) | (122,280,032 | ) | |||||
| 3 | Adjustment for assets assigned or transferred with substantial transfer of risks and benefits and | (4,899,420 | ) | (4,855,298 | ) | |||||
| 4 | Adjustment for changes in reference values and potential future gains on derivative financial | 16,039,230 | 18,170,046 | |||||||
| 5 | Adjustment for repurchase transactions and securities lending | 7,024,353 | 6,749,914 | |||||||
| 6 | Adjustment for transactions not booked in prudential conglomerate's total assets | 106,441,369 | 110,181,720 | |||||||
| 7 | Other adjustments | (81,473,482 | ) | (81,883,640 | ) | |||||
| 8 | Total Exposure | 1,198,452,474 | 1,285,255,152 | |||||||
| Disclosure of information on Leverage Ratio | ||||||||||
| R$ Thousand | ||||||||||
| 03/31/2016 | 12/31/2015 | |||||||||
| Items shown in the Balance Sheet | ||||||||||
| 1 | Balance sheet items other than derivative financial instruments, securities received on loan and resales | 853,469,456 | 891,531,269 | |||||||
| 2 | Adjustments for equity items deducted in calculating Level I Capital | (17,035,289 | ) | (14,903,083 | ) | |||||
| 3 | Total exposure shown in the Balance Sheet | 836,434,166 | 876,628,185 | |||||||
| Transactions using Derivative Financial Instruments | ||||||||||
| 4 | Replacement value for derivatives transactions | 27,347,728 | 27,570,116 | |||||||
| 5 | Potential future gains from derivatives transactions | 12,805,779 | 13,839,814 | |||||||
| 6 | Adjustment for collateral in derivatives transactions | - | - | |||||||
| 7 | Adjustment for daily margin held as collateral | - | - | |||||||
| 8 | Derivatives in the name of customers where there is no contractual obligation to reimburse in the event of bankruptcy or default of the entities responsible for the settlement system | - | - | |||||||
| 9 | Reference value adjusted for credit derivatives | 7,717,367 | 8,798,831 | |||||||
| 10 | Adjustment of reference value calculated for credit derivatives | (3,117,465 | ) | (3,424,798 | ) | |||||
| 11 | Total exposure for derivative financial instruments | 44,753,409 | 46,783,963 | |||||||
| Repurchase Transactions and Securities Lending (TVM) | ||||||||||
| 12 | Investments in repurchase transactions and securities lending | 203,799,176 | 244,911,369 | |||||||
| 13 | Adjustment for repurchases for settlement and creditors of securities lending | - | - | |||||||
| 14 | Amount of counterparty credit risk | 7,024,353 | 6,749,914 | |||||||
| 15 | Amount of counterparty credit risk in transactions as intermediary | - | - | |||||||
| 16 | Total exposure for repurchase transactions and securities lending | 210,823,529 | 251,661,283 | |||||||
| Off-balance sheet items | ||||||||||
| 17 | Reference value of off-balance sheet transactions | 289,663,328 | 293,415,937 | |||||||
| 18 | Adjustment for application of FCC specific to off-balance sheet transactions | (183,221,959 | ) | (183,234,216 | ) | |||||
| 19 | Total off-balance sheet exposure | 106,441,369 | 110,181,720 | |||||||
| Capital and Total Exposure | ||||||||||
| 20 | Level I | 99,290,054 | 101,000,684 | |||||||
| 21 | Total Exposure | 1,198,452,474 | 1,285,255,152 | |||||||
| Leverage Ratio | ||||||||||
| 22 | Basel III Leverage Ratio | 8.3 | % | 7.9 | % | |||||
| 14 | |
| Itaú Unibanco |
| Risk and Capital Management – Pillar 3 |
| 3 | Balance Sheet |
Balance Sheet
The following is a comparison between Itaú Unibanco’s Prudential Conglomerate Balance Sheet and its Consolidated Balance Sheet presented in the Financial Statements. Information presented in the Prudential Conglomerate are detailed so that the elements disclosed in Appendix I are identified in the last column of the table below.
| Comparisson of balance sheets – Assets | R$ million | |||||||||||||
Consolidated balance sheet | Differences 1 | Prudential | Ref. Annex I | |||||||||||
| Assets | 03/31/2016 | |||||||||||||
| Current assets and Long-term receivables | 1,263,779 | (148,519 | ) | 1,115,260 | ||||||||||
| Cash and cash equivalents | 18,384 | (218 | ) | 18,166 | ||||||||||
| Interbank investments | 237,642 | (3,277 | ) | 234,365 | ||||||||||
| Securities and derivative financial instruments | 338,997 | (137,930 | ) | 201,067 | ||||||||||
| Interbank accounts | 70,709 | - | 70,709 | |||||||||||
| Interbranch accounts | 149 | - | 149 | |||||||||||
| Loan, lease and other credit operations | 409,431 | (3,520 | ) | 405,911 | ||||||||||
| Other receivables | 184,933 | (2,955 | ) | 181,978 | ||||||||||
| Tax credit and Actuarial Assets | - | - | 19,551 | |||||||||||
| Tax credits arising from income tax losses and social contribution | - | - | 7,594 | (b) | ||||||||||
| Credits resulting from temporary differences | - | - | 11,733 | (c) | ||||||||||
| Actuarial assets related to defined benefit pension funds | - | - | 224 | (d) | ||||||||||
| Other | - | - | 162,427 | |||||||||||
| Other assets | 3,533 | (618 | ) | 2,915 | ||||||||||
| Permanent assets | 19,292 | 20,768 | 40,060 | |||||||||||
| Investments | 4,342 | 17,077 | 21,419 | |||||||||||
| Goodwill based on the expectation of future profitability | - | - | 965 | (e) | ||||||||||
| investments in the capital of companies that are similar to non-consolidated financial institutions and insurance companies | - | - | 7,805 | (f) | ||||||||||
| investments in the capital of financial institutions | - | - | 749 | (a) | ||||||||||
| Other | - | - | 11,900 | |||||||||||
| Real estate in use | 6,756 | (562 | ) | 6,194 | ||||||||||
| Deferred permanent assets | - | - | 21 | (g) | ||||||||||
| Other | - | - | 6,173 | |||||||||||
| Goodwill | 853 | (718 | ) | 135 | ||||||||||
| Goodwill based on the expectation of future profitability | - | - | 135 | (e) | ||||||||||
| Intangible assets | 7,341 | 4,971 | 12,312 | |||||||||||
| Acquisition of rights to credit payroll | 1,038 | - | 1,038 | |||||||||||
| Intangible assets acquired from October 1st 2013 | - | - | 314 | (h) | ||||||||||
| Intangible assets acquired before October 1st 2013 | - | - | 724 | (i) | ||||||||||
| Other intangible assets | 9,728 | 10,876 | 20,604 | |||||||||||
| Intangible assets acquired from October 1st 2013 | - | - | 3,427 | (h) | ||||||||||
| Intangible assets acquired before October 1st 2013 | - | - | 3,722 | (i) | ||||||||||
| Goodwill based on the expectation of future profitability | - | - | 12,826 | (e) | ||||||||||
| Deferred permanent assets | - | - | 444 | (g) | ||||||||||
| Other | - | - | 185 | |||||||||||
| (Accumulated amortization) | (3,425 | ) | (5,905 | ) | (9,330 | ) | ||||||||
| Intangible assets acquired from October 1st 2013 | - | - | (840 | ) | (h) | |||||||||
| Intangible assets acquired before October 1st 2013 | - | - | (1,713 | ) | (i) | |||||||||
| Goodwill based on the expectation of future profitability | - | - | (6,380 | ) | (e) | |||||||||
| Deferred permanent assets | - | - | (397 | ) | (g) | |||||||||
| Total assets | 1,283,071 | (127,751 | ) | 1,155,320 | ||||||||||
1Differences are mainly due to non-consolidation of non financial companies (highlighting the following companies: Insurance, Pension Plan and Premium Bonds) within the Prudential Conglomerate and also by the eliminations of transactions with related parties.
| 15 | |
| Itaú Unibanco |
| Risk and Capital Management – Pillar 3 |
| Comparisson of balance sheets – Liabilities | R$ million | |||||||||||||
Consolidated Balance Sheet | Diferences 1 | Prudential | Ref. Annex I | |||||||||||
| Liabilities | 03/31/2016 | |||||||||||||
| Current and Long-term Liabilities | 1,172,779 | (130,232 | ) | 1,042,547 | ||||||||||
| Deposits | 266,318 | 5,156 | 271,474 | |||||||||||
| Deposits received under securities repurchase agreements | 318,964 | 2,242 | 321,206 | |||||||||||
| Funds from acceptances and issuance of securities | 74,352 | 6 | 74,358 | |||||||||||
| Interbank accounts | 4,034 | - | 4,034 | |||||||||||
| Interbranch accounts | 5,789 | 2 | 5,791 | |||||||||||
| Borrowings and onlending | 95,352 | - | 95,352 | |||||||||||
| Derivative financial instruments | 28,917 | - | 28,917 | |||||||||||
| Technical provision for insurance, pension plan and capitalization | 137,677 | (137,677 | ) | - | ||||||||||
| Other liabilities | 241,377 | 38 | 241,415 | |||||||||||
| Social and statutory | 13,413 | (1,679 | ) | 11,734 | ||||||||||
| Tax credits arising from income tax losses and social contribution | - | - | 5,710 | (b)/(c) | ||||||||||
| Provision of Actuarial assets related to defined benefit pension funds | - | - | 145 | (d) | ||||||||||
| Other | - | - | 5,879 | |||||||||||
| Other | - | - | 229,681 | |||||||||||
| Deferred income | 1,847 | (36 | ) | 1,811 | ||||||||||
| Minority interest in subsidiaries | 1,799 | (862 | ) | 937 | ||||||||||
| Non-controlling interest in subsidiaries that are part of the conglomerate | - | - | 937 | (j) | ||||||||||
| Stockholders' equity | 106,647 | 3,378 | 110,025 | |||||||||||
| Capital | 85,148 | - | 85,148 | |||||||||||
| Eligible Instruments | - | - | 85,148 | (k) | ||||||||||
| Capital reserves | 1,209 | - | 1,209 | |||||||||||
| Capital reserves | - | - | 1,209 | (m) | ||||||||||
| Revenue reserves | 26,535 | 2,379 | 28,914 | |||||||||||
| Revenue reserves | - | - | 28,914 | (l) | ||||||||||
| Asset valuation adjustment | (2,101 | ) | 999 | (1,102 | ) | |||||||||
| Other revenue and other reserve | - | - | (1,102 | ) | (m) | |||||||||
| (Treasury shares) | (4,144 | ) | - | (4,144 | ) | |||||||||
| Shares or other instruments issued by the bank | - | - | (4,144 | ) | (n) | |||||||||
| Total liabilities and stockholders' equity | 1,283,071 | (127,751 | ) | 1,155,320 | ||||||||||
1 Differences are mainly due to non-consolidation of non financial companies (highlighting the following companies: Insurance, Pension Plan and Premium Bonds) within the Prudencial Conglomerate and also by the eliminations of transactions with related parties.
| 16 | |
| Itaú Unibanco |
| Risk and Capital Management – Pillar 3 |
Institutions that comprises the Financial Statements of Itaú Unibanco Holding
The following is a list of institutions that comprise the financial statements of Itaú Unibanco Holding for means of the disclosure of its Financial Statements. The institutions that, in addition to being included in the Consolidated Balance Sheet, are also included in the Prudential Conglomerate, are listed below.
List of institutions that comprises the Financial Statements of Itaú Unibanco Holding
| Institutions | ||||
| ACO Ltda. | Itaú BBA International (Cayman) Ltd. (1) | Karen International Limited | ||
| Afinco Americas Madeira, SGPS, Sociedade Unipessoal, Lda | Itau BBA International plc (1) | Kinea Dinâmico Master - Long Biased Fundo de Investimento em Ações (1) | ||
| Aj Títulos Públicos Fundo de Investimento Referenciado DI (1) | Itaú BBA México Casa de Bolsa, S.A. de C.V. (1) | Kinea I Pipe Fundo de Investimento em Ações (1) | ||
| Albarus S.A. | Itaú BBA México, S.A. de C.V. | Kinea I Private Equity Fundo de Investimento em Participações (1) | ||
| Banco Del Paraná S.A. | Itaú BBA Participações S.A. | Kinea I Total Return Equity - Fundo de Investimento em Cotas de Fundos de Investimento Multimercado (1) | ||
| Banco Investcred Unibanco S.A. (1) | Itaú BBA Trading S.A. | Kinea II Macro Fundo de Investimento Multimercado (1) | ||
| Banco Itaú (Suisse) S.A. (1) | Itau BBA UK Securities Limited (1) | Kinea Investimentos Ltda. | ||
| Banco Itaú Argentina S.A. (1) | Itau BBA USA Securities Inc. (1) | Kinea Macro Offshore Segregated Portfolio (1) | ||
| Banco Itaú BBA S.A. (1) | Itaú BMG Corretora de Seguros Ltda. | Licania Fund Limited (1) | ||
| Banco Itaú BMG Consignado S.A. (1) | Itaú BMG Gestão de Vendas Ltda. | Luizacred S.A. Soc. de Crédito Financiamento e Investimento (1) | ||
| Banco Itaú Chile (1) | Itaú BMG Participação Ltda. | Marcep Corretagem de Seguros S.A. | ||
| Banco Itaú International (1) | Itaú BMG Seguradora S.A. | Maxipago Serviços de Internet S.A. | ||
| Banco Itaú Paraguay S.A. (1) | Itau Cayman Directors Ltd. | MCC Asesorías Limitada | ||
| Banco Itaú Uruguay S.A. (1) | Itau Cayman Nominees Ltd. | MCC S.A. Corredores de Bolsa (1) | ||
| Banco Itaú Veículos S.A. (1) | Itaú Chile Administradora General de Fondos S.A. | MCC Securities Inc. (1) | ||
| Banco Itaubank S.A. (1) | Itaú Chile Compañía de Seguros de Vida S.A. | Megabônus Negócios de Varejo Ltda. | ||
| Banco Itaucard S.A. (1) | Itaú Chile Corredora de Seguros Ltda. | Microinvest S.A. Soc. de Crédito a Microempreendedor (1) | ||
| Banco Itauleasing S.A. (1) | Itaú Chile Inversiones, Servicios y Administracion S.A. | Mundostar S.A. | ||
| BICSA Holdings Ltd. | Itaú Cia. Securitizadora de Créditos Financeiros (1) | Nevada Woods S.A. | ||
| BIE Cayman Ltd. | Itaú Corretora de Valores S.A. (1) | OCA S.A. (1) | ||
| Borsen Renda Fixa Crédito Privado - Fundo de Investimento | Itaú Distribuidora de Títulos e Valores Mobiliários S.A. (1) | Oiti Fundo de Investimento Multimercado Crédito Privado Investimento no Exterior (1) | ||
| Cia. Itaú de Capitalização | Itaú EU Lux-Itaú Latin America Equity Fund (1) | Pró-Imóvel Promotora Ltda. | ||
| Conectcar Soluções de Mobilidade Eletronica S.A. (1)(2) | Itaú Europa Luxembourg S.A. | Proserv - Promociones y Servicios S.A. de Capital Variable | ||
| Credicard Promotora de Vendas Ltda. | Itau Global Asset Management Limited | Provar Negócios de Varejo Ltda. | ||
| Ctbh Fundo de Investimento Imobiliário - FII (1) | Itaú Institucional Curto Prazo - Fundo de Investimento | Recovery do Brasil Consultoria S.A. | ||
| Dibens Leasing S.A. - Arrendamento Mercantil (1) | Itaú International Investment LLC | Recovery do Brasil Gestão de Ativos Ltda. | ||
| Estrel Serviços Administrativos S.A. | Itaú International Securities Inc. (1) | Recuperadora de Creditos Ltda. | ||
| Estrutura III - Fundo de Investimento em Participações (1) | Itaú Japan Asset Management Limited | Redecard S.A. (1) | ||
| Facilita Promotora Ltda. | Itaú Kinea Private Equity Multimercado Fundo de Investimento em Cotas de Fundos de Investimento Crédito Privado (1) | Rt Alm 5 Fundo de Investimento Renda Fixa | ||
| FC Recovery S.A. | Itaú Middle East Limited | Rt Alm Soberano 2 Fundo de Investimento Renda Fixa | ||
| FIC Promotora de Vendas Ltda. | Itaú Rent Administração e Participações Ltda. | Rt Challenger Renda Fixa Crédito Privado - Fundo de Investimento em Cotas de Fundos de Investimento | ||
| Fideicomisos Financiero AC1 (1) | Itaú Seguros S.A. | Rt Columbia Renda Fixa Crédito Privado - Fundo de Investimento em Cotas de Fundos de Investimento | ||
| Fideicomisos Financiero Privados BHSA (1) | Itaú Singapore Securities Pte. Ltd. (1) | Rt Discovery Renda Fixa Crédito Privado - Fundo de Investimento em Cotas de Fundos de Investimento | ||
| Fideicomisos Financiero Renova (1) | Itau UK Asset Management Limited | Rt Endeavour Renda Fixa Crédito Privado - Fundo de Investimento | ||
| Fideicomisos Financiero TB1 (1) | Itaú Unibanco Holding Cayman Branch (1) | Rt Enterprise Soberano Renda Fixa Fundo de Investimento (1) | ||
| Fideicomisos Financiero TR1 (1) | Itaú Unibanco Holding S.A. (1) | Rt Excelsior Renda Fixa Crédito Privado - Fundo de Investimento | ||
| Financeira Itaú CBD S.A. - Crédito, Financ. e Investimento (1) | Itaú Unibanco S.A. Cayman Branch (1) | Rt Defiant Multimercado - Fundo de Investimento | ||
| Fundo de Investimento em Direitos Creditórios Não-Padronizados Barzel (1) | Itaú Unibanco S.A. New York Branch (1) | Rt Galileo Renda Fixa Crédito Privado - Fundo de Investimento em Cotas de Fundos de Investimento | ||
| Fundo de Investimento em Direitos Creditórios Não-Padronizados NPL I (1) | Itaú Unibanco S.A. Tokyo Branch (1) | Rt Itaú Dj Títulos Públicos Fundo de Investimento Referenciado DI (1) | ||
| Fundo Fortaleza de Investimento Imobiliário (1) | Itaú Unibanco S.A. (1) | Rt Itaú SIF – Brasil (1) | ||
| Garnet Corporation | Itaú Unibanco S.A.Nassau Branch (1) | Rt Magellan Renda Fixa Crédito Privado - Fundo de Investimento em Cotas de Fundos de Investimento | ||
| Hipercard Banco Múltiplo S.A. (1) | Itaú Unibanco Serviços e Processamento de Informações Comerciais Ltda. | Rt Multigestor 4 Fundo de Investimento em Cotas De Fundos de Investimento Multimercado | ||
| iCarros Ltda. | Itaú Unibanco Veículos Administradora de Consórcios Ltda. (1) | Rt Nation Renda Fixa - Fundo de Investimento | ||
| IGA Participações S.A. | Itau USA Asset Management Inc. | Rt Nor Renda Fixa - Fundo de Investimento em Cotas de Fundos de Investimento (1) | ||
| Intrag Distribuidora de Títulos e Valores Mobiliários Ltda. (1) | Itau USA Inc. | Rt Odyssey Renda Fixa Crédito Privado - Fundo de Investimento em Cotas de Fundos de Investimento | ||
| Intrag-Part Administração e Participações Ltda. | Itaú Valores S.A. (1) | Rt Pathfinder Renda Fixa Crédito Privado - Fundo de Investimento em Cotas de Fundos de Investimento | ||
| Investimentos Bemge S.A. | Itaú Vida e Previdência S.A. | Rt Union Renda Fixa Fundo de Investimento | ||
| IPI - Itaúsa Portugal Investimentos, SGPS, Lda | Itauprev Retirement Renda Fixa Crédito Privado - Fundo de Investimento | Rt Valiant Renda Fixa - Fundo de Investimento | ||
| Itaú Administração Previdenciária Ltda. | Itaúsa Europa - Investimentos, SGPS, Lda | Rt Voyager Renda Fixa Crédito Privado - Fundo de Investimento (1) | ||
| Itaú Administradora de Consórcios Ltda. (1)(2) | Itaúsa Portugal - Soc. Gestora de Partic. Sociais, S.A. | Scala Curto Prazo - Fundo de Investimento em Cotas de Fundos de Investimento (1) | ||
| Itaú Asia Securities Ltd. (1) | Itauseg Participações S.A. | Topaz Holding Ltd. | ||
| Itaú Asset Management S.A. Sociedad Gerente de Fondos Comunes de Inversión | Itauseg Saúde S.A. | Trishop Promoção e Serviços Ltda. | ||
| Itaú Bahamas Directors Ltd. | Itauvest Distribuidora de Títulos e Val. Mobiliários S.A. (1) | Tulipa S.A. | ||
| Itaú Bahamas Nominees Ltd. | ITB Holding Brasil Participações Ltda. | Unibanco Empreendimentos Ltda. | ||
| Itaú Bank & Trust Bahamas Ltd. (1) | ITB Holding Ltd. (1) | Unibanco Negócios Imobiliários Ltda. | ||
| Itaú Bank & Trust Cayman Ltd. (1) | Itrust Servicios Inmobiliarios S.A.C.I. | Uni-Investment International Corp. (1) | ||
| Itau Bank, Ltd. (1) | IU Seguros S.A. | Unión Capital AFAP S.A. | ||
| Itaú BBA Colombia S.A. Corporacion Financiera (1) | Iucor Corretora de Seguros Ltda. | Universo Fundo de Investimento em Participações (1) | ||
| Itaú BBA Corredor de Bolsa Ltda. (1) | Jasper International Investment LLC | |||
(1) Institutions that also comprise the Prudential Conglomerate.
(2) Institution that comprises only the Prudential Conglomerate.
| 17 | |
| Itaú Unibanco |
| Risk and Capital Management – Pillar 3 |
Material entities
Total assets, shareholders’ equity, and the industries of the material entities, including those subject to the risk weight for the purpose of capital requirements are as follows:
| Major Institutions | R$ million | |||||||||||||||||||||||||||
| 03/31/2016 | 12/31/2015 | 03/31/2015 | ||||||||||||||||||||||||||
| Institutions | Country | Activity | Total Assets | Equity | Total Assets | Equity | Total Assets | Equity | ||||||||||||||||||||
| Banco Itaú Argentina S.A. (1) | Argentina | Financial institution | 5,387 | 678 | 6,918 | 777 | 6,209 | 703 | ||||||||||||||||||||
| Banco Itaú BBA S.A. (1) | Brazil | Financial institution | 6,277 | 5,891 | 6,293 | 5,690 | 6,279 | 5,893 | ||||||||||||||||||||
| Banco Itaú BMG Consignado S.A (1) | Brazil | Financial institution | 44,366 | 2,343 | 42,265 | 2,290 | 46,971 | 2,151 | ||||||||||||||||||||
| Banco Itaú Chile (1) | Chile | Financial institution | 47,242 | 6,317 | 46,458 | 4,315 | 40,478 | 3,771 | ||||||||||||||||||||
| Banco Itaú Paraguay S.A. (1) | Paraguay | Financial institution | 11,770 | 1,625 | 12,417 | 1,639 | 11,042 | 1,397 | ||||||||||||||||||||
| Banco Itaú Suisse S.A. (1) | Switzerland | Financial institution | 5,340 | 691 | 6,096 | 714 | 4,840 | 584 | ||||||||||||||||||||
| Banco Itaú Uruguay S.A. (1) | Uruguay | Financial institution | 14,964 | 1,228 | 16,510 | 1,296 | 13,475 | 1,094 | ||||||||||||||||||||
| Banco Itaucard S.A. (1) | Brazil | Financial institution | 105,929 | 19,687 | 107,221 | 19,383 | 123,034 | 19,664 | ||||||||||||||||||||
| Banco Itauleasing S.A. (1) | Brazil | Financial institution | 10,911 | 10,355 | 10,875 | 10,245 | 10,265 | 9,752 | ||||||||||||||||||||
| Cia. Itaú de Capitalização | Brazil | Premium Bonds | 3,974 | 560 | 4,099 | 679 | 4,169 | 841 | ||||||||||||||||||||
| Dibens Leasing S.A. - Arrendamento Mercantil (1) | Brazil | Leasing | 170,284 | 4,023 | 167,917 | 3,864 | 150,805 | 3,197 | ||||||||||||||||||||
| Financeira Itaú CBD S.A. Crédito, Financiamento e Investimento (1) | Brazil | Consumer Finance Credit | 3,798 | 957 | 3,983 | 908 | 3,796 | 978 | ||||||||||||||||||||
| Hipercard Banco Múltiplo S.A. (1) | Brazil | Financial institution | 9,372 | 3,996 | 9,516 | 3,915 | 8,141 | 3,627 | ||||||||||||||||||||
| Itau Bank, Ltd. (1) | Cayman Islands | Financial institution | 43,688 | 2,805 | 43,097 | 1,592 | 28,137 | 2,913 | ||||||||||||||||||||
| Itaú BBA Colombia S.A. Corporación Financiera (1) | Colombia | Financial institution | 630 | 374 | 677 | 393 | 474 | 398 | ||||||||||||||||||||
| Itau BBA International plc (1) | United Kingdom | Financial institution | 22,579 | 3,618 | 27,497 | 3,938 | 22,105 | 3,184 | ||||||||||||||||||||
| Itau BBA USA Securities Inc. (1) | United States | Broker | 1,654 | 1,506 | 1,811 | 1,687 | 7,741 | 1,446 | ||||||||||||||||||||
| Itaú BMG Seguradora S.A. | Brazil | Insurance | 193 | 71 | 195 | 77 | 207 | 74 | ||||||||||||||||||||
| Itaú Corretora de Valores S.A. (1) | Brazil | Broker | 4,375 | 1,427 | 4,519 | 1,365 | 5,475 | 2,745 | ||||||||||||||||||||
| Itaú Seguros S.A. | Brazil | Insurance | 10,775 | 5,161 | 10,858 | 5,435 | 12,159 | 5,817 | ||||||||||||||||||||
| Itaú Unibanco S.A. (1) | Brazil | Financial institution | 1,240,269 | 58,153 | 1,297,135 | 56,199 | 1,185,732 | 51,699 | ||||||||||||||||||||
| Itaú Vida e Previdência S.A. | Brazil | Pension Plan | 134,872 | 3,827 | 128,760 | 3,769 | 114,424 | 5,202 | ||||||||||||||||||||
| Luizacred S.A. Soc. Cred. Financiamento Investimento (1) | Brazil | Consumer Finance Credit | 4,131 | 579 | 4,376 | 609 | 4,476 | 561 | ||||||||||||||||||||
| Redecard S.A. - REDE (1) | Brazil | Acquirer | 48,684 | 14,202 | 50,635 | 13,729 | 45,176 | 13,074 | ||||||||||||||||||||
(1) Prudential Conglomerate Institutions.
| 18 | |
| Itaú Unibanco |
| Risk and Capital Management – Pillar 3 |
| 4 | Investments in other entities |
| 4.1 | Investments in other entities not classified in the trading book |
The financial statements of Itaú Unibanco and its subsidiaries have been prepared in accordance with accounting practices adopted in Brazil, as established by Brazilian Corporate Law, together with CMN and Brazilian Securities and Exchange Commission (CVM) regulations, in the latter cases when such regulations are not inconsistent with BACEN regulations.
The interests held in other entities, except those measured at book value (equity method of accounting), which we intend to hold for a long term, are classified in Permanent Assets and measured at their acquisition cost (cost method). Investments measured under the cost method are stated at their historical amount, i.e., the price the company paid to acquire them. The investor does not account for the profits or losses of an investee, except when related to the dividends based on profits obtained, when distributed.
Investments in other companies which there is no intention to hold for a long term are classified as Securities and, based on the designation defined pursuant to Management strategies, they are recognized at fair value, in Other Comprehensive Income.
Itaú Unibanco applies its policies on a systematic basis, ensuring the consistency and comparability of its information, except when otherwise required by regulators, under amended regulations.
In the first quarter of 2016, there were no significant amendments to policies related to equity interests.
For further information on Itaú Unibanco’s accounting policies, please see Note 4 – “Summary of the main accounting practices”, to the Complete Financial Statements, that can be found on the website www.itau.com.br/investor-relations.
The table below presents the amounts for corporate shareholdings classified as permanent assets, excluding those valued by equity accounting, and for investments in equity classified as securities, both of which are not included in the trading portfolio. As of March 31, 2016, the capital required for these shareholdings was R$ 64.5 million.
| Investments in other entities | R$ million | |||||||||||
| 03/31/2016 | 12/31/2015 | 03/31/2015 | ||||||||||
| Carrying Amount | 585.1 | 573.9 | 856.3 | |||||||||
| Public | 409.4 | 396.7 | 103.2 | |||||||||
| Private | 175.8 | 177.2 | 753.1 | |||||||||
| Fair value | 778.2 | 715.1 | 966.6 | |||||||||
| Public | 570.4 | 516.3 | 206.0 | |||||||||
| Private | 207.8 | 198.8 | 760.6 | |||||||||
| Gain or losses arising on investments in other entities | 0.1 | 0.1 | (0.0 | ) | ||||||||
| Recognized and unrealized gain or losses | (150.7 | ) | (159.2 | ) | (249.5 | ) | ||||||
| Unrecognized and unrealized gain or losses | 193.0 | 141.1 | 107.9 | |||||||||
The risk of shareholdings not included in the trading portfolio is assessed, for ICAAP purposes, as part of the Itaú Unibanco risk assessment process.
| 19 | |
| Itaú Unibanco |
| Risk and Capital Management – Pillar 3 |
| 5 | Credit Risk |
| 5.1 | Framework and Treatment |
Credit risk is the possibility of losses associated with: failure by a borrower, issuer or counterparty to fulfill their respective financial obligations as defined in the contracts; value loss of credit agreements resulting from deterioration of the borrower’s issuer’s or counterparty’s credit rating; reduction of profits or income; benefits granted upon subsequent renegotiations; or debt recovery costs.
Itaú Unibanco’s credit risk management and control structure establishes operational limits, risk mitigation mechanisms and processes, and instruments to measure, monitor and control risk that can quantify the credit risk inherent to all products, portfolio concentrations and the impacts of potential changes in the economic environment. The Bank’s portfolio, policies and strategies are continuously monitored so as to ensure compliance with the rules and laws in effect in each country.
Itaú Unibanco’s credit risk management is the primary responsibility of all Business Areas and is aimed at maintaining the quality of the credit portfolio at levels that are consistent with the institution’s risk appetite, for each market segment in which it operates. The Business Areas have to:
| · | Follow up and closely monitor the portfolios under their responsibility; |
| · | Grant credit in accordance to the authority levels, market conditions, macroeconomic prospects, changes in markets and products and the effects of sector and geographic concentrations; |
| · | Manage credit risk adopting actions that provide sustainability to its business. |
Itaú Unibanco’s credit policy is based on internal factors, such as: client rating criteria, performance and evolution of the portfolio, default levels, return rates, and allocated economic capital; and on external factors, related to the economic environment, interest rates, market default indicators, inflation and changes in consumption.
Itaú Unibanco has a structured process to maintain a diversified portfolio, which is considered appropriate by the institution. The concentrations are monitored continuously for economic sectors, and largest debtors, allowing preventive measures to be taken to avoid the violation of the established limits.
The credit risk management governance is conducted through corporate bodies, and act primarily by assessing the competitive market conditions, setting the credit limits for the institution, reviewing control practices and policies, approving these actions at the respective authority levels. The risk communication and reporting process, including disclosure of institutional policies on credit risk management, are responsibility of this structure.
The credit risk control is carried out by an independent executive area segregated from the business units, as required by the current regulation. Among others, the mains responsibilities of the credit risk control area are to:
| · | Monitor and control the performance of the credit portfolios in view of the limits approved by senior management; |
| · | Conduct the centralized control of the credit risk segregated from the business units; |
| · | Manage the process of preparation, review and approval of institutional policies of credit risk, meeting the regulatory guidelines; |
| · | Assess the credit risk of the operations at the authority levels appointed by the credit commissions. |
The policies and products’ evaluation process enables the Itaú Unibanco to identify potential risks in order to ensure that credit decisions make sense from an economic and risk perspective.
Itaú Unibanco’s centralized process for approving credit policies and validating models ensures the synchronization of credit actions.
The credit rating process for wholesale transactions is based on information such as the economic and financial condition of the counterparty, its cash-generating capabilities, the economic group to which it belongs, the current and prospective situation of the economic sector in which it operates. Credit proposals are analyzed on a case-by-case basis through the approval governance.
With respect to retail transactions (individuals, small and medium companies), ratings are assigned based on statistical application (in the early stages of Itaú Unibanco’s relationship with a customer) and behavior score (used for customers with whom Itaú Unibanco already has a relationship) models. Decisions are met based on continuously monitored scoring models. Extraordinarily, an individual analysis of specific cases may be performed, in which case credit approval follows the applicable authority levels.
| 20 | |
| Itaú Unibanco |
| Risk and Capital Management – Pillar 3 |
Additionally, the risk assessment of both the retail segments and the wholesale segment incorporate client debts both to Itaú and the market.
Itaú Unibanco rates government securities and other debt instruments according to their credit quality with the purpose of managing the exposures.
Itaú Unibanco strictly controls credit exposure to clients and counterparties, acting on occasional limit breaches. In this sense, contractual covenants may be used, such as the right to demand early payment or require of additional collateral.
Itaú Unibanco counts on a specific structure and processes aimed at ensuring that the country risk is managed and controlled, including: (i) country risk governance; (ii) country ratings; (iii) credit limits for countries; (iv) limits monitoring; and (v) actions for limit breaches.
In line with the principles of CMN Resolution 3,721, Itaú Unibanco’s credit risk management structure and institutional policy are approved by its Board of Directors, applicable to all companies and subsidiaries in Brazil and abroad.
The guidelines of the institutional credit risk management policy can be accessed at http://www.itau.com.br/investor-relations, under Corporate Governance, Regulations and Policies, Public Access Report – Credit Risk.
| 21 | |
| Itaú Unibanco |
| Risk and Capital Management – Pillar 3 |
| 5.2 | Credit Portfolio Analysis |
The information presented in the following tables allow the analysis of the credit portfolio, and its behavior, from different view stands: operations with credit granting characteristics segregated by Brazil Geographic Regions, by Countries, economic sector, by type of product and remaining maturity, concentration of the credit portfolio on largest debtors and the amount of the overdue transactions and allowance for loan losses.
Operations with Credit Granting Characteristics by Brazil Geographic Regions and by Countries
| Operations with Credit(1) Granting Characteristics in Brazil: Exposure | R$ million | |||||||||||||||||||||||||||
| 03/31/2016 | 12/31/2015 | |||||||||||||||||||||||||||
| Southeast | South | North | Northeast | Midwest | Brazil | Brazil | ||||||||||||||||||||||
| Individuals | 123,047 | 21,430 | 7,635 | 29,097 | 12,598 | 193,807 | 197,009 | |||||||||||||||||||||
| Rural Loans | 167 | 32 | - | 2 | 4 | 205 | 213 | |||||||||||||||||||||
| Real State | 29,562 | 2,428 | 371 | 1,338 | 1,644 | 35,343 | 34,582 | |||||||||||||||||||||
| Payroll | 24,634 | 5,401 | 3,724 | 8,662 | 3,679 | 46,100 | 45,365 | |||||||||||||||||||||
| Vehicle and Leasing | 9,634 | 2,842 | 840 | 2,250 | 1,797 | 17,363 | 19,112 | |||||||||||||||||||||
| Credit card | 37,045 | 7,564 | 2,136 | 15,045 | 3,635 | 65,425 | 68,283 | |||||||||||||||||||||
| Endorsements and Sureties(2) | 623 | 32 | 2 | 8 | 50 | 715 | 749 | |||||||||||||||||||||
| Personal Loans (Other) | 21,382 | 3,131 | 562 | 1,792 | 1,789 | 28,656 | 28,705 | |||||||||||||||||||||
| Companies | 205,742 | 18,359 | 1,869 | 8,333 | 5,100 | 239,403 | 264,147 | |||||||||||||||||||||
| Rural Loans | 5,255 | 2,960 | - | 240 | 315 | 8,770 | 9,358 | |||||||||||||||||||||
| Investments | 50,488 | 5,720 | 781 | 3,093 | 2,156 | 62,238 | 68,928 | |||||||||||||||||||||
| Import and Export | 23,657 | 1,429 | 138 | 670 | 171 | 26,065 | 28,330 | |||||||||||||||||||||
| Working Capital, Discount Bonds and Guaranteed Account | 76,826 | 7,389 | 859 | 3,946 | 2,222 | 91,242 | 103,647 | |||||||||||||||||||||
| Endorsements and Sureties(2) | 46,923 | 367 | 31 | 140 | 90 | 47,551 | 50,136 | |||||||||||||||||||||
| Other | 2,593 | 494 | 60 | 244 | 146 | 3,537 | 3,748 | |||||||||||||||||||||
| Total | 328,789 | 39,789 | 9,504 | 37,430 | 17,698 | 433,210 | 461,156 | |||||||||||||||||||||
(1) The amount includes endorsements, sureties and committed loans, net of allowance for loan losses.
(2) From the 4th quarter of 2015, the BACEN Circular 3,770 has changed the Credit Conversion Factor (“Fator de Conversão de Crédito”) applied to some specific Endorsements and Sureties to 50%.
| Operations with Credit(1) Granting Characteristics by Countries: Exposure | R$ million | |||||||||||||||||||||||||||||||||||||||||||||||
| 03/31/2016 | 12/31/2015 | |||||||||||||||||||||||||||||||||||||||||||||||
| Brazil | Argentina | Chile | Colombia | United States of America | Paraguay | United Kingdon | Switzerland | Uruguay | Other | Total | Total | |||||||||||||||||||||||||||||||||||||
| Individuals | 193,807 | 1,217 | 19,218 | - | - | 2,671 | - | - | 2,306 | - | 219,219 | 223,650 | ||||||||||||||||||||||||||||||||||||
| Rural Loans | 205 | - | - | - | - | - | - | - | - | - | 205 | 213 | ||||||||||||||||||||||||||||||||||||
| Real State | 35,343 | 1 | 9,877 | - | - | 194 | - | - | 247 | - | 45,662 | 45,096 | ||||||||||||||||||||||||||||||||||||
| Payroll | 46,100 | - | - | - | - | - | - | - | - | - | 46,100 | 45,365 | ||||||||||||||||||||||||||||||||||||
| Vehicle and Leasing | 17,363 | - | - | - | - | 153 | - | - | - | - | 17,516 | 19,277 | ||||||||||||||||||||||||||||||||||||
| Credit card | 65,425 | 927 | 1,417 | - | - | 727 | - | - | 1,362 | - | 69,858 | 73,244 | ||||||||||||||||||||||||||||||||||||
| Endorsements and Sureties(2) | 715 | - | 6 | - | - | - | - | - | 13 | - | 734 | 776 | ||||||||||||||||||||||||||||||||||||
| Personal Loans (Other) | 28,656 | 289 | 7,918 | - | - | 1,597 | - | - | 684 | - | 39,144 | 39,679 | ||||||||||||||||||||||||||||||||||||
| Companies | 239,403 | 2,649 | 23,057 | 494 | 3,513 | 4,512 | 11,947 | 1,825 | 5,396 | 71 | 292,867 | 322,010 | ||||||||||||||||||||||||||||||||||||
| Rural Loans | 8,770 | - | - | - | - | - | - | - | - | - | 8,770 | 9,358 | ||||||||||||||||||||||||||||||||||||
| Investments | 62,238 | 3 | 2,476 | - | - | 7 | 30 | - | 58 | - | 64,812 | 71,611 | ||||||||||||||||||||||||||||||||||||
| Import and Export | 26,065 | 236 | 326 | - | 3,348 | - | 3,747 | 1,763 | 51 | - | 35,536 | 38,857 | ||||||||||||||||||||||||||||||||||||
| Working Capital, Discount Bonds and Guaranteed Account | 91,242 | 1,933 | 18,536 | 494 | - | 4,364 | 8,000 | - | 4,925 | 48 | 129,542 | 144,698 | ||||||||||||||||||||||||||||||||||||
| Endorsements and Sureties(2) | 47,551 | 477 | 1,671 | - | 165 | 141 | 170 | 62 | 347 | 23 | 50,607 | 53,737 | ||||||||||||||||||||||||||||||||||||
| Other | 3,537 | - | 48 | - | - | - | - | - | 15 | - | 3,600 | 3,749 | ||||||||||||||||||||||||||||||||||||
| Total | 433,210 | 3,866 | 42,275 | 494 | 3,513 | 7,183 | 11,947 | 1,825 | 7,702 | 71 | 512,086 | 545,660 | ||||||||||||||||||||||||||||||||||||
(1) The amount includes endorsements, sureties and committed loans, net of allowance for loan losses.
(2) From the 4th quarter of 2015, the BACEN Circular 3,770 has changed the Credit Conversion Factor (“Fator de Conversão de Crédito”) applied to some specific Endorsements and Sureties to 50%.
| Operations with Credit(1) Granting Characteristics in Brazil: Quarterly Average Exposure | R$ million | |||||||||||||||||||||||||||
| 03/31/2016 | 12/31/2015 | |||||||||||||||||||||||||||
| Southeast | South | North | Northeast | Midwest | Brazil | Brazil | ||||||||||||||||||||||
| Individuals | 123,834 | 21,583 | 7,720 | 29,524 | 12,747 | 195,408 | 197,178 | |||||||||||||||||||||
| Rural Loans | 171 | 31 | - | 2 | 5 | 209 | 213 | |||||||||||||||||||||
| Real State | 29,246 | 2,403 | 367 | 1,319 | 1,628 | 34,963 | 34,009 | |||||||||||||||||||||
| Payroll | 24,372 | 5,329 | 3,726 | 8,608 | 3,698 | 45,733 | 45,700 | |||||||||||||||||||||
| Vehicle and Leasing | 10,192 | 2,968 | 868 | 2,334 | 1,875 | 18,237 | 19,904 | |||||||||||||||||||||
| Credit card | 37,805 | 7,695 | 2,193 | 15,461 | 3,700 | 66,854 | 67,223 | |||||||||||||||||||||
| Endorsements and Sureties(2) | 641 | 32 | 2 | 8 | 49 | 732 | 741 | |||||||||||||||||||||
| Personal Loans (Other) | 21,407 | 3,125 | 564 | 1,792 | 1,792 | 28,680 | 29,388 | |||||||||||||||||||||
| Companies | 216,688 | 19,360 | 1,945 | 8,505 | 5,277 | 251,775 | 277,821 | |||||||||||||||||||||
| Rural Loans | 5,231 | 3,250 | 3 | 248 | 333 | 9,065 | 9,624 | |||||||||||||||||||||
| Investments | 53,336 | 5,986 | 807 | 3,234 | 2,220 | 65,583 | 70,809 | |||||||||||||||||||||
| Import and Export | 24,863 | 1,352 | 163 | 645 | 175 | 27,198 | 29,189 | |||||||||||||||||||||
| Working Capital, Discount Bonds and Guaranteed Account | 82,373 | 7,894 | 877 | 3,988 | 2,312 | 97,444 | 103,878 | |||||||||||||||||||||
| Endorsements and Sureties(2) | 48,189 | 379 | 33 | 149 | 93 | 48,843 | 60,608 | |||||||||||||||||||||
| Other | 2,696 | 499 | 62 | 241 | 144 | 3,642 | 3,713 | |||||||||||||||||||||
| Total | 340,522 | 40,943 | 9,665 | 38,029 | 18,024 | 447,183 | 474,999 | |||||||||||||||||||||
(1) The amount includes endorsements, sureties and committed loans, net of allowance for loan losses.
(2) From the 4th quarter of 2015, the BACEN Circular 3,770 has changed the Credit Conversion Factor (“Fator de Conversão de Crédito”) applied to some specific Endorsements and Sureties to 50%.
| 22 | |
| Itaú Unibanco |
| Risk and Capital Management – Pillar 3 |
| Operations with Credit(1) Granting Characteristics by Countries: Quarterly Average Exposure | R$ million | |||||||||||||||||||||||||||||||||||||||||||||||
| 03/31/2016 | 12/31/2015 | |||||||||||||||||||||||||||||||||||||||||||||||
| Brazil | Argentina | Chile | Colombia | United States of America | Paraguay | United Kingdon | Switzerland | Uruguay | Other | Total | Total | |||||||||||||||||||||||||||||||||||||
| Individuals | 195,408 | 1,353 | 19,420 | - | - | 2,768 | - | - | 2,486 | - | 221,435 | 222,127 | ||||||||||||||||||||||||||||||||||||
| Rural Loans | 209 | - | - | - | - | - | - | - | - | - | 209 | 213 | ||||||||||||||||||||||||||||||||||||
| Real State | 34,963 | 2 | 9,954 | - | - | 199 | - | - | 262 | - | 45,380 | 44,592 | ||||||||||||||||||||||||||||||||||||
| Payroll | 45,733 | - | - | - | - | - | - | - | - | - | 45,733 | 45,700 | ||||||||||||||||||||||||||||||||||||
| Vehicle and Leasing | 18,237 | - | - | - | - | 159 | - | - | - | - | 18,396 | 20,074 | ||||||||||||||||||||||||||||||||||||
| Credit card | 66,854 | 1,030 | 1,430 | - | - | 756 | - | - | 1,481 | - | 71,551 | 72,267 | ||||||||||||||||||||||||||||||||||||
| Endorsements and Sureties(2) | 732 | - | 8 | - | - | - | - | - | 15 | - | 755 | 764 | ||||||||||||||||||||||||||||||||||||
| Personal Loans (Other) | 28,680 | 321 | 8,028 | - | - | 1,654 | - | - | 728 | - | 39,411 | 38,517 | ||||||||||||||||||||||||||||||||||||
| Companies | 251,775 | 3,068 | 23,293 | 486 | 3,758 | 4,772 | 12,476 | 1,973 | 5,615 | 222 | 307,438 | 338,233 | ||||||||||||||||||||||||||||||||||||
| Rural Loans | 9,065 | - | - | - | - | - | - | - | - | - | 9,065 | 9,624 | ||||||||||||||||||||||||||||||||||||
| Investments | 65,583 | 3 | 2,511 | - | - | 7 | 31 | - | 76 | - | 68,211 | 73,513 | ||||||||||||||||||||||||||||||||||||
| Import and Export | 27,198 | 270 | 310 | - | 3,583 | - | 3,871 | 1,915 | 50 | - | 37,197 | 40,073 | ||||||||||||||||||||||||||||||||||||
| Working Capital, Discount Bonds and Guaranteed Account | 97,444 | 2,234 | 18,691 | 486 | - | 4,578 | 8,368 | - | 5,124 | 194 | 137,119 | 146,742 | ||||||||||||||||||||||||||||||||||||
| Endorsements and Sureties(2) | 48,843 | 561 | 1,757 | - | 175 | 186 | 206 | 58 | 357 | 28 | 52,171 | 64,567 | ||||||||||||||||||||||||||||||||||||
| Other | 3,642 | - | 24 | - | - | 1 | - | - | 8 | - | 3,675 | 3,714 | ||||||||||||||||||||||||||||||||||||
| Total | 447,183 | 4,421 | 42,713 | 486 | 3,758 | 7,540 | 12,476 | 1,973 | 8,101 | 222 | 528,873 | 560,360 | ||||||||||||||||||||||||||||||||||||
(1) The amount includes endorsements, sureties and committed loans, net of allowance for loan losses.
(2) From the 4th quarter of 2015, the BACEN Circular 3,770 has changed the Credit Conversion Factor (“Fator de Conversão de Crédito”) applied to some specific Endorsements and Sureties to 50%.
Operations with Credit Granting Characteristics by Economic Sector
The composition of loan portfolios by economic sector is presented below:
| Operations with Credit Granting Characteristics in Brazil(1): Exposure | R$ million | |||||||||||||||||||||||||||||||||||
| 03/31/2016 | 12/31/2015 | |||||||||||||||||||||||||||||||||||
| Individuals | Rural Loans | Real State | Payroll | Vehicle and Leasing | Credit Card | Endorsements and Sureties(2) | Personal Loans (Other) | Total | Total | |||||||||||||||||||||||||||
| Total | 205 | 45,662 | 46,100 | 17,516 | 69,858 | 734 | 39,144 | 219,219 | 223,650 | |||||||||||||||||||||||||||
(1) The amount includes endorsements, sureties and committed loans, net of allowance for loan losses.
(2) From the 4th quarter of 20015, the BACEN Circular 3,770 has changed the Credit Conversion Factor (“Fator de Conversão de Crédito”) applied to some specific Endorsements and Sureties to 50%.
| Operations with Credit(1) Granting Characteristics in Brazil: Exposure | R$ million | |||||||||||||||||||||||||||||||||||||||||||||||||||||||||||||||
| 03/31/2016 | 12/31/2015 | |||||||||||||||||||||||||||||||||||||||||||||||||||||||||||||||
| Rural Loans | Investments | Import and Export | Working Capital, Discount Bonds and Guaranteed Account | Endorsements | Other | Total | Total | |||||||||||||||||||||||||||||||||||||||||||||||||||||||||
| Companies | Total | % | Total | % | Total | % | Total | % | Total | % | Total | % | Total | % | Total | % | ||||||||||||||||||||||||||||||||||||||||||||||||
| Public Sector | - | 0.0 | % | 1,777 | 2.7 | % | 1,028 | 2.9 | % | 292 | 0.2 | % | 782 | 1.5 | % | - | 0.0 | % | 3,879 | 1.3 | % | 4,012 | 1.2 | % | ||||||||||||||||||||||||||||||||||||||||
| ENERGY | - | 0.0 | % | - | 0.0 | % | - | 0.0 | % | 228 | 0.2 | % | - | 0.0 | % | - | 0.0 | % | 228 | 0.1 | % | 90 | 0.0 | % | ||||||||||||||||||||||||||||||||||||||||
| PETROCHEMICAL AND CHEMICAL | - | 0.0 | % | 1,679 | 2.6 | % | 1,021 | 2.9 | % | 4 | 0.0 | % | 761 | 1.5 | % | - | 0.0 | % | 3,465 | 1.2 | % | 3,510 | 1.1 | % | ||||||||||||||||||||||||||||||||||||||||
| SUNDRY | - | 0.0 | % | 98 | 0.2 | % | 7 | 0.0 | % | 60 | 0.0 | % | 21 | 0.0 | % | - | 0.0 | % | 186 | 0.1 | % | 412 | 0.1 | % | ||||||||||||||||||||||||||||||||||||||||
| Private Sector | 8,770 | 100.0 | % | 63,035 | 97.3 | % | 34,508 | 97.1 | % | 129,250 | 99.8 | % | 49,825 | 98.5 | % | 3,600 | 100.0 | % | 288,988 | 98.7 | % | 317,998 | 98.8 | % | ||||||||||||||||||||||||||||||||||||||||
| SUGAR AND ALCOHOL | 1,175 | 13.4 | % | 4,828 | 7.4 | % | 2,407 | 6.8 | % | 417 | 0.3 | % | 657 | 1.3 | % | 51 | 1.4 | % | 9,535 | 3.3 | % | 10,282 | 3.2 | % | ||||||||||||||||||||||||||||||||||||||||
| AGRIBUSINESS AND FERTILIZERS | 2,062 | 23.5 | % | 1,724 | 2.7 | % | 3,916 | 11.0 | % | 6,028 | 4.7 | % | 1,321 | 2.6 | % | 49 | 1.4 | % | 15,100 | 5.2 | % | 15,939 | 4.9 | % | ||||||||||||||||||||||||||||||||||||||||
| FOOD AND BEVERAGE | 1,454 | 16.6 | % | 3,322 | 5.1 | % | 1,703 | 4.8 | % | 4,861 | 3.8 | % | 4,813 | 9.5 | % | 95 | 2.6 | % | 16,248 | 5.5 | % | 17,659 | 5.5 | % | ||||||||||||||||||||||||||||||||||||||||
| BANKS AND OTHER FINANCIAL INSTITUTIONS | 534 | 6.1 | % | 369 | 0.6 | % | 5 | 0.0 | % | 6,160 | 4.8 | % | 2,104 | 4.2 | % | 6 | 0.2 | % | 9,178 | 3.1 | % | 9,801 | 3.0 | % | ||||||||||||||||||||||||||||||||||||||||
| CAPITAL ASSETS | 163 | 1.9 | % | 1,855 | 2.9 | % | 1,006 | 2.8 | % | 2,587 | 2.0 | % | 1,709 | 3.4 | % | 190 | 5.3 | % | 7,510 | 2.6 | % | 8,917 | 2.8 | % | ||||||||||||||||||||||||||||||||||||||||
| PULP AND PAPER | 81 | 0.9 | % | 778 | 1.2 | % | 1,324 | 3.7 | % | 637 | 0.5 | % | 266 | 0.5 | % | 14 | 0.4 | % | 3,100 | 1.1 | % | 3,517 | 1.1 | % | ||||||||||||||||||||||||||||||||||||||||
| ELECTRONIC AND IT | 1 | 0.0 | % | 448 | 0.7 | % | 234 | 0.7 | % | 2,754 | 2.1 | % | 1,816 | 3.6 | % | 166 | 4.6 | % | 5,419 | 1.9 | % | 5,845 | 1.8 | % | ||||||||||||||||||||||||||||||||||||||||
| PACKAGING | - | 0.0 | % | 463 | 0.7 | % | 389 | 1.1 | % | 1,325 | 1.0 | % | 400 | 0.8 | % | 78 | 2.2 | % | 2,655 | 0.9 | % | 3,232 | 1.0 | % | ||||||||||||||||||||||||||||||||||||||||
| ENERGY AND SEWAGE | - | 0.0 | % | 4,629 | 7.1 | % | 57 | 0.2 | % | 2,157 | 1.7 | % | 4,602 | 9.1 | % | 355 | 9.9 | % | 11,800 | 4.0 | % | 12,976 | 4.0 | % | ||||||||||||||||||||||||||||||||||||||||
| EDUCATION | 8 | 0.1 | % | 242 | 0.4 | % | - | 0.0 | % | 1,221 | 0.9 | % | 716 | 1.4 | % | 35 | 1.0 | % | 2,222 | 0.8 | % | 2,173 | 0.7 | % | ||||||||||||||||||||||||||||||||||||||||
| PHARMACEUTICALS AND COSMETICS | - | 0.0 | % | 342 | 0.5 | % | 306 | 0.9 | % | 3,250 | 2.5 | % | 1,592 | 3.1 | % | 99 | 2.8 | % | 5,589 | 1.9 | % | 6,020 | 1.9 | % | ||||||||||||||||||||||||||||||||||||||||
| REAL ESTATE AGENTS | 29 | 0.3 | % | 14,049 | 21.7 | % | 6 | 0.0 | % | 8,184 | 6.3 | % | 1,573 | 3.1 | % | 169 | 4.7 | % | 24,010 | 8.2 | % | 24,592 | 7.6 | % | ||||||||||||||||||||||||||||||||||||||||
| ENTERTAINMENT AND TOURISM | - | 0.0 | % | 410 | 0.6 | % | 139 | 0.4 | % | 3,363 | 2.6 | % | 386 | 0.8 | % | 154 | 4.3 | % | 4,452 | 1.5 | % | 4,512 | 1.4 | % | ||||||||||||||||||||||||||||||||||||||||
| WOOD AND FURNITURE | 30 | 0.3 | % | 662 | 1.0 | % | 329 | 0.9 | % | 1,498 | 1.2 | % | 94 | 0.2 | % | 98 | 2.7 | % | 2,711 | 0.9 | % | 2,981 | 0.9 | % | ||||||||||||||||||||||||||||||||||||||||
| CONSTRUCTION MATERIAL | 1 | 0.0 | % | 1,616 | 2.5 | % | 610 | 1.7 | % | 3,272 | 2.5 | % | 1,374 | 2.7 | % | 106 | 2.9 | % | 6,979 | 2.4 | % | 7,337 | 2.3 | % | ||||||||||||||||||||||||||||||||||||||||
| STEEL AND METALLURGY | 42 | 0.5 | % | 2,048 | 3.2 | % | 1,957 | 5.5 | % | 5,284 | 4.1 | % | 1,419 | 2.8 | % | 209 | 5.8 | % | 10,959 | 3.7 | % | 12,442 | 3.9 | % | ||||||||||||||||||||||||||||||||||||||||
| MEDIA | - | 0.0 | % | 396 | 0.6 | % | 85 | 0.2 | % | 398 | 0.3 | % | 268 | 0.5 | % | 15 | 0.4 | % | 1,162 | 0.4 | % | 1,326 | 0.4 | % | ||||||||||||||||||||||||||||||||||||||||
| MINING | 3 | 0.0 | % | 735 | 1.1 | % | 682 | 1.9 | % | 3,076 | 2.4 | % | 1,732 | 3.4 | % | 31 | 0.9 | % | 6,259 | 2.1 | % | 7,048 | 2.2 | % | ||||||||||||||||||||||||||||||||||||||||
| INFRASTRUCTURE WORK | - | 0.0 | % | 1,060 | 1.6 | % | 706 | 2.0 | % | 1,722 | 1.3 | % | 1,823 | 3.6 | % | 114 | 3.2 | % | 5,425 | 1.9 | % | 5,780 | 1.8 | % | ||||||||||||||||||||||||||||||||||||||||
| OIL AND GAS (2) | 133 | 1.5 | % | 467 | 0.7 | % | 714 | 2.0 | % | 3,204 | 2.5 | % | 1,153 | 2.3 | % | 44 | 1.2 | % | 5,715 | 2.0 | % | 6,435 | 2.0 | % | ||||||||||||||||||||||||||||||||||||||||
| PETROCHEMICAL AND CHEMICAL | 250 | 2.9 | % | 1,028 | 1.6 | % | 2,070 | 5.8 | % | 3,413 | 2.6 | % | 1,465 | 2.9 | % | 140 | 3.9 | % | 8,366 | 2.9 | % | 9,436 | 2.9 | % | ||||||||||||||||||||||||||||||||||||||||
| HEALTH CARE | 1 | 0.0 | % | 533 | 0.8 | % | 33 | 0.1 | % | 1,444 | 1.1 | % | 338 | 0.7 | % | 32 | 0.9 | % | 2,381 | 0.8 | % | 2,552 | 0.8 | % | ||||||||||||||||||||||||||||||||||||||||
| INSURANCE AND REINSURANCE AND PENSION PLANS | - | 0.0 | % | 9 | 0.0 | % | - | 0.0 | % | 2 | 0.0 | % | 110 | 0.2 | % | - | 0.0 | % | 121 | 0.0 | % | 96 | 0.0 | % | ||||||||||||||||||||||||||||||||||||||||
| TELECOMMUNICATIONS | - | 0.0 | % | 480 | 0.7 | % | 1 | 0.0 | % | 731 | 0.6 | % | 4,376 | 8.6 | % | 10 | 0.3 | % | 5,598 | 1.9 | % | 6,143 | 1.9 | % | ||||||||||||||||||||||||||||||||||||||||
| CLOTHING AND FOOTWEAR | 83 | 0.9 | % | 861 | 1.3 | % | 617 | 1.7 | % | 2,515 | 1.9 | % | 354 | 0.7 | % | 102 | 2.8 | % | 4,532 | 1.5 | % | 5,300 | 1.6 | % | ||||||||||||||||||||||||||||||||||||||||
| TRADING | 22 | 0.3 | % | 139 | 0.2 | % | 377 | 1.1 | % | 1,106 | 0.9 | % | 469 | 0.9 | % | 20 | 0.6 | % | 2,133 | 0.7 | % | 2,391 | 0.7 | % | ||||||||||||||||||||||||||||||||||||||||
| TRANSPORTATION | 6 | 0.1 | % | 7,823 | 12.1 | % | 706 | 2.0 | % | 4,364 | 3.4 | % | 1,254 | 2.5 | % | 235 | 6.5 | % | 14,388 | 4.9 | % | 15,882 | 4.9 | % | ||||||||||||||||||||||||||||||||||||||||
| DOMESTIC APPLIANCES | - | 0.0 | % | 121 | 0.2 | % | 308 | 0.9 | % | 1,320 | 1.0 | % | 437 | 0.9 | % | 18 | 0.5 | % | 2,204 | 0.8 | % | 2,520 | 0.8 | % | ||||||||||||||||||||||||||||||||||||||||
| VEHICLES AND AUTOPARTS | 4 | 0.0 | % | 4,630 | 7.1 | % | 2,890 | 8.1 | % | 5,913 | 4.6 | % | 4,539 | 9.0 | % | 181 | 5.0 | % | 18,157 | 6.2 | % | 20,518 | 6.4 | % | ||||||||||||||||||||||||||||||||||||||||
| THIRD SECTOR | - | 0.0 | % | 21 | 0.0 | % | - | 0.0 | % | 3,663 | 2.8 | % | 26 | 0.1 | % | 3 | 0.1 | % | 3,713 | 1.3 | % | 3,830 | 1.2 | % | ||||||||||||||||||||||||||||||||||||||||
| PUBLISHING AND PRINTING | - | 0.0 | % | 121 | 0.2 | % | 23 | 0.1 | % | 725 | 0.6 | % | 174 | 0.3 | % | 64 | 1.8 | % | 1,107 | 0.4 | % | 1,173 | 0.4 | % | ||||||||||||||||||||||||||||||||||||||||
| COMMERCE - SUNDRY | 16 | 0.2 | % | 1,109 | 1.7 | % | 606 | 1.7 | % | 12,167 | 9.4 | % | 1,943 | 3.8 | % | 330 | 9.2 | % | 16,171 | 5.5 | % | 19,028 | 5.9 | % | ||||||||||||||||||||||||||||||||||||||||
| INDUSTRY - SUNDRY | 14 | 0.2 | % | 104 | 0.2 | % | 4,636 | 13.0 | % | 4,639 | 3.6 | % | 236 | 0.5 | % | 11 | 0.3 | % | 9,640 | 3.3 | % | 10,720 | 3.3 | % | ||||||||||||||||||||||||||||||||||||||||
| SUNDRY SERVICES | 118 | 1.3 | % | 2,320 | 3.6 | % | 5,088 | 14.3 | % | 18,618 | 14.4 | % | 2,034 | 4.0 | % | 309 | 8.6 | % | 28,487 | 9.7 | % | 30,768 | 9.6 | % | ||||||||||||||||||||||||||||||||||||||||
| SUNDRY | 2,540 | 29.0 | % | 3,293 | 5.1 | % | 578 | 1.6 | % | 7,232 | 5.6 | % | 2,252 | 4.4 | % | 67 | 1.9 | % | 15,962 | 5.5 | % | 18,827 | 5.8 | % | ||||||||||||||||||||||||||||||||||||||||
| Total | 8,770 | 100.0 | % | 64,812 | 100.0 | % | 35,536 | 100.0 | % | 129,542 | 100.0 | % | 50,607 | 100.0 | % | 3,600 | 100.0 | % | 292,867 | 100.0 | % | 322,010 | 100.0 | % | ||||||||||||||||||||||||||||||||||||||||
(1) Including sureties, endorsements and credit commitments, netted from allowance for loan losses.
(2) Comprises trade of fuel.
(3) From the 4th quarter of 20015, the BACEN Circular 3,770 has changed the Credit Conversion Factor (“Fator de Conversão de Crédito”) applied to some specific Endorsements and Sureties to 50%.
| 23 | |
| Itaú Unibanco |
| Risk and Capital Management – Pillar 3 |
Remaining maturity of loan transactions
The table below presents the remaining maturity of operations with credit granting characteristics detailed by type of products:
| Remaining maturities of loan transactions (1) | R$ million | |||||||||||||||||||||||||||||||
| 03/31/2016 | 12/31/2015 | |||||||||||||||||||||||||||||||
up to 6 months | 6 to 12 months | 1 to 5 years | above 5 years | up
to 6 | 6 to 12 months | 1 to 5 years | above 5 years | |||||||||||||||||||||||||
| Individuals | 57,028 | 5,045 | 58,781 | 64,501 | 60,514 | 5,415 | 58,294 | 65,496 | ||||||||||||||||||||||||
| Rural Loans | 54 | 58 | 82 | 7 | 21 | 83 | 96 | 9 | ||||||||||||||||||||||||
| Real State | 9 | 30 | 932 | 44,696 | 8 | 34 | 932 | 44,122 | ||||||||||||||||||||||||
| Payroll | 283 | 832 | 27,372 | 17,603 | 290 | 895 | 24,970 | 19,209 | ||||||||||||||||||||||||
| Vehicle and Leasing | 713 | 1,788 | 15,006 | 4 | 716 | 2,077 | 16,479 | 4 | ||||||||||||||||||||||||
| Credit card | 49,212 | - | - | - | 52,815 | - | - | - | ||||||||||||||||||||||||
| Guarantees | 94 | 127 | 145 | 367 | 204 | 109 | 162 | 300 | ||||||||||||||||||||||||
| Personal Loans (Other) | 6,663 | 2,210 | 15,244 | 1,824 | 6,460 | 2,217 | 15,655 | 1,852 | ||||||||||||||||||||||||
| Companies | 75,175 | 26,867 | 108,579 | 65,053 | 85,858 | 31,499 | 116,863 | 69,052 | ||||||||||||||||||||||||
| Rural Loans | 5,172 | 1,118 | 1,884 | 412 | 3,938 | 3,142 | 1,810 | 295 | ||||||||||||||||||||||||
| Investments | 5,158 | 5,565 | 32,152 | 17,002 | 6,130 | 6,198 | 35,503 | 17,974 | ||||||||||||||||||||||||
| Import and Export | 12,979 | 3,318 | 15,167 | 4,078 | 13,652 | 4,845 | 16,098 | 4,264 | ||||||||||||||||||||||||
| Working Capital, Discount Bonds and Guaranteed Account | 44,524 | 11,070 | 46,000 | 15,912 | 52,866 | 11,358 | 50,544 | 17,556 | ||||||||||||||||||||||||
| Endorsements and Sureties | 7,234 | 5,607 | 10,646 | 27,076 | 9,171 | 5,812 | 10,129 | 28,238 | ||||||||||||||||||||||||
| Other | 108 | 189 | 2,730 | 573 | 101 | 144 | 2,779 | 725 | ||||||||||||||||||||||||
| Total | 132,203 | 31,912 | 167,360 | 129,554 | 146,372 | 36,914 | 175,157 | 134,548 | ||||||||||||||||||||||||
(1) Do not include loan commitments.
Concentration on the Major Debtors
| Concentration of Largest Clients with Credit Granting Characteristics | R$ million | |||||||||||||||||||||||
| Exposure | % of portfolio | Exposure | % of portfolio | Exposure | % of portfolio | |||||||||||||||||||
| Loan, Lease and Other Credit Operations (1) | 03/31/2016 | 12/31/2015 | 03/31/2015 | |||||||||||||||||||||
| Largest debtor | 4,155 | 0.8 | % | 4,754 | 0.9 | % | 6,094 | 1.1 | % | |||||||||||||||
| 10 largest debtors | 33,084 | 6.4 | % | 35,526 | 6.5 | % | 35,185 | 6.5 | % | |||||||||||||||
| 20 largest debtors | 50,638 | 9.9 | % | 55,184 | 10.1 | % | 55,535 | 10.2 | % | |||||||||||||||
| 50 largest debtors | 85,397 | 16.6 | % | 92,745 | 17.1 | % | 90,945 | 16.7 | % | |||||||||||||||
| 100 largest debtors | 114,344 | 22.3 | % | 123,664 | 22.7 | % | 123,307 | 22.7 | % | |||||||||||||||
(1) The amounts include endorsements and sureties. Do not include loan commitments.
| Concentration of Major Clients with Credit Granting Characteristics | R$ million | |||||||||||||||||||||||
| Exposure | % of portfolio | Exposure | % of portfolio | Exposure | % of portfolio | |||||||||||||||||||
Loan, Lease and Other Credit Operations and Securities of Companies and Financial Institutions(1) | 03/31/2016 | 12/31/2015 | 03/31/2015 | |||||||||||||||||||||
| Largest debtor | 8,058 | 1.3 | % | 8,051 | 1.3 | % | 6,244 | 1.0 | % | |||||||||||||||
| 10 largest debtors | 48,319 | 7.9 | % | 51,672 | 8.1 | % | 45,367 | 7.1 | % | |||||||||||||||
| 20 largest debtors | 76,607 | 12.6 | % | 82,208 | 12.8 | % | 75,807 | 11.8 | % | |||||||||||||||
| 50 largest debtors | 125,054 | 20.5 | % | 134,405 | 21.0 | % | 128,732 | 20.1 | % | |||||||||||||||
| 100 largest debtors | 165,958 | 27.2 | % | 175,681 | 27.4 | % | 173,826 | 27.1 | % | |||||||||||||||
(1) The amounts include endorsements and sureties. Do not include loan commitments.
| 24 | |
| Itaú Unibanco |
| Risk and Capital Management – Pillar 3 |
Overdue Amounts
The table below presents the balance of overdue amounts:
| Overdue Amounts: by Brazil Regions and Countries | R$ million | |||||||||||||||||||||||||||||||||||||||
| 03/31/2016 | 12/31/2015 | |||||||||||||||||||||||||||||||||||||||
| 15 to 60 days | 61 to 90 days | 91 to 180 days | 181 to 360 days | Above 360 days | 15 to 60 days | 61 to 90 days | 91 to 180 days | 181 to 360 days | Above 360 days | |||||||||||||||||||||||||||||||
| Southeast | 6,380 | 2,066 | 4,522 | 5,317 | 333 | 5,531 | 1,808 | 4,545 | 4,866 | 347 | ||||||||||||||||||||||||||||||
| South | 1,049 | 357 | 806 | 1,009 | 63 | 994 | 363 | 820 | 914 | 66 | ||||||||||||||||||||||||||||||
| North | 306 | 93 | 232 | 260 | 33 | 303 | 92 | 214 | 247 | 24 | ||||||||||||||||||||||||||||||
| Northeast | 1,004 | 356 | 901 | 1,341 | 89 | 865 | 367 | 982 | 1,241 | 84 | ||||||||||||||||||||||||||||||
| Midwest | 600 | 200 | 451 | 536 | 46 | 566 | 223 | 452 | 524 | 44 | ||||||||||||||||||||||||||||||
| Brazil | 9,339 | 3,072 | 6,912 | 8,463 | 564 | 8,259 | 2,853 | 7,013 | 7,792 | 565 | ||||||||||||||||||||||||||||||
| Foreign | 958 | 206 | 526 | 201 | 44 | 927 | 133 | 269 | 212 | 71 | ||||||||||||||||||||||||||||||
| Total | 10,297 | 3,278 | 7,438 | 8,664 | 608 | 9,186 | 2,986 | 7,282 | 8,004 | 636 | ||||||||||||||||||||||||||||||
| Overdue Amounts: by Economic Sector | R$ million | |||||||||||||||||||||||||||||||||||||||
| 03/31/2016 | 12/31/2015 | |||||||||||||||||||||||||||||||||||||||
| 15 to 60 days | 61
to 90 days | 91
to 180 days | 181
to 360 days | Above
360 days | 15 to 60 days | 61
to 90 days | 91
to 180 days | 181
to 360 days | Above
360 days | |||||||||||||||||||||||||||||||
| Public Sector | - | - | - | - | - | - | - | - | - | - | ||||||||||||||||||||||||||||||
| Private Sector | 10,297 | 3,278 | 7,438 | 8,664 | 608 | 9,186 | 2,986 | 7,282 | 8,004 | 636 | ||||||||||||||||||||||||||||||
| Companies | 3,793 | 1,200 | 2,820 | 2,621 | 126 | 3,309 | 844 | 2,474 | 2,209 | 197 | ||||||||||||||||||||||||||||||
| Industry and Commerce | 1,516 | 581 | 1,539 | 1,373 | 91 | 1,376 | 496 | 1,168 | 1,199 | 126 | ||||||||||||||||||||||||||||||
| Services | 1,890 | 602 | 1,098 | 1,062 | 27 | 1,495 | 322 | 1,036 | 650 | 44 | ||||||||||||||||||||||||||||||
| Primary | 374 | 15 | 180 | 177 | 7 | 423 | 24 | 265 | 350 | 26 | ||||||||||||||||||||||||||||||
| Other | 13 | 2 | 3 | 9 | 1 | 15 | 2 | 5 | 10 | 1 | ||||||||||||||||||||||||||||||
| Individuals | 6,504 | 2,078 | 4,618 | 6,043 | 482 | 5,877 | 2,142 | 4,808 | 5,795 | 439 | ||||||||||||||||||||||||||||||
| Total | 10,297 | 3,278 | 7,438 | 8,664 | 608 | 9,186 | 2,986 | 7,282 | 8,004 | 636 | ||||||||||||||||||||||||||||||
Allowance for Loan Losses
In order to be hedged against losses arising from loan operations, Itaú Unibanco takes into consideration all the aspects that determine the client’s credit risk to determine the provision level that is appropriate to the risk incurred in each operation. For each operation, the assessment and the client or economic group rating, the operation rating, and the possible existence of past due amounts are taken into account and the volume of the regulatory provision is determined.
| Allowance for Loan Losses - Quarterly evolution | R$ million | |||||||||||||||||||||||||||||||
| 03/31/2016 | 12/31/2015 | |||||||||||||||||||||||||||||||
| Opening Balance | Necessary accounting net provisions | Write-Off | Final Balance | Opening Balance | Necessary accounting net provisions | Write-Off | Final Balance | |||||||||||||||||||||||||
| Public Sector | (1 | ) | (4 | ) | - | (5 | ) | (1 | ) | - | - | (1 | ) | |||||||||||||||||||
| Private Sector | (33,520 | ) | (7,039 | ) | 5,080 | (35,479 | ) | (33,673 | ) | (5,699 | ) | 5,852 | (33,520 | ) | ||||||||||||||||||
| Companies | (15,176 | ) | (3,773 | ) | 1,794 | (17,155 | ) | (16,135 | ) | (2,215 | ) | 3,174 | (15,176 | ) | ||||||||||||||||||
| Industry and Commerce | (5,314 | ) | (2,387 | ) | 922 | (6,779 | ) | (6,437 | ) | (1 | ) | 1,124 | (5,314 | ) | ||||||||||||||||||
| Services | (8,186 | ) | (795 | ) | 426 | (8,555 | ) | (7,784 | ) | (2,322 | ) | 1,920 | (8,186 | ) | ||||||||||||||||||
| Primary | (1,657 | ) | (589 | ) | 443 | (1,803 | ) | (1,891 | ) | 106 | 128 | (1,657 | ) | |||||||||||||||||||
| Other | (19 | ) | (2 | ) | 3 | (18 | ) | (23 | ) | 2 | 2 | (19 | ) | |||||||||||||||||||
| Individuals | (18,344 | ) | (3,266 | ) | 3,286 | (18,324 | ) | (17,538 | ) | (3,484 | ) | 2,678 | (18,344 | ) | ||||||||||||||||||
| Total | (33,521 | ) | (7,043 | ) | 5,080 | (35,484 | ) | (33,674 | ) | (5,699 | ) | 5,852 | (33,521 | ) | ||||||||||||||||||
| 25 | |
| Itaú Unibanco |
| Risk and Capital Management – Pillar 3 |
Mitigating Instruments
Itaú Unibanco uses guarantees aiming at increasing resiliencies in operations with credit risk. The using guarantees can be personal guarantees, secured guarantees, legal structures with mitigating power and netting arrangements.
When used for managerial purposes, to be considered as credit risk mitigation instrument, the guarantees need to comply with requirements and determinations of the regulations that govern the guarantees, whether internal or external and are legally valid (effective), enforceable and regularly evaluated. In the case of tangible collateral, legal structures with mitigating effects and set-off agreements, mitigation depends on established methods jointly approved by the business units responsible for managing credit risk and the central credit risk control area. Such methods take into account factors relating to the legal enforcement of the security, the costs involved in the process and the expected execution value, considering market volatility and liquidity. Additionally, fiduciary guarantees and the purchase of protection through credit derivatives mitigate credit risk by substituting the taker’s risk parameters with those of the guarantor.
Itaú Unibanco uses credit derivatives, such as single name CDS, to mitigate the credit risk of its portfolios of securities. These instruments are priced based on models that use the fair value of market inputs, such as credit spreads, recovery rates, correlations and interest rates.
The credit limits are continuously monitored and changed according to client behavior. Thus, the potential loss values represent a fraction of the amount available.
The table below presents the total amount mitigated by risk mitigating instruments (personal and secured guarantees) as defined in BACEN Circular 3,644, Art. 36, 3rd paragraph.
It is worth noting that purchase and sale commitments and residential real estate or first mortgage-backed loan operations are considered when determining risk weights assets.
| Total Mitigation | R$ million | |||||||||||
| 03/31/2016 | 12/31/2015 | 03/31/2015 | ||||||||||
| Demand and time deposits, savings and own financial credit bills | 295,167 | 318,628 | 306,757 | |||||||||
| FPR 0% | 295,167 | 318,628 | 306,757 | |||||||||
| Securities | 53,601 | 14,360 | 20,726 | |||||||||
| FPR 0% | 53,601 | 14,360 | 20,726 | |||||||||
| Personal Guarantee | 37,081 | 35,665 | 34,257 | |||||||||
| FPR 0% | 3,559 | 3,647 | 3,109 | |||||||||
| FPR 50% | 33,522 | 32,017 | 31,149 | |||||||||
| 26 | |
| Itaú Unibanco |
| Risk and Capital Management – Pillar 3 |
Counterparty Credit Risk
Itaú Unibanco sees the counterparty credit risk as a possibility of noncompliance, by a given counterparty, with obligations related to the settlement of transactions that involve the trading of financial assets with a bilateral risk, including those related to the settlement of derivative financial instruments. Additionally, Itaú Unibanco includes the risk of deterioration of the credit quality of the counterparty in its risk assessment.
Itaú Unibanco’s structure for managing, monitoring and controlling the counterparty credit risk arising from derivative financial instruments and other financial instruments, is inserted in the credit risk management framework.
For management purposes, counterparty credit risk is managed and measured by considering the potential credit risk (RCP) of transactions using an internal model with a 95% confidence level. The RCP is the value of the potential financial exposure that a transaction can attain upon maturity, and it is used to define utilization of credit risk limits attributed to counterparties. During the life of a derivatives contract, the adjustments on marking the transaction to market and the credit risk spread attaching to over-the-counter trades are the chief instruments used to measure possible losses in respect of Counterparty Credit Risk. After the maturity of a derivatives contract, Itaú Unibanco’s practice is to set up a provision for the amounts receivable on these instruments.
The table below presents the notional value of the contracts subject to the counterparty credit risk. According to Circular No. 3,644, for the calculation of the net global exposure to the counterparty credit risk arising from operations with derivative financial instruments, the application of the Future Potential Exposure Factor (FEPF) is considered. In the case of unsettled operations, the application of the Unsettled Operation Credit Conversion Factor (FCL) is considered. The application of these factors reduces the final exposure of the operations subject to the counterparty credit risk.
| Notional Amount of Contracts Subject to the Counterparty Credit Risk | R$ million | |||||||||||
| 03/31/2016 | 12/31/2015 | 03/31/2015 | ||||||||||
| Notional Amount | 1,934,850 | 1,978,818 | 1,818,580 | |||||||||
| Settled in Settlement Systems (Stock Exchange) (1) | 758,492 | 768,410 | 477,038 | |||||||||
| Not Settled in Settlement Systems (Over-The-Counter) | 1,176,358 | 1,210,408 | 1,341,541 | |||||||||
| With Guarantees | 497,710 | 561,251 | 499,556 | |||||||||
| Without Guarantees | 678,648 | 649,157 | 841,985 | |||||||||
(1) amounts related to contracts settled in the settlement system of a clearing house for the financial settlement of operations in which the house operates as the central counterparty.
The tables below presents the gross positive amount and the amount of the guarantees of the contracts subject to the counterparty credit risk.
| Gross Positive Amount of Contracts Subject to the Counterparty Credit Risk | R$ million | |||||||||||
| 03/31/2016 | 12/31/2015 | 03/31/2015 | ||||||||||
| Total Gross Positive Amount | 555,057 | 604,210 | 547,330 | |||||||||
| Repurchase agreements | 504,734 | 567,890 | 507,735 | |||||||||
| Others | 50,323 | 36,320 | 39,595 | |||||||||
| Guarantees of Contracts Subject to the Counterparty Credit Risk | R$ milhões | |||||||||||
| 03/31/2016 | 12/31/2015 | 03/31/2015 | ||||||||||
| Gross Amount of the Guarantees | 497,710 | 561,251 | 499,556 | |||||||||
The table below presents the net global exposure to the credit risk of the counterparty, calculated in accordance with the criteria of Circular No. 3,664 and applying the Future Potential Exposure and Unsettled Operation Credit Conversion factors.
| Exposure to the Counterparty Credit Risk | R$ milhões | |||||||||||
| 03/31/2016 | 12/31/2015 | 03/31/2015 | ||||||||||
| Net Global Exposure to the Counterparty Credit Risk | 38,179 | 35,948 | 40,458 | |||||||||
| 27 | |
| Itaú Unibanco |
| Risk and Capital Management – Pillar 3 |
Acquisitions, Sale or Transfer of Financial Assets
The acquisition of financial assets follows the same policies and the same credit governance established for the portfolios originated at Itaú Unibanco, where decision-making is based on the objective assessment of the borrowers’ credit risk. Financial asset acquisitions can aim at increasing loan portfolio diversification or meeting the clients’ demands for liquidity. The purpose of the sale and transfer of financial assets is to meet investor demand for credit assets and be used as a portfolio credit risk management instrument.
Credit assignments (transfers of receivables) carried out through December 2011 were recorded in accordance with current regulation together with income recognition at the time of the assignment, regardless of the risks and benefits being retained or not.
Since beginning January 2012, as provided for by CMN Resolution No. 3,533 and supplementary regulation, accounting records take into consideration the retention or non-retention of risks and benefits on sale or transfers of financial assets.
| Sale or Transfer of Financial Assets | R$ million | |||||||||||
| 03/31/2016 | 12/31/2015 | 03/31/2015 | ||||||||||
| Balance of exposures assigned with significant withholding of risks and benefits | 162 | 171 | 208 | |||||||||
| Balance of sale of exposure with substantial retention of risks and benefits | 5,362 | 5,497 | 4,799 | |||||||||
| Credit rights Investments Fund (FIDC) | - | - | - | |||||||||
| Securitization Companies | 5,344 | 5,474 | 4,799 | |||||||||
| Financial institutions | 18 | 23 | - | |||||||||
| Specific Purpose Company (SPE) | - | - | - | |||||||||
| Balance of sale of exposure without substantial transfer or retention of risks and benefits | - | - | - | |||||||||
| Sale or Transfer of Financial Assets | R$ million | |||||||||||||||||||
| 1st quarter | 4th quarter | 3rd quarter | 2nd quarter | 1st quarter | ||||||||||||||||
| 2016 | 2015 | 2015 | 2015 | 2015 | ||||||||||||||||
| Flow of sale exposure in the quarter with substantial transfer of risks and rewards | 0 | 946 | 50 | 442 | 206 | |||||||||||||||
| Credit rights Investments Fund (FIDC) | - | - | 2 | - | - | |||||||||||||||
| Securitization Companies | 0 | 675 | 5 | 442 | 173 | |||||||||||||||
| Financial institutions | - | 15 | 43 | - | 33 | |||||||||||||||
| Specific Purpose Company (SPE) | - | - | - | - | - | |||||||||||||||
| Other(1) | - | 256 | - | - | - | |||||||||||||||
(1) Transfer of college credits held with the public sector.
| Sale or Transfer of Financial Assets | R$ million | |||||||||||||||||||
| 1st quarter | 4th quarter | 3rd quarter | 2nd quarter | 1st quarter | ||||||||||||||||
| 2016 | 2015 | 2015 | 2015 | 2015 | ||||||||||||||||
| Total exposures assigned over the last 12 months which have been honored, repurchased or written-off | 113 | 117 | 151 | 141 | 175 | |||||||||||||||
| 28 | |
| Itaú Unibanco |
| Risk and Capital Management – Pillar 3 |
| Acquisition of Financial Assets | R$ million | |||||||||||
| 03/31/2016 | 12/31/2015 | 03/31/2015 | ||||||||||
| Acquisitions of loan portfolios WITH the retention of assignor's risks and rewards | ||||||||||||
| a) By type of exposure | 3,028 | 3,692 | 5,124 | |||||||||
| Individuals - Payroll | - | - | 4 | |||||||||
| Individuals - Vehicle and Leasing | 2,202 | 2,592 | 3,508 | |||||||||
| Companies -Loans (CCB) | 816 | 1,086 | 1,583 | |||||||||
| Companies - Other | 10 | 14 | 29 | |||||||||
| b) By type of assignor | 3,028 | 3,692 | 5,124 | |||||||||
| Credit rights Investments Fund (FIDC) | - | - | - | |||||||||
| Securitization Companies | - | - | - | |||||||||
| Financial institutions | 3,028 | 3,692 | 5,124 | |||||||||
| Specific Purpose Company (SPE) | - | - | - | |||||||||
| Acquisition of Financial Assets | R$ million | |||||||||||
| 03/31/2016 | 12/31/2015 | 03/31/2015 | ||||||||||
| Acquisitions of loan portfolios with NO retention of assignor's risks and rewards | ||||||||||||
| a) By type of exposure | 5,647 | 6,542 | 10,530 | |||||||||
| Individuals - Payroll | 5,647 | 6,542 | 10,530 | |||||||||
| b) By type of assignor | 5,647 | 6,542 | 10,530 | |||||||||
| Credit rights Investments Fund (FIDC) | - | - | - | |||||||||
| Securitization Companies | - | - | - | |||||||||
| Financial institutions | 5,647 | 6,542 | 10,530 | |||||||||
| Specific Purpose Company (SPE) | - | - | - | |||||||||
Operations of Securitization
Itaú Unibanco’s portfolio includes securities arising from securitization processes. The portfolio is made up of Securitized Real Estate Loans (CRI), quotas of Credit Rights Investment Funds (FIDC) and Agribusiness Receivables Certificate (CRA).
The CRIs are backed by real estate loans and predominantly are not subordinated. The quotas of FIDCs are usually senior and backed by receivables, such as trade notes, promissory notes. The CRAs are backed by receivables linked to agribusiness.
Itaú Unibanco classifies securities arising from securitization processes based on the governance of products determined, and the credit is approved at the proper authority levels. The balances of these operations are presented below.
| Securitization Exposures (1) | R$ million | |||||||||||
| 03/31/2016 | 12/31/2015 | 03/31/2015 | ||||||||||
| CRI | 17,774 | 17,694 | 16,979 | |||||||||
| Mortgage Loans | 17,774 | 17,694 | 16,979 | |||||||||
| Single-Tranche | 15,688 | 15,660 | 14,561 | |||||||||
| Subordinated | 2,086 | 2,034 | 2,418 | |||||||||
| CRA | 20 | 25 | 32 | |||||||||
| Credit Related to Agribusiness | 20 | 25 | 32 | |||||||||
| Single-Tranche | 20 | 25 | 32 | |||||||||
| FIDC | - | - | 24 | |||||||||
| Credit Rights | - | - | 24 | |||||||||
| Senior | - | - | 24 | |||||||||
| Total | 17,794 | 17,719 | 17,035 | |||||||||
(1) traditional securitization.
Itaú Unibanco follows risk retention guidelines as defined at Resolutions 3,533 of the CMN.
| 29 | |
| Itaú Unibanco |
| Risk and Capital Management – Pillar 3 |
Then there is the summary of the securitization activity in the period:
| Securitization Activities in the Period(1) | R$ million | |||||||||||
| 1st quarter 2016 | 4th quarter 2015 | 1st quarter 2015 | ||||||||||
| CRI | - | 266 | 829 | |||||||||
| Mortgage Loans | - | 266 | 829 | |||||||||
| CRA | - | 675 | - | |||||||||
| Credit Rights | - | 675 | - | |||||||||
| Total | - | 941 | 829 | |||||||||
(1) traditional securitization.
Credit Derivatives
Itaú Unibanco buys and sells credit protection mainly related to securities of the Brazilian government and securities of Brazilian listed companies in order to meet the needs of its customers. When Itaú Unibanco sells contracts for credit protection, the exposure for a given reference entity may be partially or totally offset by a credit protection purchase contract of another counterparty for the same reference entity or similar entity. The credit derivatives for which Itaú Unibanco is protection seller are credit default swap (CDS) and total return swap (TRS).
CDS is credit derivative in which, upon a credit event related to the reference entity pursuant to the terms of the contract, the protection buyer is entitled to receive, from the protection seller, the amount equivalent to the difference between the face value of the CDS contract and the fair value of the liability on the date the contract was settled, also known as the recovered amount. The protection buyer does not need to hold the debt instrument of the reference entity for it to receive the amounts due pursuant to the CDS contract terms when a credit event occurs.
TRS is a transaction in which a party swaps the total return of a reference entity or of a basket of assets for regular cash flows, usually interest and a guarantee against capital loss. In a TRS contract, the parties do not transfer the ownership of the assets.
The maximum potential loss that may be incurred with the credit derivative is based on the notional amount of the derivative. Itaú Unibanco believes that, based on its historical experience, the maximum potential loss does not represent the expected loss. It happens because, when a loss event occurs, the amount of maximum potential loss should be reduced from the notional amount by the recoverable amount.
The credit derivatives sold are not covered by guarantees, and during the first quarter of 2016, Itaú Unibanco has not incurred any loss related to credit derivative contracts.
The table below shows the nominal value of purchased credit derivatives that are identical to those that Itaú Unibanco acts as seller of protection underlying values.
| Notional Amount of Credit Derivatives Held in Portfolio | R$ million | |||||||||||
| 03/31/2016 | 12/31/2015 | 03/31/2015 | ||||||||||
| Risk Transferred | 3,884 | 3,863 | 2,834 | |||||||||
| Credit Default Swap (CDS) | 3,884 | 3,863 | 2,834 | |||||||||
| Total Return Swap (TRS) | - | - | - | |||||||||
| Risk Received | (7,717 | ) | (8,799 | ) | (9,941 | ) | ||||||
| Credit Default Swap (CDS) | (7,717 | ) | (8,799 | ) | (8,405 | ) | ||||||
| Total Return Swap (TRS) | - | - | (1,536 | ) | ||||||||
| Total | (3,833 | ) | (4,936 | ) | (7,107 | ) | ||||||
| Required capital of Risk Received | 350 | 467 | 428 | |||||||||
| 30 | |
| Itaú Unibanco |
| Risk and Capital Management – Pillar 3 |
| 6 | Market Risk |
| 6.1 | Framework and Treatment |
Market risk is the possibility of losses resulting from fluctuations in the market values of positions held by a financial institution, usually the risks caused by variations in foreign exchange rates, interest rates, price indexes, equity and commodity prices, with various indexes based on these risk factors.
At Itaú Unibanco, market risk management is the process by which management monitors and controls risk of variations in the financial instruments, due to market movements, while aiming to optimize the risk-return ratio through an adequate limits structure, alerts, effective risk management models and related management tools.
Itaú Unibanco’s institutional policies and general market risk management framework are in line with the principles of CMN Resolution No. 3,464, and subsequent amendments. These principles guide the institution’s approach to market risk control and management across all business units and legal entities of Itaú Unibanco.
The document that details the market risk control institutional policy is on the Investor Relations website www.itau.com.br/investor-relations, in the route: Corporate Governance, Rules and Policies, Public Access Report - Market Risk.
Itaú Unibanco’s market risk management strategy is aimed at balancing corporate business goals, taking into account, among other things:
| · | Political, economic and market conditions; |
| · | The profile of Itau Unibanco´s portfolio; and |
| · | Expertise within the group to support operations in specific markets. |
Itaú Unibanco’s market risk management framework is subject to the governance and hierarchy of corporate bodies and to a structure of limits and alerts, with specific limits assigned to different levels and classes of market risk (such as interest rate risk, foreign exchange risk, among others). This structure of limits and alerts covers from aggregated risk indicators at the portfolio level, to more granular limits at the individual desk level. The market risk limits framework extends to the risk factor level, with specific limits and is aim to improve the process of risk monitoring and understanding as well as prevent risk concentration. Limits and alerts are calibrated based on projections of future balance sheets, stockholders’ equity, liquidity, complexity and market volatility, as well as the Itaú Unibanco’s risk appetite. Limits are monitored on a daily basis and breaches and potential breaches of limits are reported and discussed in accordance with the following procedure:
| · | within one business day, for management responsible for the business units and executives in the risk control area and business areas; and |
| · | within one month, for the competent corporate bodies. |
Daily risk reports used by the business and control areas are distributed to the executives officers. In addition, Itaú Unibanco’s market risk management and control process is subject to periodic reviews.
The structure of limits and alerts follows Board of Directors guidelines. These are approved by corporate bodies. The process for defining limit levels and reporting violations is subject to the approval governance of Itaú Unibanco institutional policies. The established information flow is intended to provide this information to the various executive levels of the institution, including members of the Board of Directors through the committees responsible for risk management.
The key principles underlying Itaú Unibanco’s market risk control structure are as follows:
| · | Provide visibility and comfort for all senior management levels that market risks assumed must be in line with Itaú Unibanco risk-return objectives; |
| · | Provide disciplined and informed dialogue of the overall market risk profile and its evolution over time; |
| · | There must be transparency as to how the business works to optimize results; |
| · | The market risk control structure must provide early warning mechanisms to facilitate effective risk management, without obstructing the business objectives; and |
| · | Concentration of risks must be monitored and avoided. |
Market risk management and control process is subject to periodic reviews, to ensure it reflects alignment with best market practices, and continuous improvement over time.
| 31 | |
| Itaú Unibanco |
| Risk and Capital Management – Pillar 3 |
Market risk is controlled by an area independent of the business units, which is responsible for the following daily activities: (i) measuring and assessing risk, (ii) monitoring stress scenarios, limits and alerts, (iii) applying, analyzing and testing stress scenarios, (iv) reporting risk to the individuals responsible in the business units, in compliance with Itaú Unibanco´s governance, (v) monitoring the measures needed to adjust positions and/or risk levels to make them viable, and (vi) supporting the secure launch of new financial products. For this, there is a structured process of communication and information flow, which provides information to corporate bodies and ensures compliance with the requirements of Brazilian and foreign regulatory agencies.
Itaú Unibanco hedges transactions with clients and proprietary positions, including its foreign investments, in order to mitigate risk arising from fluctuations in market risk factors and maintain the positions on the breaching limits. Derivatives are commonly used for these hedging activities. When these transactions are classified as hedges for accounting purposes, specific supporting documentation is provided, including ongoing follow-up of hedge effectiveness (retrospective and prospective) and other changes in the accounting process. The accounting and managerial hedging procedures are governed by the institutional polices of Itaú Unibanco.
Hedge accounting considerations are presented in detail in explanatory Note 7g V – “Accounting hedge” of the Complete Financial Statements, that can be found on the website www.itau.com.br/investor-relations.
Market risk framework categorizes transactions as part of either the Banking Book or the Trading Book, in accordance with general criteria established by CMN Resolution No. 3,464 and BACEN Circular No. 3,354.
Trading Book is composed of all trades with financial and commodity instruments (including derivatives) undertaken with the intention of trading them.
Banking Book is predominantly characterized by portfolios originated from the banking business and operations related to the management of the institution’s balance sheet. As a general rule, this book’s portfolios are intended to be either held to maturity, or sold in the medium and in the long run.
Market risk exposures inherent in various financial instruments, including derivatives, are composed of various risk factors that refer to a market parameter whose variation impacts a position’s valuation. The main risk factors measured by Itaú Unibanco are as follow:
| · | Interest rates: the risk of losses from transactions subject to interest rates variation; |
| · | Other foreign interest rates: the risk of losses from transactions subject to foreign interest rates variations; |
| · | FX Rates: the risk of losses from positions subject to foreign exchange rate variation (e.g., foreign currency positions); |
| · | Brazilian inflation indexes: the risk of losses from transactions subject to the variations in inflation-linked; |
| · | Equities and Commodities: the risk of losses from transactions subject to equity or commodities price variations. |
The CMN has regulations establishing the segregation of market risk exposure at a minimum into the following categories: interest rates, FX rates, equities and commodities. Brazilian inflation indexes are treated as a group of risk indicators and receive the same treatment of the others risk indicators, such as interest rates and FX rates and follows the governance and risk limits framework adopted by Itaú Unibanco for market risk management.
Market risk is analyzed based on the following key metrics:
| · | Value at Risk: a statistical metric that quantifies the maximum potential economic loss expected in normal market conditions, considering a defined holding period and confidence level; |
| · | Losses in Stress Scenarios (Stress Testing): a simulation technique to evaluate the impact, in the assets, liabilities and derivatives of the portfolio, of various risk factors in extreme market situations (based on prospective and historic scenarios); |
| · | Stop Loss: metrics that trigger a management review of positions, if the accumulated losses in a given period reach specified levels; |
| · | Concentration: cumulative exposure of certain financial instrument or risk factor calculated at market value ("MtM - Mark to Market"); and |
| · | Stressed VaR: statistical metric derived from VaR calculation, aimed at capturing the biggest risk in simulations of the current portfolio, taking into consideration the observable returns in historical scenarios of extreme volatility. |
In addition to the risk metrics described above, sensitivity and loss control measures are also analyzed. They include:
| · | Gap Analysis: accumulated exposure of the cash flows by risk factor, which are marked-to-market and positioned by settlement dates; |
| 32 | |
| Itaú Unibanco |
| Risk and Capital Management – Pillar 3 |
| · | Sensitivity (DV01 – Delta Variation Risk): impact on the market value of cash flows when a 1 basis point change is applied to current interest rates or on the index rates; |
| · | Sensitivities to Various Risk Factors (Greeks): partial derivatives of a portfolio of options on the prices of the underlying assets, implied volatilities, interest rates and time. |
Itaú Unibanco uses proprietary systems to measure the consolidated market risk. The processing of these systems takes place in an access-controlled environment, being highly available, which has data safekeeping and recovery processes, and counts on such an infrastructure to ensure the continuity of business in contingency (disaster recovery) situations.
| 33 | |
| Itaú Unibanco |
| Risk and Capital Management – Pillar 3 |
| 6.2 | Portfolio Analysis |
Interest rate risk in the non-trading book
Interest rate risk corresponds to the potential loss associated with changes in market interest on index, maturity and investment and funding mismatches. The interest rate risk management process of transactions classified in the non-trading book is consistent with the corporate bodies governance and hierarchy, and the limits approved for risk market management. A mark-to-market methodology is adopted for the different products by calculating the sensitivity to the changes in interest rates, the value at risk (VaR), and stress tests are conducted to the entire book, as established in Itaú Unibanco’s institutional policies.
In treating the loan portfolios with material early settlements, the original maturities of the transactions are adjusted for the monthly revisions of their parameters, estimated from their historic bases, which accelerate the decrease of the originally contracted payment flows to better reflect the expected client behavior.
Remainders of products with no definite expiry date, such as demand deposits and savings accounts, are included in the statistics on the basis of past and seasonal experience. The core portion is distributed over time, thus generating an exposure to changes in interest rates, pursuant to internally approved methodologies.
The table below shows the sensitivity of the amount of the non-trading book positions to changes in interest rate curves, using the methodology and stress scenarios adopted to manage this book’s risks at Itaú Unibanco for the first quarter of 2016.
| Sensibility of Banking Position (1) | R$ million | |||||||||||||
| Exposures | 03/31/2016 | |||||||||||||
| Risk factors | Risk of variation in: | Scenario I | Scenario II | Scenario III | ||||||||||
| Interest Rate | Fixed Income Interest Rates in reais | (3 | ) | (1,080 | ) | (2,093 | ) | |||||||
| Foreign Exchange Linked | Foreign Exchange Linked Interest Rates | (1 | ) | (87 | ) | (156 | ) | |||||||
| Price Index Linked | Interest of Inflation coupon | (3 | ) | (310 | ) | (561 | ) | |||||||
| TR | TR Linked Interest Rates | 1 | (197 | ) | (426 | ) | ||||||||
(1) Amounts net of tax effects.
In order to measure these sensitivities, the following scenarios are used:
· Scenario I: Shocks of 1 base point in interest fixed rates, currency coupon, inflation, interest rate indexes;
· Scenario II: Shocks of 25 percent in interest fixed rates, currency coupon, inflation, interest rate indexes, both for growth and fall, considering the largest resulting losses per risk factor;
· Scenario III: Shocks of 50 percent in interest fixed rates, currency coupon, inflation, interest rate indexes, both for growth and fall, considering the largest resulting losses per risk factor.
As required by CVM Regulatory Instruction 475, Itaú Unibanco conducts sensitivity analysis against exceptional scenarios for market risk factors considered relevant. The results can be found at Note 7j – “Sensitivity analysis (trading and banking portfolios)” of the Complete Financial Statements – BRGAAP, on the website www.itau.com.br/investor-relations.
| 34 | |
| Itaú Unibanco |
| Risk and Capital Management – Pillar 3 |
Evolution of the Trading Portfolio
The evolution of the Trading Portfolio, broken down by major risk factors, is tabulated below:
| Total Value of Trading Position | R$ million | |||||||||||||||||||||||
| 03/31/2016 | 12/31/2015 | 03/31/2015 | ||||||||||||||||||||||
| Risk factors | Long | Short | Long | Short | Long | Short | ||||||||||||||||||
| Interest Rates | 155,487 | (173,265 | ) | 121,109 | (129,064 | ) | 198,263 | (169,575 | ) | |||||||||||||||
| Foreign Exchange Rates | 116,638 | (109,010 | ) | 101,968 | (91,090 | ) | 152,942 | (152,447 | ) | |||||||||||||||
| Equities | 1,594 | (1,692 | ) | 1,376 | (1,367 | ) | 15,885 | (15,834 | ) | |||||||||||||||
| Commodities | 39 | (17 | ) | 20 | (8 | ) | 74 | (54 | ) | |||||||||||||||
Evolution of the Derivatives Portfolio
The main purpose of the derivative positions in the Banking Portfolio is to manage risks in this portfolio and in the corresponding risk factors. The evolution of Itaú Unibanco’s derivatives portfolio, broken down by group of risk factor, by the existence or absence of a central counterparty (exchange or over-the-counter market) and whether it is in Brazil or abroad, is presented below for both Trading and Banking Portfolios:
| Derivatives: Trades in Brazil - Trading + Banking - With Central Counterparty | R$ million | |||||||||||||||||||||||
| 03/31/2016 | 12/31/2015 | 03/31/2015 | ||||||||||||||||||||||
| Risk factors | Long | Short | Long | Short | Long | Short | ||||||||||||||||||
| Interest Rates | 355,999 | (472,970 | ) | 329,309 | (432,361 | ) | 230,981 | (345,264 | ) | |||||||||||||||
| Foreign Exchange Rates | 147,453 | (129,003 | ) | 144,922 | (132,980 | ) | 132,593 | (105,109 | ) | |||||||||||||||
| Equities | 3,910 | (3,324 | ) | 1,656 | (1,771 | ) | 3,891 | (3,841 | ) | |||||||||||||||
| Commodities | 738 | (511 | ) | 648 | (326 | ) | 399 | (188 | ) | |||||||||||||||
| Derivatives: Trades in Brazil - Trading + Banking - Without Central Counterparty | R$ million | |||||||||||||||||||||||
| 03/31/2016 | 12/31/2015 | 03/31/2015 | ||||||||||||||||||||||
| Risk factors | Long | Short | Long | Short | Long | Short | ||||||||||||||||||
| Interest Rates | 308,346 | (298,691 | ) | 309,375 | (309,656 | ) | 189,945 | (189,951 | ) | |||||||||||||||
| Foreign Exchange Rates | 189,419 | (230,228 | ) | 262,301 | (295,018 | ) | 105,120 | (136,506 | ) | |||||||||||||||
| Equities | 22,321 | (22,423 | ) | 20,187 | (20,446 | ) | 20,751 | (20,905 | ) | |||||||||||||||
| Commodities | 152 | (354 | ) | 157 | (472 | ) | 150 | (271 | ) | |||||||||||||||
| Derivatives: Foreign Trades - Trading + Banking - With Central Counterparty | R$ million | |||||||||||||||||||||||
| 03/31/2016 | 12/31/2015 | 03/31/2015 | ||||||||||||||||||||||
| Risk factors | Long | Short | Long | Short | Long | Short | ||||||||||||||||||
| Interest Rates | 0 | (436 | ) | 0 | (723 | ) | 26 | (437 | ) | |||||||||||||||
| Foreign Exchange Rates | 130,345 | (130,003 | ) | 156,102 | (155,786 | ) | 158,121 | (157,524 | ) | |||||||||||||||
| Equities | 286 | (362 | ) | 451 | (207 | ) | 272 | (305 | ) | |||||||||||||||
| Commodities | - | - | 17 | (17 | ) | 64 | (133 | ) | ||||||||||||||||
| Derivatives: Foreign Trades - Trading + Banking - Without Central Counterparty | R$ million | |||||||||||||||||||||||
| 03/31/2016 | 12/31/2015 | 03/31/2015 | ||||||||||||||||||||||
| Risk factors | Long | Short | Long | Short | Long | Short | ||||||||||||||||||
| Interest Rates | 132,908 | (130,785 | ) | 110,037 | (113,171 | ) | 104,344 | (105,977 | ) | |||||||||||||||
| Foreign Exchange Rates | 541,994 | (543,667 | ) | 531,271 | (527,912 | ) | 424,556 | (421,504 | ) | |||||||||||||||
| Equities | 970 | (970 | ) | 1,284 | (1,284 | ) | - | (54 | ) | |||||||||||||||
| Commodities | - | - | - | - | - | - | ||||||||||||||||||
| 35 | |
| Itaú Unibanco |
| Risk and Capital Management – Pillar 3 |
VaR – Consolidated Itaú Unibanco
Consolidated VaR of Itaú Unibanco is calculated through the Historical Simulation methodology, which fully reflects all its positions based on the historical series of asset prices. In the first quarter of 2016, o Itaú Unibanco opted for including the exposures of each foreign unit in the calculation of the Consolidated VaR, so as to take into account the risk factors of these units, thus improving the methodology used.
The Consolidated Total VaR table provides an analysis of the exposure to market risk of Itaú Unibanco portfolios.
| VaR - Itaú Unibanco Holding (1) | R$ million | |||||||||||||||
| VaR per Risk Factor Group | 03/31/2016 (2) | 12/31/2015 (3) | 12/31/2015 (3) | 03/31/2015 (3) | ||||||||||||
| Brazilian Interest rates | 165.4 | 160.1 | 121.2 | 166.5 | ||||||||||||
| Other Foreign Interest rates | 102.0 | 101.7 | 108.6 | 89.9 | ||||||||||||
| FX rates | 20.7 | 18.0 | 13.1 | 40.4 | ||||||||||||
| Brazilian Inflation Indexes | 140.2 | 139.0 | 108.9 | 110.0 | ||||||||||||
| Equities and Commodities | 62.5 | 62.5 | 59.3 | 19.2 | ||||||||||||
| Diversification effect | (315.8 | ) | (309.0 | ) | (233.3 | ) | (231.8 | ) | ||||||||
| Total VaR | 174.9 | 200.9 | 204.0 | 221.7 | ||||||||||||
| Maximum Total VaR of the Quarter | 208.5 | 230.3 | 327.6 | 236.6 | ||||||||||||
| Average Total VaR of the Quarter | 174.1 | 197.2 | 213.6 | 203.7 | ||||||||||||
| Minimum Total VaR of the Quarter | 155.1 | 174.6 | 170.8 | 179.1 | ||||||||||||
(1) Considers one-day holding period and 99% confidence level.
(2) VaR per Risk Factor Group includes foreign units informations.
(2) VaR per Risk Factor Group does not include foreign units informations.
Itaú Unibanco maintained its conservative and diversification management style, having operated within low limits in relation to its capital through the period. The Total Average VaR for the quarter remained below 1% of Itaú Unibanco’s consolidated stockholders’ equity.
The total VaR remained stable compared with the previous quarter.
VaR - Trading Portfolio
Itaú Unibanco’s Trading Portfolio VaR, based on the “historical simulation” methodology, is presented below.
| VaR - Itaú Unibanco - Trading Portfolio (1) | R$ million | |||||||||||
| VaR per Risk Factor Group | 03/31/2016 | 12/31/2015 | 03/31/2015 | |||||||||
| Brazilian Interest rates | 63.8 | 22.9 | 36.7 | |||||||||
| Other Foreign Interest rates | 20.0 | 14.0 | 11.0 | |||||||||
| FX rates | 15.2 | 12.9 | 35.3 | |||||||||
| Brazilian Inflation Indexes | 3.7 | 7.7 | 7.4 | |||||||||
| Equities and Commodities | 8.4 | 6.6 | 5.8 | |||||||||
| Diversification effect | (65.4 | ) | (43.2 | ) | (69.0 | ) | ||||||
| Total VaR | 45.6 | 20.8 | 27.3 | |||||||||
| Maximum Total VaR of the Quarter | 54.5 | 42.3 | 31.6 | |||||||||
| Average Total VaR of the Quarter | 35.5 | 23.7 | 18.7 | |||||||||
| Minimum Total VaR of the Quarter | 17.7 | 10.6 | 10.9 | |||||||||
(1) VaR Historical Simulation approach. Amounts reported consider one-day holding period and 99% confidence level.
(1) External Units are not cosidered.
| 36 | |
| Itaú Unibanco |
| Risk and Capital Management – Pillar 3 |
Backtesting
The effectiveness of the VaR model is validated by the use of backtesting techniques that compare hypothetic daily results with the estimated daily VaR. The number of exceptions to the VaR pre-established limits should be consistent, within an acceptable margin, with the hypothesis of 99% confidence level (i.e., there is a 1% probability that financial losses could be greater than the losses estimated by the model), considering a range of 250 business days (ending on March 31, 2016). The backtesting analysis presented below takes into consideration the ranges suggested by the Basel document “Supervisory Framework for the use of backtesting in conjunction with the internal models approach to market risk capital requirements.” The ranges are divided into:
| · | Green (0 to 4 exceptions): corresponds to backtesting results that do not suggest any problems with the quality or accuracy of the models adopted; |
| · | Yellow (5 to 9 exceptions): refers to an intermediate range group, which indicates the need to pay attention and/or monitoring and may indicate the need of reviewing the model; and |
| · | Red (10 or more exceptions): demonstrate the need for improvement action. |
The exposure graph below illustrates the reliability of risk measures generated from the models used by Itaú Unibanco in the Trading Portfolio (International Units are not included in these graph, given the immateriality of amounts involved).
The graph shows the adequacy level of the market risk models used by Itaú Unibanco, presenting the risk (absolute value) x return for the period considered.
Since the diagonal line represents the threshold where risk equals results, all the dots below this line indicate exceptions to the estimated risk.
For the exposure of the Trading Portfolio the hypothetic losses exceeded the VaR estimated by the model in 3 days in the period.
Backtesting - Trading Portfolio(1)
| 37 | |
| Itaú Unibanco |
| Risk and Capital Management – Pillar 3 |
| 7 | Operational Risk |
| 7.1 | Framework and Treatment |
For Itaú Unibanco the operational risk is defined as the possibility of losses arising from failure, deficiency or inadequacy of internal process, people or systems or from external events that affect the achievement of strategic, tactical or operational objectives. It includes legal risk associated with inadequacy or deficiency in contracts signed by the institution, as well as penalties due to noncompliance with laws and punitive damages to third parties arising from the activities undertaken by the Institution.
Itaú Unibanco internally classifies its risk events in:
| · | Internal fraud; |
| · | External fraud; |
| · | Labor demands and deficient security in the workplace; |
| · | Inadequate practices related to clients, products and services; |
| · | Damages to own physical assets or assets in use by Itaú Unibanco; |
| · | Interruption of Itaú Unibanco’s activities; |
| · | Failures in information technology systems; |
| · | Failures in the performance, compliance with deadlines and management of activities at Itaú Unibanco. |
In line with the principles of the CMN Resolution 3,380 and BACEN Circular 3,647, Itaú Unibanco has an operational risk management structure and institutional policy, which are annually approved by the Board of Directors and are applicable to its local and foreign companies and subsidiaries.
Operational risk management is the process composed of operational risk management and control activities, which objective is to support the institution in decision making processes, always searching for the proper identification and assessment of risks, the creation of value for stockholders and the protection of Itaú Unibanco’s assets and image.
Itaú Unibanco has a governance process that is structured through forums and corporate bodies composed of senior management, which, in turn, report to the Board of Directors, and by well-defined roles and responsibilities in order to reinforce the segregation of the business and management and control activities, ensuring independence between the areas and, consequently, well-balanced decisions with respect to risks. This is reflected in the risk management process carried out on a decentralized basis under the responsibility of the business areas and by a centralized control carried out by the internal control, compliance and operational risk department by means of methodologies, training, certification and monitoring of the control environment on an independent basis.
The management structure seeks to identify, prioritize and manage any operational risks, and to monitor and report management activities, for the purpose of ensuring the quality of the control environment in accordance with the internal guidelines and regulation in effect.
The executive areas managers use corporate methodologies that are built and made available by the internal control, compliance and operational risk department. Among the methodologies and tools used are the self-evaluation and the map of the organization’s prioritized risks, the approval of processes, products, and system development products and projects, the monitoring of key risk indicators that and the database of operational losses. Therefore, Itaú Unibanco’s operational risk framework ensures a conceptual exclusive basis for the management of processes, systems, projects and new products and services.
Within the governance of the risk management process, the consolidated reports on risk monitoring, controls, action plans and operational losses are regularly presented to the business area executives.
It is worth noting that the dissemination of the risk and control culture to the employees by means of training is an important pillar, aimed at providing a better understanding of the matter and playing a relevant role in its mitigation.
A summarized version of the institutional operational risk management policy can be found on the website www.itau.com.br/investor-relations under Corporate Governance, Regulations and Policies, Public Access Report – Operational Risk.
| 38 | |
| Itaú Unibanco |
| Risk and Capital Management – Pillar 3 |
| 7.2 | Crisis Management and Business Continuity |
The purpose of Itaú Unibanco’s Business Continuity Program is to protect its employees, ensure the continuity of the critical functions of its business lines, safeguard revenue and sustain both a stable financial market in which it operates and the trust of its clients and strategic partners in the provision of services and products.
It is composed of procedures for relocating and/ or recovering operations in response to a variety of interruption levels, and can be divided into two key elements:
| · | Crisis Management: centralized communication and response processes to manage business interruption events and any other types of threats to the image and reputation of its identity before its employees, clients, strategic partners and regulators. The structure has a command center that constantly monitors the daily operations, as well as the media channels in which Itaú Unibanco is mentioned. The success of Crisis Management takes place through the Focal Agent Network, who are the representatives appointed by the business areas and that work in the monitoring of potential problems, resolution of crisis, resumption of business, improvement of processes and search for prevention actions; |
| · | Business Continuity Plans (PCN): document with procedures and information, developed, consolidated and maintained available for use during possible incidents, allowing the resumption of critical activities in acceptable terms and conditions. For the quick and safe resumption of the operations, Itaú Unibanco has established, in its PCN, corporate wide and customized actions for its line of business by means of: |
| – | Disaster Recovery Plan: focused on the recovery of its primary data center, ensuring the continuity of the processing of critical systems within minimum pre-established periods; |
| – | Workplace Contingency Plan: employees responsible for carrying out critical business functions have alternative facilities to perform their activities in the event the buildings in which they usually work become unavailable. There is approximately 2,000 contingency dedicated seats that are fully equipped to meet the needs of the business areas in emergency situations. |
| – | Emergency Plan: procedures aimed at minimizing the effects of emergency situations that may impact Itaú Unibanco’s facilities, with a preemptive focus; |
| – | Processes Contingency Plan: alternatives (Plan B) to carry out the critical processes identified in the business areas. |
In order to keep the continuity solutions aligned with the business requirements (processes, minimum resources, legal requirements, etc) the Program applies the following tools to understand the organization:
| – | Business Impact Analysis (BIA): evaluates the criticality and resumption requirement of the processes that support the delivery of products and services. Through this analysis the businesses’ resumption priorities are defined. |
| – | Risk Assessment (RA): evaluates the processes and the effectiveness of the controls in place to mitigate the inherent risks of interruption as well as to implement actions to the gaps eventually identified in the business; |
| – | Threats and Vulnerabilities Analysis (AVA): identification of threats to the locations where Itaú Unibanco buildings are located. The control’s efficiency is evaluated against the potential threats in order to eventually identify vulnerabilities so that controls are adjusted or implemented to enhance the resilience level of the firm’s critical facilities. |
| 39 | |
| Itaú Unibanco |
| Risk and Capital Management – Pillar 3 |
| 8 | Liquidity Risk |
| 8.1 | Framework and Treatment |
Liquidity risk is defined as the likelihood of the institution not being able to effectively honor its expected and unexpected obligations, current and future, including those from guarantees commitment, not affecting its daily operations and not incurring significant losses.
The liquidity control risk is carried out by an independent group of the business units and is responsible for determining the composition of the reserve, proposing assumptions for the performance of cash flows in different timeframes, proposing liquidity risk limits in accordance with the group risk appetite, communicating any mismatches, considering liquidity risk on an individual basis in the countries where Itaú Unibanco operates, simulating the behavior of cash flows in stress conditions, assessing and reporting in advance the risks inherent to new products and operations, as well as reporting on the information required by the regulatory agencies. All activities are subject to assessment by the independent validation, internal controls and audit departments.
The liquidity risk measurement has to comprise all financial trades of the companies of Itaú Unibanco, as well as possible contingent and unexpected exposures, such as those derived from settlement services, provision of sureties and guarantees, credit lines contracted and not used.
The liquidity policies of management and associated limits are established based on prospective scenarios, reviewed periodically and based on definitions from senior management.
The document that details the liquidity risk control institutional policy is on the Investor Relations website www.itau.com.br/investor-relations, in the route: Corporate Governance, Rules and Policies, Public Access Report - Liquidity Risk.
Itaú Unibanco manages and controls liquidity risk on a daily basis, through governance approved at corporate bodies, which, among other things, provides for minimum liquidity limits to be adopted, sufficient to absorb possible cash losses under situations of stress, measured by means of both in-house and regulatory calculations.
As from October 1, 2015, a minimum Liquidity Coverage Ratio (LCR) has been required of banks with total assets exceeding R$100 billion. It is calculated on an individual or consolidated basis for institutions that are part of a Prudential Conglomerate. This indicator is calculated as required by the Central Bank, in line with international guidelines.
As required by BACEN Circular Letter 3,724, Itaú Unibanco sends to BACEN, on a monthly basis, a disclosure requirement for the LCR. As from the second quarter of 2016, this information will be public disclosure, in accordance with BACEN Circular 3,749.
The following table shows the schedule for introduction of LCR, with a minimum requirement of 60% as from October 2015, rising gradually to 100% in January 2015.
| Timetable for limits to be observed | From January 1st | |||||||||||||||||||
| 2015 | 2016 | 2017 | 2018 | 2019 | ||||||||||||||||
| Liquidity Coverage Ratio (LCR) | 60% | (1) | 70 | % | 80 | % | 90 | % | 100 | % | ||||||||||
(1) From October 1st 2015
Additionally, and pursuant to the requirements of CMN Resolutions No. 4,090 and BACEN Circular No. 3,749, Itaú Unibanco makes monthly delivery of its Liquidity Risk Statements (DLR) to BACEN and the following items are regularly prepared and submitted to the senior management for monitoring and decision support:
| · | Different scenarios for liquidity projections; |
| · | Contingency plans for crisis situations; |
| · | Reports and charts to enable monitoring risk positions; |
| · | Assessment of funding costs and alternatives; |
| · | Tracking the sort of funding sources through a continuous control of funding sources considering counterparty type, maturity and other aspects. |
| 40 | |
| Itaú Unibanco |
| Risk and Capital Management – Pillar 3 |
| 8.2 | Primary sources of funding |
Itaú Unibanco has different sources of funding, with the main source arising from retail segment.
| Primary sources of funding | R$ million | |||||||||||||||||||||||||||||||||||
| 03/31/2016 | 12/31/2015 | 03/31/2015 | ||||||||||||||||||||||||||||||||||
| Funding | 0 to 30 days | Total | % | 0 to 30 days | Total | % | 0 to 30 days | Total | % | |||||||||||||||||||||||||||
| Deposits | 183,215 | 271,475 | 49 | % | 195,103 | 298,320 | 50 | % | 198,220 | 303,735 | 55 | % | ||||||||||||||||||||||||
| Demand deposits | 62,854 | 62,854 | 11 | % | 65,843 | 65,843 | 11 | % | 60,820 | 60,820 | 11 | % | ||||||||||||||||||||||||
| Savings deposits | 107,292 | 107,292 | 19 | % | 111,319 | 111,319 | 19 | % | 117,357 | 117,357 | 21 | % | ||||||||||||||||||||||||
| Time deposits | 9,638 | 92,774 | 17 | % | 13,465 | 106,189 | 18 | % | 10,354 | 97,405 | 18 | % | ||||||||||||||||||||||||
| Other | 3,431 | 8,555 | 2 | % | 4,476 | 14,969 | 3 | % | 9,689 | 28,153 | 5 | % | ||||||||||||||||||||||||
| Funds from acceptances and issuance of securities(1) | 4,114 | 74,358 | 13 | % | 4,128 | 75,596 | 13 | % | 2,317 | 50,762 | 9 | % | ||||||||||||||||||||||||
| Funds from own issue (2) | 2,309 | 150,097 | 27 | % | 2,863 | 154,682 | 26 | % | 2,472 | 138,797 | 25 | % | ||||||||||||||||||||||||
| Subordinated debt | 421 | 57,919 | 10 | % | 4,722 | 65,785 | 11 | % | 320 | 59,528 | 11 | % | ||||||||||||||||||||||||
| Total | 190,059 | 553,849 | 100 | % | 206,816 | 594,383 | 100 | % | 203,329 | 552,822 | 100 | % | ||||||||||||||||||||||||
(1) Includes mortgage notes, real estate credit bills, agribusiness and financial credit bills recorded in interbank and institutional market debts and liabilities for issue of debentures and foreign borrowings and securities recorded in funds from institutional markets.
(2) Refer to deposits received under securities repurchase agreements with securities from own issue.
| 9 | Other Risks |
Insurance products, pension plans and capitalização risks
Products that compose portfolios of insurance companies of Itau Unibanco are related to life and elementary insurance, as well as pension plans and capitalização. Accordingly, Itaú Unibanco understands that the main risks inherent to these products are:
| · | Underwriting Risk is the possibility of losses arising from insurance products, pension plans and capitalização that go against company’s expectations, directly or indirectly associated with technical and actuarial bases used for calculating premiums, contributions and technical provisions; |
| · | Market Risk is the possibility of losses resulting from fluctuations in market values of assets and liabilities that comprise technical actuarial reserves; |
| · | Credit Risk is the possibility of noncompliance, by a given debtor, with obligations related to the settlement of operations that involve the trading of financial assets of reinsurance; |
| · | Operational risk is the possibility of the occurrence of losses arising from the failure, deficiency or inadequacy of internal processes, people and systems, or from external events that affect the achievement of the strategic, tactical or operational objectives of the insurance, pension and capitalização operations; |
| · | Liquidity risk in insurance operations is the possibility of the institution not be able to honor timely its obligations to policyholders and beneficiaries due to lack of liquidity of the assets comprising the actuarial technical reserves. |
In line with good national and international practices and to ensure that risks arising from insurance products, pension plans and capitalização are properly identified, measured, evaluated, reported and approved in relevant forums, Itau Unibanco has a risk management framework, whose guidelines are established in institutional normative, approved by the Board, applicable to companies and subsidiaries at risk from insurance products, pension plans and capitalização, in Brazil and abroad.
The process of risk management for insurance, pensions and special savings plans is based on defined responsibilities distributed between the control and business areas, ensuring that they are independent of each other and focusing on the special nature of each risk, as per the guidelines established by Itaú Unibanco.
As part of the risk management process, there is a governance structure where decisions may be taken by corporate bodies, thus ensuring compliance with several regulatory and internal requirements, as well as balanced decisions relative to risks.
The aim of Itaú Unibanco is to ensure that assets serving as collateral for long-term products, with guaranteed minimum returns, are managed according to the characteristics of the liabilities, so that they are actuarially balanced and solvent over the long term.
Each year, liabilities for long-term products, which result in projected future benefits flows, are mapped using actuarial premises. This mapping enables Asset Liability Management models to be created, and these are used to define the best makeup of the asset portfolio to neutralize the risk of this type of product, taking into account their economic and financial viability over the long term. Portfolios of collateral assets are rebalanced periodically according to changes in market prices, the company’s liquidity requirements and the changes in the characteristics of the liabilities.
| 41 | |
| Itaú Unibanco |
| Risk and Capital Management – Pillar 3 |
Social and Environmental Risk
In business management, Itaú Unibanco continuously takes into consideration the potential of the risk of losses due to exposure to social and environmental events arising from the performance of its activities. These events arise from the direct operation of Itaú Unibanco which, on its own, has an impact on the environment or human health. Accordingly, the institution sees the social and environmental risk as the risk of losses arising from social and environmental losses caused by Itaú Unibanco in the development of its activities or by its actions, being its management structured by specific governance and formalized by means of policies. For the purpose of mitigating the exposure to these risks, the institution incorporated the social and environmental variable into its own activities and in its business that could, somehow, trigger financial losses.
In the governance of social and environmental issues, Itaú Unibanco has the Social and Environmental Risk Committee whose purpose is to establish the governance for social and environmental risk issues for the entire institution. Additionally, the social and environmental risk is managed by the first line of defense in its daily activities with the support of the legal department and social and environmental risk analysis units dedicated to the business. The business units also have the governance of approval of new products, which assesses the social and environmental risk, thus ensuring compliance with this requirement in all products and processes of the institution.
To this end, Itaú Unibanco has been developing many internal processes aimed at the management, control and mitigation of events that may lead to the occurrence of social and environmental risk, accordingly, the institution has been incorporating the social and environmental variable into different processes.
Itaú Unibanco consistently seeks to evolve in the management of social and environmental risk, always paying attention to the challenges so as to monitor the changes in and demands of society. Therefore, among other actions, Itaú Unibanco has assumed and incorporated into Itaú Unibanco’s internal processes a number of national and international voluntary commitments and pacts aimed at integrating social, environmental and governance aspects into Itaú Unibanco business. The main ones are the Principles for Responsible Investment (PRI), the Charter for Human Rights – Ethos, the Equator Principles (EP), the Global Impact, the Carbon Disclosure Project (CDP), the Brazilian GHG Protocol Program, the Pacto Nacional para Erradicação do Trabalho Escravo (National Pact for Eradicating Slave Labor), among others. Itaú Unibanco efforts to increase the knowledge of the assessment of the social and environmental criteria have been recognized as models in Brazil and abroad, as shown by the recurring presence of the institution in the major sustainability indexes abroad, such as the Dow Jones Sustainability Index, and in Brazil, such as the Corporate Sustainability Index, in addition to the many awards we have received.
Regulatory Risk
Regulatory risk is considered at Itaú Unibanco as the risk arising from losses due to fines, sanctions and other penalties applied by regulatory agencies resulting from noncompliance with regulatory requirements. The regulatory risk is managed through a structured process aimed at identifying changes in the regulatory environment, analyzing their impacts on the departments of the institution and monitoring the implementation of actions directed at adherence to the regulatory requirements.
Itaú Unibanco has a structured and consistent flow for addressing rules, covering the stages of recognition, distribution, monitoring and compliance, and all of these processes are established in internal policies. The structure and flow for addressing the regulatory risk are composed of: (i) monitoring of legislative bills, notices and public consultation; (ii) recognition of new rules for determining action plans; (iii) relationship with regulators; (iv) monitoring of action plans; (v) prioritization of risks; and (vi) control of compliance with legal decisions on class actions and with the Conduct Adjustment Instrument (TAC).
Model Risk
Itaú Unibanco’s risk management already has proprietary models for risk management that are continuously monitored, and reviewed whenever necessary, aiming at ensuring effectiveness in strategic and business decisions.
Model risk is defined as the risk that arises from the models used by Itaú Unibanco not reflecting, on a consistent basis, the relationships of variables of interest, creating results that systematically differ from those observed. This risk may materialize mainly as a result of methodological inadequacies during its development or the use in different situations from those modeled.
Itaú Unibanco uses the best market practices to manage the model risk to which it is exposed during the entire lifecycle of a model and the stages of which may be classified into four main ones: development, implementation, validation and use. The best practices that mark the model risk control at the institution include: (i) certification of the quality of the database used; (ii) application of a list of essential steps to be taken during the development; (iii) conservatism in judgmental models (iv) use of external benchmarks; (v) approval of results generated in implementation; (vi) independent technical validation; (vii) assessments of use; (viii) assessments of the impact in the use; (ix) monitoring of performance; and (x) monitoring of the distribution of the explanatory variables and final score.
| 42 | |
| Itaú Unibanco |
| Risk and Capital Management – Pillar 3 |
Country Risk
Country risk is defined as the risk of losses arising from noncompliance with the financial obligations in the terms agreed upon by borrowers, issuers, counterparties or guarantors as a result of actions taken by the government of the country where the borrower, issuer, counterparty or guarantor is located or of political, eco nomic and social events related to that country.
Itaú Unibanco is present in many other countries in addition to Brazil. In addition to the foreign units, Itaú Unibanco has a relationship with borrowers, issuers, counterparties and guarantors from many places in the world, regardless of whether Itaú Unibanco has a foreign un in the place it where the borrower, issuer, counterparty or guarantor is located.
In order to properly address the country risk, Itaú Unibanco has a specific and a process structure aimed at ensuring that the risk is managed and controlled. These processes include: (i) country risk governance; (ii) establishment of country ratings; (iii) determination of limits for countries; and (iv) monitoring of limits and treatment of noncompliance.
Business and Strategy Risk
Itaú Unibanco defines the business and strategy risk as the risk of a negative impact on the results or capital as a consequence of a faulty strategic planning, the making of adverse strategic decisions, the inability of Itaú Unibanco to implement the proper strategic plans and/or changes in its business environment.
Since the business and strategic risk can directly affect the creation of value and even the feasibility of the institution, Itaú Unibanco has implemented many mechanisms that ensure that both the business and the strategic decision-making processes follow proper governance standards, have the active participation of executives and the Board of Directors, are based on market, macroeconomic and risk information and are aimed at optimizing the risk-return ratio.
In order to treat risk properly, Itaú Unibanco has the governance standards and processes listed below that fully involve the senior management and the risk control and management department in business and strategic decisions so as to ensure that the risk is managed and that the decisions are sustainable. Therefore, there is:
| · | Governance that has qualified decision-makers who, at the same time, are properly motivated; |
| · | Budgeting process with the active participation of the risk control and management department; |
| · | Process for the assessment of new products before they are sold; |
| · | Specific structure for the assessment and prospection of mergers and acquisitions. |
Reputational Risk
Itaú Unibanco defines reputational risk as the risk arising from internal practices, risk events and external factors that may generate a negative perception of the institution among clients, counterparties, stockholders, investors, supervisors, commercial partners, among others, resulting in impacts on the value of the brand and financial losses, in addition to adversely affecting Itaú Unibanco’s capability to maintain existing commercial relations, start new businesses and continue to have access to financing sources.
Since the reputational risk directly or indirectly permeates all operations and processes of the institution, Itaú Unibanco’s governance is structured in a way to ensure that potential reputational risks are identified, analyzed and managed still in the initial phases of its operations and the analysis of new products.
Itaú Unibanco believes that its reputation is extremely important for achieving its long-term goals and this is why the institution tries to align its speech with ethical and transparent practice and work, which is essential to raise the confidence of Itaú Unibanco’s stakeholders.
For the purpose of avoiding negative impacts on the perception of Itaú Unibanco’s image by the many stakeholders, the treatment given to reputational risk is structured by means of many processes and internal initiatives, which, in turn, are supported by internal policies, and their main purpose is to provide mechanisms for the monitoring, management, control and mitigation of the main reputational risks to which the institution is, or might be, exposed. Among them are:
| · | Risk appetite framework; |
| · | Process for the prevention and fight against the use of Itaú Unibanco in unlawful acts; |
| · | Crisis management process and business continuity; |
| 43 | |
| Itaú Unibanco |
| Risk and Capital Management – Pillar 3 |
| · | Processes and guidelines of the governmental and institutional relations; |
| · | Corporate communication process; | |
| · | Brand management process; |
| · | Ombudsman offices initiatives and commitment to customer satisfaction; | |
| · | Ethics guidelines and prevention of corruption. |
Financial institutions play a key role in preventing and combating illegal acts, in particular money laundering, terrorist financing and fraud, for which the challenge is to identify and suppress increasingly sophisticated operations that seek to conceal the origin, ownership and movement of goods and assets derived from illegal activities.
Itaú Unibanco has introduced a corporate policy in order to prevent its involvement in illegal acts and to protect its reputation and image before employees, customers, strategic partners, suppliers, service providers, regulators and society, through a governance structure based on transparency, strict compliance with rules and regulations and cooperation with police and judicial authorities. It is also continuously aligned with local and international best practices for preventing and combating illegal acts, through investing and continuously training employees.
In compliance with the guidelines of this corporate policy, Itaú Unibanco established a program to prevent and combat illegal acts based on the following pillars:
| · | Client Identification Process; |
| · | Know Your Client (KYC) Process; |
| · | Know Your Partner (KYP) Process; |
| · | Know Your Supplier (KYS) Process; |
| · | Know Your Employee (KYE) Process; |
| · | Assessment of New Products and Services; |
| · | Monitoring of Transactions; |
| · | Communication of Suspicious Transactions to the Regulatory Bodies; and |
| · | Training and Awareness Raising. |
This program applies to the entire Itaú Unibanco Group, including subsidiaries and affiliates in Brazil and abroad. Governance on preventing and combating unlawful acts is carried out by the Board of Directors and corporate bodies. The document that presents the guidelines established in the program to prevent and combat unlawful acts may be seen on the www.itau.com.br/investor-relations website in the section Corporate Governance, Regulations and Policies, corporate policy to prevent and combat unlawful acts.
In addition to the program to prevent, detect and combat unlawful acts, Itaú Unibanco is committed to protecting corporate information and ensuring the privacy of clients in any operations. To this end, Itaú Unibanco is guided by the Information Security Corporate Policy whose purpose is to ensure the application of the principles and guidelines for the protection of information and intellectual property of the organization, clients and general public.
To ensure that the processed information is properly protected, Itaú Unibanco has a process monitoring and control structure that covers technology, business areas and international units. Additionally, a Security Operation Center (SOC) that works 24/7 contributes for the cyber security of Itaú Unibanco’s electronic channels and IT infrastructure, the monitoring of operations and thus minimization of the risk of a security incident.
Awareness raising campaigns to prevent corruption, money laundering, fraud and other unlawful acts are regularly carried out using the many communication channels existing with Itaú Unibanco´s employees. The actions include lectures, campaigns and in-person training and e-learning courses on the many topics. Besides lectures and campaigns, Itaú Unibanco offers a website with guidelines on security in the digital and physical world, for the general public.
| 44 | |
| Itaú Unibanco |
| Risk and Capital Management – Pillar 3 |
| 10 | Enterprise Risk Management and Alignment of Incentives |
In accordance with the scope and complexity of its operations, Itaú Unibanco established processes for effectively identifying, assessing, monitoring and controlling risks, besides adequately allocating the capital to segments. In addition, Itaú Unibanco established processes, which enables the Executives and Board of Directors to hold a global view about the institution´s risk exposures, as well as a prospective view about the adequacy of its capital, besides promoting the alignment of incentives. Some of these processes are described below:
Risk Appetite
Itaú Unibanco’s risk appetite is a set of guidelines and limits defining acceptable levels of risk for the Bank. Divided into four dimensions consisting of a set of metrics of the key risks involved, risk appetite combines complementary forms of risk measurement, in order to give a comprehensive overview of the institution’s exposure.
The capitalization level reflects the level of protection of the bank against significant losses, defining capitalization limits that consider the current scenarios expected and the stress scenario. This level establishes the minimum capitalization guidelines of Itaú Unibanco in relation to its risks, according to which management uses the bank’s capital in accordance with acceptable leverage levels and funding costs.
The liquidity level reflects the level of protection of the bank against a long period of funding stress, which could lead to a lack of liquidity. This level establishes the guidelines regarding the minimum liquidity levels, acceptable levels of mismatch of terms and funding structure.
The business composition level, meanwhile, seeks to ensure, by means of concentration limits, proper portfolio composition, aiming at low volatility and sustainability of the business.
Last, the franchise level addresses risks that may impact the value of the brand and reputation of Itaú Unibanco with stakeholders.
The Board of Directors holds the highest approval authority for risk appetite guidelines and limits, carrying out its responsibilities with the support of its Risk and Capital Management Committee, which submits reports and recommendations on the issue for the Board’s approval. Acceptable risk levels must obey the risk appetite limits approved by the Board of Directors.
Executive and operational functions are the responsibility of the Executive Board and the risk commissions, whose members include the Chief Risk Officer (CRO) and the CEO of the institution. As well as regularly monitoring and supervising the metrics, the risk commissions are also responsible for implementing the risk appetite framework. The Audit Committee also monitors changes in risk appetite and assists in managing it.
Stress Test
The stress test performed by Itaú Unibanco is aimed at evaluating the solvency of the institution in extreme stress situations, as well as identifying areas that are more susceptible to stress impact that may undergo risk mitigation. It is based on stressed projections of macroeconomic and credit variables, with the purpose of analyzing the added effect on income, capital and liquidity of the institution, consistent with the financial industry’s standards. The test is performed on the main bank portfolios, simulating the impact on each business area through the calculation of stressed financial statements, under different scenarios approved by the Board of Directors, considering a horizon of two to three years.
The test results are reported to the senior management and the Board of Directors supporting strategic decisions. They are also included in the ICAAP report submitted to BACEN.
Risk-adjusted Compensation
The Compensation guidelines of Itaú Unibanco are aimed at attracting, retaining and compensating on merit its collaborators, encouraging prudent risk exposure levels in short-, medium- and long-term strategies, in line with the interests of its shareholders and regulatory authorities and line with the organization’s culture. The governance structure of compensation and incentive to the prudent risk taking has been consolidating in line with the best international compensation and governance practices. The Compensation Committee, in accordance with the CMN Resolution No. 3,921 and reporting to the Board of Directors is responsible for setting out the guidelines on models of compensation to collaborators and the policy on compensation of management members of the Conglomerate companies.
| 45 | |
| Itaú Unibanco |
| Risk and Capital Management – Pillar 3 |
Compensation at Itaú Unibanco takes into account the strategy of the institution, the general and specific legislation that should be adopted for each business or region of operation, and the adequate risk management over time. The variable compensation considers the current and potential risks, giving incentive to the achievement of sustainable results and discouraging decisions that involve excess risks. The calculation of the aggregate and individual amounts considers, among others, long-term sustainable financial bases, adjustments to future payments in view of assumed risks, the results of the institution and/or of the area, when applicable, and the ratio between performance and risks incurred.
In accordance with the CMN Resolution No. 3,921, a portion of the variable compensation of statutory officers is paid in stocks (at least 50%) and a percentage is deferred for three years (at least 40% of variable compensation). The deferred and unpaid portions must be reversed in case the institution has an unsatisfactory performance and the business unit has a negative performance.
Reflecting its concern with sustainable performance, Itaú Unibanco implements specific variable compensation practices for collaborators which roles and responsibilities have material impact on the risk of the bank, although they are not subject to the requirements of CMN Resolution No. 3,921. For such collaborators, mechanisms are provided for making adjustments to bonus arising from compliance, risk as well as deferral events.
For more information about remuneration in Itaú Unibanco, see Note 16 – “Shareholders’ Equity” in the full Financial Statements, which are shown on the website www.itau.com.br/investor-relations.
| 46 | |
| Itaú Unibanco |
| Risk and Capital Management – Pillar 3 |
| 11 | Appendix I |
| Breakdown of the Referential Equity and Information on its adequacy | 03/31/2016 | |||||||||||
| Value | Temporary Treatment | Balance | ||||||||||
| (R$ Thousand) | (R$ Thousand) | Sheet Reference | ||||||||||
| Core Capital: instruments and reserves | ||||||||||||
| 1 | Instruments Eligible for the Core Capital | 85,148,000 | - | (k) | ||||||||
| 2 | Revenue reserves | 28,914,671 | - | (l) | ||||||||
| 3 | Other revenue and other reserve | 106,694 | - | (m) | ||||||||
| 4 | Instruments that are authorized to compose the Core Capital before Resolution No. 4,192 of 2013 comes into effect | |||||||||||
| 5 | Non-controlling interest in subsidiaries that are part of the conglomerate, non-deductible from the Core Capital¹ | 700,071 | 157,968 | (j) | ||||||||
| 6 | Core Capital before prudential adjustments | 114,869,436 | ||||||||||
| Core Capital: prudential adjustments | ||||||||||||
| 7 | Prudential adjustments related to the pricing of financial instruments | 588,265 | - | |||||||||
| 8 | Goodwill paid upon the acquisition of investments based on the expectation of future profitability | 4,527,408 | 3,018,272 | (e) | ||||||||
| 9 | Intangible assets | 4,472,792 | 1,160,455 | (h) / (i) | ||||||||
| 10 | Tax credits arising from income tax losses and social contribution tax loss carryfowards and those originating from this contribution related to determination periods ended until December 31, 19982 | 4,532,767 | 3,021,845 | (b) | ||||||||
| 11 | Adjustments related to the market value of derivative financial instruments used to hedge the cash flows of protected items whose mark-to-market adjustments are not recorded in the books. | - | - | |||||||||
| 12 | Downward difference between the amount recognized as a provision and the expected loss for institutions using the IRB | - | - | |||||||||
| 13 | Gains arising from securitization operations | |||||||||||
| 14 | Gains or losses arising from the impact of changes on the credit risk of the institution on the fair value assessment of liability items | |||||||||||
| 15 | Actuarial assets related to defined benefit pension funds | 47,443 | 31,629 | (d) | ||||||||
| 16 | Shares or other instruments issued by the bank authorized to compose the Core Capital, acquired directly, indirectly or synthetically | 4,144,448 | - | (n) | ||||||||
| 17 | Investments crossed with instruments eligible for the Core Capital | |||||||||||
| 18 | Added value of investments lower than 10% of the capital of companies that are similar to non-consolidated financial institutions, insurance companies, reinsurance companies, capitalization companies and sponsored pension fund entities, that exceeds 10% of the amount of the Core Capital, disregarding specific deductions. | - | - | |||||||||
| 19 | Investments higher than 10% of the capital of companies that are similar to non-consolidated financial institutions, insurance companies, reinsurance companies, capitalization companies and sponsored pension fund entities | - | - | |||||||||
| 20 | Mortgage servicing rights | |||||||||||
| 21 | Tax credits arising from temporary differences that depend on the generation of income or future taxable income for their realization, above the limit of 10% of the Core Capital, disregarding specific deductions | - | - | |||||||||
| 22 | Amount that exceeds 15% of the Core Capital | - | - | |||||||||
| 23 | of which: arising from investments in the capital of companies that are similar to non-consolidated financial institutions, insurance companies, reinsurance companies, capitalization companies and open ended pension entities | - | - | |||||||||
| 24 | of which: arising from mortgage servicing rights | |||||||||||
| 25 | of which: arising from tax credits resulting from temporary differences that depend on the generation of income or future taxable income for their realization² | - | - | |||||||||
| 26 | National regulatory adjustments | (2,663,889 | ) | - | ||||||||
| 26.a | Deferred permanent assets | 68,220 | - | (g) | ||||||||
| 26.b | Investment in dependence, financial institution abroad or non-financial entity that is part of the conglomerate, with respect to which the Central Bank of Brazil does not have access to information, data and documents | - | - | |||||||||
| 26.c | Funding instruments eligible for the Core Capital issued by an institution that is authorized to operate by the Central Bank of Brazil or by a financial institution abroad, and that is not part of the conglomerate | - | - | |||||||||
| 26.d | Increase of unauthorized capital | - | - | |||||||||
| 26.e | Excess of the amount adjusted of Core Capital | - | - | |||||||||
| 26.f | Deposit to cover capital deficiency | - | - | |||||||||
| 26.g | Amount of intangible assets established before Resolution No. 4,192 of 2013 comes into effect | 2,732,109 | - | (i) | ||||||||
| 26.h | Excess of resources invested on permanent assets | - | - | |||||||||
| 26.i | PR emphasis | - | - | |||||||||
| 26.j | Other residual differences concerning the Core Capital calculation methodology for regulatory purposes | - | - | |||||||||
| 27 | Regulatory adjustments applied to the Core Capital due to the Insufficiency of Additional Capital and Tier II Capital to cover deductions | |||||||||||
| 28 | Total regulatory deductions from the Core Capital | 15,649,234 | ||||||||||
| 29 | Core Capital | 99,220,203 | ||||||||||
| 1 - Considers prudential adjustments corresponding to deduction of non-controlling interest. | ||||||||||||
| 2 - Considers the deduction of deferred tax liabilities. | ||||||||||||
| 3 - Calculated according to article 9 of Bacen Resolution No. 4,192. | ||||||||||||
| 4 - Calculated according to article 29 of Resolution No. 4,192. | ||||||||||||
| 47 | |
| Itaú Unibanco |
| Risk and Capital Management – Pillar 3 |
| Breakdown of the Referential Equity and Information on its adequacy | 03/31/2016 | |||||||||||
| Value | Temporary Treatment | Balance | ||||||||||
| (R$ Thousand) | (R$ Thousand) | Sheet Reference | ||||||||||
| Additional Capital: instruments | ||||||||||||
| 30 | Instruments eligible for the Additional Capital | - | - | |||||||||
| 31 | of which: classified as core capital in accordance with the accounting rules | - | - | |||||||||
| 32 | of which: classified as liabilities in accordance with the accounting rules | - | - | |||||||||
| 33 | Instruments that are authorized to compose the Additional Capital before Resolution No. 4,192 of 2013 comes into effect | - | - | |||||||||
| 34 | Non-controlling interest in subsidiaries that are part of the conglomerate, non-deductible from the Additional Capital³ | 69,851 | 46,567 | |||||||||
| 35 | of which: instruments issued by subsidiaries before Resolution No. 4,192 of 2013 comes into effect | - | - | |||||||||
| 36 | Additional capital before regulatory deductions | 69,851 | ||||||||||
| Additional Capital: regulatory deductions | ||||||||||||
| 37 | Shares or other instruments issued by the bank authorized to compose the Additional Capital, acquired directly, indirectly or synthetically | |||||||||||
| 38 | Investments crossed with instruments eligible for the Additional Capital | |||||||||||
| 39 | Added value of investments lower than 10% of the capital of institutions authorized to operate by the Central Bank of Brazil or by a financial institution abroad that are not part of the conglomerate and that exceeds 10% of the amount of the Additional Capital | - | ||||||||||
| 40 | Investments higher than 10% of the capital of institutions authorized to operate by the Central Bank of Brazil or by a financial institution abroad that are not part of the conglomerate | - | ||||||||||
| 41 | National regulatory adjustments | - | - | |||||||||
| 41.a | Funding instruments eligible for the Additional Capital issued by an institution that is authorized to operate by the Central Bank of Brazil or by a financial institution abroad, and that is not part of the conglomerate, limited to the instruments held by third parties and issued until December 31, 2012 | - | - | |||||||||
| 41.b | Non-controlling interest in Additional Capital | - | - | |||||||||
| 41.c | Other residual differences concerning the Additional Capital calculation methodology for regulatory purposes | - | - | |||||||||
| 42 | Regulatory adjustments applied to the Additional Capital due to the insufficiency of Tier II Capital to cover deductions | - | - | |||||||||
| 43 | Total regulatory deductions from the Additional Capital | |||||||||||
| 44 | Additional Capital | 69,851 | ||||||||||
| 45 | Tier I | 99,290,053 | ||||||||||
| Tier II: instruments | ||||||||||||
| 46 | Instruments eligible for Tier II Capital | - | - | |||||||||
| 47 | Instruments that are authorized to compose Tier II Capital before Resolution No. 4,192 of 2013 comes into effect4 | 23,488,432 | 15,658,955 | |||||||||
| 48 | Non-controlling interest in subsidiaries that are part of the conglomerate, non-deductible from Tier II Capital³ | 93,135 | 62,090 | |||||||||
| 49 | of which: instruments issued by subsidiaries before Resolution No. 4,192 of 2013 comes into effect | 93,135 | 62,090 | |||||||||
| 50 | Excess of provisions with respect to the loss expected in IRB | - | - | |||||||||
| 51 | Tier II before regulatory deductions | 23,581,566 | ||||||||||
| Tier II: regulatory deductions | ||||||||||||
| 52 | Shares or other instruments issued by the bank authorized to compose Tier II Capital, acquired directly, indirectly or synthetically | - | ||||||||||
| 53 | Investments crossed with instruments eligible for Tier II Capital | |||||||||||
| 54 | Added value of investments lower than 10% of the capital of institutions authorized to operate by the Central Bank of Brazil or by a financial institution abroad that are not part of the conglomerate and that exceeds 10% of the amount of Tier II Capital | - | ||||||||||
| 55 | Investments higher than 10% of the capital of institutions authorized to operate by the Central Bank of Brazil or by a financial institution abroad that are not part of the conglomerate | - | ||||||||||
| 56 | National regulatory adjustments | - | - | |||||||||
| 56.a | Funding instruments issued by an institution that is authorized to operate by the Central Bank of Brazil or by a financial institution abroad, and that is not part of the conglomerate, limited to the instruments held by third parties and issued until December 31, 2012 | - | - | |||||||||
| 56.b | Non-controlling interest in Tier II | - | - | |||||||||
| 56.c | Other residual differences concerning Tier II calculation methodology for regulatory purposes | - | - | |||||||||
| 57 | Total regulatory deductions from Tier II Capital | - | ||||||||||
| 58 | Tier II | 23,581,566 | ||||||||||
| 59 | Referential Equity (Tier I + Tier II) | 122,871,620 | ||||||||||
| 60 | Total risk-weighted assets | 694,898,698 | ||||||||||
| 1 - Considers prudential adjustments corresponding to deduction of non-controlling interest. | ||||||||||||
| 2 - Considers the deduction of deferred tax liabilities. | ||||||||||||
| 3 - Calculated according to article 9 of Bacen Resolution No. 4,192. | ||||||||||||
| 4 - Calculated according to article 29 of Resolution No. 4,192. | ||||||||||||
| 48 | |
| Itaú Unibanco |
| Risk and Capital Management – Pillar 3 |
| Breakdown of the Referential Equity and Information on its adequacy | 03/31/2016 | |||||||||||
| Value | Temporary Treatment | Balance | ||||||||||
| (R$ Thousand) | (R$ Thousand) | Sheet Reference | ||||||||||
| BIS Ratios and Additional Core Capital | ||||||||||||
| 61 | Common Equity Tier 1 | 14.3 | % | |||||||||
| 62 | Tier I Ratio | 14.3 | % | |||||||||
| 63 | BIS Ratio | 17.7 | % | |||||||||
| 64 | Core Capital minimum requirement, including capital additions (% of RWA) | 5.125 | % | |||||||||
| 65 | of which: additional for preserving capital | 0.625 | % | |||||||||
| 66 | of which: countercyclical additional | 0.0 | % | |||||||||
| 67 | of which: additional for institutions that are systemically important at global level (G-SIB) | |||||||||||
| 68 | Core Capital available to meet the requirement for Additional Core Capital (% of RWA) | 0.625 | % | |||||||||
| National Minimum | ||||||||||||
| 69 | Core Capital Ratio, if different from that established in Basel III | |||||||||||
| 70 | Tier I Ratio, if different from that established in Basel III | 6.0 | % | |||||||||
| 71 | BIS Ratio, if different from that established in Basel III | 9.875 | % | |||||||||
| Amounts below the limit for deduction (non-weighted by risk) | ||||||||||||
| 72 | Added value of investments lower than 10% of the capital of companies that are similar to non-consolidated financial institutions, insurance companies, reinsurance companies, capitalization companies and sponsored pension fund entities | 29,285 | ||||||||||
| 73 | Investments higher than 10% of the capital of companies that are similar to non-consolidated financial institutions, insurance companies, reinsurance companies, capitalization companies and sponsored pension fund entities | 8,553,753 | (a) / (f) | |||||||||
| 74 | Mortgage servicing rights | |||||||||||
| 75 | Tax credits arising from temporary differences, not deducted from the Core Capital | 6,235,500 | (c) | |||||||||
| Limits to the inclusion of provisions in Tier II | ||||||||||||
| 76 | Generic provisions eligible for the inclusion in Tier II Capital related to exposures subject to the calculation of the capital requirement by means of a standardized approach | |||||||||||
| 77 | Limit for the inclusion of generic provisions in Tier II Capital for exposures subject to the standardized approach | |||||||||||
| 78 | Provisions eligible for the inclusion in Tier II Capital related to exposures subject to the calculation of the capital requirement by means of the IRB approach (before the application of the limit) | - | ||||||||||
| 79 | Limit for the inclusion of provisions in Tier II Capital for exposures subject to the IRB approach | - | ||||||||||
| Instruments authorized to compose the Referential Equity before Resolution No. 4,192 of 2013 comes into effect (applicable between October 1, 2013 and January 1, 2022) | ||||||||||||
| 80 | Current limit for instruments that are authorized to compose the Core Capital before Resolution No. 4,192 of 2013 comes into effect | |||||||||||
| 81 | Amount excluded from the Core Capital due to the limit | |||||||||||
| 82 | Instruments that are authorized to compose the Additional Capital before Resolution No. 4,192 of 2013 comes into effect | - | - | |||||||||
| 83 | Amount excluded from the Additional Capital due to the limit | - | - | |||||||||
| 84 | Instruments that are authorized to compose Tier II Capital before Resolution No. 4,192 of 2013 comes into effect4 | 23,488,432 | - | |||||||||
| 85 | Amount excluded from Tier II Capital due to the limit4 | 15,658,955 | - | |||||||||
| 1 - Considers prudential adjustments corresponding to deduction of non-controlling interest. | ||||||||||||
| 2 - Considers the deduction of deferred tax liabilities. | ||||||||||||
| 3 - Calculated according to article 9 of Bacen Resolution No. 4,192. | ||||||||||||
| 4 - Calculated according to article 29 of Resolution No. 4,192. | ||||||||||||
| 49 | |
| Itaú Unibanco |
| Risk and Capital Management – Pillar 3 |
| 12 | Glossaries |
| 12.1 | Glossary of Acronyms |
A
| · | AVA - Avaliação de Vulnerabilidades e Ameaças (Threats and Vulnerabilities Analysis) |
| · | ARS - Argentine Peso |
B
| · | BACEN - Banco Central do Brasil (Central Bank of Brazil) |
| · | BIA - Business Impact Analysis |
| · | BM&FBOVESPA - Bolsa de Valores, Mercadorias e Futuros de São Paulo (São Paulo Stock, Mercantile and Future Exchange) |
| · | BRL - Brazilian Real |
C
| · | CCB – Cédula de Crédito Bancário |
| · | CDB - Certificado de Depósito Bancário (Bank Deposit Certificate) |
| · | CDI - Certificado de Depósito Interfinanceiro (Interbank Deposit Certificate) |
| · | CDS - Credit Default Swap |
| · | CER - Coeficiente de Estabilización de Referencia (Argentine inflation index linked interest rate) |
| · | CLN - Credit Linked Note |
| · | CLP - Chilean Peso | |
| · | CMN - Conselho Monetário Nacional (National Monetary Council) |
| · | CNSP - Conselho Nacional de Seguros Privados (National Council of Private Insurance) |
| · | CRA – Certificados de Recebíveis do Agronegócio (Agribusiness Receivables Certificate) |
| · | CRI - Certificados de Recebíveis Imobiliários (Securitized Real Estate Loans) |
| · | CVM - Securities and Exchange Commission |
D
| · | DRL - Demonstrativo de Risco de Liquidez (Liquidity Risk Statements) |
| · | DV01 - Delta Variation Risk |
E
| · | EAD - Exposure at Default |
F
| · | FIDC - Fundo de Investimento em Direitos Creditórios (Credit Rights Investment Funds) |
| · | FII – Fundo de Investimento Imobiliário (Real Estate Investiment Fund) |
| · | FPRs - Fatores de Ponderação de Riscos (weighting factor) |
G
| · | GDP - Gross Domestic Product |
| · | G-SIBs - Global Systemically Important Banks |
I
| · | ICAAP - Internal capital adequacy assessment process |
| · | IGPM – Índice Geral de Preços do Mercado (Brazilian consumer index) |
| · | IPCA - Índice de Preço ao Consumidor Amplo (Brazilian consumer index) |
| · | IT - Information Technology |
L
| · | LGD - Loss Given Default |
| 50 | |
| Itaú Unibanco |
| Risk and Capital Management – Pillar 3 |
M
| · | MEP - Equity Method | |
| · | MtM - Mark to Market |
P
| · | PCN - Planos de Continuidade de Negócios (Business Continuity Plans) |
| · | PD - Probability of default |
| · | PR - Patrimônio de Referência (Referential Equity) |
| · | PYG - Paraguayan Guarani |
R
| · | RA - Risk Assessment |
| · | RBAN - Referential equity calculated for covering the interest rate risk of trades of the Banking Portfolio |
| · | RCAP – Regulatory Consistency Assessment Programme |
| · | RCP - Risco de Crédito Potencial (Potential Credit Risk) |
| · | RWA - Risk Weighted Asset |
| · | RWAACS – Portion relating to exposures subjects to variations in equities prices and classified in the Trading Portfolio; |
| · | RWACAM – Portion relating the exposures in gold, foreign exchange rate and assets subject to foreign exchange rate variations; |
| · | RWACOM – Portion relating to exposures subjects to variations in commodity prices |
| · | RWACPAD – Portion relating to exposures to credit risk |
| · | RWAJUR - Portion relating to exposures subjects to variations of interest rates, interest coupons and coupon rates and classified in the Trading Portfolio |
| · | RWAJUR1 – Portion relating to exposures subject to fixed income interest rate denominated in reais |
| · | RWAJUR2 - Portion relating to exposures subject to variation in the foreign exchange linked interest rate |
| · | RWAJUR3 - Portion relating to exposures subject to variation in the price index linked interest rates |
| · | RWAJUR4 - Portion relating exposures subject to variation in the interest rate index linked interest rate |
| · | RWAMPAD - Sum of the terms: RWACAM, RWAJUR, RWACOM, RWAACS |
| · | RWAOPAD - Portion relating to the calculation of operational risk capital requirements |
S
| · | SUSEP - Superintendência de Seguros Privados (Superintendence of Private Insurance) |
T
| · | TRS - Total Return Swap |
| · | TR - Taxa Referencial (Referential Rate) |
| · | TVM - Títulos de valores mobiliários (Securities) |
U
| · | UF - Chilean consumer index |
| · | UI - Uruguayan consumer index |
| · | U.S. - United States of America |
| · | UYU - Uruguayan Peso |
V
| · | VaR - Value at Risk |
| 51 | |
| Itaú Unibanco |
| Risk and Capital Management – Pillar 3 |
| 12.2 | Glossary of Regulations |
| · | BACEN Circular No. 3,354 of June 27th, 2007 |
| · | BACEN Circular No. 3,547, of July 07th, 2011 |
| · | BACEN Circular No. 3,640, of March 04th, 2013 |
| · | BACEN Circular No. 3,644, of March 04th, 2013 |
| · | BACEN Circular No. 3,647, of March 04th, 2013 |
| · | BACEN Circular No. 3,675, of October 31st, 2013 |
| · | BACEN Circular No. 3,678, of October 31st, 2013 |
| · | BACEN Circular No. 3,716, of August 21st, 2014 |
| · | BACEN Circular No. 3,739, of December 17th, 2014 |
| · | BACEN Circular No. 3,748, of February 26th, 2015 |
| · | BACEN Circular No. 3,749, of March 05th, 2015 |
| · | BACEN Circular No. 3,751, of March 19th, 2015 |
| · | BACEN Circular No. 3,768, of October 29th, 2015 |
| · | BACEN Circular No. 3,769, of October 29th, 2015 |
| · | BACEN Circular No. 3,770, of October 29th, 2015 |
| · | BACEN Circular Letter No. 3,685 of December 19th, 2014 |
| · | BACEN Circular Letter No. 3,724 of September 15th, 2015 |
| · | CNSP Resolution No. 228 of December 06th, 2010 |
| · | CNSP Resolution No. 280, of January 30th, 2013 |
| · | CNSP Resolution No. 282, of January 30th, 2013 |
| · | CNSP Resolution No. 283, of January 30th, 2013 |
| · | CNSP Resolution No. 284, of January 30th, 2013 |
| · | CNSP Resolution No. 321, of July 15th, 2015 |
| · | CMN Resolution No. 3,380 of June 29th, 2006 |
| · | CMN Resolution No. 3,444 of February 28th, 2007 |
| · | CMN Resolution No. 3,464 of June 26th, 2007 |
| · | CMN Resolution No. 3,533 of January 31st, 2008 |
| · | CMN Resolution No. 3,721 of April 30th, 2009 |
| · | CMN Resolution No. 3,921 of November 25th, 2010 |
| · | CMN Resolution No. 3,988 of June 30th, 2011 |
| · | CMN Resolution No. 4,090, of May 24th, 2012 |
| · | CMN Resolution No. 4,192, of March 1st, 2013 |
| · | CMN Resolution No. 4,193, of March 1st, 2013 |
| · | CMN Resolution No. 4,195, of March 1st, 2013 |
| · | CMN Resolution No. 4,280, of October 31st, 2013 |
| · | CMN Resolution No. 4,281, of October 31st, 2013 |
| · | CVM Regulatory Instruction No. 475 of December 17th, 2008 |
| 52 | |
| Itaú Unibanco |
Serious News for Serious Traders! Try StreetInsider.com Premium Free!
You May Also Be Interested In
- ITAÚ UNIBANCO - Interactive Meeting 1Q24
- Innovative Medical Products & Curexo Inc. Announce Strategic OUS Distribution Partnership
- Decisions of Annual General Meeting in SP Group A/S
Create E-mail Alert Related Categories
SEC FilingsSign up for StreetInsider Free!
Receive full access to all new and archived articles, unlimited portfolio tracking, e-mail alerts, custom newswires and RSS feeds - and more!
