

Form 6-K ING GROEP NV For: Feb 11
 Tweet
Tweet Share
ShareUNITED STATES
SECURITIES AND EXCHANGE COMMISSION
Washington, DC 20549
FORM 6-K
Report of Foreign Private Issuer
Pursuant to Rule 13a-16 or 15d-16
of the Securities Exchange Act of 1934
For 11 February, 2015
Commission File Number 1-14642
ING Groep N.V.
Bijlmerplein 888
1102 MG Amsterdam
The Netherlands
Indicate by check mark whether the registrant files or will file annual reports under cover of Form 20-F or Form 40-F.
Form 20-F x Form 40-F ¨
Indicate by check mark if the registrant is submitting the Form 6-K in paper as permitted by Regulation S-T rule 101(b)(1): ¨
Indicate by check mark if the registrant is submitting the Form 6-K in paper as permitted by Regulation S-T rule 101(b)(7): ¨
Indicate by check mark whether the registrant by furnishing the information contained in this Form is also thereby furnishing the information to the Commission pursuant to rule 12g3-2(b) under the Securities Exchange Act of 1934.
Yes ¨ No x
If “Yes” is marked, indicate below the file number assigned to the registrant in connection with Rule 12g3-2(b).
This Report contains a copy of the following:
The Press Release issued on 11 February, 2015
 |
| PRESS RELEASE |
11 February, 2015
|
NG Bank posts 2014 underlying net profit of EUR 3,424 million;
Dividends reinstated with EUR 0.12 per ordinary share
|
•
|
ING Bank full-year 2014 underlying net profit of EUR 3,424 million, up 8.5% from full-year 2013
|
|
•
|
Strong full-year 2014 results reflect higher interest results, strict expense control and lower risk costs
|
|
•
|
4Q14 underlying net result of EUR 548 million reflects redundancy provisions, annual Dutch bank tax and negative CVA/DVA
|
|
•
|
Full-year 2014 underlying return on IFRS-EU equity improved to 9.9%; year-end fully-loaded CET 1 ratio strengthened to 11.4%
|
|
•
|
ING Group full-year 2014 net result EUR 1,251 million (EUR 0.32 per share), including special items and Insurance results
|
|
•
|
4Q14 net result was EUR 1,176 million (EUR 0.30 per share) including results from discontinued operations of NN Group and Voya
|
|
•
|
Significant progress on restructuring in 2014: Dutch State fully repaid, NN Group stake reduced to 68%, Voya stake down to 19%
|
|
•
|
ING reinstates dividend payments on ordinary shares and will propose to pay EUR 0.12 per share at the AGM in May
|
|
•
|
Financial strength enables ING to propose to pay a cash dividend of EUR 470 million, or EUR 0.12 per ordinary share
|
|
•
|
ING intends to pay a minimum of 40% of ING Group’s annual net profits to shareholders, through dividends, effective from 2015
|
CEO STATEMENT
“2014 was an important and successful year for ING,” said Ralph Hamers, CEO of ING Group. “We launched our ‘Think Forward’ strategy, repaid the Dutch State ahead of schedule and moved closer to completing our restructuring plan. We are proud to have solidified our repositioning as a leading European bank and pleased to see that both NN Group and Voya are thriving as standalone companies. Today, I am delighted to announce the reinstatement of dividend payments on ordinary shares with a proposed cash dividend of EUR 0.12 per share.”
“In 2014, ING Bank welcomed over one million new customers and established half a million primary banking relationships. I am grateful for the loyalty of our customers and for the dedication of our employees to deliver a differentiating experience to our customers every day. Following the launch of ‘Think Forward’, our Chief Innovation Officer and Chief Operations Officer have been working together to deliver innovations and service improvements to our customers as quickly as possible. We have already introduced a steady stream of improvements during 2014, the most recent being biometrics technology in Belgium, and are excited about other new projects that will debut this year.”
“ING Bank posted a strong set of full-year 2014 results, despite some headwinds in the fourth quarter. Interest results were robust, risk costs approached normalised levels and our continued vigilance on costs was evident as we invested for the further digitalisation of our banking services in the Netherlands and extended our ongoing transformation programme within Commercial Banking. Our fourth-quarter result was dampened by redundancy provisions related to these actions, the annual Dutch bank tax and negative CVA/ DVA impacts which lowered the underlying result before tax to EUR 783 million. Excluding those items, the underlying result before tax was a strong EUR 1,376 million. ING Bank’s underlying net profit for the full-year 2014 was EUR 3,424 million, up 8.5% from 2013. The improvement was driven by higher interest results, disciplined expense control and lower risk costs, and despite negative CVA/DVA impacts. The full-year underlying return on IFRS-EU equity rose to 9.9% and ING Bank ended the year with a fully-loaded CET1 ratio of 11.4%.”
“Our efforts to support our customers and the economy contributed to strong commercial growth during 2014. The Bank grew net lending by EUR 14.7 billion in 2014, driven by robust growth in our core lending businesses and despite further reductions in the run- off portfolios. Net lending assets in the core businesses grew by EUR 18.5 billion in 2014, or 3.8%, which is in line with our strategy. Total net inflow of funds entrusted amounted to EUR 16.8 billion, demonstrating the strength of our deposit-gathering capabilities.”
“ING has started 2015 with a strong financial position and a clear focus on empowering our growing customer base through outstanding products and customer service. I am optimistic about the prospects for our bank and am confident that we are well positioned to build on our strategic momentum. We remain committed to reaching our Ambition 2017 targets and are pleased that we are able to begin returning capital to our shareholders. Our intention is to pay a minimum of 40% of ING Group’s annual net profits to shareholders, through dividends, with effect from 2015. Furthermore, at the end of each financial year, the Board will recommend whether to return additional capital to shareholders dependent on financial, strategic and regulatory considerations.”
|
Investor enquiries
|
Press enquiries
|
Table of contents
|
|||
|
T: +31 20 576 6396
|
T: +31 20 576 5000
|
Share information
|
2
|
||
|
Economic environment
|
3
|
||||
|
Consolidated results
|
4
|
||||
|
Investor conference call
|
Press conference
|
Segment reporting
|
9
|
||
|
11 February 2015 at 9:00 CET
|
11 February 2015 at 10:30 CET
|
Corporate Line
|
16
|
||
|
+31 20 794 8500 (NL)
|
Bijlmerplein 888, Amsterdam
|
Consolidated balance sheet
|
17
|
||
|
+44 20 7190 1537 (UK)
|
Or via Q&A at +31 20 531 5871 (NL)
|
Risk & Capital management
|
20
|
||
|
+1 480 629 9031 (US)
|
or +44 203 365 3210 (UK)
|
Business & Sustainability highlights
|
24
|
||
|
Live audio webcast at www.ing.com
|
Live audio webcast at www.ing.com
|
Appendix
|
25
|
SHARE INFORMATION
|
Financial calendar
|
Share information
|
||||||||||
| ● |
Publication of 2014 Annual Report ING Groep N.V.: Thursday, 19 March 2015
|
||||||||||
| ● |
Publication results 1Q2015: Thursday, 7 May 2015
|
4Q2014
|
3Q2014
|
2Q2014
|
1Q2014
|
||||||
| ● |
Annual General Meeting: Monday, 11 May 2015
|
Shares (in millions, end of period)
|
|||||||||
| ● |
Publication results 2Q2015: Wednesday, 5 August 2015
|
Total number of shares
|
3,858.9
|
3,858.5
|
3,858.1
|
3,843.8
|
|||||
| ● | Publication results 3Q2015: Wednesday, 4 November 2015 |
Treasury shares
|
4.3
|
2.0
|
7.7
|
4.2
|
|||||
| (These dates are provisional.) |
Shares outstanding
|
3,854.6
|
3,856.5
|
3,850.4
|
3,839.6
|
||||||
|
Average number of shares
|
3,856.2
|
3,854.5
|
3,850.1
|
3,837.4
|
|||||||
|
Listing information
|
Share price (in euros)
|
||||||||||
|
ING ordinary shares are registered shares with a par value of EUR 0.24 per share. The (depositary receipts for) ordinary shares of ING Group are listed on the exchanges of Amsterdam, Brussels and New York (NYSE).
|
End of period
|
10.83
|
11.31
|
10.26
|
10.00
|
||||||
|
High
|
11.78
|
11.95
|
10.83
|
10.93
|
|||||||
|
|
Tickers
|
Security codes
|
Low
|
10.07
|
9.60
|
9.44
|
9.63
|
||||
|
Stock exchanges
|
(Bloomberg, Reuters)
|
(ISIN, SEDOL1)
|
Net result per share (in euros)
|
0.30
|
0.24
|
0.28
|
-0.50
|
||||
|
Euronext Amsterdam
|
INGA NA, ING.AS
|
NL0000303600, 7154182
|
Shareholders' equity per share (end of period, in euros)
|
13.08
|
12.23
|
12.59
|
11.82
|
||||
|
New York Stock Exchange
|
ING US, ING.N
|
US4568371037, 2452643
|
Dividend per share (in euros)
|
0.12
|
n.a.
|
0
|
n.a.
|
||||
|
Price/earnings ratio 1)
|
33.8
|
62.8
|
n.a.
|
n.a.
|
|||||||
|
American Depositary Receipts (ADRs)
|
Price/book ratio
|
0.83
|
0.92
|
0.81
|
0.85
|
||||||
| For questions related to the ING ADR
program, please contact
|
J.P. Morgan Transfer Agent Service
Center
|
1) Four-quarter rolling average.
|
|||||||||
| J.P. Morgan Shareholder Services:
JPMorgan Chase Bank, N.A.
4 New York Plaza, Floor 12
New York, NY 1004
Attention: Depositary Receipts Group
Fax: (+1 212) 552-1950
In the U.S.: (866) JPM-ADRS
Outside the US.: +1 866 576-2377
|
ADR shareholders can contact: JPMorgan Chase Bank N.A.
P.O. Box 64504
St. Paul, MN 55164-0854
In the US: +1 800 990 1135
Outside the US: +1 651 453 2128
e-mail: [email protected]
|
 |
|||||||||
|
Or visit J.P. Morgan Depositary Receipts Services. Web: www.adr.com
|
|||||||||||
|
Note for editors
|
|||||||||||
|
For further information on ING, please visit www.ing.com. Frequent news updates can be found in the Newsroom or via the @ING_news Twitter feed. Photos of ING operations, buildings and its executives are available for download at Flickr. Footage (B-roll) of ING is available via videobankonline.com, or can be requested by emailing [email protected]. ING presentations are available at SlideShare. For convenient access to the latest financial information and press releases both online and offline, download the ING Group Investor Relations and Media app for iOS on the Apple Store or for Android on Google Play.
|
|||||||||||
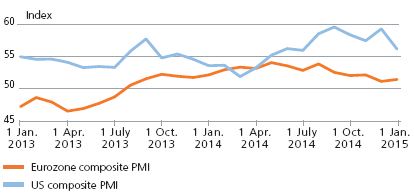
Relative share price performance
1 JANUARY 2014 TO 1 JANUARY 2015

| 2 | ING GROUP PRESS RELEASE 4Q2014 |
ECONOMIC ENVIRONMENT
|
ECONOMIC ACTIVITY
|
CURRENCY MARKETS
|
|
|
● On balance the composite purchasing managers’ index for the eurozone, weakened somewhat further during the fourth quarter. It still points to growth, albeit very slow growth.
● In the US, the composite PMI also slipped, but remained at levels consistent with reasonably strong economic growth.
● The PMIs are regarded as timely indicators of underlying trends in economic activity.
|
● The weakening trend in the euro’s exchange rate, which started in June (after the ECB cut interest rates and announced a series of TLTROs), extended into the fourth quarter as expectations of further ECB stimulus (i.e. quantitative easing) mounted and the US Federal Reserve hinted at the start of interest rate normalisation in 2015.
|
|
 |
 |
|
|
INTEREST RATES
|
CREDIT MARKETS
|
|
|
● The slope of the eurozone yield curve flattened sharply in the fourth quarter, as long-term yields tumbled on the back of weak growth, falling inflation and the anticipation of quantitative easing by the ECB. US long-term yields were also dragged lower, leading to a flatter US yield curve.
|
● Credit market sentiment in both the US and the eurozone was little changed in the fourth quarter of 2014. Credit spreads remain at subdued levels.
|
|
 |
 |
|
| STOCK MARKETS |
CONSUMER CONFIDENCE
|
|
|
● Equity indices resumed their upward trend in the fourth quarter, especially in the US. At the same time, however, equity markets also saw some bouts of volatility related to the sharp drop in oil prices and ongoing geopolitical tensions.
|
● Consumer confidence in the eurozone declined somewhat in the fourth quarter of 2014, but started to rise again at the end of the year. The sharp drop in oil prices is supporting consumer purchasing power.
|
|
 |
 |
| ING GROUP PRESS RELEASE 4Q2014 | 3 |
CONSOLIDATED RESULTS
|
Consolidated result
|
||||||||
|
4Q2014
|
4Q20131)
|
Change
|
3Q2014
|
Change
|
FY2014
|
FY20131)
|
Change
|
|
|
Profit and loss data (in EUR million)
|
||||||||
|
Interest result
|
3,208
|
2,946
|
8.9%
|
3,156
|
1.6%
|
12,376
|
11,804
|
4.8%
|
|
Commission income
|
556
|
562
|
-1.1%
|
579
|
-4.0%
|
2,290
|
2,244
|
2.0%
|
|
Investment income
|
25
|
64
|
-60.9%
|
37
|
-32.4%
|
206
|
319
|
-35.4%
|
|
Other income
|
-34
|
242
|
171
|
424
|
938
|
-54.8%
|
||
|
Total underlying income
|
3,756
|
3,815
|
-1.5%
|
3,942
|
-4.7%
|
15,296
|
15,305
|
-0.1%
|
|
Staff expenses
|
1,204
|
1,194
|
0.8%
|
1,194
|
0.8%
|
4,844
|
4,863
|
-0.4%
|
|
Other expenses
|
1,339
|
1,125
|
19.0%
|
921
|
45.4%
|
4,047
|
3,695
|
9.5%
|
|
Intangibles, amortisation and impairments
|
29
|
32
|
-9.4%
|
19
|
52.6%
|
88
|
136
|
-35.3%
|
|
Operating expenses
|
2,572
|
2,351
|
9.4%
|
2,134
|
20.5%
|
8,979
|
8,694
|
3.3%
|
|
Gross result
|
1,183
|
1,464
|
-19.2%
|
1,808
|
-34.6%
|
6,317
|
6,611
|
-4.4%
|
|
Addition to loan loss provision
|
400
|
560
|
-28.6%
|
322
|
24.2%
|
1,594
|
2,288
|
-30.3%
|
|
Underlying result before tax
|
783
|
904
|
-13.4%
|
1,486
|
-47.3%
|
4,724
|
4,323
|
9.3%
|
|
Taxation
|
215
|
199
|
8.0%
|
349
|
-38.4%
|
1,221
|
1,078
|
13.3%
|
|
Minority interests
|
20
|
19
|
5.3%
|
14
|
42.9%
|
79
|
90
|
-12.2%
|
|
Underlying net result
|
548
|
686
|
-20.1%
|
1,123
|
-51.2%
|
3,424
|
3,155
|
8.5%
|
|
Net gains/losses on divestments
|
202
|
-6
|
||||||
|
Net result from divested units
|
-37
|
|||||||
|
Special items after tax
|
-18
|
-19
|
-117
|
-1,021
|
-82
|
|||
|
Net result Banking
|
530
|
666
|
-20.4%
|
1,006
|
-47.3%
|
2,606
|
3,031
|
-14.0%
|
|
Net result Insurance Other
|
14
|
-26
|
43
|
107
|
117
|
|||
|
Net result IC elimination between ING Bank and NN Group
|
-12
|
-22
|
-3
|
-55
|
-97
|
|||
|
Net result from discontinued operations NN Group2)
|
226
|
-171
|
-159
|
65
|
455
|
|||
|
Net result from discontinued operations Voya Financial
|
418
|
179
|
41
|
-1,471
|
40
|
|||
|
Net result ING Group
|
1,176
|
626
|
87.7%
|
928
|
26.8%
|
1,251
|
3,545
|
-64.7%
|
|
Net result per share (in EUR)3)
|
0.30
|
0.16
|
87.5%
|
0.24
|
25.0%
|
0.32
|
0.93
|
-65.6%
|
|
Capital ratios (end of period)
|
||||||||
|
ING Group shareholders' equity (in EUR billion)
|
47
|
6.9%
|
50
|
46
|
9.7%
|
|||
|
ING Bank shareholders' equity (in EUR billion)
|
37
|
4.1%
|
38
|
33
|
16.2%
|
|||
|
ING Bank common equity Tier 1 ratio fully loaded
|
11.1%
|
11.4%
|
10.0%
|
|||||
|
ING Bank common equity Tier 1 phased in
|
11.2%
|
11.2%
|
11.7%
|
|||||
|
Client balances (end of period, in EUR billion)
|
||||||||
|
Residential Mortgages
|
276.4
|
-0.8%
|
274.3
|
272.7
|
0.6%
|
|||
|
Other Lending
|
230.8
|
0.4%
|
231.7
|
216.7
|
6.9%
|
|||
|
Funds Entrusted
|
483.3
|
-0.9%
|
479.1
|
465.0
|
3.0%
|
|||
|
AUM/Mutual Funds
|
64.8
|
1.4%
|
65.7
|
60.0
|
9.5%
|
|||
|
Profitability and efficiency
|
||||||||
|
Underlying interest margin Banking
|
1.53%
|
1.45%
|
1.53%
|
1.51%
|
1.42%
|
|||
|
Underlying cost/income ratio Banking
|
68.5%
|
61.6%
|
54.1%
|
58.7%
|
56.8%
|
|||
|
Underlying return on equity based on IFRS-EU equity ING Bank4)
|
5.9%
|
8.1%
|
12.7%
|
9.9%
|
9.0%
|
|||
|
Employees ING Bank (FTEs, end of period)
|
52,854
|
0.1%
|
52,898
|
63,805
|
-17.1%
|
|||
|
Risk
|
||||||||
|
Non-performing loans/total loans (end of period)
|
2.8%
|
3.0%
|
2.8%
|
|||||
|
Stock of provisions/provisioned loans (end of period)
|
38.5%
|
35.5%
|
38.6%
|
|||||
|
Underlying risk costs in bps of average RWA
|
54
|
81
|
44
|
55
|
83
|
|||
|
Risk-weighted assets ING Bank (end of period, in EUR billion)
|
294.9
|
0.5%
|
296.3
|
282.5
|
4.9%
|
|||
1) The figures of this period have been restated to reflect the classification of NN Group as Held for sale/Discontinued operations.
2) The 4Q2014 net result from discontinued operations NN Group includes EUR 82 million reversal of impairments.
3) Result per share differs from IFRS earnings per share in respect of attributions to the core Tier 1 securities.
4) Annualised underlying net result divided by average IFRS-EU shareholders’ equity of ING Bank N.V.
Note: Underlying figures are non-GAAP measures. These are derived from figures according to IFRS-EU by excluding impact from divestments, special items, Insurance Other, intercompany eliminations between ING Bank and NN Group, and discontinued operations.
| 4 | ING GROUP PRESS RELEASE 4Q2014 |
CONSOLIDATED RESULTS
|
ING Bank posted a strong set of full-year 2014 results. Higher interest results, strict cost control and lower risk costs drove the underlying net profit to EUR 3,424 million, or 8.5% higher than in 2013. This strong performance was achieved despite EUR 273 million of negative CVA/DVA impacts in 2014, and EUR 375 million of redundancy provisions recorded in the fourth quarter which related principally to the further digitalisation of our banking services in the Netherlands. Including the net result of the legacy Insurance businesses, the 2014 net result of ING Group was EUR 1,251 million. In the fourth quarter, ING Bank recorded robust interest results and continued to be vigilant about expenses. The fourth-quarter result before tax was EUR 783 million, and included negative CVA/ DVA impacts, redundancy provisions and the annual Dutch bank tax. The fourth-quarter net result of ING Group was EUR 1,176 million, supported by the profit on the sale of Voya shares in November 2014 and the strong net result of NN Group.
Banking
ING Bank’s fourth-quarter underlying result before tax of EUR 783 million was good on the back of steady growth in the interest result. However, credit and debt valuation adjustments (CVA/ DVA), reported within Commercial Banking and the Corporate Line, amounted to EUR -80 million for the quarter, against EUR-17 million in the fourth quarter of 2013 and EUR -69 million in the previous quarter. Furthermore, the fourth quarter included a redundancy provision of EUR 375 million, which was mainly related to measures to further expand digital banking in the Netherlands and to enhance operational excellence, as well as measures to accelerate the transformation programme in Commercial Banking. Restructuring costs were EUR 76 million in the fourth quarter of 2013 and EUR 24 million in the previous quarter. Finally, the annual Dutch bank tax, which was paid in full in the fourth quarter, was EUR 138 million for 2014 and EUR 149 million for 2013. Excluding these factors, the underlying result before tax was EUR 1,376 million in the fourth quarter, up 20.1% from the same quarter of 2013, reflecting higher net interest income, lower expenses and lower risk costs. On a like-for-like basis, the pre-tax result was down 12.9% from the previous quarter due to lower income, reflecting seasonality in Financial Markets and a decline in income at Bank Treasury, as well as higher risk costs, which were positively affected in the third quarter by the release on a large file in Commercial Banking.
Customers
In 2014, ING Bank welcomed over one million new customers and established half a million primary banking relationships. Commercial momentum was solid as we continued to support customers’ financial needs throughout the year. The net inflow of funds entrusted was EUR 16.8 billion in 2014, including a
|
reduction in Commercial Banking. In Retail Banking, net funds entrusted increased by EUR 19.2 billion. Net lending assets grew by EUR 14.7 billion in 2014, driven by strong growth in our core lending businesses, partly offset by reductions in the run- off portfolios of WUB and Lease. Net lending assets in the core businesses grew by EUR 18.5 billion, or 3.8%, in 2014. There was strong growth in Retail Banking outside the Netherlands and in Structured Finance and Transaction Services at Commercial Banking. Net lending assets in the core businesses of Retail Netherlands declined due to higher prepayments of Dutch mortgages and a reduction in business lending.
Total underlying income
Total underlying income was robust at EUR 3,756 million, down only 1.5% year-on-year. The decline was primarily due to EUR 80 million of negative CVA/DVA impacts recorded in Commercial Banking and the Corporate Line versus EUR -17 million of CVA/ DVA impacts in the fourth quarter of 2013. Furthermore, the fourth quarter of 2013 included a EUR 99 million positive one- off result on the unwinding of the IABF and EUR 68 million of income from ING Vysya Bank when it was still fully consolidated. Excluding these items, underlying income rose 4.6%, mainly attributable to Retail Banking. Compared with the previous quarter, which included EUR 69 million of negative CVA/DVA impacts, total underlying income declined 4.7%, mainly due to seasonally lower income at Financial Markets and a decline in Bank Treasury.
The ongoing political and economic turmoil affected fourth-quarter business growth in some specific regions and products. Total net lending decreased by EUR 1.0 billion (adjusted for currency impacts, the sale of a mortgage portfolio in Australia and additional transfers of WUB mortgages to NN Bank). The net production of residential mortgages was EUR -0.2 billion due to declines in the Netherlands and in Germany, more than offsetting the growth in most other countries. Other lending declined by EUR 0.9 billion. Retail Netherlands reported a decline in other lending due to low demand in business lending, while in Commercial Banking the decline was mainly caused by decreases in short-term products (such as Trade Finance Services and Trade & Commodity Finance), the run-off of the lease portfolio and a further reduction in Russian exposures. Net growth in other lending in Retail Banking outside of the Netherlands and in Industry Lending within Commercial Banking was not high enough to offset these declines.
Funds entrusted (adjusted for currency impacts) recorded a net outflow of EUR 3.1 billion in the fourth quarter of 2014, following EUR 5.3 billion of reductions in Commercial Banking, which were mainly due to lower deposits from asset managers and corporate treasuries at year-end. In Retail Banking, net funds entrusted rose by EUR 2.2 billion, as net outflows in the Benelux were more than offset by growth in Germany and Rest of World.
The underlying interest result rose 8.9% to EUR 3,208 million year-on-year. Excluding the deconsolidation impact of ING Vysya Bank, the increase was 10.9%. The interest result on customer lending activities rose primarily due to higher margins on
|
| ING GROUP PRESS RELEASE 4Q2014 | 5 |
CONSOLIDATED RESULTS
|
mortgages and higher volumes on other lending. The interest result on funds entrusted also improved due to growth in volumes and higher margins on savings. However, the margin on current accounts declined year-on-year.
Compared with the third quarter of 2014, the underlying interest result increased 1.6%. This was mainly attributable to higher interest results on customer lending, which were partly offset by a decline in Financial Markets. The fourth-quarter underlying interest margin of ING Bank was 1.53%, which was stable compared with the previous quarter (but up eight basis points year-on-year). The interest margin on total lending activities improved, driven by higher margins on mortgages in the Benelux and higher margins in Industry Lending. Although ING reduced client savings rates in several countries, the margin on funds entrusted decreased slightly in the quarter due to continued margin pressure on savings and current accounts caused by the low interest rate environment.
 Commission income declined 1.1% from the fourth quarter of 2013 to EUR 556 million, which was mainly due to the deconsolidation impact of ING Vysya Bank. This was largely offset by higher commission income in Retail Belgium and Retail Germany. On a sequential basis, commission income dropped 4.0%, mainly due to lower fees in Retail International.
Investment income declined to EUR 25 million from EUR 64 million in the fourth quarter of 2013. This was mainly due to lower net realised gains on bonds and equities, lower dividend income and lower income from real estate investments. Compared with the third quarter of 2014, which included the EUR 22 million annual dividend from Bank of Beijing, investment income dropped by EUR 11 million.
Other income fell to EUR -34 million from EUR 242 million in the fourth quarter of 2013. The decline was partly caused by negative CVA/DVA impacts (EUR -80 million in the fourth quarter of 2014 versus EUR -17 million in the previous year) and the EUR 99 million one-off result on the unwinding of the IABF in the fourth quarter of 2013. Excluding both impacts, other income dropped by EUR 114 million year-on-year due to higher negative valuation results on non-trading derivatives. Other income fell by EUR 205 million compared with the third quarter of 2014, which included EUR -69 million of CVA/DVA impacts. The decline was mainly caused by lower net trading results and higher negative valuation results.
|
Operating expenses
Underlying operating expenses rose 9.4% year-on-year to EUR 2,572 million. The increase was primarily due to three provisions recorded in the current quarter: EUR 325 million of redundancy provisions following ING’s November 2014 announcement that it is taking the next steps in digital banking in the Netherlands; EUR 39 million of repositioning costs at Commercial Banking to support the further optimisation of ING’s international network; and EUR 11 million of costs for further restructuring at WUB. By comparison, the fourth quarter of 2013 included EUR 76 million of additional restructuring costs in Retail Netherlands.
Excluding the impact of the aforementioned provisions and the deconsolidation impact of ING Vysya Bank, operating expenses were 1.9% lower year-on-year. The decline was mainly attributable to the benefits of the ongoing cost-savings initiatives and a large release from deposit guarantee scheme (DGS) related provisions booked in the Corporate Line, which more than offset higher pension costs in the Netherlands and additional investments in Retail International and Industry Lending to support business growth.
Compared with the third quarter of 2014, expenses increased 20.5%. Excluding redundancy provisions (EUR 375 million in the fourth quarter and EUR 24 million in the third quarter of 2014), expenses rose by EUR 87 million, or 4.1%. This was fully attributable to the annual Dutch bank tax of EUR 138 million, which was paid in the fourth quarter. The fourth-quarter underlying cost/income ratio for ING Bank was 68.5%, up from 61.6% a year ago. The full-year 2014 underlying cost/income ratio rose to 58.7% from 56.8% in 2013. However, excluding CVA/DVA impacts and the redundancy/restructuring provisions in both years, the cost/income ratio improved to 55.1% from 56.2% in 2013.
 The current cost-savings programmes at ING Bank, including the additional measures taken in the fourth quarter of 2014, are expected to reduce total annual expenses by EUR 1.2 billion by 2017 and by EUR 1.3 billion by 2018. Of these targeted amounts, EUR 662 million of savings have already been achieved. Total headcount reductions related to these initiatives are estimated at 9,540 FTEs, of which 5,677 FTEs have already left ING Bank since the start of the programmes.
The total number of internal staff rose slightly to 52,898 FTEs at year-end. This is 44 FTEs higher than at the end of September 2014 and due to growth outside the Benelux. The strong decline versus year-end 2013 was for 11,105 FTEs caused by the deconsolidation of ING Vysya Bank.
|
| 6 | ING GROUP PRESS RELEASE 4Q2014 |
CONSOLIDATED RESULTS
|
Loan loss provisions
ING Bank added EUR 400 million to the provision for loan losses in the fourth quarter, down from EUR 560 million a year ago and also lower than in the first two quarters of 2014, but up from EUR 322 million in the previous quarter. The sequential increase was attributable to Commercial Banking, where General Lending was positively affected by a release on a large file in the third quarter. Higher risk costs were also visible in Industry Lending, due to some larger files in Structured Finance, and there was a modest increase at Real Estate Finance after two quarters of negligible risk costs. Net additions in Retail Benelux declined on both comparable quarters. This was mainly attributable to a further decline of risk costs for Dutch mortgages to EUR 41 million in this quarter, next to lower risk costs for business lending in both countries. At Retail International, net additions were slightly higher than in the previous quarter, but they were lower than a year ago, supported by the deconsolidation of ING Vysya Bank. Total NPLs at ING Bank rose to EUR 16.9 billion from EUR 15.7 billion at the end of September 2014, mainly due to alignment with EBA rules on forbearance. The NPL ratio increased to 3.0% of total credit outstandings compared with 2.8% at the end of the third quarter.
Total risk costs were 54 basis points of average risk-weighted assets versus 44 basis points in the previous quarter and 81 basis points in the fourth quarter of 2013. Most businesses, with the exception of Retail Netherlands, are now operating at around a normalised level of risk costs as the overall economic environment gradually improves.
 Underlying result before tax
The fourth-quarter 2014 underlying result before tax was EUR 783 million, a decline of 13.4% compared with the same quarter of 2013. However, excluding the redundancy provisions, CVA/DVA impacts and the Dutch bank tax, the underlying result before tax jumped 20.1%.
On a sequential basis, the underlying result before tax fell 47.3%. This was next to the redundancy provisions, mainly caused by the annual Dutch bank tax, which was paid in the fourth quarter, combined with lower income and higher risk costs in Commercial Banking.
|
 Net result Banking
ING Bank’s underlying net result fell to EUR 548 million from EUR 686 million in the fourth quarter of 2013 and EUR 1,123 million in the third quarter of 2014. The effective underlying tax rate was 27.5% compared with 22.0% in the fourth quarter of 2013 and 23.5% in the previous quarter.
ING Bank’s fourth-quarter net result was EUR 530 million, including EUR -18 million of special items after tax, which were fully related to the restructuring programmes in Retail Netherlands announced before 2013.
The full-year 2014 underlying return on IFRS-EU equity rose to 9.9% from 9.0% in 2013. Excluding the redundancy provisions, the full-year 2014 underlying return would have been 10.7%. The improvement was driven by higher underlying results combined with a modest decline in the average equity base. The decline in the average equity base was caused by dividend payments to ING Group throughout both years and the write-down in the net pension asset in the first quarter of 2014. The Ambition 2017 target range for return on IFRS-EU equity is 10-13%.
 Net result ING Group
ING Group’s fourth-quarter net result was EUR 1,176 million, compared with EUR 626 million in the fourth quarter of 2013 and EUR 928 million in the third quarter of 2014. These figures include the net results of the legacy Insurance businesses.
 |
| ING GROUP PRESS RELEASE 4Q2014 | 7 |
CONSOLIDATED RESULTS
|
For the fourth quarter of 2014, ING Group recorded a net result from the discontinued operations of NN Group of EUR 226 million, compared with EUR -171 million one year earlier and EUR -159 million in the third quarter of 2014. The fourth-quarter 2014 result represents ING’s 68.1% stake in NN Group’s net result of EUR 197 million. The fourth-quarter 2014 net result from the discontinued operations of NN Group also includes a EUR 82 million gain on the partial reversal of the EUR 333 million write- down in the third quarter of 2014 for certain other non-current assets, as NN Group divested some of these assets in the fourth quarter.
In November 2014, ING sold 34.5 million shares of common stock in Voya Financial, Inc., reducing ING’s stake in Voya from 32.5% to approximately 19%. As a result, ING lost significant influence on Voya and will account for its stake in Voya as an available-for-sale investment going forward. The financial impact of the November transaction is reflected in the EUR 418 million net result from discontinued operations of Voya. It reflects the difference between the EUR 2.1 billion book value of ING’s 32.5% investment in Voya (which equals the market value at the date of deconsolidation on 25 March 2014) and the market value of this stake at the time of the transaction.
ING Group’s net profit per share was EUR 0.30 for the fourth quarter of 2014 and EUR 0.32 for the full year 2014.
Dividend
As stated in our Ambition 2017 targets, ING is committed to returning capital to shareholders through a sustainable dividend policy. Effective from 2015, ING intends to pay a minimum of 40% of ING Group’s annual net profits by way of dividend, consisting of both an interim and a final dividend.
Furthermore, the Board will recommend whether to return additional capital to shareholders at the end of each financial year. Such decisions will reflect considerations including expected future capital requirements, growth opportunities available to the Group, the net earnings of the Group, and regulatory approvals as appropriate.
The Board proposes to pay a final 2014 dividend of EUR 470 million, or EUR 0.12 per (depositary receipt for an) ordinary share, subject to the approval of shareholders at the Annual General Meeting in May 2015.
|
| 8 | ING GROUP PRESS RELEASE 4Q2014 |
|
Retail Banking: Consolidated profit and loss account
|
||||||||||
|
Total Retail Banking
|
Retail Benelux | Retail International | ||||||||
|
Netherlands
|
Belgium
|
Germany
|
Rest of World
|
|||||||
| In EUR million |
4Q2014
|
4Q2013
|
4Q2014
|
4Q2013
|
4Q2014
|
4Q2013
|
4Q2014
|
4Q2013
|
4Q2014
|
4Q2013
|
|
Profit & loss
|
||||||||||
|
Interest result
|
2,341
|
2,205
|
980
|
930
|
495
|
479
|
390
|
357
|
477
|
439
|
|
Commission income
|
318
|
319
|
119
|
116
|
94
|
80
|
44
|
32
|
61
|
91
|
|
Investment income
|
5
|
11
|
0
|
0
|
3
|
1
|
0
|
0
|
2
|
10
|
|
Other income
|
27
|
24
|
-15
|
-3
|
21
|
27
|
-23
|
-11
|
45
|
11
|
|
Total underlying income
|
2,691
|
2,559
|
1,084
|
1,043
|
613
|
587
|
411
|
378
|
584
|
551
|
|
Staff and other expenses
|
1,861
|
1,632
|
928
|
669
|
360
|
386
|
197
|
179
|
376
|
398
|
|
Intangibles amortisation and impairments
|
12
|
2
|
4
|
0
|
0
|
-1
|
0
|
0
|
8
|
2
|
|
Operating expenses
|
1,873
|
1,633
|
932
|
669
|
359
|
386
|
197
|
179
|
385
|
400
|
|
Gross result
|
818
|
926
|
152
|
374
|
254
|
202
|
214
|
199
|
199
|
151
|
|
Addition to loan loss provision
|
248
|
384
|
165
|
234
|
18
|
70
|
16
|
25
|
50
|
54
|
|
Underlying result before tax
|
570
|
542
|
-13
|
140
|
236
|
131
|
198
|
174
|
149
|
97
|
|
Client balances (in EUR billion)1)
|
||||||||||
|
Residential Mortgages
|
274.3
|
272.7
|
129.3
|
132.7
|
32.8
|
30.9
|
63.2
|
62.1
|
49.0
|
46.9
|
|
Other Lending
|
96.0
|
94.3
|
34.8
|
36.3
|
37.1
|
34.0
|
5.0
|
4.4
|
19.0
|
19.6
|
|
Funds Entrusted
|
405.6
|
389.4
|
113.8
|
112.1
|
82.2
|
78.3
|
113.5
|
105.9
|
96.1
|
93.0
|
|
AUM/Mutual Funds
|
65.5
|
59.9
|
19.7
|
17.7
|
27.4
|
26.9
|
7.7
|
6.8
|
10.6
|
8.5
|
|
Profitability and efficiency1)
|
||||||||||
|
Cost/income ratio
|
69.6%
|
63.8%
|
86.0%
|
64.1%
|
58.6%
|
65.7%
|
47.9%
|
47.3%
|
65.9%
|
72.6%
|
|
Return on equity based on 10.0% common equity Tier 12)
|
10.2%
|
10.3%
|
-1.2%
|
6.2%
|
27.5%
|
16.8%
|
21.6%
|
20.5%
|
9.2%
|
7.2%
|
|
Risk1)
|
||||||||||
|
Risk costs in bps of average RWA
|
65
|
105
|
111
|
155
|
28
|
129
|
26
|
43
|
46
|
52
|
|
Risk-weighted assets (end of period)
|
154,467
|
152,134
|
59,821
|
64,354
|
26,515
|
23,338
|
24,542
|
23,756
|
43,588
|
40,685
|
|
1)
|
Key figures based on underlying figures.
|
|
2)
|
Underlying after-tax return divided by average equity based on 10.0% common equity Tier 1 ratio (annualised).
|
|
Retail Banking posted strong full-year 2014 results. The underlying profit before tax rose by 23.5% to EUR 3,158 million on the back of healthy business growth and substantially lower risk costs in most markets. In the fourth quarter, the underlying result before tax was EUR 570 million (or EUR 895 million, excluding EUR 325 million of redundancy provisions mainly related to taking the next steps in digital banking in the Netherlands). The result for the quarter improved strongly versus a year ago, increasing 44.8% excluding redundancy provisions. Compared to the previous quarter, the like-for-like result declined by EUR 75 million (or 7.7%), mainly due to the annual Dutch bank tax, which was booked fully in the fourth quarter, and higher IT investments. Retail Banking attracted EUR 2.2 billion of funds entrusted in the fourth quarter; net lending grew by EUR 0.9 billion.
 |
Underlying income in the fourth quarter rose 5.2% from a year ago to EUR 2,691 million. The increase was driven by higher interest results in most countries due to higher volumes and improved margins on lending and savings. Compared with the third quarter of 2014, income declined 1.7% as slightly higher interest results were more than offset by lower fee income, negative hedge ineffectiveness and lower dividends. Net funds entrusted grew by EUR 2.2 billion in the fourth quarter, despite outflows in the Netherlands and Belgium. Net lending increased by EUR 0.9 billion as continued growth in Belgium and Rest of World outpaced declines in the Netherlands and Germany.
Operating expenses rose 14.7% from the fourth quarter of 2013 to EUR 1,873 million; this included EUR 325 million of redundancy provisions versus EUR 76 million a year ago. Excluding these provisions, expenses were 0.6% lower year-on- year, supported by the deconsolidation of ING Vysya Bank and the cost-savings initiatives. Compared with the previous quarter, like-for-like expenses were EUR 68 million higher, mainly due to the annual Dutch bank tax and higher IT investments.
Risks costs were EUR 248 million, down 35.4% from a year ago, and 13.6% lower than in the third quarter. The sequential decline was mainly in the Benelux due to a model refinement in Belgium and lower risk costs for Dutch mortgages.
The underlying return on equity based on a 10% common equity Tier 1 ratio was 10.2% in the fourth quarter, compared with 10.3% a year ago. On a full-year basis, the return on equity rose to 15.0% from 12.9% in 2013.
|
| ING GROUP PRESS RELEASE 4Q2014 | 9 |
SEGMENT REPORTING: RETAIL BANKING
|
RETAIL NETHERLANDS
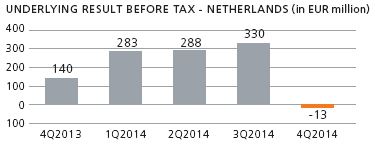 Retail Netherlands recorded a EUR 13 million pre-tax loss in the fourth quarter, due to EUR 314 million of redundancy provisions to take the next step in digital banking in the Netherlands (as announced on 25 November 2014) and EUR 11 million for further restructuring at WUB (related to outsourcing of back- office activities). Excluding these provisions, the underlying result before tax was EUR 312 million, up from EUR 216 million a year ago when excluding the EUR 76 million additional restructuring provision taken in that quarter. The improvement compared with a year ago was attributable to higher interest margins and lower risk costs. Compared with the third quarter of 2014, which included a provision of EUR 24 million for additional redundancies, the result before tax declined, mainly due to the annual Dutch bank tax of EUR 33 million which was paid in full in the fourth quarter.
Total underlying income rose 3.9% from a year ago to EUR 1,084 million. This increase mainly reflects higher interest margins on lending and savings, which more than offset a decline in net lending assets. The decrease in lending was primarily due to lower mortgage volumes. Compared with the previous quarter, income increased slightly by EUR 3 million due to higher margins on mortgages and savings, which were mostly offset by lower volumes. The margin improvement on savings was supported by client rate reductions in both quarters. The mortgage portfolio declined by EUR 1.5 billion, of which EUR 0.2 billion was caused by additional transfers of WUB mortgages to NN Bank and EUR 0.5 billion to the continuing run-off of the WUB portfolio. Part of the decline was also caused by higher redemptions. Other lending, mainly business lending, decreased by EUR 1.2 billion following low business demand. Funds entrusted recorded a net outflow of EUR 1.6 billion, partly related to higher mortgage repayments.
Operating expenses were EUR 932 million in the fourth quarter of 2014. However, excluding the aforementioned redundancy provisions, operating expenses were EUR 607 million, up by only EUR 14 million from a year ago. This increase was mainly due to higher pension costs and increased IT investments, which were only partly offset by the impact of cost-containment initiatives. Compared with the previous quarter, operating expenses excluding the redundancy provisions rose by EUR 60 million. This increase was mainly caused by the annual Dutch bank tax of EUR 33 million, the seasonal impact of the holiday provision, and higher IT investments. The cost-efficiency programmes, including the next steps in digital banking, remain on track to realise EUR 675 million of annual cost savings by the end of 2017. Of this amount, EUR 354 million has already been realised.
|
Risk costs declined to EUR 165 million from EUR 234 million in the fourth quarter of 2013 due to lower net additions in both mortgages and business lending. Compared with the previous mortgages declined to EUR 41 million from EUR 62 million in the third quarter of 2014. The net additions for business lending decreased to EUR 96 million from EUR 104 million; this was partly offset by higher risk costs in consumer lending.
Risk-weighted assets increased by EUR 0.5 billion in the fourth quarter to EUR 59.8 billion.
RETAIL BELGIUM
 Retail Belgium delivered another strong underlying fourth-quarter result. The result before tax rose to EUR 236 million from EUR 131 million in the fourth quarter of 2013, reflecting lower risk costs, volume growth in most products and lower expenses. The cost/ income ratio improved by more than seven percentage points to 58.6%. Compared with the third quarter of 2014, the result before tax rose 12.9%, almost entirely caused by lower risk costs.
Total underlying income rose 4.4% from a year ago to EUR 613 million. This increase was mainly due to higher interest results following volume growth in most products, as well as higher management fees. Compared with the previous quarter, income increased marginally by 0.2% as higher margins on mortgages and increased average volumes in current accounts compensated for margin pressure on savings and current accounts. Net lending assets rose by EUR 2.3 billion in the fourth quarter, mainly in non- mortgage lending, while funds entrusted recorded a small outflow of EUR 0.6 billion.
Operating expenses declined by EUR 27 million, or 7.0%, to EUR 359 million compared with the previous year. The decline was partly due to the absence of Belgian bank taxes in the fourth quarter of 2014, whereas the fourth quarter of 2013 included a EUR 11 million charge. The remaining decline is mainly due to lower headcount in the Retail branch network, partly offset by increased IT costs. Compared with the previous quarter, expenses remained flat. The strategic projects announced by ING Belgium remain on track to realise EUR 160 million of cost savings by the end of 2017. Of this amount, savings of EUR 105 million have already been realised.
Risk costs were EUR 18 million, down from EUR 70 million a year ago and EUR 44 million in the previous quarter. The decrease on both comparable quarters was mainly caused by a model
|
| 10 | ING GROUP PRESS RELEASE 4Q2014 |
SEGMENT REPORTING: RETAIL BANKING
|
refinement, which resulted in lower risk costs for business lending and consumer lending. The net addition for mortgages rose to EUR 19 million from EUR 5 million in the previous quarter.
Risk-weighted assets increased by EUR 2.7 billion in the fourth quarter to EUR 26.5 billion. This was mainly caused by lower expected recovery rates in all portfolios and a higher probability of default in the SME portfolio.
RETAIL GERMANY
 Retail Germany continued its strong performance with a fourth- quarter 2014 underlying result before tax of EUR 198 million, up from EUR 174 million in the fourth quarter of 2013. The improvement was driven by higher income, mainly reflecting volume growth, and lower risk costs. This was partly offset by higher expenses to support business growth strategies. The cost/ income ratio was 47.9%. Compared with the third quarter of 2014, the result before tax declined 7.0%, mainly due to lower margins on savings and partly offset by lower expenses and risk costs.
Total underlying income was EUR 411 million, up 8.7% from the fourth quarter of 2013. The increase primarily reflects higher interest results from increased lending and savings balances, while the margin was flat compared with a year ago. Higher commission income, mainly caused by more security brokerage transactions, was offset by increased negative hedge ineffectiveness results. Compared with the third quarter of 2014, income was 5.3% lower; this was primarily due to lower margins on savings stemming from the current interest rate environment. Funds entrusted grew by EUR 2.0 billion in the fourth quarter. Retail lending decreased by EUR 0.4 billion, of which EUR 0.5 billion was in residential mortgages, while consumer lending rose by EUR 0.1 billion.
Operating expenses were EUR 197 million, up 10.1% from the fourth quarter of 2013, reflecting an increase in headcount at both ING-DiBa and Interhyp, as well as investments to support business growth and attract primary banking clients. Compared with the previous quarter, expenses were 2.5% lower, mainly due to seasonality in marketing.
Risk costs were EUR 16 million, down from EUR 25 million in the fourth quarter of 2013 and EUR 19 million in the previous quarter, reflecting better performance in the mortgage book (mainly lower observed LGDs). Risk costs in the fourth quarter of 2014 were 26 basis points of average RWA.
|
Risk-weighted assets decreased by EUR 1.5 billion in the fourth quarter to EUR 24.5 billion, mainly reflecting model updates in the investment book and a reduction in operational RWA.
RETAIL REST OF WORLD
 The underlying result before tax of Retail Rest of World rose to EUR 149 million from EUR 97 million in the fourth quarter of 2013. The higher result largely reflects better commercial results in Romania, Italy, France and Poland; a one-off gain on the sale of a white label mortgage portfolio in Australia; and lower losses in the UK Legacy run-off portfolio. These effects were partly offset by lower results in Turkey and Spain. Compared with the third quarter of 2014, which included a dividend from Bank of Beijing (of EUR 22 million) and ING’s share in the net profit of ING Vysya Bank (EUR 9 million versus nil this quarter following its reclassification to assets held-for-sale), the result before tax declined by EUR 45 million.
Underlying income rose 6.0% to EUR 584 million compared with a year ago. The improvement was driven by higher interest margins and higher volumes in most countries, a higher result from ING Bank’s stake in TMB, lower losses in the UK legacy run-off portfolio and a EUR 17 million gain on the sale of a mortgage portfolio in Australia. Excluding the deconsolidation of ING Vysya Bank, underlying income grew 17.1%. Compared with the third quarter of 2014, income declined by EUR 27 million, caused by the annual Bank of Beijing dividend being received in the previous quarter and no result from ING’s share in ING Vysya Bank as a result of the reclassification to assets held- for-sale. Lower income in Turkey, Poland and Italy was offset by the gain on the sale of the mortgage portfolio in Australia. Net funds entrusted grew by EUR 2.3 billion in the fourth quarter, mainly driven by Poland, Spain and Australia. Net lending assets (adjusted for currency impacts and the sale of the mortgage portfolio) rose by EUR 1.4 billion, with growth concentrated in Australia, Poland and Turkey.
Operating expenses decreased by EUR 15 million from a year ago to EUR 385 million. Excluding the deconsolidation of ING Vysya Bank, expenses increased 6.1%, mainly due to investments in strategic initiatives and higher marketing costs. Compared with the third quarter of 2014, operating expenses rose by EUR 13 million, mainly owing to EUR 6 million of allocated annual Dutch bank tax, higher marketing expenses and higher costs in Turkey.
Risk costs were EUR 50 million against EUR 54 million in the fourth quarter of 2013, which included EUR 16 million for ING
|
| ING GROUP PRESS RELEASE 4Q2014 | 11 |
SEGMENT REPORTING: RETAIL BANKING
|
Vysya Bank and lower risk costs in Turkey due to releases in that quarter. Compared with the previous quarter, risk costs were EUR 6 million higher, mainly due to higher provisioning in Turkey. Total fourth-quarter risk costs were 46 basis points of average RWA, down from 52 basis points a year ago, but up from 42 basis points in the third quarter of 2014.
Risk-weighted assets increased in the fourth quarter by EUR 0.8 billion to EUR 43.6 billion, mainly due to business growth and increases in the market value of the strategic Asian bank stakes.
|
| 12 | ING GROUP PRESS RELEASE 4Q2014 |
SEGMENT REPORTING: COMMERCIAL BANKING
|
Commercial Banking: Consolidated profit and loss account
|
||||||||||
|
Total Commercial
Banking
|
Industry
Lending
|
General Lending &
Transaction Services
|
Financial Markets
|
Bank Treasury,
Real Estate & Other
|
||||||
|
In EUR million
|
4Q2014
|
4Q2013
|
4Q2014
|
4Q2013
|
4Q2014
|
4Q2013
|
4Q2014
|
4Q2013
|
4Q2014
|
4Q2013
|
|
Profit & loss
|
|
|
||||||||
|
Interest result
|
900
|
748
|
426
|
372
|
242
|
236
|
195
|
75
|
37
|
66
|
|
Commission income
|
239
|
245
|
135
|
127
|
85
|
93
|
19
|
26
|
0
|
-1
|
|
Investment income
|
21
|
54
|
-7
|
25
|
0
|
0
|
6
|
3
|
21
|
25
|
|
Other income excl. CVA/DVA
|
25
|
146
|
-15
|
-15
|
15
|
4
|
24
|
145
|
2
|
12
|
|
Underlying income excl. CVA/DVA
|
1,185
|
1,192
|
539
|
509
|
342
|
332
|
244
|
250
|
60
|
101
|
|
Other income - DVA on structured notes
|
1
|
-14
|
1
|
-14
|
||||||
|
Other income - CVA/DVA on derivatives
|
-73
|
23
|
-73
|
23
|
||||||
|
Total underlying income
|
1,113
|
1,201
|
539
|
509
|
342
|
332
|
172
|
258
|
60
|
101
|
|
Staff and other expenses
|
700
|
630
|
149
|
140
|
193
|
202
|
249
|
233
|
110
|
56
|
|
Intangibles amortisation and impairments
|
16
|
24
|
2
|
0
|
0
|
0
|
0
|
0
|
14
|
25
|
|
Operating expenses
|
716
|
654
|
151
|
139
|
193
|
202
|
249
|
233
|
124
|
80
|
|
Gross result
|
397
|
547
|
388
|
369
|
148
|
131
|
-76
|
26
|
-63
|
21
|
|
Addition to loan loss provision
|
152
|
177
|
122
|
102
|
8
|
47
|
-1
|
0
|
23
|
27
|
|
Underlying result before tax
|
245
|
370
|
266
|
267
|
141
|
84
|
-76
|
26
|
-86
|
-7
|
| Client balances (in EUR billion)1) | ||||||||||
|
Residential Mortgages
|
135.8
|
122.5
|
82.8
|
72.3
|
44.0
|
39.7
|
2.0
|
2.0
|
7.0
|
8.4
|
|
Other Lending
|
||||||||||
|
Funds Entrusted
|
73.5
|
75.6
|
1.3
|
0.7
|
41.7
|
36.2
|
4.7
|
3.9
|
25.8
|
34.8
|
|
AUM/Mutual Funds
|
0.2
|
0.2
|
0.0
|
0.0
|
0.0
|
0.0
|
0.0
|
0.0
|
0.2
|
0.2
|
|
Profitability and efficiency1)
|
||||||||||
|
Cost/income ratio
|
64.3%
|
54.5%
|
28.0%
|
27.4%
|
56.6%
|
60.6%
|
144.3%
|
90.1%
|
204.9%
|
79.5%
|
|
Return on equity based on 10.0% common equity Tier 1 2)
|
5.3%
|
8.5%
|
17.0%
|
16.5%
|
12.3%
|
7.2%
|
-7.3%
|
2.4%
|
-20.4%
|
-5.4%
|
|
Risk1)
|
||||||||||
|
Risk costs in bps of average RWA
|
44
|
56
|
96
|
80
|
8
|
55
|
-1
|
0
|
62
|
71
|
|
Risk-weighted assets (end of period)
|
137,976
|
127,165
|
51,161
|
50,356
|
36,803
|
34,374
|
36,793
|
26,114
|
13,219
|
16,321
|
|
1)
|
Key figures based on underlying figures.
|
|
2)
|
Underlying after-tax return divided by average equity based on 10.0% common equity Tier 1 ratio (annualised).
|
|
Commercial Banking posted a good set of full-year 2014 results on the back of very strong Industry Lending performance, good volume growth, and despite negative CVA/DVA impacts throughout the year and additional redundancy provisions. The underlying result before tax was EUR 1,997 million in 2014, and grew 12.9% versus 2013 excluding these two items. In the fourth quarter, the underlying result before tax was EUR 245 million, down from a year ago, but stable excluding CVA/DVA impacts and redundancy provisions. The decline compared with the previous quarter, was additionally caused by the annual Dutch bank tax and higher risk costs, combined with seasonally lower results in Financial Markets and lower income at Bank Treasury.
 |
Total underlying income decreased 7.3% versus the fourth quarter of 2013, mainly due to the negative CVA/DVA adjustments. These CVA/DVA effects, reported within Financial Markets, were EUR-72 million for the quarter, down from EUR 9 million in the fourth quarter of 2013 and EUR -42 million in the previous quarter. Excluding the CVA/DVA impact, income was 0.6% lower than in the fourth quarter of 2013. Industry Lending income was 5.9% higher than last year due to the strong performance of Structured Finance, largely offsetting lower income in Bank Treasury, Real Estate & Other. Total income was down 9.8% on the prior quarter, excluding CVA/DVA effects, driven by seasonality in Financial Markets and lower income in Bank Treasury, which was impacted by the low yield environment and declining investment spreads, as well as negative revaluation of derivatives and lower capital gains on bonds.
The interest result increased 20.3% compared with a year ago, driven by strong volume growth in Structured Finance over the year. This was supported by higher interest results in Financial Markets, partly offset by lower results at Bank Treasury. Compared with the previous quarter, the interest result of Commercial Banking rose 0.8%, mainly due to Structured Finance, on the back of higher volumes and margins, partly offset by lower interest results in Financial Markets.
Commission income was 2.4% lower than in the same quarter
|
| ING GROUP PRESS RELEASE 4Q2014 | 13 |
SEGMENT REPORTING: COMMERCIAL BANKING
|
a year ago and down 1.2% on the third quarter of 2014. Both decreases were caused by General Lending & Transaction Services.
Investment income was EUR 21 million compared with EUR 54 million in the fourth quarter of 2013 and EUR 17 million in the previous quarter. The last quarter of 2013 included gains on the sale of various investments in Industry Lending as well as gains on the sale of assets within Real Estate, whereas this quarter included an EUR 11 million impairment on an equity stake in Corporate Investments.
Total other income amounted to EUR -47 million, down EUR 201 million from a year ago and partly due to negative CVA/DVA effects in Financial Markets. Compared with the previous quarter, other income fell by EUR 167 million; this was largely due to Financial Markets and lower revaluations of derivatives used for hedging purposes in Bank Treasury.
Operating expenses were 9.5% higher than in the fourth quarter of 2013. The fourth quarter of 2014 included the Dutch bank tax of EUR 72 million, compared with EUR 76 million a year ago, and a redundancy provision of EUR 50 million, of which EUR 11 million is for the next steps in digital banking in the Netherlands as announced on 25 November 2014. The remaining EUR 39 million redundancy provision relates to the ongoing transformation programmes, which will lead to a net additional reduction of staff of around 250 FTEs in the next three years. Both programmes will result in additional structural cost savings of approximately EUR 40 million per annum by 2018. The previously announced restructuring programmes are on track. At the end of 2014, EUR 203 million of cost savings had already been realised out of EUR 340 million targeted by 2017.
Excluding the Dutch bank levies and the redundancy provisions, expenses increased 2.9% year-on-year despite the costs savings from the previously announced restructuring programmes and lower impairments in Real Estate Development. The year-on-year increase was due to inflationary impacts, a higher number of FTEs in Structured Finance to support business growth, higher pension costs in the Netherlands and the weakening of the euro. On a sequential basis, expenses excluding the Dutch bank levies and redundancy provisions rose 6.1% due to new hires in Structured Finance and higher IT investments to improve Commercial Banking’s product offering. The cost/income ratio was 64.3%, up from the 54.5% in the fourth quarter of 2013 and 44.1% in the previous quarter. Excluding CVA/DVA impacts, the redundancy provision and the Dutch bank levies, the cost/income ratio was 50.2% in the fourth quarter.
Risk costs amounted to EUR 152 million for the quarter, down from EUR 177 million in the fourth quarter of 2013, but up from EUR 34 million in the previous quarter, which was positively affected by the release of a large file.
Risk-weighted assets (RWA) declined by EUR 1.1 billion compared with the previous quarter. The underlying return on equity, based on a 10% common equity Tier 1 ratio, was 5.3%, down from 8.5% in the fourth quarter of 2013. The full-year 2014 underlying
|
return on equity was 11.4%, down from 12.8% in 2013. Excluding CVA/DVA impacts, the underlying ROE rose to 12.6% from 11.8% in 2013.
INDUSTRY LENDING
 Industry Lending posted an underlying result before tax of EUR 266 million, down 0.4% from the fourth quarter of 2013 as higher income was offset by higher expenses (reflecting investments in future growth) and higher risk costs. Income was up 5.9% year-on-year, driven by higher income in Structured Finance on the back of higher lending volumes. This was partly offset by lower income in Real Estate Finance (REF) and an EUR 11 million impairment on an equity stake in Corporate Investments.
In Structured Finance, the net lending assets, excluding FX impacts, increased by EUR 6.9 billion year-on-year despite a reduction in Russian exposures and the negative impact of the decline in oil prices on volumes. Compared with the previous quarter, the pre-tax result was down 28.7% due to higher risk costs and the Dutch bank tax. Income, excluding the impairment, rose by 0.9%, supported by lending growth and higher margins. Lending volumes, excluding FX impacts, grew by EUR 1.3 billion, of which EUR 0.8 billion related to Structured Finance and EUR 0.5 billion to REF. Expenses increased 22.8% on the previous quarter, mainly due to the Dutch bank tax. The cost/income ratio remained low at 28.0%.
Net additions to loan loss provisions amounted to EUR 122 million, up from EUR 102 million a year ago and EUR 49 million in the third quarter of 2014. The addition to the provision for loan losses was mainly attributable to Structured Finance; the net addition for REF remained low at EUR 25 million for the quarter.
|
| 14 | ING GROUP PRESS RELEASE 4Q2014 |
SEGMENT REPORTING: COMMERCIAL BANKING
|
GENERAL LENDING & TRANSACTION SERVICES
 The underlying result before tax from General Lending & Transaction Services was EUR 141 million, up 67.9% from a year ago, mainly due to lower risk costs. Income was slightly higher due to higher income in both Working Capital Solutions and Bank Mendes Gans, offsetting lower income in General Lending, where interest margins continued to be under pressure. Expenses were 4.5% lower than in the previous year, due entirely to the cost savings from the restructuring plans. Compared with the previous quarter, the pre-tax result declined 24.6%, as higher income was offset by higher expenses, reflecting the booking of the Dutch bank tax and higher IT investments. Risk costs were EUR 8 million for the quarter, up from EUR -28 million in the prior quarter, which included the release from a large file.
FINANCIAL MARKETS
 Financial Markets posted an underlying result before tax of EUR-76 million, down from EUR 26 million in the fourth quarter of 2013 and EUR 55 million in the previous quarter. Both the year- on-year and quarterly variance were influenced by the negative credit and debt valuation adjustments (CVA/DVA). Results in the current quarter included EUR -72 million of CVA/DVA impacts compared with EUR 9 million a year ago and EUR -42 million in the previous quarter.
Compared with the same quarter a year ago, income excluding CVA/DVA fell 2.4%. Fourth-quarter income is traditionally lower than in the third quarter and 2014 was no exception. Income excluding CVA/DVA declined 18.9% from the previous quarter, mainly reflected in lower credit trading business. Operating expenses rose 6.9% year-on-year as the costs savings from the restructuring plans were more than offset by higher staff expenses, inflationary impacts and the weakening of the euro. Expenses rose 22.1% from the third quarter, mainly due to the annual Dutch bank tax.
|
BANK TREASURY, REAL ESTATE AND OTHER
 Bank Treasury, Real Estate and Other booked an underlying result before tax of EUR -86 million (including the EUR 50 million of redundancy provisions), compared with EUR -7 million in the fourth quarter of 2013 and EUR 62 million in the previous quarter. Income declined 40.6% year-on-year, mainly due to portfolio reduction within the run-off businesses.
Sequentially, income fell 53.8% (mainly within Bank Treasury) as the previous quarter included positive revaluation of derivatives for hedging purposes and higher capital gains on bonds. In addition, Bank Treasury income was lower than in the previous quarter due to the low yield environment and declining investment spreads. Expenses rose 55.0% from a year ago and more than doubled on the previous quarter, mainly due to EUR 50 million of redundancy provisions recorded in this quarter. The impairments within the run-off businesses (mainly related to Real Estate Development) amounted to EUR 14 million, down from EUR 25 million a year ago, but up from EUR 5 million in the previous quarter.
|
| ING GROUP PRESS RELEASE 4Q2014 | 15 |
CORPORATE LINE BANKING
|
Banking Corporate Line: Underlying result before tax
|
||
|
In EUR million
|
4Q2014
|
4Q2013
|
|
Income on capital surplus
|
124
|
121
|
|
Solvency costs
|
-37
|
-72
|
|
Financing charges
|
-24
|
-51
|
|
Other Capital Management
|
14
|
149
|
|
Capital Management excl. DVA
|
77
|
148
|
|
Bank Treasury excl. DVA
|
-123
|
-92
|
|
DVA
|
-8
|
-26
|
|
Other
|
21
|
-37
|
|
Underlying result before tax
|
-32
|
-8
|
|
of which: Underlying income
|
-49
|
55
|
|
of which: Operating expenses
|
-17
|
63
|
|
Corporate Line Banking posted an underlying result before tax of EUR -32 million compared with EUR -8 million in the fourth quarter of 2013. Both quarters included substantial positive one-off results: this quarter included a large release from provisions related to regulatory expenses (DGS-related), whereas the fourth quarter of 2013 included the positive result from the unwinding of the IABF following the agreement with the Dutch State. The underlying result before tax in the previous quarter was EUR -137 million.
Capital Management-related results fell to EUR 77 million from EUR 148 million in the fourth quarter of 2013, which included a EUR 99 million one-off result from the unwinding of the IABF.
Within Capital Management results, income on capital surplus was EUR 124 million compared with EUR 121 million in the same quarter of the previous year. Solvency costs improved to EUR 37 million from EUR 72 million in the fourth quarter of 2013. The improvement mainly reflects the call of hybrid securities in December 2013 and April 2014. Financing charges improved to EUR 24 million from EUR 51 million in the same quarter of the previous year, driven by one-off results from the settlement of FX hedges and by lower expenses from Group debt, which are fully allocated to the banking results. The result of Other Capital Management fell to EUR 14 million from EUR 149 million in the same quarter of 2013. The lower result was mainly attributable to the EUR 99 million one-off result from the unwinding of the IABF and EUR 18 million of gains on the repurchase of Tier 2 securities in the fourth quarter of 2013. Furthermore, fair value results were more negative than a year ago.
Bank Treasury-related results include the isolated legacy costs (mainly negative interest results) for replacing short-term funding with long-term funding. The results deteriorated to EUR -123 million from EUR -92 million in the fourth quarter of 2013.
DVA on own-issued debt was EUR -8 million compared with EUR-26 million in the fourth quarter of 2013 as ING’s credit spread continued to tighten.
The result of ‘Other’, which included EUR 27 million of the annual Dutch bank tax, improved to EUR 21 million versus EUR -37 million in the same quarter of 2013. This improvement was mainly due to a large release from provisions related to regulatory expenses (DGS- related) and higher value-added tax restitutions.
|
| 16 | ING GROUP PRESS RELEASE 4Q2014 |
|
ING Group: Consolidated balance sheet
|
||||||||
|
in EUR million
|
31 Dec. 14
|
30 Sep. 14
|
31 Dec. 13
pro-forma 1)
|
31 Dec. 14
|
30 Sep. 14
|
31 Dec. 13
pro-forma 1)
|
||
|
Assets
|
Equity
|
|||||||
|
Cash and balances with central banks
|
12,233
|
13,272
|
11,928
|
Shareholders' equity
|
50,424
|
47,166
|
45,776
|
|
|
Amounts due from banks
|
37,119
|
41,876
|
42,996
|
Minority interests
|
8,072
|
7,307
|
5,913
|
|
|
Financial assets at fair value through P&L
|
144,099
|
141,661
|
121,253
|
Non-voting equity securities
|
683
|
1,500
|
||
|
- trading assets
|
136,959
|
133,402
|
113,510
|
Total equity
|
58,496
|
55,156
|
53,189
|
|
|
- non-trading derivatives
|
4,384
|
3,834
|
5,435
|
Liabilities
|
||||
|
- other
|
2,756
|
4,425
|
2,308
|
Subordinated loans
|
6,861
|
6,678
|
6,889
|
|
|
Investments
|
97,641
|
94,809
|
79,981
|
Debt securities in issue
|
126,352
|
133,615
|
127,727
|
|
|
- debt securities available-for-sale
|
92,683
|
90,553
|
75,238
|
Other borrowed funds
|
11,297
|
12,485
|
10,229
|
|
|
- debt securities held-to-maturity
|
2,239
|
2,170
|
3,098
|
Amounts due to banks
|
29,999
|
30,412
|
27,200
|
|
|
- equity securities available-for-sale
|
2,718
|
2,086
|
1,645
|
Customer deposits
|
483,871
|
492,277
|
468,543
|
|
|
Loans and advances to customers
|
517,478
|
520,218
|
506,882
|
- savings accounts
|
295,533
|
294,121
|
284,069
|
|
|
- securities at amortised cost and IABF2)
|
10,579
|
11,995
|
15,692
|
- credit balances on customer accounts
|
140,707
|
138,705
|
127,073
|
|
|
- customer lending
|
506,899
|
508,223
|
491,190
|
- corporate deposits
|
46,203
|
58,383
|
56,528
|
|
|
Investments in associates and joint ventures
|
953
|
1,592
|
951
|
- other
|
1,428
|
1,067
|
873
|
|
|
Real estate investments
|
80
|
78
|
325
|
Financial liabilities at fair value through P&L
|
116,682
|
104,766
|
96,608
|
|
|
Property and equipment
|
2,100
|
2,111
|
2,282
|
- trading liabilities
|
97,091
|
84,786
|
73,491
|
|
|
Intangible assets
|
1,655
|
1,655
|
1,449
|
- non-trading derivatives
|
6,040
|
5,824
|
9,262
|
|
|
Other assets
|
13,966
|
14,235
|
17,263
|
- other
|
13,551
|
14,156
|
13,855
|
|
|
Other liabilities
|
17,166
|
16,709
|
17,300
|
|||||
|
Total assets excl. assets held for sale
|
827,324
|
831,508
|
785,310
|
Total liabilities excl. liabilities held for sale
|
792,228
|
796,942
|
754,496
|
|
|
Assets held for sale
|
165,532
|
159,480
|
296,006
|
Liabilities held for sale
|
142,132
|
138,889
|
273,633
|
|
|
Total liabilities
|
934,360
|
935,831
|
1,028,129
|
|||||
|
Total assets
|
992,856
|
990,987
|
1,081,317
|
Total equity and liabilities
|
992,856
|
990,987
|
1,081,317
|
|
|
1)
|
The figures of this period have been restated to reflect a change in accounting policy. The comparative figures have also been restated to reflect the implementation of IFRS 10, which introduced amendments to the criteria for consolidation, and IFRS 11, which replaced proportional consolidation for joint ventures by equity accounting. Additi- onally, the figures were adjusted for the transfer of NN Group to assets/liabilities held for sale provided for comparison reasons only.
|
|
2)
|
IABF was unwound in 1Q2014.
|
|
The balance sheet of ING Group increased by EUR 2 billion in the fourth quarter to EUR 993 billion, with negligible currency impacts. Customer lending decreased by EUR 1 billion after three consecutive quarters of growth due principally to a reduction of the mortgage portfolio. After the strong net inflow in the third quarter, customer deposits decreased by EUR 8 billion, primarily due to year-end outflows from asset managers and corporate treasurers. ING Bank’s loan-to-deposit ratio increased to 1.04 from 1.02 at the end of September. Higher valuation of derivatives, related to lower interest rates, had an upward impact on both the asset and the liability sides of the balance sheet.
Cash and balances with central banks
Cash and balances with central banks decreased by EUR 1 billion to EUR 12 billion due to lower placements by the Bank Treasury departments in the Netherlands and Belgium.
Amounts due from and to banks
Amounts due from banks decreased by EUR 5 billion to EUR 37 billion. Lower placements were partly related to the net outflow of corporate deposits, while amounts due to banks remained flat at EUR 30 billion. Amounts due to banks at year-end included EUR 5.7 billion from the TLTRO.
|
Loans and advances to customers
Loans and advances to customers declined to EUR 517 billion from EUR 520 billion, due to EUR 1 billion of lower securities at amortised cost (mainly maturities) and EUR 1 billion of lower customer lending. The latter was mainly due to EUR 2 billion in lower residential mortgages, which included the EUR 1 billion sale of white-label mortgages in Australia and a decrease in the Netherlands, which was due to increased prepayments towards year-end and additional transfers of WUB mortgages to NN Bank. Non-mortgage lending rose by EUR 1 billion due to growth in business and consumer lending at Retail Banking, partly offset by a small decrease in Commercial Banking (mainly in General Lending & Transaction Services and Financial Markets, but up in Structured Finance and Real Estate Finance).
Financial assets/liabilities at fair value
Financial assets at fair value through P&L increased by EUR 2 billion to EUR 144 billion. This was mainly due to the EUR 7 billion higher valuation of trading derivatives (following a further decline of interest rates), which was largely offset by EUR 5 billion lower reverse repo activity at year-end. Financial liabilities at fair value through P&L rose by EUR 12 billion to EUR 117 billion, of which EUR 8 billion was caused by higher valuation of trading derivatives, mirroring the asset side of the balance sheet. Repo activity increased by EUR 5 billion. Financial assets and liabilities at fair value consists predominantly of derivatives, securities and repos, which are mainly used to facilitate the servicing of ING’s clients.
|
| ING GROUP PRESS RELEASE 4Q2014 | 17 |
CONSOLIDATED BALANCE SHEET
|
ING Group: Change in shareholders’ equity
|
||||||||
|
ING Group
|
ING Bank N.V.
|
NN Group N.V1)
|
Holding/Eliminations
|
|||||
|
in EUR million
|
4Q2014
|
3Q2014
|
4Q2014
|
3Q2014
|
4Q2014
|
3Q2014
|
4Q2014
|
3Q2014
|
|
Shareholders' equity beginning of period
|
47,166
|
48,461
|
36,566
|
34,124
|
12,500
|
16,939
|
-1,900
|
-2,602
|
|
Net result for the period
|
1,176
|
928
|
545
|
1,033
|
134
|
241
|
497
|
-346
|
|
Unrealised revaluations of equity securities
|
767
|
-95
|
572
|
355
|
120
|
-450
|
75
|
0
|
|
Unrealised revaluations of debt securities
|
1,530
|
-497
|
110
|
220
|
1,391
|
-717
|
29
|
0
|
|
Deferred interest crediting to life policyholders
|
-673
|
765
|
0
|
0
|
-673
|
765
|
0
|
0
|
|
Realised gains/losses equity securities released to P&L
|
-16
|
-6
|
-13
|
-1
|
-3
|
-5
|
0
|
0
|
|
Realised gains/losses debt securities transferred to P&L
|
-9
|
-9
|
-6
|
-8
|
-3
|
-1
|
0
|
0
|
|
Change in cashflow hedge reserve
|
776
|
-373
|
257
|
516
|
459
|
-865
|
60
|
-24
|
|
Other revaluations
|
178
|
-198
|
213
|
-124
|
-31
|
-74
|
-4
|
0
|
|
Defined benefit remeasurement
|
38
|
32
|
62
|
57
|
-16
|
19
|
-8
|
-44
|
|
Exchange rate differences
|
-268
|
506
|
-257
|
370
|
-20
|
142
|
10
|
-6
|
|
Changes in treasury shares
|
-32
|
57
|
0
|
0
|
0
|
0
|
-32
|
57
|
|
Employee stock options and share plans
|
20
|
14
|
20
|
13
|
3
|
3
|
-4
|
-2
|
|
Repurchase premium non-voting equity securities
|
-342
|
0
|
0
|
0
|
0
|
0
|
-342
|
0
|
|
Impact IPO NN Group
|
0
|
-4,263
|
0
|
0
|
0
|
-5,397
|
0
|
1,134
|
|
Other
|
112
|
1,845
|
-5
|
11
|
8
|
1,900
|
108
|
-67
|
|
Total changes
|
3,258
|
-1,295
|
1,498
|
2,442
|
1,370
|
-4,439
|
390
|
702
|
|
Shareholders' equity end of period
|
50,424
|
47,166
|
38,064
|
36,566
|
13,870
|
12,500
|
-1,510
|
-1,900
|
|
1)
|
These figures represent ING’s 68.1% shareholding in NN Group as per 30 September 2014.
|
|
ING Group: Shareholders’ equity
|
||||||||
|
ING Group
|
ING Bank N.V.
|
NN Group N.V1)
|
Holding/Eliminations
|
|||||
|
in EUR million
|
31 Dec. 14
|
30 Sep. 14
|
31 Dec. 14
|
30 Sep. 14
|
31 Dec. 14
|
30 Sep. 14
|
31 Dec. 14
|
30 Sep. 14
|
|
Share premium/capital
|
16,971
|
16,969
|
17,067
|
17,067
|
8,267
|
8,267
|
-8,363
|
-8,365
|
|
Revaluation reserve equity securities
|
2,847
|
2,097
|
2,019
|
1,460
|
751
|
635
|
77
|
2
|
|
Revaluation reserve debt securities
|
7,755
|
6,233
|
1,597
|
1,493
|
6,158
|
4,769
|
0
|
-29
|
|
Revaluation reserve crediting to life policyholders
|
-3,765
|
-3,092
|
0
|
0
|
-3,765
|
-3,092
|
0
|
0
|
|
Revaluation reserve cashflow hedge
|
3,877
|
3,102
|
875
|
618
|
3,040
|
2,582
|
-38
|
-98
|
|
Other revaluation reserves
|
306
|
314
|
291
|
295
|
16
|
18
|
-1
|
1
|
|
Defined benefit remeasurement reserve
|
-504
|
-542
|
-370
|
-432
|
-79
|
-63
|
-55
|
-47
|
|
Currency translation reserve
|
-741
|
-660
|
-610
|
-570
|
-135
|
-84
|
3
|
-7
|
|
Treasury shares
|
-46
|
-14
|
0
|
0
|
0
|
0
|
-46
|
-14
|
|
Retained earnings and other reserves
|
23,724
|
22,760
|
17,195
|
16,635
|
-385
|
-532
|
6,913
|
6,657
|
|
Total
|
50,424
|
47,166
|
38,064
|
36,566
|
13,870
|
12,500
|
-1,510
|
-1,900
|
|
1)
|
These figures represent ING’s 68.1% shareholding in NN Group as per 30 September 2014.
|
|
Investments
Investments rose to EUR 98 billion from EUR 95 billion at the end of the third quarter, mainly as a result of a EUR 3 billion increase in government bonds and a EUR 1 billion higher valuation of equity stakes.
Assets/liabilities held for sale
Assets and liabilities held for sale increased by EUR 6 billion and EUR 3 billion, respectively. They are mainly related to NN Group. In the fourth quarter, ING Bank’s stake in ING Vysya Bank was transferred from investments in associates to assets held for sale following the announcement to merge ING Vysya Bank with another Indian bank.
Debt securities in issue
Debt securities in issue declined by EUR 7 billion to EUR 126 billion, due to lower CD/CPs. Long-term debt securities were flat. ING Bank issued EUR 3 billion of long-term debt during the fourth quarter. This consisted mainly of senior unsecured debt, which was offset by EUR 3 billion of maturities and redemptions.
|
Customer deposits and other funds on deposits
Customer deposits decreased by EUR 8 billion to EUR 484 billion compared with the end of the third quarter. This decline was mainly due to EUR 12 billion of lower corporate deposits from asset managers and corporate treasurers towards year-end. Credit balances on customer accounts were EUR 2 billion higher (primarily in the Netherlands). Savings accounts increased by EUR 1 billion, despite lower client rates in various countries.
Total equity
Shareholders’ equity increased by EUR 3.3 billion in the fourth quarter of 2014. The increase was mainly caused by the quarterly net result of EUR 1.2 billion and higher debt and equity revaluation reserves (reflecting a decline in interest rates and an increase in the market value of ING’s equity stake in Bank of Beijing). The increase in shareholders’ equity was partly offset by the premium paid on the repayment of the core Tier 1 securities and negative exchange rate differences. The strengthening of the euro against the Russian rouble, Australian dollar and Polish zloty was partly offset by the weakening of the euro against most other currencies. Shareholders’ equity per share increased from EUR 12.23 on 30 September 2014 to EUR 13.08 at the end of December.
|
| 18 | ING GROUP PRESS RELEASE 4Q2014 |
CONSOLIDATED BALANCE SHEET
|
Balance sheet ING Bank
The balance sheet total of ING Bank was EUR 829 billion. The difference on the asset side compared with the balance sheet of ING Group is mainly due to the difference in assets held for sale, of which only EUR 0.7 billion refers to the Bank. The difference on the liability side is mainly attributable to equity and issued debt items, and to liabilities held for sale.
Annual development consolidated balance sheet
Compared with year-end 2013, ING Group’s balance sheet decreased by EUR 88 billion, due to the deconsolidation of Voya with EUR 150 billion of assets held for sale, whereas assets held for sale of NN Group increased by EUR 20 billion.
Total assets excluding assets held for sale increased by EUR 42 billion, including EUR 14 billion of positive currency impacts. Excluding currency impacts, the remaining increase of EUR 28 billion was mainly due to EUR 18 billion in higher financial assets at fair value through P&L (mainly higher derivatives valuation due to lower interest rates), EUR 17 billion of higher investments in order to build an eligible liquidity portfolio, and EUR 9 billion in higher customer lending. The increase in customer lending was realised despite the deconsolidation of ING Vysya Bank, additional transfers of WUB mortgages to NN Bank, and the sale of a mortgage portfolio in Australia. These increases were partly offset by lower amounts due from banks and lower securities at amortised costs, including the unwinding of the last part of the IABF. On the liability side, ING Group improved its funding profile with an EUR 11 billion growth in savings accounts and EUR 13 billion of higher credit balances on customer accounts, all excluding currency impacts.
|
| ING GROUP PRESS RELEASE 4Q2014 | 19 |
|
ING Bank: Loan book
|
||||||
|
Credit outstandings
|
Non-performing loans
|
NPL%
|
||||
|
in EUR million
|
31 Dec. 2014
|
30 Sep. 2014
|
31 Dec. 2014
|
30 Sep. 2014
|
31 Dec. 2014
|
30 Sep. 2014
|
|
Residential mortgages Netherlands
|
134,265
|
135,759
|
3,424
|
2,694
|
2.6%
|
2.0%
|
|
Other lending Netherlands
|
34,303
|
35,719
|
3,253
|
2,878
|
9.5%
|
8.1%
|
|
of which Business Lending Netherlands
|
28,556
|
29,852
|
2,231
|
2,323
|
7.8%
|
7.8%
|
|
Residential mortgages Belgium
|
32,292
|
31,646
|
902
|
762
|
2.8%
|
2.4%
|
|
Other lending Belgium
|
39,719
|
37,707
|
1,373
|
1,431
|
3.5%
|
3.8%
|
|
of which Business Lending Belgium
|
33,410
|
31,561
|
1,165
|
1,225
|
3.5%
|
3.9%
|
|
Retail Banking Benelux
|
240,579
|
240,831
|
8,952
|
7,765
|
3.7%
|
3.2%
|
|
Germany residential mortgages
|
63,154
|
63,383
|
712
|
593
|
1.1%
|
0.9%
|
|
Other lending Germany
|
11,869
|
11,797
|
164
|
149
|
1.4%
|
1.3%
|
|
Residential mortgages Rest of World
|
49,418
|
50,193
|
409
|
288
|
0.8%
|
0.6%
|
|
Other lending Rest of World
|
26,652
|
25,072
|
741
|
736
|
2.8%
|
2.9%
|
|
Retail Banking International
|
151,093
|
150,445
|
2,026
|
1,766
|
1.3%
|
1.2%
|
|
Industry lending
|
97,284
|
95,289
|
3,541
|
3,879
|
3.6%
|
4.1%
|
|
of which: Structured Finance
|
73,792
|
72,126
|
1,551
|
1,448
|
2.1%
|
2.0%
|
|
of which: Real Estate Finance
|
23,228
|
22,934
|
1,882
|
2,419
|
8.1%
|
10.5%
|
|
General Lending & Transaction Services
|
62,111
|
62,864
|
1,264
|
1,205
|
2.0%
|
1.9%
|
|
FM, Bank Treasury, Real Estate & Other
|
16,691
|
19,276
|
1,106
|
1,077
|
6.6%
|
5.6%
|
|
of which General Lease run-off
|
5,063
|
5,434
|
1,105
|
1,076
|
21.8%
|
19.8%
|
|
Commercial Banking
|
176,086
|
177,430
|
5,911
|
6,161
|
3.4%
|
3.5%
|
|
Total loan book
|
567,758
|
568,706
|
16,889
|
15,692
|
3.0%
|
2.8%
|
|
1)
|
Lending and money market credit outstandings, including guarantees and letters of credit (off balance positions)
|
|
Following the implementation of the EBA forbearance definition, which mainly impacted the Retail Banking mortgage portfolios, ING Bank’s NPL ratio increased to 3.0% in the fourth quarter. The underlying development of the mortgage portfolios is positive, as is the development of non-performing loans in the other Retail Banking and Commercial Banking portfolios. ING Bank’s capital position remains robust with a fully-loaded CRD IV common equity Tier 1 ratio increasing to 11.4%. Considering ING Group and ING Bank’s strong capital position, the Board proposes to pay a final 2014 dividend amounting to EUR 0.12 per share.
|
Credit risk management
ING Bank’s non-performing loans (NPLs) expressed as a percentage of lending credit outstandings increased in the last quarter of the year to 3.0% from 2.8% in the third quarter. This increase was mainly caused by higher NPL amounts in the Retail Banking mortgage portfolios following the implementation of the EBA forbearance definition, which requires a forborne NPL loan to remain an NPL throughout a 12-month probation period.
The new definition resulted in an increase of the NPL ratio for the Dutch mortgage book to 2.6%. However, the part that is 90+ days overdue decreased to 1.4% in the fourth quarter compared to 1.5% in the third quarter, showing an actual underlying improvement in the credit quality of the portfolio. The improvement reflects the gradual improvement of the Dutch economy and housing market which we are starting to experience through an improvement in risk costs. The implementation of the EBA forbearance definition also led to an increase in the
|
|
ING Bank: Stock of provisions1)
|
|||||
|
in EUR million
|
Retail Banking
Benelux
|
Retail Banking
International
|
Commercial
Banking
|
Total ING Bank
4Q 2014
|
Total ING Bank
3Q 2014
|
|
Stock of provisions at beginning of period
|
2,485
|
1,188
|
2,370
|
6,043
|
6,222
|
|
Changes in composition of the Bank
|
0
|
0
|
|||
|
Amounts written off
|
-226
|
-48
|
-206
|
-481
|
-569
|
|
Recoveries of amounts written off
|
10
|
1
|
8
|
20
|
34
|
|
Increases in loan loss provisioning
|
320
|
94
|
257
|
671
|
654
|
|
Releases from loan loss provisioning
|
-137
|
-29
|
-105
|
-271
|
-332
|
|
Net additions to loan loss provisions
|
182
|
66
|
152
|
400
|
322
|
|
Exchange rates or other movements
|
78
|
1
|
-66
|
13
|
34
|
|
Stock of provisions at end of period
|
2,529
|
1,208
|
2,258
|
5,995
|
6,043
|
|
Coverage ratio 4Q 2014
|
28.3%
|
59.6%
|
38.2%
|
35.5%
|
|
|
Coverage ratio 3Q 2014
|
32.0%
|
67.3%
|
38.5%
|
38.5%
|
|
|
1)
|
At the end of December 2014, the stock of provisions included provisions for amounts due from banks: EUR 6 million (September 2014: EUR 5 million)
|
| 20 | ING GROUP PRESS RELEASE 4Q2014 |
RISK & CAPITAL MANAGEMENT
|
other Retail Banking mortgage portfolios. In Belgium, the NPL ratio of residential mortgages increased to 2.8% from 2.4% in the third quarter. In Retail Banking International, the NPL ratio for German residential mortgages edged up to 1.1% from 0.9% in the third quarter, while in Rest of World the NPL ratio for residential mortgages increased to 0.8% from 0.6% at the end of September.
The Business Lending portfolios of Retail Banking Benelux showed an improving credit quality. Although the NPL ratio for Business Lending Netherlands remained stable at 7.8% – a level that was reported in the last three quarters – the amount of NPLs decreased for the second consecutive quarter, reflecting the gradual improvement of the Dutch economy. In Belgium the NPL ratio of Business Lending improved from 3.9% to 3.5%, driven by a combination of volume growth and a reduction of NPLs. For Business Lending Netherlands, we expect loan losses to remain at elevated levels.
The NPL ratio for Real Estate Finance declined to 8.1% in the fourth quarter from 10.5% in the previous quarter, mainly due to the sale of NPLs. The decrease in NPL amounts in Commercial Banking was accompanied by a reduction in credit outstandings, resulting in a slight drop of the NPL ratio to 3.4% from 3.5% in the third quarter. The increase of credit outstandings in Structured Finance and Real Estate Finance was more than offset by a reduction in Bank Treasury and General Lending.
The fourth quarter was characterised by increased instability, especially in eastern Ukraine, and a further deterioration of the economic situation in both Ukraine and Russia. ING Bank continues to actively manage its exposures in both countries. At the end of the fourth quarter, ING Bank’s exposure to Russia was EUR 7.0 billion. In the last six months, the exposure to Russia was reduced by approximately EUR 2.1 billion at constant FX rates. The quality of the portfolio remains strong with an NPL ratio remaining low at 3%.
ING Bank’s stock of provisions remained stable at EUR 6.0 billion in the last quarter of 2014. Total NPLs rose, primarily due to the impact of the EBA forbearance implementation, which more than offset the reduction in NPLs at Commercial Banking. The coverage ratio therefore decreased to 35.5% compared to 38.5% at the end of September 2014. ING Bank’s loan portfolio consists predominantly of asset-based and/or well-secured loans, including Structured Finance, Real Estate Finance, and mortgage loans in Retail Banking.
Securities portfolio
In the fourth quarter, ING Bank’s overall debt securities portfolio increased to EUR 108.1 billion from EUR 107.4 billion at the end of September 2014. This was mainly driven by a EUR 2.7 billion increase in highly liquid government bonds ahead of the introduction of LCR and in anticipation of the ECB’s QE programme. This increase was only partially offset by a decrease in covered bonds, following maturities. The revaluation reserve of debt securities rose to EUR 1.6 billion after tax compared to EUR 1.5 billion at the end of September 2014, reflecting the high
|
quality of the investment portfolio, which benefited from ongoing credit spread tightening and low interest rates.
|
|||||
|
ING Bank: Debt securities1)
|
||||||
|
in EUR billion
|
31 Dec. 14
|
30 Sep. 14
|
||||
|
Government bonds
|
69.7
|
67.0
|
||||
|
Covered bonds
|
17.7
|
18.8
|
||||
|
Financial Institutions
|
11.5
|
11.9
|
||||
|
Corporate bonds
|
2.8
|
2.8
|
||||
|
ABS
|
6.4
|
6.8
|
||||
|
Subtotal debt securities
|
108.1
|
107.4
|
||||
|
1) Figures exclude positions at fair value through the P&L but include securities classified as Loans & Receivables
|
||||||
|
Funding and liquidity
In the fourth quarter of 2014, the ECB allotted a second TLTRO tranche and took additional steps to expand its purchases of covered bond and asset-backed securities to include other securities in order to increase liquidity in the market and stimulate bank lending to consumers and businesses. ING Bank continued to issue long-term funding while participating in the second tranche of the TLTRO, taking approximately EUR 5.7 billion over two allocations. ING Bank issued EUR 3 billion of long-term debt in the fourth quarter of 2014. Most of it was senior unsecured debt, offset by EUR 3 billion of maturing debt.
|
||||||
|
ING Bank Liquidity buffer
|
||||||
|
in EUR million
|
31 Dec. 14
|
30 Sep. 14
|
||||
| Cash and holdings at central banks |
4,499
|
6,086
|
||||
|
Securities issued or guaranteed by sovereigns, central banks and multilateral development banks
|
86,863
|
95,850
|
||||
|
Liquid assets eligible at central banks (not included in above)
|
88,199
|
91,799
|
||||
|
Other liquid assets
|
3,320
|
7,012
|
||||
|
Total
|
182,880
|
200,747
|
||||
|
In the fourth quarter of 2014, a reduction in all asset classes, mainly due to repo’s and reverse repo’s, decreased ING Bank’s total eligible collateral position to EUR 183 billion at market values compared with EUR 201 billion at the end of September 2014. NG Bank’s loan-to-deposit ratio, excluding securities that are recorded at amortised cost, increased to 1.04 from 1.02 at the end of September 2014.
Market risk
In the last quarter of 2014, the average Value-at-Risk (VaR) remained stable at EUR 9 million compared to the third quarter of 2014. The overnight VaR for ING Bank’s trading portfolio ranged from EUR 7 million to EUR 12 million.
|
||||||
|
ING Commercial Banking: Consolidated VaR trading books
|
||||||
|
in EUR million
|
Minimum
|
Maximum
|
Average
|
Quarter-end
|
||
|
Foreign exchange
|
1 | 6 | 2 | 2 | ||
|
Equities
|
3 | 7 | 4 | 6 | ||
|
Interest rate
|
3 | 7 | 5 | 7 | ||
|
Credit spread
|
4 | 9 | 6 | 9 | ||
|
Diversification
|
-8 | -12 | ||||
|
Total VaR1)
|
7 | 12 | 9 | 11 | ||
| 1) The total VaR for the columns Minimum and Maximum cannot be calculated by taking the sum of the individual components since the observations for both the individual markets as well as for total VaR may occur on different dates. | ||||||
| ING GROUP PRESS RELEASE 4Q2014 | 21 |
RISK & CAPITAL MANAGEMENT
|
ING Bank: Capital position
|
||||
|
2019 rules
(Basel III fully loaded)
|
2014 rules
(Basel III phased in)
|
|||
|
In EUR million
|
31 Dec. 14
|
30 Sept. 14
|
31 Dec. 14
|
30 Sept. 14
|
|
Shareholders' equity (parent)
|
38,064
|
36,566
|
38,064
|
36,566
|
|
Regulatory adjustments
|
-4,395
|
-3,772
|
-4,808
|
-3,584
|
|
Available common equity Tier 1 capital
|
33,668
|
32,795
|
33,256
|
32,982
|
|
Subordinated loans qualifying as Tier 1 capital1)
|
5,727
|
5,569
|
5,727
|
5,569
|
|
Regulatory adjustments additional Tier 12)
|
0
|
0
|
-1,883
|
-1,875
|
|
Available Tier 1 capital
|
39,395
|
38,363
|
37,100
|
36,676
|
|
Supplementary capital - Tier 2 bonds3)
|
9,371
|
9,548
|
9,371
|
9,548
|
|
Regulatory adjustments Tier 2
|
103
|
85
|
-456
|
-466
|
|
Available BIS capital
|
48,869
|
47,996
|
46,015
|
45,757
|
|
Risk-weighted assets
|
296,427
|
294,903
|
296,319
|
294,903
|
|
Common equity Tier 1 ratio
|
11.4%
|
11.1%
|
11.2%
|
11.2%
|
|
Tier 1 ratio
|
13.3%
|
13.0%
|
12.5%
|
12.4%
|
|
BIS ratio
|
16.5%
|
16.3%
|
15.5%
|
15.5%
|
|
1)
|
Of which EUR 1,988 million is CRR/CRD IV-compliant and EUR 3,739 million to be replaced as capital recognition is subject to CRR/CRD IV grandfathering rules.
|
|
2)
|
Such as goodwill and intangibles.
|
|
3)
|
Of which EUR 5,778 million is CRR/CRD IV-compliant and EUR 3,593 million to be replaced as capital recognition is subject to CRR/CRD IV grandfathering rules.
|
|
Capital ratios ING Bank
ING Bank continued to grow its capital base, ending the fourth quarter of 2014 with a fully-loaded common equity Tier 1 ratio of 11.4%, up from 11.1% at the end of September 2014. The increase reflects EUR 0.5 billion of retained earnings and EUR 0.7 billion of higher debt and equity revaluation reserves due to a decline in interest rates and a higher market value of the equity stake in Bank of Beijing. RWAs increased by EUR 1.5 billion versus the previous quarter, mainly due to the strengthening of the USD. The fully-loaded Tier 1 ratio increased from 13.0% to 13.3%, while the fully-loaded BIS ratio at the end of December was 16.5%. This increase primarily reflects the retained earnings and higher revaluation reserves. In the fourth quarter, ING redeemed non-CRD IV-compliant Tier 2 securities. The total redeemed amount was EUR 1.6 billion with a capital recognition of only EUR 1.2 billion.
ING Bank’s leverage ratio increased to 4.1%, up from 4.0% in September due to higher capital, while the total exposure remained stable. The leverage exposure is calculated using the published IFRS-EU balance sheet, in which notional cash pooling activities are netted, plus off-balance-sheet commitments. In January 2015, the EC formally adopted the Delegated Act for the leverage ratio. The pro-forma leverage ratio of ING Bank, taking into account the combined impact of grossing up the notional cash pool activities and the alignment with the Delegated Act, is 3.6%.
|
Risk-weighted assets (RWA): fully-loaded
At the end of 2014, ING Bank’s total RWA increased by EUR 1.5 billion to EUR 296.4 billion, of which 1.4 billion was FX-related following the strengthening of the USD. Credit RWA increased by EUR 1.7 billion to EUR 252.0 billion compared with the end of September as FX impacts and volume growth more than offset improvements in credit quality. Market RWA increased by EUR 0.6 billion to EUR 10.7 billion, while operational RWA decreased by EUR 0.8 billion to EUR 33.7 billion.
|
|||
|
ING Bank: Composition of RWA
|
||||
|
in EUR billion
|
31 Dec. 14
|
30 Sep. 14
|
||
|
Credit RWA
|
252.0
|
250.2
|
||
|
Operational RWA
|
33.7
|
34.6
|
||
|
Market RWA
|
10.7
|
10.1
|
||
|
Total RWA
|
296.4
|
294.9
|
||
| 22 | ING GROUP PRESS RELEASE 4Q2014 |
RISK & CAPITAL MANAGEMENT
|
ING Group: Capital position
|
||||
|
2019 rules
(Basel III fully loaded)
|
2014 rules
(Basel III phased in)
|
|||
|
In EUR million
|
31 Dec. 14
|
30 Sept. 14
|
31 Dec. 14
|
30 Sept. 14
|
|
Shareholders' equity (parent)
|
50,424
|
47,166
|
50,424
|
47,166
|
|
- Deductions of significant investments in financial institutions
|
-14,103
|
-12,757
|
-4,631
|
-3,970
|
|
- Proposed dividend
|
-470
|
0
|
-470
|
0
|
|
- Other adjustments
|
-4,339
|
-3,703
|
-4,780
|
-3,495
|
|
Regulatory adjustments
|
-18,912
|
-16,460
|
-9,881
|
-7,465
|
|
Available common equity Tier 1 capital
|
31,512
|
30,706
|
40,543
|
39,701
|
|
Additional Tier 1 securities1)
|
5,727
|
5,569
|
5,727
|
5,569
|
|
Regulatory adjustments additional Tier 1
|
0
|
0
|
-5,727
|
-5,569
|
|
Available Tier 1 capital
|
37,239
|
36,275
|
40,543
|
39,701
|
|
Supplementary capital - Tier 2 bonds2)
|
9,371
|
9,548
|
9,371
|
9,548
|
|
Regulatory adjustments Tier 2
|
103
|
85
|
-6,081
|
-5,560
|
|
Available BIS capital
|
46,713
|
45,907
|
43,834
|
43,689
|
|
Risk-weighted assets
|
300,758
|
300,908
|
300,647
|
300,960
|
|
Common equity Tier 1 ratio
|
10.5%
|
10.2%
|
13.5%
|
13.2%
|
|
Tier 1 ratio
|
12.4%
|
12.1%
|
13.5%
|
13.2%
|
|
BIS ratio
|
15.5%
|
15.3%
|
14.6%
|
14.5%
|
|
1)
|
Of which EUR 5,727 milion to be replaced as capital recognition is subject to CRR/CRD IV grandfathering rules. This amount is presented net of positions on-lent to Insurance.
|
|
2)
|
Of which EUR 5,778 million is CRR/CRD IV-compliant and EUR 3,593 million to be replaced as capital recognition is subject to CRR/CRD IV grandfathering rules.
|
|
Capital ratios ING Group
CRR/CRD IV also prescribes regular reporting on ING Group solvency ratios. The starting point for the risk-based ratio is ING Group shareholders’ equity, from which similar regulatory adjustments are deducted as in the CET1 capital calculation of ING Bank. In addition, this capital base is further adjusted for the carrying values of NN Group and Voya. ING Group’s fully-loaded CET1 ratio improved by 0.3%-points to 10.5% during the fourth quarter, almost fully attributable to the quarterly net profit as well as a higher debt securities revaluation reserves reflecting lower interest rates. The proposed dividend, to be paid in May 2015, has been deducted from ING Group’s capital base, in line with regulatory requirements. Risk-weighted assets were stable versus the previous quarter.
The Group’s phased-in CET1 ratio at the end of the fourth quarter improved by 0.3%-point to 13.5%, largely due to the quarterly net profit after excluding the proposed dividend. This ratio is well in excess of 10.5%, which we understand will be the regulatory guidance level for the Group.
The final tranche of EUR 1,025 million was paid to the Dutch State in November 2014, half a year ahead of schedule as agreed with the European Commission. As a result, the aggregate paid to the Dutch State amounted to EUR 13.5 billion, consisting of EUR 10 billion in principal and an additional EUR 3.5 billion of premiums and coupons. The payment was funded from ING Group. The impact of the repayment of this final tranche on the Group’s capital ratio was limited to the premium paid, amounting to EUR 1.3 billion. The notional amount was already excluded from ING Group’s CET1 capital as per 30 September 2014.
|
Dividend
As stated in our Ambition 2017 targets, ING is committed to returning capital to shareholders through a sustainable dividend policy. Effective from 2015, ING intends to pay a minimum of 40% of ING Group’s annual net profits by way of dividend, consisting of both an interim and a final dividend.
Furthermore, the Board will recommend whether to return additional capital to shareholders at the end of each financial year. Such decisions will reflect considerations including expected future capital requirements, growth opportunities available to the Group, the net earnings of the Group, and regulatory approvals as appropriate.
The Board proposes to pay a final 2014 dividend of EUR 470 million, or EUR 0.12 per (depositary receipt for an) ordinary share, subject to the approval of shareholders at the Annual General Meeting in May 2015.
Ratings
During the fourth quarter, all ratings and outlooks for ING Group and ING Bank remained unchanged. Fitch affirmed its ratings and outlooks in October. Moody’s and Standard & Poor’s affirmed their ratings and outlooks in December and November, respectively.
|
|||||||
|
Main credit ratings of ING on 10 February 2015
|
||||||||
|
Standard
& Poor’s
|
Moody’s
|
Fitch
|
||||||
|
Rating
|
Outlook
|
Rating
|
Outlook
|
Rating
|
Outlook
|
|||
|
ING Groep N.V.
|
A-
|
Negative
|
A3 |
Negative
|
A |
Negative
|
||
|
ING Bank N.V.
|
A |
Negative
|
A2 |
Negative
|
A+ |
Negative
|
||
| ING GROUP PRESS RELEASE 4Q2014 | 23 |
|
ING believes all sustainable progress is driven by people with the imagination and determination to improve their future and the futures of those around them. We empower people and organisations to realise their own vision for a better future – however modest or grand. Our purpose is to empower people to stay a step ahead in life and in business.
Our 53,000 employees work each day to earn the primary relationship with our customers and meet their needs over the long term. Our teams are encouraged to constantly think of better and innovative ways to service their clients.
Belgium introduces biometrics
With an aim to make mobile banking easier, quicker and safer, ING in Belgium introduced biometric verification. This is any means by which a person can be uniquely identified by evaluating one or more unique biological traits. Unique identifiers include fingerprints, hand geometry, voice waves, DNA and signatures. Since 1 December 2014, any customer with an iPhone 5S or iPhone 6/6 Plus can access ING Belgium’s Smart Banking app using their fingerprints instead of their log-in code.
Germany introduces ‘Photo Transfer’ for payments In Germany, ING-DiBa expanded its mobile banking app by adding an automated invoice payments solution, ‘Photo Transfer’, which makes money transfers easier and faster. With this new technology, customers can take a picture of an invoice using their mobile phone, and the relevant data to process the payment will be filled out automatically. Customers can use ‘Photo Transfer’ on any Android or iOS smartphone. This feature will be regularly updated and further developed with the latest technology.
ING recognised in the Netherlands, Belgium and Poland
ING’s efforts to innovate and improve customer service have not gone unnoticed. In November 2014, the global financial magazine The Banker named ING Bank Netherlands and ING Bank Belgium ‘Bank of the Year 2014’ in their respective countries. This is the fourth time in a row that ING in the Netherlands has received this accolade, and the second time in a row for Belgium. The jury praised ING for its commitment to innovate in digital banking in both countries while continuing to invest in a better branch network. Furthermore, ING was praised for being “at the forefront of the sweeping change” in meeting the new economic and regulatory realities. In Poland, ING was named the ‘Most Innovative Bank’ by International Finance Magazine, a publication targeted at the global finance community. A judging panel said ING Bank Slaski takes initiative in identifying distribution channels and implementing new, innovative banking products to streamline the customer service process from the client’s perspective.
Accelerating sustainable transitions ING finances a wide range of companies and projects around the world. Our portfolio includes a broad spectrum of customers that ING actively assess using our ESR Policy Framework to identify and manage environmental and social risks. Furthermore, ING believes that sustainability is becoming a source of competitive advantage: we have observed that companies which proactively reduce their
|
use of scarce resources have a better financial performance and lower risk profile than companies where resource efficiency is not taken as seriously. We therefore focus more heavily on servicing and financing clients and projects that contribute to the transition to a more sustainable economy.
Sustainable Transitions Financed
“Sustainable Transitions Financed” (STF) represents the volume of business that ING conducts with clients and projects that provide sustainable solutions and outperform their sector on environmental or social performance. In 2014 total STF amounted to EUR 19.5 billion, covering such business areas as energy, real estate and transport.
|
||||
|
Overview of Sustainable Transitions Financed
|
|||||
|
In EUR million
|
2014
|
2013
|
2012
|
||
|
ING Groenbank
|
836
|
769
|
804
|
||
|
Loans to renewable energy projects
|
1,730
|
1,275
|
1,065
|
||
|
Loans to other projects
|
768
|
224
|
3
|
||
|
Loans to environmental outperformers*
|
16,142
|
n.a.
|
n.a.
|
||
|
Total
|
19,476
|
2,268
|
1,872
|
||
|
* Going forward, ING will report this amount representing clients who have been identified as environmental outperformers based on a reputable external independent data provider or internal client assessments.
|
|||||
|
A growing portfolio in renewables
The share of renewables among the electricity-generating projects in the Structured Finance Power portfolio continued a trend of gradual increase, from 23% in 2009 to 43% in 2014.
In the fourth quarter, ING acted as joint-lead arranger of the Burgos 150-megawatt wind farm in the Philippines. As the largest wind farm in the Philippines, it was awarded the Project Finance International ‘Asia-Pacific Renewables Deal of the Year’. Once completed, Burgos will generate enough energy for more than one million households and displace 200,000 tonnes of carbon per year - the equivalent of removing all cars from the streets of London for 10 days.
Sustainable Assets Under Management ING makes a distinction between its financing activities for sustainable clients and projects and the investment funds and portfolios that are offered by ING Private Banking and managed according to sustainability criteria. The latter is classified as “Sustainable Assets under Management” (SAuM). In 2014 SAuM managed by ING amounted to EUR 1,538 million, reflecting a steady increase in the appetite of our clients for sustainable investments over previous years.
RobecoSAM ‘Gold Class’ distinction
RobecoSAM ‘Industry Leader’ ING Group was awarded the ‘Gold Class’ distinction in the industry Diversified Financials for its sustainability performance in 2014. Each year, over 3,000 of the world’s largest companies are invited to participate in the RobecoSAM Corporate Sustainability Assessment. The top performing company within each of the 59 industries is named the RobecoSAM ‘Industry Leader’ and is considered to be best prepared to seize the opportunities and manage the risks deriving from economic, environmental and social developments.
|
|||||
| 24 | ING GROUP PRESS RELEASE 4Q2014 |
CONSOLIDATED PROFIT AND LOSS ACCOUNT ING GROUP
|
ING Group: Consolidated profit and loss account
|
||||||||
|
Total ING Group
|
of which:
Retail Banking
|
of which:
Commercial Banking
|
of which:
Corporate Line Banking
|
|||||
|
In EUR million
|
4Q2014
|
4Q20131)
|
4Q2014
|
4Q2013
|
4Q2014
|
4Q2013
|
4Q2014
|
4Q2013
|
|
Interest result
|
3,208
|
2,946
|
2,341
|
2,205
|
900
|
748
|
-34
|
-7
|
|
Commission income
|
556
|
562
|
318
|
319
|
239
|
245
|
-1
|
-1
|
|
Investment income
|
25
|
64
|
5
|
11
|
21
|
54
|
||
|
Other income
|
-34
|
242
|
27
|
24
|
-47
|
154
|
-14
|
64
|
|
Total underlying income
|
3,756
|
3,815
|
2,691
|
2,559
|
1,113
|
1,201
|
-49
|
55
|
|
Staff and other expenses
|
2,543
|
2,319
|
1,861
|
1,632
|
700
|
630
|
-18
|
57
|
|
Intangibles amortisation and impairments
|
29
|
32
|
12
|
2
|
16
|
24
|
1
|
6
|
|
Operating expenses
|
2,572
|
2,351
|
1,873
|
1,633
|
716
|
654
|
-17
|
63
|
|
Gross result
|
1,183
|
1,464
|
818
|
926
|
397
|
547
|
-32
|
-8
|
|
Addition to loan loss provisions
|
400
|
560
|
248
|
384
|
152
|
177
|
-
|
-
|
|
Underlying result before tax Banking
|
783
|
904
|
570
|
542
|
245
|
370
|
-32
|
-8
|
|
Taxation
|
215
|
199
|
180
|
165
|
60
|
103
|
-25
|
-69
|
|
Minority interests
|
20
|
19
|
15
|
15
|
5
|
5
|
||
|
Underlying net result Banking
|
548
|
686
|
376
|
362
|
180
|
262
|
-7
|
61
|
|
Net gains/losses on divestments
|
||||||||
|
Net result from divested units
|
||||||||
|
Special items after tax
|
-18
|
-19
|
-18
|
-19
|
||||
|
Net result Banking
|
530
|
666
|
357
|
343
|
180
|
262
|
-7
|
61
|
|
Net result Insurance Other
|
14
|
-26
|
||||||
|
Net result intercompany elimination between ING Bank and NN Group
|
-12
|
-22
|
||||||
|
Net result from discontinued operations NN Group2)
|
226
|
-171
|
||||||
|
Net result from discontinued operations Voya Financial
|
418
|
179
|
||||||
|
Net result ING Group
|
1,176
|
626
|
||||||
|
ING Group: Consolidated profit and loss account
|
||||||||
|
Total ING Group
|
of which:
Retail Banking
|
of which:
Commercial Banking
|
of which:
Corporate Line Banking
|
|||||
|
In EUR million
|
FY2014
|
FY20131)
|
FY2014
|
FY2013
|
FY2014
|
FY2013
|
FY2014
|
FY2013
|
|
Interest result
|
12,376
|
11,804
|
9,103
|
8,482
|
3,473
|
3,292
|
-201
|
30
|
|
Commission income
|
2,290
|
2,244
|
1,332
|
1,284
|
960
|
964
|
-2
|
-5
|
|
Investment income
|
206
|
319
|
37
|
119
|
161
|
203
|
8
|
-3
|
|
Other income
|
424
|
938
|
212
|
277
|
333
|
953
|
-121
|
-292
|
|
Total underlying income
|
15,296
|
15,305
|
10,685
|
10,162
|
4,927
|
5,412
|
-316
|
-269
|
|
Staff and other expenses
|
8,891
|
8,558
|
6,396
|
6,152
|
2,393
|
2,308
|
102
|
98
|
|
Intangibles amortisation and impairments
|
88
|
136
|
37
|
31
|
37
|
78
|
14
|
27
|
|
Operating expenses
|
8,979
|
8,694
|
6,433
|
6,183
|
2,430
|
2,386
|
116
|
125
|
|
Gross result
|
6,317
|
6,611
|
4,252
|
3,980
|
2,497
|
3,026
|
-431
|
-395
|
|
Addition to loan loss provisions
|
1,594
|
2,288
|
1,094
|
1,421
|
500
|
867
|
-
|
-
|
|
Underlying result before tax Banking
|
4,724
|
4,323
|
3,158
|
2,558
|
1,997
|
2,160
|
-431
|
-395
|
|
Taxation
|
1,221
|
1,078
|
866
|
715
|
458
|
520
|
-103
|
-157
|
|
Minority interests
|
79
|
90
|
54
|
63
|
26
|
27
|
-
|
-
|
|
Underlying net result Banking
|
3,424
|
3,155
|
2,239
|
1,780
|
1,513
|
1,613
|
-328
|
-238
|
|
Net gains/losses on divestments
|
202
|
-6
|
202
|
-6
|
-957
|
25
|
||
|
Net result from divested units
|
-37
|
-37
|
||||||
|
Special items after tax
|
-1,021
|
-82
|
-63
|
-107
|
||||
|
Net result Banking
|
2,606
|
3,031
|
2,378
|
1,631
|
1,513
|
1,613
|
-1,286
|
-213
|
|
Net result Insurance Other
|
107
|
117
|
||||||
|
Net result intercompany elimination between ING Bank and NN Group
|
-55
|
-97
|
||||||
|
Net result from discontinued operations NN Group2)
|
65
|
455
|
||||||
|
Net result from discontinued operations Voya Financial
|
-1,471
|
40
|
||||||
|
Net result ING Group
|
1,251
|
3,545
|
||||||
|
1)
|
The figures of this period have been restated to reflect the classification of NN Group as Held for sale/Discontinued operations.
|
|
2)
|
The net result of discontinued operations NN Group before intercompany elimination was EUR 214 million in 4Q2014 (4Q2013: EUR -193 million, FY 2014: EUR 10 mil- lion, FY2013: EUR 358 million). Furthermore, the 4Q2014 and FY2014 net result from discontinued operations NN Group includes EUR 82 million and EUR -321 million, respectively, on the classification of NN Group as held for sale as per 30 September 2014.
|
| ING GROUP PRESS RELEASE 4Q2014 | 25 |
OUR QUARTERLY PUBLICATIONS
Additional information is available in the following documents on www.ing.com:
|
●
|
ING Group Historical Trend Data
|
|
●
|
ING Group Analyst Presentation
|
|
●
|
ing.world, ING Group’s online magazine, for anyone who is interested in ING
|
IMPORTANT LEGAL INFORMATION
|
ING Group’s Annual Accounts are prepared in accordance with International Financial Reporting Standards as adopted by the European Union (‘IFRS-EU’).
In preparing the financial information in this document, the same accounting principles are applied as in the 3Q2014 ING Group Interim Accounts.
The Financial statements for 2014 are in progress and may be subject to adjustments from subsequent events.
All figures in this document are unaudited. Small differences are possible in the tables due to rounding.
Certain of the statements contained herein are not historical facts, including, without limitation, certain statements made of future expectations and other forward-looking statements that are based on management’s current views and assumptions and involve known and unknown risks and uncertainties that could cause actual results, performance or events to differ materially from those expressed or implied in such statements. Actual results, performance or events may differ materially from those in such statements due to, without limitation: (1) changes in general economic conditions, in particular economic conditions in ING’s core markets, (2) changes in performance of financial markets, including developing markets, (3) consequences of a potential (partial) break-up of the euro, (4) the implementation of ING’s restructuring plan to separate banking and insurance operations, (5) changes in the availability of, and costs associated with, sources of liquidity such as interbank funding, as well as
|
conditions in the credit markets generally, including changes in borrower and counterparty creditworthiness, (6) the frequency and severity of insured loss events, (7) changes affecting mortality and morbidity levels and trends, (8) changes affecting persistency levels, (9) changes affecting interest rate levels, (10) changes affecting currency exchange rates, (11) changes in investor, customer and policyholder behaviour, (12) changes in general competitive factors, (13) changes in laws and regulations, (14) changes in the policies of governments and/or regulatory authorities, (15) conclusions with regard to purchase accounting assumptions and methodologies, (16) changes in ownership that could affect the future availability to us of net operating loss, net capital and built-in loss carry forwards, (17) changes in credit ratings, (18) ING’s ability to achieve projected operational synergies and (19) the other risks and uncertainties detailed in the Risk Factors section contained in the most recent annual report of ING Groep N.V. Any forward-looking statements made by or on behalf of ING speak only as of the date they are made, and, ING assumes no obligation to publicly update or revise any forward- looking statements, whether as a result of new information or for any other reason.
This document does not constitute an offer to sell, or a solicitation of an offer to purchase, any securities in the United States or any other jurisdiction. The securities of NN Group have not been and will not be registered under the U.S. Securities Act of 1933, as amended (the “Securities Act”), and may not be offered or sold within the United States absent registration or an applicable exemption from the registration requirements of the Securities Act.
|
| 26 | ING GROUP PRESS RELEASE 4Q2014 |
SIGNATURE
Pursuant to the requirements of the Securities Exchange Act of 1934, the registrant has duly caused this report to be signed on its behalf by the undersigned, thereunto duly authorized.
|
ING Groep N.V.
|
|||
|
(Registrant)
|
|||
|
By:
|
/s/ P. Jong
|
||
|
P. Jong
|
|||
|
Global Head of Communications
|
|||
|
By:
|
/s/ C. Blokbergen
|
||
|
C. Blokbergen
|
|||
|
Head Legal Department
|
Dated: 11 February, 2015
Serious News for Serious Traders! Try StreetInsider.com Premium Free!
You May Also Be Interested In
- Stockholm Exergi Selects Hansen to Automate and Optimise Power Trading Operations
- American Strategic Investment Co. Announces Release Date for First Quarter Results
- Essential Utilities Donated $5.5 Million in 2023 to Strengthen Communities Across Service Territory
Create E-mail Alert Related Categories
SEC FilingsSign up for StreetInsider Free!
Receive full access to all new and archived articles, unlimited portfolio tracking, e-mail alerts, custom newswires and RSS feeds - and more!
