

Form 6-K GENETIC TECHNOLOGIES For: Sep 25
 Tweet
Tweet Share
Share
FORM 6-K
U.S. SECURITIES AND EXCHANGE COMMISSION
Washington, D.C. 20549
REPORT OF FOREIGN PRIVATE ISSUER
PURSUANT TO RULE 13a-16 OR 15d-16 UNDER THE
SECURITIES EXCHANGE ACT OF 1934
dated September 25, 2015
Commission File Number 0-51504
GENETIC TECHNOLOGIES LIMITED
(Exact Name as Specified in its Charter)
N/A
(Translation of Registrant’s Name)
60-66 Hanover Street
Fitzroy
Victoria 3065 Australia
(Address of principal executive offices)
Indicate by check mark whether the registrant files or will file annual reports under cover of Form 20-F or Form 40-F.
|
Form 20-F x |
Form 40-F o |
Indicate by check mark if the registrant is submitting the Form 6-K in paper as permitted by Regulation S-T Rule 101(b)(1): o
Indicate by check mark if the registrant is submitting the Form 6-K in paper as permitted by Regulation S-T Rule 101(b)(7): o
Indicate by check mark whether by furnishing the information contained in this Form, the registrant is also thereby furnishing the information to the Commission pursuant to Rule 12g3-2(b) under the Securities Exchange Act of 1934.
|
Yes o |
No x |
If “Yes” is marked, indicate below the file number assigned to the registrant in connection with Rule 12g3-2(b): Not applicable.
SIGNATURES
Pursuant to the requirements of the Securities Exchange Act of 1934, the registrant has duly caused the Report to be signed on its behalf by the undersigned, thereunto duly authorized.
|
Date: September 25, 2015 |
| |
|
|
| |
|
|
GENETIC TECHNOLOGIES LIMITED | |
|
|
| |
|
|
| |
|
|
By: |
/s/ Bronwyn Christie |
|
|
|
Name: Bronwyn Christie |
|
|
|
Title: Company Secretary |
Exhibit 99.1
|
|
Genetic Technologies Annual Report 2015 Personalising health |

|
|
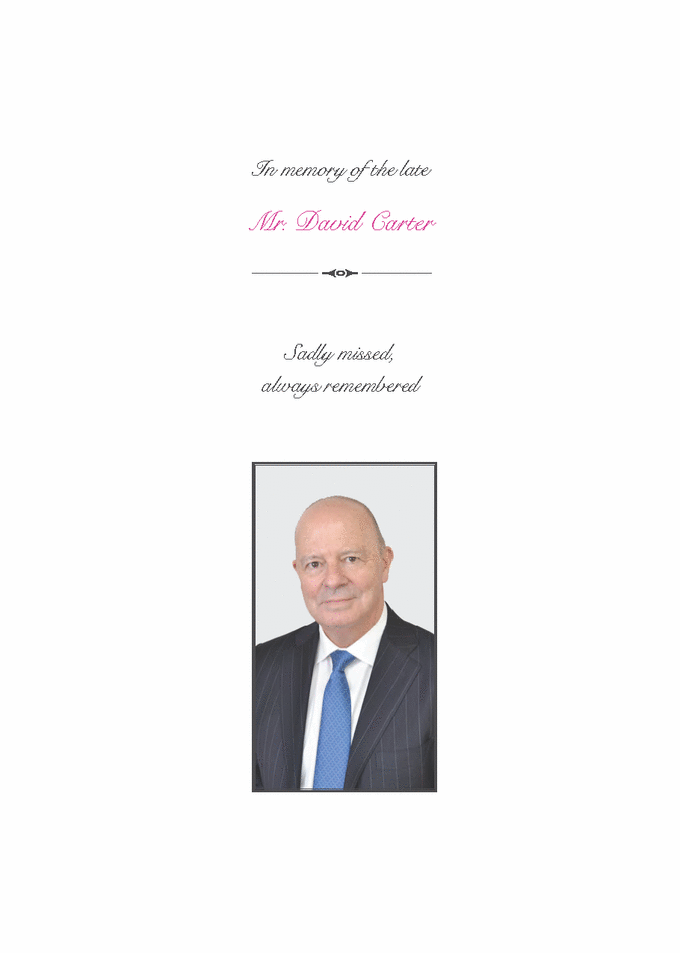
In memory of the late Mr. David Carter Sadly missed, always remembered |
|
|
ABOUT GENETIC TECHNOLOGIES (GTG) Founded in 1989, Genetic Technologies is an established Australian-based global genetic testing business specialising in cancer diagnostics, with a focus on women’s health. Listed on the ASX (GTG) in 2000 and NASDAQ (GENE) in 2005, the Company has established a successful fee-for-service genetic testing business that is primarily focused on the U.S. market. From its headquarters in Melbourne, Victoria, the Company’s laboratory holds a number of accreditations including: » The Clinical Laboratory Improvement Amendments (CLIA) license required for all laboratories offering test in the U.S.; » The Clinical Laboratory Evaluation Program (CLEP) license, an additional certification required to offer tests in New York State; » A Medical Device Establishment License (MDEL required for Canada); » The BREVAGenplus® test is CE marked for sale in Europe; and » The laboratory complies with the International Organisation for Standardisation (ISO), enabling it to accept test samples from anywhere in the world Following its acquisition in 2010 of a proprietary breast cancer risk assessment test named BREVAGen™, the Company established a permanent office in North Carolina from which its current U.S. sales activities are based. CONTENTS 01 ABOUT GENETIC TECHNOLOGIES 38 CONSOLIDATED BALANCE SHEET 02 CHAIrmAN AND CEO’S mESSAGE 39 CONSOLIDATED STATEmENT OF CASH FLOWS 04 BOArD OF DIrECTOrS AND SENIOr mANAGEmENT 40 CONSOLIDATED STATEmENT OF CHANGES IN EQUITY 06 CANCEr DIAGNOSTICS 41 NOTES TO THE FINANCIAL STATEmENTS 08 BrEVAGenplus® 16 LICENSING AND IP 75 DIrECTOrS’ DECLArATION 16 NON-COrE ASSETS 76 AUDITOr’S rEPOrT 18 DIrECTOrS’ rEPOrT 78 AUDITOr’S INDEPENDENCE DECLArATION 36 COrPOrATE GOVErNANCE STATEmENT 79 ASX ADDITIONAL INFOrmATION 37 CONSOLIDATED STATEmENT OF COmPrEHENSIVE INCOmE IBC COrPOrATE INFOrmATION 01 GENETIC TECHNOLOGIES ANNUAL REPORT 2015 |
|
|
CHAIRMAN AND CEO’S MESSAGE PRIMED TO MOvE fORwARD Without question, securing sufficient capital resources to enable proper execution of our “next generation” plan was a top priority. This was a ground-breaking milestone for the Company. It is a pleasure to provide an introduction to the 2015 Annual Report. This financial year was a tipping point for Genetic Technologies as we streamlined operations and focused on executing an ambitious commercial strategy for BREVAGenplus®, our flagship first-in-class risk assessment test for non-hereditary breast cancer. Dr. mALCOLm r. BrANDON Non-Executive Chairman The catalyst for the transformation was the undertaking of a major operational restructuring, which commenced at the start of the fiscal year, having made the strategic decision to shift the Company’s entire focus to the U.S. molecular diagnostics market and to become a commercially driven organisation. As such, we divested all non-core assets, realigned corporate spending and restructured the Board of Directors to best serve our revised mission of being a pre-eminent provider of diagnostic tests that affect clinical outcomes in women’s health. Leading this effort is Eutillio Buccilli, who was appointed to the post of Chief Executive Officer in February of 2015. Eutillio originally joined the company as Chief Financial Officer in June 2014 and had been appointed Chief Operating Officer and Chief Financial Officer in November of 2015. His broad expertise across the areas of finance, corporate governance and commercial development gave us the confidence to launch this transformation. Additionally, we recently appointed Mr. Brian Manuel as Chief Financial Officer. His 25 plus years of experience, including over a decade in Chief Financial Officer level positions for companies listed on the ASX, bring broad financial knowledge and business acumen to the Company. Without question, securing sufficient capital resources to enable proper execution of our “next generation” plan was a top priority. We partnered with Maxim Group. LLC, a U.S. based investment bank and, on March 6th, announced an AUD$18.6 million placement. This was a groundbreaking milestone for the Company as it represents the first time in many years that we are properly financed to execute our strategic plans without being hampered by a lack of resources. To this end, as we escalate the commercial program for BREVAGenplus, we have revised our sales and marketing strategy to target large comprehensive breast treatment and imaging centres, in addition to our ongoing outreach to independent physician and women’s healthcare providers. We expect this emphasis on establishing relationships with large breast health centres to facilitate our growth rate and reduce revenue volatility. Throughout the year, we remained on target with guidance and are delighted with the timing of the launch of BREVAGenplus, which was in-line with our previous guidance of bringing the product to market during Breast Cancer Awareness month (October 2014). This easy-to-use predictive risk test for women at risk of developing sporadic, or non-hereditary breast cancer represents an enhancement in accuracy and broader patient applicability compared to our first generation product, BREVAGen™. BREVAGenplus assesses both genetic information and clinical data to determine a woman’s five-year and lifetime risk of developing the disease. It is designed to facilitate better-informed decisions about breast cancer screening and preventive treatment plans. The enhanced test utilises a 10-fold expanded SNP panel and extends test efficiency to additional ethnicities - beyond Caucasian women of the first generation test, to include African American and Hispanic women. 02 |

|
|
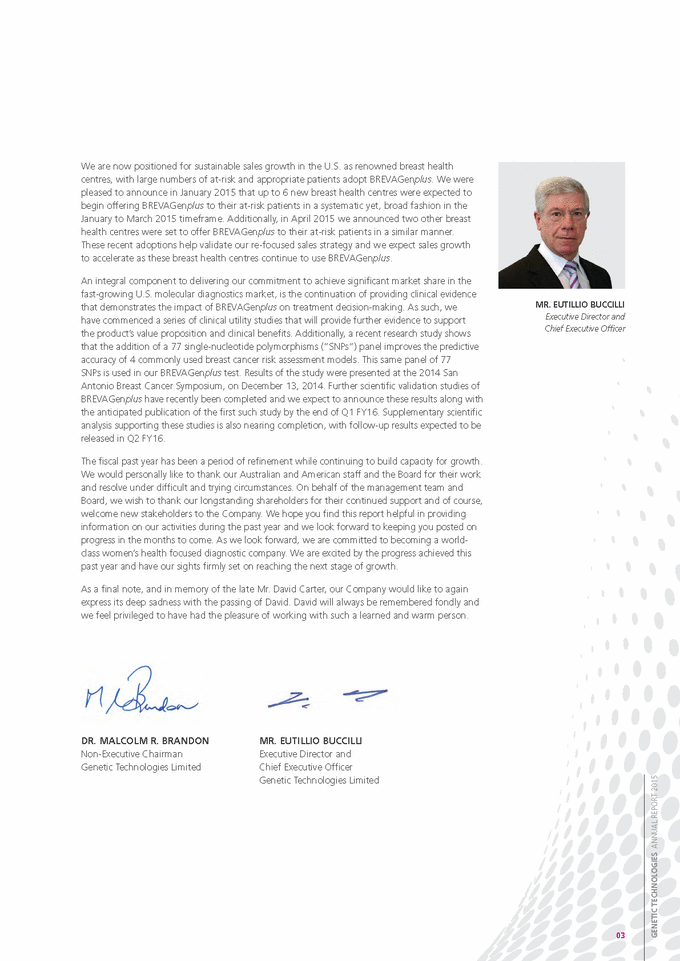
We are now positioned for sustainable sales growth in the U.S. as renowned breast health centres, with large numbers of at-risk and appropriate patients adopt BREVAGenplus. We were pleased to announce in January 2015 that up to 6 new breast health centres were expected to begin offering BREVAGenplus to their at-risk patients in a systematic yet, broad fashion in the January to March 2015 timeframe. Additionally, in April 2015 we announced two other breast health centres were set to offer BREVAGenplus to their at-risk patients in a similar manner. These recent adoptions help validate our re-focused sales strategy and we expect sales growth to accelerate as these breast health centres continue to use BREVAGenplus. An integral component to delivering our commitment to achieve significant market share in the fast-growing U.S. molecular diagnostics market, is the continuation of providing clinical evidence that demonstrates the impact of BREVAGenplus on treatment decision-making. As such, we have commenced a series of clinical utility studies that will provide further evidence to support the product’s value proposition and clinical benefits. Additionally, a recent research study shows that the addition of a 77 single-nucleotide polymorphisms (“SNPs”) panel improves the predictive accuracy of 4 commonly used breast cancer risk assessment models. This same panel of 77 SNPs is used in our BREVAGenplus test. Results of the study were presented at the 2014 San Antonio Breast Cancer Symposium, on December 13, 2014. Further scientific validation studies of BREVAGenplus have recently been completed and we expect to announce these results along with the anticipated publication of the first such study by the end of Q1 FY16. Supplementary scientific analysis supporting these studies is also nearing completion, with follow-up results expected to be released in Q2 FY16. mr. EUTILLIO BUCCILLI Executive Director and Chief Executive Officer The fiscal past year has been a period of refinement while continuing to build capacity for growth. We would personally like to thank our Australian and American staff and the Board for their work and resolve under difficult and trying circumstances. On behalf of the management team and Board, we wish to thank our longstanding shareholders for their continued support and of course, welcome new stakeholders to the Company. We hope you find this report helpful in providing information on our activities during the past year and we look forward to keeping you posted on progress in the months to come. As we look forward, we are committed to becoming a world-class women’s health focused diagnostic company. We are excited by the progress achieved this past year and have our sights firmly set on reaching the next stage of growth. As a final note, and in memory of the late Mr. David Carter, our Company would like to again express its deep sadness with the passing of David. David will always be remembered fondly and we feel privileged to have had the pleasure of working with such a learned and warm person. Dr. mALCOLm r. BrANDON Non-Executive Chairman Genetic Technologies Limited mr. EUTILLIO BUCCILLI Executive Director and Chief Executive Officer Genetic Technologies Limited 03 GENETIC TECHNOLOGIES ANNUAL REPORT 2015 |
|
|
BOARD OF DIRECTORS and SENIOR MANAGEMENT Dr. Malcolm R. Brandon Non-Executive Chairman Dr. Brandon was appointed to the Board in October 2009 and was appointed Chairman in November 2013. He has over 39 years’ experience in commercially focused research and development and in building successful companies which have commercialised a wide range of Australian and international technologies. Dr. Brandon is currently Managing Director of genetics and artificial animal breeding company Clone International which uses cloning technologies to preserve the genetics of elite animals. Dr. Paul Kasian Non-Executive Director Dr. Kasian was appointed to the Board on 12 December 2013. He brings to the Board a combination of expertise in strategic business leadership and biotech investment giving him a deep understanding on key value drivers for companies in generating shareholder value. He is an experienced executive director with demonstrated domestic and international success in funds management, encompassing senior leadership, investment and risk roles. Dr. Kasian has held senior leadership positions in a number of investment groups, and has significant funds management experience in Australia leading investment in the healthcare and life sciences sector. He holds a PhD in Microbiology and a Master of Business Administration, both from the University of Melbourne. Mr. Grahame Leonard AM Non-Executive Director Mr. Leonard was appointed to the Board on 29 November 2013. He is a qualified Lawyer and Chartered Accountant. He brings over 35 years in the corporate world including Lysaght (BHP), BTR Nylex and The Thompson Corporation. His numerous community positions include Commissioner, Victorian Multicultural Commission and Director of Transparency International Australia, (the Australian arm of the international anti-corruption watchdog). Dr. Lindsay Wake field M.B.B.S Non-Executive Director Dr. Wakefield was appointed to the Board on September 24, 2014. Dr. Wakefield started Safetech in 1985. In 1993, he left Medicine to become the fulltime CEO of the Company. Over the next 25 years, Safetech became a force in the Australian material handling and lifting equipment market, designing and manufacturing a wide range of industrial products. In 2006, Safetech was awarded the Telstra Australian National Business of the Year. In 2013, Safetech merged to become STS (Safetech Tieman Solutions) which is Australia’s largest manufacturer and supplier of dock equipment, freight hoists and custom lifting solutions. Dr. Wakefield continues as Managing Director of STS and has been a keen Biotech investor for past 20 years, often at a mezzanine level. |

|
|
MR. Eutillio Buccilli Executive Director and Chief Executive Officer Mr. Buccilli was appointed Executive Director and Chief Executive Officer on June 12, 2015. Mr. Buccilli joined the Company in June 2014 as Chief Financial Officer. In November 2014, he was appointed to the position of Chief Operating Officer and Chief Financial Officer and was subsequently appointed Chief Executive Officer in February 2015. Mr. Buccilli has more than 35 years of senior management experience in the financial services, contracting and recruitment, property and retail industries in Australia and the U.S. He has held senior management positions with blue chip corporations such as General Electric (“GE”), Computer Science Corporation, Coles Myer and Challenger Limited. Whilst at GE, Mr. Buccilli was seconded to the U.S., where he worked at the GE Capital Headquarters located in Stamford Connecticut. He brings with him extensive financial, corporate governance, commercial and fund raising experience. MR. Brian Manuel Chief Financial Officer and Joint Company Secretary Mr. Manuel joined the Company in June 2015 as Chief Financial Officer and in July 2015 he was appointed to the position of Joint Company Secretary. He is a Fellow Chartered Accountant and a Fellow of the Governance Institute of Australia. Of his 25 plus years of experience, more than a decade has been at the CFO level for companies listed on the ASX including the biotech company Cellestis Ltd, as the CFO and Company Secretary until its acquisition in 2011. He brings broad business acumen to the Company in addition to his strong foundation in finance, IT and corporate governance. Dr. Richard Allman Scientific Director Dr. Allman joined the Company in 2004 and was appointed as Scientific Director in December 2012. He has over 20 years of scientific and research experience in both the academic arena in the UK and the commercial sector in Australia. He has wide experience in research leadership, innovation management, and intellectual property strategy, covering oncology, diagnostics, and product development. Prior to entering the biotech sector, Dr. Allman’s academic career encompassed oncology research, drug development, and assay design. MS. Diana Newport Quality and Business Operations Director Ms. Newport was appointed as Quality and Business Operations Director in September 2013. She comes to the Company with extensive international Quality Systems and operational experience in the highly regulated industries of food and pharmaceutical. The Company will benefit from her recent senior roles within the CSL quality control laboratories. GENETIC TECHNOLOGIES ANNUAL REPORT 2015 05 |

|
|
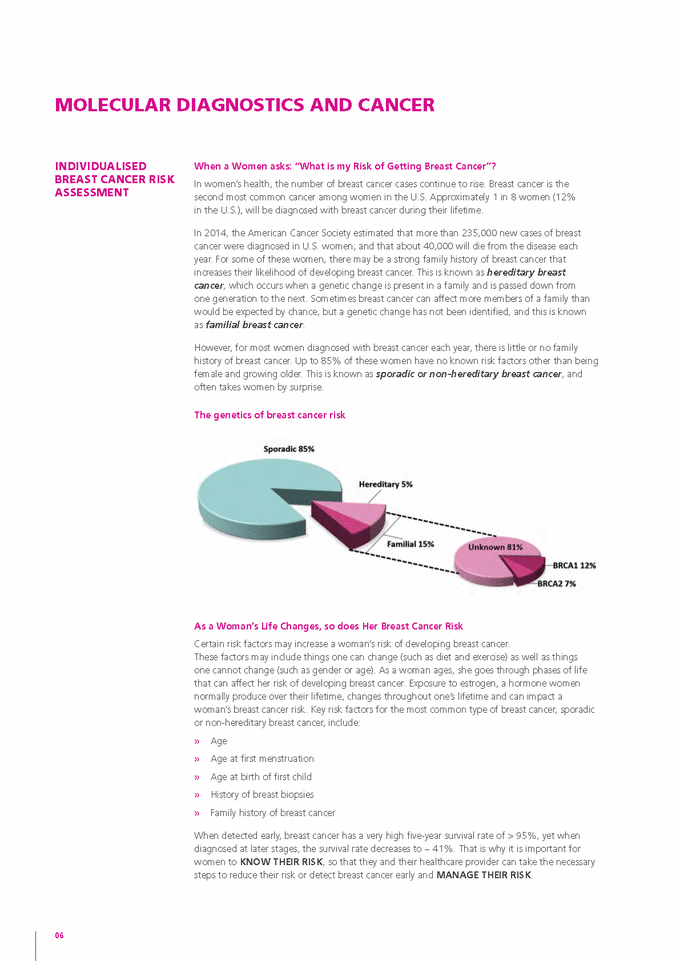
MOLECULAR DIAGNOSTICS AND CANCER INDIvIDUALISED BREAST CANCER RISK ASSESSMENT When a Women asks: “What is my risk of Getting Breast Cancer”? In women’s health, the number of breast cancer cases continue to rise. Breast cancer is the second most common cancer among women in the U.S. Approximately 1 in 8 women (12% in the U.S.), will be diagnosed with breast cancer during their lifetime. In 2014, the American Cancer Society estimated that more than 235,000 new cases of breast cancer were diagnosed in U.S. women; and that about 40,000 will die from the disease each year. For some of these women, there may be a strong family history of breast cancer that increases their likelihood of developing breast cancer. This is known as hereditary breast cancer, which occurs when a genetic change is present in a family and is passed down from one generation to the next. Sometimes breast cancer can affect more members of a family than would be expected by chance, but a genetic change has not been identified, and this is known as familial breast cancer. However, for most women diagnosed with breast cancer each year, there is little or no family history of breast cancer. Up to 85% of these women have no known risk factors other than being female and growing older. This is known as sporadic or non-hereditary breast cancer, and often takes women by surprise. The genetics of breast cancer risk As a Woman’s Life Changes, so does Her Breast Cancer risk Certain risk factors may increase a woman’s risk of developing breast cancer. These factors may include things one can change (such as diet and exercise) as well as things one cannot change (such as gender or age). As a woman ages, she goes through phases of life that can affect her risk of developing breast cancer. Exposure to estrogen, a hormone women normally produce over their lifetime, changes throughout one’s lifetime and can impact a woman’s breast cancer risk. Key risk factors for the most common type of breast cancer, sporadic or non-hereditary breast cancer, include: » » » » » Age Age at first menstruation Age at birth of first child History of breast biopsies Family history of breast cancer When detected early, breast cancer has a very high five-year survival rate of > 95%, yet when diagnosed at later stages, the survival rate decreases to ~ 41%. That is why it is important for women to KNOW THEIr rISK, so that they and their healthcare provider can take the necessary steps to reduce their risk or detect breast cancer early and mANAGE THEIr rISK. 06 |
|
|
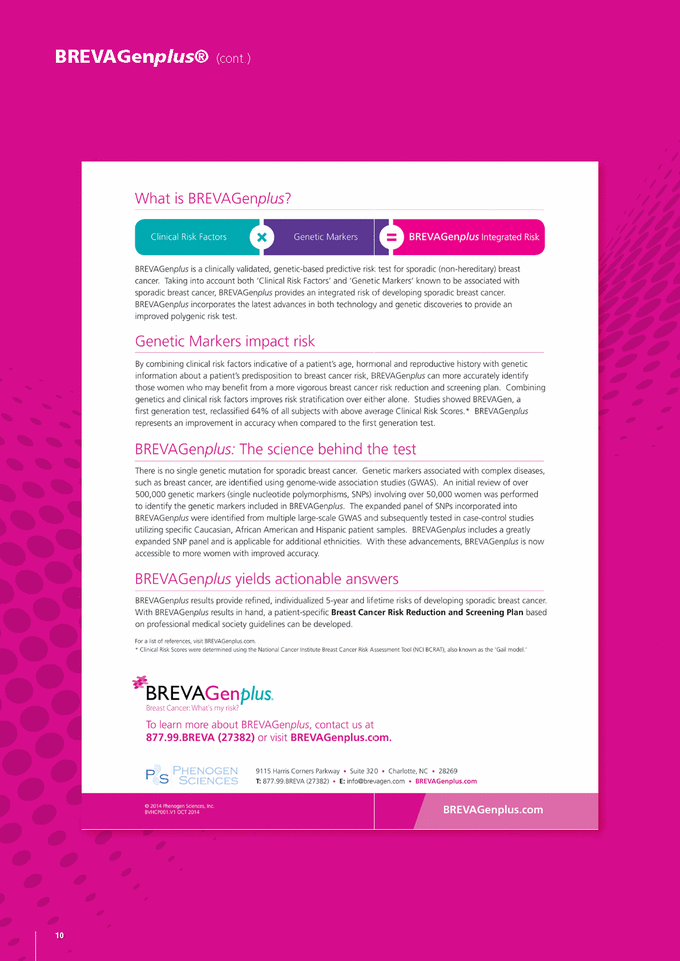
Description of brochure at right. Quantifying Breast Cancer risk Even though studies have shown that 1 in 8 women will be diagnosed with breast cancer during their lifetime, an individual’s risk may be higher (or lower) than that. Combining one’s ‘Clinical Risk Factors’ with ‘Genetic Marker’ information from a woman’s own DNA, a personalised risk of developing sporadic (non-hereditary) breast cancer can be determined. A woman’s healthcare provider can determine whether any clinical risk factors, for breast cancer, exist by asking questions about that individual’s personal, reproductive and family history. In addition, scientists have discovered that the presence of certain genetic markers in a woman’s DNA can impact the risk of developing breast cancer. Depending on a woman’s genetic make-up, some genetic markers increase their breast cancer risk, while others may protect a woman against developing breast cancer. In delivering a percentage score for the risk of developing breast cancer over the next five years and over the patient’s lifetime, the result can be used to create an ongoing personalised breast health care plan. GENETIC MARKERS CLINICAL RISK BREVAGen™ INTEGRATED RISK = X Average Risk Integrated Lifetime Risk: < 15% Above Average Risk Integrated Lifetime Risk: 15% to 20% High Risk Integrated Lifetime Risk: > 20% Integrated 5-year Risk: > 1.66% 07 GENETIC TECHNOLOGIES ANNUAL REPORT 2015 |

|
|
– A CLEARER PICTURE Of BREAST CANCER RISK COMBINING CLINICAL RISK fACTORS AND GENETIC MARKERS fOR A MORE ACCURATE PERSONALISED INDICATION Of BREAST CANCER RISK What is BrEVAGenplus? BrEVAGenplus is a State-of-the-Art Breast Cancer risk Assessment Test designed to enable for a more personalised breast cancer risk assessment in a greater number of women The identification, in 2007, of a number of single nucleotide polymorphisms (SNPs), each with an associated small relative risk of breast cancer, led to the development of the first commercially available genetic risk test for sporadic breast cancer, BREVAGenTM. The Company launched the product, in the U.S. in June 2011. In October 2014, Genetic Technologies released its next generation breast cancer risk assessment test, BREVAGenplus. This new version of the test incorporates a 10-fold expanded panel of genetic markers (SNPs), known to be associated with the development of sporadic breast cancer, providing an increase in predictive power relative to its first-generation predecessor test. In addition, the new test is clinically validated in a broader population of women including, African American and Hispanic women. This increases the applicable market beyond the Caucasian only indication of the first generation test, and simplifies the marketing process in medical clinics and breast health centres in the U.S. The expanded panel of SNPs incorporated into BREVAGenplus were identified from multiple large-scale genome-wide association studies and subsequently tested in case-control studies utilising specific Caucasian, African American and Hispanic patient samples. BREVAGenplus is a first-in-class, clinically validated, predictive risk test for sporadic breast cancer which examines a woman’s clinical risk factors, combined with seventy seven scientifically validated genetic biomarkers (SNPs), to allow for more personalised breast cancer risk assessment and risk management. Physicians worldwide look largely to family history of breast cancer as an indication of risk in patients for developing this disease. However, 85% of women who develop breast cancer have little or no family history of developing the disease and BREVAGenplus is designed to help elucidate risk in this group of women. Targeted towards women over the age of 35 who have little or no family history of breast cancer but harbour one or more known clinical risk factors such as early menstruation, late childbirth, late menopause, a history of atypical or benign breast biopsies, BREVAGenplus provides a more accurate tool for assessing a woman’s personal risk of developing breast cancer. In addition, women designated as having ‘dense breasts’ upon mammographic evaluation are recognised as being at elevated risk of developing breast cancer, which makes these patients potential candidates for the BREVAGenplus test. Several U.S. States have enacted legislation, which mandates that breast density be documented on mammogram reports, and encouraging physicians to discuss risk profiles and risk reduction strategies with these patients. Recent scientific evidence indicates that BREVAGenplus may help to properly identify the high risk women in this category. It is expected that more U.S. jurisdictions will adopt similar legislation in the coming years, increasing awareness of the correlation between dense breast and breast cancer risk amongst healthcare providers, patients and health insurance payers. 08 |
|
|
[LOGO] |

|
|
[LOGO] |
|
|
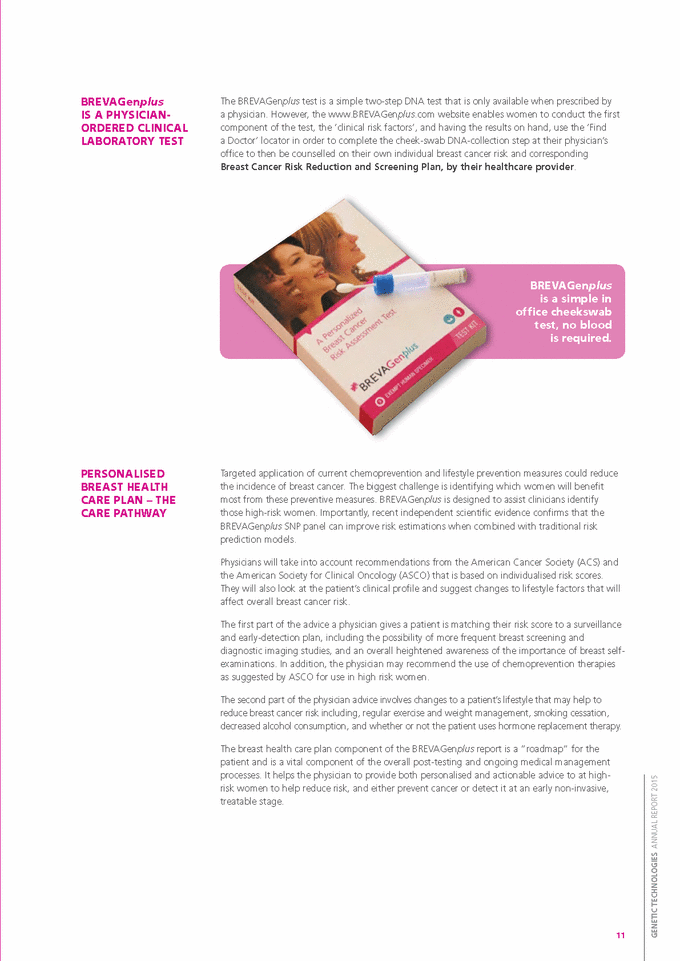
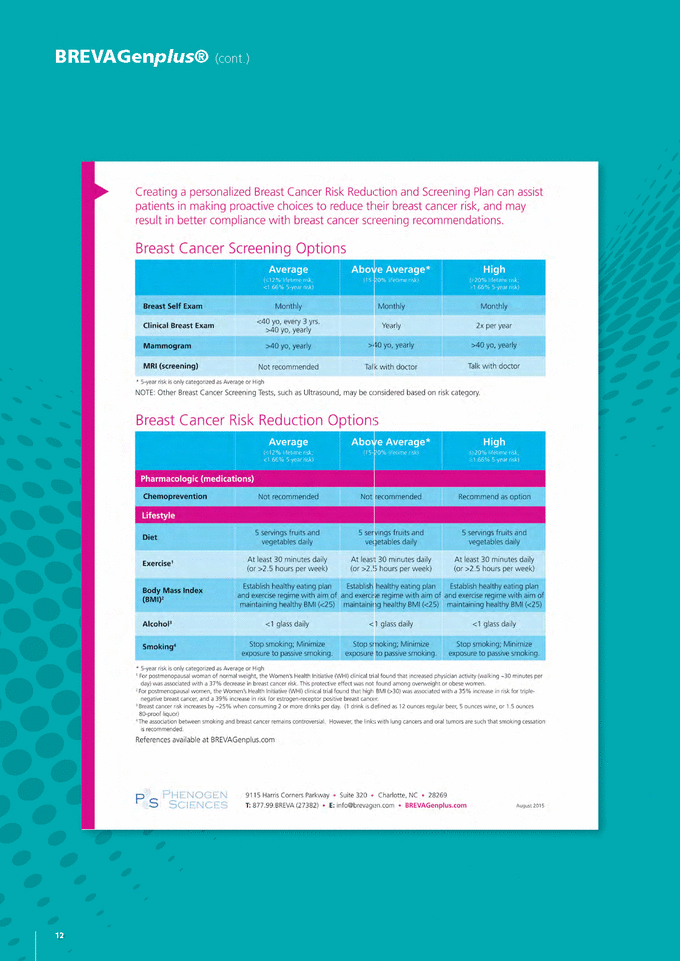
BREvAGenplus IS A PHySICIAN-ORDERED CLINICAL LABORATORy TEST The BREVAGenplus test is a simple two-step DNA test that is only available when prescribed by a physician. However, the www.BREVAGenplus.com website enables women to conduct the first component of the test, the ‘clinical risk factors’, and having the results on hand, use the ‘Find a Doctor’ locator in order to complete the cheek-swab DNA-collection step at their physician’s office to then be counselled on their own individual breast cancer risk and corresponding Breast Cancer risk reduction and Screening Plan, by their healthcare provider. BREvAGenplus is a simple in office cheekswab test, no blood is required. PERSONALISED BREAST HEALTH CARE PLAN – THE CARE PATHwAy Targeted application of current chemoprevention and lifestyle prevention measures could reduce the incidence of breast cancer. The biggest challenge is identifying which women will benefit most from these preventive measures. BREVAGenplus is designed to assist clinicians identify those high-risk women. Importantly, recent independent scientific evidence confirms that the BREVAGenplus SNP panel can improve risk estimations when combined with traditional risk prediction models. Physicians will take into account recommendations from the American Cancer Society (ACS) and the American Society for Clinical Oncology (ASCO) that is based on individualised risk scores. They will also look at the patient’s clinical profile and suggest changes to lifestyle factors that will affect overall breast cancer risk. The first part of the advice a physician gives a patient is matching their risk score to a surveillance and early-detection plan, including the possibility of more frequent breast screening and diagnostic imaging studies, and an overall heightened awareness of the importance of breast self-examinations. In addition, the physician may recommend the use of chemoprevention therapies as suggested by ASCO for use in high risk women. The second part of the physician advice involves changes to a patient’s lifestyle that may help to reduce breast cancer risk including, regular exercise and weight management, smoking cessation, decreased alcohol consumption, and whether or not the patient uses hormone replacement therapy. The breast health care plan component of the BREVAGenplus report is a “roadmap” for the patient and is a vital component of the overall post-testing and ongoing medical management processes. It helps the physician to provide both personalised and actionable advice to at high-risk women to help reduce risk, and either prevent cancer or detect it at an early non-invasive, treatable stage. 11 GENETIC TECHNOLOGIES ANNUAL REPORT 2015 |
|
|
[LOGO] |
|
|
ADDITIONAL CLINICAL UTILITy STUDIES AND PEER-REvIEwED PUBLICATIONS TO DRIvE REIMBURSE-MENT OUTCOME The Company had previously conducted multiple scientific studies to develop and validate the first generation BREVAGen test as well as created two health economic models to demonstrate potential cost savings and health benefits associated with the BREVAGen test. Importantly, due to the nature of the technology and the specific improvements incorporated in BREVAGenplus, the research undertaken and published based on the original version of the test remains applicable to the new BREVAGenplus test. Clinical support for BREVAGenplus was further enhanced with the release of findings from a new independent research study showing that adding a panel of 77 SNPs improves the predictive accuracy of four commonly used breast cancer risk assessment models. This same panel of 77 SNPs is used in the Company’s BREVAGenplus test. Results of the study were presented at the 2014 San Antonio Breast Cancer Symposium, on December 13, 2014. Further scientific validation studies of BREVAGenplus have recently been completed and the Company expects to announce the results along with the anticipated publication of the first such study by the end of Q1 FY16. Supplementary scientific analysis supporting these studies is also nearing completion, with follow-up results expected to be released in Q2 FY16. Following is a list of peer-reviewed publications on the BREVAGen test, to date: 1) “Cost-effectiveness of a Genetic Test for Breast Cancer risk”. Cancer prevention research. 2013 Dec; vol. 6 (12):1328-36. “Economic Evaluation of Using a Genetic Test to Direct Breast Cancer Chemoprevention in White Women with a Previous Breast Biopsy”. applied health Economics and health policy. 2014 apr; vol. 12 (2):203-17. “Using SNP genotypes to improve the discrimination of a simple breast cancer risk prediction model”. Breast Cancer res treat. 2013 Jun; vol. 139 (3):887-96. “Assessment of clinical validity of a breast cancer risk model combining genetic and clinical information”. J Natl Cancer inst. 2010 Nov 3; vol. 102 (21):1618-27. 2) 3) 4) And supporting presentations: 1) Jacoby E, DiCicco, Allman R. (2013). Impact of genomics on the assessment and management of breast cancer risk in a women’s healthcare clinic. Proceedings of the National Consortium of Breast Centres March 2013. Fohlse HJ, Dinh TA, Allman R. (2013). Genetic testing for breast cancer risk estimation – A cost-effectiveness analysis. Presented at The California Pacific Medical Centre Breast Cancer Risk Assessment Workshop June 2013. Fohlse HJ, Dinh TA, Allman R. (2013). Genetic testing for breast cancer risk estimation – A cost-effectiveness analysis. Presented at the San Antonio Breast Cancer Symposium December 2013. 2) 3) While these papers remain relevant to the BREVAGenplus test, they: 1) Underestimate its improved performance, due to its inclusion of a greatly expanded single-nucleotide polymorphism (SNP) panel; and 2) Do not capture the performance of BREVAGenplus in African American and Hispanic women, two groups for which the first test was not validated. 13 GENETIC TECHNOLOGIES ANNUAL REPORT 2015 |
|
|
BREvAGenplus® (cont.) Although the BREVAGen concept has already demonstrated market acceptance, the Company recognises that in order to secure wider commercial payer coverage and improve the level of commercial payer payments currently received, it needs to provide additional evidence that demonstrate the impact of the test on treatment decision-making that is aligned with payer evidence requirements. As such, Genetic Technologies is about to commence a series of clinical utility studies that will provide further evidence to support the product’s value proposition and clinical benefits. These study designs have been developed in conjunction with U.S. consultants (Boston Healthcare Associates, Inc.), incorporating feedback from medical directors and physicians. The first of three clinical trials planned is scheduled to begin in Q2 FY16 with completion expected before the end of FY16. Two longer-term clinical trials are also expected to commence within the current financial year and are designed to run for up to two years. One of the longer term studies will be prospective in design looking at patient outcomes, with the other being retrospective, assessing the impact of the test on MRI screening rates. The data obtained from these studies will be utilised in direct contracting discussions with insurers and self-insured employer groups. Peer-reviewed publications demonstrating the product’s utility in terms of patient outcomes and its impact on healthcare costs is the most powerful marketing tool for a product like BREVAGenplus. Such publications are crucial in convincing physicians’ to use a product and how much payers will pay for its use. Attaining such publications in medical journals will help to further strengthen the Company’s commercial position and accelerate reimbursement discussions with private payers. The Company is confident that further publications will ultimately lead to wider commercial payer coverage and or to improve the level of commercial payer payments currently received. Professional Guidelines and Position Statements Supporting Formal Breast Cancer risk Assessment and risk-reduction Interventions In July 2013, the American Society of Clinical Oncology published its updated clinical practice statement in the Journal of Clinical Oncology which more strongly supported the use of selective estrogen receptor modulators and one aromatase inhibitor in postmenopausal women who are at increased risk for breast cancer. The updated statement from ASCO was soon followed in September 2013 by the United States Preventive Services Task Force’s (USPSTF) final recommendation statement on medications for risk reduction of primary breast cancer in women. The Task Force’s recommendation stated that for women older than age 35 who have not been diagnosed with breast cancer, LCIS or DCIS, “after a formal breast cancer risk assessment, women at increased risk should talk with their health care professional about the potential benefits and harms of taking a risk-reducing medication such as tamoxifen or raloxifene.” These evidence-based clinical practice recommendations published during the last year further underscore the need for health care providers in the U.S. to perform a formal, individualized risk assessment for breast cancer using BREVAGen in women older than 35 years of age. 14 |
|
|
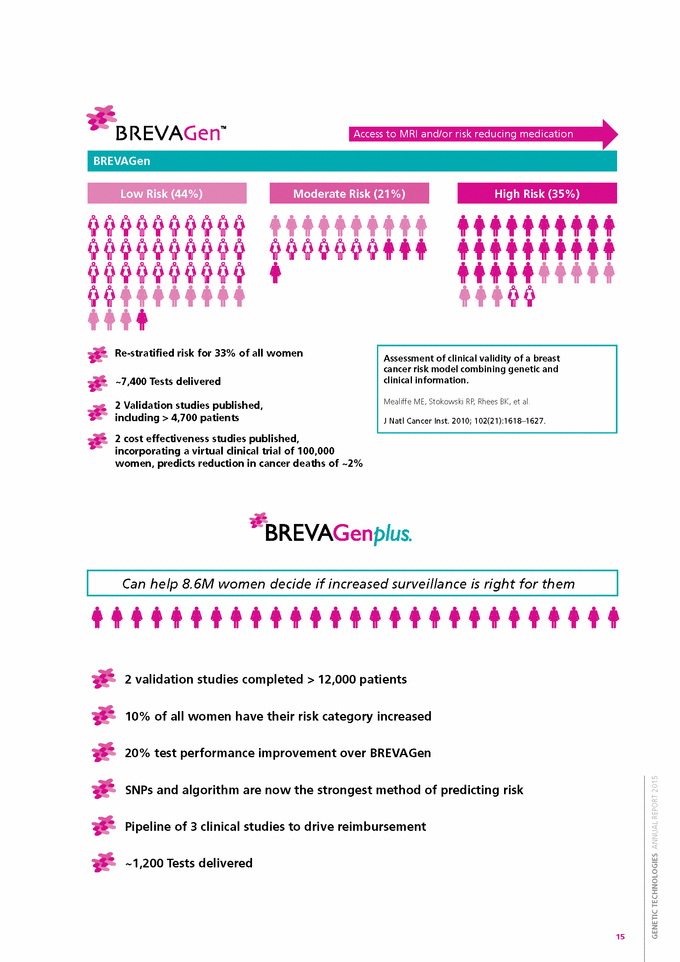
Access to MRI and/or risk reducing medication Re-stratified risk for 33% of all women ~7,400 Tests delivered 2 Validation studies published, including > 4,700 patients 2 cost effectiveness studies published, incorporating a virtual clinical trial of 100,000 women, predicts reduction in cancer deaths of ~2% 2 validation studies completed > 12,000 patients 10% of all women have their risk category increased 20% test performance improvement over BREVAGen SNPs and algorithm are now the strongest method of predicting risk Pipeline of 3 clinical studies to drive reimbursement ~1,200 Tests delivered 15 GENETIC TECHNOLOGIES ANNUAL REPORT 2015 Can help 8.6M women decide if increased surveillance is right for them Assessment of clinical validity of a breast cancer risk model combining genetic and clinical information. Mealiffe ME, Stokowski RP, Rhees BK, et al. J Natl Cancer Inst. 2010; 102(21):1618–1627. High Risk (35%) Moderate Risk (21%) Low Risk (44%) BREVAGen |
|
|
LICENSING AND IP NON-CODING ASSERTION PROGRAM As reported previously, on the 30 October 2014, Judge Stark issued a Memorandum Opinion finding Claim 1 of the Company’s foundation ‘179 patent ineligible and granted that Motion to Dismiss. Legal Counsel has now prepared an appeal to the decision in the Federal Circuit. It is anticipated that the appeal will be argued in September 2015, with a decision being issued between December 2015 and June 2016. Counsel sought and achieved a stay of all non-appealed actions pending resolution of the Appeal. Several of those cases are asserted against major pharmaceutical companies. If the appeal is successful in overturning Judge Stark’s decision, the pending cases will be resumed. Colorado-based law firm, Sheridan Ross, continues to assist the Company with its licensing and intellectual property activities. NON-CORE ASSETS DOMESTIC GENETIC TESTING During 2014, the Directors considered an offer by Specialist Diagnostic Services Ltd (SDS), the wholly owned pathology subsidiary of Primary Health Care Ltd., to purchase the assets of the Australian Genetic testing business, which included Paternity, Forensics, Animal and Medical testing for the ANZ region. In September 2014, the Company signed a binding Sale and Purchase Agreement with SDS. On 19 November 2014, the Company completed the sale of its heritage Australian Genetics business to SDS. Under the terms of sale, SDS acquired the Australian Genetics business for $2.0M, in cash. 16 |
|
|
[LOGO] |
|
|
DIRECTORS’ REPORT The Directors submit their Report for the year ended 30 June 2015. DIRECTORS The names and details of the Directors of Genetic Technologies Limited who held office during the 2015 financial year and until the date of this Report are stated below. Unless otherwise stated the following persons were directors during the whole of the financial year and up to the date of this report: Directors in office as at the date of this report Dr malcolm r. Brandon BScagr, phD (Non-Executive) Dr Brandon was appointed to the Board on 5 October 2009 and as its Chairman on 28 November 2012. He has over 39 years’ experience in commercially focused research and development and in building successful companies which have commercialised a wide range of Australian and international technologies. Dr Brandon is currently Managing Director of genetics and artificial animal breeding company Clone International which uses cloning technologies to preserve the genetics of elite animals. mr Eutillio Buccilli (Executive) In office as a Director from 12 June 2015 to the date of this Report. Mr Buccilli joined the Company in June 2014 as Chief Financial Officer. In November 2014, he was appointed to the position of Chief Operating Officer and Chief Financial Officer and was subsequently appointed Chief Executive Officer in February 2015. Mr Buccilli has more than 35 years of senior management experience in the financial services, contracting and recruitment, property and retail industries in Australia and the U.S. He has held senior management positions with blue chip corporations such as General Electric (“GE”), Computer Science Corporation, Coles Myer and Challenger Limited. Whilst at GE, Mr Buccilli was seconded to the U.S., where he worked at the GE Capital Headquarters located in Stamford Connecticut. He brings to the Board extensive financial, corporate governance, commercial and fund raising experience. Dr Paul A. Kasian, PhD, mBA (Non-Executive) Dr Kasian was appointed to the Board on 12 December 2013. He brings to the Board a combination of expertise in strategic business leadership and biotech investment giving him a deep understanding on key value drivers for companies in generating shareholder value. He is an experienced executive director with demonstrated domestic and international success in funds management, encompassing senior leadership, investment and risk roles. Dr Kasian has held senior leadership positions in a number of investment groups, and has significant funds management experience in Australia leading investment in the healthcare and life sciences sector. He holds a PhD in Microbiology and a Master of Business Administration, both from the University of Melbourne. mr Grahame Leonard am, Ba (hons), llB, Ca, Cpa, faiCD (Dip), afaim (Non-Executive) Mr Leonard was appointed to the Board on 29 November 2013 and also serves as Chairman of the Company’s Audit Committee. He is a qualified Lawyer and Chartered Accountant. He brings over 35 years in the corporate world including Lysaght (BHP), BTR Nylex and The Thompson Corporation. His numerous community positions include Commissioner, Victorian Multicultural Commission and Director of Transparency International Australia, (the Australian arm of the international anti-corruption watchdog). Dr Lindsay Wakefield mBBS (Non-Executive) Dr Wakefield was appointed to the Board on 24 September 2014. Dr Wakefield started Safetech in 1985. In 1993 he left medicine to become the fulltime CEO of the Company. Over the next 25 years, Safetech became a force in the Australian material handling and lifting equipment market, designing and manufacturing a wide range of industrial products. In 2006, Safetech was awarded the Telstra Australian National Business of the Year. In 2013, Safetech merged to become STS (Safetech Tieman Solutions) which is Australia’s largest manufacturer and supplier of dock equipment, freight hoists and custom lifting solutions. Dr Wakefield continues as Managing Director of STS and has been a keen Biotech investor for past 20 years, often at a mezzanine level. 18 |
|
|
DIRECTORS (cont.) Company Secretaries as at the date of this report mr Brian manuel fCa, fGia, fCiS, B. Com Mr Manuel was appointed to the role of Company Secretary on 9 July 2015 following his appointment as Chief Financial Officer on 15 June 2015. Mr Manuel is a Fellow Chartered Accountant and a Fellow of the Governance Institute of Australia. Of his 25 plus years of experience, more than a decade has been at the CFO level for companies listed on the ASX. He has a broad business acumen in addition to his strong foundation in finance, IT and corporate governance. ms Bronwyn Christie B Com, Cpa, Grad.Dip.Corp.Gov. Ms Christie was appointed as Company Secretary on 1 March 2014. Ms Christie is a Graduate of Melbourne University, a Certified Practicing Accountant and a member of the Governance Institute of Australia and has over 25 years of experience in financial management and secretarial roles. Interests in the shares and options of the Company and related bodies corporate As at the date of this Report, the following Directors hold an indirect beneficial interest in the shares of the Company: » » » Mr Grahame Leonard AM Dr Paul Kasian Dr Lindsay Wakefield 2,000,000 shares 256,410 shares 14,754,763 shares Dr Wakefield also has a direct interest in 570,500 shares and an indirect interest in 8,333,333 options. Apart from the above, no Director holds any interest in the shares and options of the Company as at the date of this Report. 19 GENETIC TECHNOLOGIES ANNUAL REPORT 2015 |

|
|
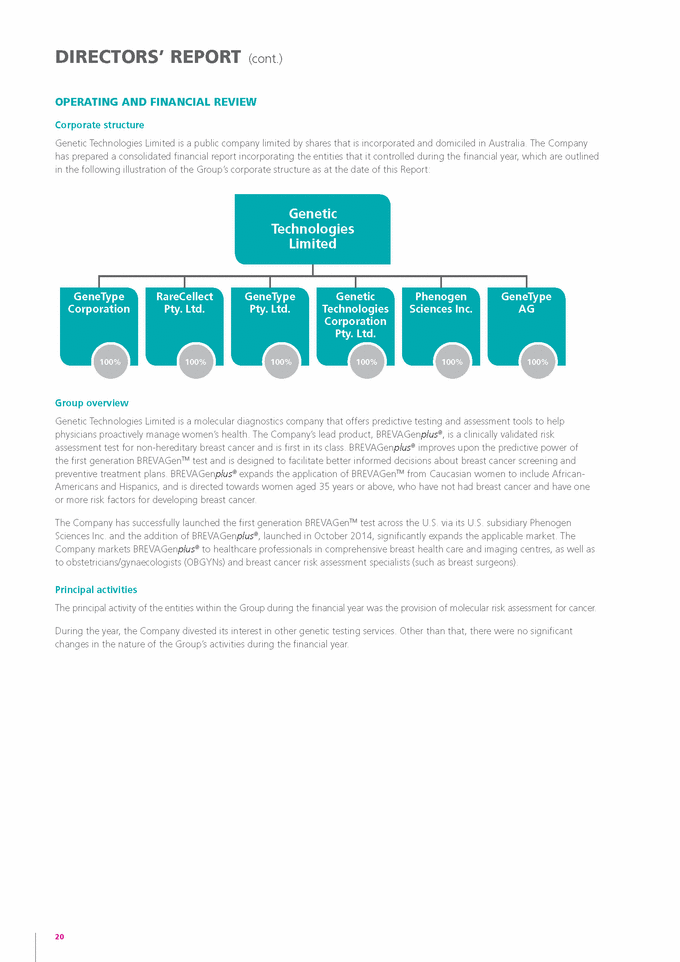
DIRECTORS’ REPORT (cont.) OPERATING AND fINANCIAL REvIEw Corporate structure Genetic Technologies Limited is a public company limited by shares that is incorporated and domiciled in Australia. The Company has prepared a consolidated financial report incorporating the entities that it controlled during the financial year, which are outlined in the following illustration of the Group’s corporate structure as at the date of this Report: Genetic Technologies Limited GeneType Corporation rareCellect Pty. Ltd. GeneType Pty. Ltd. Genetic Technologies Corporation Pty. Ltd. Phenogen Sciences Inc. GeneType AG 100% 100% 100% 100% 100% 100% Group overview Genetic Technologies Limited is a molecular diagnostics company that offers predictive testing and assessment tools to help physicians proactively manage women’s health. The Company’s lead product, BREVAGenplus®, is a clinically validated risk assessment test for non-hereditary breast cancer and is first in its class. BREVAGenplus® improves upon the predictive power of the first generation BREVAGenTM test and is designed to facilitate better informed decisions about breast cancer screening and preventive treatment plans. BREVAGenplus® expands the application of BREVAGenTM from Caucasian women to include African-Americans and Hispanics, and is directed towards women aged 35 years or above, who have not had breast cancer and have one or more risk factors for developing breast cancer. The Company has successfully launched the first generation BREVAGenTM test across the U.S. via its U.S. subsidiary Phenogen Sciences Inc. and the addition of BREVAGenplus®, launched in October 2014, significantly expands the applicable market. The Company markets BREVAGenplus® to healthcare professionals in comprehensive breast health care and imaging centres, as well as to obstetricians/gynaecologists (OBGYNs) and breast cancer risk assessment specialists (such as breast surgeons). Principal activities The principal activity of the entities within the Group during the financial year was the provision of molecular risk assessment for cancer. During the year, the Company divested its interest in other genetic testing services. Other than that, there were no significant changes in the nature of the Group’s activities during the financial year. 20 |
|
|
OPERATING AND fINANCIAL REvIEw (cont.) Operating result The operating result for the year is directly reflective of the repositioning of the business. Non-core business was sold, operations have been appropriately scaled back and equity has been raised to set the Company up for future success. Critical to this was the release of the much improved 2nd generation BREVAGenplus® test in October 2014. The Company has purposefully moved focus away from reliance on its past licensing assertion programme as there is now a clear focus on concentrating effort on the Company’s lead product BREVAGenplus® in the U.S. During the 2015 financial year, Genetic Technologies Limited and its subsidiaries generated consolidated gross revenues from continuing operations, excluding other revenue, of approximately $2.0 million compared to $4.6 million in the preceding year. $(2.2) million of this differential is directly attributable to the divested Heritage business with the balance of $(0.4) million due to a decrease in the overall combined sales of the BREVAGenTM and BREVAGenplus® tests. Overheads have decreased by approximately $2.6 million compared with 2014. The combined areas of selling/ marketing, administration (excluding net foreign currency losses), licensing and operations totalled $11.9 million for the year compared with $14.5 million for 2014. The decreased licensing activities accounted for approximately $0.6 million of the decrease with the remaining $2.1 million the result of the divestment of the Heritage business in November 2014, benefits derived from restructure activities and better management with overhead spending. With reference to significant “one-off” items, the loss for the year of approximately $8.8 million includes a $1.4 million pre-tax profit on the sale of the Heritage business and a write-down of $0.8 million against the opening asset value for the Immunaid option. Dividends and distributions No dividends have been paid since the end of the previous financial year, nor have the Directors recommended that any dividend be paid. Capital raising During the year the Company issued 1,100,273,139 ordinary shares increasing contributed equity by approximately $25.2 million after transaction costs. Refer Note 22. Convertible notes During the prior year the Company announced that it had executed documents with Ironridge BioPharma Co., a division of institutional investor Ironridge Global IV, Ltd. (“Ironridge”), in respect of redeemable convertible notes to raise USD 5,000,000 (the “Notes”). During 2014 the Notes were drawn down and the Company received $5,627,462 (being the Australian dollar equivalent of USD 5,000,000) from Ironridge, before the payment of associated costs. During the current year, conversion notices were received from Ironridge in respect of Notes with a face value of USD 1,750,000. These Notes were converted in return for which Ironridge received 164,771,370 ordinary shares (including ordinary shares issued in lieu of interest payment and interest true-up adjustments). As a result of the above conversions, there are no further Notes relating to Ironridge remaining to be converted. The last conversion notice was received by the Company on 27 November 2014. With respect to the unlisted secured (debt) notes that were issued to existing and new Australian institutional and wholesale investors in September 2014, and subsequently became convertible notes, following approval at the Annual General Meeting held on 25 November 2014, $2,125,000 of the convertible notes, together with the capitalised interest, had been converted into 150,961,041 ordinary shares in the Company, as at 30 June 2015. Subsequent to 30 June 2015, the remaining $25,000 of convertible notes plus capitalised interest has been converted into 1,091,093 ordinary shares in the Company. 21 GENETIC TECHNOLOGIES ANNUAL REPORT 2015 |
|
|
DIRECTORS’ REPORT (cont.) OPERATING AND fINANCIAL REvIEw (cont.) review of financial condition Capital structure As at the date of this Report, the Company had a total of 1,714,191,631 fully paid ordinary shares on issue, all of which were listed on the Australian Securities Exchange, and on the NASDAQ Capital Market in the U.S. via the Company’s ADRs (American Depositary Receipts). Also at that date, there were 24,241,667 unissued ordinary shares in the Company under option. As at the date of this Report, no ordinary shares were subject to escrow. Treasury and related policies The Company has in place a cash management policy which follows industry accepted leading practice by investing the Company’s cash assets in a range of short to medium term interest-bearing deposits with appropriately rated financial institutions. Cash provided by operations During the financial year, the consolidated net cash outflows used in operations was approximately $9.7 million. This is a $1.3 million improvement compared to the prior financial year. Overall, the Group’s consolidated cash assets increased by approximately $15.5 million during the 2015 financial year primarily on the back of proceeds from share issues. Liquidity and funding As at 30 June 2015, the Company also had corporate credit card facilities with National Australia Bank Limited and Bank of America, which had total credit limits of $150,000 and $156,750, respectively. As at that date, a total liability outstanding in respect of these credit card facilities was $25,708. Cash and cash equivalents, as at 30 June 2015, was $18,341,357. Significant changes in the state of affairs During the year the Company’s strategy was to focus on the expansion of its cancer diagnostic franchise whilst divesting of other assets considered to be non-core. Significant changes in the state of affairs of the group during the financial year were as follows: » Contributed equity increased by $25,166,636 to $115,247,128 as the result of a private share placements, a Share Purchase Plan, the issue of shares as part of the conversion of convertible notes and on the exercise of options attached to the convertible notes. Details of the changes in contributed equity are disclosed in note 22 to the financial statements. The Company issued $2,150,000 of interest bearing convertible notes during the year which are convertible into ordinary shares at the option of the holder. All but $25,000 of these notes were converted during the year. Refer note 20. The net cash received from the increase in contributed equity and the issue of the convertible notes was used principally to provide the Company with general working capital and to fund the continuing commercialisation and to facilitate the acceptance and growth of the Company’s flagship lead breast cancer risk test BREVAGenplus®. On 31 July 2014, the Company granted a total of 6,875,000 options over ordinary shares in the Company to its US employees. The options, which were granted at no cost, entitle the holders to acquire one ordinary share at a price of $0.040 at any time up to, and including 31 May 2019, subject to certain vesting conditions. Refer note 26. On 2 December 2014, the Company granted a total of 143,333,333 fully vested options over ordinary shares in the Company to the holders of convertible notes. The options, which were granted at no cost, entitle the holders to acquire one ordinary share at a price of $0.015 at any time up to, and including 2 December 2018. As at balance date 20,366,667 of these options remain unexercised. Refer note 26. » » » » There were no other significant changes in the state of affairs that are not described elsewhere in this Report. Significant events after balance date Except for the conversion of $25,000 of convertible notes plus capitalised interest as disclosed above, there have been no significant events which have occurred after balance date. 22 |
|
|
OPERATING AND fINANCIAL REvIEw (cont.) Business strategy, future developments and prospects BREVAGenplus® was released in October 2014. This latest version of BREVAGenTM incorporates an expanded SNP (Single Nucleotide Polymorphism) panel, providing a 10-fold improvement in the predictive power of the test. BREVAGenplus® provides a better and more accurate risk assessment and is now applicable to women with African American, Hispanic and Caucasian heritage thereby increasing the applicable market and simplifying the marketing process for the BREVAGenplus® test in U.S. clinics and breast health centres. During the 2016 financial year, the Group will focus on the expansion of its genetic testing business, with emphasis on the sale and distribution of the BREVAGenplus® breast cancer risk test in the U.S. through its wholly-owned U.S. subsidiary, Phenogen Sciences Inc. Further development of the Key Opinion Leader speaker program continues accompanied by public relations and promotional activities in target market areas including comprehensive breast health and imaging centres. The Company continues to actively progress research programs with leading international academic collaborators to confirm the utility of genomic risk assessment in other ethnic populations and to incorporate the full portfolio of currently known common breast cancer susceptibility variants into the BREVAGenplus® platform. Even though the BREVAGenTM concept has already demonstrated market acceptance, the Company recognises that in order to secure wider commercial payer coverage and to improve the level of commercial payer payments currently received, it needs to provide additional evidence that demonstrate the impact of the test on treatment decision-making that is aligned with payer evidence requirements. As such, the Company is about to commence a series of clinical utility studies that will provide further evidence to support the product’s value proposition and clinical benefits. The first of three clinical trials planned is scheduled to begin in Q2 FY16 with completion expected before the end of FY16. Two longer-term clinical trials are also expected to commence within the 2016 financial year and are designed to run for up to two years. One of the longer term studies will be prospective in design looking at patient outcomes, with the other being retrospective, assessing the impact of the test on MRI screening rates. Legal matters There are no legal matters of a material nature or amount affecting the Company as at the date of this Report. Earnings / (loss) per share 2015 2014 material business risks The Group operates in the biotechnology sector. Any investment in this sector is considered to be high risk in nature. The Group is subject to normal business risks including, but not limited to, exchange rate fluctuations; the condition, liquidity and volatility of global securities markets; changes in government policy and legislation (particularly in Australia and the U.S.); and potential litigation, all of which are largely outside the control of the Company’s Board and Management. Other risks that are more specific to the Company, the sector in which it operates and its underlying business activities include: » Financial risk - With the exception of the year ended 30 June 2011, the Company has incurred operating losses in every year of its existence. As at 30 June 2015, the Company had accumulated losses of $100,985,283 and the extent of any future losses and whether or not the Company can generate profits in future years remains uncertain. The Company currently does not generate sufficient revenue to cover its operating expenses. There is also no certainty that the Company will be able to raise additional funds by issuing further shares and/or the raising of debt and, if such funds are available, on what terms the Company would be able to secure them. » Competition - with respect to BREVAGenplus®, the Company’s lead breast cancer risk test, the Company is currently subject to limited competition from biotechnology and diagnostic companies, academic and research institutions and government or other publicly-funded agencies. However, many potential competitors, which include private and public sector enterprises in Australia, the U.S. and elsewhere, have greater experience in the areas of finance, research and development, marketing, sales, distribution, technical and regulatory matters than the Company does. However, the Company maintains an extensive patent portfolio which does provide some protection for the BREVAGenplus® test. 23 GENETIC TECHNOLOGIES ANNUAL REPORT 2015 Basic earnings / (loss) per share (cents per share) (0.82) (1.76) Diluted earnings / (loss) per share (cents per share) (0.82) (1.76) |
|
|
DIRECTORS’ REPORT (cont.) OPERATING AND fINANCIAL REvIEw (cont.) material business risks (cont.) » Intellectual property (“IP”) risks - the Company relies on its portfolio of patents, patent applications and exclusive licenses to patents relating to genetic technologies. While the Company patents and protects its IP, it cannot be certain that additional patents will be issued to it or that its patents will withstand challenges by others. Patents issued to, or licensed by, the Company may be infringed or third parties may develop similar technologies. Further, patents may not provide meaningful protection from competitors. The Company may also need to sue, or be sued, by third parties regarding its patents and other IP rights. These suits may be costly and would divert funds and resources from the Company and cause a distraction to Management. Professional liability risks - by the very nature of its operations, the Company’s business exposes it to potential liability risks that are inherent in the testing, manufacturing, marketing and sale of genetic tests. In the event of a mistake occurring, including an incorrect result of analysis of genetic variations or other screening tests performed, the commercial sale of a genetic test by the Company may expose it to professional liability claims and possible adverse publicity. Litigation of such claims could be costly. Further, if a court were to require the Company to pay damages to a plaintiff, the amount of such damages could harm its financial condition, despite the Company having significant levels of public and product liability insurance coverage to protect it from such risks. Government regulation – in addition to general regulation and laws applicable to all businesses, the Company is subject to accreditation regulation and legislation relating to genetic research and testing. From time to time, federal, state and/or local governments adopt or change regulations relating to the conduct of genetic research and genetic testing. In future, such regulations could limit or restrict the Company’s genetic research activities as well as genetic testing for research or clinical purposes. Regulations restricting genetic testing could adversely affect the Company’s ability to market and sell its products and services. Accordingly, any regulations of this nature could increase the costs of operations or restrict its ability to conduct its testing business and might adversely affect its operations and financial condition. Ethical issues - public opinion regarding ethical issues related to the confidentiality and appropriate use of genetic testing results may influence government authorities to call for limits on, or regulation of the use of, genetic testing. In addition, such authorities could prohibit testing for genetic predisposition to certain conditions, particularly for those that have no known cure. Adverse publicity or public opinion relating to genetic research and testing could reduce the potential markets for the Company’s services, which could adversely affect its revenues. Further, the patents it holds over uses of “non-coding” DNA have broad scope and have also been the subject of much debate and some criticism in the media. Potential licensees could take legal action to seek the amendment, re-examination, revocation or invalidation of these patents, something which has happened previously on several occasions, though the Company has prevailed in all such cases. BrEVAGenTm - since the launch of the Company’s BREVAGenTM test in June 2011, a number of potential commercial risks have been identified. The test exists in a new area of genetic testing, being a predictive test, and it may take time to establish credibility and educate potential customers which may delay establishing reasonable rates of sales. Despite already having various studies and review publications, clinician adoption of the test requires substantial resources and effort. The establishment of a new US company, such as the Company’s subsidiary Phenogen Sciences Inc., requires staffing with qualified and experienced salespeople who require time to establish customer contacts and convert sales. Invariably, some new employees are not able to adapt to the new sales environment and may need to be replaced, potentially hampering growth. Even though the Company’s laboratory has now been CLIA certified, U.S. government health care programs could potentially restrict its ability to offer the test in the U.S., thereby restricting the available market. The US healthcare reimbursement system with which the Company interacts is complex, involving a series of independent insurers and other third parties involved to assist with credentialing and the administration of the payment processes. Establishing benchmarks with insurers is a time consuming process which could delay the receipt of initial payments until such time as “rules” with each provider can be established. The introduction of the Affordable Care Act in 2014 has created additional people with insurance coverage but has resulted in many people selecting policies with higher deductibles. This could reduce the reimbursement amount from insurers, place more cost onto the patient and thus negatively impact the willingness of patients to agree to take the BREVAGenTM test. The launch of BREVAGenplus® (expanded SNP panel applicable to African-American and Hispanic ethnicities as well as Caucasian) in October 2014, brings additional risks with the costs of development, public relations and marketing communications adding to overhead costs. There is a risk that the forecasted increase in uptake for BREVAGenplus® does not occur to offset the cost of this product introduction. » » » » 24 |
|
|
risk management In respect of the above risks, the Group takes a proactive approach to risk management. The Board is responsible for ensuring that risks and opportunities are identified on a timely basis and that the Group’s objectives and activities are aligned with those risks and opportunities. The Board believes that it is important for all Board members to be a part of this process and the Board takes overall responsibility for the recognition and management of risk. The overview of the compliance and control mechanisms has been delegated to the Audit Committee through its Charter. The Board believes that the Group is not yet sufficiently large to warrant the appointment of an internal auditor. SHARE OPTIONS Unissued shares under option As at the date of this Report, there were 24,241,667 unissued ordinary shares in the Company under option. During the year ended 30 June 2015, a total of 150,208,333 options to acquire ordinary shares in the Company were granted. All options were granted at nil cost. Refer Note 28 to the attached financial statements for details regarding the outstanding options. Shares issued as a result of the exercise of options During the 2015 financial year, 122,966,666 shares were issued as a result of the exercise of options. No options have been exercised since the end of the financial year. During the 2015 financial year, a total of 10,775,000 options that had been issued to employees lapsed due to forfeiture. Option holders do not have any right, by virtue of their options, to participate in any share issue of the Company or any related body corporate. INDEMNIfICATION AND INSURANCE Of DIRECTORS AND OffICERS During the financial year, the Company paid a premium in respect of a contract insuring the Directors and Officers of the Company and any related body corporate against a liability incurred in his or her capacity as a Director or Officer to the extent permitted by the Corporations act 2001. The contract of insurance prohibits disclosure of the nature of the insurance provided and the amount of the premium. The Company has agreed to indemnify the current and former Directors and Executive Officers against all liabilities to other persons that may arise from their position as Directors or Officers of the Company and its subsidiaries, except where to do so would be prohibited by law. 25 GENETIC TECHNOLOGIES ANNUAL REPORT 2015 |
|
|
DIRECTORS’ REPORT (cont.) REMUNERATION REPORT Introduction This Remuneration Report outlines the Director and Executive remuneration arrangements of Genetic Technologies Limited (the “Company”) and its subsidiaries (collectively, the “Group”) in accordance with the requirements of the Corporations act 2001 and its Regulations. For the purposes of this Report, Key Management Personnel (“KMP”) of the Group are defined as those persons having authority and responsibility for planning, directing and controlling the major activities of the Company and the Group, directly or indirectly, including any Director (whether executive or not) of the parent company, and includes executives in the Group who meet the criteria, as set out below, receiving the highest remuneration. For the purposes of this Report, the term “Executive” encompasses the Group’s Chief Executive Officer, Chief Financial Officer, Scientific Director, Quality and Business Operations Director and Director, Global Licensing and IP. For details regarding changes to Key Management Personnel during the period from 1 July 2014 to the date of this Report, please refer to the notes at the foot of the Remuneration Table. Details of Directors and Key management Personnel as at balance date Directors Executives Dr Malcolm R. Brandon (Non-Executive Chairman) Mr Brian Manuel (Chief financial Officer) Mr Eutillio Buccilli (Executive Director & Chief Executive Officer) Ms Diana Newport (Quality and Business Operations Director) Mr Grahame Leonard AM (Non-Executive) Dr Richard Allman (Scientific Director) Dr Lindsay Wakefield (Non-Executive) Ms Luisa Ashdown (Director, Global licensing and ip) Dr Paul Kasian (Non-Executive) remuneration Committee During the year the Company formed a separate Remuneration Committee however the function of the Remuneration Committee was undertaken by the full Board until 30 June 2015 and any reference to Remuneration Committee in this Report refers to the full Board. As at the date of this report, the composition of the Remuneration Committees is: » » » Dr Lindsay Wakefield (Chairman of the Committee) Dr Paul Kasian Mr Eutillio Buccilli As an executive, Mr Buccilli does not take part in deliberations pertaining to his own remuneration. The Remuneration Committee is, amongst other things, responsible for determining and reviewing remuneration arrangements for the Directors, the Chief Executive Officer and the Senior Leadership Team. The majority of the Committee is comprised of independent directors. The Remuneration Committee assesses the appropriateness of the nature and amount of remuneration paid to Directors and Executives on a periodic basis by reference to relevant employment market conditions, with the overall objective of ensuring maximum shareholder benefit from the retention of a high quality Board and Senior Leadership Team. remuneration strategy The performance of the Company depends upon the quality of its Directors and Executives. To prosper, the Company must attract, motivate and retain appropriately skilled Directors and Executives. To this end, the Company embodies the following principles in its remuneration framework: » » » » provide competitive rewards to attract high calibre Executives; wherever possible, link Executive rewards to shareholder value; ensure that a portion of an Executive’s remuneration is “at risk”; and establish appropriate, demanding performance hurdles for variable Executive remuneration. The remuneration strategy is recommended by the Remuneration Committee and approved by the Board. remuneration structure In accordance with best practice corporate governance, the structure of Non-Executive Director and Executive remuneration is separate and distinct. The key performance indicators applicable for all Executives are quantifiable and the methods of measurement are defined. Potential levels of remuneration are linked to each performance indicator based on the pretext that if the performance indicators as defined are met then the business will have more likely achieved certain key financial or strategic objectives. In addition to the 26 |
|
|
various key performance indicators that are used to assess the performance of each Executive, the overall financial performance of the Company is also taken into consideration when determining both base levels of remuneration and short term incentive payments for those individuals. Non-Executive Director remuneration Objective The Board seeks to set aggregate remuneration at a level which provides the Company with the ability to attract and retain Directors of the highest calibre, whilst incurring a cost which is acceptable to shareholders. Structure The Company’s Constitution and the Listing Rules of the Australian Securities Exchange specify that the aggregate remuneration of Non-Executive Directors shall be determined from time to time by a General Meeting of shareholders. An amount not exceeding the amount determined is then divided between the Directors as agreed. The most recent determination was made at the 2007 Annual General Meeting, when shareholders approved an aggregate remuneration not exceeding $500,000 per year. The amount of aggregate remuneration sought to be approved by shareholders and the manner in which it is apportioned amongst Directors are reviewed annually. Each Non-Executive Director receives a fee for serving as a Director of the Company. No additional fees are paid to any Director for serving on a sub-committees of the Board, hence all fees disclosed on page 30 are base fees by nature. Executive remuneration Objective The Group aims to reward Executives with a level and mix of remuneration which is commensurate with their positions and responsibilities within the Group and so as to: » » » reward Executives for Group and individual performance against targets set by reference to suitable benchmarks; align the interests of Executives with those of the shareholders; and ensure that the total remuneration paid is competitive by market standards. Structure The remuneration paid to Executives is set with reference to prevailing market levels and comprises a fixed remuneration comprising base salary and superannuation, various short-term incentives (which are linked to agreed Key Performance Indicators (“KPIs”), as described below under the heading of Variable remuneration), and a long-term option component. Fixed remuneration Objective The Remuneration Committee oversees the setting of fixed remuneration on an annual basis. The process consists of a review of Company, divisional and individual performance, relevant comparative remuneration in the market and internally and, where appropriate, external advice on policies and practices. The members of the Committee have access to external advice independent of Management. Structure Fixed remuneration consists of some or all of the following components: » » » base salary; non-monetary benefits which can include a motor vehicle allowance, etc.; and superannuation benefits, which includes employer contributions. With the exception of the employer contributions to superannuation, Executives are given some flexibility to decide the composition of their total fixed remuneration and the allocation between cash and other benefits. It is intended that the manner of payment chosen will be optimal for the recipient without creating any additional cost for the Group. Fixed remuneration is reviewed annually with reference to individual performance, market benchmarks for individual roles and the overall financial performance of the Group. Any changes to the fixed remuneration of Executives are first approved by the Remuneration Committee. All employee remuneration is evaluated on a regular basis using a set of variables and taking into account the addition of the statutory superannuation contribution. An assessment of existing base salaries is made annually using comparisons against independent market data which provides information on salaries and other benefits paid for comparable roles within the biotech and pharmaceutical industries, using third party salary survey data. Annual performance reviews with each employee are based on a rating system which is used to assess his or her eligibility for salary increases. Other qualitative factors, including the specialised knowledge and experience of the individual and the difficulty of replacing that person, are also taken into account when considering salary adjustments. 27 GENETIC TECHNOLOGIES ANNUAL REPORT 2015 |
|
|
DIRECTORS’ REPORT (cont.) REMUNERATION REPORT (cont.) Variable remuneration Objective » » » » The objective of variable remuneration is to: align the interests of Executives with those of shareholders; link Executive rewards to the achievement of strategic goals and performance of the Company; and ensure that the total remuneration paid by the Company is competitive by market standards. Short Term Incentive (“STI”) STI is an annual plan that applies to Executives and other senior employees that is based on the performance of both the Company and the individual during a given financial year. STI ranges vary depending on the role, responsibilities and deliverables achieved by each individual. Actual STI payments granted to the relevant employee will depend on the extent to which the pre-agreed specific targets are met within a financial year. Specific targets are quantifiable with the agreed method of measurement defined at the beginning of the financial year. The ongoing performance of the Executive or senior employee is evaluated regularly during the performance cycle. Group objectives, and their relative weighting, vary depending on the position and responsibility of the respective individual, but in respect of the year ended 30 June 2015 include, amongst other things, the achievement of: » » » » achieving or exceeding revenue targets; achieving targets for cost reduction or efficiency gains; contributing to business growth and expansion; and performance or the delivery of results which exceed agreed targets. These measures are chosen as they represent the key drivers for the short term success of the business and provide a framework for delivering long term value. Personal and operating objectives vary according to the role and responsibility of the Executive and include objectives such as service delivery to customers, project delivery, compliance outcomes, intellectual property management and various staff management and leadership objectives. Achievement of an individual’s targets or objectives is documented and assessed by both the individual and his or her direct manager. The individual will participate in an annual performance review and must provide evidence of the objectives that he or she has delivered during the period under review. Each objective is then rated on an achievement scale. Depending on the aggregate of the ratings, the individual may be eligible to receive an STI payment. STI payments, if any, are generally paid in August or September of each year subject to the completion of the performance review process and the receipt of a satisfactory rating. The Board conducts this process in the case of the CEO. Long Term Incentive (“LTI”) The objective of the Group’s LTI arrangements is to reward Executives and senior employees in a manner that aligns their remuneration with the creation of shareholder wealth. As such, significant LTI grants are generally only made to Executives who are able to influence the generation of shareholder wealth and have an impact on the Group’s long term profitability. There are no specific performance hurdles, apart from certain vesting provisions, in respect of the LTI grants made to Executives. Options with a vesting period also serve as a retention tool and may reduce the likelihood of high performing Executives and senior employees being targeted by other companies. LTI grants to Executives and senior employees are delivered in the form of options over unissued ordinary shares in the Company which are granted under the terms and conditions of the Company’s Employee Option Plan. Selected Executives who contribute significantly to the long term profitability of the Company are invited to participate in the Employee Option Plan. The remuneration value of these grants varies and is determined with reference to the nature of the individual’s role, as well as his or her individual potential and specific performance. The options are granted at no cost, have an approximate life of 4 years and, in most cases, generally vest in three equal tranches after 12, 24 and 36 months from the date on which they are granted. During the year ended 30 June 2015, a net share-based payments expense/ (credit) of $(26,536) (2014: $119,531) was incurred by the Company in respect of all options which had previously been granted to Executives and other senior employees. In cases where an Executive ceases employment prior to the vesting of his or her options, the options are forfeited after a prescribed period if they have not been exercised. The prescribed period ranges from two to six months, depending on the circumstances under which they left the Company, e.g. resignation, retirement, termination or death. In the event of a change of control of the Company, the performance period end date will be brought forward to the date of the change of control and awards will vest over this shortened period. 28 |
|
|
REMUNERATION REPORT (cont.) Variable remuneration (cont.) The following table shows the key performance indicators for the Group over the past five financial years ended 30 June. 2015 2014 2013 2012 2011 $ $ $ $ $ % % % % % relative proportion of fixed vs variable remuneration expense Fixed remuneration At risk – STI At risk – LTI* Executive director 2015 2014 2015 2014 2015 2014 * Since the long-term incentives are provided exclusively by way of options, the percentages disclosed also reflect the value of remuneration consisting of options, based on the value of options expensed during the year. Where applicable, the expenses include negative amounts for expenses reversed during the year due to a failure to satisfy the vesting conditions. percentage not disclosed as the total amount of Sti and/or lti remuneration expense was negative for the relevant period. ** Employment contracts The Chief Executive Officer, Mr Eutillio Buccilli, is employed under an ongoing contract dated 25 February 2015 which has the following key terms and conditions: » » Base salary of $300,000 plus statutory superannuation contributions as prescribed under the Superannuation Guarantee legislation; STI payment equivalent to a maximum of 30% of base salary based on achievement of Key Performance Indicators, as agreed with the Board from time to time; Notice period of three months; and The contract may be terminated at any time without notice if serious misconduct has occurred. Where termination with cause occurs, he is only entitled to receive that portion of remuneration which is fixed and only up to the date of termination. In this instance, all entitlements to both STI and LTI are forfeited and would lapse. » » The key provisions contained in the employment contracts for other Key Management Personnel in office at the date of this Report are: » the Executive receives a base salary and statutory superannuation contributions, as prescribed under the Superannuation Guarantee legislation, together with certain STI payments based on achievement of Key Performance Indicators, as agreed with the Chief Executive Officer from time to time; the Executive may resign from his / her position and terminate the contract by giving up to three months written notice; the Company may terminate the contract by providing up to three months written notice or payment in lieu of notice; and the Company may terminate the contract without notice in the event of serious misconduct. In this instance, entitlements to both STI and LTI payments are forfeited and will lapse. » » » There are no employment contracts in place with any Non-Executive Director of the Company. 29 GENETIC TECHNOLOGIES ANNUAL REPORT 2015 Eutillio Buccilli 77% 100% 23% - - - Other KMP of the group Luisa Ashdown 98% 87% - - 2% 13% Diana Newport 90% 93% 10% 7% - - Dr Richard Allman 92% 92% 8% 8% - - Brian Manuel 100% - - - - - Alison Mew 84% 100% 16% - - - Mark J. Ostrowski 100% 83% - - ** 17% Thomas Howitt - 100% - - - - Ivan Jasenko - 100% - - - - Increase/(decrease) in share price (22.2) (62.1)(20.8)(42.9)500.0 Total KMP incentives (being STI and LTI) as a percentage of profit/(loss) for the year (1.30) (0.90)(1.36)(2.16)41.98 Profit/(loss) for the year attributable to owners of Genetic Technologies Limited (8,810,170) (10,125,197)(9,298,367)(5,287,523)910,002 Basic earnings per share (cents) (0.82) (1.76)(1.97)(1.15)0.22 |
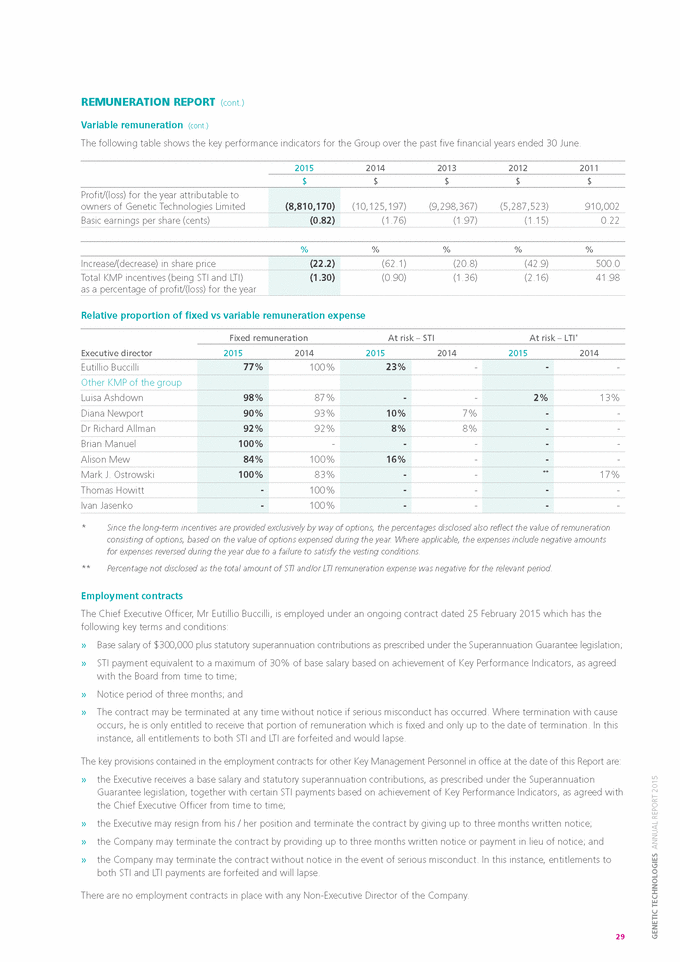
|
|
DIRECTORS’ REPORT (cont.) REMUNERATION REPORT (cont.) remuneration of Key management Personnel (“KmP”) Post-employment Other long-term Short-term Share-based Salary/fees Other Superannuation* benefits** Options*** Totals Name and title of Year $ $ $ $ $ $ Non-Executive Directors Dr Malcolm R. Brandon Non-Executive Chairman 2015 2014 87,125 87,125 - - 8,277 8,059 - - - - 95,402 95,184 Grahame Leonard AM 2015 2014 53,626 31,281 - - 5,094 2,893 - - - - 58,720 34,174 Dr Paul Kasian 2015 2014 53,626 29,460 - - 5,094 2,725 - - - - 58,720 32,185 Dr Lindsay Wakefield1 2015 2014 41,251 - - - 3,919 - - - - - 45,170 - David Carter2 2015 2014 18,907 - - - 1,796 - - - - - 20,703 - Dr Mervyn Cass3 2015 2014 22,344 53,626 - - 2,123 4,959 - - - - 24,467 58,585 Prof Ian McKenzie3 2015 2014 21,554 31,281 - - 2,048 2,893 - - - - 23,602 34,174 Tommaso Bonvino4 2015 2014 - 22,343 - - - 2,066 - - - - - 24,409 Benjamin Silluzio4 2015 2014 - 22,343 - - - 2,066 - - - - - 24,409 Totals 2015 2014 298,433 277,459 - - 28,351 25,661 - - - - 326,784 303,120 Notes pertaining to changes during the year: 1. 2. 3. 4. appointed to the Board in September 2014. appointed to the Board in September 2014 subsequently ceased to be a Director in January 2015. resigned from the Board effective November 2014. resigned from the Board in the previous financial year. 30 |
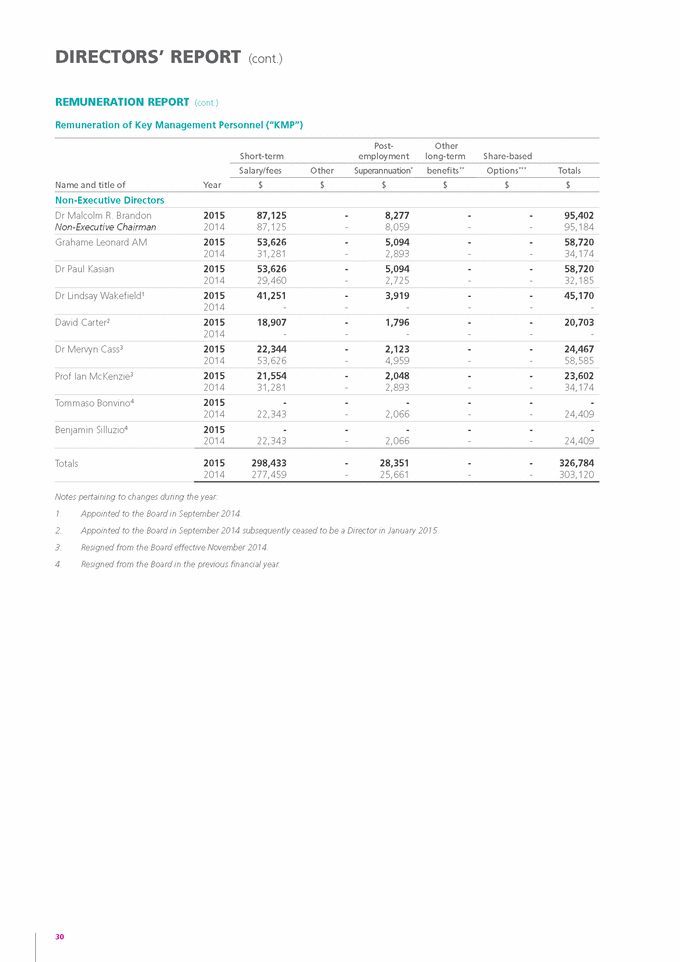
|
|
REMUNERATION REPORT (cont.) remuneration of Key management Personnel (“KmP”) (cont.) Post-employment Other long term Short-term Share-based Salary/fees Other Superannuation* benefits** Options*** Totals Name and title of Year $ $ $ $ $ $ Executives Eutillio Buccilli5 Executive Director & Chief Executive Officer 2015 2014 238,090 14,433 80,000 - 27,369 2,865 8,085 1,289 - - 353,544 18,587 Luisa Ashdown6 Director, licensing & ip 2015 2014 163,947 140,441 - - 15,575 12,991 (20,672) 8,500 2,927 20,761 161,777 182,693 Diana Newport7 Quality & Ops. Director 2015 2014 154,350 98,692 20,000 10,000 16,088 23,878 2,793 7,644 - - 193,231 140,214 Dr Richard Allman8 Scientific Director 2015 2014 145,965 125,725 15,812 12,000 15,084 14,252 19,908 7,459 - - 196,769 159,436 Brian Manuel9 Chief financial Officer 2015 2014 8,333 - - - 792 - 737 - - - 9,862 - Alison J. Mew10 Ex-Chief Executive Officer 2015 2014 137,164 227,375 25,000 - 15,401 22,812 (20,757) 4,168 - - 156,808 254,355 Mark J. Ostrowski11 Ex-uS Senior vp Sales & marketing 2015 2014 170,631 299,828 - - - - 1,052 6,591 (28,886) 60,661 142,797 367,080 Thomas G. Howitt12 Ex-Chief financial Officer 2015 2014 - 187,824 - - - 17,374 - - - - - 205,198 Ivan Jasenko13 Ex-Operations Director 2015 2014 - 20,470 - - - 1,894 - - - (12,156) - 10,208 Sub-totals for Executives 2015 2014 1,018,480 1,114,788 140,812 22,000 90,309 96,066 (8,854) 35,651 (25,959) 69,266 1,214,788 1,337,771 Total remuneration of Key Management Personnel 2015 2014 1,316,913 1,392,247 140,812 22,000 118,660 121,727 (8,854) 35,651 (25,959) 69,266 1,541,572 1,640,891 Notes pertaining to changes during the year: 5. mr Buccilli was appointed to the Chief Executive Officer role in february 2015 prior to which he was the Chief financial Officer. “Other” includes a bonus paid or payable in the amount of $80,000, $50,000 of which was paid on the successful raising of capital in march 2015 with the balance paid at the discretion of the Board. ms ashdown ceased to be an executive with effect from July 2015. “Other” includes a bonus paid or payable to ms Newport in the amount of $20,000 at the discretion of the Board. “Other” includes a bonus paid or payable to Dr allman in the amount of $15,812 at the discretion of the Board. mr manuel was appointed to the Chief financial Officer role in June 2015. ms mew held the role of Chief Executive Officer until her resignation in December 2014. “Other” includes a bonus paid in the amount of $25,000 on the successful sale of the heritage business. mr Ostrowski held the role of uS Senior vice president Sales and marketing until his resignation in January 2015. mr howitt resigned as Chief financial Officer in the 2014 financial year. 6. 7. 8. 9. 10 11. 12 13. mr Jasenko resigned as Operations Director in the 2014 financial year. referencing the previous two tables: *post-employment benefits as per Corporations regulation 2m.3.03(1) item 7 ** Other long-term benefits as per Corporations regulation 2m.3.03(1) item 8 *** Equity settled share-based payments as per Corporations regulation 2m.3.03(1) item 11 The details of those Executives nominated as Key Management Personnel under section 300A of the Corporations act 2001 have been disclosed in this Report. No other employees of the Company meet the definition of “Key Management Personnel” as defined in iaS 24 / (aaSB 124) related party Disclosures, or “senior manager” as defined in the Corporations act 2001. 31 GENETIC TECHNOLOGIES ANNUAL REPORT 2015 |
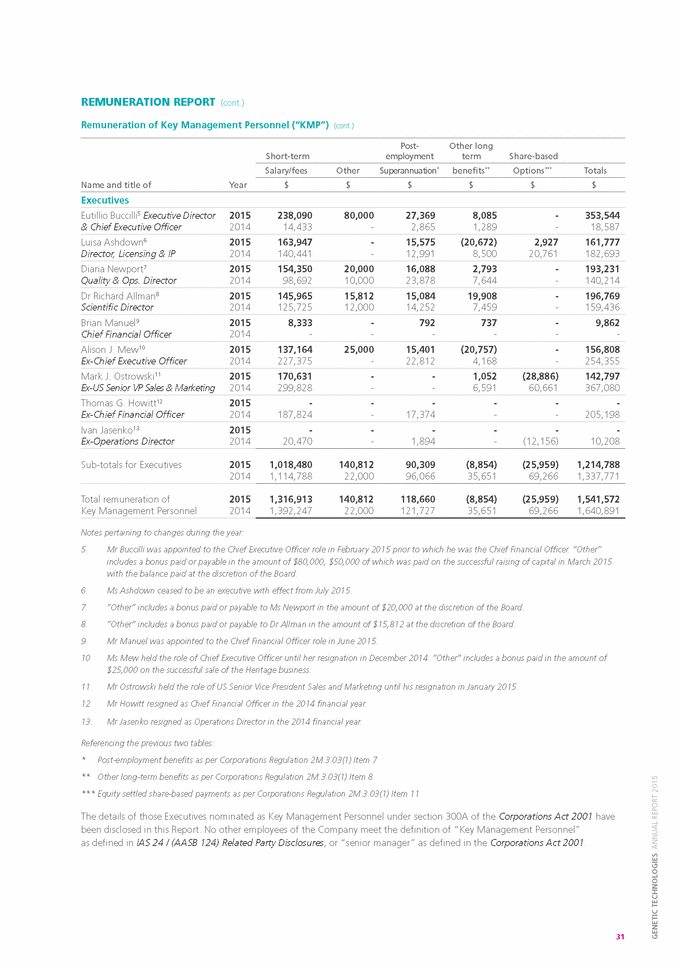
|
|
DIRECTORS’ REPORT (cont.) REMUNERATION REPORT (cont.) Options exercised, granted and forfeited as part of remuneration during the year ended 30 June 2015 During the 2015 financial year 2,500,000 options were granted as equity compensation benefits to Executives, all of which were subsequently forfeited. Details of the options held by the Executives nominated as Key Management Personnel during the year ended 30 June 2015 are set out below. Number of options Exercise price Number forfeited Fair value per option Final vesting date Name of Executive Exercised Granted Eutillio Buccilli - - - - - - Brian Manuel - - - - - - Mark J. Ostrowski - 2,500,000 $0.04 (2,500,000)1 $0.018 - Mark J. Ostrowski - - $0.14 (2,400,000)2 $0.065 - Dr. Richard Allman - - - - - - Diana Newport - - - - - - Luisa Ashdown - - - - - - - - - - - - Totals - 2,500,000 (4,900,000) 1. 2. Granted in July 2014. Granted in October 2012. Options exercised, granted and forfeited as part of remuneration during the year ended 30 June 2014 During the 2014 financial year, there were no options granted as equity compensation benefits to Executives. No options were exercised and 1,000,000 forfeited. Fair values of options The above options granted during the 2015 financial year vest in three equal tranches after 12 months, 24 months and 36 months from the date of grant, respectively. As at 30 June 2015, there was 1 executive and 7 employees who held options that had been granted under the Company’s respective option plans. Fair values at grant date are independently determined using a Black-Scholes option pricing model that takes into account the exercise price, the term of the option, the share price at grant date and expected price volatility of the underlying share, the expected divided yield and the risk-free interest rate for the term of the option. Option holdings of Key management Personnel 30 June 2015 Number of options Vesting as at year end Financial Fair Value Name of option holder Opening balance Closing balance Not Exercisable exercisable year in which yet to vest Granted Exercised Lapsed options vest $ Executive Eutillio Buccilli - - - - - Brian Manuel - - - - - - - - - Mark J. Ostrowski 2,400,000 - - (2,400,000) - - - - - Mark J. Ostrowski - 2,500,000 - (2,500,000) - - - - - Richard Allman - - - - - - - - - Diana Newport - - - - - - - - - Luisa Ashdown 1,000,000 - - - 1,000,000 1,000,000 - 2015 - Luisa Ashdown 500,000 - - -500,000 500,000 - 2014 - Totals 3,900,000 2,500,000 - (4,900,000) 1,500,000 1,500,000 - - 32 |
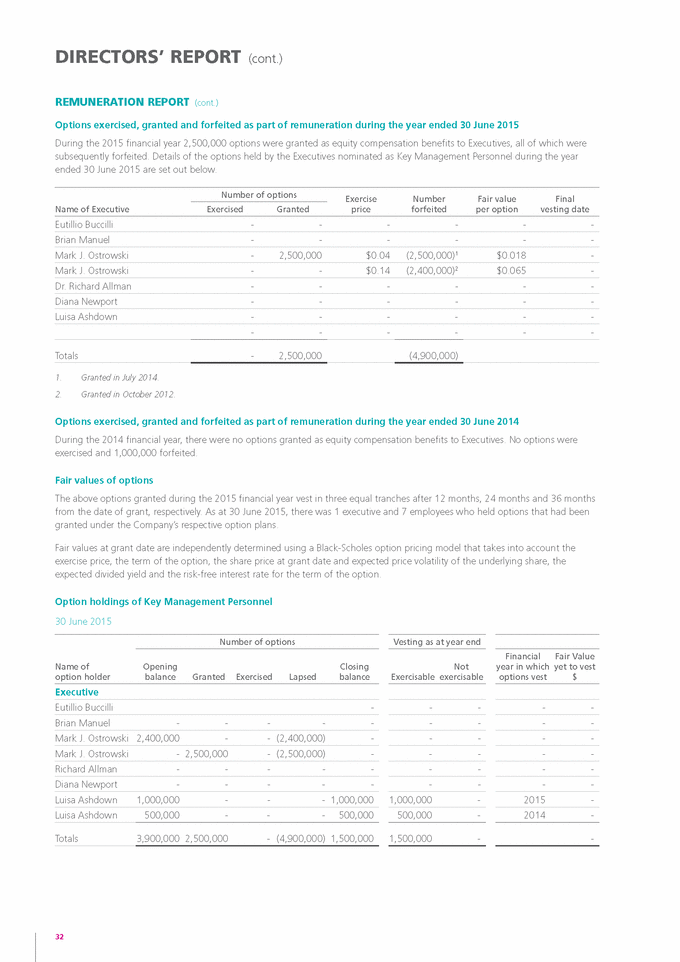
|
|
REMUNERATION REPORT (cont.) Option holdings of Key management Personnel (cont.) 30 June 2014 Number of options Vesting as at year end Financial Fair Value Name of option holder Opening balance Closing balance Not Exercisable exercisable year in which yet to vest Granted Exercised Lapsed options vest $ Executive Thomas G. Howitt 500,000 - - (500,000) - - - - - Alison J. Mew - - - - - - - - - Gregory J. McPherson - - - - - - - - - Mark J. Ostrowski 2,400,000 - - - 2,400,000 800,000 1,600,000 2016 104,000 Richard Allman - - - - - - - - - Ivan Jasenko 500,000 - - (500,000) - - - - - Diana Newport - - - - - - - - - Luisa Ashdown 1,000,000 - - - 1,000,000 666,667 333,333 2015 21,667 Luisa Ashdown 500,000 - - -500,000 500,000 - 2014 - Eutillio Buccilli - - - - - - - - - Totals 4,900,000 - - (1,000,000) 3,900,000 1,966,667 1,933,333 125,667 Shareholdings of Key management Personnel 30 June 2015 Number of shares Acquired on exercise of convertible notes Opening balance Closing balance Shares held in Genetic Technologies Limited Bought Sold Director Dr Malcolm Brandon - - - - - Mr Eutillio Buccilli - - - - - Mr Grahame Leonard A.M. 3,000,000 555,556 (1,555,556) - 2,000,000 Dr Paul Kasian 256,410 - - - 256,410 Dr Lindsay Wakefield1 14,916,746 - (11,000,000) 11,408,517 15,325,263 Executive Brian Manuel - - - - - Mark Ostrowski2 - - - - - Dr. Richard Allman - - - - - Diana Newport - - - - - Luisa Ashdown 622,045 - (609,545) - 12,500 Totals 18,795,201 555,556 (13,165,101) 11,408,517 17,594,173 1. 2. Opening balance for Dr Wakefield refers to the number of shares held directly and indirectly on appointment as a director in September 2014. mr Ostrowski was a Kmp from the start of the year to 31 January 2015. There were no loans to/from Key Management Personnel during the financial years ending 2015 and 2014. End of Remuneration Report 33 GENETIC TECHNOLOGIES ANNUAL REPORT 2015 |
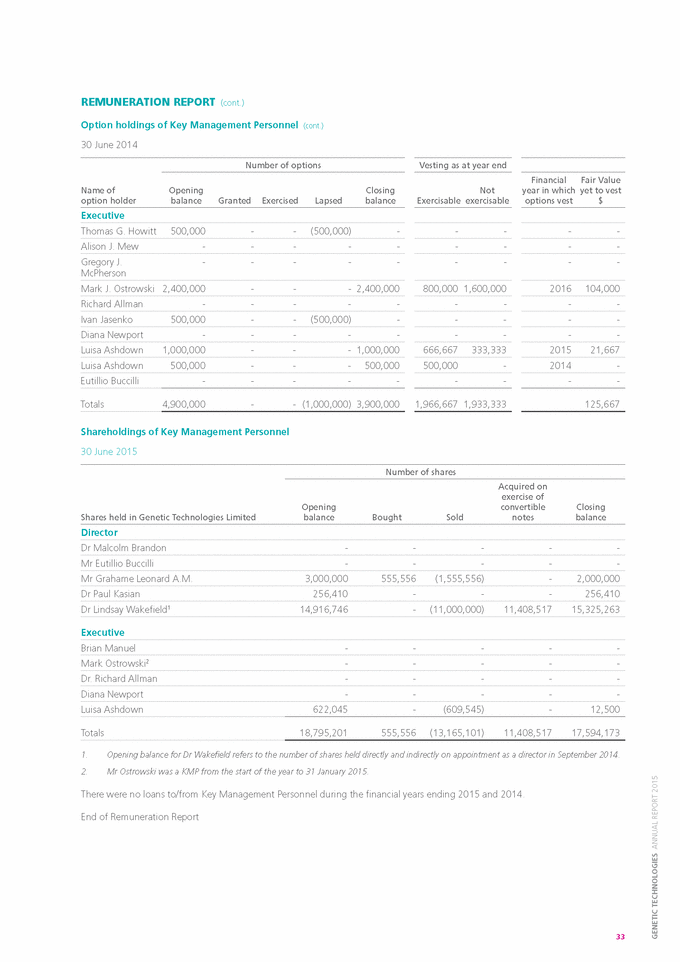
|
|
DIRECTORS’ REPORT (cont.) AUDITOR INDEPENDENCE AND NON-AUDIT SERvICES Auditor independence The Directors of Genetic Technologies Limited have received an independence declaration from PricewaterhouseCoopers, the Company’s auditor, as reproduced immediately following the Directors’ Declaration on page 75 of the Financial Report. Non-audit services The company may decide to employ the auditor on assignments additional to their statutory audit duties where the auditor’s expertise and experience with the company and/or the group are important. The board of directors has considered the position and, in accordance with advice received from the audit committee, is satisfied that the provision of the non-audit services is compatible with the general standard of independence for auditors imposed by the Corporations act 2001. The directors are satisfied that the provision of non-audit services by the auditor, as set out below, did not compromise the auditor independence requirements of the Corporations act 2001 for the following reasons: » all non-audit services have been reviewed by the audit committee to ensure they do not impact the impartiality and objectivity of the auditor » none of the services undermine the general principles relating to auditor independence as set out in APES 110 Code of Ethics for professional accountants. During the financial year, the following fees were paid or payable to the auditors of Genetic Technologies Limited and its subsidiaries in respect of both audit and non-audit services: Consolidated 2015 $ 2014 $ ENvIRONMENTAL REGULATION The Company is not aware of any breaches of any environmental regulation during the 2015 financial year. ROUNDING Of AMOUNTS The Company is of a kind referred to in Class Order 98/100, issued by the Australian and Securities and Investments Commission, relating to the “rounding off” of amounts in the Directors’ Report. Amounts in the Directors’ Report have been rounded off in accordance with that Class order to the nearest dollar. PROCEEDINGS ON BEHALf Of THE COMPANy No proceedings have been brought or intervened in or on behalf of the Company with leave to the Court under section 237 of the Corporations act 2001. 34 Audit and assurance services PricewaterhouseCoopers in respect of: Audit and review of the Company’s Financial Report under the Corporations act 2001 328,860 280,500 Other assurance services 229,500 60,000 Other audit firms in respect of: Audit of the Financial Reports of subsidiaries 2,539 3,864 Total remuneration in respect of audit services 560,899 344,364 Non-audit services Other audit firms in respect of: Tax advice and compliance, accounting and other services 147,554 21,470 Total auditors’ remuneration 708,453 365,834 |
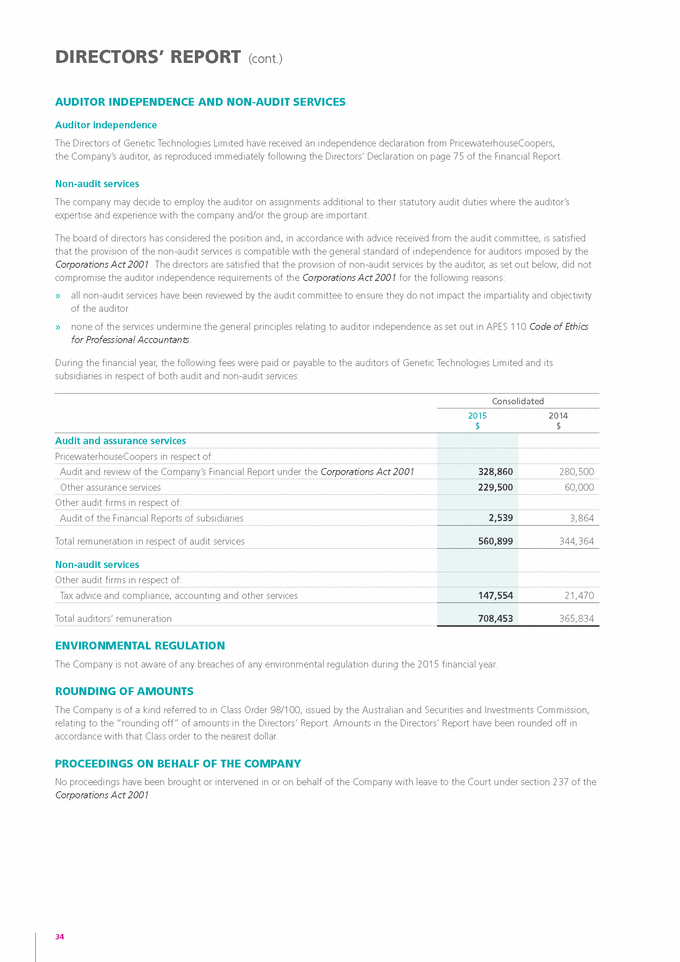
|
|
DIRECTORS’ MEETINGS meeting attendances The number of meetings of Directors (including the meetings of Sub-Committees of the Board) held during the financial year, and the number of such meetings attended by each Director, were as follows: Directors’ meetings Audit Committee meetings Attended Eligible Attended Eligible Dr Malcolm Brandon 11 11 - - Mr Eutillio Buccilli - - - - Mr Grahame Leonard A.M. 11 11 5 5 Dr Paul Kasian 9 11 5 5 Dr Lindsay Wakefield 9 10 2 2 Mr David Carter 4 5 - - Dr Mervyn Cass 3 4 2 3 Prof Ian McKenzie 4 4 - - Sub-committee membership During the year the Company combined the Corporate Governance Committee into the Audit Committee and formed a separate Remuneration Committee. However, during the year the function of the Remuneration Committee was undertaken by the full Board until 30 June 2015. As at the date of this Report, the composition of these two Sub-Committees are: Audit Committee Remuneration Committee Mr Grahame Leonard AM (Chairman of the Committee) Dr Lindsay Wakefield (Chairman of the Committee) Dr Paul Kasian Dr Paul Kasian Dr Lindsay Wakefield Mr Eutillio Buccilli Signed in accordance with a resolution of the Directors. mr. GrAHAmE LEONArD Non-Executive Director Melbourne, 24 September 2015 35 GENETIC TECHNOLOGIES ANNUAL REPORT 2015 |
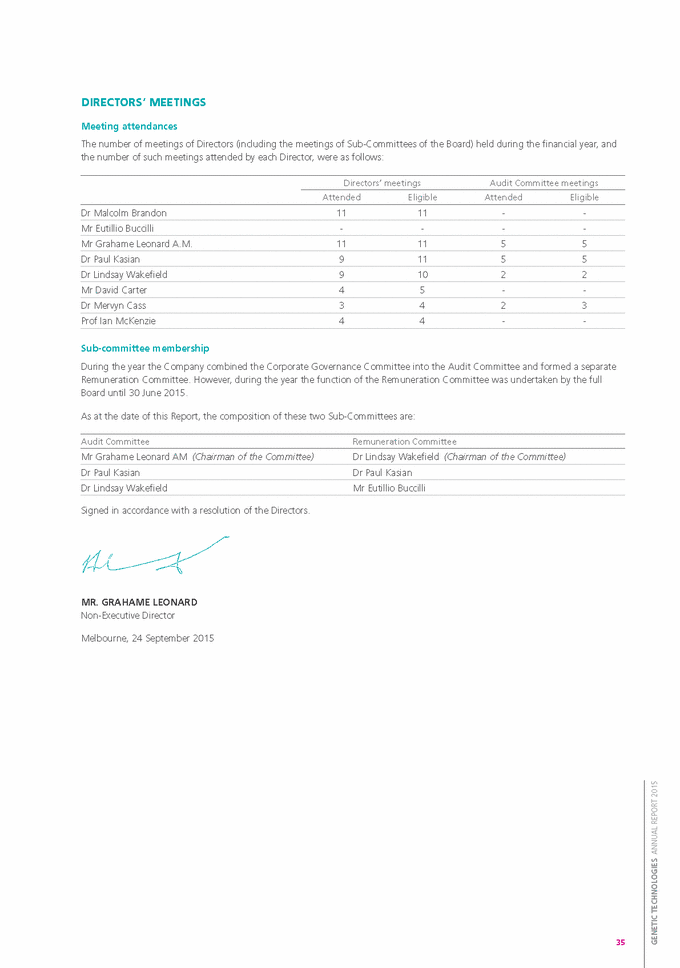
|
|
CORPORATE GOvERNANCE STATEMENT Genetic Technologies Limited (the “Company”) and its Board are committed to achieving the leading standards of corporate governance. Reference is made to the revised Corporate Governance Principles and Recommendations issued and revised from time to time by the ASX Corporate Governance Council. The Board believes that all concepts of the revised Principles and Recommendations have been satisfied, however the Board is realistic with respect to the relative size and nature of the Company and have implemented the Recommendations accordingly. The Company endeavours to ensure exceptions to the guidelines do not have negative impact on the best interests of shareholders. While in most respects the Company complies with the Recommendations, it is recognised that the development and implementation of policies and practices is an ongoing process that evolves with the needs of the business and its stakeholders. ASX Listing Rule 4.10.3 requires an entity that is included in the official list as an ASX Listing to include in its annual report either a corporate governance statement that meets the requirements of that rule or the URL of the page on its website where such a statement is located. The Company therefore advises that the current corporate governance statement and a summary of its main corporate governance practices may be found via the following link on the Company’s website: www.gtgcorporate.com/investor-centre/corporate-governance 36 |

|
|
CONSOLIDATED STATEMENT Of COMPREHENSIvE INCOME FOR THE YEAR ENDED 30 JUNE 2015 Consolidated 2015 2014 Notes $ $ The above consolidated statement of comprehensive income should be read in conjunction with the accompanying notes. 37 GENETIC TECHNOLOGIES ANNUAL REPORT 2015 revenue from continuing operations – genetic testing services 2,011,918 4,564,280 Less: cost of sales4 (891,243) (1,837,729) Gross profit from continuing operations – genetic testing services 1,120,675 2,726,551 Other revenue5 1,027,151 863,832 Other income6 370,557 1,071,072 Gain on disposal of subsidiary - 761,361 Gain on disposal of business7 1,396,798 - Selling and marketing expenses (4,504,299) (6,251,595) General and administrative expenses (4,222,988) (3,173,109) Licensing, patent and legal costs (435,418) (1,079,199) Laboratory and research and development costs (2,851,665) (3,298,127) Finance costs (264,694) (744,199) Fair value gain/(loss) on financial liabilities at fair value through profit/loss 349,246 (648,374) Fair value loss on ImmunAid option fee (795,533) - Share of net loss of associate accounted for using the equity method - (362,682) Loss from continuing operations before income tax expense (8,810,170) (10,134,469) Income tax expense9 - - Loss for the year (8,810,170) (10,134,469) Other comprehensive profit / (loss) Items that may be reclassified to profit or loss Exchange gains / (losses) on translation of controlled foreign operations 414,005 (149,162) Exchange gains / (losses) on translation of non-controlled foreign operations - 86 Other comprehensive profit / (loss) for the year, net of tax 414,005 (149,076) Total comprehensive loss for the year (8,396,165) (10,283,545) Profit loss for the year is attributable to: Owners of Genetic Technologies Limited (8,810,170) (10,125,197) Non-controlling interests - (9,272) Total loss for the year (8,810,170) (10,134,469) Total comprehensive loss for the year is attributable to: Owners of Genetic Technologies Limited (8,396,165) (10,274,359) Non-controlling interests - (9,186) Total comprehensive loss for the year (8,396,165) (10,283,545) Loss per share attributable to owners of the Company and from continuing operations: Basic loss per share (cents per share)10 (0.82) (1.76) Diluted loss per share (cents per share)10 (0.82) (1.76) |
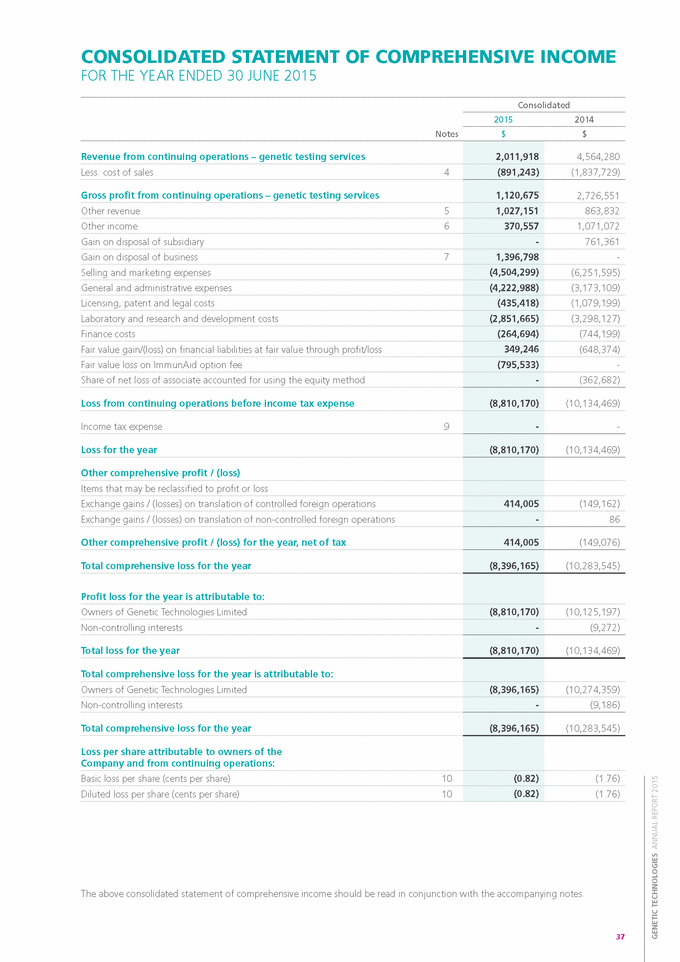
|
|
CONSOLIDATED BALANCE SHEET AS AT 30 JUNE 2015 Consolidated 2015 2014 Notes $ $ The above consolidated balance sheet should be read in conjunction with the accompanying notes. 38 ASSETS Current assets Cash and cash equivalents11 18,341,357 2,831,085 Trade and other receivables12 714,951 1,111,565 Prepayments and other assets13 506,198 414,910 Performance bond and deposits 3,590 2,949 Total current assets 19,566,096 4,360,509 Non-current assets Financial assets at fair value through profit or loss14 - 795,533 Property, plant and equipment15 417,595 394,164 Intangible assets and goodwill 16 736,041 1,178,993 Total non-current assets 1,153,636 2,368,690 Total assets 20,719,732 6,729,199 LIABILITIES Current liabilities Trade and other payables17 1,102,974 1,449,187 Financial liabilities at fair value through profit or loss20 25,000 - Deferred revenue18 77,282 153,226 Provisions19 529,907 715,603 Total current liabilities 1,735,163 2,318,016 Non-current liabilities Provisions19 25,321 81,280 Financial liabilities at fair value through profit or loss20 - 2,502,384 Total non-current liabilities 25,321 2,583,664 Total liabilities 1,760,484 4,901,680 Net assets 18,959,248 1,827,519 EQUITY Contributed equity22 115,247,128 90,080,492 Reserves23 4,697,403 3,922,140 Accumulated losses24 (100,985,283) (92,175,113) Total equity 18,959,248 1,827,519 |
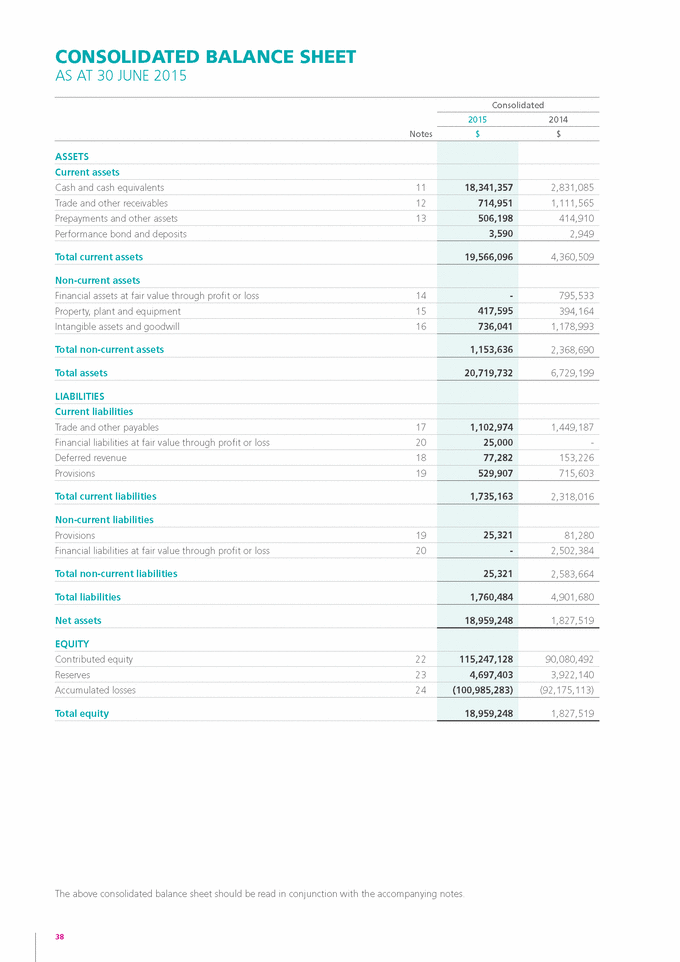
|
|
CONSOLIDATED STATEMENT Of CASH fLOwS FOR THE YEAR ENDED 30 JUNE 2015 Consolidated 2015 2014 Notes $ $ The above consolidated statement of cash flows should be read in conjunction with the accompanying notes. 39 GENETIC TECHNOLOGIES ANNUAL REPORT 2015 Cash flows from / (used in) operating activities Receipts from customers 2,855,599 4,007,591 Payments to suppliers and employees (12,583,957) (15,058,176) Interest received 39,951 116,047 Interest and finance charges paid (3,121) (52,550) Net cash flows from / (used in) operating activities11 (9,691,528) (10,987,088) Cash flows from / (used in) investing activities Proceeds from the sale of plant and equipment 57,119 - Purchases of plant and equipment (192,592) (47,917) Proceeds from the sale of business 2,100,895 - Proceeds from the sale of available-for-sale financial assets - 577,497 Cash disposed on loss of control of subsidiary - (162,576) Advances to associates - (20,470) Payment for financial assets at fair value through profit or loss - (114,159) Net cash flows from / (used in) investing activities 1,965,422 232,375 Cash flows from / (used in) financing activities Proceeds from the issue of shares 23,289,927 7,000,000 Equity transaction costs (2,572,664) (658,498) Proceeds from borrowings 2,150,000 5,581,462 Net cash flows from / (used in) financing activities 22,867,263 11,922,964 Net increase / (decrease) in cash and cash equivalents 15,141,157 1,168,251 Cash and cash equivalents at beginning of year 2,831,085 1,721,293 Net foreign exchange difference 369,115 (58,459) Cash and cash equivalents at end of year11 18,341,357 2,831,085 |
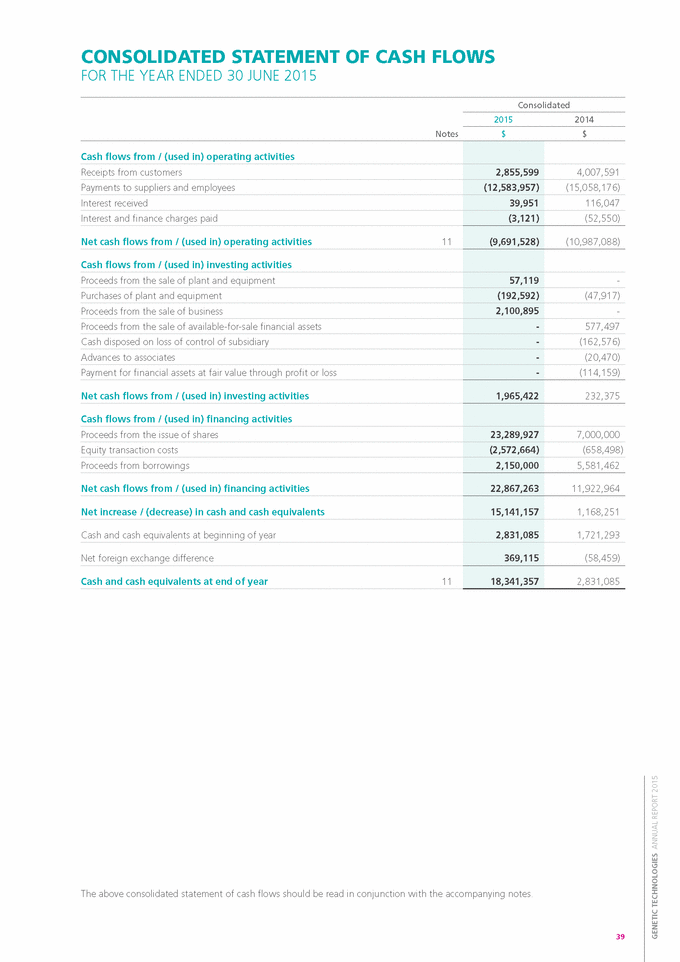
|
|
CONSOLIDATED STATEMENT Of CHANGES IN EQUITy FOR THE YEAR ENDED 30 JUNE 2015 Attributable to Members of Genetic Technologies Limited Contributed equity Accumulated losses Non-controlling interests Total equity Reserves Parent interests Consolidated $ $ $ $ $ $ Balance at 30 June 2013 83,735,845 3,951,771 (82,049,916) 5,637,700 120,587 5,758,287 Loss for the year - - (10,125,197) (10,125,197) (9,272) (10,134,469) Other comprehensive income - (149,162) - (149,162) 86 (149,076) Total comprehensive loss - (149,162) (10,125,197) (10,274,359) (9,186) (10,283,545) Transactions with owners in their capacity as owners Contributions of equity (net of transaction costs) 6,341,472 - - 6,341,472 - 6,341,472 Value of shares issued on conversion of convertible notes 3,572,877 - - 3,572,877 - 3,572,877 Value of shares cancelled as part of the swap deal (3,569,702) - - (3,569,702) - (3,569,702) Share-based payments - 119,531 - 119,531 - 119,531 Removal of non-controlling interests on de-consolidation - - - - (111,401) (111,401) 6,344,647 119,531 - 6,464,178 (111,401) 6,352,777 Balance at 30 June 2014 90,080,492 3,922,140 (92,175,113) 1,827,519 - 1,827,519 The above consolidated statement of changes in equity should be read in conjunction with the accompanying notes. 40 Loss for the year --(8,810,170)(8,810,170)-(8,810,170) Other comprehensive income -414,005 -414,005 -414,005 Total comprehensive loss -414,005 (8,810,170)(8,396,165) -(8,396,165) Transactions with owners in their capacity as owners Contributions of equity (net of transaction costs) 20,659,527--20,659,527 -20,659,527 Value of shares issued on conversion of convertible notes 4,507,109--4,507,109 -4,507,109 Share-based payments -303,522 -303,522 -303,522 Transaction costs on placement of shares -57,736 -57,736 -57,736 25,166,636361,258 -25,527,894 -25,527,894 Balance at 30 June 2015 115,247,1284,697,403 (100,985,283)18,959,248-18,959,248 |
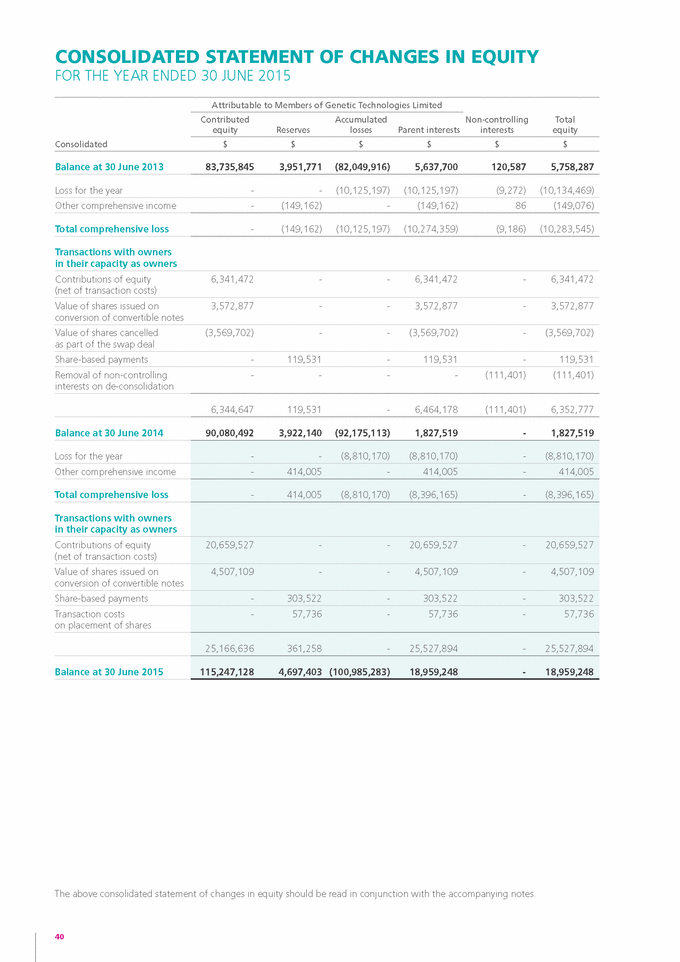
|
|
NOTES TO THE fINANCIAL STATEMENTS FOR THE YEAR ENDED 30 JUNE 2015 1. CORPORATE INfORMATION The Financial Report of Genetic Technologies Limited (the “Company”) for the year ended 30 June 2015 was authorised for issue in accordance with a resolution of the Directors dated 24 September 2015. Genetic Technologies Limited is incorporated in Australia and is a company limited by shares. The Directors have the power to amend and reissue the financial statements. The Company’s ordinary shares are publicly traded on the Australian Securities Exchange under the symbol GTG and, via Level II American Depositary Receipts, on the NASDAQ Capital Market under the ticker GENE. 2. SUMMARy Of SIGNIfICANT ACCOUNTING POLICIES (a) Basis of preparation This general purpose Financial Report has been prepared in accordance with Australian Accounting Standards, other authoritative pronouncements of the Australian Accounting Standards Board and the Corporations act 2001. Compliance with IFRS The Financial Report complies with Australian Accounting Standards as issued by the Australian Accounting Standards Board and International Financial Reporting Standards (“IFRS”) as issued by the International Accounting Standards Board. Historical cost convention These financial statements have been prepared under the historical cost convention except for financial assets and liabilities (including derivative instruments) which are measured at fair value. Critical accounting estimates The preparation of financial statements requires the use of certain critical accounting estimates. It also requires Management to exercise its judgement in the process of applying the Group’s accounting policies. The areas involving a higher degree of judgement or complexity, or areas where assumptions and estimates are critical to the financial statements, are disclosed in Note 3. (b) New accounting standards and interpretations (I) Standards and Interpretations affecting amounts reported in the current period (and/or prior period) The group has applied the following standards and amendments for the first time for their annual reporting period commencing 1 July 2014: » » » » AASB 2013-3 Amendments to AASB 136 – Recoverable Amount Disclosures for Non-Financial Assets; AASB 2013-4 Amendments to Australian Accounting Standards – Novation of Derivatives and Continuation of Hedge Accounting; Interpretation 21 Accounting for Levies; and AASB 2014-1 Amendments to Australian Accounting Standards. The adoption of these standards did not have any impact on the current period or any prior period and is not likely to affect future periods. 41 GENETIC TECHNOLOGIES ANNUAL REPORT 2015 |
|
|
NOTES TO THE fINANCIAL STATEMENTS (cont.) FOR THE YEAR ENDED 30 JUNE 2015 2. SUMMARy Of SIGNIfICANT ACCOUNTING POLICIES (cont.) (b) New accounting standards and interpretations (cont.) (ii) Standards and Interpretations in issue but not yet adopted In respect of the year ended 30 June 2015, the Group has assessed all new Australian accounting standards, and the IFRS equivalents, mandatory for adoption during the current year, noting no new standards which would have a material effect on the disclosure in these financial statements. There has been no effect on the profit and loss or the financial position of the Group. Certain new accounting standards and interpretations have been published that are not mandatory for 30 June 2015 reporting periods. The Group’s and the parent entity’s assessment of the impact of these new standards and interpretations is set out below. Title of Standard Summary and impact on Group’s financial statements Application date of the standard Application date for Group for financial year ending AASB 9 Financial Instruments AASB 9 Financial Instruments replaces AASB 139 and addresses and classification, measurement and derecognition of financial assets and liabilities. It also addresses the new hedge accounting requirements, including changes to hedge effectiveness, treatment of hedging costs and risk components that can be hedged. AASB 9 introduces a new expected loss model impairment model that will require entities to account for expected credit losses at the time of recognising the asset. The Group does not expect the adoption of the new standard to have a material impact on its classification and measurement of the financial assets and liabilities or its results on adoption of the new impairment model. The new standard will result in extended disclosures in the financial statements. The Group has decided not to early adopt AASB 9. 1 January 2018 30 June 2019 AASB 15 revenue from Contracts with Customers AASB 15 provides a single, principles based five-step model to be applied to all contracts with customers. The five steps in the model are as follows: 1 January 2018 30 June 2019 1. 2. 3. 4. identify contracts with customers identify the separate performance obligations determine the transaction price of the contract allocate the transaction price to each of the separate performance obligations, and recognise the revenue as each performance obligation is satisfied. 5. Guidance is provided on topics such as the point in which revenue is recognised, accounting for variable consideration, costs of fulfilling and obtaining a contract and various related matters. The Group is assessing the impact of the new standard on its revenue recognition policy. There are no other standards that are not yet effective and that are expected to have a material impact on the entity in the current or future reporting periods and on foreseeable future transactions. 42 |
|
|
2. SUMMARy Of SIGNIfICANT ACCOUNTING POLICIES (cont.) (c) Principles of consolidation Subsidiaries The consolidated financial statements incorporate the assets and liabilities of all subsidiaries of Genetic Technologies Limited (the “Company” or “Parent Entity”) as at 30 June 2015 and the results of all subsidiaries for the year then ended. Genetic Technologies Limited and its subsidiaries together are referred to in this Financial Report as the “Group” or the “Consolidated Entity”. Subsidiaries are all entities (including structured entities) over which the group has control. The group controls an entity when the group is exposed to, or has rights to, variable returns from its involvement within the entity and has the ability to affect those returns through its power to direct the activities of the entity. Subsidiaries are fully consolidated from the date on which control is transferred to the Group. They are de-consolidated from the date that control ceases. Intercompany transactions, balances and unrealised gains / losses on transactions between Group companies are eliminated. Unrealised losses are also eliminated unless the transaction provides evidence of the impairment of the asset transferred. Accounting policies of subsidiaries have been changed where necessary to ensure consistency with the Group’s policies. Non-controlling interests in the results and equity of subsidiaries are shown separately in the consolidated statement of comprehensive income, consolidated balance sheet and consolidated statement of changes in equity, respectively. Associates Associates are all entities over which the Group has significant influence but not control or joint control, generally accompanying a shareholding of between 20% and 50% of the voting rights. Investments in associates are accounted for using the equity method of accounting, after initially being recognised at cost. The Group’s share of its associate’s post-acquisition profits or losses is recognised in profit or loss and its share of post-acquisition other comprehensive income is recognised in other comprehensive income. The cumulative post-acquisition movements are adjusted against the carrying amount of the investment. Dividends receivable from associates are recognised as a reduction in the carrying amount of the investment. When the Group’s share of losses in an associate equals or exceeds its interest in the associate, including any other unsecured long-term receivables, the Group does not recognise further losses, unless it has incurred obligations or made payments on behalf of the associate. Unrealised gains on transactions between the Group and its associates are eliminated to the extent of the Group’s interest in the associates. Unrealised losses are also eliminated unless the transaction provides evidence of an impairment of the asset transferred. Accounting policies of associates have been changed where necessary to ensure consistency with the policies adopted by the Group. Changes in ownership interests The Group treats transactions with non-controlling interests that do not result in a loss of control as transactions with equity owners of the Group. A change in ownership interest results in an adjustment between the carrying amounts of the controlling and non-controlling interests to reflect their relative interests in the subsidiary. Any difference between the amount of the adjustment to non-controlling interests and any consideration paid or received is recognised in a separate reserve within equity attributable to owners of Genetic Technologies Limited. When the Group ceases to have control, joint control or significant influence, any retained interest in the entity is remeasured to its fair value with the change in carrying amount recognised in profit or loss. The fair value is the initial carrying amount for the purposes of subsequently accounting for the retained interest as an associate, joint venture or financial asset. In addition, any amounts previously recognised in other comprehensive income in respect of that entity are accounted for as if the Group had directly disposed of the related assets or liabilities. This may mean that amounts previously recognised in other comprehensive income are reclassified to profit or loss. If the ownership interest in a joint venture or an associate is reduced but joint control or significant influence is retained, only a proportionate share of the amounts previously recognised in other comprehensive income are reclassified to profit or loss where appropriate. (d) Segment reporting Operating segments are reported in a manner consistent with the internal reporting provided to the chief operating decision maker. The chief operating decision maker, who is responsible for allocating resources and assessing the performance of the operating segments, has been identified as the Chief Executive Officer. 43 GENETIC TECHNOLOGIES ANNUAL REPORT 2015 |
|
|
NOTES TO THE fINANCIAL STATEMENTS (cont.) FOR THE YEAR ENDED 30 JUNE 2015 2. SUMMARy Of SIGNIfICANT ACCOUNTING POLICIES (cont.) (e) Parent entity financial information The financial information for the parent entity, Genetic Technologies Limited has been prepared on the same basis as the consolidated financial statements, except that investments in subsidiaries are accounted for at cost in the financial statements of Genetic Technologies Limited. Loans to subsidiaries are written down to their recoverable value as at balance date. (f) Foreign currency translation The functional and presentation currency of Genetic Technologies Limited and its Australian subsidiaries is the Australian dollar (AUD). Transactions in foreign currencies are initially recorded in the functional currency at the exchange rates ruling at the date of the transaction. Monetary assets and liabilities which are denominated in foreign currencies are retranslated at the rate of exchange ruling at the balance sheet date. All differences are taken to the statement of comprehensive income. Non-monetary items that are measured in terms of historical cost in a foreign currency are translated using the exchange rate ruling at the date of the initial transaction. Non-monetary items measured at fair value in a foreign currency are translated using the exchange rates ruling at the date when the fair value was determined. The functional currencies of the Company’s three overseas subsidiaries are as follows: » » » GeneType AG – Swiss francs (CHF) GeneType Corporation – United States dollars (USD) Phenogen Sciences Inc. – United States dollars (USD) As at the reporting date, the assets and liabilities of these subsidiaries are translated into the presentation currency of Genetic Technologies Limited at the rate of exchange ruling at the balance sheet date and the statement of comprehensive income is translated at the weighted average exchange rates for the period unless this is not a reasonable approximation of the cumulative effect of the rates prevailing on the transaction dates, in which case income and expenses are translated at the dates of the transactions. The exchange differences arising on the retranslation are recognised in other comprehensive income and taken directly to a separate component of equity. On disposal of a foreign entity, the deferred cumulative amount recognised in equity relating to that particular foreign operation is recognised in the statement of comprehensive income. (g) Earnings per share (“EPS”) Basic EPS is calculated by dividing the profit attributable to owners of the Company, excluding any costs of servicing equity other than ordinary shares, by the weighted average number of ordinary shares outstanding during the financial year. Diluted EPS adjusts the figures used in the determination of basic EPS to take into account the after income tax effect of interest and other financing costs associated with dilutive potential ordinary shares and the weighted average number of ordinary shares that would have been outstanding assuming the conversion of all dilutive potential ordinary shares. (h) revenue recognition Revenues are recognised to the extent that it is probable that the economic benefits will flow to the entity and the revenues can be reliably measured. Revenues are recognised at the fair value of the consideration received or receivable net of the amounts of Goods and Services Tax. The following recognition criteria must also be met before revenue is recognised: Genetic testing revenues The Company operates facilities which provide genetic testing services. The Company recognises revenue from the provision of these services when the services have been completed. Fees received in advance of the testing process are deferred until such time as the Company completes its performance obligations. License fees, royalties and annuities received The Company licenses the use of its patented genetic technologies. License fee income is recorded either upfront where the Group has no future obligations or over the license term where the Group has future obligations based on the execution of a binding agreement. The Group does not grant refunds to its customers. Royalties and annuities arising from the above licenses are recognised when earned in accordance with the substance of the agreement, in cases where no future performance is required by the Company and collection is reasonably assured. Interest received Revenue is recognised as the interest accrues using the effective interest method. Interest charged on loans to related parties is charged on commercial and arm’s-length terms and conditions. 44 |
|
|
2. SUMMARy Of SIGNIfICANT ACCOUNTING POLICIES (cont.) (h) revenue recognition (cont.) Research and development tax incentive The Australian government replaced the research and development tax concession with research and development (R&D) tax incentive from 1 July 2011. The R&D tax incentive applies to expenditure incurred and the use of depreciating assets in an income year commencing on or after 1 July 2011. A refundable tax offset is available to eligible companies with an annual aggregate turnover of less than $20 million. Management has assessed the Group’s activities and expenditure to determine which are likely to be eligible under the incentive scheme. The Group accounts for the R&D tax incentive as a government grant. The grant is recognised as other income over the period in which the R&D expense is recognised. (i) Share-based payment transactions The Group provides benefits to Group employees in the form of share-based payment transactions, whereby employees render services and receive rights over shares (“equity-settled transactions”). There is currently an Employee Option Plan in place to provide these benefits to executives and employees and the cost of these transactions is measured by reference to the fair value at the date they are granted. The fair value of options granted is determined by Cape Leveque Securities Pty. Ltd., an independent valuer, using a Black-Scholes option pricing model. Cape Leveque Securities Pty. Ltd. has consented to having its name included in this Report. In valuing equity-settled transactions, no account is taken of any non-market performance conditions. The cost of equity-settled transactions is recognized as an employee benefits expense, together with a corresponding increase in equity, over the period in which the relevant vesting conditions are fulfilled, ending on the date the relevant employees become entitled to the award (“vesting date”). The cumulative expense recognised for equity-settled transactions at each reporting date until vesting date reflects (i) the extent to which the vesting period has expired; and (ii) the number of awards that, in the opinion of the Directors of the Group, will ultimately vest. This opinion is formed based on the best information available at balance date. The Group uses non-market vesting conditions for its share-based payment transactions and no cumulative expense is recognised for any awards that do not ultimately vest. Where the terms of an equity-settled award are modified, as a minimum an expense is recognised as if the terms had not been modified. In addition, an expense is recognised for any increase in the value of the transaction as a result of the modification, as at the date of modification. Where appropriate, the dilutive effect of outstanding options is reflected as additional share dilution in the computation of diluted earnings per share. The Company’s policy is to treat the options of terminated employees as forfeitures. (j) Income tax The income tax expense or revenue for the period is the tax payable on the current period’s taxable income based on the national income tax rate for each jurisdiction adjusted by changes in deferred tax assets and liabilities attributable to temporary differences and unused tax losses. The current income tax charge is calculated on the basis of the tax laws enacted or substantively enacted at the end of the reporting period in the countries where the company’s subsidiaries and associates operate and generate taxable income. Management periodically evaluates positions taken in tax returns with respect to situations in which applicable tax regulation is subject to interpretation. It establishes provisions where appropriate on the basis of amounts expected to be paid to the tax authorities. Deferred income tax is provided in full, using the liability method, on temporary differences arising between the tax bases of assets and liabilities and their carrying amounts in the consolidated financial statements. However, the deferred income tax is not accounted for if it arises from initial recognition of an asset or liability in a transaction other than a business combination that, at the time of the transaction, affects neither accounting nor taxable profit or loss. Deferred income tax is determined using tax rates (and laws) that have been enacted or substantially enacted by the balance sheet date and are expected to apply when the related deferred income tax asset is realised or the deferred income tax liability is settled. Deferred tax assets are recognised for deductible temporary differences and unused tax losses only if it is probable that future taxable amounts will be available to utilise those temporary differences and losses. Deferred tax assets are recognised for deductible temporary differences and unused tax losses only if it is probable that future taxable amounts will be available to utilise those temporary differences and losses. Deferred tax liabilities and assets are not recognised for temporary differences between the carrying amount and tax bases of investments in controlled entities where the parent entity is able to control the timing of the reversal of the temporary differences and it is probable that the differences will not reverse in the foreseeable future. Deferred tax assets and liabilities are offset when there is a legally enforceable right to offset current tax assets and liabilities and when the deferred tax balances relate to the same taxation authority. Current tax assets and tax liabilities are offset where the entity has a legally enforceable right to offset and intends either to settle on a net basis, or to realise the asset and settle the liability simultaneously. Current and deferred tax balances attributable to amounts recognised directly in equity are also recognised directly in equity. Current and deferred tax is recognised in profit or loss, except to the extent that it relates to items recognised in other comprehensive income or directly in equity. In this case, the tax is also recognised in other comprehensive income or directly in equity, respectively. 45 GENETIC TECHNOLOGIES ANNUAL REPORT 2015 |
|
|
NOTES TO THE fINANCIAL STATEMENTS (cont.) FOR THE YEAR ENDED 30 JUNE 2015 2. SUMMARy Of SIGNIfICANT ACCOUNTING POLICIES (cont.) (j) Income tax (cont.) Tax consolidation legislation Genetic Technologies Limited (“GTG”) and its wholly-owned Australian-resident subsidiaries have implemented the tax consolidation legislation. The head entity, GTG, and the subsidiaries in the tax consolidated group account for their own current and deferred tax amounts. These tax amounts are measured as if each entity in the tax consolidated group continues to be a stand-alone taxpayer in its own right. In addition to its own current and deferred tax amounts, GTG also recognises the current tax assets / liabilities and the deferred tax assets arising from unused tax losses and tax credits assumed from subsidiaries in the tax consolidated group. Assets or liabilities arising under tax funding agreements with the tax consolidated entities are recognised as amounts receivable from or payable to other entities in the Group. Any difference between the amounts assumed and amounts receivable or payable under the tax funding agreements are recognised as a contribution to (or distribution from) wholly-owned tax subsidiaries. (k) Other taxes Revenues, expenses and assets are recognised net of the amount of Goods and Services Tax (GST) except where the GST incurred on a purchase of goods and services is not recoverable from the taxation authority, in which case the GST is recognised as part of the cost of acquisition of the asset or as part of the expense item as applicable; and receivables and payables are stated with the amount of GST included. The net amount of GST recoverable from, or payable to, the taxation authority is included as part of receivables or payables in the balance sheet. Cash flows are included in the cash flow statement on a gross basis and the GST component arising from investing and financing activities, which is recoverable from / payable to the taxation authority, are classified as operating cash flows. (l) Withholding tax The Group generates revenues from the granting of licenses to parties resident in overseas countries. Such revenues may, in certain circumstances, be subject to the deduction of local withholding tax. In such cases, revenues are recorded net of any withholding tax deducted. (m) Finance costs Finance costs are recognised using the effective interest rate method. (n) Cash and cash equivalents Cash and cash equivalents in the balance sheet comprise cash at bank and in hand and short-term deposits with an original maturity of 3 months or less. For the purposes of the cash flow statement, cash and cash equivalents consist of cash and cash equivalents as defined above. Cash at bank earns interest at floating rates based on daily bank deposit rates. Short-term deposits are made for varying periods, depending on the immediate cash requirements of the Group, and earn interest at the respective short-term deposit rates. (o) Trade and other receivables Trade receivables, which are non-interest bearing and generally have terms of between 30 to 90 days, are recognised and carried at original invoice amount less an allowance for any uncollectible amounts. An allowance for doubtful debts is made when there is objective evidence that a receivable is impaired. Such evidence includes an assessment of the debtor’s ability and willingness to pay the amount due. The amount of the allowance/impairment loss is measured as the difference between the carrying amount of the trade receivables and the estimated future cash flows expected to be received from the relevant debtors. (p) Inventories Inventories principally comprise laboratory and other supplies and are valued at the lower of cost and net realisable value. Inventory costs are recognised as the purchase price of items from suppliers plus freight inwards and any applicable landing charges. Costs are assigned on the basis of weighted average cost. (q) Performance bonds and deposits Performance bonds and deposits include cash deposits held as security for the performance of certain contractual obligations. 46 |
|
|
2. SUMMARy Of SIGNIfICANT ACCOUNTING POLICIES (cont.) (r) Property, plant and equipment Plant and equipment is stated at cost less accumulated depreciation and any impairment in value. Depreciation is calculated on either a straight-line or diminishing value basis over the estimated useful life of the respective asset as follows: » » » » » Laboratory equipment – 3 to 5 years. Computer equipment – 2 to 5 years. Office equipment – 2 to 5 years. Equipment under hire purchase – 3 years. Leasehold improvements – lease term, being between 1 and 5 years. Costs relating to day-to-day servicing of any item of property, plant and equipment are recognised in profit or loss as incurred. The cost of replacing larger parts of some items of property, plant and equipment are capitalised when incurred and depreciated over the period until their next scheduled replacement, with the replacement parts being subsequently written off. (s) Intangible assets Patents Patents held by the Group are used in the licensing, testing and research areas and are carried at cost and amortised on a straight-line basis over their useful lives, being 10 years. External costs incurred in filing and protecting patent applications, for which no future benefit is reasonably assured, are expensed as incurred. Research and development costs Costs relating to research activities are expensed as incurred. An intangible asset arising from development expenditure on an internal project is recognised only when the Group can demonstrate the technical feasibility of completing the intangible asset so that it will be available for use or sale, its intention to complete and its ability to use or sell the asset, how the asset will generate future economic benefits, the availability of resources to complete the development and the ability to measure reliably the expenditure attributable to the intangible asset during its development. To date, all development costs have been expensed as incurred as their recoverability cannot be regarded as assured. (t) Goodwill Goodwill on acquisition is initially measured at cost, being the excess of the cost of the business combination over the acquirer’s interest in the net fair value of the identifiable assets, liabilities and contingent liabilities. Following its initial recognition, goodwill is measured at cost less any accumulated impairment losses. Goodwill is not amortised. Goodwill is reviewed for impairment at each reporting date, or more frequently if events or changes in circumstances indicate that the carrying value may be impaired. Impairment is determined by assessing the recoverable amount of the cash-generating unit to which the goodwill relates. Where the recoverable amount of the cash-generating unit is less than the carrying amount, an impairment loss is recognised. Where goodwill forms part of a cash-generating unit and part of the operation within that unit is disposed of, the goodwill associated with the operation disposed of is included in the carrying amount of the operation when determining the gain or loss on disposal of the operation. Goodwill disposed of in this circumstance is measured on the basis of the relative values of the operation disposed of and the portion of the cash-generating unit retained. For the purpose of impairment testing, goodwill acquired in a business combination is, from the acquisition date, allocated to each of the Group’s cash-generating units, or groups of cash-generating units, that are expected to benefit from the synergies of the combination, irrespective of whether other assets or liabilities of the Group are assigned to those units or groups of units. Each unit or group of units to which the goodwill is so allocated represents the lowest level within the Group at which the goodwill is monitored for internal management purposes and is not larger than an operating segment in accordance with AASB 8 Operating Segments. 47 GENETIC TECHNOLOGIES ANNUAL REPORT 2015 |
|
|
NOTES TO THE fINANCIAL STATEMENTS (cont.) FOR THE YEAR ENDED 30 JUNE 2015 2. SUMMARy Of SIGNIfICANT ACCOUNTING POLICIES (cont.) (u) Impairment of assets (other than goodwill) The Group assesses at each reporting date whether there is an indication that an asset may be impaired. If any such indication exists, the Group makes an estimate of the asset’s recoverable amount. An asset’s recoverable amount is the higher of its fair value less costs of disposal and its value in use and is determined for an individual asset, unless the asset does not generate cash inflows that are largely independent of those from other assets or groups of assets and the asset’s value-in-use cannot be estimated to be close to its fair value. In such cases, the asset is tested for impairment as part of the cash-generating unit to which it belongs. When the carrying amount of an asset or cash-generating unit exceeds its recoverable amount, the asset or cash-generating unit is considered impaired and is written down to its recoverable amount. In assessing value in use, the estimated future cash flows are discounted to their present value using a pre-tax discount rate that reflects current market assessments of the time value of money and the risks specific to the asset. Impairment losses relating to operations are recognised in those expense categories consistent with the function of the impaired asset unless the asset is carried at its revalued amount, in which case the impairment loss is treated as a revaluation decrease. An assessment is made at each reporting date as to whether there is any indication that previously recognised impairment losses may no longer exist or may have decreased. If such indication exists, the recoverable amount is estimated. A previously recognised impairment loss is reversed only if there has been a change in the estimates used to determine the asset’s recoverable amount since the last impairment loss was recognised. If so, the carrying amount of the asset is increased to its recoverable amount. The increased amount cannot exceed the carrying amount that would have been determined, net of depreciation, had no impairment loss been recognised for the asset in prior years. Such reversal is recognised in profit or loss unless it reverses a decrement previously charged to equity, in which case the reversal is treated as a revaluation increase. After such a reversal, the depreciation charge is adjusted in future periods to allocate the asset’s revised carrying amount, less any residual value, on a systematic basis over its remaining useful life. (v) Leases and hire purchase agreements Finance leases and hire purchase agreements, which transfer to the Group substantially all the risks and benefits incidental to ownership of the financed item, are capitalised at the inception of the lease at the fair value of the leased property or, if lower, at the present value of the minimum lease payments. Lease and hire purchase payments are apportioned between finance charges and a reduction of the associated liability so as to achieve a constant rate of interest on the remaining balance of the liability. Finance charges are recognised as an expense in profit or loss. Capitalised leased assets and assets under hire purchase are depreciated over the shorter of the estimated useful life of the asset or the term of the agreement. Leases where the lessor retains substantially all the risks and benefits of ownership of the asset are classified as operating leases. Operating lease payments are recognised as an expense in the statement of comprehensive income on a straight-line basis over the lease term. (w) Employee benefits (i) Short-term obligations Provision is made for employee benefits accumulated as a result of employees rendering services up to the reporting date. These benefits include wages and salaries, annual leave and long service leave. Liabilities arising in respect of wages and salaries, expected to be settled within twelve months of the reporting date are measured at their nominal amounts based on remuneration rates which are expected to be paid when the liability is settled. Expenses for non-accumulating sick leave are recognised when the leave is taken during the year and are measured at rates paid or payable. (ii) Other long-term employee benefit obligations The liabilities for long service leave and annual leave are not expected to be settled wholly within 12 months after the end of the reporting period in which the employee renders the related service. They are therefore recognised in the provision for employee benefits and measured as the present value of expected future payments to be made in respect of services provided by employees up to the end of the reporting period using the projected unit credit method. Consideration is given to expected future wage and salary levels, experience of employee departures and periods of service. Expected future payments are discounted using market yields at the end of the reporting period of corporate bonds with terms and currencies that match, as closely as possible, the estimated future cash outflows. The obligations are presented as current liabilities in the balance sheet if the entity does not have an unconditional right to defer settlement for at least twelve months after the reporting period, regardless of when the actual settlement is expected to occur. (iii) Retirement benefit obligations The Group does not have any defined benefit funds. Statutory contributions to defined contribution superannuation funds are recognised as an expense as they become payable. Prepaid contributions are recognised as an asset to the extent that a cash refund or a reduction in the future payments is available. Statutory contributions are legally enforceable in Australia. 48 |
|
|
2. SUMMARy Of SIGNIfICANT ACCOUNTING POLICIES (cont.) (x) Provisions Provisions are recognised when the Group has a present obligation (legal or constructive) as a result of a past event, it is probable that an outflow of resources embodying economic benefits will be required to settle the obligation and a reliable estimate can be made of the amount of the obligation. Where the Group expects some or all of a provision to be reimbursed, the reimbursement is recognised as a separate asset but only when the reimbursement is virtually certain. The expense relating to any provision is presented in the statement of comprehensive income net of any reimbursement. If the effect of the time value of money is material, provisions are determined by discounting the expected future cash flows at a pre-tax rate that reflects market assessments of the time value of money and, where appropriate, the risks specific to the liability. Where discounting is used, the increase in the provision due to the passage of time is recognised as a finance cost. (y) Trade and other payables Trade payables and other payables are carried at amortised cost and represent liabilities for goods and services provided to the Group prior to the end of the financial year that are unpaid and arise when the Group becomes obliged to make future payments in respect of the purchase of these goods and services. Trade payables and other payables generally have terms of between 30 and 60 days. (z) Contributed equity Issued and paid up capital is recognised at the fair value of the consideration received by the Company. Transaction costs arising on the issue of ordinary shares are recognised directly in equity as a deduction, net of tax, of the proceeds received. The Company has a share-based payment option plan under which options to subscribe for the Company’s shares have been granted to certain executives and other employees. (aa) Financial assets and liabilities During the year ended 30 June 2015, the Group acquired both a financial asset and liability at fair value through profit or loss. Financial assets and liabilities at fair value through profit or loss are initially recognised at fair value on the date a contract is entered into and are subsequently remeasured to their fair value and at the end of each reporting period. The accounting for subsequent changes in fair value is recognised in profit or loss. (ab) Business combinations The acquisition method of accounting is used to account for all business combinations, including business combinations involving entities or businesses under common control, regardless of whether equity instruments or other assets are acquired. The consideration transferred for the acquisition of a subsidiary comprises the fair values of the assets transferred, the liabilities incurred and the equity interests issued by the Group. The consideration transferred also includes the fair value of any contingent consideration arrangement and the fair value of any pre-existing equity interest in the subsidiary. All costs relating to acquisitions are expensed as incurred. Identifiable assets acquired and liabilities and contingent liabilities assumed in a business combination are, with limited exceptions, measured initially at their fair values at the acquisition date. On an acquisition-by-acquisition basis, the Group recognises any non-controlling interest in the acquiree either at fair value or at the non-controlling interest’s proportionate share of the acquiree’s net identifiable assets. The excess of the consideration transferred, the amount of any non-controlling interest in the acquiree and the acquisition-date fair value of any previous equity interest in the acquiree over the fair value of the Group’s share of the net identifiable assets acquired is recorded as goodwill. If those amounts are less than the fair value of the net identifiable assets of the subsidiary acquired and the measurement of all amounts has been reviewed, the difference is recognised directly in profit or loss as a bargain purchase. Where settlement of any part of cash consideration is deferred, the amounts payable in the future are discounted to their present value as at the date of exchange. The discount rate used is the entity’s incremental borrowing rate, being the rate at which a similar borrowing could be obtained from an independent financier under comparable terms and conditions. 49 GENETIC TECHNOLOGIES ANNUAL REPORT 2015 |
|
|
NOTES TO THE fINANCIAL STATEMENTS (cont.) FOR THE YEAR ENDED 30 JUNE 2015 3. CRITICAL ACCOUNTING ESTIMATES AND JUDGEMENTS Estimates and judgements are evaluated and based on historical experience and other factors, including expectations of future events that may have a financial impact on the Company and that are believed to be reasonable under the circumstances. Going concern During the 2015 financial year, the Company incurred a total comprehensive loss after income tax of $8,396,165 (2014: $10,283,545) and net cash outflows from operations of $9,691,528 (2014: $10,987,088). As at 30 June 2015, the Company held cash reserves of $18,341,357 and had net current assets of $17,830,933. The cash generated from revenue combined with its existing cash reserves will enable the Company to fund its operations in the next twelve months from the date of this report. However, the Company is aware that the long term viability of the Company is directly dependent on the ability to grow revenue, control costs and raise additional funds via the issuance of new equity should the need arise. Any issuance of new equity will be subject to normal risks and therefore could impact the ability of the Company to continue as a going concern. However, the Directors believe that the Company would be successful in raising new funds if the need arises and have prepared the financial report on a going concern basis. Critical accounting estimates and assumptions The carrying amounts of certain assets and liabilities are often determined based on estimates and assumptions of future events. The key estimates and assumptions that have a significant risk of causing a material adjustment to the carrying value of certain assets and liabilities within the next annual reporting period are set out below. Impairment of intangible assets and goodwill The Group determines whether intangible assets, including goodwill, are impaired on at least an annual basis, in accordance with the accounting policies stated in Notes 2(s) and 2(t). This process requires an estimation to be made of the recoverable amount of the cash-generating units to which the respective assets are allocated. Share-based payments transactions The Group measures the cost of equity-settled transactions with employees by reference to the value of the equity instruments at the date on which they are granted. Management determined the fair value by engaging an independent valuer using a Black-Scholes options pricing model. Useful lives of assets The estimation of the useful lives of assets has been based on historical experience as well as lease terms (for leased equipment) and patent terms (for patents). In addition, the condition of the assets is assessed at least annually and considered against the remaining useful life and adjustments to useful lives are made when considered necessary. Revenue from the sale of BREVAGen tests In accordance with revenue recognition principles, the Group recognises the revenue from the sale of BREVAGenTM and BREVAGenplus® test on an accruals basis. This requires the Group to estimate the amount of revenue expected to be received based on the historical data of amounts received from tests sold since the launch of BREVAGenTM and BREVAGenplus®. The accrual estimate may be impacted by the recoverability of the amounts via the U.S. healthcare reimbursement system. 50 |
|
|
Consolidated 2015 $ 2014 $ 4. COST Of SALES 5. OTHER REvENUE 1. license fees received included $781,108 (2014: $291,628) of licensing income from applera Corporation and this agreement will end in December 2015. 6. OTHER INCOME 7. GAIN ON SALE Of BUSINESS 2015 $ On 19 November 2014, the Company announced that it had completed the sale of its heritage Australian Genetics business to Specialist Diagnostics Services Ltd (“SDS”), the wholly owned pathology subsidiary of Primary Health Care Ltd. Under the terms of sale, SDS acquired the Australian Genetics business for $2,100,895 (net of employee entitlements and inclusive of GST) in cash. The gain on disposal as recognised in the Consolidated Statement of Comprehensive Income is $1,396,798 the details of which are noted above. 8. EXPENSES 51 GENETIC TECHNOLOGIES ANNUAL REPORT 2015 Amortisation of intangible assets 127,564 127,566 Depreciation of fixed assets 104,639 83,937 Net foreign currency losses 200,243 - Employee benefits expenses 5,470,007 6,247,731 Operating lease expenses 404,638 386,694 Research and development expenses 728,592 652,994 Proceeds from sale of business 2,100,895 Trade and other receivables (190,990) Prepayments and other assets (220,785) Net value of fixed assets (176,065) Goodwill (315,388) Deferred revenue 51,952 Current provisions 120,989 Long term provisions 26,190 Total gain on sale of business 1,396,798 Net foreign exchange gains - 167,584 Net profit on disposal of plant and equipment 3,843 53,277 Management fees received - 38,267 Research and development tax incentive 111,188 358,395 Fair value gains on financial assets at fair value through profit or loss - 295,533 Interest income 39,951 116,047 Net gain on sale of available-for-sale financial assets - 41,969 Rent recovery 215,575 - Total other income and expenses 370,557 1,071,072 License fees received1 938,471 628,497 Royalties and annuities received 88,680 235,335 Total other revenue 1,027,151 863,832 Inventories used 462,908 929,538 Direct labour costs 347,745 716,731 Depreciation expense 55,818 126,942 Inventories written off 24,772 64,518 Total cost of sales 891,243 1,837,729 |
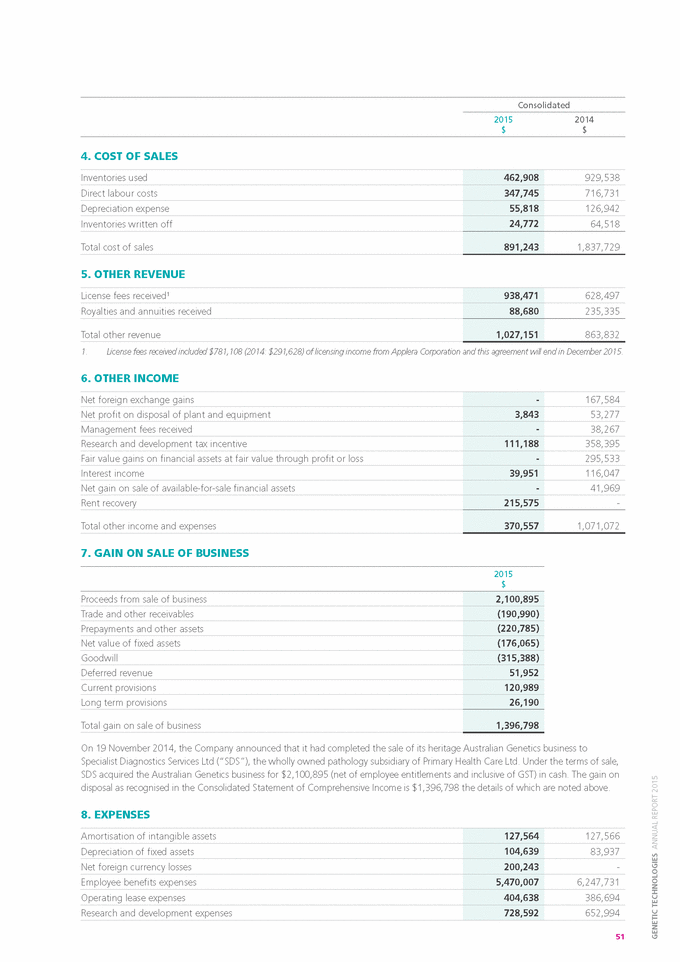
|
|
NOTES TO THE fINANCIAL STATEMENTS FOR THE YEAR ENDED 30 JUNE 2015 (cont.) Consolidated 2015 $ 2014 $ 9. INCOME TAX 52 reconciliation of income tax expense to prima facie tax payable Loss before income tax expense (8,810,170) (10,134,469) Tax at the Australian tax rate of 30% (2014: 30%) (2,643,051) (3,040,341) tax effect amounts which are not deductible / (taxable) in calculating taxable income Net impairment losses and other write-downs 98 (83,376) Share-based payments expense 91,057 35,859 Share of net loss of associate accounted for using the equity method - 108,805 Capital raising expenses - 92,194 Disposal of associate accounted for using the equity method - 1,100,195 Gain on disposal of subsidiary - (216,056) Fair value gains on financial assets at fair value through profit or loss - (88,660) Fair value (gains)/ loss on financial liabilities at fair value through profit or loss (104,774) 194,512 Research and development tax incentive 78,673 113,360 Non-assessable forgiveness of debt - (111,203) Disposal of Heritage business 41,091 - Tax effect of inter-company transactions 5,370 (81,909) Withholding tax expense 5,484 5,606 Other non-deductible items 2,032 2,869 (2,524,020) (1,968,145) Under /(over) provision (7,849) (1,424,354) Research and development tax credit (33,356) (107,518) Tax losses not recognised 2,565,225 3,500,017 Income tax expense - - Net deferred tax assets Deferred tax assets not recognised ImmunAid option fee 150,000 - Property, plant & equipment 9,067 - Capital raising costs 849,649 481,459 Applera settlement 44,945 279,285 Intangible assets 2,185,263 2,170,487 Doubtful debts - 32,677 Provisions 226,568 239,065 Other 86,830 64,755 Total deferred tax assets 3,552,322 3,267,728 Deferred tax liabilities not recognised Prepayments 355 - ImmunAid Option - 88,660 Total deferred tax liabilities 355 88,660 Net deferred tax assets on temporary differences not brought to account (3,551,967) (3,179,068) Total net deferred tax assets - - |
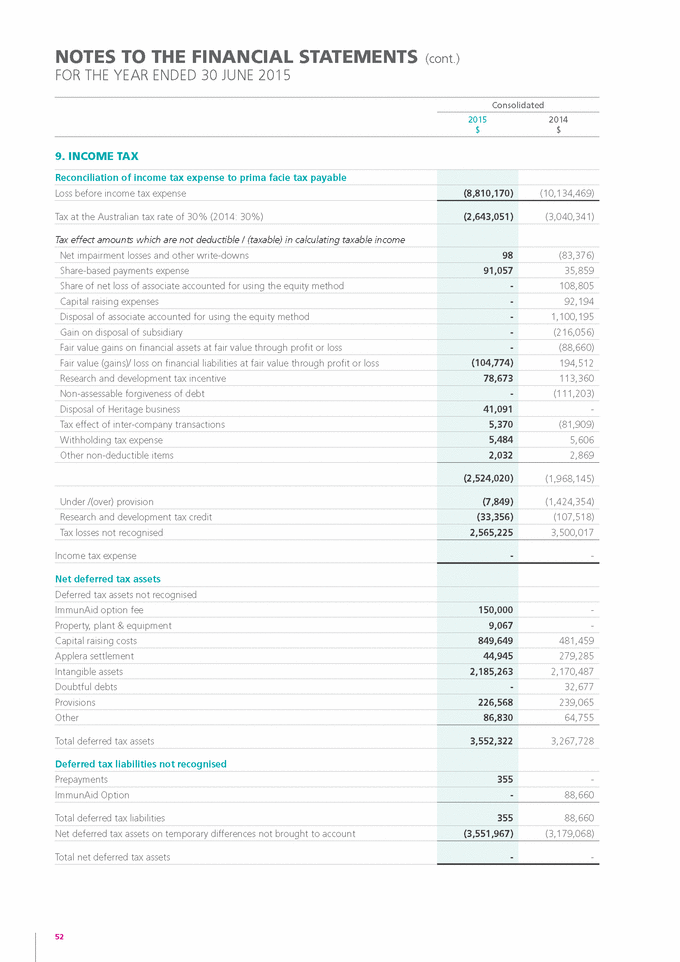
|
|
Consolidated 2015 $ 2014 $ 9. INCOME TAX (cont.) Subject to the Group continuing to meet the relevant statutory tests, the tax losses are available for offset against future taxable income. At 30 June 2015, the Group had a potential tax benefit related to tax losses carried forward of $19,134,010. Such amount includes net losses of $5,696,906 related to subsidiaries in the United States (US) which would expire after 20 years starting in 2030. The remaining tax losses carried forward of $13,437,104 are indefinite and are attributable to the Group’s operations in Australia As such, the total unused tax losses available to the Group, equal $19,134,010. As at balance date, there are unrecognised tax losses with a benefit of approximately $19,134,010 (2014: $15,793,555) that have not been recognised as a deferred tax asset to the Group. These unrecognised deferred tax assets will only be obtained if: (a) The Group companies derive future assessable income of a nature and amount sufficient to enable the benefits to be realised; (b) The Group companies continue to comply with the conditions for deductibility imposed by the law; and (c) No changes in tax legislation adversely affect the Group companies from realising the benefit. Tax consolidation legislation Genetic Technologies Limited and its wholly-owned Australian subsidiaries implemented the tax consolidation legislation as from 1 July 2003. The accounting policy in relation to this legislation is set out in Note 2(j). The entities in the tax consolidated group have entered into a Tax Sharing Agreement which, in the opinion of the Directors, limits the joint and several liabilities of the wholly-owned entities in the case of a default by the head entity, Genetic Technologies Limited. The entities have also entered into a Tax Funding Agreement under which the wholly-owned entities fully compensate Genetic Technologies Limited for any current tax payable assumed and are compensated by Genetic Technologies Limited for any current tax receivable and deferred tax assets relating to unused tax losses or unused tax credits that are transferred to Genetic Technologies Limited under the tax consolidation legislation. The funding amounts are determined by reference to the amounts recognised in the respective subsidiaries’ financial statements. The amounts receivable or payable under the Tax Funding Agreement are due upon receipt of the funding advice from the head entity, which is issued as soon as practicable after the end of each financial year. As at 30 June 2015, there are no unrecognised temporary differences associated with the Group’s investments in subsidiaries, as the Group has no liability for additional taxation should unremitted earnings be remitted (2014: $nil). 10. LOSS PER SHARE The following reflects the income and share data used in the calculations of basic and diluted loss per share: Note: None of the 24,241,667 (2014: 7,775,000) options over the Company’s ordinary shares that were outstanding as at the reporting date are considered to be non-dilutive for the purposes of calculating diluted earnings per share. 53 GENETIC TECHNOLOGIES ANNUAL REPORT 2015 Loss for the year attributable to the owners of Genetic Technologies Limited (8,810,170) (10,125,197) Weighted average number of ordinary shares used in calculating loss per share 1,072,803,358 574,557,747 Tax losses Unused tax losses for which no deferred tax asset has been recognised 63,780,030 52,645,184 Potential tax benefit @ 30% 19,134,010 15,793,555 |
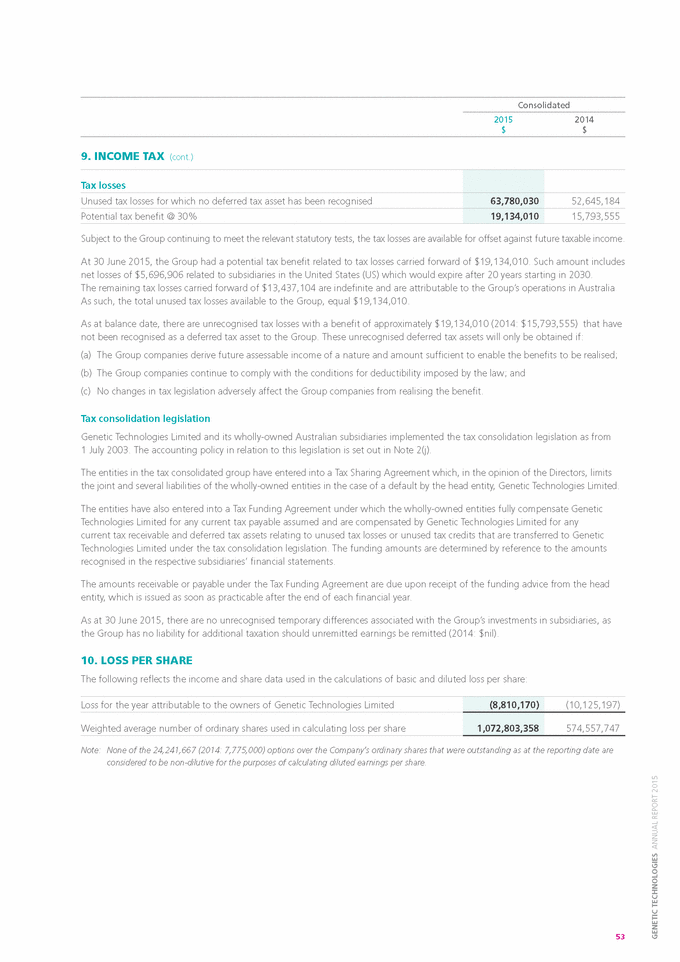
|
|
NOTES TO THE fINANCIAL STATEMENTS FOR THE YEAR ENDED 30 JUNE 2015 (cont.) Consolidated 2015 2014 $ $ 11. CASH AND CASH EQUIvALENTS reconciliation of loss for the year Financing facilities available 54 As at 30 June 2015, the following financing facilities had been negotiated and were available: total facilities Credit cards 306,750 277,298 facilities used as at reporting date Credit cards (25,708) (26,577) facilities unused as at reporting date Credit cards 281,042 250,721 Reconciliation of loss for the year after income tax to net cash flows used in operating activities is as follows: Loss for the year after income tax (8,810,170) (10,134,469) Adjust for non-cash items Amortisation and depreciation expenses 232,203 338,445 Interest on convertible notes converted to shares 73,618 - Share-based payments expense 303,522 119,531 Share of loss of associate - 362,682 Non-cash licensing revenue (245,500) - Fair value gain on deconsolidation of subsidiary - (225,833) Net (gain)/loss on sale of business (1,396,798) - Net (gain)/loss on sale of available for sale financial assets - (41,969) Fair value gains on financial assets at fair value through profit or loss - (295,533) Fair value (gains) / losses on financial liabilities at fair value through profit or loss (349,246) 447,769 Net (profit) / loss on disposal of plant and equipment (3,843) (53,277) Net foreign exchange (gains) / losses 200,243 46,344 adjust for changes in assets and liabilities (Increase) / decrease in trade and other receivables 152,348 (782,923) (Increase) / decrease in prepayments and other assets (312,073) (16,725) (Increase) / decrease in performance bonds and deposits (641) 206,347 (Increase) / decrease in financial assets at fair value through profit or loss 795,533 (795,533) Increase / (decrease) in trade and other payables (412,256) 73,651 Increase / (decrease) in deferred revenue (23,993) (167,555) Increase / (decrease) in provisions 105,525 (68,040) Net cash flows from / (used in) operating activities (9,691,528) (10,987,088) reconciliation of cash and cash equivalents Cash at bank and on hand 18,341,357 2,831,085 Total cash and cash equivalents 18,341,357 2,831,085 |
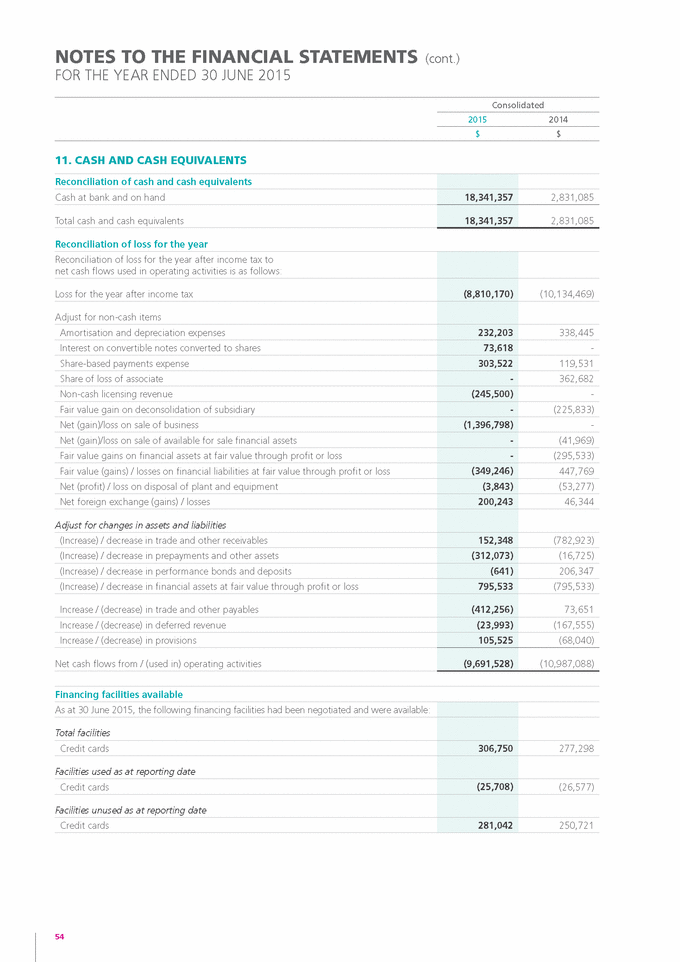
|
|
Consolidated 2015 2014 $ $ 12. TRADE AND OTHER RECEIvABLES (CURRENT) Note: trade and other receivables for the Group include amounts due in uS dollars of uSD 373,137 (2014: uSD 511,307). refer Note 34 for details of aging, interest rate and credit risks applicable to trade and other receivables for which, due to their short-term nature, their carrying value approximates their fair value. 13. PREPAyMENTS AND OTHER ASSETS (CURRENT) 14. fINANCIAL ASSETS AT fAIR vALUE THROUGH PROfIT AND LOSS (NON-CURRENT) ImmunAid Limited (“ImmunAid”) is a former associate of Genetic Technologies Limited (the “Company”) in which ImmunAid and the Company executed an Option Agreement pursuant to which ImmunAid granted the Company options to acquire a total of $2,250,000 ordinary shares in ImmunAid. Each option will entitle the Company to acquire one ordinary share in ImmunAid at a price of $1.35 per share at any time for three years from the date on which the options are granted on 17 April 2014. During the year ended 30 June 2015 the Company has written down the ImmunAid asset by $795,533 to $NIL. The write-down was recorded as a fair value loss on financial assets at fair value through profit or loss in the Comprehensive Income Statement. 55 GENETIC TECHNOLOGIES ANNUAL REPORT 2015 Option Fee – ImmunAid Limited - 795,533 Total financial assets at fair value through profit and loss - 795,533 Prepayments 188,701 201,916 Inventories at the lower of cost and net realisable value 317,497 212,994 Total current prepayments and other assets 506,198 414,910 Trade receivables 524,580 1,004,395 Less: provision for doubtful debts - (108,925) Net trade receivables 524,580 895,470 Other receivables 190,371 216,095 Total net current trade and other receivables 714,951 1,111,565 |
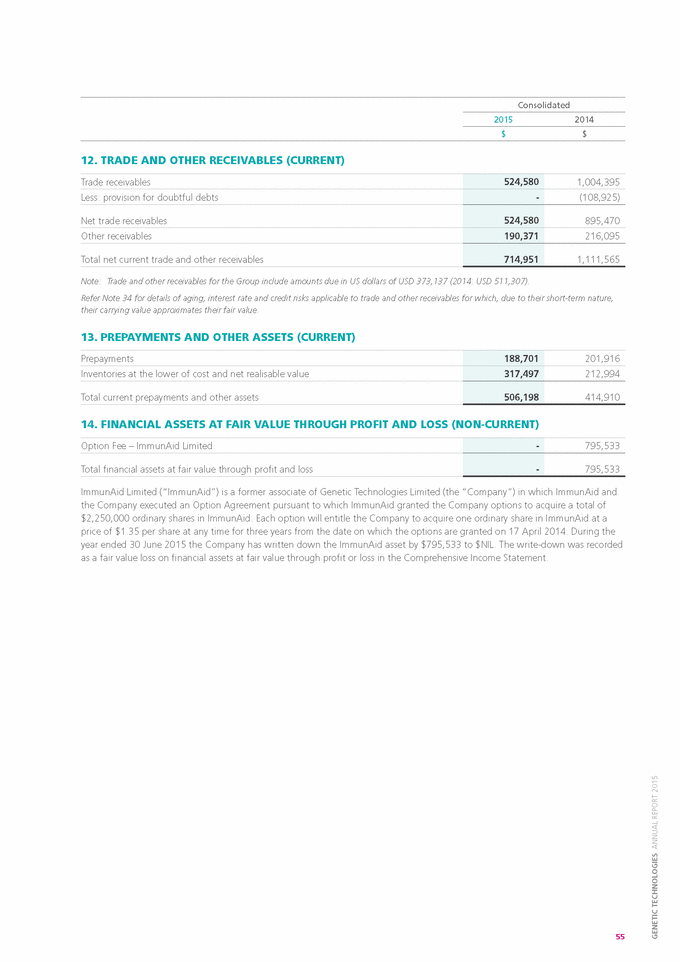
|
|
NOTES TO THE fINANCIAL STATEMENTS FOR THE YEAR ENDED 30 JUNE 2015 (cont.) Consolidated 2015 2014 $ $ 15. PROPERTy, PLANT AND EQUIPMENT reconciliation of property, plant and equipment reconciliation of movements in property, plant and equipment by asset category Opening net carrying Amount Net disposals due to sale of subsidiary Closing net carrying amount Additions during year Depreciation expense Asset category $ $ $ $ $ Laboratory equipment 308,982 274,310 (161,703) (57,988) 363,601 Computer equipment 60,321 29,825 (7,826) (36,527) 45,793 Office equipment 21,944 - (6,536) (8,383) 7,025 Leasehold improvements 2,917 - - (1,741) 1,176 Totals 394,164 304,135 (176,065) (104,639) 417,595 56 Opening gross carrying amount 5,799,559 6,194,829 Add: additions purchased during the year 304,135 181,875 Less: disposals made during the year (31,789) (577,145) Less: disposals due to sale of business (3,417,497) - Closing gross carrying amount 2,654,408 5,799,559 Opening accumulated depreciation and impairment losses (5,405,395) (5,771,661) Add: disposals made during the year 31,789 577,145 Add: disposals due to sale of business 3,241,432 - Less: depreciation expense charged (104,639) (210,879) Closing accumulated depreciation and impairment losses (2,236,813) (5,405,395) Total net property, plant and equipment 417,595 394,164 Laboratory equipment, at cost 1,277,651 3,479,145 Less: accumulated depreciation (914,050) (2,743,213) Less: impairment loss - (426,950) Net laboratory equipment 363,601 308,982 Computer equipment, at cost 502,695 728,323 Less: accumulated depreciation (456,902) (668,002) Net computer equipment 45,793 60,321 Office equipment, at cost 167,564 229,104 Less: accumulated depreciation (160,539) (207,160) Net office equipment 7,025 21,944 Equipment under hire purchase, at cost 594,626 1,251,114 Less: accumulated depreciation (594,626) (1,251,114) Net equipment under hire purchase - - Leasehold improvements, at cost 111,873 111,873 Less: accumulated depreciation (110,697) (108,956) Net leasehold improvements 1,176 2,917 Total net property, plant and equipment 417,595 394,164 |
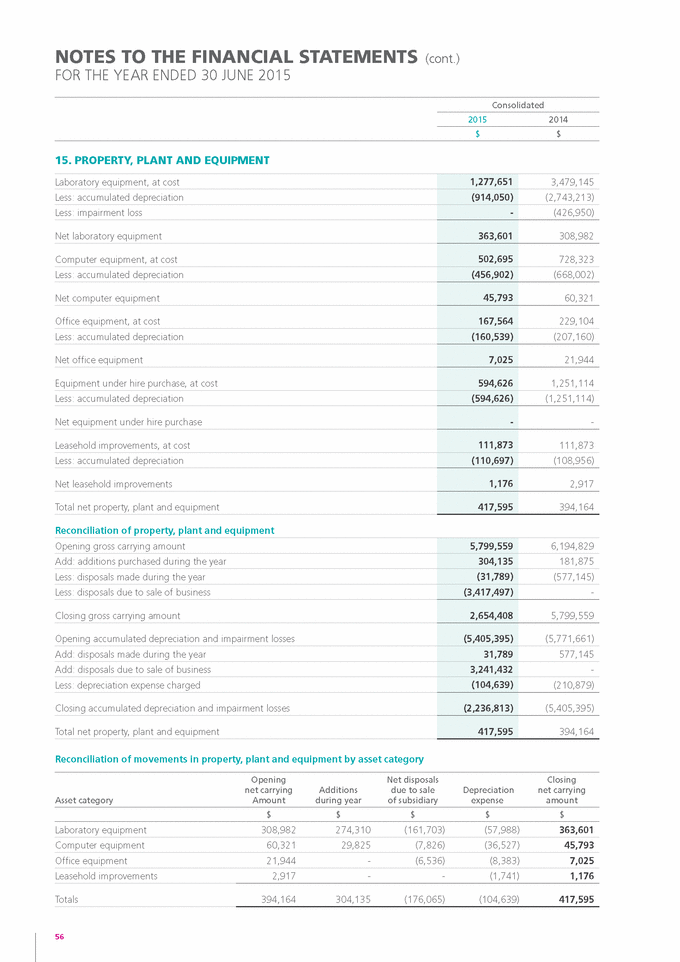
|
|
Consolidated 2015 2014 $ $ 16. INTANGIBLE ASSETS AND GOODwILL 57 GENETIC TECHNOLOGIES ANNUAL REPORT 2015 Patents Patents, at cost 36,662,592 36,662,592 Less: accumulated amortisation (32,914,177) (32,889,940) Less: impairment losses (3,632,338) (3,632,338) Total net patents 116,077 140,314 Other intangible assets Assets associated with BREVAGenTM breast cancer risk test, at cost 1,033,273 1,033,273 Less: accumulated amortisation (413,309) (309,982) Total net other intangible assets 619,964 723,291 Goodwill Goodwill, at cost - 358,012 Less: accumulated impairment - (42,624) Total net goodwill - 315,388 Total net intangible assets and goodwill 736,041 1,178,993 reconciliation of patents Opening gross carrying amount 36,662,592 36,594,310 Adjust for exchange rate movements - 68,282 Closing gross carrying amount 36,662,592 36,662,592 Opening accumulated amortisation and impairment losses (36,522,278) (36,429,758) Add: amortisation expense charged (refer below) (24,237) (24,238) Adjust for exchange rate movements - (68,282) Closing accumulated amortisation and impairment losses (36,546,515) (36,522,278) Total net patents 116,077 140,314 reconciliation of other intangible assets Opening net carrying amount 723,291 826,619 Less: amortisation expense charged (refer below) (103,327) (103,328) Total net other intangible assets 619,964 723,291 reconciliation of goodwill Opening gross carrying amount 358,012 358,012 Less: goodwill disposed on sale of business (358,012) - Closing gross carrying amount - 358,012 Opening accumulated impairment losses (42,624) (42,624) Add: goodwill disposed on sale of business 42,624 - Closing accumulated impairment losses - (42,624) Total net goodwill - 315,388 |
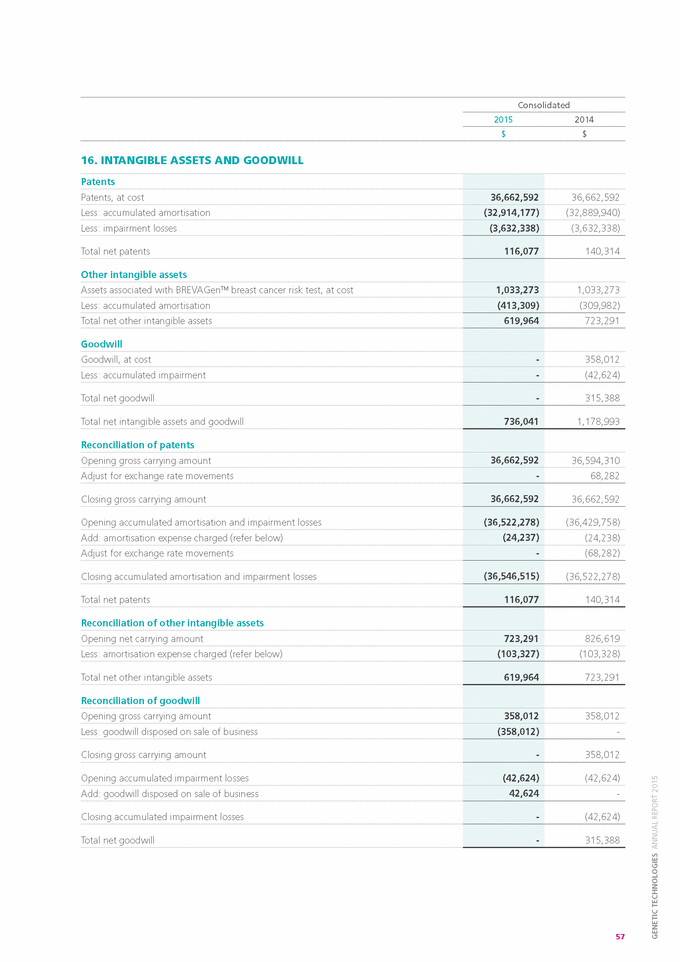
|
|
NOTES TO THE fINANCIAL STATEMENTS (cont.) FOR THE YEAR ENDED 30 JUNE 2015 16. INTANGIBLE ASSETS AND GOODwILL (cont.) remaining useful lives The assets associated with the BREVAGenTM breast cancer risk test have a remaining useful life of 6 years as at 30 June 2015. Disclosure of expenses The total amortisation expense charged during the year in respect of intangible assets of $127,564 is disclosed in the consolidated statement of comprehensive income under the headings of laboratory and research and development costs ($103,327) and licensing, patent and legal costs ($24,237). Consolidated 2015 2014 $ $ 17. TRADE AND OTHER PAyABLES (CURRENT) Note: trade payables and other payables for the Group include amounts due in uS dollars of uSD 232,733 (2014: uSD 331,481), European euros of Eur Nil (2014: Eur 75,752), Swiss francs of Chf 2,082 (2014: Chf 2,790), and New Zealand dollars of NZD Nil (2014: NZD 861). refer Note 34 for details of contractual maturity and management of interest rate, foreign exchange and liquidity risks applicable to trade and other payables for which, due to their short-term nature, their carrying value approximates their fair value. 18. DEfERRED REvENUE (CURRENT) 58 Genetic testing fees received in advance 77,282 153,226 Total current deferred revenue 77,282 153,226 Trade payables 517,079 900,275 Other payables 155,215 311,746 Accrued expenses 430,680 237,166 Total current trade and other payables 1,102,974 1,449,187 |
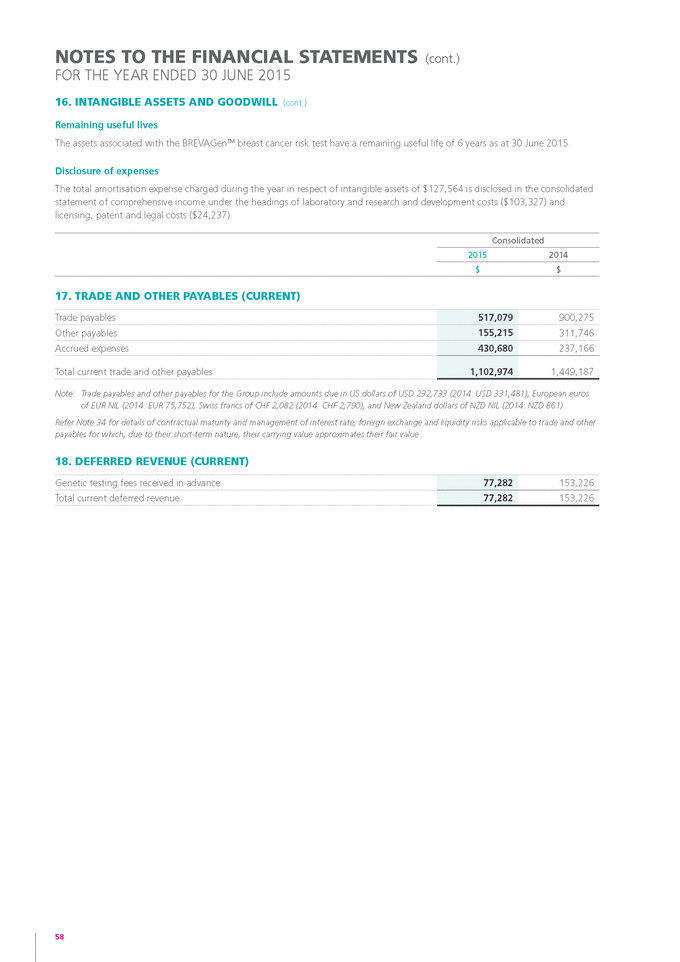
|
|
Consolidated 2015 2014 $ $ 19. PROvISIONS (CURRENT AND NON-CURRENT) Current provisions Note: the current provisions for annual leave and long service leave include a total amount of $381,683 (2014: $345,276) in respect of obligations which, based on historical evidence, the Company estimates will be settled more than 12 months from balance date. 20. fINANCIAL LIABILITIES AT fAIR vALUE THROUGH THE PROfIT OR LOSS (CURRENT AND NON-CURRENT) Debt convertible notes During the current year the Company finalised the raising of $2,150,000 via the issue of unlisted secured (debt) notes to existing and new Australian institutional and wholesale investors. The debt notes carried a 10.0% coupon rate, and as approved at the Annual General Meeting, held on 25 November 2014, became convertible notes which could convert into ordinary shares (at a 10.0% discount to the 5 day VWAP). These convertible notes also carry free attached options to purchase further shares in the Company. $2,125,000 of the convertible notes, together with the capitalised interest, has been converted into 150,961,041 ordinary shares in the Company. Subsequent to 30 June 2015, the balance of $25,000 convertible notes plus capitalised interest has been converted into 1,091,093 ordinary shares in the Company. redeemable convertible notes During the previous financial year the Company issued the redeemable convertible notes which had an initial face value of USD 5,000,000 to Ironridge BioPharma Co., a division of institutional investor Ironridge Global IV, Ltd. As at 30 June 2015 these redeemable notes had been fully converted. 59 GENETIC TECHNOLOGIES ANNUAL REPORT 2015 Debt convertible notes at fair value - current 25,000 - Redeemable convertible notes at fair value – non-current - 2,502,384 Total financial liabilities at fair value through profit or loss 25,000 2,502,384 Annual leave 200,957 370,327 Long service leave 328,950 345,276 Total current provisions 529,907 715,603 Non-current provisions Long service leave 25,321 81,280 Total non-current provisions 25,321 81,280 Total provisions 555,228 796,883 reconciliation of annual leave provision Balance at the beginning of the financial year 370,327 415,511 Add: obligation accrued during the year 380,804 388,935 Less: amount transferred on disposal of business (66,623) - Less: utilised during the year (483,551) (434,119) Balance at the end of the financial year 200,957 370,327 reconciliation of long service leave provision Balance at the beginning of the financial year 426,556 449,412 Add: obligation accrued during the year 42,949 58,415 Less: amount transferred due to sale of business (80,558) - Less: utilised during the year (34,676) (81,271) Balance at the end of the financial year 354,271 426,556 |
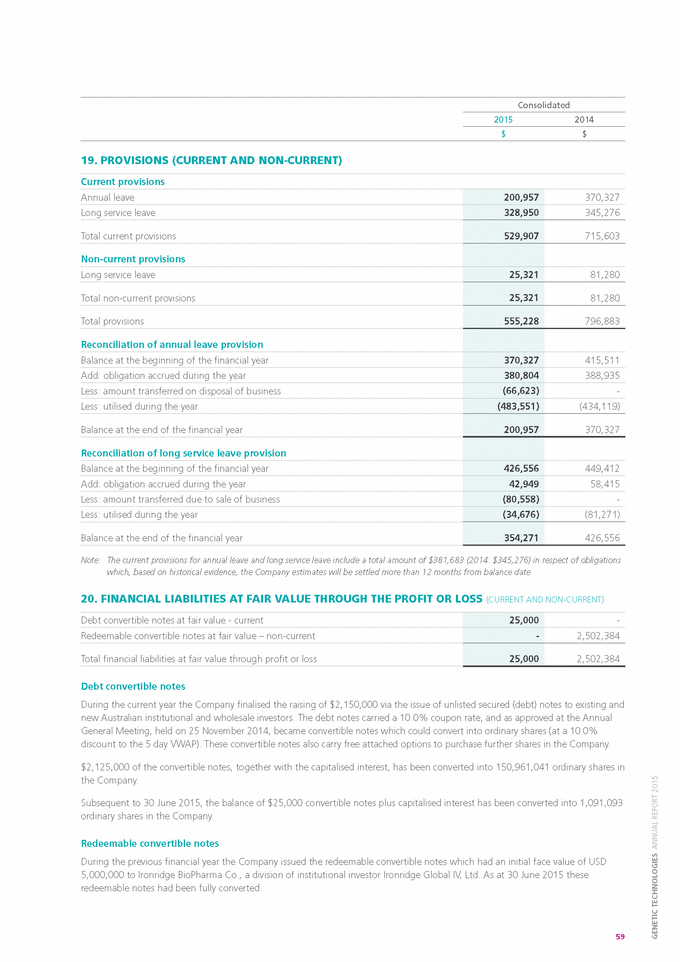
|
|
NOTES TO THE fINANCIAL STATEMENTS (cont.) FOR THE YEAR ENDED 30 JUNE 2015 21. fAIR vALUE MEASUREMENT Of fINANCIAL INSTRUMENTS (i) Fair value hierarchy This section explains the judgements and estimates made in determining the fair values of the financial instruments that are recognised and measured at fair value in the financial statements. To provide an indication about the reliability of the inputs used in determining fair value, the group has classified its financial instruments into the three levels prescribed under the Accounting Standards. An explanation of each level follows: (a) quoted prices (unadjusted) in active markets for identical assets or liabilities (level 1); (b) inputs other than prices included within level 1 that are observable for the asset or liability, either directly or indirectly (level 2); and (c) inputs for the asset or liability that are not based on observable market data (unobservable inputs) (level 3). The following tables presents the Group’s financial assets and financial liabilities measured and recognised at fair value as at 30 June 2015 and 2014. No level 1 or level 2 financial assets or liabilities were held by the Group as at 30 June 2015 and 2014. ImmunAid option financial asset Convertible note (financial liabilities) At 30 June 2014 $ $ Opening balance 1 July 2013 - - Additions 500,000 (5,627,462) Conversions to equity - 3,572,877 Exchange differences - 200,575 Fair value gain/(loss) recognised through profit and loss 295,533 (648,374) Closing balance 30 June 2014 795,533 (2,502,384) Additions - (2,150,000) Conversions to equity - 4,433,491 Exchange differences - (155,353) Fair value gain/(loss) recognised through profit and loss (795,533) 349,246 1 Closing balance 30 June 2015 - (25,000) 1. management has recognised a fair value of $Nil for the immunaid financial assets as at 30 June 2015 to reflect the expected recoverability of the investment. The Group’s policy is to recognise transfers into and transfers out of fair value hierarchy levels as at the end of the reporting period. There were no transfers between levels 1 and 2 for recurring fair value measurements during the year, as the Company did not have any fair value assets or liabilities at 30 June 2015. (ii) Valuation techniques used to derive level 2 and level 3 fair values The Group obtains independent valuations for its financial assets and financial liabilities at least annually. At the end of each reporting period, the directors update their assessment of the fair value of each asset and liability, taking into account the most recent independent valuations. The directors determine an assets or liabilities value range within a range of reasonable fair value estimates. The fair value of financial instruments that are not traded in an active market is determined using valuation techniques. These valuation techniques maximise the use of observable market data where it is available and rely as little as possible on entity specific estimates. If all significant inputs required to fair value an instrument are observable, the instrument is included in level 2. If one or more of the significant inputs is not based on observable market data, the instrument is included in level 3. 60 |
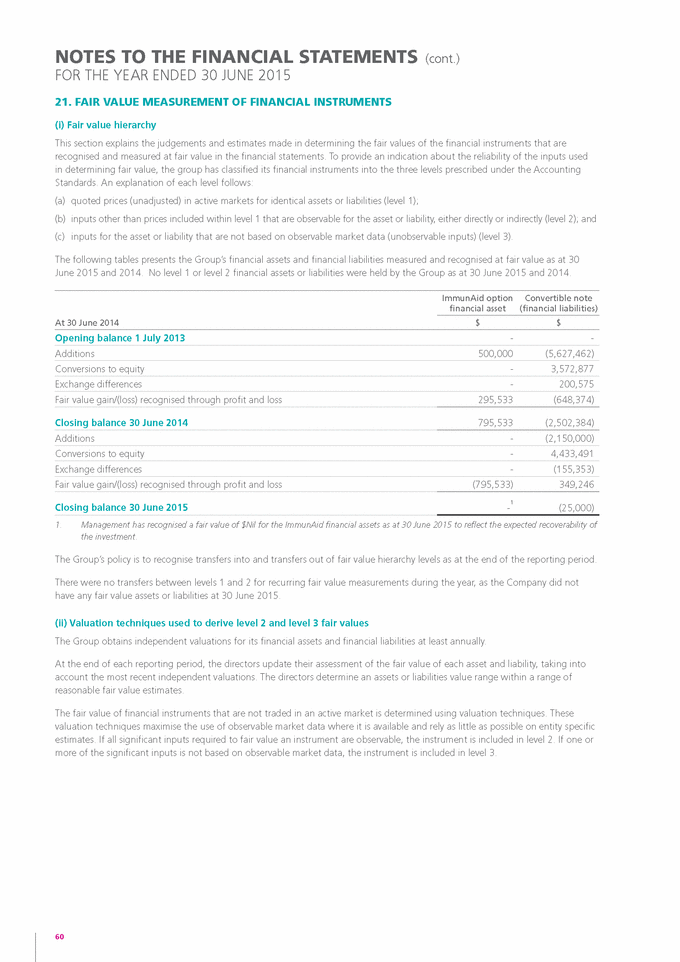
|
|
21. fAIR vALUE MEASUREMENT Of fINANCIAL INSTRUMENTS (cont.) (iii) Valuation processes Convertible note The value of the Convertible Note outstanding as at 30 June 2015 was calculated with reference to its face value, which approximates its fair value. Consolidated 2015 $ 2014 $ 22. CONTRIBUTED EQUITy movements in shares on issue Shares $ year ended 30 June 2014 Balance at the beginning of the financial year 475,471,819 83,735,845 Add: shares issued as part of private placements 97,222,302 7,000,000 Add: shares issued as part of the conversion of convertible notes 117,161,871 3,572,877 Less: shares cancelled as part of the swap deal (75,937,500) (3,569,702) Less: transaction costs arising on share issue - (658,528) Balance at the end of the financial year 613,918,492 90,080,492 Terms and conditions of contributed equity Ordinary shares have the right to receive dividends as declared and, in the event of winding up the Company, to participate in the proceeds from the sale of all surplus assets in proportion to the number of and amounts paid up on shares held. Ordinary shares, which have no par value, entitle their holder to one vote, either in person or by proxy, at a meeting of the Company. Capital management When managing capital, Management’s objective is to ensure that the Group continues as a going concern as well as to provide returns for shareholders and benefits for other stakeholders. Management also aims to maintain a capital structure to reduce the entity’s cost of capital. 61 GENETIC TECHNOLOGIES ANNUAL REPORT 2015 year ended 30 June 2015 Balance at the beginning of the financial year 613,918,49290,080,492 Add: shares issued as part of private placements 621,574,06221,445,427 Add: shares issued as part of the conversion of convertible notes 315,732,4114,507,109 Add: shares issued on exercise of options 122,966,6661,844,500 Less: transaction costs arising on share issue -(2,572,664) Add: shares issued in relation to a share-based payment (Note 28) 35,876,392-Add/ (less): transaction costs on placement of shares (Note 28) 4,123,608(57,736) Balance at the end of the financial year 1,714,191,631115,247,128 Issued and paid-up capital Fully paid ordinary shares 115,247,128 90,080,492 Total contributed equity 115,247,128 90,080,492 |
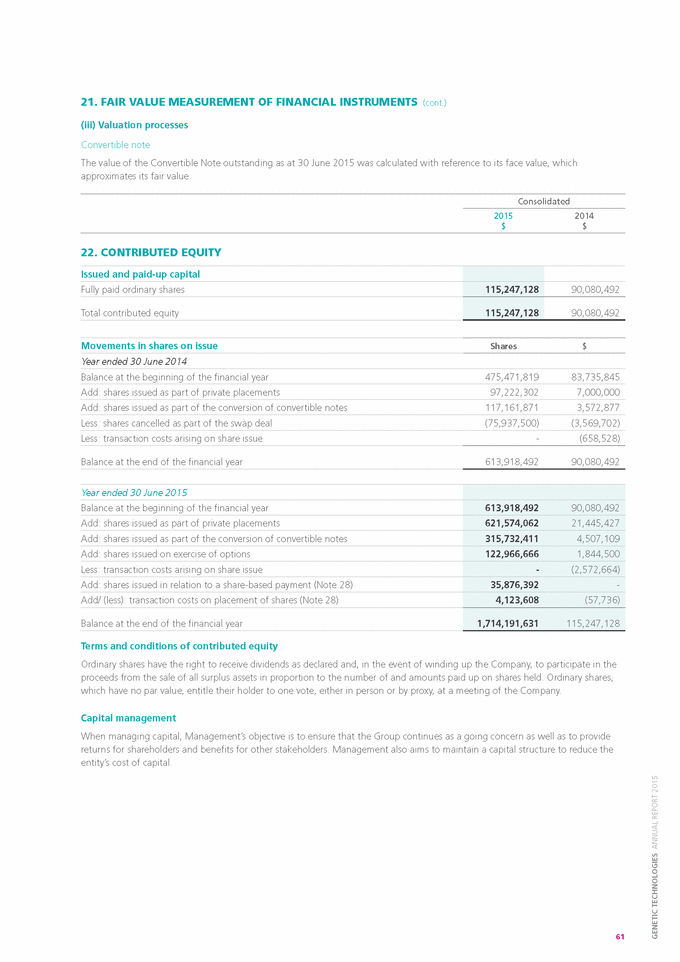
|
|
NOTES TO THE fINANCIAL STATEMENTS FOR THE YEAR ENDED 30 JUNE 2015 (cont.) Consolidated 2015 2014 $ $ 23. RESERvES Nature and purpose of reserves Foreign currency translation reserve This reserve is used to record exchange differences arising from the translation of the financial statements of foreign subsidiaries. Share-based payments reserve This reserve is used to record the value of share-based payments provided to employees and others providing similar services as part of their remuneration. 24. ACCUMULATED LOSSES 25. NON-CONTROLLING INTERESTS 62 reconciliation of non-controlling interests in subsidiaries Balance at the beginning of the financial year - 120,587 Add: movements during the year Less: share of operating losses - (9,272) Less: share of movement in reserves - 86 Net loss attributable to non-controlling interests - (9,186) Removal of non-controlling interests on de-consolidation - (111,401) Balance at the end of the financial year - - Balance at the beginning of the financial year (92,175,113) (82,049,916) Add: net loss attributable to owners of Genetic Technologies Limited (8,810,170) (10,125,197) Balance at the end of the financial year (100,985,283) (92,175,113) Foreign currency translation 112,332 (301,673) Share-based payments 4,585,071 4,223,813 Total reserves 4,697,403 3,922,140 reconciliation of foreign currency translation reserve Balance at the beginning of the financial year (301,673) (152,511) Add: net currency translation gain / (loss) 414,005 (149,162) Balance at the end of the financial year 112,332 (301,673) reconciliation of share-based payments reserve Balance at the beginning of the financial year 4,223,813 4,104,282 Add: share-based payments expense 303,522 119,531 Add: transaction costs on placement of shares 57,736 - Balance at the end of the financial year 4,585,071 4,223,813 |
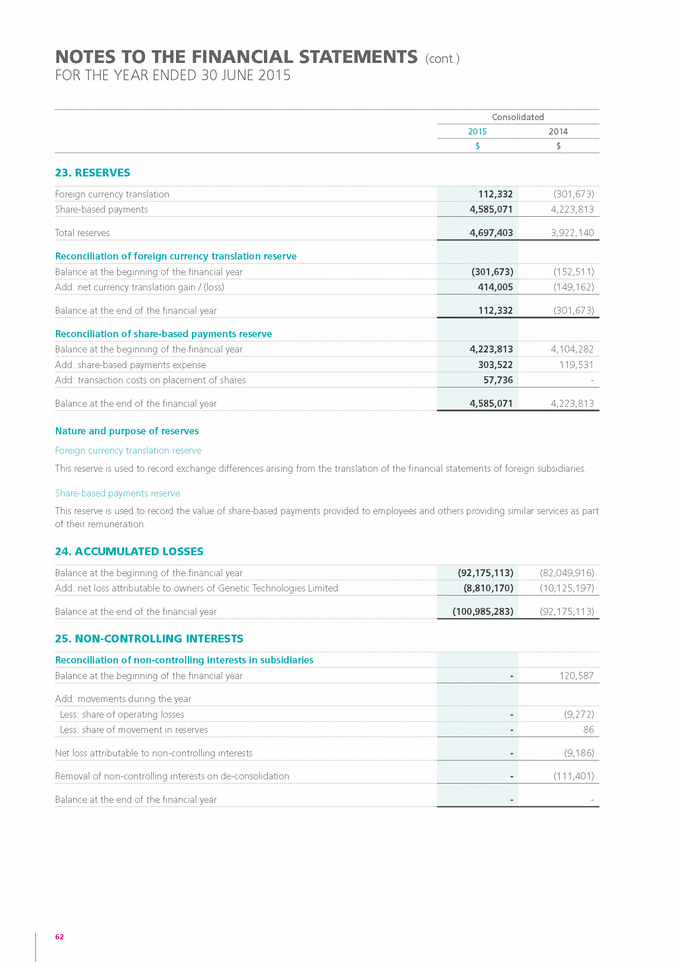
|
|
26. OPTIONS As at 30 June 2015, the following options over ordinary shares in the Company were outstanding. Weighted average exercise price Weighted average exercise price 2015 2014 On 30 November 2001, the Directors of the Company established a Staff Share Plan. On 19 November 2008, the shareholders of the Company approved the introduction of a new Employee Option Plan. Under the terms of the respective Plans, the Directors of the Company may grant options over ordinary shares in Genetic Technologies Limited to executives, consultants and employees of the Group. The options, which are granted at nil cost, are not transferable and are not quoted on ASX. As at 30 June 2015, there was 1 executive and 7 employees who held options that had been granted under the Plans. Options granted under the Plans carry no rights to dividends and no voting rights. The movements in the number of options granted under the Plans are as follows: Weighted average exercise price Weighted average exercise price 2015 2014 There were no options exercised under the Employee Option Plan during the year ended 30 June 2015 nor the year ended 30 June 2014. The numbers of options outstanding as at 30 June 2015 by ASX code, including the respective dates of expiry and exercise prices, are tabled below (refer Note 30 for further information). The options tabled below are not listed on ASX. Weighted average exercise price Weighted average exercise price Option description 2015 2014 The weighted average remaining contractual life of options outstanding as at 30 June 2015 was 3.20 years (2014: 2.75 years). 63 GENETIC TECHNOLOGIES ANNUAL REPORT 2015 Unlisted employee options GTGAK (expiring 20 February 2017) --750,000$0.120 GTGAM (expiring 31 July 2016) 1,000,000$0.200 1,000,000$0.200 GTGAO (expiring 29 August 2017) 250,000$0.140 2,650,000$0.140 GTGAQ (expiring 1 December 2017) --250,000$0.100 GTGAS (expiring 25 January 2018) --500,000$0.100 GTGAW (expiring 31 March 2016) 1,250,000$0.190 1,875,000$0.190 GTGAY (expiring 11 July 2018) 250,000$0.110 750,000$0.110 GTGAA (expiring 31 May 2019) 1,125,000$0.040 --3,875,000$0.140 7,775,000$0.151 Unlisted options attached to convertible notes GTGAC (expiring 2 December 2018) 20,366,667$0.015 --Balance at the end of the financial year 24,241,667$0.035 7,775,000$0.151 Exercisable at the end of the financial year 23,033,334$0.034 4,175,000$0.167 Unlisted employee options Balance at the beginning of the financial year 7,775,000$0.151 9,525,000$0.147 Add: options granted during the year 6,875,000$0.040 1,250,000$0.110 Less: options exercised during the year ---- Less: options forfeited during the year (10,775,000)$0.084 (3,000,000)$0.121 Less: options expired during the year ---- Balance at the end of the financial year 3,875,000$0.140 7,775,000$0.151 Unlisted employee options (refer below) 3,875,000$0.140 7,775,000$0.151 Unlisted options attached to convertible notes 20,366,667$0.015 --24,241,667$0.035 7,775,000$0.151 |
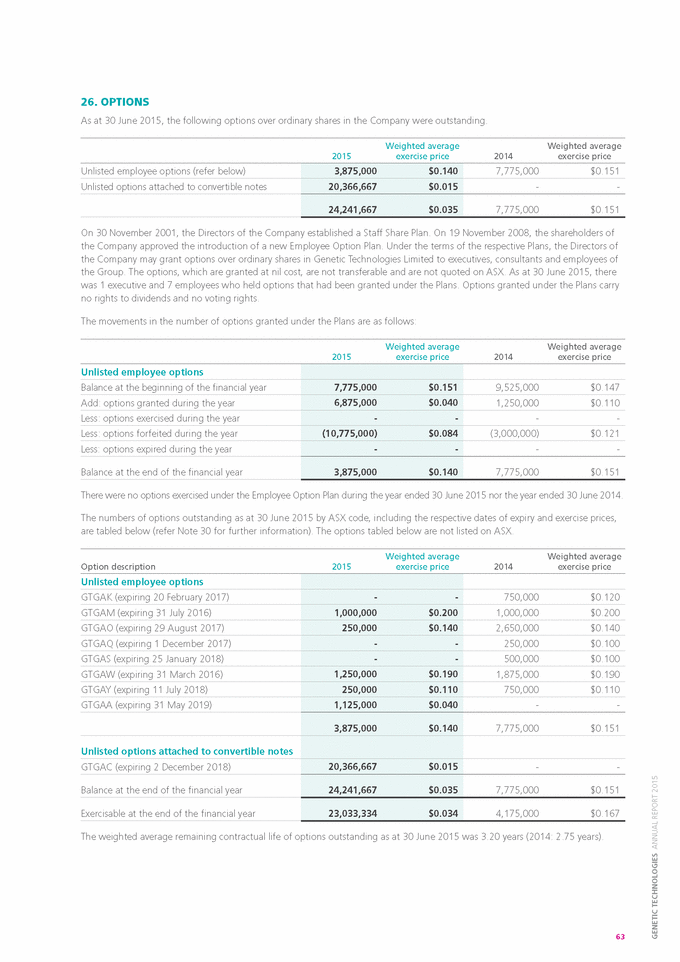
|
|
NOTES TO THE fINANCIAL STATEMENTS (cont.) FOR THE YEAR ENDED 30 JUNE 2015 27. SEGMENT INfORMATION Identification of reportable segments In line with the changes to the business activities for the Group during the past year, there is now just the one operating and reportable segment. Previously the Group’s activities were split into three reportable segments based on the nature of the business at that time. The sole operating segment as reported is consistent with the internal reporting provided to the chief operating decision maker, being the newly appointed Chief Executive Officer, and is aligned to the one major revenue stream. The Group’s one operating segment is summarised as follows: Business segments Revenues and income Sales Other Totals Profit / (loss) Segment $ $ $ $ Operations 2015 2014 2,011,918 4,564,280 2,794,506 2,696,265 4,806,424 7,260,545 (8,810,170) (10,134,469) Amortisation / depreciation Purchases of equipment Assets Liabilities Segment $ $ $ $ Operations 2015 2014 20,719,732 6,729,199 (1,760,484) (4,901,680) (232,203) (338,445) 304,135 181,875 Geographic information » » » Australia – is the home country of the parent entity and the location of the Company’s genetic testing and licensing operations. USA – is the home of Phenogen Sciences Inc. and GeneType Corporation. Switzerland – is the home of GeneType AG. Geographic information Revenues and income Sales Other Totals Profit/(Loss) $ $ $ $ Australia 2015 2014 910,740 2,867,665 2,794,358 2,273,473 3,705,098 5,141,138 (1,519,192) (6,470,068) USA 2015 2014 1,101,178 1,696,615 148 422,157 1,101,326 2,118,772 (7,276,878) (3,974,981) Other 2015 2014 - - - 635 - 635 (14,100) 310,580 Totals 2015 2014 2,011,918 4,564,280 2,794,506 2,696,265 4,806,424 7,260,545 (8,810,170) (10,134,469) Amortisation /depreciation Purchases of Equipment Assets Liabilities $ $ $ $ Australia 2015 2014 3,139,778 5,939,694 (1,532,911) 9,336,251 (219,784) (320,476) 304,135 162,934 USA 2015 2014 17,576,978 784,829 (224,917) (14,091,395) (12,419) (17,969) - 18,941 Other 2015 2014 2,976 4,676 (2,656) (146,536) - - - - Totals 2015 2014 20,719,732 6,729,199 (1,760,484) (4,901,680) (232,203) (338,445) 304,135 181,875 64 |
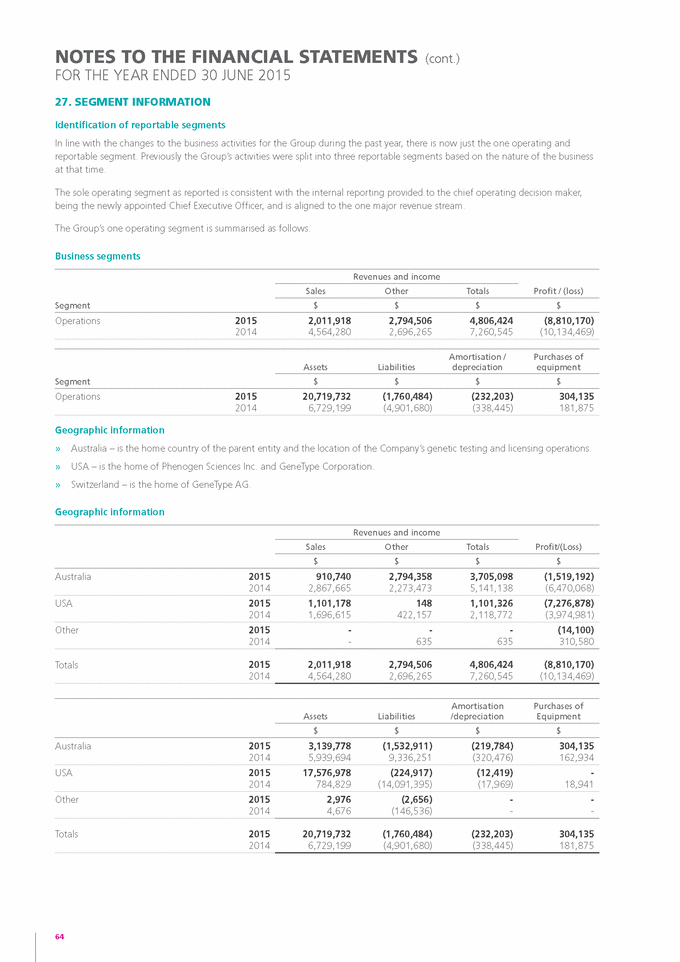
|
|
27. SEGMENT INfORMATION (cont.) Additional segment disclosures » » » » Other revenues and income includes interest received of $39,951 (2014: $116,047). Expenses includes employee benefits expenses of $5,470,007 (2014: $6,247,731). Assets - includes cash of $18,341,357 (2014: $2,831,085). Liabilities includes trade and other payables of $1,102,974 (2014: $1,449,187) and provisions of $555,228 (2014: $796,883). Included in the above figures are the following intersegment balances and transactions: Consolidated 2015 2014 $ $ Segment products and locations The principal geographic segment is Australia, with the Company’s headquarters being located in Melbourne in the State of Victoria however the key sales activities take place in the USA. major customers During the prior year the Group had a number of major customers to which it provides both products and services. During the year ended 30 June 2014, there was one Australian customer from whom the Group generated revenues representing more than 10% ($ 535,716) of the total consolidated revenue from operations. During the year ended 30 June 2015, there were no such customers. 28. SHARE BASED PAyMENTS (a) Employee option plan On 30 November 2001, the Directors of the Company established a Staff Share Plan. On 19 November 2008, the shareholders of the Company approved the introduction of a new Employee Option Plan. Under the terms of the respective Plans, the Directors may, at their discretion, grant options over the ordinary shares in the Genetic Technologies Limited to executives, consultants, employees, and former Non-Executive Directors, of the Group. On 31 July 2014 6,875,000 options over ordinary shares (expiring 31 May 2019) were granted, at no cost, to a number of employees of the Company’s US subsidiary, Phenogen Sciences Inc. Each option entitles the holders to acquire one ordinary share at a cost of between $0.040, settled in cash. The above options granted during the 2015 financial year vest in three equal tranches after 12 months, 24 months and 36 months from the date of grant, respectively. As at 30 June 2015, there was 1 executive and 7 employees who held options that had been granted under the Plans. The fair value of each option granted under the Employee Option Plan is estimated by an external valuer using a Black-Scholes option-pricing model with the following assumptions used for grants made during the years ended 30 June 2015 and 2014: 2015 2014 The expected price volatility is based on the historic volatility (based on the remaining life of the options), adjusted for any expected changes to future volatility due to publicly available information. 65 GENETIC TECHNOLOGIES ANNUAL REPORT 2015 Dividend yield - - Historic volatility and expected volatility 80% 80% Option exercise price $0.040 $0.105 Weighted average exercise price $0.040 $0.105 Risk-free interest rate 2.81% 3.13% Expected life of an option 3.83 years 3.82 years Loan payable (USA) and loan receivable (Australia) 16,948,601 346,315 Foreign exchange gain (USA) and foreign exchange loss (Australia) 3,823,791 422,157 Cost of sales (USA) and sales (Australia) 153,581 154,555 |
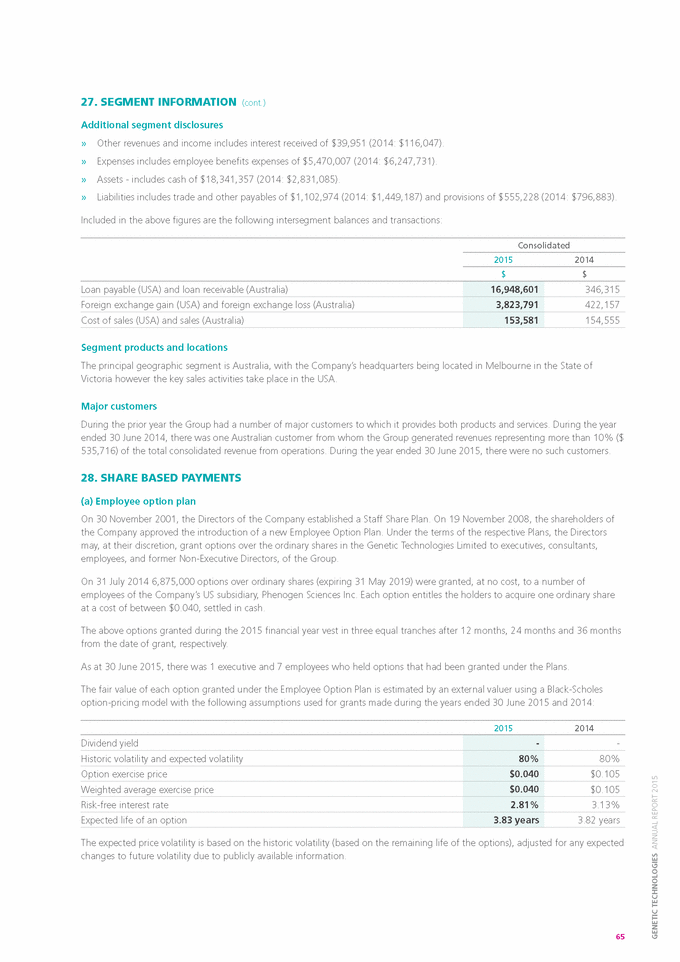
|
|
NOTES TO THE fINANCIAL STATEMENTS (cont.) FOR THE YEAR ENDED 30 JUNE 2015 28. SHARE BASED PAyMENTS (cont.) (b) Other share based payments During the year the Company entered into a Standby Equity Placement Facility Agreement with the Kentgrove Capital Growth Fund (“Kentgrove Capital”), an investment fund managed by Kentgrove Capital Pty Ltd, a Melbourne-based investment and advisory firm. Key terms of the Standby Equity Placement Facility » » » » Standby equity placement facility of up to A$24,000,000 with a maturity date 21 January, 2017. Multiple placements permitted. For each placement, shares are issued at a 5% discount to a volume weighted average price (VWAP) over the period of the placement. A facility fee of 2.33% of the facility amount is payable, to be satisfied by the issue of shares. The facility fee, less 20%, will be rebated at termination or at maturity, pro rata for any amount of the facility that is unutilised. The commencement fee rebate may be paid by cash or shares. » A total of 40,000,000 shares has been issued to Kentgrove Capital on commencement date of the facility agreement in January 2015. As at 30 June 2015, 10.31% of the facility has been utilised. Hence, 10.31% of 40,000,000 shares which amounted to $57,736 is accounted for as transaction costs for the placements made by Kentgrove Capital. The remaining 89.69% of the 40,000,000 shares is accounted for as shares issued in relation to a share-based payment. This represents an option for Kentgrove Capital to acquire shares that the Company has granted to Kentgrove Capital. The option value has been determined through the use of a Black-Scholes option pricing model and the fair value of consideration paid and expensed for the 2015 year is $330,059. (c) Expenses arising from share-based payment transactions Total expenses arising from share-based payment transactions recognised during the period as part of employee benefit expense were as follows: Consolidated 2015 2014 $ $ 29. COMMITMENTS AND CONTINGENCIES As at 30 June 2015, the above operating leases related to the following premises that are currently occupied by the Group both of which are being renegotiated since balance date: Date of expiry of lease Minimum payments ($) Location Landlord Use 60-66 Hanover Street Fitzroy, Victoria 3065 Australia Crude Pty. Ltd. Office / laboratory 31 August 2015 61,173 9115 Harris Corners Parkway, Suite 320 Charlotte, North Carolina 28269 USA New Boston Harris Corners LLC Office 31 October 2015 14,353 Total 75,526 Apart from the above, there were no other commitments or contingencies as at 30 June 2015. 66 Operating lease expenditure commitments Minimum operating lease payments - not later than one year 75,526 373,379 - later than one year but not later than five years - 60,585 - later than five years - - Total minimum operating lease payments 75,526 433,964 Options issued under employee option plan (26,536) 119,531 Shares issued as consideration for standby equity placement facility 330,059 - Total 303,523 119,531 |
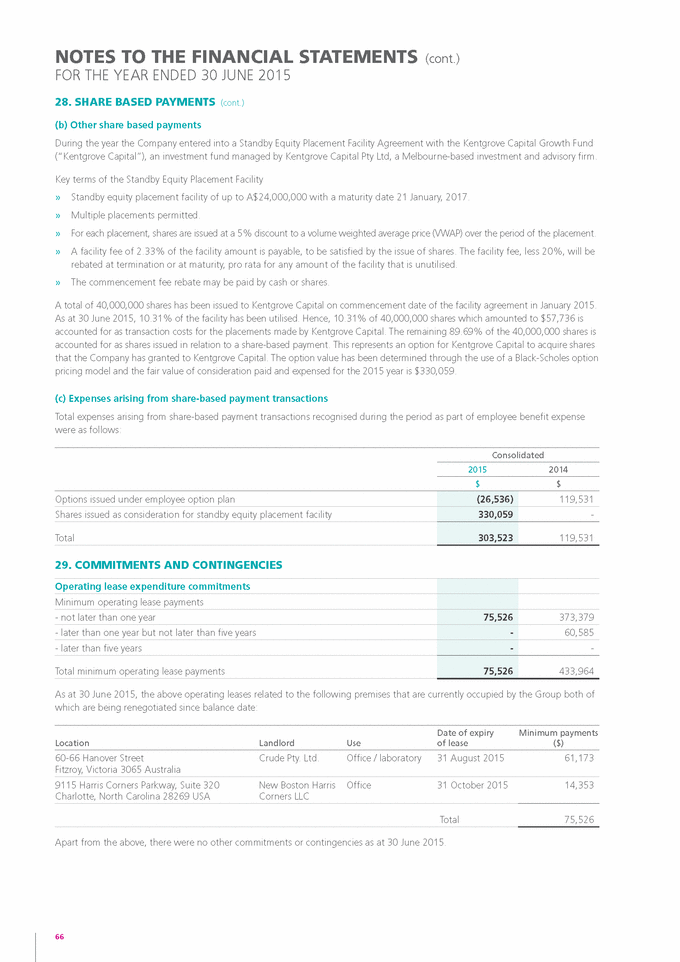
|
|
Consolidated 2015 2014 $ $ 30. AUDITORS’ REMUNERATION 31. RELATED PARTy DISCLOSURES Ultimate parent Genetic Technologies Limited is the ultimate Australian parent company. As at the date of this Report, no shareholder controls more than 50% of the issued capital of the Company. Transactions within the Group and with other related parties During the year ended 30 June 2015, the only transactions between entities within the Group and other related parties occurred, are as listed below. Except where noted, all amounts were charged on commercial, arm’s-length terms and at commercial rates. Phenogen Sciences Inc. During the year ended 30 June 2015, Phenogen Sciences Inc, a subsidiary, purchased testing services from Genetic Technologies Corporation Pty. Ltd., another subsidiary at a cost of $153,581 (2014: $154,555). Debt convertible notes As described in Note 20, during the current year the Company finalised the raising of $2,150,000 via the issue of unlisted secured (debt) notes to existing and new Australian institutional and wholesale investors. The debt notes carried a 10.0% coupon rate, and as approved at the Annual General Meeting, held on 25 November 2014, became convertible notes which could convert into ordinary shares (at a 10.0% discount to the 5 day VWAP). These convertible notes also carry free attached options to purchase further shares in the Company. $50,000 of these convertible notes were issued to a holder associated with Mr David Carter, a Company director at the time of issue, on the same terms and conditions as arm’s length holders. All of these convertible notes were converted during the year. The 3,333,333 share options attached to these convertible notes were exercised during the year. $125,000 of these convertible notes were issued to a holder associated with Dr Lindsay Wakefield, a Company director at the time of issue, on the same terms and conditions as arm’s length holders. All of these convertible notes were converted during the year. The 8,333,333 share options attached to these convertible notes remain unexercised at the end of the year. There were no transactions with parties related to Key Management Personnel during the year other than that disclosed above. ImmunAid financial asset Refer Note 14. 67 GENETIC TECHNOLOGIES ANNUAL REPORT 2015 Audit and assurance services PricewaterhouseCoopers in respect of: Audit and review of the Company’s Financial Report under the Corporations act 2001 328,860 280,500 Other assurance services 229,500 60,000 Other audit firms in respect of: Audit of the Financial Reports of subsidiaries 2,539 3,864 Total remuneration in respect of audit services 560,899 344,364 Non-audit services Other audit firms in respect of: Tax advice and compliance, accounting and other services 147,554 21,470 Total auditors’ remuneration 708,453 365,834 |
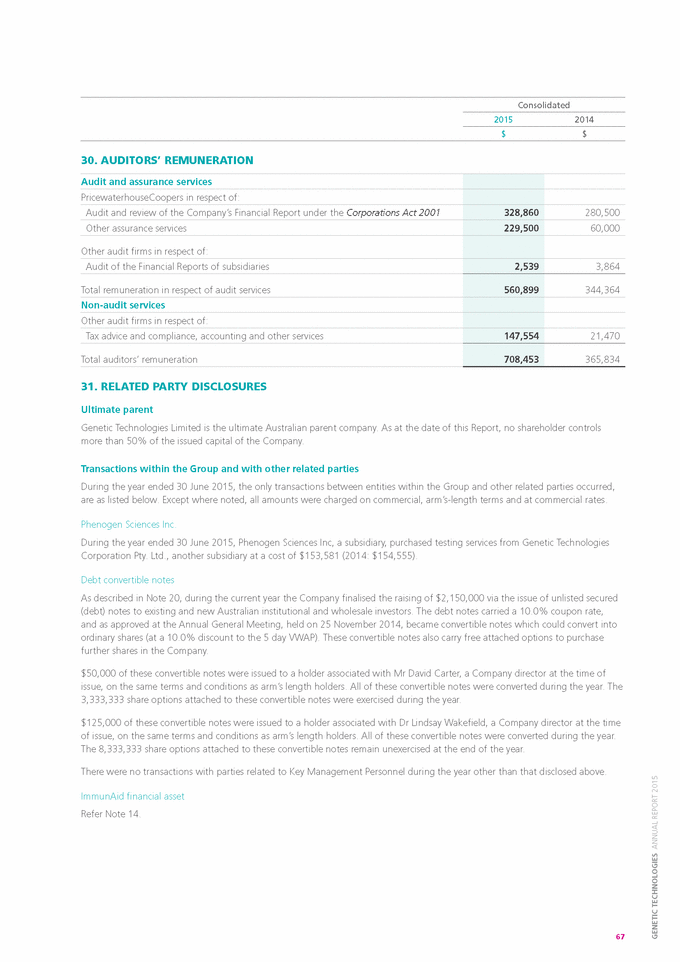
|
|
NOTES TO THE fINANCIAL STATEMENTS (cont.) FOR THE YEAR ENDED 30 JUNE 2015 31. RELATED PARTy DISCLOSURES (cont.) Details of Directors and Key management Personnel as at balance date Directors Executives Dr Malcolm R. Brandon (Non-Executive Chairman) Mr Brian Manuel (Chief financial Officer) Mr Eutillio Buccilli (Executive Director & Chief Executive Officer) Ms Diana Newport (Quality and Business Operations Director) Mr Grahame Leonard AM (Non-Executive) Dr Richard Allman (Scientific Director) Dr Lindsay Wakefield (Non-Executive) Ms Luisa Ashdown (Director, Global licensing and ip) Dr Paul Kasian (Non-Executive) Consolidated 2015 2014 $ $ 32. SUBSIDIARIES The following diagram is a depiction of the Group structure as at 30 June 2015. Genetic Technologies Limited GeneType Corporation rareCellect Pty. Ltd. GeneType Pty. Ltd. Genetic Technologies Corporation Pty. Ltd. Phenogen Sciences Inc. GeneType AG 100% 100% 100% 100% 100% 100% Group interest (%) Net carrying value ($) Incorporation details 2015 2014 2015 2014 68 Entities held directly by parent GeneType Pty. Ltd.5 September 1990 (Dormant) Victoria, Australia 100% 100% - - Genetic Technologies Corporation Pty. Ltd. 11 October 1996 (Genetic testing)N.S.W., Australia 100% 100% 2 2 RareCellect Pty. Ltd. 7 March 2001 (Dormant)N.S.W., Australia 100% 100% 10 10 GeneType AG 13 February 1989 (Dormant)Zug, Switzerland 100% 100% 1,350 1,350 GeneType Corporation18 December 1989 (Dormant) California, U.S.A. 100% 100% - - Phenogen Sciences Inc. 28 June 2010 (BREVAGenTM )Delaware, U.S.A. 100% 100% 11,006 11,006 Total carrying value 12,368 12,368 remuneration of Key management Personnel Short-term employee benefits 1,457,725 1,414,247 Post-employment benefits 118,660 121,727 Share-based payments (25,959) 69,266 Other long-term benefits (8,854) 35,651 Total remuneration of Key Management Personnel 1,541,572 1,640,891 |
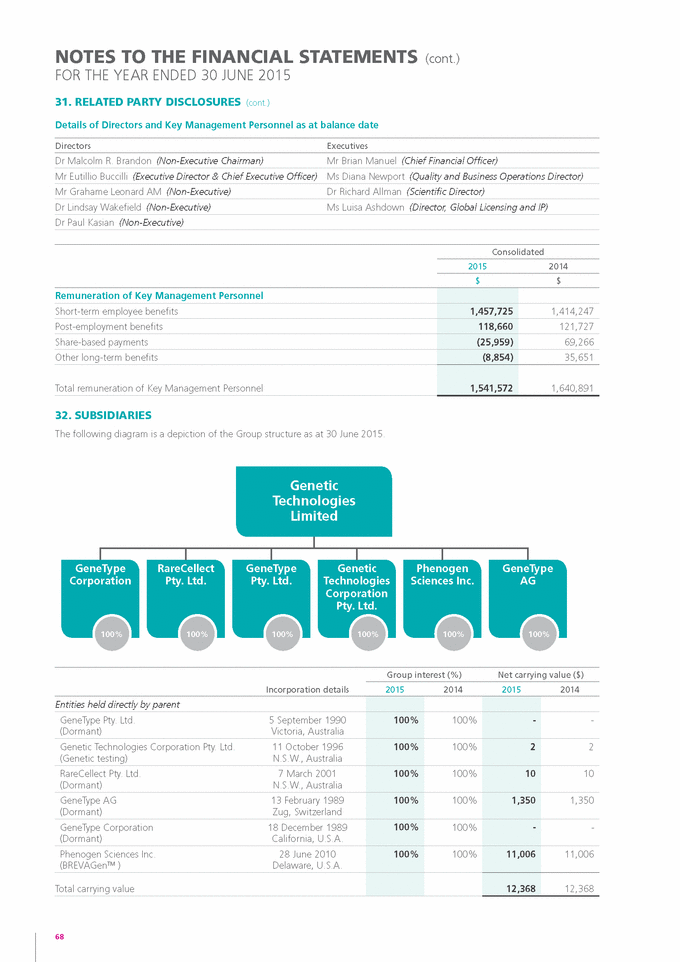
|
|
33. PARENT ENTITy fINANCIAL INfORMATION Summary financial information The individual financial statements for the parent entity, Genetic Technologies Limited, disclose the aggregate amounts set out in the following table. 2015 2014 $ $ related party information As at 30 June 2015, an amount of $70,460,572 (2014: $45,808,549) was receivable by the Company from its various subsidiaries and associates. As at the same date, an amount of $12,670,195 (2014: $12,510,981) was payable by the Company to its wholly-owned subsidiaries. All such loans are unsecured, generally interest free and there are no fixed terms of repayment. Financial risk management In assessing the recoverability of intercompany receivables, Genetic Technologies Limited, the parent entity, raises a provision for diminution to ensure that the carrying amount of these receivables does not exceed the net tangible assets of the subsidiaries. The balance of the provision as at 30 June 2015 was $44,235,233 (2014:$44,260,582). Contingent liabilities and commitments of the parent entity As at the date of this Report, the parent entity had no contingent liabilities or other commitments. 69 GENETIC TECHNOLOGIES ANNUAL REPORT 2015 Balance sheet Current assets 1,609,280 2,930,079 Total assets 28,623,265 6,233,906 Current liabilities 1,384,627 1,452,778 Total liabilities 14,080,143 16,547,422 Equity Contributed equity 115,247,127 90,080,492 Reserves (share-based payments) 2,770,395 2,409,136 Accumulated losses (103,474,400) (102,803,144) Total equity 14,543,122 (10,313,516) Total comprehensive loss (671,257) (11,529,090) |
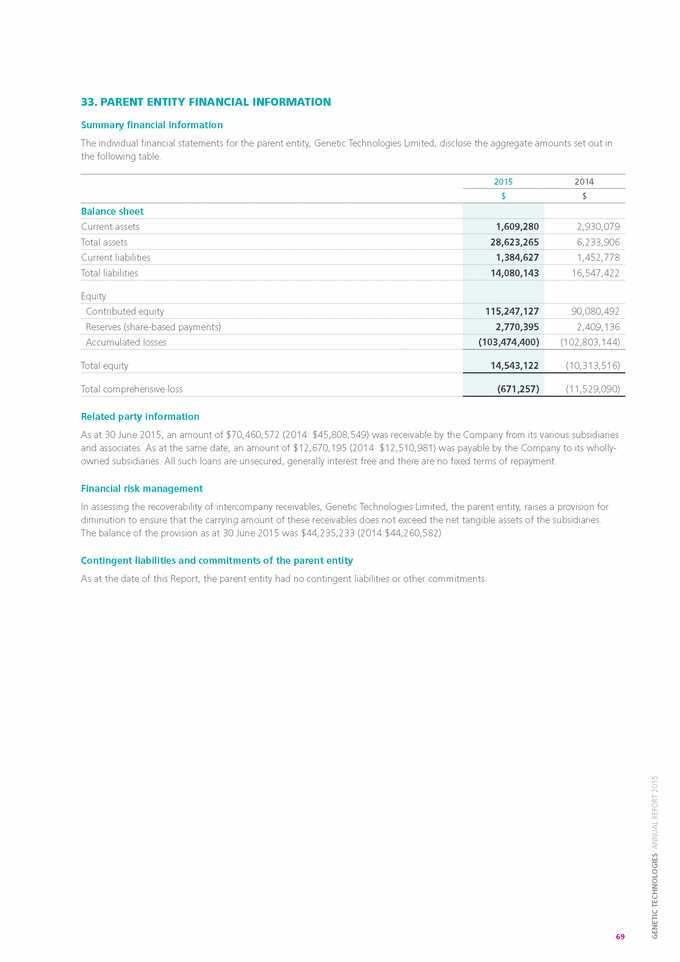
|
|
NOTES TO THE fINANCIAL STATEMENTS (cont.) FOR THE YEAR ENDED 30 JUNE 2015 34. fINANCIAL RISK MANAGEMENT The Group’s activities expose it to a variety of financial risks such as credit risk, market risk (including foreign currency risk and interest rate risk) and liquidity risk. The Group’s overall risk management program focuses on the unpredictability of financial markets and seeks to minimise potential adverse effects on the financial performance of the Group. The Group uses different methods to measure the different types of risk to which it is exposed. These methods include sensitivity analysis in the case of foreign exchange, interest rate and aging analysis for credit risk. Risk management is managed by the Executive under guidance provided by the Board of Directors via its Audit Committee, which provides guidance for overall risk management, as well as policies covering specific areas, such as credit risk, foreign exchange risk and interest rate risk. The Committee identifies and evaluates financial risks in close cooperation with the Group’s executive management. The Group’s principal financial instruments comprise cash and cash equivalents. The Group also has other financial assets and liabilities, such as trade receivables and payables, which arise directly from its operations. The Group does not typically enter into derivative transactions, such as interest rate swaps or forward currency contracts. It is, and has been throughout the period under review, the Group’s policy that no trading in financial instruments shall be undertaken. The main risks arising from the Group’s financial instruments are credit risk exposures, foreign currency risk, interest rate risk and liquidity risk. The policies for managing each of these risks are summarised below. Details of the significant accounting policies and methods adopted, including the criteria for recognition, the basis of measurement and the basis on which income and expenses are recognised, in respect of each class of financial asset, financial liability and equity instrument are disclosed in Note 2. The Group holds the following financial instruments: Consolidated 2015 2014 $ $ 70 Financial assets Cash at bank / on hand 18,341,357 2,831,085 Trade and other receivables 714,951 1,111,565 Performance bond and deposits 3,590 2,949 Financial assets at fair value through profit or loss - 795,533 Total financial assets 19,059,898 4,741,132 Financial liabilities Trade and other payables 1,102,974 1,449,187 Financial liabilities at fair value through profit or loss 25,000 2,502,384 Total financial liabilities 1,127,974 3,951,571 |
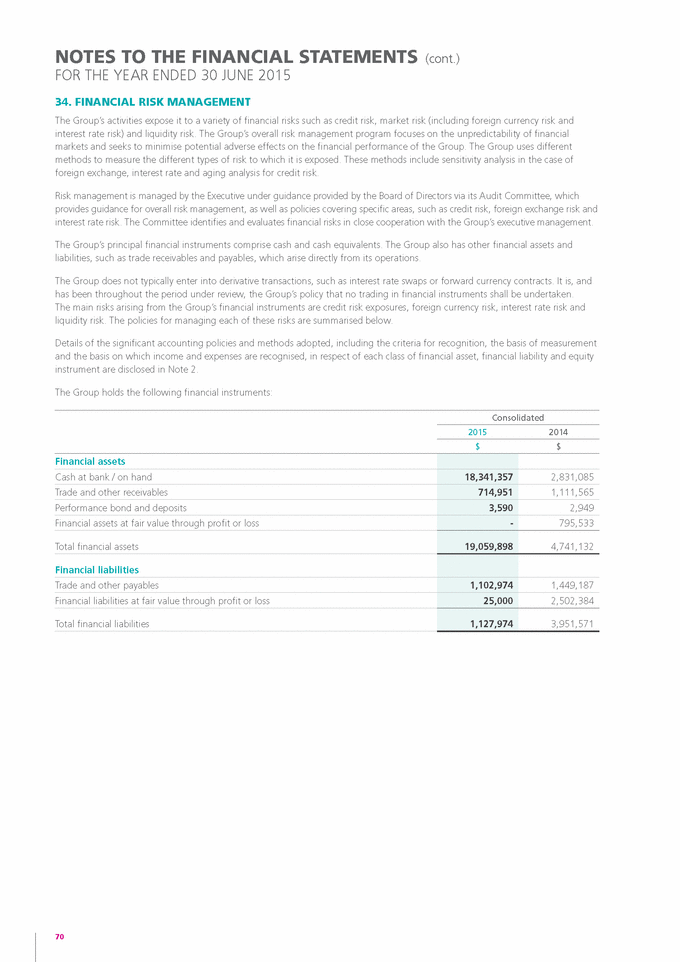
|
|
34. fINANCIAL RISK MANAGEMENT (cont.) Credit risk The Group’s credit risk is managed on a Group basis. Credit risk arises from cash and cash equivalents and deposits with banks and financial institutions, as well as credit exposures to customers, including outstanding receivables and committed transactions. If there is no independent rating, the Group assesses the credit quality of the customer, taking into account its financial position, past experience and other factors. Individual risk limits are set based on internal or external ratings. The compliance with credit limits by customers is regularly monitored by Management. Sales to retail customers are required to be settled in cash or using major credit cards, thereby mitigating credit risk. The maximum exposures to credit risk as at 30 June 2015 in relation to each class of recognised financial assets is the carrying amount of those assets, as indicated in the balance sheet. Financial assets included on the balance sheet that potentially subject the Group to concentration of credit risk consist principally of cash and cash equivalents and trade receivables. In accordance with the guidelines of the Group’s Short Term Investment Policy, the Group minimises this concentration of risk by placing its cash and cash equivalents with financial institutions that maintain superior credit ratings in order to limit the degree of credit exposure. For banks and financial institutions, only independently-rated parties with a minimum rating of “A-1” are accepted. The Group has also established guidelines relative to credit ratings, diversification and maturities that seek to maintain safety and liquidity. The Group does not require collateral to provide credit to its customers, however, the majority of the Group’s customers to whom credit is provided are large, reputable organisations and, as such, the risk of credit exposure is limited. The Group has not entered into any transactions that qualify as a financial derivative instrument. In addition, receivable balances are monitored on an ongoing basis with the result that the Group’s exposure to bad debts is not significant. As at 30 June 2015, the balance of the Group’s provision for doubtful debts was $nil (2014: $108,925), out of a total net receivables balance as at that date of $714,951 (2014: $1,111,565) (refer Note 12). Credit risk further arises in relation to financial guarantees given by the Group to certain parties in respect of obligations of its subsidiaries. Such guarantees are only provided in exceptional circumstances. An analysis of the aging of trade and other receivables and trade and other payables is provided below: Consolidated 2015 2014 $ $ Note: Given the nature of the trade receivables for the remaining business all amounts are considered to be current. 71 GENETIC TECHNOLOGIES ANNUAL REPORT 2015 Net trade and other receivables Current (less than 30 days) 714,951 862,292 31 days to 60 days - 89,028 61 days to 90 days (note) - 70,404 Greater than 90 days (note) - 89,841 Total net trade and other receivables (Note 12) 714,951 1,111,565 |
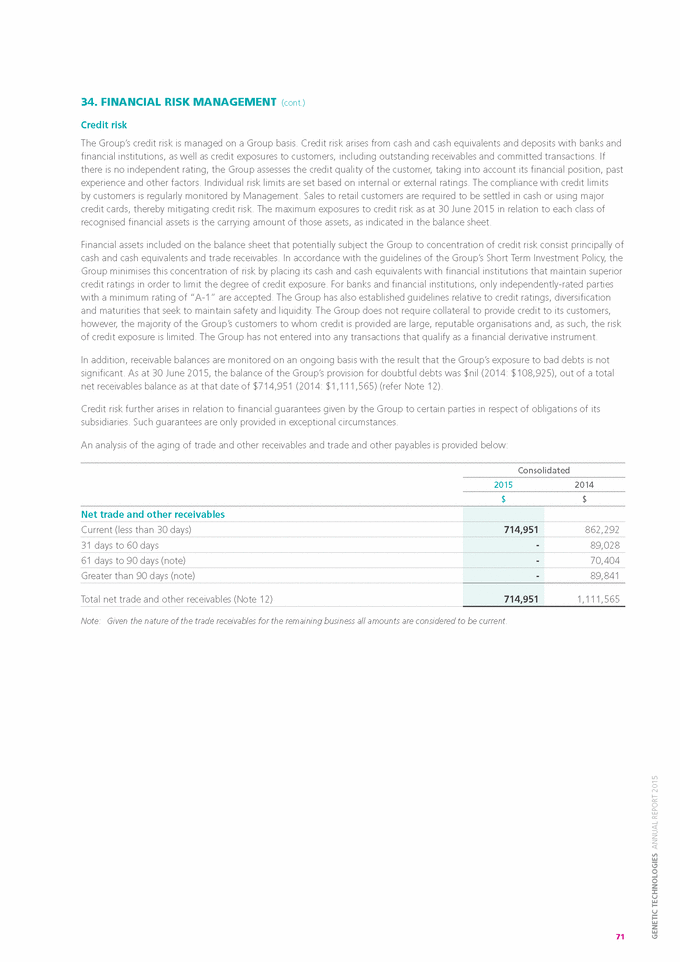
|
|
NOTES TO THE fINANCIAL STATEMENTS (cont.) FOR THE YEAR ENDED 30 JUNE 2015 34. fINANCIAL RISK MANAGEMENT (cont.) market risk Foreign currency risk The Group operates internationally and is exposed to foreign currency exchange risk, primarily with respect to the US dollar, through financial assets and liabilities. It is the Group’s policy not to hedge these transactions as the exposure is considered to be minimal from a consolidated operations perspective. Further, as the Group incurs expenses which are payable in US dollars, the financial assets that are held in US dollars provide a natural hedge for the Group. Foreign exchange risk arises from planned future commercial transactions and recognised assets and liabilities denominated in a currency that is not the entity’s functional currency and net investments in foreign operations. The risk is measured using sensitivity analysis and cash flow forecasting. The Group has a Foreign Exchange Management Policy which was developed to establish a formal framework and procedures for the efficient management of the financial risks that impact on Genetic Technologies Limited through its activities outside of Australia, predominantly in the United States. The policy governs the way in which the financial assets and liabilities of the Group that are denominated in foreign currencies are managed and any risks associated with that management are identified and addressed. Under the policy, which is updated on a regular basis as circumstances dictate, the Group generally retains in foreign currency only sufficient funds to meet the expected expenditures in that currency. Surplus funds are converted into Australian dollars as and when deemed appropriate by the Board in consultation with the CFO. As at 30 June 2015, the Group held the following financial assets and liabilities that were denominated in foreign currencies: Consolidated Year USD CAD EUR NZD CHF Financial assets Cash at bank / on hand 2015 2014 28,231 335,026 - 85 100,535 44 - 86 - - Trade and other receivables 2015 2014 - 90,313 - - - 90,000 - - - - Total financial assets 2015 2014 28,231 425,339 - 85 100,535 90,044 - 86 - - Financial liabilities Trade and other payables 2015 2014 108,380 331,481 - - - 75,752 - 861 2,082 2,790 Borrowings 2015 2014 - 2,362,000 - - - - - - - - Total financial liabilities 2015 2014 108,380 2,693,481 - - - 75,752 - 861 2,082 2,790 Note: USD – united States dollars CAD – Canadian dollars EUR – European euros NZD – New Zealand dollars CHF – Swiss francs During the year ended 30 June 2015, the Australian dollar / US dollar exchange rate weakened by 18.9%, from 0.9439 at the beginning of the year to 0.7655 at the end of the year. Based on the financial instruments held at 30 June 2015, had the Australian dollar weakened/ strengthened by 10% against the US dollar with all other variables held constant, the Group’s loss for the year would have been $10,000 lower/ $12,000 higher (2014: loss $218,000 lower / loss $267,000 higher), mainly as a result of changes in the values of cash and cash equivalents which are denominated in US dollars, as detailed in the above tables. 72 |
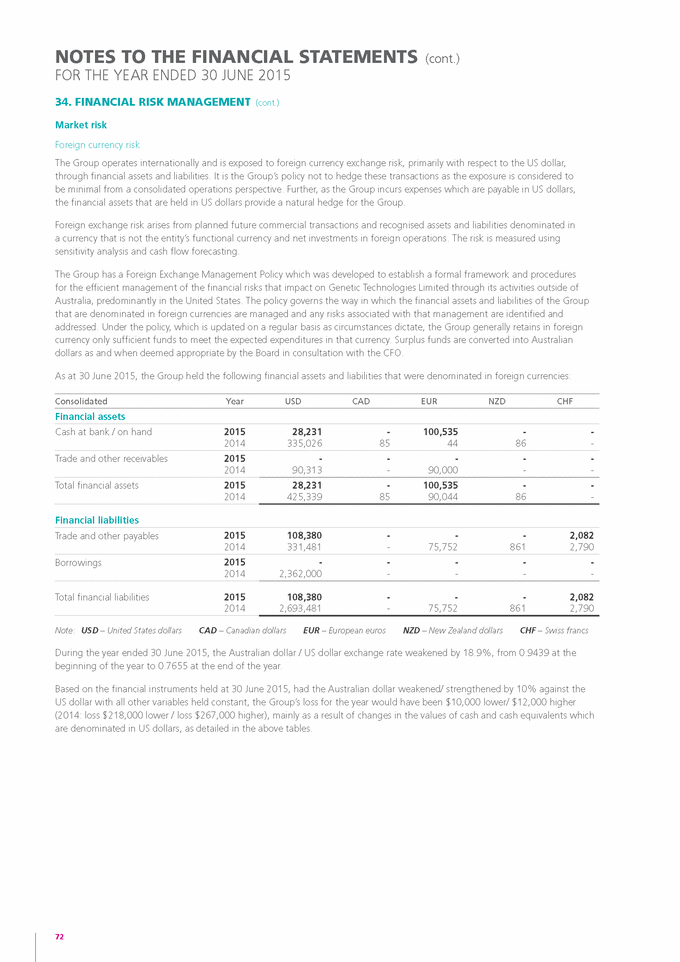
|
|
34. fINANCIAL RISK MANAGEMENT (cont.) market risk (cont.) Interest rate risk The Group’s main interest rate risk arises in relation to its short-term deposits with various financial institutions. If rates were to decrease, the Group may generate less interest revenue from such deposits. However, given the relatively short duration of such deposits, the associate risk is relatively minimal. The Group also has various hire purchase liabilities with fixed interest rates. While these rates do not vary once the contract has been executed, the Group may be subject to interest rate movements if it were to acquire additional assets via similar contracts in the future. The Group has a Short Term Investment Policy which was developed to manage the Group’s surplus cash and cash equivalents. In this context, the Group adopts a prudent approach that is tailored to cash forecasts rather than seeking high returns that may compromise access to funds as and when they are required. Under the policy, the Group deposits its surplus cash in a range of deposits / securities over different time frames and with different institutions in order to diversify its portfolio and minimise risk. On a monthly basis, Management provides the Board with a detailed list of all cash and cash equivalents, showing the periods over which the cash has been deposited, the name and credit rating of the institution holding the deposit and the interest rate at which the funds have been deposited. A comparison of interest rate movements from month to month and a variance to an 11am deposit rate is also provided. At 30 June 2015, if interest rates had changed by +/-50 basis points from the year-end rates, with all other variables held constant, the Group’s loss for the year would have been $5,000 lower / higher (2014: loss $12,000 lower / higher), as a result of higher / lower interest income from cash and cash equivalents. Consolidated equity for the Group would have been $5,000 higher / lower (2014: $12,000 higher / lower) mainly as a result of an increase / decrease in the fair value of cash and cash equivalents. The exposure to interest rate risks and the effective interest rates of financial assets and liabilities, both recognised and unrealised, for the Group is as follows: Weighted average effective rate Average maturity period Floating rate Fixed rate Carrying amount Consolidated Year $ $ $ % days Financial assets Cash at bank / on hand 2015 2014 1,108,297 2,831,085 - - 1,108,297 2,831,085 2.25% 2.35% At call At call Performance bond / deposits 2015 2014 - - 3,950 2,949 3,950 2,949 - - At call At call Financial assets at fair value through profit or loss 2015 2014 - - - 795,533 - 795,533 - - At call At call Totals 2015 2014 1,108,297 2,831,085 3,950 798,482 1,112,247 3,629,567 Financial liabilities Financial liabilities at fair value through profit or loss 2015 2014 - - 25,000 2,502,384 25,000 2,502,384 10.00% 7.50% At call At call Totals 2015 2014 - - 25,000 2,502,384 25,000 2,502,384 Note: the Company holds the balance of its cash in non-interest bearing bank accounts. 73 GENETIC TECHNOLOGIES ANNUAL REPORT 2015 |
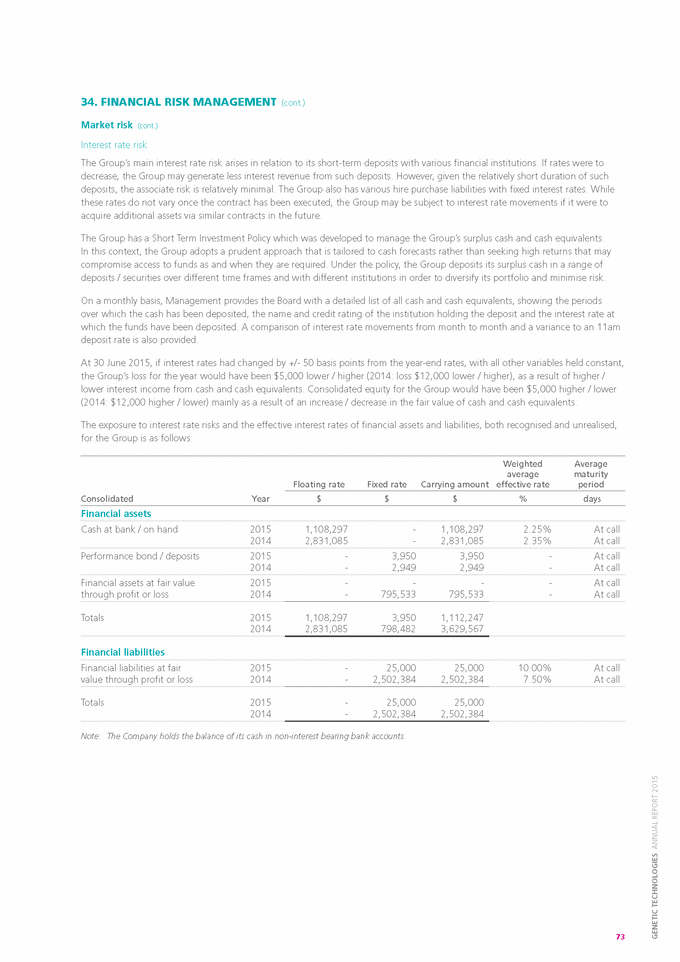
|
|
NOTES TO THE fINANCIAL STATEMENTS (cont.) FOR THE YEAR ENDED 30 JUNE 2015 34. fINANCIAL RISK MANAGEMENT (cont.) Liquidity risk Prudent liquidity risk management implies maintaining sufficient cash and cash equivalents and the availability of funding through an adequate amount of committed credit facilities, such as its hire purchase and credit card facilities. The Group manages liquidity risk by continuously monitoring forecast and actual cash flows and, wherever possible, matching the maturity profiles of financial assets and liabilities. Due to the dynamic nature of the underlying businesses, Management aims to maintain flexibility in funding by keeping committed credit lines available. Surplus funds are generally only invested in instruments that are tradeable in highly liquid markets. A balanced view of cash inflows and outflows affecting the Group is summarised in the table below: < 6 months 6 to 12 months 1 to 5 years > 5 years Totals Consolidated Year $ $ $ $ $ Financial assets Cash at bank / on hand 2015 2014 18,341,357 2,831,085 - - - - - - 18,341,357 2,831,085 2015 2014 714,951 1,111,565 - - - - - - 714,951 1,111,565 Trade and other receivables Performance bond and deposits 2015 2014 3,590 2,949 - - - - - - 3,590 2,949 Total financial assets 2015 2014 19,059,898 3,945,599 - - - - - - 19,059,898 3,945,599 Financial liabilities Trade and other payables 2015 2014 1,102,974 1,449,187 - - - - - - 1,102,974 1,449,187 2015 2014 1,102,974 1,449,187 - - - - - - 1,102,974 1,449,187 Total financial liabilities Net maturity 2015 2014 17,956,924 2,496,412 - - - - - - 17,956,924 2,496,412 The Group had access to the following undrawn borrowing facility as at 30 June 2015: Facility limit Amount used Amount available Nature of facility $ $ $ Credit card facility 306,750 (25,708) 281,042 35. SUBSEQUENT EvENTS Except for the conversion of $25,000 of convertible notes plus capitalised interest as disclosed above, there have been no significant events which have occurred after balance date. 74 |
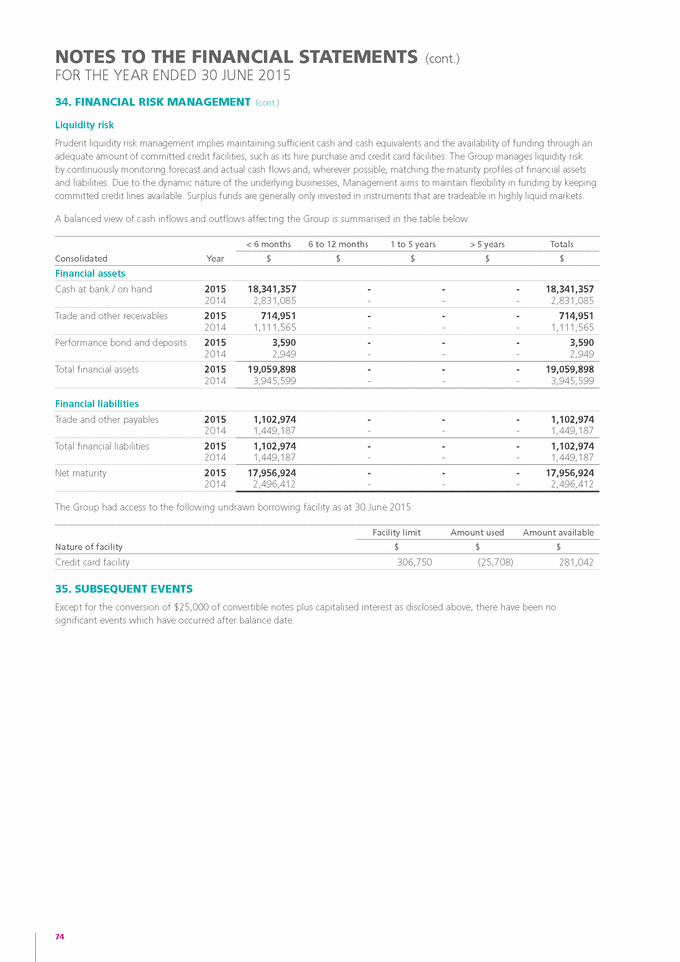
|
|
DIRECTORS’ DECLARATION In the opinion of the Directors: (a) the Financial Statements and accompanying notes set out on pages 37 to 74 are in accordance with the Corporations act 2001, including: (i) complying with Accounting Standards, the Corporations Regulations 2001 and other mandatory professional reporting requirements; and (ii) giving a true and fair view of the consolidated entity’s financial position as at 30 June 2015 and of its performance for the financial year ended on that date; and (b) there are reasonable grounds to believe that the Company will be able to pay its debts as and when they become due and payable; and Note 2 confirms that the financial statements also comply with International Financial Reporting Standards as issued by the International Accounting Standards Board. The Directors have been given the declarations by the Chief Executive Officer and Chief Financial Officer, as required by section 295A of the Corporations act 2001. This Declaration is made in accordance with a resolution of the Directors. mr. GrAHAmE LEONArD Non-Executive Director Melbourne, 24 September 2015 75 GENETIC TECHNOLOGIES ANNUAL REPORT 2015 |
|
|
AUDITOR’S REPORT 76 Independent auditor’s report to the members of Genetic Technologies Limited Report on the financial report We have audited the accompanying financial report of Genetic Technologies Limited (the company), which comprises the consolidated balance sheet as at 30 June 2015, the consolidated statement of comprehensive income, consolidated statement of changes in equity and consolidated statement of cash flows for the year ended on that date, a summary of significant accounting policies, other explanatory notes and the directors’ declaration for Genetic Technologies Limited (the consolidated entity). The consolidated entity comprises the company and the entities it controlled at year’s end or from time to time during the financial year. Directors’ responsibility for the financial report The directors of the company are responsible for the preparation of the financial report that gives a true and fair view in accordance with Australian Accounting Standards, the Corporations Act 2001 and for such internal control as the directors determine is necessary to enable the preparation of the financial report that is free from material misstatement, whether due to fraud or error. In Note 2, the directors also state, in accordance with Accounting Standard AASB 101 Presentation of Financial Statements, that the financial statements comply with International Financial Reporting Standards as issued by the International Accounting Standards Board. Auditor’s responsibility Our responsibility is to express an opinion on the financial report based on our audit. We conducted our audit in accordance with Australian Auditing Standards. Those standards require that we comply with relevant ethical requirements relating to audit engagements and plan and perform the audit to obtain reasonable assurance whether the financial report is free from material misstatement. An audit involves performing procedures to obtain audit evidence about the amounts and disclosures in the financial report. The procedures selected depend on the auditor’s judgement, including the assessment of the risks of material misstatement of the financial report, whether due to fraud or error. In making those risk assessments, the auditor considers internal control relevant to the consolidated entity’s preparation and fair presentation of the financial report in order to design audit procedures that are appropriate in the circumstances, but not for the purpose of expressing an opinion on the effectiveness of the entity’s internal control. An audit also includes evaluating the appropriateness of accounting policies used and the reasonableness of accounting estimates made by the directors, as well as evaluating the overall presentation of the financial report. We believe that the audit evidence we have obtained is sufficient and appropriate to provide a basis for our audit opinion. Independence In conducting our audit, we have complied with the independence requirements of the Corporations Act 2001. PricewaterhouseCoopers, ABN 52 780 433 757 Freshwater Place, 2 Southbank Boulevard, SOUTHBANK VIC 3006, GPO Box 1331, MELBOURNE VIC 3001 T: 61 3 8603 1000, F: 61 3 8603 1999, www.pwc.com.au Liability limited by a scheme approved under Professional Standards Legislation. |
|
|
77 GENETIC TECHNOLOGIES ANNUAL REPORT 2015 Auditor’s opinion In our opinion: (a) the financial report of Genetic Technologies Limited is in accordance with the Corporations Act 2001, including: (i) giving a true and fair view of the consolidated entity's financial position as at 30 June 2015 and of its performance for the year ended on that date; and (ii) complying with Australian Accounting Standards (including the Australian Accounting Interpretations), the Corporations Regulations 2001. (b) the financial report and notes also comply with International Financial Reporting Standards as disclosed in Note 2. Report on the Remuneration Report We have audited the remuneration report included in pages 26 to 33 of the directors’ report for the year ended 30 June 2015. The directors of the company are responsible for the preparation and presentation of the remuneration report in accordance with section 300A of the Corporations Act 2001. Our responsibility is to express an opinion on the remuneration report, based on our audit conducted in accordance with Australian Auditing Standards. Auditor’s opinion In our opinion, the remuneration report of Genetic Technologies Limited for the year ended 30 June 2015 complies with section 300A of the Corporations Act 2001. PricewaterhouseCoopers Sam Lobley Melbourne Partner 24 September 2015 |
|
|
AUDITOR’S INDEPENDENCE DECLARATION 78 Auditor’s Independence Declaration As lead auditor for the audit of Genetic Technologies Limited for the year ended 30 June 2015, I declare that to the best of my knowledge and belief, there have been: a) no contraventions of the auditor independence requirements of the Corporations Act 2001 in relation to the audit; and b) no contraventions of any applicable code of professional conduct in relation to the audit. This declaration is in respect of Genetic Technologies Limited and the entities it controlled during the period. Sam Lobley Melbourne Partner 24 September 2015 PricewaterhouseCoopers PricewaterhouseCoopers, ABN 52 780 433 757 Freshwater Place, 2 Southbank Boulevard, SOUTHBANK VIC 3006, GPO Box 1331, MELBOURNE VIC 3001 T: 61 3 8603 1000, F: 61 3 8603 1999, www.pwc.com.au Liability limited by a scheme approved under Professional Standards Legislation. |
|
|
ASX ADDITIONAL INfORMATION Additional information required by the Listing Rules of the Australian Securities Exchange (ASX) and not disclosed elsewhere in this Annual Report. The information provided is current as at 31 August 2015. HOME EXCHANGE The Company’s ordinary shares are quoted on the Australian Securities Exchange. The home exchange is Perth, Western Australia. The ASX code for the Company’s ordinary shares is GTG. The Company also has a listing of Level II American Depositary Receipts (ADRs) on the National Association of Securities Dealers Automated Quotation (NASDAQ) Capital Market in the U.S.A. Each ADR comprises 150 fully paid ordinary shares and trade under the ticker symbol GENE. DISTRIBUTION Of EQUITy SECURITIES The number of shareholders as at 31 August 2015, ranked by size of holding, in each class of shares are as follows: Range of shares Number of holders Number of shares 1 - 1,000 289 168,966 1,001 - 5,000 730 2,195,927 5,001 - 10,000 455 3,772,848 10,001 - 100,000 1,221 47,516,515 100,001 - 9,999,999,999 467 1,661,628,468 Rounding Total 3,162 1,715,282,724 The number of shareholders holding less than a “marketable parcel” of shares (being 23,810 shares) is 1,954. The total number of shares held by these shareholders on 31 August was 14,132,983. TwENTy LARGEST SHAREHOLDERS The names of the twenty largest registered shareholders of the Company’s ordinary shares as at 31 August 2015 are: Rank Name Number of shares Percentage held 1. NATIONAL NOMINEES LIMITED 1,311,469,295 76.46 2. MERVYN JACOBSON APS 18,562,500 1.08 3. SECURITY & EQUITY RESOURCES LIMITED 15,923,506 0.93 4. MR ROGER LETTS DAWKINS + MR WAYNE COX <IMMUNOGENETICS R FDN WA A/C> 13,016,667 0.76 5. INNES PTY LIMITED <INNES P/L EMPLOYEES S/F A/C> 11,890,000 0.69 6. KENTGROVE CAPITAL PTY LTD <KENTGROVE CAPITAL GROWTH A/C> 10,000,000 0.58 7. HSBC CUSTODY NOMINEES (AUSTRALIA) LIMITED 9,968,943 0.58 8. MS GAIL JEAN BRATZ 9,000,000 0.52 9. J P MORGAN NOMINEES AUSTRALIA LIMITED 8,116,654 0.47 10. MR JIMMY THOMAS + MS IVY RUTH PONNIAH <THOMAS SUPER FUND A/C> 8,000,000 0.47 11. MR WARWICK WRIGHT 8,000,000 0.47 12. WAKKO ENTERPRISES PTY LTD <L&S WAKEFIELD S/F A/C> 7,809,664 0.46 13. WAKKO INVESTMENTS PTY LTD 6,945,099 0.4 14. MR FRANK WENG THONG CHEW 6,300,000 0.37 15. MERVYN JACOBSON APS 5,714,934 0.33 16. CITICORP NOMINEES PTY LIMITED 5,276,494 0.31 17. IRWIN BIOTECH NOMINEES PTY LTD <BIOA A/C> 5,000,000 0.29 18. MJGD NOMINEES PTY LTD <BSMI A/C> 4,849,129 0.28 19. MR JERRY HUI KANG GAO 4,800,000 0.28 20. SAMBOR NOMINEES PTY LTD <SUSANNE & MONIAK SAMBOR A/C> 4,600,000 0.27 Totals 1,475,242,885 86.00 79 GENETIC TECHNOLOGIES ANNUAL REPORT 2015 |
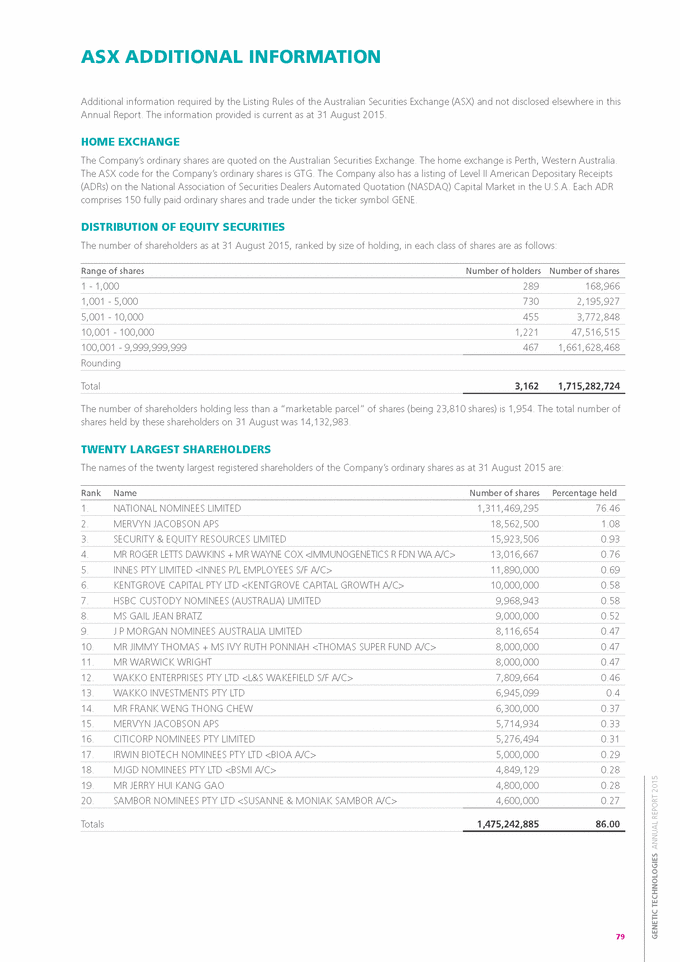
|
|
ASX ADDITIONAL INfORMATION (cont.) RESTRICTED SECURITIES As at 31 August 2015 there were no ordinary shares that were subject to escrow arrangements with the Company. VOTING rIGHTS Article 17 of the Company’s Constitution stipulates the voting rights of Members as follows: “Subject to any rights or restrictions for the time being attached to any class or classes of shares and to this Constitution: (a) On the show of hands every person present in the capacity of a Member or proxy, attorney or representative (or in more than one of these capacities) has one vote; and (b) On a poll every person present who is a Member or proxy, attorney or representative has: (i) (ii) For each fully paid share that the person holds or represents; one vote; and For each share other than a fully paid share that the person holds or represents: that portion of one vote that the amount paid (not credited) on the shares bears to the total amount paid and payable on the share (excluding amounts credited).” 80 |

|
|
CORPORATE INfORMATION DIRECTORS Dr. Malcolm R. Brandon (Non-Executive Chairman) BANKER (AUSTRALIA) National Australia Bank Limited Level 2, 151 Rathdowne Street Carlton Vic. 3053 Australia Mr. Eutillio Buccilli (Executive Director & Chief Executive Officer) BANKER (USA) Bank of America, N.A. 155 Town Centre Drive Mooresville NC 28117 USA Dr. Paul A. Kasian (Non-Executive) Mr. Grahame J. Leonard AM (Non-Executive) AUDITOR PricewaterhouseCoopers Chartered Accountants Freshwater Place 2 Southbank Boulevard Southbank Vic. 3006 Australia Dr. Lindsay Wakefield (Non-Executive) COMPANy SECRETARIES Mr. Brian Manuel Ms. Bronwyn Christie STOCK EXCHANGES Australian Securities Exchange Code: GTG REGISTERED OffICE 60-66 Hanover Street Fitzroy Vic. 3065 Australia Stock Exchange Centre| 2 The Esplanade Perth W.A. 6000 Australia Telephone: +61 3 8412 7000 Facsimile: +61 3 8412 7040 Email: [email protected] NASDAQ Capital Market Ticker: GENE POSTAL ADDRESS P.O. Box 115 Fitzroy Vic. 3065 Australia The NASDAQ Stock Market One Liberty Plaza, 165 Broadway New York NY 10006 USA AUSTRALIAN BUSINESS NUMBER SHARE REGISTER Computershare Investor Services Pty. Ltd. Yarra Falls, 452 Johnston StreetAbbotsford Vic. 3067 Australia 17 009 212 328 COMPANy wEBSITE www.gtglabs.com Telephone: +61 3 9415 5000 Facsimile: +61 3 9473 2500 Website:www.computershare.com Designed and produced by motivo |
|
|
Genetic Technologies Limited 60-66 Hanover Street Fitzroy, Victoria 3065 Australia T: +61 3 8412 7000 F: +61 3 8412 7040 E: [email protected] P.O. Box 115 Fitzroy, Victoria 3065 Australia www.gtglabs.com |

|
|
GENETIC TECHNOLOGIES ANNUAL rEPOrT 2015 |

Serious News for Serious Traders! Try StreetInsider.com Premium Free!
You May Also Be Interested In
- Genetic Technologies (GENE) Announces $2 Million Registered Direct Offering
- First Trust Energy Income and Growth Fund Declares Its Final Common Share Distribution Dates
- EVe Mobility Acquisition Corp Receives NYSE Notice Regarding Late Filing of Annual Report on Form 10-K
Create E-mail Alert Related Categories
SEC FilingsSign up for StreetInsider Free!
Receive full access to all new and archived articles, unlimited portfolio tracking, e-mail alerts, custom newswires and RSS feeds - and more!
