

Form 6-K ENCANA CORP For: Mar 27
 Tweet
Tweet Share
Share
U.S. SECURITIES AND EXCHANGE COMMISSION
Washington, D.C. 20549
FORM 6-K
Report of Foreign Private Issuer
Pursuant to Rule 13a-16 or 15d-16 under the Securities Exchange Act of 1934
| For: March 27, 2015 | Commission File Number: 1-15226 |
ENCANA CORPORATION
(Translation of registrant’s name into English)
Suite 4400, 500 Centre Street SE
PO Box 2850
Calgary, Alberta, Canada T2P 2S5
(Address of principal executive office)
Indicate by check mark whether the registrant files or will file annual reports under cover of Form 20-F or Form 40-F:
Form 20- F Form 40-F ü
Indicate by check mark if the registrant is submitting the Form 6-K in paper as permitted by Regulation S-T Rule 101(b)(1):
Indicate by check mark if the registrant is submitting the Form 6-K in paper as permitted by Regulation S-T Rule 101(b)(7):
|
|
|
|
DOCUMENTS FILED AS PART OF THIS FORM 6-K
See the Exhibit Index to this Form 6-K.
SIGNATURES
Pursuant to the requirements of the Securities Exchange Act of 1934, the registrant has duly caused this report to be signed on its behalf by the undersigned, thereunto duly authorized.
| Date: March 27, 2015 | ENCANA CORPORATION | |||||||||||
| (Registrant) | ||||||||||||
| By: | /s/ Jocelyn S. Salazar | |||||||||||
| Name: | Jocelyn S. Salazar | |||||
| Title: | Assistant Corporate Secretary |
Form 6-K Exhibit Index
| Exhibit No. |
||
| 99.1 | 2014 Annual Report | |
Exhibit 99.1


|
A transformative year | |||
|
2014 was a remarkable year for Encana. The successful execution of the strategy, which is built around a disciplined focus on profitable growth, saw the company complete virtually all of its key deliverables two years ahead of schedule. The speed of this achievement demonstrates the effectiveness of the strategy and the highly driven culture built by Doug Suttles and his leadership team.
Entering the year, Encana embarked on the right course of action at the right time by restructuring and resizing its organization, resulting in an approximately 25 percent workforce reduction. The company modified core processes such as capital allocation which led to a focused investment on seven growth assets, down from almost 30 funded areas the prior year. Strong efficiency improvements across the company highlighted Encana’s relentless drive for operational excellence.
The year was also marked by the transformation of Encana’s portfolio with the divestiture of non-core assets, including the initial public offering and secondary offering of PrairieSky Royalty Ltd., coupled with major acquisitions in the top two oil plays in the U.S.; the Eagle Ford and the Permian Basin. These transactions have delivered a balanced liquids and natural gas portfolio and have made Encana more resilient to dynamic market conditions.
As Chairman of the Board, my focus is to continue our commitment to strong governance and corporate responsibility, while leading the Board of Directors in stewarding Encana towards building value for its shareholders. The Board of Directors continues to believe Encana’s strategy is the best way to grow profitability and maximize |
shareholder value over the long term. With commodity prices expected to be volatile through 2015, the company will continue to make prudent decisions to ensure it emerges even stronger from this downturn.
On behalf of the Board of Directors, I’d like to thank Encana’s Executive Leadership Team and staff. Their achievements through 2014 have put the company in a position of relative strength and on a path to sustainable success.
CLAYTON WOITAS CHAIRMAN OF THE BOARD | |||

1

2
PORTFOLIO TRANSFORMATION
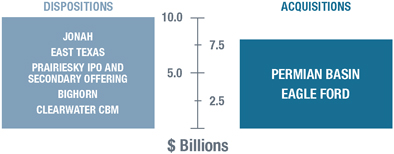
In 2014, we completed around $18 billion of acquisition and divestiture activity and built a balanced commodity portfolio, rich with investment opportunities in premium positions in Canada and the United States. We focused around 86 percent of our capital investment toward seven growth assets, down from nearly 30 assets the previous year.
Creating a focused, balanced and higher margin portfolio
We dramatically reshaped our portfolio and replaced lower margin natural gas production with higher margin liquids. We divested non-core assets and acquired two strategic assets in two of North America’s best oil plays.
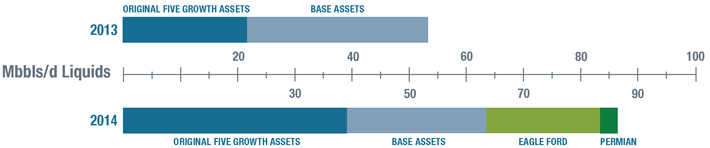
61 percent increase in liquids production
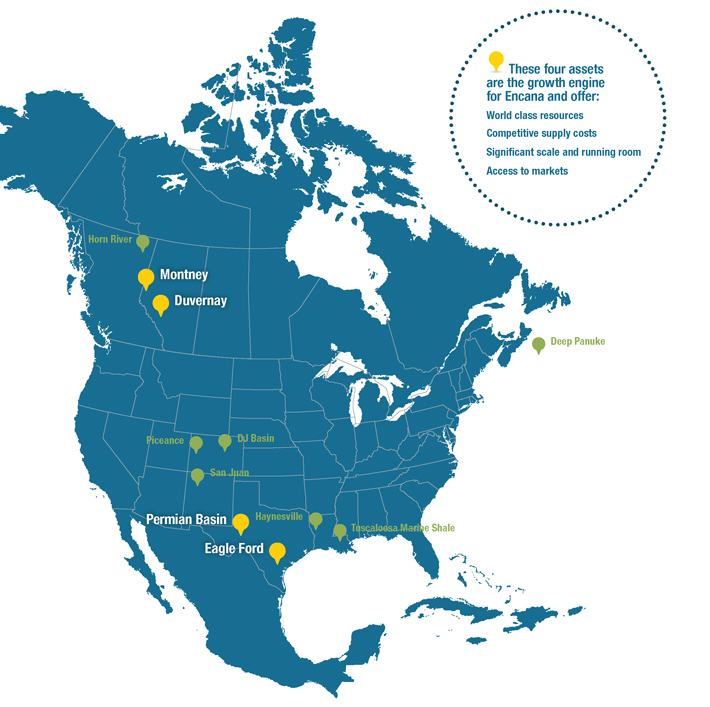
We grew total annual production from 54,000 bbls/d in 2013 to 87,000 bbls/d in 2014. Our five original growth assets; Montney, Duvernay, DJ Basin, San Juan and Tuscaloosa Marine Shale performed exceptionally. The acquisition of two new growth assets; in the Eagle Ford and the Permian Basin, made an immediate contribution to our liquids production.
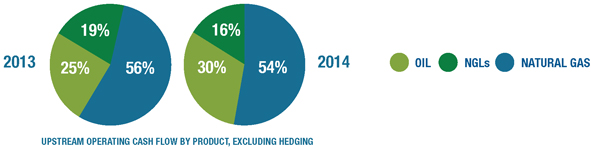
Shifting to higher value production
We are focused on high value production rather than production volume growth. In 2014, we delivered a 14 percent increase in year-over-year cash flow. We delivered this cash flow growth on approximately seven percent lower total production in a similar commodity price environment compared to 2013.
3


|
Efficient, competitive and resilient | |||
|
The transformation we undertook through 2014 occurred at a pace that surpassed our own high expectations. The result of our hard work is a competitive, resilient, low-cost and lean Encana. We have a focused portfolio rich with investment opportunities and premium positions in two of the best resource plays in Canada; the Montney and the Duvernay, and two of the best in the United States; the Eagle Ford and the Permian Basin.
The steps we took during 2014 were designed to deliver sustainable value to our shareholders by growing cash flow per share. We focused on higher value production rather than volume growth and directed our capital investment toward assets with scale and low supply costs – in short, the assets that provide the highest returns. This capital discipline was complemented by around $18 billion of acquisition and divestiture activity, which enabled us to dramatically reshape our portfolio and replace lower margin natural gas production with higher margin liquids.
Our cultural change has been just as dramatic and important to the transformation of the company. By embracing our values of One, Agile and Driven, our staff has harnessed the technical strength, knowledge and stability of a large organization, while adopting the mindset of a small, entrepreneurial company. They continue to relentlessly identify and implement ways to enhance efficiencies and streamline processes. In addition, in 2014 they delivered the best ever safety record in company history; an impressive accomplishment during a period of significant change.
The recent market volatility is a sharp reminder that we are in the commodity business. While we did not predict the recent drop in commodity prices, we knew that it was a possibility sometime during the execution of our long-term strategy. |
With this in mind, our strategy was designed to create a competitive and resilient company able to deliver shareholder value through commodity price cycles.
While oil traded at approximately $100 per barrel, our staff delivered material efficiency improvements throughout the company. In a lower price environment, we see significant opportunity to deliver further enduring efficiencies.
We will continue to take a prudent view of commodity prices and will protect our balance sheet throughout 2015 by exercising strict financial discipline. Equally important, we will maintain a capital allocation philosophy that is consistent with our strategy by prioritizing investment to our four most strategic assets: the Eagle Ford, Permian Basin, Montney and Duvernay.
Our team’s accomplishments in 2014 should not be overshadowed by today’s low commodity environment. In fact, it makes their achievements even more important. We are in a position of relative strength with a culture and strategy that keep us on the path to becoming a leading North American resource play company.
On behalf of the Executive Leadership Team, I want to thank our Board of Directors for their ongoing support and say a special thank you to all Encana staff for a remarkable 2014.
DOUG SUTTLES PRESIDENT & CEO | |||

5

|
PILLARS |
||||
|
Encana is structured and organized around four core competencies that we believe every exploration and production company needs to excel at in order to deliver sustainable shareholder value.
|

| |||
|
TOP TIER ASSETS |
CAPITAL ALLOCATION |
|||
|
We will always be on the lookout for the best rocks and focus our capital on a limited number of core growth assets characterized by high returns, scale and running room. Our strategy is centered on diversifying our commodity mix and growing value in top tier assets.
|
A highly disciplined, dynamic and centrally controlled capital allocation program will help ensure that we are directing our investment dollars in a manner that is consistent with our strategy. By concentrating capital on our core growth assets, we believe we can generate the most value for our shareholders. |
|||
|
MARKET FUNDAMENTALS |
OPERATIONAL EXCELLENCE |
|||
|
We will actively monitor and manage the effects of market volatility to enable us to respond to the ever-changing trade winds inherent in the oil and gas business. Leveraging our industry-leading commodity market expertise to inform our capital allocation decisions is critical to both managing risk and maximizing margins. |
Operational excellence is one of Encana’s strengths and we will continuously work to maintain this competitive advantage. We strive to increase profitability by running our operations in the most efficient and cost effective manner possible. Our best-in-class operators will focus on efficiency, safety and integrated and collaborative thinking in order to maximize value across our asset base.
|
|||
|
BALANCE SHEET STRENGTH |
||||
|
Underpinning these four core competencies is balance sheet strength. Maintaining financial flexibility and investment grade credit ratings are an important part of how we think about managing our business. Balance sheet strength allows us to capitalize on opportunities as they arise and demonstrates the sustainability of our business model through commodity cycles. |
||||
6
FOCUSED INVESTMENT
Our portfolio is rich with high quality oil, natural gas liquids and natural gas investment opportunities. Around 80 percent of our 2015 capital program is expected to be focused on our four most strategic growth assets: the Eagle Ford, Permian Basin, Montney and Duvernay.
7

| 8 |

| 9 |


| Annual Report 2014 | Encana Corporation 11 |

| 12 Encana Corporation | Annual Report 2014 |
| Annual Report 2014 | Encana Corporation 13 |
| 14 Encana Corporation | Annual Report 2014 |
| Annual Report 2014 | Encana Corporation 15 |
| 16 Encana Corporation | Annual Report 2014 |
| Annual Report 2014 | Encana Corporation 17 |
| 18 Encana Corporation | Annual Report 2014 |
| Annual Report 2014 | Encana Corporation 19 |
| 20 Encana Corporation | Annual Report 2014 |
| Annual Report 2014 | Encana Corporation 21 |
| 22 Encana Corporation | Annual Report 2014 |
| Annual Report 2014 | Encana Corporation 23 |
| 24 Encana Corporation | Annual Report 2014 |
| Annual Report 2014 | Encana Corporation 25 |
| 26 Encana Corporation | Annual Report 2014 |
| Annual Report 2014 | Encana Corporation 27 |
| 28 Encana Corporation | Annual Report 2014 |
| Annual Report 2014 | Encana Corporation 29 |
| 30 Encana Corporation | Annual Report 2014 |
| Annual Report 2014 | Encana Corporation 31 |
| 32 Encana Corporation | Annual Report 2014 |
| Annual Report 2014 | Encana Corporation 33 |
| 34 Encana Corporation | Annual Report 2014 |
| Annual Report 2014 | Encana Corporation 35 |
| 36 Encana Corporation | Annual Report 2014 |
| Annual Report 2014 | Encana Corporation 37 |
| 38 Encana Corporation | Annual Report 2014 |
| Annual Report 2014 | Encana Corporation 39 |
| 40 Encana Corporation | Annual Report 2014 |
| Annual Report 2014 | Encana Corporation 41 |
| 42 Encana Corporation | Annual Report 2014 |
| Annual Report 2014 | Encana Corporation 43 |
| 44 Encana Corporation | Annual Report 2014 |
| Annual Report 2014 | Encana Corporation 45 |
| 46 Encana Corporation | Annual Report 2014 |
| Annual Report 2014 | Encana Corporation 47 |
| 48 Encana Corporation | Annual Report 2014 |
| MANAGEMENT REPORT
|

|
Management’s Responsibility for Consolidated Financial Statements
The accompanying Consolidated Financial Statements of Encana Corporation (the “Company”) are the responsibility of Management. The Consolidated Financial Statements have been prepared by Management in United States dollars in accordance with generally accepted accounting principles in the United States and include certain estimates that reflect Management’s best judgments.
The Company’s Board of Directors has approved the information contained in the Consolidated Financial Statements. The Board of Directors fulfills its responsibility regarding the financial statements mainly through its Audit Committee, which has a written mandate that complies with the current requirements of Canadian securities legislation and the United States Sarbanes-Oxley Act of 2002 and voluntarily complies, in principle, with the Audit Committee guidelines of the New York Stock Exchange. The Audit Committee meets at least on a quarterly basis.
Management’s Assessment of Internal Control over Financial Reporting
Management is also responsible for establishing and maintaining adequate internal control over the Company’s financial reporting. The internal control system was designed to provide reasonable assurance to the Company’s Management regarding the preparation and presentation of the Consolidated Financial Statements.
Internal control systems, no matter how well designed, have inherent limitations. Therefore, even those systems determined to be effective can provide only reasonable assurance with respect to financial statement preparation and presentation. Also, projections of any evaluation of effectiveness to future periods are subject to the risk that controls may become inadequate because of changes in conditions, or that the degree of compliance with the policies or procedures may deteriorate.
Management has assessed the design and effectiveness of the Company’s internal control over financial reporting as at December 31, 2014. In making its assessment, Management has used the Internal Control – Integrated Framework (2013) issued by the Committee of Sponsoring Organizations of the Treadway Commission to evaluate the effectiveness of the Company’s internal control over financial reporting. Based on our evaluation, Management has concluded that the Company’s internal control over financial reporting was effectively designed and operating effectively as at that date.
Management has excluded Athlon Energy Inc. from its assessment of internal control over financial reporting as at December 31, 2014 because it was acquired by the Company through a business combination during 2014. Assets attributable to Athlon Energy Inc. as of December 31, 2014 represented approximately 13 percent of the Company’s total assets as of December 31, 2014, and revenues attributable to Athlon Energy Inc. for the period from November 13, 2014 to December 31, 2014 represented approximately 2 percent of the Company’s total revenues for the year ended December 31, 2014.
PricewaterhouseCoopers LLP, an independent firm of chartered accountants, was appointed by a vote of shareholders at the Company’s last annual meeting to audit and provide independent opinions on both the Consolidated Financial Statements and the Company’s internal control over financial reporting as at December 31, 2014, as stated in their Auditor’s Report. PricewaterhouseCoopers LLP has provided such opinions.

|

| |||
| Douglas J. Suttles | Sherri A. Brillon | |||
| President & Chief Executive Officer | Executive Vice-President & Chief Financial Officer | |||
| March 3, 2015 | ||||
Annual Report 2014 | Encana Corporation 49

|
AUDITOR’S REPORT
|
INDEPENDENT AUDITOR’S REPORT
To the Shareholders of Encana Corporation
We have completed an integrated audit of Encana Corporation’s 2014, 2013 and 2012 Consolidated Financial Statements and its internal control over financial reporting as at December 31, 2014. Our opinions, based on our audits, are presented below.
Report on the Consolidated Financial Statements
We have audited the accompanying Consolidated Financial Statements of Encana Corporation, which comprise the Consolidated Balance Sheet as at December 31, 2014 and December 31, 2013 and the Consolidated Statements of Earnings, Comprehensive Income, Changes in Shareholders’ Equity and Cash Flows for each of the three years in the period ended December 31, 2014, and the related notes, which comprise a summary of significant accounting policies and other explanatory information.
Management’s Responsibility for the Consolidated Financial Statements
Management is responsible for the preparation and fair presentation of these Consolidated Financial Statements in accordance with accounting principles generally accepted in the United States of America and for such internal control as management determines is necessary to enable the preparation of Consolidated Financial Statements that are free from material misstatement, whether due to fraud or error.
Auditor’s Responsibility
Our responsibility is to express an opinion on these Consolidated Financial Statements based on our audits. We conducted our audits as at December 31, 2014 and December 31, 2013 and for the years then ended in accordance with Canadian generally accepted auditing standards and the standards of the Public Company Accounting Oversight Board (United States). Those standards require that we plan and perform the audit to obtain reasonable assurance about whether the Consolidated Financial Statements are free from material misstatement. Canadian generally accepted auditing standards also require that we comply with ethical requirements.
An audit involves performing procedures to obtain audit evidence, on a test basis, about the amounts and disclosures in the consolidated financial statements. The procedures selected depend on the auditor’s judgment, including the assessment of the risks of material misstatement of the consolidated financial statements, whether due to fraud or error. In making those risk assessments, the auditor considers internal control relevant to the company’s preparation and fair presentation of the consolidated financial statements in order to design audit procedures that are appropriate in the circumstances. An audit also includes evaluating the appropriateness of accounting principles and policies used and the reasonableness of accounting estimates made by management, as well as evaluating the overall presentation of the consolidated financial statements.
We believe that the audit evidence we have obtained in our audits is sufficient and appropriate to provide a basis for our audit opinion on the Consolidated Financial Statements.
Opinion
In our opinion, the Consolidated Financial Statements present fairly, in all material respects, the financial position of Encana Corporation and its subsidiaries as at December 31, 2014 and December 31, 2013 and the results of its operations and its cash flows for each of the three years in the period ended December 31, 2014 in accordance with accounting principles generally accepted in the United States of America.
50 Encana Corporation | Annual Report 2014

REPORT ON INTERNAL CONTROL OVER FINANCIAL REPORTING
We have also audited Encana Corporation and its subsidiaries’ internal control over financial reporting as at December 31, 2014, based on criteria established in Internal Control – Integrated Framework (2013), issued by the Committee of Sponsoring Organizations of the Treadway Commission (“COSO”).
Management’s Responsibility for Internal Control over Financial Reporting
Management is responsible for maintaining effective internal control over financial reporting and for its assessment of the effectiveness of internal control over financial reporting included in the accompanying Management’s Assessment of Internal Control over Financial Reporting.
Auditor’s Responsibility
Our responsibility is to express an opinion on the company’s internal control over financial reporting based on our audit. We conducted our audit of internal control over financial reporting in accordance with the standards of the Public Company Accounting Oversight Board (United States). Those standards require that we plan and perform the audit to obtain reasonable assurance about whether effective internal control over financial reporting was maintained in all material respects.
An audit of internal control over financial reporting includes obtaining an understanding of internal control over financial reporting, assessing the risk that a material weakness exists, testing and evaluating the design and operating effectiveness of internal control based on the assessed risk, and performing such other procedures as we consider necessary in the circumstances.
We believe that our audit provides a reasonable basis for our audit opinion on the company’s internal control over financial reporting.
Definition of Internal Control over Financial Reporting
A company’s internal control over financial reporting is a process designed to provide reasonable assurance regarding the reliability of financial reporting and the preparation of financial statements for external purposes in accordance with generally accepted accounting principles. A company’s internal control over financial reporting includes those policies and procedures that: (i) pertain to the maintenance of records that, in reasonable detail, accurately and fairly reflect the transactions and dispositions of the assets of the company; (ii) provide reasonable assurance that transactions are recorded as necessary to permit preparation of financial statements in accordance with generally accepted accounting principles, and that receipts and expenditures of the company are being made only in accordance with authorizations of management and directors of the company; and (iii) provide reasonable assurance regarding prevention or timely detection of unauthorized acquisition, use, or disposition of the company’s assets that could have a material effect on the financial statements.
Inherent Limitations
Because of its inherent limitations, internal control over financial reporting may not prevent or detect misstatements. Also, projections of any evaluation of effectiveness to future periods are subject to the risk that controls may become inadequate because of changes in conditions or that the degree of compliance with the policies or procedures may deteriorate.
As described in Management’s Report on Internal Control over Financial Reporting, management has excluded Athlon Energy Inc. from its assessment of internal control over financial reporting as at December 31, 2014 because it was acquired by the Company through a business combination during 2014. We have also excluded Athlon Energy Inc. from our audit of internal control over financial reporting. Assets attributable to Athlon Energy Inc. as of December 31, 2014 represented approximately 13 percent of the Company’s total assets as of December 31, 2014, and revenues attributable to Athlon Energy Inc. for the period from November 13, 2014 to December 31, 2014 represented approximately 2 percent of the Company’s total revenues for the year ended December 31, 2014.
Opinion
In our opinion, Encana Corporation and its subsidiaries maintained, in all material respects, effective internal control over financial reporting as at December 31, 2014, based on criteria established in Internal Control – Integrated Framework (2013) issued by COSO.

|
| PricewaterhouseCoopers LLP |
| Chartered Accountants |
| Calgary, Alberta, Canada |
| March 3, 2015 |
| Annual Report 2014 | Encana Corporation 51 |

|
CONSOLIDATED STATEMENT OF EARNINGS
|
| For the years ended December 31 ($ millions, except per share amounts) |
2014 | 2013 | 2012 | |||||||||||||
| Revenues, Net of Royalties |
(Note 2 | ) | $ | 8,019 | $ | 5,858 | $ | 5,160 | ||||||||
| Expenses |
(Note 2 | ) | ||||||||||||||
| Production and mineral taxes |
133 | 134 | 105 | |||||||||||||
| Transportation and processing |
1,505 | 1,476 | 1,231 | |||||||||||||
| Operating |
735 | 859 | 794 | |||||||||||||
| Purchased product |
1,191 | 441 | 349 | |||||||||||||
| Depreciation, depletion and amortization |
1,745 | 1,565 | 1,956 | |||||||||||||
| Impairments |
(Note 9 | ) | — | 21 | 4,695 | |||||||||||
| Accretion of asset retirement obligation |
(Note 15 | ) | 52 | 53 | 53 | |||||||||||
| Administrative |
(Note 19 | ) | 327 | 439 | 392 | |||||||||||
| Interest |
(Note 5 | ) | 654 | 563 | 522 | |||||||||||
| Foreign exchange (gain) loss, net |
(Note 6 | ) | 403 | 325 | (107 | ) | ||||||||||
| (Gain) loss on divestitures |
(Notes 4,18 | ) | (3,426 | ) | (7 | ) | — | |||||||||
| Other |
(Note 3 | ) | 71 | 1 | 1 | |||||||||||
|
|
|
|
|
|
|
|||||||||||
| 3,390 | 5,870 | 9,991 | ||||||||||||||
|
|
|
|
|
|
|
|||||||||||
| Net Earnings (Loss) Before Income Tax |
4,629 | (12 | ) | (4,831 | ) | |||||||||||
| Income tax expense (recovery) |
(Note 7 | ) | 1,203 | (248 | ) | (2,037 | ) | |||||||||
|
|
|
|
|
|
|
|||||||||||
| Net Earnings (Loss) |
3,426 | 236 | (2,794 | ) | ||||||||||||
| Net earnings attributable to noncontrolling interest |
(Note 18 | ) | (34 | ) | — | — | ||||||||||
|
|
|
|
|
|
|
|||||||||||
| Net Earnings (Loss) Attributable to Common Shareholders |
$ | 3,392 | $ | 236 | $ | (2,794 | ) | |||||||||
|
|
|
|
|
|
|
|||||||||||
| Net Earnings (Loss) per Common Share |
||||||||||||||||
| Basic & Diluted |
(Note 16 | ) | $ | 4.58 | $ | 0.32 | $ | (3.79 | ) | |||||||
CONSOLIDATED STATEMENT
OF COMPREHENSIVE INCOME
| For the years ended December 31 ($ millions) |
2014 | 2013 | 2012 | |||||||||||||
| Net Earnings (Loss) |
$ | 3,426 | $ | 236 | $ | (2,794 | ) | |||||||||
| Other Comprehensive Income (Loss), Net of Tax |
||||||||||||||||
| Foreign currency translation adjustment |
(Note 17 | ) | 22 | (46 | ) | 81 | ||||||||||
| Pension and other post-employment benefit plans |
(Notes 17,21 | ) | (17 | ) | 60 | 13 | ||||||||||
|
|
|
|
|
|
|
|||||||||||
| Other Comprehensive Income |
5 | 14 | 94 | |||||||||||||
|
|
|
|
|
|
|
|||||||||||
| Comprehensive Income (Loss) |
3,431 | 250 | (2,700 | ) | ||||||||||||
|
|
|
|
|
|
|
|||||||||||
| Comprehensive Income Attributable to Noncontrolling Interest |
(Note 18 | ) | (34 | ) | — | — | ||||||||||
|
|
|
|
|
|
|
|||||||||||
| Comprehensive Income (Loss) Attributable to Common Shareholders |
$ | 3,397 | $ | 250 | $ | (2,700 | ) | |||||||||
|
|
|
|
|
|
|
|||||||||||
See accompanying Notes to Consolidated Financial Statements
52 Encana Corporation | Annual Report 2014
| CONSOLIDATED BALANCE SHEET
|

|
| As at December 31 ($ millions) |
2014 | 2013 | ||||||||||
| Assets |
||||||||||||
| Current Assets |
||||||||||||
| Cash and cash equivalents |
$ | 338 | $ | 2,566 | ||||||||
| Accounts receivable and accrued revenues |
(Note 8 | ) | 1,307 | 988 | ||||||||
| Risk management |
(Note 23 | ) | 707 | 56 | ||||||||
| Income tax receivable |
509 | 562 | ||||||||||
| Deferred income taxes |
(Note 7 | ) | — | 118 | ||||||||
|
|
|
|
|
|||||||||
| 2,861 | 4,290 | |||||||||||
| Property, Plant and Equipment, at cost: |
(Note 9 | ) | ||||||||||
| Natural gas and oil properties, based on full cost accounting |
||||||||||||
| Proved properties |
42,615 | 51,603 | ||||||||||
| Unproved properties |
6,133 | 1,068 | ||||||||||
| Other |
2,711 | 3,148 | ||||||||||
|
|
|
|
|
|||||||||
| Property, plant and equipment |
51,459 | 55,819 | ||||||||||
| Less: Accumulated depreciation, depletion and amortization |
(33,444 | ) | (45,784 | ) | ||||||||
|
|
|
|
|
|||||||||
| Property, plant and equipment, net |
(Note 2 | ) | 18,015 | 10,035 | ||||||||
| Cash in Reserve |
73 | 10 | ||||||||||
| Other Assets |
(Note 10 | ) | 394 | 526 | ||||||||
| Risk Management |
(Note 23 | ) | 65 | 204 | ||||||||
| Deferred Income Taxes |
(Note 7 | ) | 296 | 939 | ||||||||
| Goodwill |
(Notes 2, 3, 4, 11, 18 | ) | 2,917 | 1,644 | ||||||||
|
|
|
|
|
|||||||||
| (Note 2 | ) | $ | 24,621 | $ | 17,648 | |||||||
|
|
|
|
|
|||||||||
| Liabilities and Shareholders’ Equity |
||||||||||||
| Current Liabilities |
||||||||||||
| Accounts payable and accrued liabilities |
(Note 12 | ) | $ | 2,243 | $ | 1,895 | ||||||
| Income tax payable |
15 | 29 | ||||||||||
| Risk management |
(Note 23 | ) | 20 | 25 | ||||||||
| Current portion of long-term debt |
(Note 13 | ) | — | 1,000 | ||||||||
| Deferred income taxes |
(Note 7 | ) | 128 | 3 | ||||||||
|
|
|
|
|
|||||||||
| 2,406 | 2,952 | |||||||||||
| Long-Term Debt |
(Note 13 | ) | 7,340 | 6,124 | ||||||||
| Other Liabilities and Provisions |
(Note 14 | ) | 2,484 | 2,520 | ||||||||
| Risk Management |
(Note 23 | ) | 7 | 5 | ||||||||
| Asset Retirement Obligation |
(Note 15 | ) | 870 | 900 | ||||||||
| Deferred Income Taxes |
(Note 7 | ) | 1,829 | — | ||||||||
|
|
|
|
|
|||||||||
| 14,936 | 12,501 | |||||||||||
|
|
|
|
|
|||||||||
| Commitments and Contingencies |
(Note 25 | ) | ||||||||||
| Shareholders’ Equity |
||||||||||||
| Share capital – authorized unlimited common shares, without par value 2014 issued and outstanding: 741.2 million shares (2013: 740.9 million shares) |
(Note 16 | ) | 2,450 | 2,445 | ||||||||
| Paid in surplus |
(Notes 16, 18, 20 | ) | 1,358 | 15 | ||||||||
| Retained earnings |
5,188 | 2,003 | ||||||||||
| Accumulated other comprehensive income |
(Note 17 | ) | 689 | 684 | ||||||||
|
|
|
|
|
|||||||||
| Total Shareholders’ Equity |
9,685 | 5,147 | ||||||||||
|
|
|
|
|
|||||||||
| $ | 24,621 | $ | 17,648 | |||||||||
|
|
|
|
|
|||||||||
See accompanying Notes to Consolidated Financial Statements
Approved by the Board of Directors

|

| |||
| Clayton H. Woitas | Jane L. Peverett | |||
| Director | Director | |||
Annual Report 2014 | Encana Corporation 53

|
CONSOLIDATED STATEMENT OF CHANGES IN SHAREHOLDERS’ EQUITY
|
| For the year ended December 31, 2014 ($ millions) |
Share Capital |
Paid in Surplus |
Retained Earnings |
Accumulated Other Comprehensive Income |
Non- Controlling Interest |
Total Shareholders’ Equity |
||||||||||||||||||||||
| Balance, December 31, 2013 |
$ | 2,445 | $ | 15 | $ | 2,003 | $ | 684 | $ | — | $ | 5,147 | ||||||||||||||||
| Share-Based Compensation |
(Note 20 | ) | — | (2 | ) | — | — | — | (2 | ) | ||||||||||||||||||
| Net Earnings (Loss) |
— | — | 3,392 | — | 34 | 3,426 | ||||||||||||||||||||||
| Dividends on Common Shares |
(Note 16 | ) | — | — | (207 | ) | — | — | (207 | ) | ||||||||||||||||||
| Common Shares Issued Under Dividend Reinvestment Plan |
(Note 16 | ) | 5 | — | — | — | — | 5 | ||||||||||||||||||||
| Other Comprehensive Income |
(Note 17 | ) | — | — | — | 5 | — | 5 | ||||||||||||||||||||
| Sale of Noncontrolling Interest |
(Note 18 | ) | — | 1,345 | — | — | 117 | 1,462 | ||||||||||||||||||||
| Distributions to Noncontrolling Interest Owners |
(Note 18 | ) | — | — | — | — | (18 | ) | (18 | ) | ||||||||||||||||||
| Sale of Investment in PrairieSky |
(Note 18 | ) | — | — | — | — | (133 | ) | (133 | ) | ||||||||||||||||||
|
|
|
|
|
|
|
|
|
|
|
|
|
|||||||||||||||||
| Balance, December 31, 2014 |
$ | 2,450 | $ | 1,358 | $ | 5,188 | $ | 689 | $ | — | $ | 9,685 | ||||||||||||||||
|
|
|
|
|
|
|
|
|
|
|
|
|
|||||||||||||||||
| For the year ended December 31, 2013 ($ millions) |
Share Capital |
Paid in Surplus |
Retained Earnings |
Accumulated Other Comprehensive Income |
Non- Controlling Interest |
Total Shareholders’ Equity |
||||||||||||||||||||||
| Balance, December 31, 2012 |
$ | 2,354 | $ | 10 | $ | 2,261 | $ | 670 | $ | — | $ | 5,295 | ||||||||||||||||
| Share-Based Compensation |
(Note 20 | ) | — | 3 | — | — | — | 3 | ||||||||||||||||||||
| Net Earnings (Loss) |
— | — | 236 | — | — | 236 | ||||||||||||||||||||||
| Common Shares Cancelled |
(Note 16 | ) | (2 | ) | 2 | — | — | — | — | |||||||||||||||||||
| Dividends on Common Shares |
(Note 16 | ) | — | — | (494 | ) | — | — | (494 | ) | ||||||||||||||||||
| Common Shares Issued Under Dividend Reinvestment Plan |
(Note 16 | ) | 93 | — | — | — | — | 93 | ||||||||||||||||||||
| Other Comprehensive Income |
(Note 17 | ) | — | — | — | 14 | — | 14 | ||||||||||||||||||||
|
|
|
|
|
|
|
|
|
|
|
|
|
|||||||||||||||||
| Balance, December 31, 2013 |
$ | 2,445 | $ | 15 | $ | 2,003 | $ | 684 | $ | — | $ | 5,147 | ||||||||||||||||
|
|
|
|
|
|
|
|
|
|
|
|
|
|||||||||||||||||
| For the year ended December 31, 2012 ($ millions) |
Share Capital |
Paid in Surplus |
Retained Earnings |
Accumulated Other Comprehensive Income |
Non- Controlling Interest |
Total Shareholders’ Equity |
||||||||||||||||||||||
| Balance, December 31, 2011 |
$ | 2,354 | $ | 5 | $ | 5,643 | $ | 576 | $ | — | $ | 8,578 | ||||||||||||||||
| Share-Based Compensation |
(Note 20 | ) | — | 5 | — | — | — | 5 | ||||||||||||||||||||
| Net Earnings (Loss) |
— | — | (2,794 | ) | — | — | (2,794 | ) | ||||||||||||||||||||
| Dividends on Common Shares |
(Note 16 | ) | — | — | (588 | ) | — | — | (588 | ) | ||||||||||||||||||
| Other Comprehensive Income |
— | — | — | 94 | — | 94 | ||||||||||||||||||||||
|
|
|
|
|
|
|
|
|
|
|
|
|
|||||||||||||||||
| Balance, December 31, 2012 |
$ | 2,354 | $ | 10 | $ | 2,261 | $ | 670 | $ | — | $ | 5,295 | ||||||||||||||||
|
|
|
|
|
|
|
|
|
|
|
|
|
|||||||||||||||||
See accompanying Notes to Consolidated Financial Statements
54 Encana Corporation | Annual Report 2014
| CONSOLIDATED STATEMENT OF CASH FLOWS
|

|
| For the years ended December 31 ($ millions) |
2014 | 2013 | 2012 | |||||||||||||
| Operating Activities |
||||||||||||||||
| Net earnings (loss) |
$ | 3,426 | $ | 236 | $ | (2,794 | ) | |||||||||
| Depreciation, depletion and amortization |
1,745 | 1,565 | 1,956 | |||||||||||||
| Impairments |
(Note 9 | ) | — | 21 | 4,695 | |||||||||||
| Accretion of asset retirement obligation |
(Note 15 | ) | 52 | 53 | 53 | |||||||||||
| Deferred income taxes |
(Note 7 | ) | 960 | (57 | ) | (1,837 | ) | |||||||||
| Unrealized (gain) loss on risk management |
(Note 23 | ) | (444 | ) | 345 | 1,465 | ||||||||||
| Unrealized foreign exchange (gain) loss |
(Note 6 | ) | 440 | 330 | (112 | ) | ||||||||||
| (Gain) loss on divestitures |
(Notes 4,18 | ) | (3,426 | ) | (7 | ) | — | |||||||||
| Other |
(34 | ) | 62 | 82 | ||||||||||||
| Net change in other assets and liabilities |
(43 | ) | (80 | ) | (78 | ) | ||||||||||
| Net change in non-cash working capital |
(Note 24 | ) | (9 | ) | (179 | ) | (323 | ) | ||||||||
|
|
|
|
|
|
|
|||||||||||
| Cash From (Used in) Operating Activities |
2,667 | 2,289 | 3,107 | |||||||||||||
|
|
|
|
|
|
|
|||||||||||
| Investing Activities |
||||||||||||||||
| Capital expenditures |
(Note 2 | ) | (2,526 | ) | (2,712 | ) | (3,476 | ) | ||||||||
| Acquisitions |
(Note 4 | ) | (3,016 | ) | (184 | ) | (379 | ) | ||||||||
| Corporate acquisition |
(Note 3 | ) | (5,962 | ) | — | — | ||||||||||
| Proceeds from divestitures |
(Note 4 | ) | 4,345 | 705 | 4,043 | |||||||||||
| Proceeds from sale of investment in PrairieSky |
(Notes 4,18 | ) | 2,172 | — | — | |||||||||||
| Cash in reserve |
(63 | ) | 44 | 415 | ||||||||||||
| Net change in investments and other |
321 | 252 | (242 | ) | ||||||||||||
|
|
|
|
|
|
|
|||||||||||
| Cash From (Used in) Investing Activities |
(4,729 | ) | (1,895 | ) | 361 | |||||||||||
|
|
|
|
|
|
|
|||||||||||
| Financing Activities |
||||||||||||||||
| Issuance of revolving long-term debt |
(Notes 13,23 | ) | 1,277 | — | 1,721 | |||||||||||
| Repayment of revolving long-term debt |
(Note 3 | ) | (335 | ) | — | (1,724 | ) | |||||||||
| Repayment of long-term debt |
(Note 13 | ) | (2,152 | ) | (500 | ) | (503 | ) | ||||||||
| Dividends on common shares |
(Note 16 | ) | (202 | ) | (401 | ) | (588 | ) | ||||||||
| Proceeds from sale of noncontrolling interest |
(Note 18 | ) | 1,462 | — | — | |||||||||||
| Distributions to noncontrolling interest owners |
(Note 18 | ) | (18 | ) | — | — | ||||||||||
| Capital lease payments and other financing arrangements |
(Note 9 | ) | (71 | ) | (8 | ) | (17 | ) | ||||||||
|
|
|
|
|
|
|
|||||||||||
| Cash From (Used in) Financing Activities |
(39 | ) | (909 | ) | (1,111 | ) | ||||||||||
|
|
|
|
|
|
|
|||||||||||
| Foreign Exchange Gain (Loss) on Cash and Cash Equivalents Held in Foreign Currency |
(127 | ) | (98 | ) | 22 | |||||||||||
|
|
|
|
|
|
|
|||||||||||
| Increase (Decrease) in Cash and Cash Equivalents |
(2,228 | ) | (613 | ) | 2,379 | |||||||||||
| Cash and Cash Equivalents, Beginning of Year |
2,566 | 3,179 | 800 | |||||||||||||
|
|
|
|
|
|
|
|||||||||||
| Cash and Cash Equivalents, End of Year |
$ | 338 | $ | 2,566 | $ | 3,179 | ||||||||||
|
|
|
|
|
|
|
|||||||||||
| Cash, End of Year |
$ | 142 | $ | 161 | $ | 92 | ||||||||||
| Cash Equivalents, End of Year |
196 | 2,405 | 3,087 | |||||||||||||
|
|
|
|
|
|
|
|||||||||||
| Cash and Cash Equivalents, End of Year |
$ | 338 | $ | 2,566 | $ | 3,179 | ||||||||||
|
|
|
|
|
|
|
|||||||||||
| Supplementary Cash Flow Information | (Note 24 | ) | ||||||||||||||
See accompanying Notes to Consolidated Financial Statements
Annual Report 2014 | Encana Corporation 55

|
NOTES TO CONSOLIDATED FINANCIAL STATEMENTS
|
1. SUMMARY OF SIGNIFICANT ACCOUNTING POLICIES
A) NATURE OF OPERATIONS
Encana Corporation and its subsidiaries (“Encana” or the “Company”) are in the business of the exploration for, the development of, and the production and marketing of natural gas, oil and natural gas liquids (“NGLs”). The term liquids is used to represent Encana’s oil, NGLs and condensate.
B) BASIS OF PRESENTATION
The Consolidated Financial Statements include the accounts of Encana and are presented in accordance with accounting principles generally accepted in the United States (“U.S. GAAP”).
In these Consolidated Financial Statements, unless otherwise indicated, all dollar amounts are expressed in United States (“U.S.”) dollars. Encana’s financial results are consolidated in Canadian dollars; however, the Company has adopted the U.S. dollar as its reporting currency to facilitate a more direct comparison to other North American oil and gas companies. All references to US$ or to $ are to United States dollars and references to C$ are to Canadian dollars.
C) PRINCIPLES OF CONSOLIDATION
The Consolidated Financial Statements include the accounts of Encana and entities in which it holds a controlling interest. The noncontrolling interest represented the third party equity ownership in a former consolidated subsidiary, PrairieSky Royalty Ltd. (“PrairieSky”). See Note 18 for further details regarding the noncontrolling interest. As of September 26, 2014, Encana no longer holds an interest in PrairieSky. All intercompany balances and transactions are eliminated on consolidation. For upstream joint interest operations where Encana retains an undivided interest in jointly owned property, the Company records its proportionate share of assets, liabilities, revenues and expenses. Investments in non-controlled entities over which Encana has the ability to exercise significant influence are accounted for using the equity method.
D) FOREIGN CURRENCY TRANSLATION
Monetary assets and liabilities of the Company that are denominated in foreign currencies are translated at the rates of exchange in effect at the period end date. Any gains or losses are recorded in the Consolidated Statement of Earnings. Foreign currency revenues and expenses are translated at the rates of exchange in effect at the time of the transaction.
Assets and liabilities of foreign operations are translated at period end exchange rates, while the related revenues and expenses are translated using average rates over the period. Translation gains and losses relating to the foreign operations are included in accumulated other comprehensive income (“AOCI”). Recognition of Encana’s accumulated translation gains and losses into net earnings occurs upon complete or substantially complete liquidation of the Company’s investment in the foreign operation.
For financial statement presentation, assets and liabilities are translated into the reporting currency at period end exchange rates, while revenues and expenses are translated using average rates over the period. Gains and losses relating to the financial statement translation are included in AOCI.
E) USE OF ESTIMATES
Preparation of the Consolidated Financial Statements in conformity with U.S. GAAP requires Management to make informed estimates and assumptions and use judgments that affect reported amounts of assets and liabilities and disclosures of contingent assets and liabilities at the date of the Consolidated Financial Statements and the reported amounts of revenues and expenses during the period. Such estimates primarily relate to unsettled transactions and events as of the date of the Consolidated Financial Statements. Accordingly, actual results may differ from estimated amounts as future events occur.
Significant items subject to estimates and assumptions are:
| • | Estimates of proved reserves and related future cash flows used for depletion and ceiling test impairment calculations |
| • | Estimated fair value of long-term assets used for impairment calculations |
| • | Fair value of reporting units used for the assessment of goodwill |
| • | Estimates of future taxable earnings used to assess the realizable value of deferred tax assets |
| • | Fair value of asset retirement obligations and costs |
| • | Fair value of derivative instruments |
| • | Fair value attributed to assets acquired and liabilities assumed in business combinations |
| • | Tax interpretations, regulations and legislation in the various jurisdictions in which the Company and its subsidiaries operate |
| • | Accruals for long-term performance-based compensation arrangements, including whether or not the performance criteria will be met and measurement of the ultimate payout amount |
| • | Recognized values of pension assets and obligations, as well as the pension costs charged to net earnings, depend on certain actuarial and economic assumptions |
| • | Accruals for legal claims, environmental risks and exposures |
56 Encana Corporation | Annual Report 2014

F) REVENUE RECOGNITION
Revenues associated with Encana’s natural gas and liquids are recognized when production is sold to a purchaser at a fixed or determinable price, delivery has occurred, title has transferred and collectability of the revenue is probable. Realized gains and losses from the Company’s financial derivatives related to natural gas and oil commodity prices are recognized in revenue when the contract is settled. Unrealized gains and losses related to these contracts are recognized in revenue based on the changes in fair value of the contracts at the end of the respective periods.
Market optimization revenues and purchased product expenses are recorded on a gross basis when Encana takes title to the product and has the risks and rewards of ownership. Purchases and sales of products that are entered into in contemplation of each other with the same counterparty are recorded on a net basis. Revenues associated with the services provided where Encana acts as agent are recorded as the services are provided.
G) PRODUCTION AND MINERAL TAXES
Costs paid by Encana to certain mineral and non-mineral interest owners based on production of natural gas and liquids are recognized when the product is produced.
H) TRANSPORTATION AND PROCESSING
Costs paid by Encana for the transportation and processing of natural gas and liquids are recognized when the product is delivered and the services provided.
I) OPERATING
Operating costs paid by Encana for oil and gas properties in which the Company has a working interest. Expenses are net of amounts capitalized in accordance with the full cost method of accounting.
J) EMPLOYEE BENEFIT PLANS
The Company sponsors defined contribution and defined benefit plans, providing pension and other post-employment benefits to its employees in Canada and the U.S. As of January 1, 2003, the defined benefit pension plan was closed to new entrants.
Pension expense for the defined contribution pension plan is recorded as the benefits are earned by the employees covered by the plans. Encana accrues for its obligations under its employee defined benefit plans, net of plan assets. The cost of defined benefit pensions and other post-employment benefits is actuarially determined using the projected benefit method based on length of service and reflects Management’s best estimate of salary escalation, retirement ages of employees and expected future health care costs. The expected return on plan assets is based on historical and projected rates of return for assets in the investment plan portfolio. The actual return is based on the fair value of plan assets. The projected benefit obligation is discounted using the market interest rate on high-quality corporate debt instruments as at the measurement date.
Pension expense for the defined benefit pension plan includes the cost of pension benefits earned during the current year, the interest cost on pension obligations, the expected return on pension plan assets, the amortization of the net transitional obligation, the amortization of adjustments arising from pension plan amendments, the amortization of prior service costs, and the amortization of the excess of the net actuarial gain or loss over 10 percent of the greater of the benefit obligation and the fair value of plan assets. Amortization is on a straight-line basis over a period covering the expected average remaining service lives of employees covered by the plans. Actuarial gains and losses related to the change in the over-funded or under-funded status of the defined benefit pension plan and other post-employment benefit plans are recognized in other comprehensive income.
K) INCOME TAXES
Encana follows the liability method of accounting for income taxes. Under this method, deferred income taxes are recorded for the effect of any temporary difference between the accounting and income tax basis of an asset or liability, using the enacted income tax rates and laws expected to apply when the assets are realized and liabilities are settled. Current income taxes are measured at the amount expected to be recoverable from or payable to the taxation authorities based on the income tax rates and laws enacted at the end of the reporting period. The effect of a change in the enacted tax rates or laws is recognized in net earnings in the period of enactment. Income taxes are recognized in net earnings except to the extent that they relate to items recognized directly in shareholders’ equity, in which case the income taxes are recognized directly in shareholders’ equity.
Deferred income tax assets are routinely assessed for realizability. If it is more likely than not that deferred tax assets will not be realized, a valuation allowance is recorded to reduce the deferred tax assets. Encana considers available positive and negative evidence when assessing the realizability of deferred tax assets including historic and expected future taxable earnings, available tax planning strategies and carry forward periods. The assumptions used in determining expected future taxable earnings are consistent with those used in the goodwill impairment assessment.
Encana recognizes the financial statement effects of a tax position when it is more likely than not, based on the technical merits, that the position will be sustained upon examination by a taxing authority. A recognized tax position is initially and subsequently measured as the largest amount of tax benefit that is greater than 50 percent likely of being realized upon settlement with a taxing authority. Liabilities for unrecognized tax benefits that are not expected to be settled within the next 12 months are included in other liabilities and provisions.
Annual Report 2014 | Encana Corporation 57
L) EARNINGS PER SHARE AMOUNTS
Basic net earnings per common share is computed by dividing the net earnings by the weighted average number of common shares outstanding during the period. Diluted net earnings per common share amounts are calculated giving effect to the potential dilution that would occur if stock options were exercised or other contracts to issue common shares were exercised, fully vested, or converted to common shares. The treasury stock method is used to determine the dilutive effect of stock options and other dilutive instruments. The treasury stock method assumes that proceeds received from the exercise of in-the-money stock options and other dilutive instruments are used to repurchase common shares at the average market price.
M) CASH AND CASH EQUIVALENTS
Cash and cash equivalents include cash on hand and short-term investments, such as money market deposits or similar type instruments, with a maturity of three months or less when purchased. Outstanding disbursements issued in excess of applicable bank account balances are excluded from cash and cash equivalents and are recorded in accounts payable and accrued liabilities. Cash in reserve represents cash amounts segregated or held in escrow which are not available for general operating use.
N) PROPERTY, PLANT AND EQUIPMENT
UPSTREAM
Encana uses the full cost method of accounting for its acquisition, exploration and development activities. Under this method, all costs directly associated with the acquisition of, the exploration for, and the development of natural gas and liquids reserves are capitalized on a country-by-country cost centre basis. Capitalized costs exclude costs relating to production, general overhead or similar activities.
Under the full cost method of accounting, the carrying amount of Encana’s natural gas and oil properties within each country cost centre is subject to a ceiling test performed quarterly. A ceiling test impairment is recognized in net earnings when the carrying amount of a country cost centre exceeds the country cost centre ceiling. The carrying amount of a cost centre includes capitalized costs of proved oil and gas properties, net of accumulated depletion and the related deferred income taxes.
The cost centre ceiling is the sum of the estimated after-tax future net cash flows from proved reserves, using the 12-month average trailing prices and unescalated future development and production costs, discounted at 10 percent, plus unproved property costs. The 12-month average trailing price is calculated as the average of the price on the first day of each month within the trailing 12-month period. Any excess of the carrying amount over the calculated ceiling amount is recognized as an impairment in net earnings.
Capitalized costs accumulated within each cost centre are depleted using the unit-of-production method based on proved reserves. Depletion is calculated using the capitalized costs, including estimated retirement costs, plus the undiscounted future expenditures to be incurred in developing proved reserves.
Costs associated with unproved properties are excluded from the depletion calculation until it is determined that proved reserves are attributable or impairment has occurred. Unproved properties are assessed separately for impairment on a quarterly basis. Costs that have been impaired are included in the costs subject to depletion within the full cost pool.
Proceeds from the divestiture of properties are normally deducted from the full cost pool without recognition of gain or loss unless the deduction significantly alters the relationship between capitalized costs and proved reserves in the cost centre, in which case a gain or loss is recognized in net earnings. Generally, a gain or loss on a divestiture would be recognized when 25 percent or more of the Company’s proved reserves quantities in a particular country are sold. For divestitures that result in the recognition of a gain or loss on the sale and constitute a business, goodwill is allocated to the divestiture.
CORPORATE
Costs associated with office furniture, fixtures, leasehold improvements, information technology and aircraft are carried at cost and depreciated on a straight-line basis over the estimated service lives of the assets, which range from three to 25 years. Costs associated with The Bow office building are carried at cost and depreciated on a straight-line basis over the 60-year estimated life of the building. Assets under construction are not subject to depreciation until put into use. Land is carried at cost.
O) CAPITALIZATION OF COSTS
Expenditures related to renewals or betterments that improve the productive capacity or extend the life of an asset are capitalized. Maintenance and repairs are expensed as incurred. Interest is capitalized during the construction phase of major development projects.
58 Encana Corporation | Annual Report 2014
P) BUSINESS COMBINATIONS
Business combinations are accounted for using the acquisition method. The acquired identifiable net assets are measured at their fair value at the date of acquisition. Deferred taxes are recognized for any differences between the fair value of net assets acquired and their tax bases. Any excess of the purchase price over the fair value of the net assets acquired is recognized as goodwill. Any deficiency of the purchase price below the fair value of the net assets acquired is recorded as a gain in net earnings. Associated transaction costs are expensed when incurred.
Q) GOODWILL
Goodwill, which represents the excess of purchase price over fair value of net assets acquired, is assessed for impairment at least annually at December 31. Goodwill and all other assets and liabilities are allocated to reporting units, which are Encana’s country cost centres. To assess impairment, the carrying amount of each reporting unit is determined and compared to the fair value of the reporting unit. If the carrying amount of the reporting unit is higher than its related fair value then goodwill is written down to the reporting unit’s implied fair value of goodwill. The implied fair value of goodwill is determined by deducting the fair value of the reporting unit’s assets and liabilities from the fair value of the reporting unit as if the reporting entity had been acquired in a business combination. Any excess of the carrying value of goodwill over the implied fair value of goodwill is recognized as an impairment and charged to net earnings. Subsequent measurement of goodwill is at cost less any accumulated impairments.
R) IMPAIRMENT OF LONG-TERM ASSETS
The carrying value of long-term assets, excluding goodwill and upstream assets included in property, plant and equipment, are assessed for impairment when indicators suggest that the carrying value of an asset or asset group may not be recoverable. If the carrying amount exceeds the sum of the undiscounted cash flows expected to result from the continued use and eventual disposition of the asset or asset group, an impairment is recognized for the excess of the carrying amount over its estimated fair value.
S) ASSET RETIREMENT OBLIGATION
Asset retirement obligations are those legal obligations where the Company will be required to retire tangible long-lived assets such as producing well sites, offshore production platforms and natural gas processing plants. The fair value of estimated asset retirement obligations is recognized in the Consolidated Balance Sheet when incurred and a reasonable estimate of fair value can be made. The asset retirement cost, equal to the initially estimated fair value of the asset retirement obligation, is capitalized as part of the cost of the related long-lived asset. Changes in the estimated obligation resulting from revisions to estimated timing or amount of future cash flows are recognized as a change in the asset retirement obligation and the related asset retirement cost.
Amortization of asset retirement costs is included in depreciation, depletion and amortization in the Consolidated Statement of Earnings. Increases in the asset retirement obligations resulting from the passage of time are recorded as accretion of asset retirement obligation in the Consolidated Statement of Earnings.
Actual expenditures incurred are charged against the accumulated asset retirement obligation.
T) STOCK-BASED COMPENSATION
Obligations for payments of cash or common shares under Encana’s stock-based compensation plans are accrued over the vesting period, net of forfeitures, using fair values. Fair values are determined using observable share prices and/or pricing models such as the Black-Scholes-Merton option-pricing model. For equity-settled stock-based compensation plans, fair values are determined at the grant date and are recognized over the vesting period as compensation costs with a corresponding credit to shareholders’ equity. For cash-settled stock-based compensation plans, fair values are determined at each reporting date and periodic changes are recognized as compensation costs, with a corresponding change to liabilities.
Obligations for payments for share units of Cenovus Energy Inc. (“Cenovus”) held by Encana employees were accrued as compensation costs based on the fair value of the financial liability.
U) LEASES
Leases entered into for the use of an asset are classified as either capital or operating leases. Capital leases transfer to the Company substantially all of the risks and benefits incidental to ownership of the leased item. Capital leases are capitalized upon commencement of the lease term at the lower of the fair value of the leased asset or the present value of the minimum lease payments. Capitalized leased assets are amortized over the estimated useful life of the asset if the lease arrangement contains a bargain purchase option or ownership of the leased asset transfers at the end of the lease term. Otherwise, the leased assets are amortized over the lease term. Amortization of capitalized leased assets is included in depreciation, depletion and amortization in the Consolidated Statement of Earnings. All other leases are classified as operating leases and the payments are recognized on a straight-line basis over the lease term.
Annual Report 2014 | Encana Corporation 59
V) FAIR VALUE MEASUREMENTS
Fair value is defined as the price that would be received to sell an asset or paid to transfer a liability in an orderly transaction between market participants at the measurement date. Valuation techniques include the market, income, and cost approach. The market approach uses information generated by market transactions involving identical or comparable assets or liabilities; the income approach converts estimated future amounts to a present value; the cost approach is based on the amount that currently would be required to replace an asset.
Inputs used in determining fair value are characterized according to a hierarchy that prioritizes those inputs based on the degree to which they are observable. The three input levels of the fair value hierarchy are as follows:
| • | Level 1 – Inputs represent quoted prices in active markets for identical assets or liabilities, such as exchange-traded commodity derivatives. |
| • | Level 2 – Inputs other than quoted prices included within Level 1 that are observable for the asset or liability, either directly or indirectly, such as quoted market prices for similar assets or liabilities in active markets or other market corroborated inputs. |
| • | Level 3 – Inputs that are not observable from objective sources, such as forward prices supported by little or no market activity or internally developed estimates of future cash flows used in a present value model. |
In determining fair value, the Company utilizes the most observable inputs available. If a fair value measurement reflects inputs at multiple levels within the hierarchy, the fair value measurement is characterized based on the lowest level of input that is significant to the fair value measurement.
The carrying amount of cash and cash equivalents, accounts receivable and accounts payable reported on the Consolidated Balance Sheet approximates fair value. The fair value of long-term debt is disclosed in Note 13. Fair value information related to pension plan assets is included in Note 21. Recurring fair value measurements are performed for risk management assets and liabilities and for share units issued as part of the Split Transaction, as discussed in Notes 16 and 22.
Certain non-financial assets and liabilities are initially measured at fair value, such as asset retirement obligations and assets and liabilities acquired in business combinations or certain non-monetary exchange transactions.
W) RISK MANAGEMENT ASSETS AND LIABILITIES
Risk management assets and liabilities are derivative financial instruments used by Encana to manage economic exposure to market risks relating to commodity prices, foreign currency exchange rates and interest rates. The use of these derivative instruments is governed under formal policies and is subject to limits established by the Board of Directors (“Board”). The Company’s policy is not to utilize derivative financial instruments for speculative purposes.
Derivative instruments that do not qualify for the normal purchases and sales exemption are measured at fair value with changes in fair value recognized in net earnings. The fair values recorded in the Consolidated Balance Sheet reflect netting the asset and liability positions where counterparty master netting arrangements contain provisions for net settlement. Realized gains or losses from financial derivatives related to natural gas and oil commodity prices are recognized in revenues as the contracts are settled. Realized gains or losses from financial derivatives related to power commodity prices are recognized in transportation and processing expense as the related power contracts are settled. Unrealized gains and losses are recognized in revenues and transportation and processing expense accordingly, at the end of each respective reporting period based on the changes in fair value of the contracts.
X) COMMITMENTS AND CONTINGENCIES
Liabilities for loss contingencies arising from claims, assessments, litigation, environmental and other sources are recorded when it is probable that a liability has been incurred and the amount can be reasonably estimated. These accruals are adjusted as additional information becomes available or circumstances change.
60 Encana Corporation | Annual Report 2014
Y) RECENT ACCOUNTING PRONOUNCEMENTS
CHANGES IN ACCOUNTING POLICIES AND PRACTICES
On January 1, 2014, Encana adopted the following Accounting Standards Updates (“ASU”) issued by the Financial Accounting Standards Board (“FASB”), which have not had a material impact on the Company’s Consolidated Financial Statements:
| • | ASU 2013-04, “Obligations Resulting from Joint and Several Liability Arrangements for Which the Total Amount of the Obligation is Fixed at the Reporting Date”, clarifies guidance for the recognition, measurement and disclosure of liabilities resulting from joint and several liability arrangements. The amendments have been applied retrospectively. |
| • | ASU 2013-05, “Parent’s Accounting for the Cumulative Translation Adjustment upon Derecognition of Certain Subsidiaries or Groups of Assets within a Foreign Entity or of an Investment in a Foreign Entity”, clarifies the applicable guidance for certain transactions that result in the release of the cumulative translation adjustment into net earnings. The amendments have been applied prospectively. |
| • | ASU 2013-11, “Presentation of an Unrecognized Tax Benefit When a Net Operating Loss Carryforward, a Similar Tax Loss, or a Tax Credit Carryforward Exists”, clarifies that a liability related to an unrecognized tax benefit or portions thereof should be presented as a reduction to a deferred tax asset for a net operating loss carryforward, a similar tax loss or a tax credit carryforward, except under specific situations. The amendments have been applied prospectively. |
NEW STANDARDS ISSUED NOT YET ADOPTED
| • | As of January 1, 2015, Encana will be required to adopt ASU 2014-08, “Reporting Discontinued Operations and Disclosures of Disposals of Components of an Entity”, which amends the criteria and expands the disclosures for reporting discontinued operations. Under the new criteria, only disposals representing a strategic shift in operations would qualify as a discontinued operation. The amendments will be applied prospectively and are not expected to have a material impact on the Company’s Consolidated Financial Statements. |
| • | As of January 1, 2016, Encana will be required to adopt ASU 2014-12, “Compensation – Stock Compensation: Accounting for Share-Based Payments When the Terms of an Award Provide That a Performance Target Could Be Achieved after the Requisite Service Period”. The standard requires that a performance target that affects vesting and could be achieved after the requisite service period be treated as a performance condition. The amendments will be applied prospectively and are not expected to have a material impact on the Company’s Consolidated Financial Statements. |
| • | As of January 1, 2017, Encana will be required to adopt ASU 2014-09, “Revenue from Contracts with Customers” under Topic 606, which was the result of a joint project by the FASB and International Accounting Standards Board. The new standard replaces Topic 605, “Revenue Recognition”, and other industry-specific guidance in the Accounting Standards Codification. The new standard is based on the principle that revenue is recognized on the transfer of promised goods or services to customers in an amount that reflects the consideration the Company expects to be entitled to in exchange for those goods or services. The standard can be applied using either the full retrospective approach or a modified retrospective approach at the date of adoption. Encana is currently assessing the potential impact of the standard on the Company’s Consolidated Financial Statements. |
2. SEGMENTED INFORMATION
Encana’s reportable segments are determined based on the Company’s operations and geographic locations as follows:
| • | Canadian Operations includes the exploration for, development of, and production of natural gas, oil and NGLs and other related activities within the Canadian cost centre. |
| • | USA Operations includes the exploration for, development of, and production of natural gas, oil and NGLs and other related activities within the U.S. cost centre. |
| • | Market Optimization is primarily responsible for the sale of the Company’s proprietary production. These results are included in the Canadian and USA Operations. Market optimization activities include third party purchases and sales of product to provide operational flexibility for transportation commitments, product type, delivery points and customer diversification. These activities are reflected in the Market Optimization segment. Market Optimization sells substantially all of the Company’s upstream production to third party customers. Transactions between segments are based on market values and are eliminated on consolidation. |
Corporate and Other mainly includes unrealized gains or losses recorded on derivative financial instruments. Once the instruments are settled, the realized gains and losses are recorded in the reporting segment to which the derivative instruments relate.
Annual Report 2014 | Encana Corporation 61
RESULTS OF OPERATIONS
SEGMENT AND GEOGRAPHIC INFORMATION
| Canadian Operations | USA Operations | Market Optimization | ||||||||||||||||||||||||||||||||||
| For the years ended December 31 |
2014 | 2013 | 2012 | 2014 | 2013 | 2012 | 2014 | 2013 | 2012 | |||||||||||||||||||||||||||
| Revenues, Net of Royalties |
$ | 3,310 | $ | 2,824 | $ | 2,760 | $ | 2,902 | $ | 2,763 | $ | 3,365 | $ | 1,248 | $ | 512 | $ | 419 | ||||||||||||||||||
| Expenses |
||||||||||||||||||||||||||||||||||||
| Production and mineral taxes |
15 | 15 | 9 | 118 | 119 | 96 | — | — | — | |||||||||||||||||||||||||||
| Transportation and processing |
835 | 756 | 555 | 658 | 722 | 652 | — | — | — | |||||||||||||||||||||||||||
| Operating |
314 | 372 | 352 | 354 | 411 | 377 | 39 | 38 | 48 | |||||||||||||||||||||||||||
| Purchased product |
— | — | — | — | — | — | 1,191 | 441 | 349 | |||||||||||||||||||||||||||
|
|
|
|
|
|
|
|
|
|
|
|
|
|
|
|
|
|
|
|||||||||||||||||||
| 2,146 | 1,681 | 1,844 | 1,772 | 1,511 | 2,240 | 18 | 33 | 22 | ||||||||||||||||||||||||||||
| Depreciation, depletion and amortization |
625 | 601 | 748 | 992 | 818 | 1,102 | 4 | 12 | 12 | |||||||||||||||||||||||||||
| Impairments |
— | — | 1,822 | — | — | 2,842 | — | — | — | |||||||||||||||||||||||||||
|
|
|
|
|
|
|
|
|
|
|
|
|
|
|
|
|
|
|
|||||||||||||||||||
| $ | 1,521 | $ | 1,080 | $ | (726 | ) | $ | 780 | $ | 693 | $ | (1,704 | ) | $ | 14 | $ | 21 | $ | 10 | |||||||||||||||||
|
|
|
|
|
|
|
|
|
|
|
|
|
|
|
|
|
|
|
|||||||||||||||||||
| Corporate & Other | Consolidated | |||||||||||||||||||||||
| 2014 | 2013 | 2012 | 2014 | 2013 | 2012 | |||||||||||||||||||
| Revenues, Net of Royalties |
$ | 559 | $ | (241 | ) | $ | (1,384 | ) | $ | 8,019 | $ | 5,858 | $ | 5,160 | ||||||||||
| Expenses |
||||||||||||||||||||||||
| Production and mineral taxes |
— | — | — | 133 | 134 | 105 | ||||||||||||||||||
| Transportation and processing |
12 | (2 | ) | 24 | 1,505 | 1,476 | 1,231 | |||||||||||||||||
| Operating |
28 | 38 | 17 | 735 | 859 | 794 | ||||||||||||||||||
| Purchased product |
— | — | — | 1,191 | 441 | 349 | ||||||||||||||||||
|
|
|
|
|
|
|
|
|
|
|
|
|
|||||||||||||
| 519 | (277 | ) | (1,425 | ) | 4,455 | 2,948 | 2,681 | |||||||||||||||||
| Depreciation, depletion and amortization |
124 | 134 | 94 | 1,745 | 1,565 | 1,956 | ||||||||||||||||||
| Impairments |
— | 21 | 31 | — | 21 | 4,695 | ||||||||||||||||||
|
|
|
|
|
|
|
|
|
|
|
|
|
|||||||||||||
| $ | 395 | $ | (432 | ) | $ | (1,550 | ) | 2,710 | 1,362 | (3,970 | ) | |||||||||||||
|
|
|
|
|
|
|
|
|
|
|
|
|
|||||||||||||
| Accretion of asset retirement obligation |
52 | 53 | 53 | |||||||||||||||||||||
| Administrative |
327 | 439 | 392 | |||||||||||||||||||||
| Interest |
654 | 563 | 522 | |||||||||||||||||||||
| Foreign exchange (gain) loss, net |
403 | 325 | (107 | ) | ||||||||||||||||||||
| (Gain) loss on divestitures |
(3,426 | ) | (7 | ) | — | |||||||||||||||||||
| Other |
71 | 1 | 1 | |||||||||||||||||||||
|
|
|
|
|
|
|
|
|
|
|
|
|
|||||||||||||
| (1,919 | ) | 1,374 | 861 | |||||||||||||||||||||
|
|
|
|
|
|
|
|
|
|
|
|
|
|||||||||||||
| Net Earnings (Loss) Before Income Tax |
4,629 | (12 | ) | (4,831 | ) | |||||||||||||||||||
| Income tax expense (recovery) |
1,203 | (248 | ) | (2,037 | ) | |||||||||||||||||||
|
|
|
|
|
|
|
|
|
|
|
|
|
|||||||||||||
| Net Earnings (Loss) |
3,426 | 236 | (2,794 | ) | ||||||||||||||||||||
| Net earnings attributable to noncontrolling interest |
(34 | ) | — | — | ||||||||||||||||||||
|
|
|
|
|
|
|
|
|
|
|
|
|
|||||||||||||
| Net Earnings (Loss) Attributable to Common Shareholders |
$ | 3,392 | $ | 236 | $ | (2,794 | ) | |||||||||||||||||
|
|
|
|
|
|
|
|
|
|
|
|
|
|||||||||||||
62 Encana Corporation | Annual Report 2014
RESULTS OF OPERATIONS
INTERSEGMENT INFORMATION
| Market Optimization | ||||||||||||||||||||||||||||||||||||
| Marketing Sales | Upstream Eliminations | Total | ||||||||||||||||||||||||||||||||||
| For the years ended December 31 |
2014 | 2013 | 2012 | 2014 | 2013 | 2012 | 2014 | 2013 | 2012 | |||||||||||||||||||||||||||
| Revenues, Net of Royalties |
$ | 7,371 | $ | 5,662 | $ | 4,260 | $ | (6,123 | ) | $ | (5,150 | ) | $ | (3,841 | ) | $ | 1,248 | $ | 512 | $ | 419 | |||||||||||||||
| Expenses |
||||||||||||||||||||||||||||||||||||
| Transportation and processing |
458 | 516 | 528 | (458 | ) | (516 | ) | (528 | ) | — | — | — | ||||||||||||||||||||||||
| Operating |
62 | 75 | 84 | (23 | ) | (37 | ) | (36 | ) | 39 | 38 | 48 | ||||||||||||||||||||||||
| Purchased product |
6,822 | 4,993 | 3,593 | (5,631 | ) | (4,552 | ) | (3,244 | ) | 1,191 | 441 | 349 | ||||||||||||||||||||||||
|
|
|
|
|
|
|
|
|
|
|
|
|
|
|
|
|
|
|
|||||||||||||||||||
| Operating Cash Flow |
$ | 29 | $ | 78 | $ | 55 | $ | (11 | ) | $ | (45 | ) | $ | (33 | ) | $ | 18 | $ | 33 | $ | 22 | |||||||||||||||
|
|
|
|
|
|
|
|
|
|
|
|
|
|
|
|
|
|
|
|||||||||||||||||||
CAPITAL EXPENDITURES
| For the years ended December 31 |
2014 | 2013 | 2012 | |||||||||
| Canadian Operations |
$ | 1,226 | $ | 1,365 | $ | 1,567 | ||||||
| USA Operations |
1,285 | 1,283 | 1,727 | |||||||||
| Market Optimization |
— | 3 | 7 | |||||||||
| Corporate & Other |
15 | 61 | 175 | |||||||||
|
|
|
|
|
|
|
|||||||
| $ | 2,526 | $ | 2,712 | $ | 3,476 | |||||||
|
|
|
|
|
|
|
|||||||
GOODWILL, PROPERTY, PLANT AND EQUIPMENT AND TOTAL ASSETS BY SEGMENT
| Goodwill | Property, Plant and Equipment | Total Assets | ||||||||||||||||||||||
| As at December 31 |
2014 | 2013 | 2014 | 2013 | 2014 | 2013 | ||||||||||||||||||
| Canadian Operations |
$ | 788 | $ | 1,171 | $ | 2,338 | $ | 2,728 | $ | 3,632 | $ | 4,452 | ||||||||||||
| USA Operations |
2,129 | 473 | 13,817 | 5,127 | 16,800 | 6,350 | ||||||||||||||||||
| Market Optimization |
— | — | 1 | 91 | 181 | 161 | ||||||||||||||||||
| Corporate & Other |
— | — | 1,859 | 2,089 | 4,008 | 6,685 | ||||||||||||||||||
|
|
|
|
|
|
|
|
|
|
|
|
|
|||||||||||||
| $ | 2,917 | $ | 1,644 | $ | 18,015 | $ | 10,035 | $ | 24,621 | $ | 17,648 | |||||||||||||
|
|
|
|
|
|
|
|
|
|
|
|
|
|||||||||||||
GOODWILL, PROPERTY, PLANT AND EQUIPMENT AND TOTAL ASSETS BY GEOGRAPHIC REGION
| Goodwill | Property, Plant and Equipment | Total Assets | ||||||||||||||||||||||
| As at December 31 |
2014 | 2013 | 2014 | 2013 | 2014 | 2013 | ||||||||||||||||||
| Canada |
$ | 788 | $ | 1,171 | $ | 4,070 | $ | 4,772 | $ | 7,336 | $ | 10,434 | ||||||||||||
| United States |
2,129 | 473 | 13,945 | 5,263 | 17,273 | 6,996 | ||||||||||||||||||
| Other Countries |
— | — | — | — | 12 | 218 | ||||||||||||||||||
|
|
|
|
|
|
|
|
|
|
|
|
|
|||||||||||||
| $ | 2,917 | $ | 1,644 | $ | 18,015 | $ | 10,035 | $ | 24,621 | $ | 17,648 | |||||||||||||
|
|
|
|
|
|
|
|
|
|
|
|
|
|||||||||||||
EXPORT SALES
Sales of natural gas and liquids produced or purchased in Canada delivered to customers outside of Canada were $338 million (2013 – $243 million; 2012 – $177 million).
MAJOR CUSTOMERS
In connection with the marketing and sale of Encana’s own and purchased natural gas and liquids for the year ended December 31, 2014, the Company had one customer which individually accounted for more than 10 percent of Encana’s consolidated revenues, net of royalties. Sales to this customer, which has an investment grade credit rating, were approximately $1,043 million which comprised $634 million in Canada and $409 million in the United States (2013 – one customer with sales of approximately $815 million; 2012 – two customers with sales of approximately $661 million and $534 million).
Annual Report 2014 | Encana Corporation 63
3. BUSINESS COMBINATIONS
ATHLON ENERGY INC. ACQUISITION
On November 13, 2014, Encana completed the acquisition of all of the issued and outstanding shares of common stock of Athlon Energy Inc. (“Athlon”) for $5.93 billion, or $58.50 per share. In addition, Encana assumed Athlon’s $1.15 billion senior notes and repaid and terminated Athlon’s credit facility with indebtedness outstanding of $335 million. Encana funded the acquisition of Athlon with cash on hand. Transaction costs of approximately $31 million are included in other expenses. Following completion of the acquisition, Athlon’s $1.15 billion senior notes were redeemed in accordance with the provisions of the governing indentures (See Note 13). Athlon’s operations focused on the acquisition and development of oil and gas properties located in the Permian Basin in Texas.
The transaction was accounted for under the acquisition method, which requires that the assets acquired and liabilities assumed be recognized at their fair values as of the acquisition date. The preliminary purchase price allocation, representing consideration paid and the fair values of the assets acquired and liabilities assumed as of the acquisition date, is shown in the table below.
| Preliminary Purchase Price Allocation |
||||
| Assets Acquired: |
||||
| Cash |
$ | 2 | ||
| Accounts receivable and other current assets |
133 | |||
| Risk management |
80 | |||
| Proved properties |
2,124 | |||
| Unproved properties |
5,338 | |||
| Other property, plant and equipment |
2 | |||
| Other assets |
2 | |||
| Goodwill |
1,724 | |||
| Liabilities Assumed: |
||||
| Accounts payable and accrued liabilities |
(195 | ) | ||
| Long-term debt, including revolving credit facility |
(1,497 | ) | ||
| Asset retirement obligation |
(25 | ) | ||
| Deferred income taxes |
(1,724 | ) | ||
|
|
|
|||
| Total Purchase Price (1) |
$ | 5,964 | ||
|
|
|
|||
| (1) | The purchase price includes cash consideration paid for issued and outstanding shares of common stock of Athlon of $58.50 per share totaling $5.93 billion, as well as payments to terminate certain employment agreements with Athlon’s management and payments for certain other existing obligations of Athlon. |
The Company used the income approach valuation technique for the fair value of assets acquired and liabilities assumed. The carrying amounts of cash, accounts receivable and other current assets, and accounts payable and accrued liabilities approximate their fair values due to the short-term maturity of the instruments. The fair values of the risk management assets and long-term debt, including the revolving credit facility, are categorized within Level 2 of the fair value hierarchy and were determined using quoted prices and rates from an available pricing source. The fair values of the proved and unproved properties, other property, plant and equipment, other assets, goodwill, and asset retirement obligation are categorized within Level 3 and were determined using relevant market assumptions, including discount rates, future commodity prices and costs, timing of development activities, projections of oil and gas reserves, and estimates to abandon and reclaim producing wells.
Goodwill arose primarily from the requirement to recognize deferred taxes on the difference between the fair value of the assets acquired and liabilities assumed and the respective carry-over tax basis. Goodwill is not amortized and is not deductible for tax purposes.
The results of operations attributable to the Athlon acquisition are included in the Company’s Consolidated Statement of Earnings beginning November 13, 2014. The assets acquired generated revenues of $176 million and a net loss of $3 million for the period from November 13, 2014 to December 31, 2014.
64 Encana Corporation | Annual Report 2014
EAGLE FORD ACQUISITION
On June 20, 2014, Encana completed the acquisition of approximately 45,500 net acres located in the Eagle Ford shale formation from Freeport-McMoRan Oil & Gas LLC and PXP Producing Company LLC for approximately $2.9 billion, after closing adjustments. The acquisition included an interest in certain producing properties and undeveloped lands in the Karnes, Wilson and Atascosa counties of south Texas. Encana funded the acquisition with cash on hand. Transaction costs of approximately $9 million are included in other expenses.
The transaction was accounted for under the acquisition method. The final purchase price allocation, representing consideration paid and the fair values of the assets acquired and liabilities assumed as of the acquisition date, is shown in the table below. Based on the allocation of the consideration paid, no goodwill was recognized.
| Final Purchase Price Allocation |
||||
| Assets Acquired: |
||||
| Inventory |
$ | 4 | ||
| Proved properties |
2,873 | |||
| Unproved properties |
78 | |||
| Liabilities Assumed: |
||||
| Asset retirement obligation |
(32 | ) | ||
|
|
|
|||
| Total Purchase Price |
$ | 2,923 | ||
|
|
|
|||
The Company used the income approach valuation technique. The fair values of the assets acquired and liabilities assumed are categorized within Level 3 of the fair value hierarchy. The fair values of the assets acquired and liabilities assumed were determined using relevant market assumptions, including future commodity prices and costs, timing of development activities, projections of oil and gas reserves, and estimates to abandon and reclaim producing wells.
The results of operations attributable to the Eagle Ford assets are included in the Company’s Consolidated Statement of Earnings beginning June 20, 2014. The assets acquired generated revenues of $585 million and net earnings of $222 million for the period from June 20, 2014 to December 31, 2014.
UNAUDITED PRO FORMA FINANCIAL INFORMATION
The following unaudited pro forma financial information has been prepared assuming the Athlon and Eagle Ford acquisitions occurred on January 1, 2013. The pro forma information is not intended to reflect the actual results of operations that would have occurred if the business combinations had been completed at the dates indicated. In addition, the pro forma information does not project Encana’s results of operations for any future period.
| Athlon | Eagle Ford | |||||||||||||||
| For the years ended December 31 ($ millions, except per share amounts) |
2014 | 2013 | 2014 | 2013 | ||||||||||||
| Revenues, Net of Royalties |
$ | 8,572 | $ | 6,139 | $ | 8,760 | $ | 7,189 | ||||||||
| Net Earnings Attributable to Common Shareholders |
$ | 3,486 | $ | 158 | $ | 3,641 | $ | 741 | ||||||||
| Net Earnings per Common Share |
||||||||||||||||
| Basic & Diluted |
$ | 4.71 | $ | 0.21 | $ | 4.91 | $ | 1.01 | ||||||||
Annual Report 2014 | Encana Corporation 65
4. ACQUISITIONS AND DIVESTITURES
| For the years ended December 31 |
2014 | 2013 | 2012 | |||||||||
| Acquisitions |
||||||||||||
| Canadian Operations |
$ | 21 | $ | 28 | $ | 139 | ||||||
| USA Operations |
2,995 | 156 | 240 | |||||||||
|
|
|
|
|
|
|
|||||||
| Total Acquisitions |
3,016 | 184 | 379 | |||||||||
|
|
|
|
|
|
|
|||||||
| Divestitures |
||||||||||||
| Canadian Operations |
(1,847 | ) | (685 | ) | (3,770 | ) | ||||||
| USA Operations |
(2,264 | ) | (18 | ) | (271 | ) | ||||||
| Market Optimization |
(205 | ) | — | — | ||||||||
| Corporate & Other |
(29 | ) | (2 | ) | (2 | ) | ||||||
|
|
|
|
|
|
|
|||||||
| Total Divestitures |
(4,345 | ) | (705 | ) | (4,043 | ) | ||||||
|
|
|
|
|
|
|
|||||||
| Net Acquisitions & (Divestitures) |
$ | (1,329 | ) | $ | (521 | ) | $ | (3,664 | ) | |||
|
|
|
|
|
|
|
|||||||
ACQUISITIONS
For the year ended December 31, 2014, acquisitions totaled $3,016 million (2013 – $184 million; 2012 – $379 million), which primarily included the purchase of certain properties in the Eagle Ford shale formation in south Texas as described in Note 3.
DIVESTITURES
For the year ended December 31, 2014, amounts received on the sale of assets were $4,345 million (2013 – $705 million; 2012 – $4,043 million). In 2014, divestitures were $1,847 million in the Canadian Operations and $2,264 million in the USA Operations.
Amounts received from the divestiture transactions have been deducted from the respective Canadian and U.S. full cost pools, except for divestitures that result in a significant alteration between capitalized costs and proved reserves in the respective country cost centre. For divestitures that result in a gain or loss and constitute a business, goodwill is allocated to the divestiture.
The Canadian Operations and USA Operations divestitures included the following transactions:
CANADIAN OPERATIONS
In 2014, divestitures in the Canadian Operations primarily included the sale of the Company’s Bighorn assets in west central Alberta for approximately $1,725 million. For the year ended December 31, 2014, Encana recognized a gain of approximately $1,014 million, before tax, on the sale of the Company’s Bighorn assets in the Canadian cost centre and allocated goodwill of $257 million.
In 2013, divestitures in the Canadian Operations included the sale of the Company’s Jean Marie natural gas assets in northeast British Columbia and other assets.
In 2012, Encana entered into a partnership agreement with a Mitsubishi Corporation subsidiary (“Mitsubishi”) to jointly develop certain lands in northeast British Columbia. Under the agreement, Encana owns 60 percent and Mitsubishi owns 40 percent of the partnership. Mitsubishi agreed to invest approximately C$2.9 billion for its partnership interest, with C$1.45 billion received in February 2012. Mitsubishi agreed to invest the remaining amount of approximately C$1.45 billion, in addition to its 40 percent of the partnership’s future capital investment, based on the expected five year development plan, thereby reducing Encana’s capital funding commitment to 30 percent of the total expected capital investment.
In 2012, the Company entered into an agreement with a PetroChina Company Limited subsidiary (“PetroChina”) to jointly explore and develop certain liquids rich natural gas Duvernay lands in Alberta. PetroChina agreed to invest approximately C$2.18 billion for a 49.9 percent working interest in the lands. PetroChina invested C$1.18 billion in December 2012 and agreed to further invest approximately C$1.0 billion, which will be used to fund half of Encana’s capital funding commitment over an expected commitment period which expires in 2020.
In 2012, Encana entered into an agreement with a Toyota Tsusho Corporation subsidiary (“Toyota Tsusho”) under which Toyota Tsusho agreed to invest approximately C$600 million to acquire a 32.5 percent gross overriding royalty interest in natural gas production from a portion of Encana’s Clearwater play. Toyota Tsusho invested C$100 million in April 2012 and agreed to further invest approximately C$500 million over an expected commitment period of approximately seven years, which runs through to 2019.
In 2012, the Company also closed the sale of two natural gas processing plants in British Columbia and Alberta for proceeds of approximately C$920 million.
66 Encana Corporation | Annual Report 2014
USA OPERATIONS
In 2014, divestitures in the USA Operations primarily included the sale of the Jonah properties for proceeds of approximately $1,636 million and the sale of certain properties in East Texas for proceeds of approximately $495 million. For the year ended December 31, 2014, Encana recognized a gain of approximately $209 million, before tax, on the sale of the Jonah properties in the U.S. cost centre and allocated goodwill of $68 million.
OTHER CAPITAL TRANSACTIONS
The following transactions involve the acquisition or disposition of common shares and, therefore, are excluded from the acquisitions and divestitures table above.
ACQUISITION OF ATHLON
On November 13, 2014, Encana acquired all of the issued and outstanding shares of common stock of Athlon for $5.93 billion, or $58.50 per share. See Note 3 for further details regarding the Athlon transaction.
DIVESTITURE OF INVESTMENT IN PRAIRIESKY
On September 26, 2014, Encana completed the secondary offering of 70.2 million common shares of PrairieSky at a price of C$36.50 per common share for aggregate gross proceeds of approximately C$2.6 billion. As the sale of the investment in PrairieSky resulted in a significant alteration between capitalized costs and proved reserves in the Canadian cost centre, Encana recognized a gain on divestiture of approximately $2.1 billion, before tax.
See Note 18 for further details regarding the PrairieSky transactions.
5. INTEREST
| For the years ended December 31 |
2014 | 2013 | 2012 | |||||||||
| Interest Expense on: |
||||||||||||
| Debt |
$ | 509 | $ | 460 | $ | 474 | ||||||
| The Bow office building |
75 | 76 | 16 | |||||||||
| Capital leases |
37 | 9 | 2 | |||||||||
| Other |
33 | 18 | 30 | |||||||||
|
|
|
|
|
|
|
|||||||
| $ | 654 | $ | 563 | $ | 522 | |||||||
|
|
|
|
|
|
|
|||||||
Interest on Debt for the year ended December 31, 2014 includes a one-time outlay of approximately $125 million associated with the early redemption of senior notes assumed in conjunction with the Athlon acquisition (See Note 13).
Interest on Capital leases and Other were previously reported together in 2013 and 2012.
6. FOREIGN EXCHANGE (GAIN) LOSS, NET
| For the years ended December 31 |
2014 | 2013 | 2012 | |||||||||
| Unrealized Foreign Exchange (Gain) Loss on: |
||||||||||||
| Translation of U.S. dollar debt issued from Canada |
$ | 456 | $ | 349 | $ | (131 | ) | |||||
| Translation of U.S. dollar risk management contracts issued from Canada |
(16 | ) | (19 | ) | 19 | |||||||
|
|
|
|
|
|
|
|||||||
| 440 | 330 | (112 | ) | |||||||||
| Foreign Exchange on Intercompany Transactions |
28 | — | 4 | |||||||||
| Other Monetary Revaluations and Settlements |
(65 | ) | (5 | ) | 1 | |||||||
|
|
|
|
|
|
|
|||||||
| $ | 403 | $ | 325 | $ | (107 | ) | ||||||
|
|
|
|
|
|
|
|||||||
Annual Report 2014 | Encana Corporation 67
7. INCOME TAXES
The provision for income taxes is as follows:
| For the years ended December 31 |
2014 | 2013 | 2012 | |||||||||
| Current Tax |
||||||||||||
| Canada |
$ | 249 | $ | (152 | ) | $ | (219 | ) | ||||
| United States |
(21 | ) | (64 | ) | (25 | ) | ||||||
| Other Countries |
15 | 25 | 44 | |||||||||
|
|
|
|
|
|
|
|||||||
| Total Current Tax Expense (Recovery) |
243 | (191 | ) | (200 | ) | |||||||
|
|
|
|
|
|
|
|||||||
| Deferred Tax |
||||||||||||
| Canada |
713 | (106 | ) | (902 | ) | |||||||
| United States |
246 | 52 | (935 | ) | ||||||||
| Other Countries |
1 | (3 | ) | — | ||||||||
|
|
|
|
|
|
|
|||||||
| Total Deferred Tax Expense (Recovery) |
960 | (57 | ) | (1,837 | ) | |||||||
|
|
|
|
|
|
|
|||||||
| Income Tax Expense (Recovery) |
$ | 1,203 | $ | (248 | ) | $ | (2,037 | ) | ||||
|
|
|
|
|
|
|
|||||||
The following table reconciles income taxes calculated at the Canadian statutory rate with the actual income taxes:
| For the years ended December 31 |
2014 | 2013 | 2012 | |||||||||
| Net Earnings (Loss) Before Income Tax |
||||||||||||
| Canada |
$ | 3,744 | $ | (316 | ) | $ | (2,246 | ) | ||||
| United States |
665 | 46 | (2,978 | ) | ||||||||
| Other Countries |
220 | 258 | 393 | |||||||||
|
|
|
|
|
|
|
|||||||
| Total Net Earnings (Loss) Before Income Tax |
4,629 | (12 | ) | (4,831 | ) | |||||||
| Canadian Statutory Rate |
25.7 | % | 25.1 | % | 25.0 | % | ||||||
|
|
|
|
|
|
|
|||||||
| Expected Income Tax |
1,190 | (3 | ) | (1,208 | ) | |||||||
| Effect on Taxes Resulting From: |
||||||||||||
| Statutory rate and other foreign differences |
7 | (42 | ) | (412 | ) | |||||||
| Effect of legislative changes |
— | (70 | ) | — | ||||||||
| Non-taxable capital (gains) losses |
64 | 48 | (16 | ) | ||||||||
| Tax differences on divestitures and transactions |
8 | (28 | ) | (307 | ) | |||||||
| Partnership tax allocations in excess of funding |
(53 | ) | (41 | ) | (40 | ) | ||||||
| Amounts in respect of prior periods |
(19 | ) | (103 | ) | (64 | ) | ||||||
| Other |
6 | (9 | ) | 10 | ||||||||
|
|
|
|
|
|
|
|||||||
| $ | 1,203 | $ | (248 | ) | $ | (2,037 | ) | |||||
|
|
|
|
|
|
|
|||||||
| Effective Tax Rate |
26.0 | % | 2,066.7 | % | 42.2 | % | ||||||
|
|
|
|
|
|
|
|||||||
Statutory rate and other foreign differences above include statutory and other rate differences and international financing, which were previously reported separately in 2012.
68 Encana Corporation | Annual Report 2014
The net deferred income tax asset (liability) consists of:
| As at December 31 |
2014 | 2013 | ||||||
| Deferred Income Tax Assets |
||||||||
| Property, plant and equipment |
$ | 217 | $ | 786 | ||||
| Compensation plans |
91 | 109 | ||||||
| Accrued and unpaid expense |
59 | 61 | ||||||
| Non-capital and net capital losses carried forward |
492 | 429 | ||||||
| Alternative minimum tax and foreign tax credits |
205 | 199 | ||||||
| Less valuation allowance |
(12 | ) | (6 | ) | ||||
| Other |
72 | 95 | ||||||
| Deferred Income Tax Liabilities |
||||||||
| Property, plant and equipment |
(2,485 | ) | (407 | ) | ||||
| Risk management |
(226 | ) | (63 | ) | ||||
| Unrealized foreign exchange gains |
(48 | ) | (120 | ) | ||||
| Other |
(26 | ) | (29 | ) | ||||
|
|
|
|
|
|||||
| Net Deferred Income Tax Asset (Liability) |
$ | (1,661 | ) | $ | 1,054 | |||
|
|
|
|
|
|||||
The net deferred income tax asset (liability) is reflected in the Consolidated Balance Sheet as follows:
| As at December 31 |
2014 | 2013 | ||||||
| Current deferred income tax asset |
$ | — | $ | 118 | ||||
| Non-current deferred income tax asset |
296 | 939 | ||||||
| Current deferred income tax liability |
(128 | ) | (3 | ) | ||||
| Non-current deferred income tax liability |
(1,829 | ) | — | |||||
|
|
|
|
|
|||||
| Net Deferred Income Tax Asset (Liability) |
$ | (1,661 | ) | $ | 1,054 | |||
|
|
|
|
|
|||||
Tax pools, loss carryforwards, charitable donations and tax credits that can be utilized in future years are as follows:
| As at December 31 |
2014 | Expiration Date | ||||
| Canada |
||||||
| Tax pools |
$ | 2,188 | Indefinite | |||
| Net capital losses |
1 | Indefinite | ||||
| Non-capital losses |
58 | 2027 - 2034 | ||||
| United States |
||||||
| Tax basis |
$ | 6,769 | Indefinite | |||
| Non-capital losses |
1,306 | 2031 - 2034 | ||||
| Charitable donations |
9 | 2018 - 2019 | ||||
| Alternative minimum tax credits |
34 | Indefinite | ||||
| Foreign tax credits (net of valuation allowance) |
159 | 2021 - 2024 | ||||
As at December 31, 2014, approximately $2.6 billion of Encana’s unremitted earnings from its foreign subsidiaries were considered to be permanently reinvested outside of Canada and, accordingly, Encana has not recognized a deferred tax liability for Canadian income taxes in respect of such earnings. If such earnings were to be remitted to Canada, Encana may be subject to Canadian income taxes and foreign withholding taxes. However, determination of any potential amount of unrecognized deferred income tax liabilities is not practicable.
The following table presents changes in the balance of Encana’s unrecognized tax benefits excluding interest:
Annual Report 2014 | Encana Corporation 69
| For the years ended December 31 |
2014 | 2013 | ||||||
| Balance, Beginning of Year |
$ | (119 | ) | $ | (164 | ) | ||
| Additions for tax positions taken in the current year |
(289 | ) | — | |||||
| Additions for tax positions of prior years |
(1 | ) | — | |||||
| Reductions for tax positions of prior years |
2 | 2 | ||||||
| Lapse of statute of limitations |
— | 4 | ||||||
| Settlements |
2 | 29 | ||||||
| Foreign currency translation |
23 | 10 | ||||||
|
|
|
|
|
|||||
| Balance, End of Year |
$ | (382 | ) | $ | (119 | ) | ||
|
|
|
|
|
|||||
The unrecognized tax benefit is reflected in the Consolidated Balance Sheet as follows:
| For the years ended December 31 |
2014 | 2013 | ||||||
| Income tax receivable |
$ | (36 | ) | $ | — | |||
| Other liabilities and provisions (See Note 14) |
(279 | ) | (133 | ) | ||||
| Current deferred income tax liability |
1 | (2 | ) | |||||
| Non-current deferred income tax asset |
(68 | ) | 16 | |||||
|
|
|
|
|
|||||
| Balance, End of Year |
$ | (382 | ) | $ | (119 | ) | ||
|
|
|
|
|
|||||
If recognized, all of Encana’s unrecognized tax benefits as at December 31, 2014 would affect Encana’s effective income tax rate. Encana does not anticipate that the amount of unrecognized tax benefits will significantly change during the next 12 months.
Encana recognizes interest accrued in respect of unrecognized tax benefits in interest expense. During 2014, Encana recognized an expense of $1 million (2013 – recovery of $6 million; 2012 – recovery of $8 million) in interest expense. As at December 31, 2014, Encana had a liability of $2 million (2013 – $1 million) for interest accrued in respect of unrecognized tax benefits.
Included below is a summary of the tax years, by jurisdiction, that remain subject to examination by the taxation authorities.
| Jurisdiction |
Taxation Year | |
| Canada - Federal |
2006 - 2014 | |
| Canada - Provincial |
2006 - 2014 | |
| United States - Federal |
2011 - 2014 | |
| United States - State |
2010 - 2014 | |
| Other |
2013 - 2014 | |
Encana and its subsidiaries file income tax returns primarily in Canada and the United States. Issues in dispute for audited years and audits for subsequent years are ongoing and in various stages of completion.
8. ACCOUNTS RECEIVABLE AND ACCRUED REVENUES
| As at December 31 |
2014 | 2013 | ||||||
| Trade Receivables and Accrued Revenue |
$ | 1,223 | $ | 864 | ||||
| Prepaids |
60 | 53 | ||||||
| Deposits and Other |
30 | 77 | ||||||
|
|
|
|
|
|||||
| 1,313 | 994 | |||||||
| Allowance for Doubtful Accounts |
(6 | ) | (6 | ) | ||||
|
|
|
|
|
|||||
| $ | 1,307 | $ | 988 | |||||
|
|
|
|
|
|||||
Trade receivables are non-interest bearing. In determining the recoverability of trade receivables, the Company considers the age of the outstanding receivable and the credit worthiness of the counterparties. See Note 23 for further information about credit risk.
70 Encana Corporation | Annual Report 2014
9. PROPERTY, PLANT AND EQUIPMENT, NET
| As at December 31 |
2014 | 2013 | ||||||||||||||||||||||
| Cost | Accumulated DD&A (1) |
Net | Cost | Accumulated DD&A (1) |
Net | |||||||||||||||||||
| Canadian Operations |
||||||||||||||||||||||||
| Proved properties |
$ | 18,271 | $ | (16,566 | ) | $ | 1,705 | $ | 25,003 | $ | (23,012 | ) | $ | 1,991 | ||||||||||
| Unproved properties |
478 | — | 478 | 598 | — | 598 | ||||||||||||||||||
| Other |
155 | — | 155 | 139 | — | 139 | ||||||||||||||||||
|
|
|
|
|
|
|
|
|
|
|
|
|
|||||||||||||
| 18,904 | (16,566 | ) | 2,338 | 25,740 | (23,012 | ) | 2,728 | |||||||||||||||||
|
|
|
|
|
|
|
|
|
|
|
|
|
|||||||||||||
| USA Operations |
||||||||||||||||||||||||
| Proved properties |
24,279 | (16,260 | ) | 8,019 | 26,529 | (22,074 | ) | 4,455 | ||||||||||||||||
| Unproved properties |
5,655 | — | 5,655 | 470 | — | 470 | ||||||||||||||||||
| Other |
143 | — | 143 | 202 | — | 202 | ||||||||||||||||||
|
|
|
|
|
|
|
|
|
|
|
|
|
|||||||||||||
| 30,077 | (16,260 | ) | 13,817 | 27,201 | (22,074 | ) | 5,127 | |||||||||||||||||
|
|
|
|
|
|
|
|
|
|
|
|
|
|||||||||||||
| Market Optimization |
8 | (7 | ) | 1 | 223 | (132 | ) | 91 | ||||||||||||||||
| Corporate & Other |
2,470 | (611 | ) | 1,859 | 2,655 | (566 | ) | 2,089 | ||||||||||||||||
|
|
|
|
|
|
|
|
|
|
|
|
|
|||||||||||||
| $ | 51,459 | $ | (33,444 | ) | $ | 18,015 | $ | 55,819 | $ | (45,784 | ) | $ | 10,035 | |||||||||||
|
|
|
|
|
|
|
|
|
|
|
|
|
|||||||||||||
| (1) | Depreciation, depletion and amortization. |
Canadian Operations and USA Operations property, plant and equipment include internal costs directly related to exploration, development and construction activities of $306 million which have been capitalized during the year ended December 31, 2014 (2013 – $372 million). Included in Corporate and Other are $65 million (2013 – $71 million) of international property costs, which have been fully impaired.
For the year ended December 31, 2014, the Company recognized a ceiling test impairment of nil (2013 – nil; 2012 – $1,822 million) in the Canadian cost centre and nil (2013 – nil; 2012 – $2,842 million) in the U.S. cost centre. The impairments in 2012 resulted primarily from the decline in the 12-month average trailing natural gas prices which reduced proved reserves volumes and values.
The 12-month average trailing prices used in the ceiling test calculations reflect benchmark prices adjusted for basis differentials to determine local reference prices, transportation costs and tariffs, heat content and quality. The benchmark prices are disclosed in Note 26.
CAPITAL LEASE ARRANGEMENTS
The Company has several lease arrangements that are accounted for as capital leases, including an office building, equipment and an offshore production platform.
In December 2013, Encana commenced commercial operations at its Deep Panuke facility located offshore Nova Scotia following successful completion of the Production Field Centre (“PFC”) and issuance of the Production Acceptance Notice. As at December 31, 2014, Canadian Operations property, plant and equipment and total assets include the PFC, which is under a capital lease totaling $520 million (2013 – $536 million).
As at December 31, 2014, the total carrying value of assets under capital lease was $547 million (2013 – $683 million). Liabilities for the capital lease arrangements are included in other liabilities and provisions in the Consolidated Balance Sheet and are disclosed in Note 14.
OTHER ARRANGEMENT
As at December 31, 2014, Corporate and Other property, plant and equipment and total assets include a carrying value of $1,431 million (2013 – $1,587 million) related to The Bow office building, which is under a 25-year lease agreement. The Bow asset is being depreciated over the 60-year estimated life of the building. At the conclusion of the 25-year term, the remaining asset and corresponding liability are expected to be derecognized as disclosed in Note 14.
Annual Report 2014 | Encana Corporation 71
10. OTHER ASSETS
| As at December 31 |
2014 | 2013 | ||||||
| Deferred Charges and Debt Transaction Costs |
$ | 48 | $ | 58 | ||||
| Long-Term Receivables |
70 | 184 | ||||||
| Long-Term Investments and Other |
276 | 284 | ||||||
|
|
|
|
|
|||||
| $ | 394 | $ | 526 | |||||
|
|
|
|
|
|||||
11. GOODWILL
| As at December 31 |
2014 | 2013 | ||||||
| Canada |
$ | 788 | $ | 1,171 | ||||
| United States |
2,129 | 473 | ||||||
|
|
|
|
|
|||||
| $ | 2,917 | $ | 1,644 | |||||
|
|
|
|
|
|||||
During 2014, the Company recognized goodwill of $1,724 million in conjunction with the Athlon acquisition in the United States as described in Note 3. In Canada, the Company allocated goodwill of $257 million to the Bighorn divestiture and derecognized $39 million upon the divestiture of Encana’s investment in PrairieSky as described in Notes 4 and 18. In the United States, the Company allocated goodwill of $68 million to the Jonah divestiture as described in Note 4.
There were no additions or dispositions of goodwill during 2013 and the Company has not recognized any previous goodwill impairments. The change in the Canada goodwill balance also reflects the movements due to foreign currency translation.
Goodwill was assessed for impairment as at December 31, 2014 and December 31, 2013. The fair values of the Canada and United States reporting units were determined to be greater than the respective carrying values of the reporting units. Accordingly, no goodwill impairments were recognized.
12. ACCOUNTS PAYABLE AND ACCRUED LIABILITIES
| As at December 31 |
2014 | 2013 | ||||||
| Trade Payables |
$ | 428 | $ | 265 | ||||
| Capital Accruals |
729 | 398 | ||||||
| Royalty and Production Accruals |
495 | 473 | ||||||
| Other Accruals |
385 | 514 | ||||||
| Interest Payable |
100 | 111 | ||||||
| Outstanding Disbursements |
4 | 2 | ||||||
| Current Portion of Capital Lease Obligations (See Note 14) |
59 | 66 | ||||||
| Current Portion of Asset Retirement Obligation (See Note 15) |
43 | 66 | ||||||
|
|
|
|
|
|||||
| $ | 2,243 | $ | 1,895 | |||||
|
|
|
|
|
|||||
Payables and accruals are non-interest bearing. Interest payable represents amounts accrued related to Encana’s unsecured notes as disclosed in Note 13.
72 Encana Corporation | Annual Report 2014
13. LONG-TERM DEBT
| As at December 31 |
Note | C$ Principal Amount |
2014 | 2013 | ||||||||||||
| Canadian Dollar Denominated Debt |
||||||||||||||||
| Revolving credit and term loan borrowings |
A | $ | — | $ | — | $ | — | |||||||||
| Canadian Unsecured Notes: |
B | |||||||||||||||
| 5.80% due January 18, 2018 |
750 | 647 | 705 | |||||||||||||
|
|
|
|
|
|
|
|||||||||||
| $ | 750 | 647 | 705 | |||||||||||||
|
|
|
|
|
|
|
|||||||||||
| U.S. Dollar Denominated Debt |
||||||||||||||||
| Revolving credit and term loan borrowings |
A | 1,277 | — | |||||||||||||
| U.S. Unsecured Notes: |
B | |||||||||||||||
| 5.80% due May 1, 2014 |
— | 1,000 | ||||||||||||||
| 5.90% due December 1, 2017 |
700 | 700 | ||||||||||||||
| 6.50% due May 15, 2019 |
500 | 500 | ||||||||||||||
| 3.90% due November 15, 2021 |
600 | 600 | ||||||||||||||
| 8.125% due September 15, 2030 |
300 | 300 | ||||||||||||||
| 7.20% due November 1, 2031 |
350 | 350 | ||||||||||||||
| 7.375% due November 1, 2031 |
500 | 500 | ||||||||||||||
| 6.50% due August 15, 2034 |
750 | 750 | ||||||||||||||
| 6.625% due August 15, 2037 |
500 | 500 | ||||||||||||||
| 6.50% due February 1, 2038 |
800 | 800 | ||||||||||||||
| 5.15% due November 15, 2041 |
400 | 400 | ||||||||||||||
|
|
|
|
|
|
|
|||||||||||
| 6,677 | 6,400 | |||||||||||||||
|
|
|
|
|
|
|
|||||||||||
| Total Principal |
F | 7,324 | 7,105 | |||||||||||||
| Increase in Value of Debt Acquired |
C | 34 | 40 | |||||||||||||
| Debt Discounts |
D | (18 | ) | (21 | ) | |||||||||||
| Current Portion of Long-Term Debt |
E | — | (1,000 | ) | ||||||||||||
|
|
|
|
|
|
|
|||||||||||
| $ | 7,340 | $ | 6,124 | |||||||||||||
|
|
|
|
|
|
|
|||||||||||
Annual Report 2014 | Encana Corporation 73
A) REVOLVING CREDIT AND TERM LOAN BORROWINGS
CANADIAN REVOLVING CREDIT AND TERM LOAN BORROWINGS
At December 31, 2014, Encana had in place a committed revolving bank credit facility for C$3.5 billion ($3.0 billion), of which $1.7 billion remains unused. The facility, which matures in June 2018, is fully revolving up to maturity. The facility is extendible from time to time, but not more than once per year, for a period not longer than five years plus 90 days from the date of the extension request, at the option of the lenders and upon notice from Encana. The facility is unsecured and bears interest at the lenders’ rates for Canadian prime, U.S. base rate, Bankers’ Acceptances or LIBOR, plus applicable margins.
During 2014, the Company borrowed on its revolving credit facilities. Borrowings include LIBOR loans of $1,277 million maturing at various dates with a weighted average interest rate of 1.62 percent. These amounts are fully supported and Management expects that they will continue to be supported by revolving credit facilities that have no repayment requirements within the next year and which expire in 2018. There were no outstanding balances related to the Company’s commercial paper or revolving credit facilities as at December 31, 2013.
U.S. REVOLVING CREDIT AND TERM LOAN BORROWINGS
At December 31, 2014, one of Encana’s subsidiaries had in place a committed revolving bank credit facility for $1.0 billion, all of which remained unused. The facility, which matures in June 2018, is guaranteed by Encana Corporation and is fully revolving up to maturity. The facility is extendible from time to time, but not more than once per year, for a period not longer than five years plus 90 days from the date of the extension request, at the option of the lenders and upon notice from the subsidiary. This facility bears interest at either the lenders’ U.S. base rate or LIBOR, plus applicable margins.
Standby fees paid in 2014 relating to Canadian and U.S. revolving credit and term loan agreements were approximately $12 million (2013 – $14 million; 2012 – $15 million).
Encana is subject to certain financial covenants in its credit facility agreements and is in compliance with all financial covenants as at December 31, 2014.
B) UNSECURED NOTES
SHELF PROSPECTUS
Encana has in place a shelf prospectus, whereby the Company may issue from time to time up to $6.0 billion, or the equivalent in foreign currencies, of debt securities, common shares, preferred shares, subscription receipts, warrants and units in Canada and/or the U.S. The shelf prospectus was filed in June 2014 and expires in July 2016. At December 31, 2014, the $6.0 billion shelf prospectus remained accessible, the availability of which is dependent upon market conditions. This shelf prospectus replaced a $4.0 billion debt shelf prospectus for U.S. unsecured notes which expired in June 2014.
Unsecured notes include medium-term notes and senior notes that are issued from time to time under trust indentures and have equal priority with respect to the payment of both principal and interest.
U.S. UNSECURED NOTES
On February 28, 2014, Encana announced a cash tender offer and consent solicitation for any and all of the Company’s outstanding $1,000 million 5.80 percent notes with a maturity date of May 1, 2014. The Company paid $1,004.59 for each $1,000 principal amount of the notes plus accrued and unpaid interest up to, but not including, the settlement date and a consent payment equal to $2.50 per $1,000 principal amount of the notes.
On March 28, 2014, the tender offer and consent solicitation expired and on March 31, 2014, Encana paid the consenting note holders an aggregate of approximately $792 million in cash reflecting a $768 million principal debt repayment, $2 million for the consent payment and $22 million of accrued and unpaid interest.
On April 28, 2014, pursuant to the Notice of Redemption issued on March 28, 2014, the Company redeemed the remaining principal amount of the 5.80 percent notes not tendered in the tender offer. Encana paid approximately $239 million in cash reflecting a $232 million principal debt repayment and $7 million of accrued and unpaid interest.
On December 16, 2014, Encana completed the redemption of the $500 million 7.375 percent senior notes due April 15, 2021 and the $650 million 6.00 percent senior notes due May 1, 2022, which were assumed by Encana in conjunction with the Athlon acquisition as discussed in Note 3. The Company recognized a one-time outlay of approximately $125 million as a result of the early redemption. Encana used proceeds from the Company’s revolving credit facility of $1,277 million to redeem the senior notes.
C) INCREASE IN VALUE OF DEBT ACQUIRED
Certain of the notes and debentures of the Company were acquired in business combinations and were accounted for at their fair value at the dates of acquisition. The difference between the fair value and the principal amount of the debt is being amortized over the remaining life of the outstanding debt acquired, which is approximately 16 years.
In conjunction with the Athlon acquisition, the Company recorded an increase in the fair value of the debt acquired of approximately $12 million, which was expensed upon redemption of the senior notes and is included in other expenses in the Company’s Consolidated Statement of Earnings.
74 Encana Corporation | Annual Report 2014
D) DEBT DISCOUNTS
Long-term debt premiums and discounts are capitalized within long-term debt and are being amortized using the effective interest method. During 2014 and 2013, no debt discounts were capitalized.
E) CURRENT PORTION OF LONG-TERM DEBT
| As at December 31 |
C$ Principal Amount |
2014 | 2013 | |||||||||
| 5.80% due May 1, 2014 |
$ | — | $ | — | $ | 1,000 | ||||||
|
|
|
|
|
|
|
|||||||
| $ | — | $ | — | $ | 1,000 | |||||||
|
|
|
|
|
|
|
|||||||
F) MANDATORY DEBT PAYMENTS
| As at December 31 |
C$ Principal Amount |
US$ Principal Amount |
Total US$ Equivalent |
|||||||||
| 2015 |
$ | — | $ | — | $ | — | ||||||
| 2016 |
— | — | — | |||||||||
| 2017 |
— | 700 | 700 | |||||||||
| 2018 |
750 | 1,277 | 1,924 | |||||||||
| 2019 |
— | 500 | 500 | |||||||||
| Thereafter |
— | 4,200 | 4,200 | |||||||||
|
|
|
|
|
|
|
|||||||
| Total |
$ | 750 | $ | 6,677 | $ | 7,324 | ||||||
|
|
|
|
|
|
|
|||||||
The amount due in 2015 excludes LIBOR loans, which are fully supported by revolving credit facilities that have no repayment requirements within the next year. The revolving credit facilities are fully revolving for a period of up to five years. Based on the current maturity dates of the credit facilities, the payments are included in 2018.
Long-term debt is accounted for at amortized cost using the effective interest method of amortization. As at December 31, 2014, total long-term debt had a carrying value of $7,340 million and a fair value of $7,788 million (2013 – carrying value of $7,124 million and a fair value of $7,805 million). The estimated fair value of long-term borrowings is categorized within Level 2 of the fair value hierarchy and has been determined based on market information, or by discounting future payments of interest and principal at interest rates expected to be available to the Company at period end.
14. OTHER LIABILITIES AND PROVISIONS
| As at December 31 |
2014 | 2013 | ||||||
| The Bow Office Building (See Note 9) |
$ | 1,486 | $ | 1,631 | ||||
| Capital Lease Obligations (See Note 9) |
473 | 544 | ||||||
| Unrecognized Tax Benefits (See Note 7) |
279 | 133 | ||||||
| Pensions and Other Post-Employment Benefits (See Note 21) |
144 | 110 | ||||||
| Long-Term Incentives (See Note 20) |
70 | 58 | ||||||
| Other |
32 | 44 | ||||||
|
|
|
|
|
|||||
| $ | 2,484 | $ | 2,520 | |||||
|
|
|
|
|
|||||
Long-Term Incentives was previously reported in Other in 2013.
Annual Report 2014 | Encana Corporation 75
THE BOW OFFICE BUILDING
As described in Note 9, Encana has recognized the accumulated costs for The Bow office building, which is under a 25-year lease agreement. At the conclusion of the 25-year term, the remaining asset and corresponding liability are expected to be derecognized. Encana has also subleased part of The Bow office space to a subsidiary of Cenovus. The total undiscounted future payments related to the lease agreement and the total undiscounted future amounts expected to be recovered from the Cenovus sublease are outlined below.
| (undiscounted) |
2015 | 2016 | 2017 | 2018 | 2019 | Thereafter | Total | |||||||||||||||||||||
| Expected Future Lease Payments |
$ | 80 | $ | 81 | $ | 82 | $ | 82 | $ | 83 | $ | 1,652 | $ | 2,060 | ||||||||||||||
|
|
|
|
|
|
|
|
|
|
|
|
|
|
|
|||||||||||||||
| Sublease Recoveries |
$ | (39 | ) | $ | (40 | ) | $ | (40 | ) | $ | (40 | ) | $ | (41 | ) | $ | (812 | ) | $ | (1,012 | ) | |||||||
|
|
|
|
|
|
|
|
|
|
|
|
|
|
|
|||||||||||||||
CAPITAL LEASE OBLIGATIONS
As described in Note 9, the Company has several lease arrangements that are accounted for as capital leases, including an office building, equipment and an offshore production platform.
The PFC commenced commercial operations in December 2013. Accordingly, Encana derecognized the asset under construction and related liability and recorded the PFC as a capital lease asset with a corresponding capital lease obligation. Under the lease contract, Encana has a purchase option and the option to extend the lease for 12 one-year terms at fixed prices after the initial lease term expires in 2021. As a result, the lease contract qualifies as a variable interest and the related leasing entity qualifies as a variable interest entity (“VIE”). Encana is not the primary beneficiary of the VIE as the Company does not have the power to direct the activities that most significantly impact the VIE’s economic performance. Encana is not required to provide any financial support or guarantees to the lease entity and its affiliates, other than the contractual payments under the lease and operating contracts.
The total expected future lease payments related to the Company’s capital lease obligations are outlined below.
| 2015 | 2016 | 2017 | 2018 | 2019 | Thereafter | Total | ||||||||||||||||||||||
| Expected Future Lease Payments |
$ | 98 | $ | 98 | $ | 99 | $ | 99 | $ | 99 | $ | 232 | $ | 725 | ||||||||||||||
| Less Amounts Representing Interest |
39 | 36 | 32 | 27 | 23 | 36 | 193 | |||||||||||||||||||||
|
|
|
|
|
|
|
|
|
|
|
|
|
|
|
|||||||||||||||
| Present Value of Expected Future Lease Payments |
$ | 59 | $ | 62 | $ | 67 | $ | 72 | $ | 76 | $ | 196 | $ | 532 | ||||||||||||||
|
|
|
|
|
|
|
|
|
|
|
|
|
|
|
|||||||||||||||
15. ASSET RETIREMENT OBLIGATION
| As at December 31 |
2014 | 2013 | ||||||
| Asset Retirement Obligation, Beginning of Year |
$ | 966 | $ | 969 | ||||
| Liabilities Incurred and Acquired (See Note 3) |
85 | 38 | ||||||
| Liabilities Settled and Divested |
(188 | ) | (126 | ) | ||||
| Change in Estimated Future Cash Outflows |
35 | 68 | ||||||
| Accretion Expense |
52 | 53 | ||||||
| Foreign Currency Translation |
(37 | ) | (36 | ) | ||||
|
|
|
|
|
|||||
| Asset Retirement Obligation, End of Year |
$ | 913 | $ | 966 | ||||
|
|
|
|
|
|||||
| Current Portion (See Note 12) |
$ | 43 | $ | 66 | ||||
| Long-Term Portion |
870 | 900 | ||||||
|
|
|
|
|
|||||
| $ | 913 | $ | 966 | |||||
|
|
|
|
|
|||||
76 Encana Corporation | Annual Report 2014
16. SHARE CAPITAL
AUTHORIZED
The Company is authorized to issue an unlimited number of no par value common shares, an unlimited number of first preferred shares and an unlimited number of second preferred shares.
ISSUED AND OUTSTANDING
| As at December 31 |
2014 | 2013 | ||||||||||||||
| Number (millions) |
Amount | Number (millions) |
Amount | |||||||||||||
| Common Shares Outstanding, Beginning of Year |
740.9 | $ | 2,445 | 736.3 | $ | 2,354 | ||||||||||
| Common Shares Cancelled |
— | — | (0.8 | ) | (2 | ) | ||||||||||
| Common Shares Issued under Dividend Reinvestment Plan |
0.3 | 5 | 5.4 | 93 | ||||||||||||
|
|
|
|
|
|
|
|
|
|||||||||
| Common Shares Outstanding, End of Year |
741.2 | $ | 2,450 | 740.9 | $ | 2,445 | ||||||||||
|
|
|
|
|
|
|
|
|
|||||||||
During the year ended December 31, 2014, Encana issued 240,839 common shares totaling $5 million under the Company’s dividend reinvestment plan (2013 – issued 5,385,845 common shares totaling $93 million).
During the year ended December 31, 2013, Encana cancelled 767,327 common shares reserved for issuance to shareholders upon exchange of predecessor companies’ shares. In accordance with the terms of the merger agreement which formed Encana, shares which remained unexchanged were extinguished. Accordingly, the weighted average book value of the common shares extinguished of $2 million was transferred to paid in surplus.
DIVIDENDS
For the year ended December 31, 2014, Encana paid dividends of $0.28 per common share totaling $207 million (2013 – $0.67 per common share totaling $494 million; 2012 – $0.80 per common share totaling $588 million). The Company’s quarterly dividend payment in 2014 was $0.07 per common share. The quarterly dividend payment in 2013 was $0.20 per common share for the first three quarters and $0.07 per common share for the fourth quarter. The quarterly dividend payment in 2012 was $0.20 per common share.
For the year ended December 31, 2014, the dividends paid included $5 million in common shares as disclosed above, which were issued in lieu of cash dividends under the Company’s dividend reinvestment plan (2013 – $93 million; 2012 – nil).
On February 25, 2015, the Board declared a dividend of $0.07 per common share payable on March 31, 2015 to common shareholders of record as of March 13, 2015.
EARNINGS PER COMMON SHARE
The following table presents the computation of net earnings per common share:
| For the years ended December 31 (millions, except per share amounts) |
2014 | 2013 | 2012 | |||||||||
| Net Earnings (Loss) Attributable to Common Shareholders |
$ | 3,392 | $ | 236 | $ | (2,794 | ) | |||||
| Number of Common Shares: |
||||||||||||
| Weighted average common shares outstanding – Basic |
741.0 | 737.7 | 736.3 | |||||||||
| Effect of dilutive securities |
— | — | — | |||||||||
|
|
|
|
|
|
|
|||||||
| Weighted average common shares outstanding – Diluted |
741.0 | 737.7 | 736.3 | |||||||||
|
|
|
|
|
|
|
|||||||
| Net Earnings (Loss) per Common Share |
||||||||||||
| Basic |
$ | 4.58 | $ | 0.32 | $ | (3.79 | ) | |||||
| Diluted |
$ | 4.58 | $ | 0.32 | $ | (3.79 | ) | |||||
Annual Report 2014 | Encana Corporation 77
ENCANA STOCK OPTION PLAN
Encana has share-based compensation plans that allow employees to purchase common shares of the Company. Option exercise prices are not less than the market value of the common shares on the date the options are granted. Options granted are exercisable at 30 percent of the number granted after one year, an additional 30 percent of the number granted after two years, are fully exercisable after three years and expire five years after the date granted.
All options outstanding as at December 31, 2014 have associated Tandem Stock Appreciation Rights (“TSARs”) attached. In lieu of exercising the option, the associated TSARs give the option holder the right to receive a cash payment equal to the excess of the market price of Encana’s common shares at the time of the exercise over the original grant price. In addition, certain stock options granted are performance-based. The Performance TSARs vest and expire under the same terms and conditions as the underlying option. Vesting is also subject to Encana attaining prescribed performance relative to predetermined key measures. Historically, most holders of options with TSARs have elected to exercise their stock options as a Stock Appreciation Right (“SAR”) in exchange for a cash payment. As a result, Encana does not consider outstanding TSARs to be potentially dilutive securities. See Note 20 for further information on Encana’s outstanding and exercisable TSARs and Performance TSARs.
At December 31, 2014, there were 27.3 million common shares reserved for issuance under stock option plans (2013 – 19.1 million; 2012 – 18.8 million).
ENCANA RESTRICTED SHARE UNITS (“RSUs”)
Encana has a share-based compensation plan whereby eligible employees are granted RSUs. An RSU is a conditional grant to receive an Encana common share, or the cash equivalent, as determined by Encana, upon vesting of the RSUs and in accordance with the terms of the RSU Plan and Grant Agreement. The value of one RSU is notionally equivalent to one Encana common share. RSUs vest three years from the date granted, provided the employee remains actively employed with Encana on the vesting date. The Company intends to settle vested RSUs in cash on the vesting date. As a result, Encana does not consider RSUs to be potentially dilutive securities. See Note 20 for further information on Encana’s outstanding RSUs.
ENCANA SHARE UNITS PREVIOUSLY HELD BY CENOVUS EMPLOYEES
On November 30, 2009, Encana completed a corporate reorganization to split into two independent publicly traded energy companies – Encana Corporation and Cenovus Energy Inc. (the “Split Transaction”). In conjunction with the Split Transaction, each holder of Encana share units disposed of their right in exchange for the grant of new Encana share units and Cenovus share units. Share units included TSARs, Performance TSARs, SARs and Performance SARs. The terms and conditions of the share units were similar to the terms and conditions of the original share units. There was no impact on Encana’s net earnings for the share units held by Cenovus employees. As at December 31, 2014, all remaining share units held by Cenovus employees have expired.
17. ACCUMULATED OTHER COMPREHENSIVE INCOME
| For the years ended December 31 |
2014 | 2013 | ||||||
| Foreign Currency Translation Adjustment |
||||||||
| Balance, Beginning of Year |
$ | 693 | $ | 739 | ||||
| Change in Foreign Currency Translation Adjustment |
22 | (46 | ) | |||||
|
|
|
|
|
|||||
| Balance, End of Year |
$ | 715 | $ | 693 | ||||
|
|
|
|
|
|||||
| Pension and Other Post-Employment Benefit Plans |
||||||||
| Balance, Beginning of Year |
$ | (9 | ) | $ | (69 | ) | ||
| Net Actuarial Gains and (Losses) and Plan Amendment (See Note 21) |
(22 | ) | 65 | |||||
| Income Taxes |
7 | (17 | ) | |||||
| Reclassification of Net Actuarial (Gains) and Losses to Net Earnings (See Note 21) |
(1 | ) | 11 | |||||
| Income Taxes |
— | (3 | ) | |||||
| Reclassification of Net Prior Service Costs and (Credits) to Net Earnings (See Note 21) |
(1 | ) | — | |||||
| Income Taxes |
— | — | ||||||
| Settlement and Curtailment in Defined Benefit Plan Expense (See Note 21) |
— | 6 | ||||||
| Income Taxes |
— | (2 | ) | |||||
|
|
|
|
|
|||||
| Balance, End of Year |
$ | (26 | ) | $ | (9 | ) | ||
|
|
|
|
|
|||||
| Total Accumulated Other Comprehensive Income |
$ | 689 | $ | 684 | ||||
|
|
|
|
|
|||||
78 Encana Corporation | Annual Report 2014
18. NONCONTROLLING INTEREST
INITIAL PUBLIC OFFERING OF COMMON SHARES OF PRAIRIESKY
On May 22, 2014, PrairieSky filed a final prospectus to qualify the distribution of 52.0 million common shares (the “IPO”), to be sold by Encana pursuant to the terms of an underwriting agreement dated May 22, 2014, at a price of C$28.00 per common share (the “Offering Price”).
On May 27, 2014, prior to closing the IPO, PrairieSky acquired from Encana a royalty business in exchange for common shares of PrairieSky pursuant to the Purchase and Sale Agreement dated May 22, 2014 between PrairieSky and Encana (the “Agreement”). The royalty business assets acquired by PrairieSky comprise: (i) fee simple mineral title in lands prospective for petroleum, natural gas and certain other mines and minerals located predominantly in central and southern Alberta (the “Fee Lands”); (ii) lessor interests in and to leases that are currently issued in respect of certain Fee Lands; (iii) royalty interests, including overriding royalty interests, gross overriding royalty interests and production payments on lands located predominantly in Alberta; (iv) an irrevocable, perpetual licence to certain proprietary seismic data of Encana (the “Seismic Licence”); and (v) certain other related assets as set forth in the Agreement.
As part of the Agreement, PrairieSky and Encana entered into: (i) a Seismic Licence Agreement whereby Encana granted the Seismic Licence to PrairieSky; and (ii) Lease Issuance and Administration Agreements whereby PrairieSky issued leases to document Encana’s retention of its working interest in respect of certain Fee Lands and pursuant to which PrairieSky receives royalties from Encana.
On May 29, 2014, Encana completed the IPO of 52.0 million common shares of PrairieSky at the Offering Price for gross proceeds of approximately C$1.46 billion. On June 3, 2014, the over-allotment option granted to the underwriters to purchase up to an additional 7.8 million common shares was exercised in full for gross proceeds of approximately C$218.4 million. Encana received aggregate gross proceeds from the IPO of approximately C$1.67 billion ($1.54 billion). Subsequent to the IPO, Encana owned 70.2 million common shares of PrairieSky, representing a 54 percent ownership interest.
The noncontrolling interest in the former consolidated subsidiary, PrairieSky, was reflected as a separate component of Total Equity in the Consolidated Balance Sheet. Encana recorded $117 million of the proceeds from the IPO as a noncontrolling interest and the remainder of the proceeds of $1,427 million, less transaction costs of $82 million, was recognized as paid in surplus.
SECONDARY PUBLIC OFFERING OF COMMON SHARES OF PRAIRIESKY
On September 8, 2014, Encana and PrairieSky announced the secondary offering of 70.2 million common shares of PrairieSky at a price of C$36.50 per common share, for aggregate gross proceeds to Encana of approximately C$2.6 billion. Following the completion of the secondary offering on September 26, 2014, Encana no longer holds an interest in PrairieSky. As discussed in Note 4, the PrairieSky divestiture resulted in a significant alteration between capitalized costs and proved reserves in the Canadian cost centre. Accordingly, Encana recognized a gain on the divestiture of approximately $2,094 million, which is included in (gain) loss on divestitures in the Company’s Consolidated Statement of Earnings. In conjunction with the divestiture, Encana derecognized the carrying amount of the net assets of $258 million, including goodwill of $39 million, and the noncontrolling interest of $133 million.
DISTRIBUTIONS TO NONCONTROLLING INTEREST OWNERS
During the period from May 29, 2014 to September 25, 2014, PrairieSky paid dividends of C$0.3174 per common share totaling $38 million, of which $18 million is attributable to the noncontrolling interest as presented in the Consolidated Statement of Changes in Shareholders’ Equity and Consolidated Statement of Cash Flows.
NET EARNINGS ATTRIBUTABLE TO NONCONTROLLING INTEREST
During the period from May 29, 2014 to September 25, 2014, the Company held a controlling interest in PrairieSky. Accordingly, Encana consolidated 100 percent of the financial position and results of operations of PrairieSky and recognized a noncontrolling interest for the third party ownership. For the year ended December 31, 2014, net earnings and comprehensive income of $34 million were attributable to the noncontrolling interest as presented in the Consolidated Statement of Earnings and Consolidated Statement of Comprehensive Income.
19. RESTRUCTURING CHARGES
In November 2013, Encana announced its plans to align the organizational structure in support of the Company’s strategy. For the year ended December 31, 2014, Encana has incurred restructuring charges totaling $36 million relating primarily to severance costs, which are included in administrative expense in the Company’s Consolidated Statement of Earnings (2013 – $88 million). Of the $124 million in restructuring charges incurred to date, $4 million remains accrued as at December 31, 2014 (2013 – $65 million). Total restructuring charges are expected to be approximately $133 million before tax. The remaining restructuring charges of approximately $9 million are anticipated to be incurred in 2015.
Annual Report 2014 | Encana Corporation 79
20. COMPENSATION PLANS
Encana has a number of compensation arrangements under which the Company awards various types of long-term incentive grants to eligible employees. They include TSARs, Performance TSARs, SARs, Performance SARs, Performance Share Units (“PSUs”), Deferred Share Units (“DSUs”), RSUs and a Restricted Cash Plan. The majority of these compensation arrangements are share-based.
Encana accounts for TSARs, Performance TSARs, SARs, Performance SARs, PSUs, and RSUs held by Encana employees as cash-settled share-based payment transactions and, accordingly, accrues compensation costs over the vesting period based on the fair value of the rights determined using the Black-Scholes-Merton and other fair value models. TSARs, Performance TSARs, SARs and Performance SARs granted vest and are exercisable at 30 percent of the number granted after one year, an additional 30 percent of the number granted after two years, are fully exercisable after three years (with the exception of Performance TSARs granted in 2013) and expire five years after the date granted. PSUs and RSUs vest three years from the date of grant, provided the employee remains actively employed with Encana on the vesting date.
The following weighted average assumptions were used to determine the fair value of the share units held by Encana employees:
| As at December 31, 2014 |
Encana US$ Share Units |
Encana C$ Share Units |
||||||
| Risk Free Interest Rate |
1.01 | % | 1.01 | % | ||||
| Dividend Yield |
2.02 | % | 1.91 | % | ||||
| Expected Volatility Rate |
30.66 | % | 29.11 | % | ||||
| Expected Term |
1.5 yrs | 1.7 yrs | ||||||
| Market Share Price |
US$ | 13.87 | C$ | 16.17 | ||||
| As at December 31, 2013 |
Encana US$ Share Units |
Encana C$ Share Units |
Cenovus C$ Share Units |
|||||||||
| Risk Free Interest Rate |
1.09 | % | 1.09 | % | 1.09 | % | ||||||
| Dividend Yield |
1.55 | % | 1.50 | % | 3.18 | % | ||||||
| Expected Volatility Rate |
33.20 | % | 30.42 | % | 27.75 | % | ||||||
| Expected Term |
1.8 yrs | 1.7 yrs | 0.1 yrs | |||||||||
| Market Share Price |
US$ | 18.05 | C$ | 19.18 | C$ | 30.40 | ||||||
For both Encana and Cenovus share units held by Encana employees, volatility was estimated using historical volatility rates.
The Company has recognized the following share-based compensation costs:
| For the years ended December 31 |
2014 | 2013 | 2012 | |||||||||
| Compensation Costs of Transactions Classified as Cash-Settled |
$ | 25 | $ | 63 | $ | 42 | ||||||
| Compensation Costs of Transactions Classified as Equity-Settled (1) |
(2 | ) | 3 | 5 | ||||||||
|
|
|
|
|
|
|
|||||||
| Total Share-Based Compensation Costs |
23 | 66 | 47 | |||||||||
| Less: Total Share-Based Compensation Costs Capitalized |
(6 | ) | (22 | ) | (14 | ) | ||||||
|
|
|
|
|
|
|
|||||||
| Total Share-Based Compensation Expense |
$ | 17 | $ | 44 | $ | 33 | ||||||
|
|
|
|
|
|
|
|||||||
| Recognized on the Consolidated Statement of Earnings in: |
||||||||||||
| Operating expense |
$ | 12 | $ | 18 | $ | 13 | ||||||
| Administrative expense |
5 | 26 | 20 | |||||||||
|
|
|
|
|
|
|
|||||||
| $ | 17 | $ | 44 | $ | 33 | |||||||
|
|
|
|
|
|
|
|||||||
| (1) | RSUs may be settled in cash or equity as determined by Encana. The Company’s decision to cash settle RSUs was made subsequent to the original grant date. |
80 Encana Corporation | Annual Report 2014
As at December 31, 2014, the liability for share-based payment transactions totaled $99 million (2013 – $169 million), of which $29 million (2013 – $111 million) is recognized in accounts payable and accrued liabilities.
| For the years ended December 31 |
2014 | 2013 | 2012 | |||||||||
| Liability for Cash-Settled Share-Based Payment Transactions: |
||||||||||||
| Unvested |
$ | 78 | $ | 121 | $ | 85 | ||||||
| Vested |
21 | 48 | 71 | |||||||||
|
|
|
|
|
|
|
|||||||
| $ | 99 | $ | 169 | $ | 156 | |||||||
|
|
|
|
|
|
|
|||||||
The following sections outline certain information related to Encana’s compensation plans as at December 31, 2014.
A) TANDEM STOCK APPRECIATION RIGHTS
All options to purchase common shares issued under the Encana Stock Option Plan have associated TSARs attached. In lieu of exercising the option, the associated TSARs give the option holder the right to receive a cash payment equal to the excess of the market price of Encana’s common shares at the time of exercise over the original grant price. The TSARs vest and expire under the same terms and conditions as the underlying option.
The following tables summarize information related to the Encana TSARs held by Encana employees:
| As at December 31 |
2014 | 2013 | ||||||||||||||
| (thousands of units) |
Outstanding TSARs |
Weighted Average Exercise Price (C$) |
Outstanding TSARs |
Weighted Average Exercise Price (C$) |
||||||||||||
| Outstanding, Beginning of Year |
22,512 | 23.11 | 17,168 | 27.84 | ||||||||||||
| Granted |
5,271 | 20.57 | 9,709 | 18.08 | ||||||||||||
| Exercised - SARs |
(1,443 | ) | 19.84 | (1 | ) | 19.90 | ||||||||||
| Exercised - Options |
(1 | ) | 18.06 | — | — | |||||||||||
| Forfeited |
(4,656 | ) | 23.16 | (2,663 | ) | 26.60 | ||||||||||
| Expired |
(1,282 | ) | 29.06 | (1,701 | ) | 36.60 | ||||||||||
|
|
|
|
|
|
|
|
|
|||||||||
| Outstanding, End of Year |
20,401 | 22.30 | 22,512 | 23.11 | ||||||||||||
|
|
|
|
|
|
|
|
|
|||||||||
| Exercisable, End of Year |
9,951 | 25.40 | 9,360 | 27.84 | ||||||||||||
|
|
|
|
|
|
|
|
|
|||||||||
| As at December 31, 2014 |
Outstanding Encana TSARs | Exercisable Encana TSARs | ||||||||||||||||||
| Range of Exercise Price (C$) |
Number of TSARs (thousands of units) |
Weighted Average Remaining Contractual Life (years) |
Weighted Average Exercise Price (C$) |
Number of TSARs (thousands of units) |
Weighted Average Exercise Price (C$) |
|||||||||||||||
| 10.00 to 19.99 |
7,108 | 3.16 | 18.10 | 1,853 | 18.12 | |||||||||||||||
| 20.00 to 29.99 |
9,057 | 3.09 | 21.05 | 3,862 | 21.63 | |||||||||||||||
| 30.00 to 39.99 |
4,236 | 0.61 | 32.03 | 4,236 | 32.03 | |||||||||||||||
|
|
|
|
|
|
|
|
|
|
|
|||||||||||
| 20,401 | 2.60 | 22.30 | 9,951 | 25.40 | ||||||||||||||||
|
|
|
|
|
|
|
|
|
|
|
|||||||||||
As at December 31, 2014, there was approximately $5 million of total unrecognized compensation costs (2013 – $29 million) related to unvested TSARs held by Encana employees. The costs are expected to be recognized over a weighted average period of 2.0 years.
Annual Report 2014 | Encana Corporation 81
The following table summarizes information related to the Cenovus TSARs held by Encana employees:
| As at December 31 |
2014 | 2013 | ||||||||||||||
| (thousands of units) |
Outstanding TSARs |
Weighted Average Exercise Price (C$) |
Outstanding TSARs |
Weighted Average Exercise Price (C$) |
||||||||||||
| Outstanding, Beginning of Year |
527 | 26.29 | 2,025 | 29.75 | ||||||||||||
| Exercised - SARs |
(499 | ) | 26.29 | (885 | ) | 28.81 | ||||||||||
| Exercised - Options |
(4 | ) | 26.39 | (6 | ) | 29.32 | ||||||||||
| Forfeited |
— | — | (14 | ) | 31.16 | |||||||||||
| Expired |
(24 | ) | 26.38 | (593 | ) | 34.21 | ||||||||||
|
|
|
|
|
|
|
|
|
|||||||||
| Outstanding, End of Year |
— | — | 527 | 26.29 | ||||||||||||
|
|
|
|
|
|
|
|
|
|||||||||
| Exercisable, End of Year |
— | — | 527 | 26.29 | ||||||||||||
|
|
|
|
|
|
|
|
|
|||||||||
During the year, Encana recorded a reduction in compensation costs of $15 million related to the Encana TSARs and a reduction in compensation costs of $1 million related to the Cenovus TSARs (2013 – compensation costs of $21 million related to the Encana TSARs and a reduction of compensation costs of $4 million related to the Cenovus TSARs; 2012 – compensation costs of $6 million related to the Encana TSARs and a reduction of compensation costs of $1 million related to Cenovus TSARs).
B) PERFORMANCE TANDEM STOCK APPRECIATION RIGHTS
From 2007 to 2009, Encana granted Performance TSARs. Upon vesting, in lieu of exercising the option, the option holder has the right to receive a cash payment equal to the excess of the market price of Encana’s common shares at the time of exercise over the original grant price. The Performance TSARs vest and expire under the same terms and conditions as the underlying option. Vesting is also subject to Encana attaining prescribed performance relative to an internal recycle ratio and predetermined performance targets. Performance TSARs that do not vest when eligible are forfeited and cancelled.
In 2013, Encana granted Performance TSARs to the President & Chief Executive Officer. The Performance TSARs vest and expire over the same terms and conditions as the underlying option. Under this 2013 grant, vesting is also subject to Encana achieving prescribed performance targets over a four-year period based on Encana’s share price performance. Performance TSARs that do not vest when eligible are forfeited and cancelled.
The following tables summarize information related to the Encana Performance TSARs held by Encana employees:
| As at December 31 |
2014 | 2013 | ||||||||||||||
| (thousands of units) |
Outstanding Performance TSARs |
Weighted Average Exercise Price (C$) |
Outstanding Performance TSARs |
Weighted Average Exercise Price (C$) |
||||||||||||
| Outstanding, Beginning of Year |
3,125 | 25.74 | 4,879 | 32.44 | ||||||||||||
| Granted |
— | — | 935 | 18.00 | ||||||||||||
| Forfeited |
(61 | ) | 29.04 | (453 | ) | 29.12 | ||||||||||
| Expired |
(2,129 | ) | 29.04 | (2,236 | ) | 36.44 | ||||||||||
|
|
|
|
|
|
|
|
|
|||||||||
| Outstanding, End of Year |
935 | 18.00 | 3,125 | 25.74 | ||||||||||||
|
|
|
|
|
|
|
|
|
|||||||||
| Exercisable, End of Year |
— | — | 2,190 | 29.04 | ||||||||||||
|
|
|
|
|
|
|
|
|
|||||||||
82 Encana Corporation | Annual Report 2014
| As at December 31, 2014 |
Outstanding Encana Performance TSARs | Exercisable Encana Performance TSARs |
||||||||||||||||||
| Range of Exercise Price (C$) |
Number of TSARs (thousands of units) |
Weighted Average Remaining Contractual Life (years) |
Weighted Average Exercise Price (C$) |
Number of TSARs (thousands of units) |
Weighted Average Exercise Price (C$) |
|||||||||||||||
| 10.00 to 19.99 |
935 | 3.45 | 18.00 | — | — | |||||||||||||||
|
|
|
|
|
|
|
|
|
|
|
|||||||||||
| 935 | 3.45 | 18.00 | — | — | ||||||||||||||||
|
|
|
|
|
|
|
|
|
|
|
|||||||||||
As at December 31, 2014, there was approximately $1 million of total unrecognized compensation costs (2013 – $1 million) related to unvested Performance TSARs held by Encana employees. The costs are expected to be recognized over a weighted average period of 2.3 years.
The following table summarizes information related to the Cenovus Performance TSARs held by Encana employees:
| As at December 31 |
2014 | 2013 | ||||||||||||||
| (thousands of units) |
Outstanding Performance TSARs |
Weighted Average Exercise Price (C$) |
Outstanding Performance TSARs |
Weighted Average Exercise Price (C$) |
||||||||||||
| Outstanding, Beginning of Year |
953 | 26.27 | 3,205 | 29.00 | ||||||||||||
| Exercised - SARs |
(908 | ) | 26.27 | (1,466 | ) | 28.72 | ||||||||||
| Exercised - Options |
(5 | ) | 26.27 | (9 | ) | 29.69 | ||||||||||
| Forfeited |
(1 | ) | 26.27 | (13 | ) | 26.27 | ||||||||||
| Expired |
(39 | ) | 26.27 | (764 | ) | 32.96 | ||||||||||
|
|
|
|
|
|
|
|
|
|||||||||
| Outstanding, End of Year |
— | — | 953 | 26.27 | ||||||||||||
|
|
|
|
|
|
|
|
|
|||||||||
| Exercisable, End of Year |
— | — | 953 | 26.27 | ||||||||||||
|
|
|
|
|
|
|
|
|
|||||||||
During the year, Encana recorded compensation costs of $1 million related to the Encana Performance TSARs and a reduction in compensation costs of $1 million related to the Cenovus Performance TSARs (2013 – compensation costs of $1 million related to the Encana Performance TSARs and a reduction of compensation costs of $6 million related to the Cenovus Performance TSARs; 2012 – reduction of compensation costs of $1 million related to the Encana Performance TSARs and reduction of compensation costs of $2 million related to the Cenovus Performance TSARs).
Annual Report 2014 | Encana Corporation 83
C) STOCK APPRECIATION RIGHTS
During 2008 and 2009, Canadian dollar denominated SARs were granted to employees, which entitle the employee to receive a cash payment equal to the excess of the market price of Encana’s common shares at the time of exercise over the original grant price of the right.
The following tables summarize information related to the Encana SARs held by Encana employees:
| As at December 31 |
2014 | 2013 | ||||||||||||||
| (thousands of units) |
Outstanding SARs |
Weighted Average Exercise Price (C$) |
Outstanding SARs |
Weighted Average Exercise Price (C$) |
||||||||||||
| Outstanding, Beginning of Year |
730 | 29.11 | 1,843 | 33.79 | ||||||||||||
| Forfeited |
(20 | ) | 29.91 | (156 | ) | 30.02 | ||||||||||
| Expired |
(710 | ) | 29.09 | (957 | ) | 37.98 | ||||||||||
|
|
|
|
|
|
|
|
|
|||||||||
| Outstanding, End of Year |
— | — | 730 | 29.11 | ||||||||||||
|
|
|
|
|
|
|
|
|
|||||||||
| Exercisable, End of Year |
— | — | 730 | 29.11 | ||||||||||||
|
|
|
|
|
|
|
|
|
|||||||||
Since 2010, U.S. dollar denominated SARs have been granted to eligible U.S. based employees. The terms and conditions are similar to the Canadian dollar denominated SARs. The following tables summarize information related to U.S. dollar denominated Encana SARs held by Encana employees:
| As at December 31 |
2014 | 2013 | ||||||||||||||
| (thousands of units) |
Outstanding SARs |
Weighted Average Exercise Price (US$) |
Outstanding SARs |
Weighted Average Exercise Price (US$) |
||||||||||||
| Outstanding, Beginning of Year |
14,930 | 23.79 | 12,165 | 26.50 | ||||||||||||
| Granted |
3,139 | 19.10 | 5,048 | 17.95 | ||||||||||||
| Exercised |
(1,095 | ) | 19.96 | (2 | ) | 17.95 | ||||||||||
| Forfeited |
(4,667 | ) | 23.49 | (2,281 | ) | 25.30 | ||||||||||
| Expired |
(43 | ) | 26.04 | — | — | |||||||||||
|
|
|
|
|
|
|
|
|
|||||||||
| Outstanding, End of Year |
12,264 | 23.04 | 14,930 | 23.79 | ||||||||||||
|
|
|
|
|
|
|
|
|
|||||||||
| Exercisable, End of Year |
7,310 | 25.97 | 7,328 | 27.32 | ||||||||||||
|
|
|
|
|
|
|
|
|
|||||||||
| As at December 31, 2014 |
Outstanding Encana SARs | Exercisable Encana SARs | ||||||||||||||||||
| Range of Exercise Price (US$) |
Number of SARs (thousands of units) |
Weighted Average Remaining Contractual Life (years) |
Weighted Average Exercise Price (US$) |
Number of SARs (thousands of units) |
Weighted Average Exercise Price (US$) |
|||||||||||||||
| 10.00 to 19.99 |
5,110 | 3.60 | 18.20 | 760 | 17.97 | |||||||||||||||
| 20.00 to 29.99 |
3,530 | 2.13 | 21.75 | 2,926 | 21.66 | |||||||||||||||
| 30.00 to 39.99 |
3,624 | 0.58 | 31.13 | 3,624 | 31.13 | |||||||||||||||
|
|
|
|
|
|
|
|
|
|
|
|||||||||||
| 12,264 | 2.28 | 23.04 | 7,310 | 25.97 | ||||||||||||||||
|
|
|
|
|
|
|
|
|
|
|
|||||||||||
As at December 31, 2014, there was approximately $2 million of total unrecognized compensation costs (2013 – $18 million) related to unvested SARs held by Encana employees. The costs are expected to be recognized over a weighted average period of 2.2 years.
84 Encana Corporation | Annual Report 2014
The following table summarizes information related to the Cenovus SARs held by Encana employees:
| As at December 31 |
2014 | 2013 | ||||||||||||||
| (thousands of units) |
Outstanding SARs |
Weighted Average Exercise Price (C$) |
Outstanding SARs |
Weighted Average Exercise Price (C$) |
||||||||||||
| Outstanding, Beginning of Year |
230 | 26.42 | 1,027 | 31.25 | ||||||||||||
| Exercised |
(212 | ) | 26.35 | (385 | ) | 28.38 | ||||||||||
| Forfeited |
(2 | ) | 29.04 | (23 | ) | 33.62 | ||||||||||
| Expired |
(16 | ) | 26.95 | (389 | ) | 36.82 | ||||||||||
|
|
|
|
|
|
|
|
|
|||||||||
| Outstanding, End of Year |
— | — | 230 | 26.42 | ||||||||||||
|
|
|
|
|
|
|
|
|
|||||||||
| Exercisable, End of Year |
— | — | 230 | 26.42 | ||||||||||||
|
|
|
|
|
|
|
|
|
|||||||||
During the year, Encana recorded a reduction of compensation costs of $2 million related to the Encana SARs and no compensation costs related to the Cenovus SARs (2013 – compensation costs of $1 million related to the Encana SARs and a reduction in compensation costs of $2 million related to the Cenovus SARs; 2012 – compensation costs of $7 million related to the Encana SARs and a reduction in compensation costs of $1 million related to the Cenovus SARs).
D) PERFORMANCE STOCK APPRECIATION RIGHTS
During 2008 and 2009, Encana granted Performance SARs to certain employees, which entitle the employee to receive a cash payment equal to the excess of the market price of Encana’s common shares at the time of exercise over the original grant price. Performance SARs are subject to Encana attaining prescribed performance relative to an internal recycle ratio and predetermined key measures. Performance SARs that do not vest when eligible are forfeited.
The following table summarizes information related to the Encana Performance SARs held by Encana employees:
| As at December 31 |
2014 | 2013 | ||||||||||||||
| (thousands of units) |
Outstanding Performance SARs |
Weighted Average Exercise Price (C$) |
Outstanding Performance SARs |
Weighted Average Exercise Price (C$) |
||||||||||||
| Outstanding, Beginning of Year |
1,181 | 29.04 | 2,455 | 32.20 | ||||||||||||
| Forfeited |
(17 | ) | 29.04 | (239 | ) | 29.48 | ||||||||||
| Expired |
(1,164 | ) | 29.04 | (1,035 | ) | 36.44 | ||||||||||
|
|
|
|
|
|
|
|
|
|||||||||
| Outstanding, End of Year |
— | — | 1,181 | 29.04 | ||||||||||||
|
|
|
|
|
|
|
|
|
|||||||||
| Exercisable, End of Year |
— | — | 1,181 | 29.04 | ||||||||||||
|
|
|
|
|
|
|
|
|
|||||||||
The following table summarizes information related to the Cenovus Performance SARs held by Encana employees:
| As at December 31 |
2014 | 2013 | ||||||||||||||
| (thousands of units) |
Outstanding Performance SARs |
Weighted Average Exercise Price (C$) |
Outstanding Performance SARs |
Weighted Average Exercise Price (C$) |
||||||||||||
| Outstanding, Beginning of Year |
385 | 26.27 | 1,319 | 28.74 | ||||||||||||
| Exercised |
(365 | ) | 26.27 | (631 | ) | 28.32 | ||||||||||
| Forfeited |
— | — | (9 | ) | 26.47 | |||||||||||
| Expired |
(20 | ) | 26.27 | (294 | ) | 32.96 | ||||||||||
|
|
|
|
|
|
|
|
|
|||||||||
| Outstanding, End of Year |
— | — | 385 | 26.27 | ||||||||||||
|
|
|
|
|
|
|
|
|
|||||||||
| Exercisable, End of Year |
— | — | 385 | 26.27 | ||||||||||||
|
|
|
|
|
|
|
|
|
|||||||||
During the year, Encana recorded no compensation costs related to the Encana Performance SARs and no compensation costs related to the Cenovus Performance SARs (2013 – no compensation costs related to the Encana Performance SARs and a reduction in compensation costs of $3 million related to the Cenovus Performance SARs; 2012 – no compensation costs related to the Encana Performance SARs and no compensation costs related to the Cenovus Performance SARs).
Annual Report 2014 | Encana Corporation 85
E) PERFORMANCE SHARE UNITS
Since 2010, PSUs have been granted to eligible employees, which entitle the employee to receive, upon vesting, a cash payment equal to the value of one common share of Encana for each PSU held, depending upon the terms of the PSU Plan. PSUs vest three years from the date of grant, provided the employee remains actively employed with Encana on the vesting date.
The ultimate value of the PSUs will depend upon Encana’s performance relative to predetermined corresponding performance targets measured over a three-year period. For grants during 2010 through 2012, performance is measured relative to an internal recycle ratio as assessed by the Board on an annual basis to determine whether the performance criteria have been met. Based on this assessment, up to a maximum of two times the original PSU grant may be eligible to vest in respect of the year being measured. The respective proportion of the original PSU grant deemed eligible to vest for each year will be valued and the notional cash value deposited to a PSU account, with payout deferred to the final vesting date. For grants made in 2013, performance is measured over a three-year period relative to a specified performance peer group.
The following tables summarize information related to the PSUs:
| (thousands of units) |
Canadian Dollar Denominated Outstanding PSUs |
|||||||
| As at December 31 |
2014 | 2013 | ||||||
| Unvested and Outstanding, Beginning of Year |
1,134 | 961 | ||||||
| Granted |
457 | 856 | ||||||
| Deemed Eligible to Vest |
(211 | ) | (552 | ) | ||||
| Units, in Lieu of Dividends |
18 | 40 | ||||||
| Forfeited |
(176 | ) | (171 | ) | ||||
|
|
|
|
|
|||||
| Unvested and Outstanding, End of Year |
1,222 | 1,134 | ||||||
|
|
|
|
|
|||||
| (thousands of units) |
U.S. Dollar Denominated Outstanding PSUs |
|||||||
| As at December 31 |
2014 | 2013 | ||||||
| Unvested and Outstanding, Beginning of Year |
363 | 693 | ||||||
| Granted |
167 | 192 | ||||||
| Deemed Eligible to Vest |
(173 | ) | (474 | ) | ||||
| Units, in Lieu of Dividends |
4 | 14 | ||||||
| Forfeited |
(83 | ) | (62 | ) | ||||
|
|
|
|
|
|||||
| Unvested and Outstanding, End of Year |
278 | 363 | ||||||
|
|
|
|
|
|||||
As at December 31, 2014, there was approximately $12 million of total unrecognized compensation costs (2013 – $16 million) related to unvested PSUs held by Encana employees. The costs are expected to be recognized over a weighted average period of 1.5 years.
During the year, Encana recorded compensation costs of $4 million related to the outstanding PSUs (2013 – $11 million; 2012 – $12 million).
F) DEFERRED SHARE UNITS
The Company has in place a program whereby Directors and certain key employees are issued DSUs, which vest immediately, are equivalent in value to a common share of the Company and are settled in cash.
Under the DSU Plan, employees have the option to convert either 25 or 50 percent of their annual High Performance Results (“HPR”) award into DSUs. The number of DSUs converted is based on the value of the award divided by the closing value of Encana’s share price at the end of the performance period of the HPR award.
For both Directors and employees, DSUs can only be redeemed following departure from Encana in accordance with the terms of the respective DSU Plan and must be redeemed prior to December 15th of the year following the departure from Encana.
86 Encana Corporation | Annual Report 2014
The following table summarizes information related to the DSUs:
| (thousands of units) |
Canadian Dollar Denominated Outstanding DSUs |
|||||||
| As at December 31 |
2014 | 2013 | ||||||
| Outstanding, Beginning of Year |
1,027 | 974 | ||||||
| Granted |
152 | 106 | ||||||
| Converted from HPR awards |
— | 37 | ||||||
| Units, in Lieu of Dividends |
14 | 41 | ||||||
| Redeemed |
(302 | ) | (131 | ) | ||||
|
|
|
|
|
|||||
| Outstanding, End of Year |
891 | 1,027 | ||||||
|
|
|
|
|
|||||
During the year, Encana recorded compensation costs of $1 million related to the outstanding DSUs (2013 – $2 million; 2012 – $2 million).
G) RESTRICTED SHARE UNITS
Since 2011, RSUs have been granted to eligible employees. An RSU is a conditional grant to receive an Encana common share, or the cash equivalent, as determined by Encana, upon vesting of the RSUs and in accordance with the terms of the RSU Plan and Grant Agreement. The value of one RSU is notionally equivalent to one Encana common share. RSUs vest three years from the date granted, provided the employee remains actively employed with Encana on the vesting date. As at December 31, 2014, Encana plans to settle the RSUs in cash on the vesting date.
The following tables summarize information related to the RSUs:
| (thousands of units) |
Canadian Dollar Denominated Outstanding RSUs |
|||||||
| As at December 31 |
2014 | 2013 | ||||||
| Unvested and Outstanding, Beginning of Year |
5,130 | 1,966 | ||||||
| Granted |
2,785 | 3,873 | ||||||
| Units, in Lieu of Dividends |
94 | 205 | ||||||
| Vested and Released |
(1,368 | ) | — | |||||
| Forfeited |
(754 | ) | (914 | ) | ||||
|
|
|
|
|
|||||
| Unvested and Outstanding, End of Year |
5,887 | 5,130 | ||||||
|
|
|
|
|
|||||
| (thousands of units) |
U.S. Dollar Denominated Outstanding RSUs |
|||||||
| As at December 31 |
2014 | 2013 | ||||||
| Unvested and Outstanding, Beginning of Year |
3,475 | 1,596 | ||||||
| Granted |
1,767 | 2,458 | ||||||
| Units, in Lieu of Dividends |
51 | 139 | ||||||
| Vested and Released |
(1,071 | ) | — | |||||
| Forfeited |
(1,112 | ) | (718 | ) | ||||
|
|
|
|
|
|||||
| Unvested and Outstanding, End of Year |
3,110 | 3,475 | ||||||
|
|
|
|
|
|||||
As at December 31, 2014, there was approximately $57 million of total unrecognized compensation costs (2013 – $71 million) related to unvested RSUs held by Encana employees. The costs are expected to be recognized over a weighted average period of 1.5 years.
During the year, Encana recorded compensation costs of $36 million related to the outstanding RSUs (2013 – $45 million; 2012 – $25 million). As at December 31, 2014, $11 million of the paid in surplus balance related to the RSUs (2013 – $13 million).
H) RESTRICTED CASH PLAN
In October 2011, Encana’s Board approved the use of a Restricted Cash Plan as a component of the long-term incentive grant to eligible employees, excluding executive officers. The Restricted Cash Plan is a time-based conditional grant to receive cash which, in accordance with the corresponding grant agreement, requires that the employee remains actively employed with Encana on the vesting date. The Restricted Cash Plan vests over three years with one-third payable after each anniversary of the grant date. During the year, Encana recorded compensation costs of $1 million (2013 – $6 million; 2012 – $18 million) related to the Restricted Cash Plan grant. As at December 31, 2014, there are no remaining obligations associated with the Restricted Cash Plan.
Annual Report 2014 | Encana Corporation 87
21. PENSION AND OTHER POST-EMPLOYMENT BENEFITS
The Company sponsors defined benefit and defined contribution plans and provides pension and other post-employment benefits (“OPEB”) to its employees in Canada and the U.S. As of January 1, 2003, the defined benefit pension plan was closed to new entrants. The average remaining service period of active employees participating in the defined benefit pension plan is four years. The average remaining service period of the active employees participating in the OPEB plan is 13 years.
The Company is required to file an actuarial valuation of its pension plans with the provincial regulator at least every three years, or more frequently if directed by the regulator. The most recent filing was dated December 31, 2013 and the next required filing is expected to be as at December 31, 2016.
The following tables set forth changes in the benefit obligations and fair value of plan assets for the Company’s defined benefit pension and other post-employment benefit plans for the years ended December 31, 2014 and 2013, as well as the funded status of the plans and amounts recognized in the Consolidated Financial Statements as at December 31, 2014 and 2013.
| Pension Benefits | OPEB | |||||||||||||||
| As at December 31 |
2014 | 2013 | 2014 | 2013 | ||||||||||||
| Change in Benefit Obligations |
||||||||||||||||
| Projected Benefit Obligation, Beginning of Year |
$ | 287 | $ | 357 | $ | 93 | $ | 105 | ||||||||
| Service cost |
3 | 4 | 10 | 12 | ||||||||||||
| Interest cost |
12 | 12 | 4 | 4 | ||||||||||||
| Actuarial (gains) losses |
19 | (22 | ) | 14 | (6 | ) | ||||||||||
| Exchange differences |
(22 | ) | (19 | ) | (3 | ) | — | |||||||||
| Employee contributions |
— | — | 1 | — | ||||||||||||
| Benefits paid |
(20 | ) | (22 | ) | (5 | ) | (4 | ) | ||||||||
| Plan amendment |
— | — | — | (13 | ) | |||||||||||
| Settlement |
— | (26 | ) | — | — | |||||||||||
| Curtailment |
— | — | — | (5 | ) | |||||||||||
| Special termination benefits |
— | 3 | — | — | ||||||||||||
|
|
|
|
|
|
|
|
|
|||||||||
| Projected Benefit Obligation, End of Year |
$ | 279 | $ | 287 | $ | 114 | $ | 93 | ||||||||
|
|
|
|
|
|
|
|
|
|||||||||
| Change in Plan Assets |
||||||||||||||||
| Fair Value of Plan Assets, Beginning of Year |
$ | 291 | $ | 309 | $ | — | $ | — | ||||||||
| Actual return on plan assets |
26 | 40 | — | — | ||||||||||||
| Exchange differences |
(25 | ) | (21 | ) | — | — | ||||||||||
| Employee contributions |
— | — | 1 | — | ||||||||||||
| Employer contributions |
2 | 12 | 4 | 4 | ||||||||||||
| Benefits paid |
(20 | ) | (22 | ) | (5 | ) | (4 | ) | ||||||||
| Transfers to defined contribution plan |
(10 | ) | — | — | — | |||||||||||
| Settlement |
— | (26 | ) | — | — | |||||||||||
| Special termination benefits |
— | (1 | ) | — | — | |||||||||||
|
|
|
|
|
|
|
|
|
|||||||||
| Fair Value of Plan Assets, End of Year |
$ | 264 | $ | 291 | $ | — | $ | — | ||||||||
|
|
|
|
|
|
|
|
|
|||||||||
| Funded Status of Plan Assets, End of Year |
$ | (15 | ) | $ | 4 | $ | (114 | ) | $ | (93 | ) | |||||
|
|
|
|
|
|
|
|
|
|||||||||
| Total Recognized Amounts in the Consolidated Balance Sheet Consist of: |
||||||||||||||||
| Other assets |
$ | 4 | $ | 10 | $ | — | $ | — | ||||||||
| Current liabilities |
— | — | (7 | ) | (6 | ) | ||||||||||
| Non-current liabilities |
(19 | ) | (6 | ) | (107 | ) | (87 | ) | ||||||||
|
|
|
|
|
|
|
|
|
|||||||||
| Total |
$ | (15 | ) | $ | 4 | $ | (114 | ) | $ | (93 | ) | |||||
|
|
|
|
|
|
|
|
|
|||||||||
| Total Recognized Amounts in Accumulated Other Comprehensive Income Consist of: |
||||||||||||||||
| Net actuarial (gain) loss |
$ | 44 | $ | 37 | $ | 9 | $ | (6 | ) | |||||||
| Prior service costs |
(5 | ) | (6 | ) | (7 | ) | (8 | ) | ||||||||
|
|
|
|
|
|
|
|
|
|||||||||
| Total recognized in accumulated other comprehensive income, before tax |
$ | 39 | $ | 31 | $ | 2 | $ | (14 | ) | |||||||
|
|
|
|
|
|
|
|
|
|||||||||
88 Encana Corporation | Annual Report 2014
The accumulated defined benefit obligation for all defined benefit plans was $374 million as at December 31, 2014 (2013 – $362 million). The following sets forth the defined benefit plans with accumulated benefit obligation and projected benefit obligation in excess of the plan assets fair value:
| Pension Benefits | OPEB | |||||||||||||||
| As at December 31 |
2014 | 2013 | 2014 | 2013 | ||||||||||||
| Projected Benefit Obligation |
$ | (279 | ) | $ | (87 | ) | $ | (114 | ) | $ | (93 | ) | ||||
| Accumulated Benefit Obligation |
(260 | ) | (72 | ) | (114 | ) | (93 | ) | ||||||||
| Fair Value of Plan Assets |
260 | 81 | — | — | ||||||||||||
Following are the weighted average assumptions used by the Company in determining the defined benefit pension and other post-employment benefit obligations:
| Pension Benefits | OPEB | |||||||||||||||
| As at December 31 |
2014 | 2013 | 2014 | 2013 | ||||||||||||
| Discount Rate |
3.75 | % | 4.50 | % | 3.67 | % | 4.45 | % | ||||||||
| Rates of Increase in Compensation Levels |
3.99 | % | 3.99 | % | 6.39 | % | 6.38 | % | ||||||||
The following sets forth total benefit plan expense recognized by the Company in 2014, 2013 and 2012:
| Pension Benefits | OPEB | |||||||||||||||||||||||
| For the years ended December 31 |
2014 | 2013 | 2012 | 2014 | 2013 | 2012 | ||||||||||||||||||
| Defined Benefit Plan Expense |
$ | — | $ | 21 | $ | 6 | $ | 12 | $ | 11 | $ | 18 | ||||||||||||
| Defined Contribution Plan Expense |
34 | 43 | 44 | — | — | — | ||||||||||||||||||
|
|
|
|
|
|
|
|
|
|
|
|
|
|||||||||||||
| Total Benefit Plans Expense |
$ | 34 | $ | 64 | $ | 50 | $ | 12 | $ | 11 | $ | 18 | ||||||||||||
|
|
|
|
|
|
|
|
|
|
|
|
|
|||||||||||||
Of the total benefit plans expense, $36 million (2013 – $60 million; 2012 – $55 million) was included in operating expense and $10 million (2013 – $15 million; 2012 – $13 million) was included in administrative expense.
The defined periodic pension and OPEB expense are as follows:
| Pension Benefits | OPEB | |||||||||||||||||||||||
| For the years ended December 31 |
2014 | 2013 | 2012 | 2014 | 2013 | 2012 | ||||||||||||||||||
| Current service cost |
$ | 3 | $ | 4 | $ | 5 | $ | 10 | $ | 12 | $ | 14 | ||||||||||||
| Interest cost |
12 | 12 | 14 | 4 | 4 | 4 | ||||||||||||||||||
| Expected return on plan assets |
(15 | ) | (16 | ) | (28 | ) | — | — | — | |||||||||||||||
| Amounts reclassified from accumulated other comprehensive income: |
||||||||||||||||||||||||
| Amortization of net actuarial (gains) and losses |
— | 11 | 15 | (1 | ) | — | — | |||||||||||||||||
| Amortization of net prior service costs |
— | — | — | (1 | ) | — | — | |||||||||||||||||
| Settlement |
— | 5 | — | — | — | — | ||||||||||||||||||
| Curtailment |
— | 1 | — | — | (5 | ) | — | |||||||||||||||||
| Special termination benefits |
— | 4 | — | — | — | — | ||||||||||||||||||
|
|
|
|
|
|
|
|
|
|
|
|
|
|||||||||||||
| Total Defined Benefit Plan Expense |
$ | — | $ | 21 | $ | 6 | $ | 12 | $ | 11 | $ | 18 | ||||||||||||
|
|
|
|
|
|
|
|
|
|
|
|
|
|||||||||||||
Annual Report 2014 | Encana Corporation 89
The amounts recognized in other comprehensive income are as follows:
| Pension Benefits | OPEB | |||||||||||||||||||||||
| For the years ended December 31 |
2014 | 2013 | 2012 | 2014 | 2013 | 2012 | ||||||||||||||||||
| Net actuarial (gains) losses |
$ | 8 | $ | (46 | ) | $ | 2 | $ | 14 | $ | (6 | ) | $ | (5 | ) | |||||||||
| Plan amendment |
— | — | — | — | (13 | ) | — | |||||||||||||||||
| Amortization of net actuarial gains and losses |
— | (11 | ) | (15 | ) | 1 | — | — | ||||||||||||||||
| Amortization of net prior service costs |
— | — | — | 1 | — | — | ||||||||||||||||||
| Settlement and curtailment |
— | (6 | ) | — | — | — | — | |||||||||||||||||
|
|
|
|
|
|
|
|
|
|
|
|
|
|||||||||||||
| Total amounts recognized in other comprehensive (income) loss, before tax |
$ | 8 | $ | (63 | ) | $ | (13 | ) | $ | 16 | $ | (19 | ) | $ | (5 | ) | ||||||||
|
|
|
|
|
|
|
|
|
|
|
|
|
|||||||||||||
| Total amounts recognized in other comprehensive (income) loss, after tax |
$ | 6 | $ | (46 | ) | $ | (9 | ) | $ | 11 | $ | (14 | ) | $ | (4 | ) | ||||||||
|
|
|
|
|
|
|
|
|
|
|
|
|
|||||||||||||
The estimated net actuarial loss and net prior service costs for the pension and other post-retirement plans that will be amortized from accumulated other comprehensive income into net benefit plan expense in 2015 is $2 million.
Following are the weighted average assumptions used by the Company in determining the net periodic pension and other post-retirement benefit costs for 2014, 2013 and 2012.
| Pension Benefits | OPEB | |||||||||||||||||||||||
| For the years ended December 31 |
2014 | 2013 | 2012 | 2014 | 2013 | 2012 | ||||||||||||||||||
| Discount Rate |
4.50 | % | 4.25 | % | 4.00 | % | 4.49 | % | 3.59 | % | 4.31 | % | ||||||||||||
| Long-Term Rate of Return on Plan Assets |
6.50 | % | 6.75 | % | 6.75 | % | — | — | — | |||||||||||||||
| Rates of Increase in Compensation Levels |
3.99 | % | 3.99 | % | 4.11 | % | 6.50 | % | 6.35 | % | 6.41 | % | ||||||||||||
The Company’s assumed health care cost trend rates are as follows:
| For the years ended December 31 |
2014 | 2013 | 2012 | |||||||||
| Health care cost trend rate for next year |
7.00 | % | 7.31 | % | 7.70 | % | ||||||
| Rate to which the cost trend rate is assumed to decline (ultimate trend rate) |
4.59 | % | 4.61 | % | 4.63 | % | ||||||
| Year that the rate reaches the ultimate trend rate |
2024 | 2026 | 2025 | |||||||||
A one percent change in the assumed health care cost trend rate over the projected period would have the following effects:
| 1% Increase | 1% Decrease | |||||||
| Effect on total of service and interest cost components |
$ | 1 | $ | (1 | ) | |||
| Effect on other post-retirement benefit obligations |
$ | 8 | $ | (7 | ) | |||
The Company expects to contribute $10 million to its defined benefit pension plans in 2015. The Company’s OPEB plans are funded on an as required basis.
The following provides an estimate of benefit payments for the next 10 years. These estimates reflect benefit increases due to continuing employee service.
| Defined Benefit Pension Payments |
Other Benefit Payments |
|||||||
| 2015 |
$ | 18 | $ | 7 | ||||
| 2016 |
18 | 7 | ||||||
| 2017 |
18 | 8 | ||||||
| 2018 |
18 | 9 | ||||||
| 2019 |
18 | 9 | ||||||
| 2020 - 2024 |
90 | 47 | ||||||
90 Encana Corporation | Annual Report 2014
The Company’s defined benefit pension plan assets are presented by investment asset category and input level within the fair value hierarchy as follows:
| As at December 31 |
2014 | |||||||||||||||
| Level 1 | Level 2 | Level 3 | Total | |||||||||||||
| Investments: |
||||||||||||||||
| Cash and Cash Equivalents |
$ | 34 | $ | 1 | $ | — | $ | 35 | ||||||||
| Fixed Income - Canadian Bond Funds |
— | 82 | — | 82 | ||||||||||||
| Equity - Domestic |
20 | 50 | — | 70 | ||||||||||||
| Equity - International |
— | 64 | — | 64 | ||||||||||||
| Real Estate and Other |
1 | — | 12 | 13 | ||||||||||||
|
|
|
|
|
|
|
|
|
|||||||||
| Fair Value of Plan Assets, End of Year |
$ | 55 | $ | 197 | $ | 12 | $ | 264 | ||||||||
|
|
|
|
|
|
|
|
|
|||||||||
| As at December 31 |
2013 | |||||||||||||||
| Level 1 | Level 2 | Level 3 | Total | |||||||||||||
| Investments: |
||||||||||||||||
| Cash and Cash Equivalents |
$ | 51 | $ | 1 | $ | — | $ | 52 | ||||||||
| Fixed Income - Canadian Bond Funds |
— | 57 | — | 57 | ||||||||||||
| Equity - Domestic |
35 | 62 | — | 97 | ||||||||||||
| Equity - International |
— | 71 | — | 71 | ||||||||||||
| Real Estate and Other |
1 | — | 13 | 14 | ||||||||||||
|
|
|
|
|
|
|
|
|
|||||||||
| Fair Value of Plan Assets, End of Year |
$ | 87 | $ | 191 | $ | 13 | $ | 291 | ||||||||
|
|
|
|
|
|
|
|
|
|||||||||
Fixed income investments consist of Canadian bonds issued by investment grade companies. Equity investments consist of both domestic and international securities. The fair values of these securities are based on dealer quotes, quoted market prices, and net asset values as provided by the investment managers. Real Estate and Other consists mainly of commercial properties and is valued based on a discounted cash flow model.
| Real Estate and Other | ||||||||
| As at December 31 |
2014 | 2013 | ||||||
| Balance, Beginning of Year |
$ | 13 | $ | 13 | ||||
| Purchases, issuances and settlements |
||||||||
| Purchases |
— | — | ||||||
| Settlements |
— | — | ||||||
| Actual return on plan assets |
||||||||
| Relating to assets sold during the reporting period |
— | — | ||||||
| Relating to assets still held at the reporting date |
(1 | ) | — | |||||
|
|
|
|
|
|||||
| Balance, End of Year |
$ | 12 | $ | 13 | ||||
|
|
|
|
|
|||||
The Company’s pension plan assets were invested in the following as at December 31, 2014: 26 percent Domestic Equity (2013 – 39 percent), 24 percent Foreign Equity (2013 – 29 percent), 44 percent Bonds (2013 – 26 percent), and 6 percent Real Estate and Other (2013 – 6 percent). The expected long-term rate of return is 6.50 percent. The expected rate of return on pension plan assets is based on historical and projected rates of return for each asset class in the plan investment portfolio. The actual return on plan assets was $26 million (2013 – $40 million). The asset allocation structure is subject to diversification requirements and constraints, which reduce risk by limiting exposure to individual equity investment, credit rating categories and foreign currency exposure.
Annual Report 2014 | Encana Corporation 91
22. FAIR VALUE MEASUREMENTS
The fair values of cash and cash equivalents, accounts receivable and accrued revenues, and accounts payable and accrued liabilities approximate their carrying amounts due to the short-term maturity of those instruments except for the amounts associated with share units issued as part of the Split Transaction, as disclosed below. The fair value of cash in reserve approximates its carrying amount due to the nature of the instrument held. Fair value information related to pension plan assets is included in Note 21.
Recurring fair value measurements are performed for risk management assets and liabilities and for share units resulting from the Split Transaction, which are discussed further in Notes 23 and 20, respectively. These items are carried at fair value in the Consolidated Balance Sheet and are classified within the three levels of the fair value hierarchy in the following tables. There have been no transfers between the hierarchy levels during the period.
| As at December 31, 2014 |
Level 1 Quoted Prices in Active Markets |
Level 2 Other Observable Inputs |
Level 3 Significant Unobservable Inputs |
Total Fair Value |
Netting (1) | Carrying Amount |
||||||||||||||||||
| Risk Management |
||||||||||||||||||||||||
| Risk Management Assets |
||||||||||||||||||||||||
| Current |
$ | — | $ | 718 | $ | — | $ | 718 | $ | (11 | ) | $ | 707 | |||||||||||
| Long-term |
— | 67 | — | 67 | (2 | ) | 65 | |||||||||||||||||
| Risk Management Liabilities |
||||||||||||||||||||||||
| Current |
6 | 14 | 11 | 31 | (11 | ) | 20 | |||||||||||||||||
| Long-term |
— | 2 | 7 | 9 | (2 | ) | 7 | |||||||||||||||||
| As at December 31, 2013 |
Level 1 Quoted Prices in Active Markets |
Level 2 Other Observable Inputs |
Level 3 Significant Unobservable Inputs |
Total Fair Value |
Netting (1) | Carrying Amount |
||||||||||||||||||
| Risk Management |
||||||||||||||||||||||||
| Risk Management Assets |
||||||||||||||||||||||||
| Current |
$ | — | $ | 71 | $ | — | $ | 71 | $ | (15 | ) | $ | 56 | |||||||||||
| Long-term |
— | 204 | — | 204 | — | 204 | ||||||||||||||||||
| Risk Management Liabilities |
||||||||||||||||||||||||
| Current |
— | 38 | 2 | 40 | (15 | ) | 25 | |||||||||||||||||
| Long-term |
— | — | 5 | 5 | — | 5 | ||||||||||||||||||
| Share Units Resulting from the Split Transaction |
||||||||||||||||||||||||
| Encana Share Units Held by Cenovus Employees (2) |
$ | — | $ | — | $ | — | $ | — | $ | — | $ | — | ||||||||||||
| Cenovus Share Units Held by Encana Employees |
||||||||||||||||||||||||
| Accounts payable and accrued liabilities (3) |
— | — | 8 | 8 | — | 8 | ||||||||||||||||||
| (1) | Netting to offset derivative assets and liabilities where the legal right and intention to offset exists, or where counterparty master netting arrangements contain provisions for net settlement. |
| (2) | There were no remaining Encana share units held by Cenovus employees as at December 31, 2014 (2013 – 3.9 million share units with a weighted average exercise price of C$29.06). |
| (3) | There were no remaining Cenovus share units held by Encana employees as at December 31, 2014. |
The Company’s Level 1 and Level 2 risk management assets and liabilities consist of commodity fixed price contracts and basis swaps with terms to 2018. The fair values of these contracts are based on a market approach and are estimated using inputs which are either directly or indirectly observable at the reporting date, such as exchange and other published prices, broker quotes and observable trading activity.
92 Encana Corporation | Annual Report 2014
LEVEL 3 FAIR VALUE MEASUREMENTS
As at December 31, 2014, the Company’s Level 3 risk management assets and liabilities consist of power purchase contracts with terms to 2017. The fair values of the power purchase contracts are based on the income approach and are modelled internally using observable and unobservable inputs such as forward power prices in less active markets. The unobservable inputs are obtained from third parties whenever possible and reviewed by the Company for reasonableness.
Changes in amounts related to risk management assets and liabilities are recognized in revenues and transportation and processing expense according to their purpose. Changes in amounts related to share units resulting from the Split Transaction are recognized in operating expense, administrative expense and capitalized within property, plant and equipment as described in Note 20.
A summary of changes in Level 3 fair value measurements during 2014 and 2013 is presented below:
| Risk Management | Share Units Resulting from Split Transaction |
|||||||||||||||
| 2014 | 2013 | 2014 | 2013 | |||||||||||||
| Balance, Beginning of Year |
$ | (7 | ) | $ | (12 | ) | $ | (8 | ) | $ | (36 | ) | ||||
| Total gains (losses) |
(19 | ) | 3 | 3 | 16 | |||||||||||
| Purchases, issuances and settlements: |
||||||||||||||||
| Purchases |
— | — | — | — | ||||||||||||
| Settlements |
8 | 2 | 5 | 12 | ||||||||||||
| Transfers in and out of Level 3 |
— | — | — | — | ||||||||||||
|
|
|
|
|
|
|
|
|
|||||||||
| Balance, End of Year |
$ | (18 | ) | $ | (7 | ) | $ | — | $ | (8 | ) | |||||
|
|
|
|
|
|
|
|
|
|||||||||
| Change in unrealized gains (losses) related to assets and liabilities held at end of year |
$ | (13 | ) | $ | (2 | ) | $ | — | $ | 20 | ||||||
|
|
|
|
|
|
|
|
|
|||||||||
Quantitative information about unobservable inputs used in Level 3 fair value measurements is presented below:
| Valuation Technique |
Unobservable Input |
2014 | 2013 | |||||
| Risk Management - Power |
Discounted Cash Flow | Forward prices ($/Megawatt Hour) |
$40.70 - $48.50 | $49.25 - $54.47 | ||||
| Share Units Resulting from the Split Transaction |
Option Model | Cenovus share unit volatility | — | 27.75% | ||||
A 10 percent increase or decrease in estimated forward power prices would cause a corresponding $5 million (2013 – $7 million) increase or decrease to net risk management assets and liabilities. As at December 31, 2014, all share units resulting from the Split Transaction have expired. As at December 31, 2013, a five percentage point increase or decrease in Cenovus share unit estimated volatility would cause no increase or decrease to accounts payable and accrued liabilities.
Annual Report 2014 | Encana Corporation 93
23. FINANCIAL INSTRUMENTS AND RISK MANAGEMENT
A) FINANCIAL INSTRUMENTS
Encana’s financial assets and liabilities are recognized in cash and cash equivalents, accounts receivable and accrued revenues, cash in reserve, accounts payable and accrued liabilities, risk management assets and liabilities and long-term debt.
B) RISK MANAGEMENT ASSETS AND LIABILITIES
Risk management assets and liabilities arise from the use of derivative financial instruments and are measured at fair value. See Note 22 for a discussion of fair value measurements.
UNREALIZED RISK MANAGEMENT POSITION
| As at December 31 |
2014 | 2013 | ||||||
| Risk Management Assets |
||||||||
| Current |
$ | 707 | $ | 56 | ||||
| Long-term |
65 | 204 | ||||||
|
|
|
|
|
|||||
| 772 | 260 | |||||||
| Risk Management Liabilities |
||||||||
| Current |
20 | 25 | ||||||
| Long-term |
7 | 5 | ||||||
|
|
|
|
|
|||||
| 27 | 30 | |||||||
|
|
|
|
|
|||||
| Net Risk Management Assets |
$ | 745 | $ | 230 | ||||
|
|
|
|
|
|||||
SUMMARY OF UNREALIZED RISK MANAGEMENT POSITIONS – BY PRODUCT
| As at December 31 |
2014 | 2013 | ||||||||||||||||||||||
| Risk Management | Risk Management | |||||||||||||||||||||||
| Asset | Liability | Net | Asset | Liability | Net | |||||||||||||||||||
| Commodity Prices |
||||||||||||||||||||||||
| Natural gas |
$ | 609 | $ | 5 | $ | 604 | $ | 183 | $ | 15 | $ | 168 | ||||||||||||
| Crude oil |
163 | 4 | 159 | 77 | 8 | 69 | ||||||||||||||||||
| Power |
— | 18 | (18 | ) | — | 7 | (7 | ) | ||||||||||||||||
|
|
|
|
|
|
|
|
|
|
|
|
|
|||||||||||||
| Total Fair Value |
$ | 772 | $ | 27 | $ | 745 | $ | 260 | $ | 30 | $ | 230 | ||||||||||||
|
|
|
|
|
|
|
|
|
|
|
|
|
|||||||||||||
94 Encana Corporation | Annual Report 2014
COMMODITY PRICE POSITIONS AS AT DECEMBER 31, 2014
| Notional Volumes | Term | Average Price | Fair Value | |||||||||||||||||||
| Natural Gas Contracts |
||||||||||||||||||||||
| Fixed Price Contracts |
||||||||||||||||||||||
| NYMEX Fixed Price |
1,062 | MMcf/d | 2015 | 4.29 | US$/Mcf | $ | 487 | |||||||||||||||
| Basis Contracts (1) |
2015-2018 | 120 | ||||||||||||||||||||
| Other Financial Positions |
(3 | ) | ||||||||||||||||||||
|
|
|
|||||||||||||||||||||
| Natural Gas Fair Value Position |
604 | |||||||||||||||||||||
|
|
|
|||||||||||||||||||||
| Crude Oil Contracts |
||||||||||||||||||||||
| Fixed Price Contracts |
||||||||||||||||||||||
| WTI Fixed Price |
12.3 | Mbbls/d | 2015 | 92.88 | US$/bbl | 161 | ||||||||||||||||
| WTI Fixed Price |
1.2 | Mbbls/d | 2016 | 92.35 | US$/bbl | 14 | ||||||||||||||||
| Basis Contracts (2) |
2015-2016 | (16 | ) | |||||||||||||||||||
|
|
|
|||||||||||||||||||||
| Crude Oil Fair Value Position |
159 | |||||||||||||||||||||
|
|
|
|||||||||||||||||||||
| Power Purchase Contracts |
||||||||||||||||||||||
| Fair Value Position |
(18 | ) | ||||||||||||||||||||
|
|
|
|||||||||||||||||||||
| Total Fair Value |
$ | 745 | ||||||||||||||||||||
|
|
|
|||||||||||||||||||||
| (1) | Encana has entered into swaps to protect against widening natural gas price differentials between benchmark and regional sales prices. These basis swaps are priced using differentials determined as a percentage of NYMEX. |
| (2) | Encana has entered into swaps to protect against widening Brent and Midland differentials to WTI. These basis swaps are priced using fixed price differentials. |
EARNINGS IMPACT OF REALIZED AND UNREALIZED GAINS (LOSSES) ON RISK MANAGEMENT POSITIONS
| Realized Gain (Loss) | ||||||||||||
| For the years ended December 31 |
2014 | 2013 | 2012 | |||||||||
| Revenues, Net of Royalties |
$ | (84 | ) | $ | 544 | $ | 2,149 | |||||
| Transportation and Processing |
(7 | ) | — | 12 | ||||||||
|
|
|
|
|
|
|
|||||||
| Gain (Loss) on Risk Management |
$ | (91 | ) | $ | 544 | $ | 2,161 | |||||
|
|
|
|
|
|
|
|||||||
| Unrealized Gain (Loss) | ||||||||||||
| For the years ended December 31 |
2014 | 2013 | 2012 | |||||||||
| Revenues, Net of Royalties |
$ | 456 | $ | (347 | ) | $ | (1,441 | ) | ||||
| Transportation and Processing |
(12 | ) | 2 | (24 | ) | |||||||
|
|
|
|
|
|
|
|||||||
| Gain (Loss) on Risk Management |
$ | 444 | $ | (345 | ) | $ | (1,465 | ) | ||||
|
|
|
|
|
|
|
|||||||
RECONCILIATION OF UNREALIZED RISK MANAGEMENT POSITIONS FROM JANUARY 1 TO DECEMBER 31
| 2014 | 2013 | 2012 | ||||||||||||||
| Fair Value | Total Unrealized Gain (Loss) |
Total Unrealized Gain (Loss) |
Total Unrealized Gain (Loss) |
|||||||||||||
| Fair Value of Contracts, Beginning of Year |
$ | 230 | ||||||||||||||
| Change in Fair Value of Contracts in Place at Beginning of Year and Contracts Entered into During the Year |
353 | $ | 353 | $ | 199 | $ | 696 | |||||||||
| Foreign Exchange Translation Adjustment on Canadian Dollar Contracts |
1 | |||||||||||||||
| Fair Value of Athlon Crude Oil Contracts Acquired |
70 | |||||||||||||||
| Fair Value of Contracts Realized During the Year |
91 | 91 | (544 | ) | (2,161 | ) | ||||||||||
|
|
|
|
|
|
|
|
|
|||||||||
| Fair Value of Contracts, End of Year |
$ | 745 | $ | 444 | $ | (345 | ) | $ | (1,465 | ) | ||||||
|
|
|
|
|
|
|
|
|
|||||||||
Annual Report 2014 | Encana Corporation 95
C) RISKS ASSOCIATED WITH FINANCIAL ASSETS AND LIABILITIES
The Company is exposed to financial risks including market risks (such as commodity prices, foreign exchange and interest rates), credit risk and liquidity risk. Future cash flows may fluctuate due to movement in market prices and the exposure to credit and liquidity risks.
COMMODITY PRICE RISK
Commodity price risk arises from the effect fluctuations in future commodity prices may have on future cash flows. To partially mitigate exposure to commodity price risk, the Company has entered into various derivative financial instruments. The use of these derivative instruments is governed under formal policies and is subject to limits established by the Board. The Company’s policy is to not use derivative financial instruments for speculative purposes.
Natural Gas – To partially mitigate natural gas commodity price risk, the Company uses contracts such as NYMEX-based swaps and options. Encana also enters into basis swaps to manage against widening price differentials between various production areas and various sales points.
Crude Oil – To partially mitigate against crude oil commodity price risk including widening price differentials between North American and world prices, the Company has entered into fixed price contracts and basis swaps.
Power – The Company has entered into Canadian dollar denominated derivative contracts to manage its electricity consumption costs.
The table below summarizes the sensitivity of the fair value of the Company’s risk management positions to fluctuations in commodity prices, with all other variables held constant. The Company has used a 10 percent variability to assess the potential impact of commodity price changes. Fluctuations in commodity prices could have resulted in unrealized gains (losses) impacting pre-tax net earnings as at December 31 as follows:
| 2014 | 2013 | |||||||||||||||
| 10% Price Increase |
10% Price Decrease |
10% Price Increase |
10% Price Decrease |
|||||||||||||
| Natural gas price |
$ | (105 | ) | $ | 105 | $ | (441 | ) | $ | 441 | ||||||
| Crude oil price |
(22 | ) | 22 | (19 | ) | 19 | ||||||||||
| Power price |
5 | (5 | ) | 7 | (7 | ) | ||||||||||
CREDIT RISK
Credit risk arises from the potential that the Company may incur a loss if a counterparty to a financial instrument fails to meet its obligation in accordance with agreed terms. This credit risk exposure is mitigated through the use of Board-approved credit policies governing the Company’s credit portfolio including credit practices that limit transactions according to counterparties’ credit quality. Mitigation strategies may include master netting arrangements, requesting collateral and/or transacting credit derivatives. The Company executes commodity derivative financial instruments under master agreements that have netting provisions that provide for offsetting payables against receivables. As at December 31, 2014, the Company had no significant collateral balances posted or received and there were no credit derivatives in place.
As at December 31, 2014, cash equivalents include high-grade, short-term securities, placed primarily with financial institutions and companies with strong investment grade ratings. Any foreign currency agreements entered into are with major financial institutions in Canada and the U.S. or with counterparties having investment grade credit ratings.
A substantial portion of the Company’s accounts receivable are with customers in the oil and gas industry and are subject to normal industry credit risks. As at December 31, 2014, approximately 94 percent (2013 – 87 percent) of Encana’s accounts receivable and financial derivative credit exposures were with investment grade counterparties.
As at December 31, 2014, Encana had three counterparties (2013 – four counterparties) whose net settlement position individually accounted for more than 10 percent of the fair value of the outstanding in-the-money net risk management contracts by counterparty. As at December 31, 2014, these counterparties accounted for 16 percent, 16 percent and 15 percent (2013 – 24 percent, 14 percent, 14 percent and 13 percent) of the fair value of the outstanding in-the-money net risk management contracts.
96 Encana Corporation | Annual Report 2014
LIQUIDITY RISK
Liquidity risk arises from the potential that the Company will encounter difficulties in meeting a demand to fund its financial liabilities as they come due. The Company manages liquidity risk using cash and debt management programs.
The Company has access to cash equivalents and a range of funding alternatives at competitive rates through committed revolving bank credit facilities and debt and equity capital markets. As at December 31, 2014, the Company had committed revolving bank credit facilities totaling $4.0 billion which include C$3.5 billion ($3.0 billion) on a revolving bank credit facility for Encana and $1.0 billion on a revolving bank credit facility for a U.S. subsidiary, the latter of which remains unused. The facilities remain committed through June 2018. Of the C$3.5 billion ($3.0 billion) revolving bank credit facility, $1.7 billion remained unused and $1.3 billion was drawn to redeem the senior notes assumed by Encana in conjunction with the Athlon acquisition as discussed in Note 13.
Encana also has accessible capacity under a shelf prospectus for up to $6.0 billion, or the equivalent in foreign currencies, the availability of which is dependent on market conditions, to issue up to $6.0 billion of debt and/or equity securities in Canada and/or the U.S. The shelf prospectus expires in July 2016.
The Company believes it has sufficient funding through the use of these facilities to meet foreseeable borrowing requirements.
The Company minimizes its liquidity risk by managing its capital structure. The Company’s capital structure consists of shareholders’ equity plus long-term debt, including the current portion. The Company’s objectives when managing its capital structure are to maintain financial flexibility to preserve Encana’s access to capital markets and its ability to meet financial obligations and to finance internally generated growth as well as potential acquisitions. To manage the capital structure, the Company may adjust capital spending, adjust dividends paid to shareholders, issue new shares, issue new debt or repay existing debt.
The timing of expected cash outflows relating to financial liabilities is outlined in the table below:
| Less Than 1 Year | 1 - 3 Years | 4 - 5 Years | 6 - 9 Years | Thereafter | Total | |||||||||||||||||||
| Accounts Payable and Accrued Liabilities |
$ | 2,243 | $ | — | $ | — | $ | — | $ | — | $ | 2,243 | ||||||||||||
| Risk Management Liabilities |
20 | 7 | — | — | — | 27 | ||||||||||||||||||
| Long-Term Debt (1) |
396 | 1,493 | 3,030 | 1,610 | 6,392 | 12,921 | ||||||||||||||||||
| (1) | Principal and interest. |
Included in Encana’s long-term debt obligations of $12,921 million at December 31, 2014 are $1,277 million in principal obligations related to LIBOR loans drawn on the credit facility. These amounts are fully supported and Management expects that they will continue to be supported by revolving credit facilities that have no repayment requirements within the next year. The revolving credit facilities are fully revolving for a period of up to five years. Based on the current maturity dates of the credit facilities, these amounts are included in cash outflows for the period disclosed as 4 – 5 Years. Further information on Long-Term Debt is contained in Note 13.
FOREIGN EXCHANGE RISK
Foreign exchange risk arises from changes in foreign exchange rates that may affect the fair value or future cash flows of the Company’s financial assets or liabilities. As Encana operates primarily in North America, fluctuations in the exchange rate between the U.S. and Canadian dollars can have a significant effect on the Company’s reported results. Encana’s financial results are consolidated in Canadian dollars; however, the Company reports its results in U.S. dollars as most of its revenue is closely tied to the U.S. dollar and to facilitate a more direct comparison to other North American oil and gas companies. As the effects of foreign exchange fluctuations are embedded in the Company’s results, the total effect of foreign exchange fluctuations is not separately identifiable.
To mitigate the exposure to the fluctuating U.S./Canadian dollar exchange rate, Encana maintains a mix of both U.S. dollar and Canadian dollar debt and may also enter into foreign exchange derivatives. As at December 31, 2014, Encana had $6.7 billion in U.S. dollar debt issued from Canada that was subject to foreign exchange exposure (2013 – $5.4 billion) and $0.6 billion in debt that was not subject to foreign exchange exposure (2013 – $1.7 billion). There were no foreign exchange derivatives outstanding as at December 31, 2014.
Encana’s foreign exchange (gain) loss primarily includes unrealized foreign exchange gains and losses on the translation of U.S. dollar denominated debt issued from Canada, unrealized foreign exchange gains and losses on the translation of U.S. dollar denominated risk management assets and liabilities held in Canada and foreign exchange gains and losses on U.S. dollar denominated cash and short-term investments held in Canada. A $0.01 change in the U.S. to Canadian dollar exchange rate would have resulted in a $61 million change in foreign exchange (gain) loss as at December 31, 2014 (2013 – $48 million; 2012 – $51 million).
INTEREST RATE RISK
Interest rate risk arises from changes in market interest rates that may affect the fair value or future cash flows from the Company’s financial assets or liabilities. The Company may partially mitigate its exposure to interest rate changes by holding a mix of both fixed and floating rate debt and may also enter into interest rate derivatives to partially mitigate effects of fluctuations in market interest rates. There were no interest rate derivatives outstanding as at December 31, 2014.
As at December 31, 2014, the Company had floating rate debt of $1,277 million. Accordingly, the sensitivity in net earnings for each one percent change in interest rates on floating rate debt was $10 million (2013 – nil; 2012 – nil).
Annual Report 2014 | Encana Corporation 97
24. SUPPLEMENTARY INFORMATION
A) NET CHANGE IN NON-CASH WORKING CAPITAL
| For the years ended December 31 |
2014 | 2013 | 2012 | |||||||||
| Operating Activities |
||||||||||||
| Accounts receivable and accrued revenues |
$ | (411 | ) | $ | (75 | ) | $ | 82 | ||||
| Accounts payable and accrued liabilities |
188 | (81 | ) | (456 | ) | |||||||
| Income tax payable and receivable |
214 | (23 | ) | 51 | ||||||||
|
|
|
|
|
|
|
|||||||
| $ | (9 | ) | $ | (179 | ) | $ | (323 | ) | ||||
|
|
|
|
|
|
|
|||||||
B) SUPPLEMENTARY CASH FLOW INFORMATION
| For the years ended December 31 |
2014 | 2013 | 2012 | |||||||||
| Interest Paid |
$ | 648 | $ | 575 | $ | 509 | ||||||
| Income Taxes Paid, net of Amounts (Recovered) |
$ | 43 | $ | (186 | ) | $ | (124 | ) | ||||
25. COMMITMENTS AND CONTINGENCIES
COMMITMENTS
The following table outlines the Company’s commitments as at December 31, 2014:
| Expected Future Payments | ||||||||||||||||||||||||||||
| (undiscounted) |
2015 | 2016 | 2017 | 2018 | 2019 | Thereafter | Total | |||||||||||||||||||||
| Transportation and Processing |
$ | 878 | $ | 825 | $ | 815 | $ | 800 | $ | 673 | $ | 3,204 | $ | 7,195 | ||||||||||||||
| Drilling and Field Services |
312 | 138 | 93 | 47 | 16 | 17 | 623 | |||||||||||||||||||||
| Operating Leases |
43 | 36 | 28 | 26 | 10 | 24 | 167 | |||||||||||||||||||||
|
|
|
|
|
|
|
|
|
|
|
|
|
|
|
|||||||||||||||
| Total |
$ | 1,233 | $ | 999 | $ | 936 | $ | 873 | $ | 699 | $ | 3,245 | $ | 7,985 | ||||||||||||||
|
|
|
|
|
|
|
|
|
|
|
|
|
|
|
|||||||||||||||
CONTINGENCIES
Encana is involved in various legal claims and actions arising in the course of the Company’s operations. Although the outcome of these claims cannot be predicted with certainty, the Company does not expect these matters to have a material adverse effect on Encana’s financial position, cash flows or results of operations. If an unfavourable outcome were to occur, there exists the possibility of a material adverse impact on the Company’s consolidated net earnings or loss in the period in which the outcome is determined. Accruals for litigation and claims are recognized if the Company determines that the loss is probable and the amount can be reasonably estimated. The Company believes it has made adequate provision for such legal claims.
26. SUPPLEMENTARY OIL AND GAS INFORMATION (UNAUDITED)
STANDARDIZED MEASURE OF DISCOUNTED FUTURE NET CASH FLOWS AND CHANGES THEREIN
In calculating the standardized measure of discounted future net cash flows, constant price and cost assumptions were applied to Encana’s annual future production from proved reserves to determine cash inflows. Future production and development costs assume the continuation of existing economic, operating and regulatory conditions. Future income taxes are calculated by applying statutory income tax rates to future pre-tax cash flows after provision for the tax cost of the oil and natural gas properties based upon existing laws and regulations. The discount was computed by application of a 10 percent discount factor to the future net cash flows. The calculation of the standardized measure of discounted future net cash flows is based upon the discounted future net cash flows prepared by Encana’s independent qualified reserves evaluators in relation to the reserves they respectively evaluated, and adjusted to the extent provided by contractual arrangements, such as price risk management activities, in existence at year end and to account for asset retirement obligations and future income taxes.
Encana cautions that the discounted future net cash flows relating to proved oil and gas reserves are an indication of neither the fair market value of Encana’s oil and gas properties, nor the future net cash flows expected to be generated from such properties. The discounted future net cash flows do not include the fair market value of exploratory properties and probable or possible oil and gas reserves, nor is consideration given to the effect of anticipated future changes in oil and natural gas prices, development, asset retirement and production costs, and possible changes to tax and royalty regulations. The prescribed discount rate of 10 percent may not appropriately reflect future interest rates.
98 Encana Corporation | Annual Report 2014
NET PROVED RESERVES (1, 2)
(12-MONTH AVERAGE TRAILING PRICES; AFTER ROYALTIES)
| Natural Gas (Bcf) | Oil (MMbbls) | NGLs (MMbbls) | ||||||||||||||||||||||||||||||||||
| Canada | United States | Total | Canada | United States | Total | Canada | United States | Total | ||||||||||||||||||||||||||||
| 2012 |
||||||||||||||||||||||||||||||||||||
| Beginning of year |
6,329 | 6,511 | 12,840 | 5.9 | 38.2 | 44.1 | 89.1 | — | 89.1 | |||||||||||||||||||||||||||
| Revisions and improved recovery (3) |
(1,497 | ) | (1,701 | ) | (3,198 | ) | 3.0 | (5.0 | ) | (2.0 | ) | (13.0 | ) | 43.9 | 30.9 | |||||||||||||||||||||
| Extensions and discoveries |
638 | 338 | 976 | 7.4 | 19.3 | 26.7 | 18.5 | 19.9 | 38.4 | |||||||||||||||||||||||||||
| Purchase of reserves in place |
38 | 8 | 46 | — | 0.1 | 0.1 | — | — | — | |||||||||||||||||||||||||||
| Sale of reserves in place |
(461 | ) | (321 | ) | (782 | ) | (0.7 | ) | (2.8 | ) | (3.5 | ) | (1.5 | ) | (1.0 | ) | (2.5 | ) | ||||||||||||||||||
| Production |
(497 | ) | (593 | ) | (1,090 | ) | (2.6 | ) | (3.8 | ) | (6.4 | ) | (4.5 | ) | (0.4 | ) | (4.9 | ) | ||||||||||||||||||
|
|
|
|
|
|
|
|
|
|
|
|
|
|
|
|
|
|
|
|||||||||||||||||||
| End of year |
4,550 | 4,242 | 8,792 | 13.0 | 46.0 | 59.0 | 88.6 | 62.4 | 151.0 | |||||||||||||||||||||||||||
|
|
|
|
|
|
|
|
|
|
|
|
|
|
|
|
|
|
|
|||||||||||||||||||
| Developed |
2,985 | 2,628 | 5,613 | 9.9 | 25.0 | 34.9 | 37.9 | 18.1 | 56.0 | |||||||||||||||||||||||||||
| Undeveloped |
1,565 | 1,614 | 3,179 | 3.1 | 21.0 | 24.1 | 50.7 | 44.3 | 95.0 | |||||||||||||||||||||||||||
|
|
|
|
|
|
|
|
|
|
|
|
|
|
|
|
|
|
|
|||||||||||||||||||
| Total |
4,550 | 4,242 | 8,792 | 13.0 | 46.0 | 59.0 | 88.6 | 62.4 | 151.0 | |||||||||||||||||||||||||||
|
|
|
|
|
|
|
|
|
|
|
|
|
|
|
|
|
|
|
|||||||||||||||||||
| 2013 |
||||||||||||||||||||||||||||||||||||
| Beginning of year |
4,550 | 4,242 | 8,792 | 13.0 | 46.0 | 59.0 | 88.6 | 62.4 | 151.0 | |||||||||||||||||||||||||||
| Revisions and improved recovery (4) |
(256 | ) | (362 | ) | (618 | ) | 2.6 | (1.2 | ) | 1.4 | (9.6 | ) | (16.1 | ) | (25.7 | ) | ||||||||||||||||||||
| Extensions and discoveries |
499 | 482 | 981 | 11.5 | 14.3 | 25.8 | 16.7 | 13.3 | 30.0 | |||||||||||||||||||||||||||
| Purchase of reserves in place |
— | 7 | 7 | — | 0.5 | 0.5 | — | 0.1 | 0.1 | |||||||||||||||||||||||||||
| Sale of reserves in place |
(295 | ) | (1 | ) | (296 | ) | — | — | — | (1.5 | ) | (0.1 | ) | (1.6 | ) | |||||||||||||||||||||
| Production |
(523 | ) | (491 | ) | (1,014 | ) | (4.3 | ) | (5.1 | ) | (9.4 | ) | (6.8 | ) | (3.5 | ) | (10.3 | ) | ||||||||||||||||||
|
|
|
|
|
|
|
|
|
|
|
|
|
|
|
|
|
|
|
|||||||||||||||||||
| End of year |
3,975 | 3,877 | 7,852 | 22.8 | 54.5 | 77.3 | 87.4 | 56.1 | 143.5 | |||||||||||||||||||||||||||
|
|
|
|
|
|
|
|
|
|
|
|
|
|
|
|
|
|
|
|||||||||||||||||||
| Developed |
2,744 | 2,619 | 5,363 | 16.5 | 31.1 | 47.6 | 44.6 | 24.1 | 68.7 | |||||||||||||||||||||||||||
| Undeveloped |
1,231 | 1,258 | 2,489 | 6.3 | 23.4 | 29.7 | 42.8 | 32.0 | 74.8 | |||||||||||||||||||||||||||
|
|
|
|
|
|
|
|
|
|
|
|
|
|
|
|
|
|
|
|||||||||||||||||||
| Total |
3,975 | 3,877 | 7,852 | 22.8 | 54.5 | 77.3 | 87.4 | 56.1 | 143.5 | |||||||||||||||||||||||||||
|
|
|
|
|
|
|
|
|
|
|
|
|
|
|
|
|
|
|
|||||||||||||||||||
| 2014 |
||||||||||||||||||||||||||||||||||||
| Beginning of year |
3,975 | 3,877 | 7,852 | 22.8 | 54.5 | 77.3 | 87.4 | 56.1 | 143.5 | |||||||||||||||||||||||||||
| Revisions and improved recovery (5) |
250 | (511 | ) | (261 | ) | (5.0 | ) | (2.7 | ) | (7.7 | ) | 10.9 | (2.6 | ) | 8.3 | |||||||||||||||||||||
| Extensions and discoveries |
385 | 493 | 879 | 4.7 | 21.4 | 26.1 | 22.3 | 8.8 | 31.1 | |||||||||||||||||||||||||||
| Purchase of reserves in place |
6 | 234 | 240 | — | 148.2 | 148.2 | 0.1 | 52.9 | 53.0 | |||||||||||||||||||||||||||
| Sale of reserves in place |
(885 | ) | (1,473 | ) | (2,358 | ) | (6.6 | ) | (14.2 | ) | (20.8 | ) | (45.5 | ) | (20.0 | ) | (65.4 | ) | ||||||||||||||||||
| Production |
(503 | ) | (355 | ) | (858 | ) | (5.0 | ) | (13.1 | ) | (18.0 | ) | (8.6 | ) | (5.0 | ) | (13.6 | ) | ||||||||||||||||||
|
|
|
|
|
|
|
|
|
|
|
|
|
|
|
|
|
|
|
|||||||||||||||||||
| End of year |
3,229 | 2,265 | 5,494 | 10.9 | 194.1 | 205.0 | 66.6 | 90.2 | 156.7 | |||||||||||||||||||||||||||
|
|
|
|
|
|
|
|
|
|
|
|
|
|
|
|
|
|
|
|||||||||||||||||||
| Developed |
2,282 | 1,606 | 3,887 | 8.2 | 112.3 | 120.5 | 31.6 | 53.4 | 85.0 | |||||||||||||||||||||||||||
| Undeveloped |
947 | 660 | 1,607 | 2.8 | 81.8 | 84.5 | 34.9 | 36.8 | 71.7 | |||||||||||||||||||||||||||
|
|
|
|
|
|
|
|
|
|
|
|
|
|
|
|
|
|
|
|||||||||||||||||||
| Total |
3,229 | 2,265 | 5,494 | 10.9 | 194.1 | 205.0 | 66.6 | 90.2 | 156.7 | |||||||||||||||||||||||||||
|
|
|
|
|
|
|
|
|
|
|
|
|
|
|
|
|
|
|
|||||||||||||||||||
| * | Numbers may not add due to rounding |
Notes:
| (1) | Definitions: |
| a. | “Net” reserves are the remaining reserves of Encana, after deduction of estimated royalties and including royalty interests. |
| b. | “Proved” oil and gas reserves are those quantities of oil and gas which, by analysis of geoscience and engineering data, can be estimated with reasonable certainty to be economically producible from a given date forward, from known reservoirs, and under existing economic conditions, operating methods and government regulations. |
| c. | “Developed” oil and gas reserves are reserves of any category that are expected to be recovered through existing wells with existing equipment and operating methods or in which the cost of the required equipment is relatively minor compared to the cost of a new well. |
| d. | “Undeveloped” oil and gas reserves are reserves of any category that are expected to be recovered from new wells on undrilled acreage, or from existing wells where a relatively major expenditure is required for recompletion. |
| (2) | Encana does not file any estimates of total net proved natural gas, oil and NGLs reserves with any U.S. federal authority or agency other than the Securities and Exchange Commission. |
| (3) | In 2012, revisions and improved recovery of natural gas included a reduction of 4,589 Bcf due to significantly lower 12-month average trailing natural gas prices, partially offset by additions of 1,391 Bcf for technical revisions and improved recovery. |
| (4) | In 2013, revisions and improved recovery of natural gas included a reduction of 2,872 Bcf due to lower proved undeveloped reserves bookings, partially offset by additions of 2,233 Bcf due to significantly higher 12-month average trailing natural gas prices and minor positive revisions. |
| (5) | In 2014, revisions and improved recovery of natural gas included a reduction of 520 Bcf due to changes in the proved undeveloped reserves bookings in the U.S. |
Annual Report 2014 | Encana Corporation 99
12-MONTH AVERAGE TRAILING PRICES
The following reference prices were utilized in the determination of reserves and future net revenue:
| Natural Gas | Oil & NGLs | |||||||||||||||
| Henry Hub ($/MMBtu) |
AECO (C$/MMBtu) |
WTI ($/bbl) |
Edmonton Light Sweet (C$/bbl) |
|||||||||||||
| Reserves Pricing (1) |
||||||||||||||||
| 2012 |
2.76 | 2.35 | 94.71 | 87.42 | ||||||||||||
| 2013 |
3.67 | 3.14 | 96.94 | 93.44 | ||||||||||||
| 2014 |
4.34 | 4.63 | 94.99 | 96.40 | ||||||||||||
| (1) | All prices were held constant in all future years when estimating net revenues and reserves. |
STANDARDIZED MEASURE OF DISCOUNTED FUTURE NET CASH FLOWS RELATING TO PROVED OIL AND GAS RESERVES
| Canada | United States | |||||||||||||||||||||||
| 2014 | 2013 | 2012 | 2014 | 2013 | 2012 | |||||||||||||||||||
| Future cash inflows |
19,255 | 19,039 | 15,471 | 26,742 | 17,217 | 14,124 | ||||||||||||||||||
| Less future: |
||||||||||||||||||||||||
| Production costs |
7,456 | 7,377 | 6,273 | 6,673 | 4,484 | 4,095 | ||||||||||||||||||
| Development costs |
3,276 | 4,515 | 5,117 | 4,087 | 3,982 | 4,210 | ||||||||||||||||||
| Income taxes |
1,727 | 652 | — | 2,886 | 1,615 | 555 | ||||||||||||||||||
|
|
|
|
|
|
|
|
|
|
|
|
|
|||||||||||||
| Future net cash flows |
6,796 | 6,495 | 4,081 | 13,096 | 7,136 | 5,264 | ||||||||||||||||||
| Less 10% annual discount for estimated timing of cash flows |
2,320 | 1,836 | 1,079 | 6,015 | 2,978 | 2,249 | ||||||||||||||||||
|
|
|
|
|
|
|
|
|
|
|
|
|
|||||||||||||
| Discounted future net cash flows |
4,476 | 4,659 | 3,002 | 7,081 | 4,158 | 3,015 | ||||||||||||||||||
|
|
|
|
|
|
|
|
|
|
|
|
|
|||||||||||||
| Total | ||||||||||||
| 2014 | 2013 | 2012 | ||||||||||
| Future cash inflows |
45,997 | 36,256 | 29,595 | |||||||||
| Less future: |
||||||||||||
| Production costs |
14,129 | 11,861 | 10,368 | |||||||||
| Development costs |
7,363 | 8,497 | 9,327 | |||||||||
| Income taxes |
4,613 | 2,267 | 555 | |||||||||
|
|
|
|
|
|
|
|||||||
| Future net cash flows |
19,892 | 13,631 | 9,345 | |||||||||
| Less 10% annual discount for estimated timing of cash flows |
8,335 | 4,814 | 3,328 | |||||||||
|
|
|
|
|
|
|
|||||||
| Discounted future net cash flows |
11,557 | 8,817 | 6,017 | |||||||||
|
|
|
|
|
|
|
|||||||
100 Encana Corporation | Annual Report 2014
CHANGES IN STANDARDIZED MEASURE OF DISCOUNTED FUTURE NET CASH FLOWS RELATING TO PROVED OIL AND GAS RESERVES
| Canada | United States | |||||||||||||||||||||||
| 2014 | 2013 | 2012 | 2014 | 2013 | 2012 | |||||||||||||||||||
| Balance, beginning of year |
4,659 | 3,002 | 5,285 | 4,158 | 3,015 | 5,463 | ||||||||||||||||||
| Changes resulting from: |
||||||||||||||||||||||||
| Sales of oil and gas produced during the period |
(2,120 | ) | (1,649 | ) | (1,808 | ) | (1,746 | ) | (1,490 | ) | (2,223 | ) | ||||||||||||
| Discoveries and extensions, net of related costs |
827 | 725 | 509 | 1,429 | 633 | 319 | ||||||||||||||||||
| Purchases of proved reserves in place |
9 | — | 7 | 3,052 | 16 | 8 | ||||||||||||||||||
| Sales and transfers of proved reserves in place |
(1,320 | ) | (304 | ) | (155 | ) | (1,902 | ) | (2 | ) | (369 | ) | ||||||||||||
| Net change in prices and production costs |
1,777 | 2,703 | (1,364 | ) | 2,567 | 1,891 | (2,106 | ) | ||||||||||||||||
| Revisions to quantity estimates |
314 | (178 | ) | (1,290 | ) | (616 | ) | (324 | ) | (2,858 | ) | |||||||||||||
| Accretion of discount |
515 | 311 | 571 | 503 | 333 | 693 | ||||||||||||||||||
| Previously estimated development costs incurred, net of change in future development costs |
532 | 417 | 946 | (3 | ) | 708 | 3,021 | |||||||||||||||||
| Other |
(36 | ) | 14 | (7 | ) | 24 | (68 | ) | (79 | ) | ||||||||||||||
| Net change in income taxes |
(681 | ) | (382 | ) | 308 | (385 | ) | (554 | ) | 1,146 | ||||||||||||||
|
|
|
|
|
|
|
|
|
|
|
|
|
|||||||||||||
| Balance, end of year |
4,476 | 4,659 | 3,002 | 7,081 | 4,158 | 3,015 | ||||||||||||||||||
|
|
|
|
|
|
|
|
|
|
|
|
|
|||||||||||||
| Total | ||||||||||||
| 2014 | 2013 | 2012 | ||||||||||
| Balance, beginning of year |
8,817 | 6,017 | 10,748 | |||||||||
| Changes resulting from: |
||||||||||||
| Sales of oil and gas produced during the period |
(3,866 | ) | (3,139 | ) | (4,031 | ) | ||||||
| Discoveries and extensions, net of related costs |
2,256 | 1,358 | 828 | |||||||||
| Purchases of proved reserves in place |
3,061 | 16 | 15 | |||||||||
| Sales and transfers of proved reserves in place |
(3,222 | ) | (306 | ) | (524 | ) | ||||||
| Net change in prices and production costs |
4,344 | 4,594 | (3,470 | ) | ||||||||
| Revisions to quantity estimates |
(302 | ) | (502 | ) | (4,148 | ) | ||||||
| Accretion of discount |
1,018 | 644 | 1,264 | |||||||||
| Previously estimated development costs incurred, net of change in future development costs |
529 | 1,125 | 3,967 | |||||||||
| Other |
(12 | ) | (54 | ) | (86 | ) | ||||||
| Net change in income taxes |
(1,066 | ) | (936 | ) | 1,454 | |||||||
|
|
|
|
|
|
|
|||||||
| Balance, end of year |
11,557 | 8,817 | 6,017 | |||||||||
|
|
|
|
|
|
|
|||||||
Annual Report 2014 | Encana Corporation 101
RESULTS OF OPERATIONS
| Canada | United States | |||||||||||||||||||||||
| 2014 | 2013 | 2012 | 2014 | 2013 | 2012 | |||||||||||||||||||
| Oil and gas revenues, net of royalties, transportation and processing |
2,475 | 2,068 | 2,205 | 2,244 | 2,041 | 2,713 | ||||||||||||||||||
| Less: |
||||||||||||||||||||||||
| Operating costs, production and mineral taxes, and accretion of asset retirement obligations |
355 | 419 | 397 | 498 | 551 | 490 | ||||||||||||||||||
| Depreciation, depletion and amortization |
625 | 601 | 748 | 992 | 818 | 1,102 | ||||||||||||||||||
| Impairments |
— | — | 1,822 | — | — | 2,842 | ||||||||||||||||||
|
|
|
|
|
|
|
|
|
|
|
|
|
|||||||||||||
| Operating income (loss) |
1,495 | 1,048 | (762 | ) | 754 | 672 | (1,721 | ) | ||||||||||||||||
| Income taxes |
376 | 264 | (191 | ) | 273 | 243 | (623 | ) | ||||||||||||||||
|
|
|
|
|
|
|
|
|
|
|
|
|
|||||||||||||
| Results of operations |
1,119 | 784 | (571 | ) | 481 | 429 | (1,098 | ) | ||||||||||||||||
|
|
|
|
|
|
|
|
|
|
|
|
|
|||||||||||||
| Total | ||||||||||||
| 2014 | 2013 | 2012 | ||||||||||
| Oil and gas revenues, net of royalties, transportation and processing |
4,719 | 4,109 | 4,918 | |||||||||
| Less: |
||||||||||||
| Operating costs, production and mineral taxes, and accretion of asset retirement obligations |
853 | 970 | 887 | |||||||||
| Depreciation, depletion and amortization |
1,617 | 1,419 | 1,850 | |||||||||
| Impairments |
— | — | 4,664 | |||||||||
|
|
|
|
|
|
|
|||||||
| Operating income (loss) |
2,249 | 1,720 | (2,483 | ) | ||||||||
| Income taxes |
649 | 507 | (814 | ) | ||||||||
|
|
|
|
|
|
|
|||||||
| Results of operations |
1,600 | 1,213 | (1,669 | ) | ||||||||
|
|
|
|
|
|
|
|||||||
CAPITALIZED COSTS
| Canada | United States | |||||||||||||||||||||||
| 2014 | 2013 | 2012 | 2014 | 2013 | 2012 | |||||||||||||||||||
| Proved oil and gas properties |
18,271 | 25,003 | 26,024 | 24,279 | 26,529 | 24,825 | ||||||||||||||||||
| Unproved oil and gas properties |
478 | 598 | 716 | 5,655 | 470 | 579 | ||||||||||||||||||
|
|
|
|
|
|
|
|
|
|
|
|
|
|||||||||||||
| Total capital cost |
18,749 | 25,601 | 26,740 | 29,934 | 26,999 | 25,404 | ||||||||||||||||||
| Accumulated DD&A |
16,566 | 23,012 | 23,962 | 16,260 | 22,074 | 21,236 | ||||||||||||||||||
|
|
|
|
|
|
|
|
|
|
|
|
|
|||||||||||||
| Net capitalized costs |
2,183 | 2,589 | 2,778 | 13,674 | 4,925 | 4,168 | ||||||||||||||||||
|
|
|
|
|
|
|
|
|
|
|
|
|
|||||||||||||
| Other | Total | |||||||||||||||||||||||
| 2014 | 2013 | 2012 | 2014 | 2013 | 2012 | |||||||||||||||||||
| Proved oil and gas properties |
65 | 71 | 104 | 42,615 | 51,603 | 50,953 | ||||||||||||||||||
| Unproved oil and gas properties |
— | — | — | 6,133 | 1,068 | 1,295 | ||||||||||||||||||
|
|
|
|
|
|
|
|
|
|
|
|
|
|||||||||||||
| Total capital cost |
65 | 71 | 104 | 48,748 | 52,671 | 52,248 | ||||||||||||||||||
| Accumulated DD&A |
65 | 71 | 104 | 32,891 | 45,157 | 45,302 | ||||||||||||||||||
|
|
|
|
|
|
|
|
|
|
|
|
|
|||||||||||||
| Net capitalized costs |
— | — | — | 15,857 | 7,514 | 6,946 | ||||||||||||||||||
|
|
|
|
|
|
|
|
|
|
|
|
|
|||||||||||||
102 Encana Corporation | Annual Report 2014
COSTS INCURRED
| Canada | United States (1, 2) | |||||||||||||||||||||||
| 2014 | 2013 | 2012 | 2014 | 2013 | 2012 | |||||||||||||||||||
| Acquisitions |
||||||||||||||||||||||||
| Unproved |
15 | 26 | 121 | 5,452 | 111 | 235 | ||||||||||||||||||
| Proved |
6 | 2 | 18 | 5,008 | 45 | 5 | ||||||||||||||||||
|
|
|
|
|
|
|
|
|
|
|
|
|
|||||||||||||
| Total acquisitions |
21 | 28 | 139 | 10,460 | 156 | 240 | ||||||||||||||||||
| Exploration costs |
10 | 22 | 201 | 38 | 412 | 633 | ||||||||||||||||||
| Development costs |
1,216 | 1,343 | 1,366 | 1,247 | 871 | 1,094 | ||||||||||||||||||
|
|
|
|
|
|
|
|
|
|
|
|
|
|||||||||||||
| Total costs incurred |
1,247 | 1,393 | 1,706 | 11,745 | 1,439 | 1,967 | ||||||||||||||||||
|
|
|
|
|
|
|
|
|
|
|
|
|
|||||||||||||
| Total (1, 2) | ||||||||||||
| 2014 | 2013 | 2012 | ||||||||||
| Acquisitions |
||||||||||||
| Unproved |
5,467 | 137 | 356 | |||||||||
| Proved |
5,014 | 47 | 23 | |||||||||
|
|
|
|
|
|
|
|||||||
| Total acquisitions |
10,481 | 184 | 379 | |||||||||
| Exploration costs |
48 | 434 | 834 | |||||||||
| Development costs |
2,463 | 2,214 | 2,460 | |||||||||
|
|
|
|
|
|
|
|||||||
| Total costs incurred |
12,992 | 2,832 | 3,673 | |||||||||
|
|
|
|
|
|
|
|||||||
| (1) | 2014 Unproved includes $5,338 million from the acquisition of Athlon. |
| (2) | 2014 Proved includes $2,127 million from the acquisition of Athlon. |
COSTS NOT SUBJECT TO DEPLETION OR AMORTIZATION
Upstream costs in respect of significant unproved properties are excluded from the country cost centre’s depletable base as follows:
| As at December 31 |
2014 | 2013 | ||||||
| Canada |
$ | 478 | $ | 598 | ||||
| United States |
5,655 | 470 | ||||||
|
|
|
|
|
|||||
| $ | 6,133 | $ | 1,068 | |||||
|
|
|
|
|
|||||
The following is a summary of the costs related to Encana’s unproved properties as at December 31, 2014:
| 2014 | 2013 | 2012 | Prior to 2012 | Total | ||||||||||||||||
| Acquisition Costs |
$ | 5,474 | $ | 140 | $ | 124 | $ | 253 | $ | 5,991 | ||||||||||
| Exploration Costs |
51 | 41 | 31 | 19 | 142 | |||||||||||||||
|
|
|
|
|
|
|
|
|
|
|
|||||||||||
| $ | 5,525 | $ | 181 | $ | 155 | $ | 272 | $ | 6,133 | |||||||||||
|
|
|
|
|
|
|
|
|
|
|
|||||||||||
Ultimate recoverability of these costs and the timing of inclusion within the applicable country cost centre’s depletable base is dependent upon either the finding of proved natural gas and liquids reserves, expiration of leases or recognition of impairments. Acquisition costs primarily include costs incurred to acquire or lease properties. Exploration costs primarily include costs related to geological and geophysical studies and costs of drilling and equipping exploratory wells.
Annual Report 2014 | Encana Corporation 103

|
SUPPLEMENTAL INFORMATION | |
|
For the period ended December 31, 2014 (U.S. Dollars/U.S. Protocol) |
SUPPLEMENTAL FINANCIAL INFORMATION (unaudited)
FINANCIAL RESULTS
| ($ millions, except per share amounts) |
2014 | 2013 | ||||||||||||||||||||||||||||||||||||||
| Year | Q4 | Q3 | Q2 | Q1 | Year | Q4 | Q3 | Q2 | Q1 | |||||||||||||||||||||||||||||||
| Cash Flow (1) |
2,934 | 377 | 807 | 656 | 1,094 | 2,581 | 677 | 660 | 665 | 579 | ||||||||||||||||||||||||||||||
| Per share - Diluted (3) |
3.96 | 0.51 | 1.09 | 0.89 | 1.48 | 3.50 | 0.91 | 0.89 | 0.90 | 0.79 | ||||||||||||||||||||||||||||||
| Operating Earnings (2) |
1,002 | 35 | 281 | 171 | 515 | 802 | 226 | 150 | 247 | 179 | ||||||||||||||||||||||||||||||
| Per share - Diluted (3) |
1.35 | 0.05 | 0.38 | 0.23 | 0.70 | 1.09 | 0.31 | 0.20 | 0.34 | 0.24 | ||||||||||||||||||||||||||||||
| Net Earnings (Loss) Attributable to Common Shareholders |
3,392 | 198 | 2,807 | 271 | 116 | 236 | (251 | ) | 188 | 730 | (431 | ) | ||||||||||||||||||||||||||||
| Per share - Diluted (3) |
4.58 | 0.27 | 3.79 | 0.37 | 0.16 | 0.32 | (0.34 | ) | 0.25 | 0.99 | (0.59 | ) | ||||||||||||||||||||||||||||
| Effective Tax Rate using |
||||||||||||||||||||||||||||||||||||||||
| Canadian Statutory Rate |
25.7 | % | 25.1 | % | ||||||||||||||||||||||||||||||||||||
| Foreign Exchange Rates (US$ per C$1) |
||||||||||||||||||||||||||||||||||||||||
| Average |
0.905 | 0.881 | 0.918 | 0.917 | 0.906 | 0.971 | 0.953 | 0.963 | 0.977 | 0.992 | ||||||||||||||||||||||||||||||
| Period end |
0.862 | 0.862 | 0.892 | 0.937 | 0.905 | 0.940 | 0.940 | 0.972 | 0.951 | 0.985 | ||||||||||||||||||||||||||||||
| Cash Flow Summary |
||||||||||||||||||||||||||||||||||||||||
| Cash From (Used in) Operating Activities |
2,667 | 261 | 696 | 767 | 943 | 2,289 | 462 | 935 | 554 | 338 | ||||||||||||||||||||||||||||||
| Deduct (Add back): |
||||||||||||||||||||||||||||||||||||||||
| Net change in other assets and liabilities |
(43 | ) | (15 | ) | (11 | ) | (8 | ) | (9 | ) | (80 | ) | (21 | ) | (15 | ) | (22 | ) | (22 | ) | ||||||||||||||||||||
| Net change in non-cash working capital |
(9 | ) | (141 | ) | 155 | 119 | (142 | ) | (179 | ) | (183 | ) | 300 | (81 | ) | (215 | ) | |||||||||||||||||||||||
| Cash tax on sale of assets |
(215 | ) | 40 | (255 | ) | — | — | (33 | ) | (11 | ) | (10 | ) | (8 | ) | (4 | ) | |||||||||||||||||||||||
|
|
|
|
|
|
|
|
|
|
|
|
|
|
|
|
|
|
|
|
|
|||||||||||||||||||||
| Cash Flow (1) |
2,934 | 377 | 807 | 656 | 1,094 | 2,581 | 677 | 660 | 665 | 579 | ||||||||||||||||||||||||||||||
|
|
|
|
|
|
|
|
|
|
|
|
|
|
|
|
|
|
|
|
|
|||||||||||||||||||||
| Operating Earnings Summary |
||||||||||||||||||||||||||||||||||||||||
| Net Earnings (Loss) Attributable to Common Shareholders |
3,392 | 198 | 2,807 | 271 | 116 | 236 | (251 | ) | 188 | 730 | (431 | ) | ||||||||||||||||||||||||||||
| After-tax (addition) deduction: |
||||||||||||||||||||||||||||||||||||||||
| Unrealized hedging gain (loss) |
306 | 341 | 160 | 8 | (203 | ) | (232 | ) | (209 | ) | (89 | ) | 332 | (266 | ) | |||||||||||||||||||||||||
| Impairments |
— | — | — | — | — | (16 | ) | — | (16 | ) | — | — | ||||||||||||||||||||||||||||
| Restructuring charges |
(24 | ) | (4 | ) | (5 | ) | (5 | ) | (10 | ) | (64 | ) | (64 | ) | — | — | — | |||||||||||||||||||||||
| Non-operating foreign exchange gain (loss) |
(407 | ) | (151 | ) | (218 | ) | 156 | (194 | ) | (282 | ) | (124 | ) | 105 | (162 | ) | (101 | ) | ||||||||||||||||||||||
| Gain (loss) on divestitures |
2,523 | (11 | ) | 2,399 | 135 | — | — | — | — | — | — | |||||||||||||||||||||||||||||
| Income tax adjustments |
(8 | ) | (12 | ) | 190 | (194 | ) | 8 | 28 | (80 | ) | 38 | 313 | (243 | ) | |||||||||||||||||||||||||
|
|
|
|
|
|
|
|
|
|
|
|
|
|
|
|
|
|
|
|
|
|||||||||||||||||||||
| Operating Earnings (2) |
1,002 | 35 | 281 | 171 | 515 | 802 | 226 | 150 | 247 | 179 | ||||||||||||||||||||||||||||||
|
|
|
|
|
|
|
|
|
|
|
|
|
|
|
|
|
|
|
|
|
|||||||||||||||||||||
| (1) | Cash Flow is a non-GAAP measure defined as cash from operating activities excluding net change in other assets and liabilities, net change in non-cash working capital and cash tax on sale of assets. |
| (2) | Operating Earnings is a non-GAAP measure defined as net earnings attributable to common shareholders excluding non-recurring or non-cash items that Management believes reduces the comparability of the Company’s financial performance between periods. These after-tax items may include, but are not limited to, unrealized hedging gains/losses, impairments, restructuring charges, non-operating foreign exchange gains/losses, gains/losses on divestitures, income taxes related to divestitures and adjustments to normalize the effect of income taxes calculated using the estimated annual effective income tax rate. |
| (3) | Net earnings attributable to common shareholders, operating earnings and cash flow per common share are calculated using the weighted average number of Encana common shares outstanding as follows: |
| 2014 | 2013 | |||||||||||||||||||||||||||||||||||||||
| (millions) |
Year | Q4 | Q3 | Q2 | Q1 | Year | Q4 | Q3 | Q2 | Q1 | ||||||||||||||||||||||||||||||
| Weighted Average Common Shares Outstanding |
||||||||||||||||||||||||||||||||||||||||
| Basic |
741.0 | 741.1 | 741.1 | 741.0 | 741.0 | 737.7 | 740.4 | 738.3 | 736.1 | 736.2 | ||||||||||||||||||||||||||||||
| Diluted |
741.0 | 741.1 | 741.1 | 741.0 | 741.0 | 737.7 | 740.4 | 738.3 | 736.1 | 736.2 | ||||||||||||||||||||||||||||||
104 Encana Corporation | Annual Report 2014

SUPPLEMENTAL FINANCIAL & OPERATING INFORMATION (unaudited)
| Financial Metrics |
2014 | 2013 | ||||||
| Year | Year | |||||||
| Debt to Debt Adjusted Cash Flow |
2.1x | 2.4x | ||||||
| Debt to Adjusted Capitalization |
30 | % | 36 | % | ||||
The financial metrics disclosed above are non-GAAP measures monitored by Management as indicators of the Company’s overall financial strength. These non-GAAP measures are defined and calculated in the Non-GAAP Measures section of Encana’s Management’s Discussion and Analysis.
| Net Capital Investment |
2014 | 2013 | ||||||||||||||||||||||||||||||||||||||
| ($ millions) |
Year | Q4 | Q3 | Q2 | Q1 | Year | Q4 | Q3 | Q2 | Q1 | ||||||||||||||||||||||||||||||
| Capital Investment |
||||||||||||||||||||||||||||||||||||||||
| Canadian Operations |
1,226 | 302 | 293 | 350 | 281 | 1,365 | 354 | 301 | 301 | 409 | ||||||||||||||||||||||||||||||
| USA Operations |
1,285 | 548 | 305 | 206 | 226 | 1,283 | 343 | 330 | 327 | 283 | ||||||||||||||||||||||||||||||
| Market Optimization |
— | — | (2 | ) | 1 | 1 | 3 | 1 | — | 2 | — | |||||||||||||||||||||||||||||
| Corporate & Other |
15 | 7 | 2 | 3 | 3 | 61 | 19 | 10 | 9 | 23 | ||||||||||||||||||||||||||||||
|
|
|
|
|
|
|
|
|
|
|
|
|
|
|
|
|
|
|
|
|
|||||||||||||||||||||
| Capital Investment |
2,526 | 857 | 598 | 560 | 511 | 2,712 | 717 | 641 | 639 | 715 | ||||||||||||||||||||||||||||||
|
|
|
|
|
|
|
|
|
|
|
|
|
|
|
|
|
|
|
|
|
|||||||||||||||||||||
| Net Acquisitions & (Divestitures) (1) |
(1,329 | ) | 50 | (2,007 | ) | 652 | (24 | ) | (776 | ) | (72 | ) | (51 | ) | (312 | ) | (341 | ) | ||||||||||||||||||||||
|
|
|
|
|
|
|
|
|
|
|
|
|
|
|
|
|
|
|
|
|
|||||||||||||||||||||
| Net Capital Investment |
1,197 | 907 | (1,409 | ) | 1,212 | 487 | 1,936 | 645 | 590 | 327 | 374 | |||||||||||||||||||||||||||||
|
|
|
|
|
|
|
|
|
|
|
|
|
|
|
|
|
|
|
|
|
|||||||||||||||||||||
| (1) | Q1 2013 Net Acquisitions & (Divestitures) includes proceeds received from the sale of the Company’s 30 percent interest in the proposed Kitimat liquefied natural gas export terminal in British Columbia and associated undeveloped lands in the Horn River Basin. |
| Capital Investment |
2014 | 2013 | ||||||||||||||||||||||||||||||||||||||
| ($ millions) |
Year | Q4 | Q3 | Q2 | Q1 | Year | Q4 | Q3 | Q2 | Q1 | ||||||||||||||||||||||||||||||
| Capital Investment |
||||||||||||||||||||||||||||||||||||||||
| Montney |
776 | 157 | 205 | 208 | 206 | 565 | 186 | 136 | 107 | 136 | ||||||||||||||||||||||||||||||
| Duvernay |
328 | 118 | 58 | 81 | 71 | 155 | 68 | 11 | 28 | 48 | ||||||||||||||||||||||||||||||
| Eagle Ford |
274 | 149 | 113 | 12 | — | — | — | — | — | — | ||||||||||||||||||||||||||||||
| Permian |
117 | 117 | — | — | — | — | — | — | — | — | ||||||||||||||||||||||||||||||
| DJ Basin |
277 | 81 | 68 | 69 | 59 | 181 | 46 | 55 | 50 | 30 | ||||||||||||||||||||||||||||||
| San Juan |
287 | 96 | 89 | 50 | 52 | 166 | 33 | 61 | 46 | 26 | ||||||||||||||||||||||||||||||
|
|
|
|
|
|
|
|
|
|
|
|
|
|
|
|
|
|
|
|
|
|||||||||||||||||||||
| 2,059 | 718 | 533 | 420 | 388 | 1,067 | 333 | 263 | 231 | 240 | |||||||||||||||||||||||||||||||
|
|
|
|
|
|
|
|
|
|
|
|
|
|
|
|
|
|
|
|
|
|||||||||||||||||||||
| Other Upstream Operations (1) |
452 | 132 | 65 | 136 | 119 | 1,581 | 364 | 368 | 397 | 452 | ||||||||||||||||||||||||||||||
| Market Optimization |
— | — | (2 | ) | 1 | 1 | 3 | 1 | — | 2 | — | |||||||||||||||||||||||||||||
| Corporate & Other |
15 | 7 | 2 | 3 | 3 | 61 | 19 | 10 | 9 | 23 | ||||||||||||||||||||||||||||||
|
|
|
|
|
|
|
|
|
|
|
|
|
|
|
|
|
|
|
|
|
|||||||||||||||||||||
| Capital Investment |
2,526 | 857 | 598 | 560 | 511 | 2,712 | 717 | 641 | 639 | 715 | ||||||||||||||||||||||||||||||
|
|
|
|
|
|
|
|
|
|
|
|
|
|
|
|
|
|
|
|
|
|||||||||||||||||||||
| (1) | Other Upstream Operations includes capital investment for Encana’s base production properties as well as capital investment for prospective plays which are under appraisal, including the Tuscaloosa Marine Shale (“TMS”). 2014 capital investment for the TMS was $101 million (2013 – $98 million). |
Annual Report 2014 | Encana Corporation 105
| Production Volumes - After Royalties |
2014 | 2013 | ||||||||||||||||||||||||||||||||||||||
| (average) |
Year | Q4 | Q3 | Q2 | Q1 | Year | Q4 | Q3 | Q2 | Q1 | ||||||||||||||||||||||||||||||
| Natural Gas (MMcf/d) |
2,350 | 1,861 | 2,199 | 2,541 | 2,809 | 2,777 | 2,744 | 2,723 | 2,766 | 2,877 | ||||||||||||||||||||||||||||||
| Oil (Mbbls/d) |
49.4 | 68.8 | 62.1 | 34.2 | 32.1 | 25.8 | 33.0 | 27.2 | 22.9 | 20.0 | ||||||||||||||||||||||||||||||
| NGLs (Mbbls/d) |
37.4 | 37.6 | 41.9 | 34.0 | 35.8 | 28.1 | 33.0 | 31.0 | 24.7 | 23.5 | ||||||||||||||||||||||||||||||
|
|
|
|
|
|
|
|
|
|
|
|
|
|
|
|
|
|
|
|
|
|||||||||||||||||||||
| Oil & NGLs (Mbbls/d) |
86.8 | 106.4 | 104.0 | 68.2 | 67.9 | 53.9 | 66.0 | 58.2 | 47.6 | 43.5 | ||||||||||||||||||||||||||||||
|
|
|
|
|
|
|
|
|
|
|
|
|
|
|
|
|
|
|
|
|
|||||||||||||||||||||
| Total (MBOE/d) |
478.5 | 416.7 | 470.6 | 491.8 | 536.1 | 516.7 | 523.4 | 512.1 | 508.6 | 523.0 | ||||||||||||||||||||||||||||||
|
|
|
|
|
|
|
|
|
|
|
|
|
|
|
|
|
|
|
|
|
|||||||||||||||||||||
| Production Volumes - After Royalties |
2014 | 2013 | ||||||||||||||||||||||||||||||||||||||
| (average) |
Year | Q4 | Q3 | Q2 | Q1 | Year | Q4 | Q3 | Q2 | Q1 | ||||||||||||||||||||||||||||||
| Natural Gas (MMcf/d) |
||||||||||||||||||||||||||||||||||||||||
| Canadian Operations |
1,378 | 1,111 | 1,374 | 1,463 | 1,568 | 1,432 | 1,528 | 1,414 | 1,364 | 1,422 | ||||||||||||||||||||||||||||||
| USA Operations |
972 | 750 | 825 | 1,078 | 1,241 | 1,345 | 1,216 | 1,309 | 1,402 | 1,455 | ||||||||||||||||||||||||||||||
|
|
|
|
|
|
|
|
|
|
|
|
|
|
|
|
|
|
|
|
|
|||||||||||||||||||||
| 2,350 | 1,861 | 2,199 | 2,541 | 2,809 | 2,777 | 2,744 | 2,723 | 2,766 | 2,877 | |||||||||||||||||||||||||||||||
|
|
|
|
|
|
|
|
|
|
|
|
|
|
|
|
|
|
|
|
|
|||||||||||||||||||||
| Oil (Mbbls/d) |
||||||||||||||||||||||||||||||||||||||||
| Canadian Operations |
13.6 | 9.4 | 14.7 | 13.9 | 16.4 | 11.9 | 16.8 | 12.3 | 10.3 | 8.0 | ||||||||||||||||||||||||||||||
| USA Operations |
35.8 | 59.4 | 47.4 | 20.3 | 15.7 | 13.9 | 16.2 | 14.9 | 12.6 | 12.0 | ||||||||||||||||||||||||||||||
|
|
|
|
|
|
|
|
|
|
|
|
|
|
|
|
|
|
|
|
|
|||||||||||||||||||||
| 49.4 | 68.8 | 62.1 | 34.2 | 32.1 | 25.8 | 33.0 | 27.2 | 22.9 | 20.0 | |||||||||||||||||||||||||||||||
|
|
|
|
|
|
|
|
|
|
|
|
|
|
|
|
|
|
|
|
|
|||||||||||||||||||||
| NGLs (Mbbls/d) |
||||||||||||||||||||||||||||||||||||||||
| Canadian Operations |
23.6 | 18.8 | 27.6 | 23.5 | 24.6 | 18.5 | 21.7 | 20.5 | 15.7 | 16.0 | ||||||||||||||||||||||||||||||
| USA Operations |
13.8 | 18.8 | 14.3 | 10.5 | 11.2 | 9.6 | 11.3 | 10.5 | 9.0 | 7.5 | ||||||||||||||||||||||||||||||
|
|
|
|
|
|
|
|
|
|
|
|
|
|
|
|
|
|
|
|
|
|||||||||||||||||||||
| 37.4 | 37.6 | 41.9 | 34.0 | 35.8 | 28.1 | 33.0 | 31.0 | 24.7 | 23.5 | |||||||||||||||||||||||||||||||
|
|
|
|
|
|
|
|
|
|
|
|
|
|
|
|
|
|
|
|
|
|||||||||||||||||||||
| Oil & NGLs (Mbbls/d) |
||||||||||||||||||||||||||||||||||||||||
| Canadian Operations |
37.2 | 28.2 | 42.3 | 37.4 | 41.0 | 30.4 | 38.5 | 32.8 | 26.0 | 24.0 | ||||||||||||||||||||||||||||||
| USA Operations |
49.6 | 78.2 | 61.7 | 30.8 | 26.9 | 23.5 | 27.5 | 25.4 | 21.6 | 19.5 | ||||||||||||||||||||||||||||||
|
|
|
|
|
|
|
|
|
|
|
|
|
|
|
|
|
|
|
|
|
|||||||||||||||||||||
| 86.8 | 106.4 | 104.0 | 68.2 | 67.9 | 53.9 | 66.0 | 58.2 | 47.6 | 43.5 | |||||||||||||||||||||||||||||||
|
|
|
|
|
|
|
|
|
|
|
|
|
|
|
|
|
|
|
|
|
|||||||||||||||||||||
| Total (MBOE/d) |
||||||||||||||||||||||||||||||||||||||||
| Canadian Operations |
266.9 | 213.4 | 271.4 | 281.4 | 302.4 | 269.0 | 293.2 | 268.5 | 253.3 | 261.1 | ||||||||||||||||||||||||||||||
| USA Operations |
211.6 | 203.3 | 199.2 | 210.4 | 233.7 | 247.7 | 230.2 | 243.6 | 255.3 | 261.9 | ||||||||||||||||||||||||||||||
|
|
|
|
|
|
|
|
|
|
|
|
|
|
|
|
|
|
|
|
|
|||||||||||||||||||||
| 478.5 | 416.7 | 470.6 | 491.8 | 536.1 | 516.7 | 523.4 | 512.1 | 508.6 | 523.0 | |||||||||||||||||||||||||||||||
|
|
|
|
|
|
|
|
|
|
|
|
|
|
|
|
|
|
|
|
|
|||||||||||||||||||||
| Oil & NGLs Production Volumes - After Royalties |
2014 | 2013 | ||||||||||||||
| (average Mbbls/d) | Year | % of Total |
Year | % of Total |
||||||||||||
| Oil |
49.4 | 57 | 25.8 | 49 | ||||||||||||
| Plant Condensate |
12.0 | 14 | 8.7 | 16 | ||||||||||||
| Butane |
6.8 | 8 | 4.5 | 8 | ||||||||||||
| Propane |
10.2 | 11 | 7.2 | 13 | ||||||||||||
| Ethane |
8.4 | 10 | 7.7 | 14 | ||||||||||||
|
|
|
|
|
|
|
|
|
|||||||||
| 86.8 | 100 | 53.9 | 100 | |||||||||||||
|
|
|
|
|
|
|
|
|
|||||||||
106 Encana Corporation | Annual Report 2014
SUPPLEMENTAL FINANCIAL & OPERATING INFORMATION (unaudited)
RESULTS OF OPERATIONS
Product and Operational Information, Including the Impact of Realized Financial Hedging
| 2014 | 2013 | |||||||||||||||||||||||||||||||||||||||
| ($ millions) |
Year | Q4 | Q3 | Q2 | Q1 | Year | Q4 | Q3 | Q2 | Q1 | ||||||||||||||||||||||||||||||
| Natural Gas - Canadian Operations |
||||||||||||||||||||||||||||||||||||||||
| Revenues, Net of Royalties, excluding Hedging |
2,468 | 402 | 480 | 569 | 1,017 | 1,771 | 509 | 381 | 459 | 422 | ||||||||||||||||||||||||||||||
| Realized Financial Hedging Gain (Loss) |
(74 | ) | 25 | 20 | (44 | ) | (75 | ) | 271 | 84 | 102 | 19 | 66 | |||||||||||||||||||||||||||
| Expenses |
||||||||||||||||||||||||||||||||||||||||
| Production and mineral taxes |
5 | 2 | 1 | — | 2 | 4 | 2 | 1 | — | 1 | ||||||||||||||||||||||||||||||
| Transportation and processing |
773 | 177 | 186 | 209 | 201 | 724 | 207 | 183 | 165 | 169 | ||||||||||||||||||||||||||||||
| Operating |
279 | 57 | 66 | 72 | 84 | 322 | 82 | 72 | 80 | 88 | ||||||||||||||||||||||||||||||
|
|
|
|
|
|
|
|
|
|
|
|
|
|
|
|
|
|
|
|
|
|||||||||||||||||||||
| Operating Cash Flow |
1,337 | 191 | 247 | 244 | 655 | 992 | 302 | 227 | 233 | 230 | ||||||||||||||||||||||||||||||
|
|
|
|
|
|
|
|
|
|
|
|
|
|
|
|
|
|
|
|
|
|||||||||||||||||||||
| Natural Gas - USA Operations |
||||||||||||||||||||||||||||||||||||||||
| Revenues, Net of Royalties, excluding Hedging |
1,640 | 274 | 307 | 463 | 596 | 1,872 | 426 | 440 | 547 | 459 | ||||||||||||||||||||||||||||||
| Realized Financial Hedging Gain (Loss) |
(85 | ) | 13 | 10 | (43 | ) | (65 | ) | 260 | 80 | 84 | 27 | 69 | |||||||||||||||||||||||||||
| Expenses |
||||||||||||||||||||||||||||||||||||||||
| Production and mineral taxes |
44 | 11 | (10 | ) | 14 | 29 | 77 | 19 | 16 | 27 | 15 | |||||||||||||||||||||||||||||
| Transportation and processing |
651 | 149 | 162 | 177 | 163 | 722 | 175 | 184 | 179 | 184 | ||||||||||||||||||||||||||||||
| Operating |
235 | 52 | 50 | 65 | 68 | 339 | 97 | 78 | 78 | 86 | ||||||||||||||||||||||||||||||
|
|
|
|
|
|
|
|
|
|
|
|
|
|
|
|
|
|
|
|
|
|||||||||||||||||||||
| Operating Cash Flow |
625 | 75 | 115 | 164 | 271 | 994 | 215 | 246 | 290 | 243 | ||||||||||||||||||||||||||||||
|
|
|
|
|
|
|
|
|
|
|
|
|
|
|
|
|
|
|
|
|
|||||||||||||||||||||
| Natural Gas - Total Operations |
||||||||||||||||||||||||||||||||||||||||
| Revenues, Net of Royalties, excluding Hedging |
4,108 | 676 | 787 | 1,032 | 1,613 | 3,643 | 935 | 821 | 1,006 | 881 | ||||||||||||||||||||||||||||||
| Realized Financial Hedging Gain (Loss) |
(159 | ) | 38 | 30 | (87 | ) | (140 | ) | 531 | 164 | 186 | 46 | 135 | |||||||||||||||||||||||||||
| Expenses |
||||||||||||||||||||||||||||||||||||||||
| Production and mineral taxes |
49 | 13 | (9 | ) | 14 | 31 | 81 | 21 | 17 | 27 | 16 | |||||||||||||||||||||||||||||
| Transportation and processing |
1,424 | 326 | 348 | 386 | 364 | 1,446 | 382 | 367 | 344 | 353 | ||||||||||||||||||||||||||||||
| Operating |
514 | 109 | 116 | 137 | 152 | 661 | 179 | 150 | 158 | 174 | ||||||||||||||||||||||||||||||
|
|
|
|
|
|
|
|
|
|
|
|
|
|
|
|
|
|
|
|
|
|||||||||||||||||||||
| Operating Cash Flow |
1,962 | 266 | 362 | 408 | 926 | 1,986 | 517 | 473 | 523 | 473 | ||||||||||||||||||||||||||||||
|
|
|
|
|
|
|
|
|
|
|
|
|
|
|
|
|
|
|
|
|
|||||||||||||||||||||
| Oil & NGLs - Canadian Operations |
||||||||||||||||||||||||||||||||||||||||
| Revenues, Net of Royalties, excluding Hedging |
872 | 149 | 251 | 227 | 245 | 722 | 222 | 204 | 156 | 140 | ||||||||||||||||||||||||||||||
| Realized Financial Hedging Gain (Loss) |
18 | 24 | (1 | ) | (5 | ) | — | 5 | 6 | (7 | ) | 2 | 4 | |||||||||||||||||||||||||||
| Expenses |
||||||||||||||||||||||||||||||||||||||||
| Production and mineral taxes |
10 | — | 3 | 4 | 3 | 11 | 2 | 7 | 1 | 1 | ||||||||||||||||||||||||||||||
| Transportation and processing |
62 | 16 | 16 | 16 | 14 | 32 | 18 | 7 | 4 | 3 | ||||||||||||||||||||||||||||||
| Operating |
28 | 10 | 8 | 4 | 6 | 39 | 7 | 11 | 9 | 12 | ||||||||||||||||||||||||||||||
|
|
|
|
|
|
|
|
|
|
|
|
|
|
|
|
|
|
|
|
|
|||||||||||||||||||||
| Operating Cash Flow |
790 | 147 | 223 | 198 | 222 | 645 | 201 | 172 | 144 | 128 | ||||||||||||||||||||||||||||||
|
|
|
|
|
|
|
|
|
|
|
|
|
|
|
|
|
|
|
|
|
|||||||||||||||||||||
| Oil & NGLs - USA Operations |
||||||||||||||||||||||||||||||||||||||||
| Revenues, Net of Royalties, excluding Hedging |
1,258 | 412 | 452 | 215 | 179 | 602 | 177 | 169 | 134 | 122 | ||||||||||||||||||||||||||||||
| Realized Financial Hedging Gain (Loss) |
60 | 65 | 1 | (6 | ) | — | 4 | 3 | (7 | ) | 3 | 5 | ||||||||||||||||||||||||||||
| Expenses |
||||||||||||||||||||||||||||||||||||||||
| Production and mineral taxes |
74 | 23 | 23 | 15 | 13 | 42 | 14 | 11 | 9 | 8 | ||||||||||||||||||||||||||||||
| Transportation and processing |
7 | 3 | 4 | — | — | — | — | — | — | — | ||||||||||||||||||||||||||||||
| Operating |
115 | 51 | 44 | 12 | 8 | 59 | 10 | 12 | 14 | 23 | ||||||||||||||||||||||||||||||
|
|
|
|
|
|
|
|
|
|
|
|
|
|
|
|
|
|
|
|
|
|||||||||||||||||||||
| Operating Cash Flow |
1,122 | 400 | 382 | 182 | 158 | 505 | 156 | 139 | 114 | 96 | ||||||||||||||||||||||||||||||
|
|
|
|
|
|
|
|
|
|
|
|
|
|
|
|
|
|
|
|
|
|||||||||||||||||||||
| Oil & NGLs - Total Operations |
||||||||||||||||||||||||||||||||||||||||
| Revenues, Net of Royalties, excluding Hedging |
2,130 | 561 | 703 | 442 | 424 | 1,324 | 399 | 373 | 290 | 262 | ||||||||||||||||||||||||||||||
| Realized Financial Hedging Gain (Loss) |
78 | 89 | — | (11 | ) | — | 9 | 9 | (14 | ) | 5 | 9 | ||||||||||||||||||||||||||||
| Expenses |
||||||||||||||||||||||||||||||||||||||||
| Production and mineral taxes |
84 | 23 | 26 | 19 | 16 | 53 | 16 | 18 | 10 | 9 | ||||||||||||||||||||||||||||||
| Transportation and processing |
69 | 19 | 20 | 16 | 14 | 32 | 18 | 7 | 4 | 3 | ||||||||||||||||||||||||||||||
| Operating |
143 | 61 | 52 | 16 | 14 | 98 | 17 | 23 | 23 | 35 | ||||||||||||||||||||||||||||||
|
|
|
|
|
|
|
|
|
|
|
|
|
|
|
|
|
|
|
|
|
|||||||||||||||||||||
| Operating Cash Flow |
1,912 | 547 | 605 | 380 | 380 | 1,150 | 357 | 311 | 258 | 224 | ||||||||||||||||||||||||||||||
|
|
|
|
|
|
|
|
|
|
|
|
|
|
|
|
|
|
|
|
|
|||||||||||||||||||||
Annual Report 2014 | Encana Corporation 107
SUPPLEMENTAL OIL AND GAS OPERATING STATISTICS (unaudited)
OPERATING STATISTICS - AFTER ROYALTIES
Per-unit Results, Excluding the Impact of Realized Financial Hedging
| 2014 | 2013 | |||||||||||||||||||||||||||||||||||||||
| Year | Q4 | Q3 | Q2 | Q1 | Year | Q4 | Q3 | Q2 | Q1 | |||||||||||||||||||||||||||||||
| Natural Gas - Canadian Operations ($/Mcf) |
||||||||||||||||||||||||||||||||||||||||
| Price (1) |
4.89 | 3.93 | 3.78 | 4.27 | 7.17 | 3.35 | 3.60 | 2.90 | 3.69 | 3.21 | ||||||||||||||||||||||||||||||
| Production and mineral taxes |
0.01 | 0.01 | 0.01 | — | 0.01 | 0.01 | 0.02 | 0.01 | — | 0.01 | ||||||||||||||||||||||||||||||
| Transportation and processing |
1.53 | 1.73 | 1.47 | 1.57 | 1.42 | 1.37 | 1.46 | 1.38 | 1.33 | 1.29 | ||||||||||||||||||||||||||||||
| Operating |
0.55 | 0.55 | 0.52 | 0.55 | 0.59 | 0.61 | 0.59 | 0.55 | 0.65 | 0.66 | ||||||||||||||||||||||||||||||
|
|
|
|
|
|
|
|
|
|
|
|
|
|
|
|
|
|
|
|
|
|||||||||||||||||||||
| Netback |
2.80 | 1.64 | 1.78 | 2.15 | 5.15 | 1.36 | 1.53 | 0.96 | 1.71 | 1.25 | ||||||||||||||||||||||||||||||
|
|
|
|
|
|
|
|
|
|
|
|
|
|
|
|
|
|
|
|
|
|||||||||||||||||||||
| Natural Gas - USA Operations ($/Mcf) |
||||||||||||||||||||||||||||||||||||||||
| Price |
4.62 | 3.95 | 4.05 | 4.72 | 5.34 | 3.81 | 3.81 | 3.66 | 4.29 | 3.50 | ||||||||||||||||||||||||||||||
| Production and mineral taxes |
0.12 | 0.17 | (0.14 | ) | 0.15 | 0.26 | 0.16 | 0.18 | 0.13 | 0.21 | 0.11 | |||||||||||||||||||||||||||||
| Transportation and processing |
1.83 | 2.16 | 2.13 | 1.80 | 1.46 | 1.47 | 1.56 | 1.53 | 1.40 | 1.40 | ||||||||||||||||||||||||||||||
| Operating |
0.66 | 0.75 | 0.65 | 0.67 | 0.61 | 0.69 | 0.86 | 0.65 | 0.61 | 0.66 | ||||||||||||||||||||||||||||||
|
|
|
|
|
|
|
|
|
|
|
|
|
|
|
|
|
|
|
|
|
|||||||||||||||||||||
| Netback |
2.01 | 0.87 | 1.41 | 2.10 | 3.01 | 1.49 | 1.21 | 1.35 | 2.07 | 1.33 | ||||||||||||||||||||||||||||||
|
|
|
|
|
|
|
|
|
|
|
|
|
|
|
|
|
|
|
|
|
|||||||||||||||||||||
| Natural Gas - Total Operations ($/Mcf) |
||||||||||||||||||||||||||||||||||||||||
| Price (2) |
4.78 | 3.94 | 3.88 | 4.46 | 6.37 | 3.57 | 3.69 | 3.26 | 3.99 | 3.35 | ||||||||||||||||||||||||||||||
| Production and mineral taxes |
0.06 | 0.08 | (0.05 | ) | 0.06 | 0.12 | 0.08 | 0.09 | 0.07 | 0.11 | 0.06 | |||||||||||||||||||||||||||||
| Transportation and processing |
1.66 | 1.90 | 1.72 | 1.67 | 1.44 | 1.42 | 1.51 | 1.46 | 1.36 | 1.35 | ||||||||||||||||||||||||||||||
| Operating |
0.60 | 0.63 | 0.57 | 0.60 | 0.60 | 0.65 | 0.70 | 0.60 | 0.63 | 0.66 | ||||||||||||||||||||||||||||||
|
|
|
|
|
|
|
|
|
|
|
|
|
|
|
|
|
|
|
|
|
|||||||||||||||||||||
| Netback |
2.46 | 1.33 | 1.64 | 2.13 | 4.21 | 1.42 | 1.39 | 1.13 | 1.89 | 1.28 | ||||||||||||||||||||||||||||||
|
|
|
|
|
|
|
|
|
|
|
|
|
|
|
|
|
|
|
|
|
|||||||||||||||||||||
| Oil & NGLs - Canadian Operations ($/bbl) |
||||||||||||||||||||||||||||||||||||||||
| Price |
64.16 | 57.50 | 64.79 | 66.13 | 66.36 | 65.06 | 62.80 | 67.33 | 65.88 | 64.72 | ||||||||||||||||||||||||||||||
| Production and mineral taxes |
0.71 | 0.10 | 0.67 | 1.12 | 0.80 | 0.96 | 0.61 | 1.91 | 0.62 | 0.58 | ||||||||||||||||||||||||||||||
| Transportation and processing |
4.52 | 5.92 | 4.21 | 4.60 | 3.80 | 2.89 | 5.15 | 2.41 | 1.53 | 1.33 | ||||||||||||||||||||||||||||||
| Operating |
2.09 | 4.00 | 2.05 | 1.06 | 1.75 | 3.56 | 2.03 | 3.74 | 3.77 | 5.61 | ||||||||||||||||||||||||||||||
|
|
|
|
|
|
|
|
|
|
|
|
|
|
|
|
|
|
|
|
|
|||||||||||||||||||||
| Netback |
56.84 | 47.48 | 57.86 | 59.35 | 60.01 | 57.65 | 55.01 | 59.27 | 59.96 | 57.20 | ||||||||||||||||||||||||||||||
|
|
|
|
|
|
|
|
|
|
|
|
|
|
|
|
|
|
|
|
|
|||||||||||||||||||||
| Oil & NGLs - USA Operations ($/bbl) |
||||||||||||||||||||||||||||||||||||||||
| Price |
69.54 | 57.30 | 79.43 | 77.46 | 73.61 | 70.18 | 69.46 | 72.53 | 68.56 | 69.91 | ||||||||||||||||||||||||||||||
| Production and mineral taxes |
4.10 | 3.16 | 4.18 | 5.19 | 5.46 | 4.79 | 5.06 | 4.90 | 4.57 | 4.50 | ||||||||||||||||||||||||||||||
| Transportation and processing |
0.39 | 0.49 | 0.63 | — | — | — | — | — | — | — | ||||||||||||||||||||||||||||||
| Operating |
6.36 | 7.11 | 7.80 | 4.29 | 3.16 | 7.02 | 4.11 | 5.13 | 7.54 | 13.16 | ||||||||||||||||||||||||||||||
|
|
|
|
|
|
|
|
|
|
|
|
|
|
|
|
|
|
|
|
|
|||||||||||||||||||||
| Netback |
58.69 | 46.54 | 66.82 | 67.98 | 64.99 | 58.37 | 60.29 | 62.50 | 56.45 | 52.25 | ||||||||||||||||||||||||||||||
|
|
|
|
|
|
|
|
|
|
|
|
|
|
|
|
|
|
|
|
|
|||||||||||||||||||||
| Oil & NGLs - Total Operations ($/bbl) |
||||||||||||||||||||||||||||||||||||||||
| Price |
67.24 | 57.35 | 73.48 | 71.23 | 69.23 | 67.30 | 65.58 | 69.60 | 67.10 | 67.04 | ||||||||||||||||||||||||||||||
| Production and mineral taxes |
2.65 | 2.35 | 2.75 | 2.95 | 2.65 | 2.63 | 2.46 | 3.22 | 2.41 | 2.33 | ||||||||||||||||||||||||||||||
| Transportation and processing |
2.16 | 1.93 | 2.09 | 2.53 | 2.30 | 1.63 | 3.01 | 1.36 | 0.84 | 0.73 | ||||||||||||||||||||||||||||||
| Operating |
4.54 | 6.29 | 5.46 | 2.51 | 2.31 | 5.07 | 2.90 | 4.35 | 5.48 | 8.98 | ||||||||||||||||||||||||||||||
|
|
|
|
|
|
|
|
|
|
|
|
|
|
|
|
|
|
|
|
|
|||||||||||||||||||||
| Netback |
57.89 | 46.78 | 63.18 | 63.24 | 61.97 | 57.97 | 57.21 | 60.67 | 58.37 | 55.00 | ||||||||||||||||||||||||||||||
|
|
|
|
|
|
|
|
|
|
|
|
|
|
|
|
|
|
|
|
|
|||||||||||||||||||||
108 Encana Corporation | Annual Report 2014
SUPPLEMENTAL OIL AND GAS OPERATING STATISTICS (unaudited)
OPERATING STATISTICS - AFTER ROYALTIES (continued)
Per-unit Results, Excluding the Impact of Realized Financial Hedging
| 2014 | 2013 | |||||||||||||||||||||||||||||||||||||||
| Year | Q4 | Q3 | Q2 | Q1 | Year | Q4 | Q3 | Q2 | Q1 | |||||||||||||||||||||||||||||||
| Total Operations Netback - Canadian Operations ($/BOE) |
||||||||||||||||||||||||||||||||||||||||
| Price |
34.21 | 28.06 | 29.21 | 31.02 | 46.20 | 25.13 | 27.02 | 23.42 | 26.62 | 23.34 | ||||||||||||||||||||||||||||||
| Production and mineral taxes |
0.15 | 0.09 | 0.15 | 0.16 | 0.18 | 0.15 | 0.17 | 0.29 | 0.05 | 0.09 | ||||||||||||||||||||||||||||||
| Transportation and processing |
8.55 | 9.79 | 8.10 | 8.76 | 7.87 | 7.62 | 8.31 | 7.60 | 7.30 | 7.16 | ||||||||||||||||||||||||||||||
| Operating |
3.14 | 3.39 | 2.96 | 2.98 | 3.29 | 3.65 | 3.32 | 3.34 | 3.88 | 4.13 | ||||||||||||||||||||||||||||||
|
|
|
|
|
|
|
|
|
|
|
|
|
|
|
|
|
|
|
|
|
|||||||||||||||||||||
| Netback |
22.37 | 14.79 | 18.00 | 19.12 | 34.86 | 13.71 | 15.22 | 12.19 | 15.39 | 11.96 | ||||||||||||||||||||||||||||||
|
|
|
|
|
|
|
|
|
|
|
|
|
|
|
|
|
|
|
|
|
|||||||||||||||||||||
| Total Operations Netback - USA Operations ($/BOE) |
||||||||||||||||||||||||||||||||||||||||
| Price |
37.53 | 36.64 | 41.38 | 35.48 | 36.82 | 27.37 | 28.42 | 27.23 | 29.35 | 24.61 | ||||||||||||||||||||||||||||||
| Production and mineral taxes |
1.53 | 1.84 | 0.72 | 1.51 | 1.99 | 1.31 | 1.54 | 1.22 | 1.55 | 0.97 | ||||||||||||||||||||||||||||||
| Transportation and processing |
8.52 | 8.17 | 9.03 | 9.23 | 7.75 | 7.98 | 8.24 | 8.24 | 7.69 | 7.80 | ||||||||||||||||||||||||||||||
| Operating |
4.53 | 5.51 | 5.12 | 4.05 | 3.60 | 4.42 | 5.06 | 4.04 | 3.97 | 4.65 | ||||||||||||||||||||||||||||||
|
|
|
|
|
|
|
|
|
|
|
|
|
|
|
|
|
|
|
|
|
|||||||||||||||||||||
| Netback |
22.95 | 21.12 | 26.51 | 20.69 | 23.48 | 13.66 | 13.58 | 13.73 | 16.14 | 11.19 | ||||||||||||||||||||||||||||||
|
|
|
|
|
|
|
|
|
|
|
|
|
|
|
|
|
|
|
|
|
|||||||||||||||||||||
| Total Operations Netback ($/BOE) |
||||||||||||||||||||||||||||||||||||||||
| Price |
35.67 | 32.25 | 34.36 | 32.93 | 42.12 | 26.20 | 27.63 | 25.23 | 27.99 | 23.97 | ||||||||||||||||||||||||||||||
| Production and mineral taxes |
0.76 | 0.94 | 0.39 | 0.74 | 0.97 | 0.71 | 0.77 | 0.73 | 0.80 | 0.53 | ||||||||||||||||||||||||||||||
| Transportation and processing |
8.54 | 9.00 | 8.50 | 8.96 | 7.82 | 7.79 | 8.28 | 7.90 | 7.50 | 7.48 | ||||||||||||||||||||||||||||||
| Operating (3) |
3.76 | 4.43 | 3.87 | 3.44 | 3.43 | 4.01 | 4.08 | 3.67 | 3.92 | 4.38 | ||||||||||||||||||||||||||||||
|
|
|
|
|
|
|
|
|
|
|
|
|
|
|
|
|
|
|
|
|
|||||||||||||||||||||
| Netback |
22.61 | 17.88 | 21.60 | 19.79 | 29.90 | 13.69 | 14.50 | 12.93 | 15.77 | 11.58 | ||||||||||||||||||||||||||||||
|
|
|
|
|
|
|
|
|
|
|
|
|
|
|
|
|
|
|
|
|
|||||||||||||||||||||
| (1) | Canadian Operations price reflects Deep Panuke price for 2014 of $8.34/Mcf on natural gas production volumes of 190 MMcf/d. Excluding the impact of the Deep Panuke operations, the natural gas price for 2014 is $4.35/Mcf. |
| (2) | Excluding the impact of the Deep Panuke operations, the natural gas price for 2014 is $4.47/Mcf. |
| (3) | 2014 operating expense includes costs related to long-term incentives of $0.06/BOE (2013 – $0.08/BOE). |
Impact of Realized Financial Hedging
| 2014 | 2013 | |||||||||||||||||||||||||||||||||||||||
| Year | Q4 | Q3 | Q2 | Q1 | Year | Q4 | Q3 | Q2 | Q1 | |||||||||||||||||||||||||||||||
| Natural Gas ($/Mcf) |
||||||||||||||||||||||||||||||||||||||||
| Canadian Operations |
(0.15 | ) | 0.24 | 0.16 | (0.33 | ) | (0.53 | ) | 0.51 | 0.60 | 0.78 | 0.15 | 0.50 | |||||||||||||||||||||||||||
| USA Operations |
(0.24 | ) | 0.19 | 0.12 | (0.44 | ) | (0.58 | ) | 0.53 | 0.72 | 0.69 | 0.21 | 0.53 | |||||||||||||||||||||||||||
| Total Operations |
(0.19 | ) | 0.22 | 0.15 | (0.38 | ) | (0.55 | ) | 0.52 | 0.65 | 0.74 | 0.18 | 0.51 | |||||||||||||||||||||||||||
| Oil & NGLs ($/bbl) |
||||||||||||||||||||||||||||||||||||||||
| Canadian Operations |
1.36 | 9.35 | (0.31 | ) | (1.22 | ) | (0.09 | ) | 0.46 | 1.62 | (2.59 | ) | 1.00 | 2.20 | ||||||||||||||||||||||||||
| USA Operations |
3.29 | 8.94 | 0.25 | (2.28 | ) | 0.04 | 0.44 | 1.15 | (2.73 | ) | 1.32 | 2.67 | ||||||||||||||||||||||||||||
| Total Operations |
2.46 | 9.05 | 0.02 | (1.70 | ) | (0.04 | ) | 0.45 | 1.43 | (2.65 | ) | 1.15 | 2.41 | |||||||||||||||||||||||||||
| Total ($/BOE) |
||||||||||||||||||||||||||||||||||||||||
| Canadian Operations |
(0.57 | ) | 2.49 | 0.78 | (1.89 | ) | (2.77 | ) | 2.78 | 3.32 | 3.78 | 0.91 | 2.93 | |||||||||||||||||||||||||||
| USA Operations |
(0.33 | ) | 4.15 | 0.58 | (2.57 | ) | (3.07 | ) | 2.93 | 3.96 | 3.44 | 1.28 | 3.14 | |||||||||||||||||||||||||||
| Total Operations |
(0.46 | ) | 3.30 | 0.70 | (2.18 | ) | (2.90 | ) | 2.85 | 3.60 | 3.62 | 1.09 | 3.03 | |||||||||||||||||||||||||||
Annual Report 2014 | Encana Corporation 109
SUPPLEMENTAL OIL AND GAS OPERATING STATISTICS (unaudited)
OPERATING STATISTICS - AFTER ROYALTIES (continued)
Per-unit Results, Including the Impact of Realized Financial Hedging
| 2014 | 2013 | |||||||||||||||||||||||||||||||||||||||
| Year | Q4 | Q3 | Q2 | Q1 | Year | Q4 | Q3 | Q2 | Q1 | |||||||||||||||||||||||||||||||
| Natural Gas Price ($/Mcf) |
||||||||||||||||||||||||||||||||||||||||
| Canadian Operations |
4.74 | 4.17 | 3.94 | 3.94 | 6.64 | 3.86 | 4.20 | 3.68 | 3.84 | 3.71 | ||||||||||||||||||||||||||||||
| USA Operations |
4.38 | 4.14 | 4.17 | 4.28 | 4.76 | 4.34 | 4.53 | 4.35 | 4.50 | 4.03 | ||||||||||||||||||||||||||||||
| Total Operations |
4.59 | 4.16 | 4.03 | 4.08 | 5.82 | 4.09 | 4.34 | 4.00 | 4.17 | 3.86 | ||||||||||||||||||||||||||||||
| Natural Gas Netback ($/Mcf) |
||||||||||||||||||||||||||||||||||||||||
| Canadian Operations |
2.65 | 1.88 | 1.94 | 1.82 | 4.62 | 1.87 | 2.13 | 1.74 | 1.86 | 1.75 | ||||||||||||||||||||||||||||||
| USA Operations |
1.77 | 1.06 | 1.53 | 1.66 | 2.43 | 2.02 | 1.93 | 2.04 | 2.28 | 1.86 | ||||||||||||||||||||||||||||||
| Total Operations |
2.27 | 1.55 | 1.79 | 1.75 | 3.66 | 1.94 | 2.04 | 1.87 | 2.07 | 1.79 | ||||||||||||||||||||||||||||||
| Oil & NGLs Price ($/bbl) |
||||||||||||||||||||||||||||||||||||||||
| Canadian Operations |
65.52 | 66.85 | 64.48 | 64.91 | 66.27 | 65.52 | 64.42 | 64.74 | 66.88 | 66.92 | ||||||||||||||||||||||||||||||
| USA Operations |
72.83 | 66.24 | 79.68 | 75.18 | 73.65 | 70.62 | 70.61 | 69.80 | 69.88 | 72.58 | ||||||||||||||||||||||||||||||
| Total Operations |
69.70 | 66.40 | 73.50 | 69.53 | 69.19 | 67.75 | 67.01 | 66.95 | 68.25 | 69.45 | ||||||||||||||||||||||||||||||
| Oil & NGLs Netback ($/bbl) |
||||||||||||||||||||||||||||||||||||||||
| Canadian Operations |
58.20 | 56.83 | 57.55 | 58.13 | 59.92 | 58.11 | 56.63 | 56.68 | 60.96 | 59.40 | ||||||||||||||||||||||||||||||
| USA Operations |
61.98 | 55.48 | 67.07 | 65.70 | 65.03 | 58.81 | 61.44 | 59.77 | 57.77 | 54.92 | ||||||||||||||||||||||||||||||
| Total Operations |
60.35 | 55.83 | 63.20 | 61.54 | 61.93 | 58.42 | 58.64 | 58.02 | 59.52 | 57.41 | ||||||||||||||||||||||||||||||
| Total Price ($/BOE) |
||||||||||||||||||||||||||||||||||||||||
| Canadian Operations |
33.64 | 30.55 | 29.99 | 29.13 | 43.43 | 27.91 | 30.34 | 27.20 | 27.53 | 26.27 | ||||||||||||||||||||||||||||||
| USA Operations |
37.20 | 40.79 | 41.96 | 32.91 | 33.75 | 30.30 | 32.38 | 30.67 | 30.63 | 27.75 | ||||||||||||||||||||||||||||||
| Total Operations |
35.21 | 35.55 | 35.06 | 30.75 | 39.22 | 29.05 | 31.23 | 28.85 | 29.08 | 27.00 | ||||||||||||||||||||||||||||||
| Total Netback ($/BOE) |
||||||||||||||||||||||||||||||||||||||||
| Canadian Operations |
21.80 | 17.28 | 18.78 | 17.23 | 32.09 | 16.49 | 18.54 | 15.97 | 16.30 | 14.89 | ||||||||||||||||||||||||||||||
| USA Operations |
22.62 | 25.27 | 27.09 | 18.12 | 20.41 | 16.59 | 17.54 | 17.17 | 17.42 | 14.33 | ||||||||||||||||||||||||||||||
| Total Operations |
22.15 | 21.18 | 22.30 | 17.61 | 27.00 | 16.54 | 18.10 | 16.55 | 16.86 | 14.61 | ||||||||||||||||||||||||||||||
110 Encana Corporation | Annual Report 2014
SUPPLEMENTAL OIL AND GAS OPERATING STATISTICS (unaudited)
RESULTS BY PLAY
| 2014 | 2013 | |||||||||||||||||||||||||||||||||||||||
| Year | Q4 | Q3 | Q2 | Q1 | Year | Q4 | Q3 | Q2 | Q1 | |||||||||||||||||||||||||||||||
| Natural Gas Production (MMcf/d) - After Royalties |
||||||||||||||||||||||||||||||||||||||||
| Canadian Operations |
||||||||||||||||||||||||||||||||||||||||
| Montney |
514 | 570 | 517 | 484 | 484 | 463 | 500 | 513 | 424 | 413 | ||||||||||||||||||||||||||||||
| Duvernay |
11 | 12 | 15 | 9 | 8 | 4 | 7 | 5 | 2 | 1 | ||||||||||||||||||||||||||||||
| Other Upstream Operations (1) |
||||||||||||||||||||||||||||||||||||||||
| Clearwater |
292 | 249 | 291 | 305 | 324 | 335 | 329 | 332 | 331 | 347 | ||||||||||||||||||||||||||||||
| Bighorn |
158 | (3 | ) | 162 | 230 | 246 | 255 | 283 | 253 | 242 | 243 | |||||||||||||||||||||||||||||
| Deep Panuke |
190 | 79 | 186 | 243 | 253 | 41 | 133 | 30 | — | — | ||||||||||||||||||||||||||||||
| Other and emerging |
213 | 204 | 203 | 192 | 253 | 334 | 276 | 281 | 365 | 418 | ||||||||||||||||||||||||||||||
|
|
|
|
|
|
|
|
|
|
|
|
|
|
|
|
|
|
|
|
|
|||||||||||||||||||||
| Total Canadian Operations |
1,378 | 1,111 | 1,374 | 1,463 | 1,568 | 1,432 | 1,528 | 1,414 | 1,364 | 1,422 | ||||||||||||||||||||||||||||||
|
|
|
|
|
|
|
|
|
|
|
|
|
|
|
|
|
|
|
|
|
|||||||||||||||||||||
| USA Operations |
||||||||||||||||||||||||||||||||||||||||
| Eagle Ford |
19 | 35 | 35 | 5 | — | — | — | — | — | — | ||||||||||||||||||||||||||||||
| Permian |
5 | 20 | — | — | — | — | — | — | — | — | ||||||||||||||||||||||||||||||
| DJ Basin |
43 | 49 | 38 | 43 | 40 | 39 | 43 | 37 | 39 | 37 | ||||||||||||||||||||||||||||||
| San Juan |
8 | 8 | 9 | 7 | 7 | 3 | 6 | 3 | 1 | 1 | ||||||||||||||||||||||||||||||
| Other Upstream Operations (1) |
||||||||||||||||||||||||||||||||||||||||
| Piceance |
402 | 367 | 398 | 407 | 436 | 455 | 452 | 444 | 465 | 459 | ||||||||||||||||||||||||||||||
| Haynesville |
311 | 252 | 298 | 365 | 331 | 348 | 261 | 336 | 375 | 420 | ||||||||||||||||||||||||||||||
| Jonah |
100 | — | — | 124 | 282 | 323 | 296 | 320 | 332 | 346 | ||||||||||||||||||||||||||||||
| East Texas |
57 | — | 21 | 97 | 113 | 136 | 123 | 132 | 145 | 145 | ||||||||||||||||||||||||||||||
| Other and emerging |
27 | 19 | 26 | 30 | 32 | 41 | 35 | 37 | 45 | 47 | ||||||||||||||||||||||||||||||
|
|
|
|
|
|
|
|
|
|
|
|
|
|
|
|
|
|
|
|
|
|||||||||||||||||||||
| Total USA Operations |
972 | 750 | 825 | 1,078 | 1,241 | 1,345 | 1,216 | 1,309 | 1,402 | 1,455 | ||||||||||||||||||||||||||||||
|
|
|
|
|
|
|
|
|
|
|
|
|
|
|
|
|
|
|
|
|
|||||||||||||||||||||
| Oil & NGLs Production (Mbbls/d) - After Royalties |
||||||||||||||||||||||||||||||||||||||||
| Canadian Operations |
||||||||||||||||||||||||||||||||||||||||
| Montney |
18.7 | 24.6 | 20.7 | 13.3 | 16.1 | 10.0 | 13.5 | 11.8 | 7.8 | 6.7 | ||||||||||||||||||||||||||||||
| Duvernay |
2.1 | 2.5 | 2.6 | 1.8 | 1.4 | 0.7 | 1.2 | 0.7 | 0.5 | 0.3 | ||||||||||||||||||||||||||||||
| Other Upstream Operations (1) |
||||||||||||||||||||||||||||||||||||||||
| Clearwater |
8.6 | 2.0 | 9.9 | 11.3 | 11.3 | 9.9 | 12.2 | 9.8 | 9.2 | 8.5 | ||||||||||||||||||||||||||||||
| Bighorn |
7.5 | (1.5 | ) | 8.7 | 11.0 | 12.1 | 8.9 | 10.9 | 9.9 | 7.4 | 7.4 | |||||||||||||||||||||||||||||
| Other and emerging |
0.3 | 0.6 | 0.4 | — | 0.1 | 0.9 | 0.7 | 0.6 | 1.1 | 1.1 | ||||||||||||||||||||||||||||||
|
|
|
|
|
|
|
|
|
|
|
|
|
|
|
|
|
|
|
|
|
|||||||||||||||||||||
| Total Canadian Operations |
37.2 | 28.2 | 42.3 | 37.4 | 41.0 | 30.4 | 38.5 | 32.8 | 26.0 | 24.0 | ||||||||||||||||||||||||||||||
|
|
|
|
|
|
|
|
|
|
|
|
|
|
|
|
|
|
|
|
|
|||||||||||||||||||||
| USA Operations |
||||||||||||||||||||||||||||||||||||||||
| Eagle Ford |
19.8 | 36.1 | 37.6 | 5.0 | — | — | — | — | — | — | ||||||||||||||||||||||||||||||
| Permian |
3.5 | 13.8 | — | — | — | — | — | — | — | — | ||||||||||||||||||||||||||||||
| DJ Basin |
11.6 | 14.0 | 11.8 | 10.1 | 10.5 | 8.4 | 10.7 | 8.2 | 7.8 | 6.8 | ||||||||||||||||||||||||||||||
| San Juan |
3.9 | 5.6 | 3.5 | 3.9 | 2.7 | 1.4 | 2.9 | 1.9 | 0.4 | 0.3 | ||||||||||||||||||||||||||||||
| Other Upstream Operations (1) |
||||||||||||||||||||||||||||||||||||||||
| Piceance |
5.0 | 4.3 | 4.8 | 5.3 | 5.4 | 5.1 | 5.3 | 5.5 | 5.2 | 4.3 | ||||||||||||||||||||||||||||||
| Jonah |
1.8 | — | 0.2 | 2.5 | 4.7 | 4.7 | 4.6 | 4.8 | 4.9 | 4.6 | ||||||||||||||||||||||||||||||
| East Texas |
0.5 | — | — | 1.0 | 1.2 | 1.0 | 1.0 | 1.1 | 0.9 | 0.8 | ||||||||||||||||||||||||||||||
| Other and emerging |
3.5 | 4.4 | 3.8 | 3.0 | 2.4 | 2.9 | 3.0 | 3.9 | 2.4 | 2.7 | ||||||||||||||||||||||||||||||
|
|
|
|
|
|
|
|
|
|
|
|
|
|
|
|
|
|
|
|
|
|||||||||||||||||||||
| Total USA Operations |
49.6 | 78.2 | 61.7 | 30.8 | 26.9 | 23.5 | 27.5 | 25.4 | 21.6 | 19.5 | ||||||||||||||||||||||||||||||
|
|
|
|
|
|
|
|
|
|
|
|
|
|
|
|
|
|
|
|
|
|||||||||||||||||||||
| (1) | Other Upstream Operations includes results from plays that are not part of the Company’s current strategic focus as well as prospective plays which are under appraisal, including the TMS which is reported in Other and emerging in the USA Operations. |
Annual Report 2014 | Encana Corporation 111
SUPPLEMENTAL OIL AND GAS OPERATING STATISTICS (unaudited)
RESULTS BY PLAY (continued)
| 2014 | 2013 | |||||||||||||||||||||||||||||||||||||||
| Year | Q4 | Q3 | Q2 | Q1 | Year | Q4 | Q3 | Q2 | Q1 | |||||||||||||||||||||||||||||||
| Drilling Activity (net wells drilled) |
||||||||||||||||||||||||||||||||||||||||
| Canadian Operations |
||||||||||||||||||||||||||||||||||||||||
| Montney |
79 | 14 | 15 | 23 | 27 | 61 | 18 | 14 | 13 | 16 | ||||||||||||||||||||||||||||||
| Duvernay |
24 | 5 | 7 | 6 | 6 | 12 | 4 | 4 | 2 | 2 | ||||||||||||||||||||||||||||||
| Other Upstream Operations (1) |
||||||||||||||||||||||||||||||||||||||||
| Clearwater |
174 | 84 | 24 | — | 66 | 283 | 115 | 81 | — | 87 | ||||||||||||||||||||||||||||||
| Bighorn |
1 | — | 1 | — | — | 21 | 1 | 3 | 9 | 8 | ||||||||||||||||||||||||||||||
| Other and emerging |
1 | — | 1 | — | — | 13 | 2 | 2 | 5 | 4 | ||||||||||||||||||||||||||||||
|
|
|
|
|
|
|
|
|
|
|
|
|
|
|
|
|
|
|
|
|
|||||||||||||||||||||
| Total Canadian Operations |
279 | 103 | 48 | 29 | 99 | 390 | 140 | 104 | 29 | 117 | ||||||||||||||||||||||||||||||
|
|
|
|
|
|
|
|
|
|
|
|
|
|
|
|
|
|
|
|
|
|||||||||||||||||||||
| USA Operations |
||||||||||||||||||||||||||||||||||||||||
| Eagle Ford |
35 | 21 | 14 | — | — | — | — | — | — | — | ||||||||||||||||||||||||||||||
| Permian |
28 | 28 | — | — | — | — | — | — | — | — | ||||||||||||||||||||||||||||||
| DJ Basin |
64 | 15 | 17 | 14 | 18 | 51 | 11 | 13 | 15 | 12 | ||||||||||||||||||||||||||||||
| San Juan |
43 | 19 | 15 | 5 | 4 | 19 | 4 | 7 | 6 | 2 | ||||||||||||||||||||||||||||||
| Other Upstream Operations (1) |
||||||||||||||||||||||||||||||||||||||||
| Piceance |
1 | — | — | — | 1 | 85 | 20 | 20 | 23 | 22 | ||||||||||||||||||||||||||||||
| Haynesville |
— | — | — | — | — | 19 | 7 | 5 | 5 | 2 | ||||||||||||||||||||||||||||||
| Jonah |
18 | — | — | 6 | 12 | 49 | 9 | 13 | 13 | 14 | ||||||||||||||||||||||||||||||
| East Texas |
— | — | — | — | — | 7 | 3 | 2 | — | 2 | ||||||||||||||||||||||||||||||
| Other and emerging |
15 | 5 | 4 | 4 | 2 | 7 | 2 | 2 | — | 3 | ||||||||||||||||||||||||||||||
|
|
|
|
|
|
|
|
|
|
|
|
|
|
|
|
|
|
|
|
|
|||||||||||||||||||||
| Total USA Operations |
204 | 88 | 50 | 29 | 37 | 237 | 56 | 62 | 62 | 57 | ||||||||||||||||||||||||||||||
|
|
|
|
|
|
|
|
|
|
|
|
|
|
|
|
|
|
|
|
|
|||||||||||||||||||||
| (1) | Other Upstream Operations includes net wells drilled in plays that are not part of the Company’s current strategic focus as well as prospective plays which are under appraisal, including the TMS which is reported in Other and emerging in the USA Operations. |
112 Encana Corporation | Annual Report 2014
STRONG LEADERSHIP / OUR EXECUTIVE LEADERSHIP AND BOARD
| EXECUTIVE LEADERSHIP TEAM |
BOARD OF DIRECTORS | |||
|
Doug Suttles President & Chief Executive Officer
Doug Suttles joined Encana as President & CEO in June 2013. With 30 years of experience in the oil and gas industry in various engineering and leadership roles, he is responsible for the overall success of Encana and for creating, planning, implementing, and integrating the strategic direction of the organization.
Sherri Brillon Executive Vice-President & Chief Financial Officer
Responsible for the development and execution of a disciplined and dynamic capital allocation process strongly linked to the company’s strategic direction and the provision of financial expertise across the organization.
David Hill Executive Vice-President, Exploration & Business Development
Responsible for reviewing the company’s asset base and ensuring Encana has the right assets today and in the future as well as securing a top-tier resource portfolio for the company.
Joanne Alexander Executive Vice-President & General Counsel
Responsible for the overall legal affairs of Encana and its subsidiaries and overseeing the company’s corporate compliance program. |
Mike McAllister Executive Vice-President & Chief Operating Officer
Responsible for Encana’s upstream and production activities across the company’s assets and tasked with relentlessly pursuing greater efficiency and operational excellence.
Ryder McRitchie Vice-President, Investor Relations & Communications
Responsible for the communications, community involvement, government relations, and policy, environment and sustainability groups. Each of these play an important role in supporting Encana’s operations and uniting the Encana brand throughout North America and ensuring all of our communications are aligned with our strategy.
Mike Williams Executive Vice-President, Corporate Services
Responsible for overseeing Encana’s Corporate Services including the information technology, human resources, administration services, business office and travel & meetings groups.
Reneé Zemljak Executive Vice-President, Midstream, Marketing & Fundamentals
Responsible for driving strategic direction through industry-leading market fundamentals, maintaining Encana’s status as a supplier of choice and maximizing profitability through optimization of netback prices. |
Clayton Woitas Calgary, Alberta
Peter Dea Denver, Colorado
Fred Fowler Houston, Texas
Howard Mayson Breckenridge, Colorado
Lee McIntire Denver, Colorado
Suzanne Nimocks Houston, Texas
Jane Peverett West Vancouver, British Columbia
Brian Shaw Toronto, Ontario
Doug Suttles Calgary, Alberta
Bruce Waterman Calgary, Alberta | ||
Annual Report 2014 | Encana Corporation 113
CORPORATE AND
INVESTOR INFORMATION / TO OUR SHAREHOLDERS
114 Encana Corporation | Annual Report 2014
ABBREVIATIONS / 2014 ANNUAL REPORT
| bbls | barrels | MMbbls/d | million barrels per day | |||
| bbls/d | barrels per day | Mcf | thousand cubic feet | |||
| BOE | barrels of oil equivalent | MM | million | |||
| Bcf | billion cubic feet | MMcf | million cubic feet | |||
| Bcf/d | billion cubic feet per day | MMcf/d | million cubic feet per day | |||
| Mbbls | thousand barrels | NGLs | natural gas liquids | |||
| Mbbls/d | thousand barrels per day | Tcf | trillion cubic feet | |||
| MMbbls | million barrels | /d | per day | |||

 Please recycle this publication
Printed in Canada at Blanchette Press
Encana Corporation
500 Centre Street SE
PO Box 2850
Calgary AB T2P 2S5
CANADA
encana.com/investors
TSX: ECA — NYSE: ECA
Serious News for Serious Traders! Try StreetInsider.com Premium Free!
You May Also Be Interested In
- SEIDOR, RECOGNIZED AS THE TOP GLOBAL SAP PARTNER FOR CROSS-SEGMENT, MIDMARKET, AND SME SALES VOLUMES
- U.S. National Park Service Deploys Beam Global EV ARC™ Solar-Powered EV Charging Systems at Headquarters at the National Mall
- Snowline Gold Consolidates 100% of Its Einarson Project and Acquires Adjacent Gold Target With Historical Drill Result of 9.7 Grams per Tonne Gold Over 38.7 M
Create E-mail Alert Related Categories
SEC FilingsSign up for StreetInsider Free!
Receive full access to all new and archived articles, unlimited portfolio tracking, e-mail alerts, custom newswires and RSS feeds - and more!
