

Form 6-K ENCANA CORP For: Mar 24
 Tweet
Tweet Share
Share
U.S. SECURITIES AND EXCHANGE COMMISSION
Washington, D.C. 20549
FORM 6-K
Report of Foreign Private Issuer
Pursuant to Rule 13a-16 or 15d-16 under the Securities Exchange Act of 1934
| For March 24, 2016 | Commission File Number: 1-15226 |
ENCANA CORPORATION
(Translation of registrant’s name into English)
Suite 4400, 500 Centre Street SE
PO Box 2850
Calgary, Alberta, Canada T2P 2S5
(Address of principal executive office)
Indicate by check mark whether the registrant files or will file annual reports under cover of Form 20-F or Form 40-F:
Form 20-F Form 40-F ü
Indicate by check mark if the registrant is submitting the Form 6-K in paper as permitted by Regulation S-T Rule 101(b)(1):
Indicate by check mark if the registrant is submitting the Form 6-K in paper as permitted by Regulation S-T Rule 101(b)(7):
DOCUMENTS FILED AS PART OF THIS FORM 6-K
See the Exhibit Index to this Form 6-K.
SIGNATURES
Pursuant to the requirements of the Securities Exchange Act of 1934, the registrant has duly caused this report to be signed on its behalf by the undersigned, thereunto duly authorized.
Date: March 24, 2016
| ENCANA CORPORATION | ||||||||
| (Registrant) | ||||||||
| By: | /s/ | Dawna I. Gibb | ||||||
| Name: | Dawna I. Gibb | |||||||
| Title: | Assistant Corporate Secretary | |||||||
Form 6-K Exhibit Index
| Exhibit No. | The following documents have been filed with Canadian securities commissions: | |
| 99.1 | 2015 Annual Report | |
Exhibit 99.1

Encana Corporation | ANNUAL REPORT 2015
ANNUAL REPORT 2015
encana.com
encana
ANNUAL REPORT 2015
CHAIRMAN’S LETTER 1
CEO’S MESSAGE 2
YEAR-END HIGHLIGHTS 4
SUSTAINABILITY AT ENCANA 6
MD&A 7
FINANCIALS 61
EXECUTIVE TEAM AND BOARD
OF DIRECTORS 128
CORPORATE AND INVESTOR INFORMATION 129
ABBREVIATIONS 130
A STRONG, RESILIENT COMPANY
Chairman’s Letter

1
ADVANCING STRATEGY,
ENHANCING LIQUIDITY
CEO’s Message

2
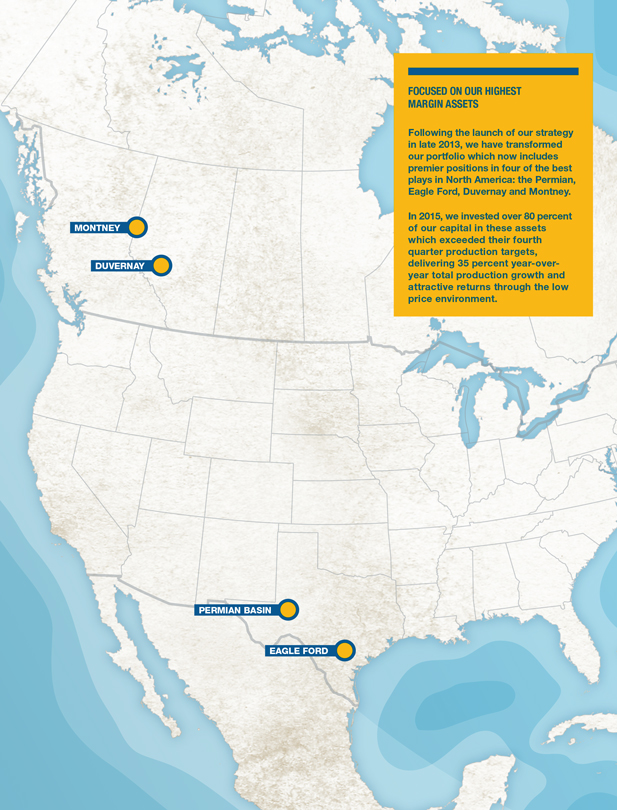
MONTNEY
DUVERNAY
FOCUSED ON OUR HIGHEST MARGIN ASSETS
Following the launch of our strategy in late 2013, we have transformed our
portfolio which now includes premier positions in four of the best plays in North America: the Permian, Eagle Ford, Duvernay and Montney.
In 2015, we invested over 80
percent of our capital in these assets which exceeded their fourth quarter production targets, delivering 35 percent year-over-year total production growth and attractive returns through the low price environment.
PERMIAN BASIN
EAGLE FORD
YEAR-END HIGHLIGHTS
| Financial highlights |
(1) |
| (US$ millions, except per share amounts) | 2015 | 2014 | ||||||
| Revenues, Net of Royalties |
4,422 | 8,019 | ||||||
| Cash Flow (2) |
1,430 | 2,934 | ||||||
| Per Share – Diluted |
1.74 | 3.96 | ||||||
| Net Earnings (Loss) Attributable to Common Shareholders |
(5,165 | ) | 3,392 | |||||
| Per Share – Diluted |
(6.28 | ) | 4.58 | |||||
| Operating Earnings (Loss) (2) |
(61 | ) | 1,002 | |||||
| Per Share – Diluted |
(0.07 | ) | 1.35 | |||||
| Total Capital Investment |
2,232 | 2,526 | ||||||
| Net Acquisitions (Divestitures) |
(1,838 | ) | (1,329 | ) | ||||
| Net Capital Investment |
394 | 1,197 | ||||||
| Dividends Per Common Share |
0.28 | 0.28 | ||||||
| Dividend Yield (%) (3) |
5.5 | 2.0 | ||||||
| Debt to Adjusted Capitalization (%) |
28 | 30 | ||||||
| Debt to Debt Adjusted Cash Flow (times) |
2.8 | 2.1 | ||||||
| Debt to Proved Developed Reserves ($/BOE) (4)(5) |
8.00 | 8.63 | ||||||
| (1) | Reported using financial information prepared in accordance with U.S. Generally Accepted Accounting Principles. |
| (2) | Non-GAAP measures as referenced in the MD&A on pages 54 to 57. |
| (3) | Based on NYSE closing price at year-end. |
| (4) | After royalties, employing forecast prices and costs. |
| (5) | A non-GAAP measure defined as long-term debt including current portion divided by proved developed reserve quantities. |
4
|
|
YEAR-END HIGHLIGHTS
Operational highlights
| After Royalties | 2015 | 2014 | ||||||
| Production Volumes (average) |
||||||||
| Natural Gas (MMcf/d) |
||||||||
| Canadian Operations |
971 | 1,378 | ||||||
| USA Operations |
664 | 972 | ||||||
| Total Natural Gas (MMcf/d) |
1,635 | 2,350 | ||||||
| Oil & NGLs (Mbbls/d) |
||||||||
| Canadian Operations |
28.4 | 37.2 | ||||||
| USA Operations |
105.0 | 49.6 | ||||||
| Total Oil & NGLs (Mbbls/d) |
133.4 | 86.8 | ||||||
| Reserves (1) |
||||||||
| Natural Gas (Bcf) |
4,076 | 5,522 | ||||||
| Oil & NGLs (MMbbls) |
380.1 | 356.5 | ||||||
| Reserve Life Index (years) |
7.2 | 7.3 | ||||||
|
For additional information on reserves reporting protocols, see the MD&A on pages 18 to 21 and page 60.
(1) After royalties, employing forecast prices and costs.
Advisory
Encana reports in U.S. dollars unless otherwise noted. Production, sales, reserves and economic contingent resources estimates are reported on an after royalties basis, unless otherwise noted. Certain information regarding the company and its subsidiaries set forth in this document including management’s assessment of the company’s future plans and operations, may constitute forward-looking statements or forward-looking information under applicable securities laws and necessarily involve risks and uncertainties associated with future events. As a consequence, actual results may differ materially from those anticipated in the forward-looking statements or information. For further details see the Advisory on page 58 of this document.
This document contains references to measures commonly referred to as non-GAAP measures, such as cash flow, cash flow per share – diluted, operating earnings, operating earnings per share – diluted, debt to adjusted capitalization and debt to debt adjusted Cash Flow. Additional disclosure relating to these measures is set forth on page 54, Non-GAAP Measures. |
| |||||||
5
| SUSTAINABILITY: OUR APPROACH AND PRIORITIES |
For more information on our sustainability approach and performance, please visit: encana.com/sustainability |
Running a responsible
and sustainable company
Realizing our vision of being a leading resource play company requires more than the efficient production of oil and natural gas – it requires that we conduct our business responsibly. These objectives are complementary, as we believe that strong environmental, social and governance (ES&G) performance contributes to long-term economic performance and value creation.
Our commitment to strong corporate governance, innovation and responsible development begins with our Board of Directors, is embraced by our Executive Leadership Team and is achieved through the collective efforts of our employees.
Each year, to inform and refine our highest ES&G priorities, we use third-party research, stakeholder consultation and our own internal expertise. We assess each priority against two criteria: their importance to our stakeholders and their potential to impact our business. Our stakeholders include investors, employees, regulators, non-government organizations and residents within our operating communities.
Our strategies for managing these issues are multi-faceted and include the use of industry best practices, stakeholder engagement, innovative operating procedures and transparent reporting. We regularly review and refine our approach for addressing each priority and work continuously to improve our performance.
In 2015, we focused on the following priorities:
6
Management’s Discussion and Analysis
This Management’s Discussion and Analysis (“MD&A”) for Encana Corporation (“Encana” or the “Company”) should be read with the audited Consolidated Financial Statements for the period ended December 31, 2015 (“Consolidated Financial Statements”), as well as the audited Consolidated Financial Statements and MD&A for the year ended December 31, 2014.
The Consolidated Financial Statements and comparative information have been prepared in accordance with United States (“U.S.”) generally accepted accounting principles (“U.S. GAAP”) and in U.S. dollars, except where another currency has been indicated. References to C$ are to Canadian dollars. Encana’s financial results are consolidated in Canadian dollars; however, the Company has adopted the U.S. dollar as its reporting currency to facilitate a more direct comparison to other North American oil and gas companies. Production volumes are presented on an after royalties basis consistent with U.S. oil and gas reporting standards and the disclosure of U.S. oil and gas companies. The term “liquids” is used to represent oil, natural gas liquids (“NGLs” or “NGL”) and condensate. The term “liquids rich” is used to represent natural gas streams with associated liquids volumes. This document is dated February 29, 2016.
For convenience, references in this document to “Encana”, the “Company”, “we”, “us”, “our” and “its” may, where applicable, refer only to or include any relevant direct and indirect subsidiary corporations and partnerships (“Subsidiaries”) of Encana Corporation, and the assets, activities and initiatives of such Subsidiaries.
Certain measures in this document do not have any standardized meaning as prescribed by U.S. GAAP and, therefore, are considered non-GAAP measures. Non-GAAP measures are commonly used in the oil and gas industry and by Encana to provide shareholders and potential investors with additional information regarding the Company’s liquidity and its ability to generate funds to finance its operations. Non-GAAP measures include: Cash Flow; Free Cash Flow; Operating Earnings (Loss); Upstream Operating Cash Flow, excluding Hedging; Operating Netback; Debt to Debt Adjusted Cash Flow; and Debt to Adjusted Capitalization. Further information regarding these measures can be found in the Non-GAAP Measures section of this MD&A, including reconciliations of Cash from Operating Activities to Cash Flow and Free Cash Flow, and of Net Earnings (Loss) Attributable to Common Shareholders to Operating Earnings (Loss).
The following volumetric measures may be abbreviated throughout this MD&A: thousand cubic feet (“Mcf’); million cubic feet (“MMcf) per day (“MMcf/d”); billion cubic feet (“Bcf”) per day (“Bcf/d”); trillion cubic feet (“Tcf’); barrel (“bbl”); thousand barrels (“Mbbls”) per day (“Mbbls/d”); million barrels (“MMbbls”); barrels of oil equivalent (“BOE”) per day (“BOE/d”); thousand barrels of oil equivalent (“MBOE”) per day (“MBOE/d”); million barrels of oil equivalent (“MMBOE”); million British thermal units (“MMBtu”).
Readers should also read the Advisory section located at the end of this document, which provides information on Forward-Looking Statements and Oil and Gas Information.
ANNUAL REPORT 2015 | Encana Corporation 7
MD&A
PREPARED USING U.S. GAAP IN US$
| Encana’s Strategic Objectives |
Encana is a leading North American energy producer that is focused on developing its strong portfolio of resource plays producing natural gas, oil and NGLs. Encana is committed to growing long-term shareholder value through a disciplined focus on generating profitable growth. The Company is pursuing the key business objectives of balancing its commodity portfolio, focusing capital investments in a limited number of core, high return and scalable projects, maintaining portfolio flexibility to respond to changing market conditions, maximizing profitability through operating efficiencies, reducing costs and preserving balance sheet strength.
Encana continually strives to improve operating efficiencies, foster technological innovation and lower its cost structures, while reducing its environmental footprint through play optimization. The Company’s resource play hub model utilizes highly integrated production facilities to develop resources by drilling multiple wells from central pad sites. Capital and operating efficiencies are achieved through repeatable operations, optimizing equipment and processes and by applying continuous improvement techniques.
Encana hedges a portion of its expected natural gas and oil production volumes. The Company’s hedging program reduces volatility and helps sustain Cash Flow and Operating Netbacks during periods of lower prices. Further information on the Company’s commodity price positions as at December 31, 2015 can be found in the Results Overview section of this MD&A and in Note 24 to the Consolidated Financial Statements.
Additional information on expected results can be found in Encana’s Corporate Guidance on the Company’s website www.encana.com.
| Encana’s Business |
Encana’s reportable segments are determined based on the Company’s operations and geographic locations as follows:
| · | Canadian Operations includes the exploration for, development of, and production of natural gas, oil and NGLs and other related activities within Canada. |
| · | USA Operations includes the exploration for, development of, and production of natural gas, oil and NGLs and other related activities within the U.S. |
| · | Market Optimization is primarily responsible for the sale of the Company’s proprietary production. These results are reported in the Canadian and USA Operations. Market optimization activities include third party purchases and sales of product to provide operational flexibility and cost mitigation for transportation commitments, product type, delivery points and customer diversification. These activities are reflected in the Market Optimization segment. Market Optimization sells substantially all of the Company’s upstream production to third party customers. Transactions between segments are based on market values and are eliminated on consolidation. Financial information is presented on an after eliminations basis within this MD&A. |
Corporate and Other mainly includes unrealized gains or losses recorded on derivative financial instruments. Once the instruments are settled, the realized gains and losses are recorded in the reporting segment to which the derivative instruments relate.
Comparative figures for 2014 and 2013 have been updated to present property taxes and certain other levied charges within production, mineral and other taxes. Further information regarding the reclassification can be found in the Results of Operations section of this MD&A.
8 Encana Corporation | ANNUAL REPORT 2015
MD&A
PREPARED USING U.S. GAAP IN US$
| Results Overview |
Highlights
In the year ended December 31, 2015, Encana reported:
| · | Cash Flow of $1,430 million and an Operating Loss of $61 million. |
| · | Net Loss of $5,165 million, including after-tax non-cash ceiling test impairments of $4,130 million and an after-tax non-operating foreign exchange loss of $702 million. |
| · | Average realized natural gas prices, including financial hedges, of $3.89 per Mcf. Average realized oil prices, including financial hedges, of $49.68 per bbl. Average realized NGL prices of $21.66 per bbl. |
| · | Average natural gas production volumes of 1,635 MMcf/d and average oil and NGL production volumes of 133.4 Mbbls/d. |
| · | Dividends paid of $0.28 per share. |
| · | Cash and cash equivalents of $271 million at year end. |
Significant developments for the Company during the year ended December 31, 2015 included the following:
| · | Closed the sale of the Company’s Haynesville natural gas assets located in northern Louisiana to GEP Haynesville, LLC (“GeoSouthern”) on November 12, 2015 for proceeds of approximately $769 million, after closing adjustments. Based on the January 1, 2015 effective date of the transaction, Encana also reduced its gathering and midstream commitments by approximately $480 million (undiscounted) through the transfer of current and future obligations and will transport and market GeoSouthern’s Haynesville production on a fee for service basis for the next five years. |
| · | Announced an agreement on October 8, 2015 to sell to Crestone Peak Resources Holdings LLC, an entity jointly owned by the Canada Pension Plan Investment Board and The Broe Group, the Company’s DJ Basin assets in Colorado, comprising approximately 51,000 net acres, for an announced purchase price of approximately $900 million, before post-closing and other adjustments. The transaction, previously expected to close in the fourth quarter of 2015, is expected to close by the end of the second quarter of 2016, with an effective date of April 1, 2015, and is subject to satisfaction of certain closing conditions. |
| · | Completed a bought deal offering of 98,458,975 common shares of Encana, including common shares issued under an over-allotment option, at a price of C$14.60 per common share (the “Share Offering”). The Share Offering was completed during March 2015 for aggregate gross proceeds of approximately C$1.44 billion. |
| · | Redeemed the Company’s $700 million 5.90 percent notes due December 1, 2017 and its C$750 million 5.80 percent medium-term notes due January 18, 2018, in April 2015, using net proceeds from the Share Offering and cash on hand. |
| · | Closed the sale of the Company’s working interest in certain properties in central and southern Alberta to Ember Resources Inc. on January 15, 2015 for proceeds of approximately C$557 million, after closing adjustments. |
| · | Closed the sale of certain natural gas gathering and compression assets in northeastern British Columbia to Veresen Midstream Limited Partnership (“VMLP”) on March 31, 2015 for cash consideration net to Encana of approximately C$450 million, after closing adjustments. |
ANNUAL REPORT 2015 | Encana Corporation 9
MD&A
PREPARED USING U.S. GAAP IN US$
Financial Results
| 2015 | 2014 | 2013 | ||||||||||||||||||||||||||||||||||||||||||||||
| ($ millions, except as indicated) | Annual | Q4 | Q3 | Q2 | Q1 | Annual | Q4 | Q3 | Q2 | Q1 | Annual | |||||||||||||||||||||||||||||||||||||
| Cash Flow (1) |
$ 1,430 | $ | 383 | $ | 371 | $ | 181 | $ | 495 | $ 2,934 | $ | 377 | $ | 807 | $ | 656 | $ | 1,094 | $ | 2,581 | ||||||||||||||||||||||||||||
| $ per share - diluted |
1.74 | 0.45 | 0.44 | 0.22 | 0.65 | 3.96 | 0.51 | 1.09 | 0.89 | 1.48 | 3.50 | |||||||||||||||||||||||||||||||||||||
| Operating Earnings (Loss) (1), (2) |
(61 | ) | 111 | (24 | ) | (167 | ) | 19 | 1,002 | 35 | 281 | 171 | 515 | 802 | ||||||||||||||||||||||||||||||||||
| $ per share - diluted |
(0.07 | ) | 0.13 | (0.03 | ) | (0.20 | ) | 0.03 | 1.35 | 0.05 | 0.38 | 0.23 | 0.70 | 1.09 | ||||||||||||||||||||||||||||||||||
| Net Earnings (Loss) Attributable to Common Shareholders |
(5,165 | ) | (612 | ) | (1,236 | ) | (1,610 | ) | (1,707 | ) | 3,392 | 198 | 2,807 | 271 | 116 | 236 | ||||||||||||||||||||||||||||||||
| $ per share - basic & diluted
|
|
(6.28
|
)
|
|
(0.72
|
)
|
|
(1.47
|
)
|
|
(1.91
|
)
|
|
(2.25
|
)
|
|
4.58
|
|
|
0.27
|
|
|
3.79
|
|
|
0.37
|
|
|
0.16
|
|
|
0.32
|
| |||||||||||||||
| Revenues, Net of Royalties |
4,422 | 1,031 | 1,312 | 830 | 1,249 | 8,019 | 2,254 | 2,285 | 1,588 | 1,892 | 5,858 | |||||||||||||||||||||||||||||||||||||
| Realized Hedging Gain (Loss), before tax |
901 | 287 | 213 | 161 | 240 | (91 | ) | 124 | 28 | (102 | ) | (141 | ) | 544 | ||||||||||||||||||||||||||||||||||
| Unrealized Hedging Gain (Loss), before tax |
(331 | ) | (90 | ) | 173 | (278 | ) | (136 | ) | 444 | 489 | 231 | 9 | (285 | ) | (345 | ) | |||||||||||||||||||||||||||||||
| Upstream Operating Cash Flow |
2,264 | 552 | 531 | 479 | 702 | 3,918 | 821 | 982 | 800 | 1,315 | 3,192 | |||||||||||||||||||||||||||||||||||||
| Upstream Operating Cash Flow, excluding Hedging (1)
|
|
1,344
|
|
|
261
|
|
|
314
|
|
|
315
|
|
|
454
|
|
|
3,999
|
|
|
694
|
|
|
952
|
|
|
898
|
|
|
1,455
|
|
|
2,652
|
| |||||||||||||||
| Capital Investment |
2,232 | 280 | 473 | 743 | 736 | 2,526 | 857 | 598 | 560 | 511 | 2,712 | |||||||||||||||||||||||||||||||||||||
| Net Acquisitions & (Divestitures) (3) |
(1,838 | ) | (761 | ) | (99 | ) | (140 | ) | (838 | ) | (1,329 | ) | 50 | (2,007 | ) | 652 | (24 | ) | (521 | ) | ||||||||||||||||||||||||||||
| Free Cash Flow (1) |
(802 | ) | 103 | (102 | ) | (562 | ) | (241 | ) | 408 | (480 | ) | 209 | 96 | 583 | (131 | ) | |||||||||||||||||||||||||||||||
| Ceiling Test Impairments, after tax |
(4,130 | ) | (514 | ) | (1,066 | ) | (1,328 | ) | (1,222 | ) | - | - | - | - | - | - | ||||||||||||||||||||||||||||||||
| Gain (Loss) on Divestitures, after tax
|
|
9
|
|
|
-
|
|
|
(2
|
)
|
|
1
|
|
|
10
|
|
|
2,523
|
|
|
(11
|
)
|
|
2,399
|
|
|
135
|
|
|
-
|
|
|
-
|
| |||||||||||||||
| Total Assets (4) |
15,644 | 24,531 | 17,645 | |||||||||||||||||||||||||||||||||||||||||||||
| Total Debt |
5,363 | 7,340 | 7,124 | |||||||||||||||||||||||||||||||||||||||||||||
| Cash & Cash Equivalents
|
|
271
|
|
|
338
|
|
|
2,566
|
| |||||||||||||||||||||||||||||||||||||||
| Production Volumes |
||||||||||||||||||||||||||||||||||||||||||||||||
| Natural Gas (MMcf/d) |
1,635 | 1,571 | 1,547 | 1,568 | 1,857 | 2,350 | 1,861 | 2,199 | 2,541 | 2,809 | 2,777 | |||||||||||||||||||||||||||||||||||||
| Oil & NGLs (Mbbls/d) |
||||||||||||||||||||||||||||||||||||||||||||||||
| Oil |
87.0 | 90.6 | 91.9 | 86.2 | 79.2 | 49.4 | 68.8 | 62.1 | 34.2 | 32.1 | 25.8 | |||||||||||||||||||||||||||||||||||||
| NGLs |
46.4 | 54.4 | 48.5 | 41.1 | 41.5 | 37.4 | 37.6 | 41.9 | 34.0 | 35.8 | 28.1 | |||||||||||||||||||||||||||||||||||||
| Total Oil & NGLs |
133.4 | 145.0 | 140.4 | 127.3 | 120.7 | 86.8 | 106.4 | 104.0 | 68.2 | 67.9 | 53.9 | |||||||||||||||||||||||||||||||||||||
| Total Production (MBOE/d) |
405.9 | 406.8 | 398.3 | 388.7 | 430.1 | 478.5 | 416.7 | 470.6 | 491.8 | 536.1 | 516.7 | |||||||||||||||||||||||||||||||||||||
| Production Mix (%) |
||||||||||||||||||||||||||||||||||||||||||||||||
| Natural Gas |
67 | 64 | 65 | 67 | 72 | 82 | 74 | 78 | 86 | 87 | 90 | |||||||||||||||||||||||||||||||||||||
| Oil & NGLs |
33 | 36 | 35 | 33 | 28 | 18 | 26 | 22 | 14 | 13 | 10 | |||||||||||||||||||||||||||||||||||||
| (1) | A non-GAAP measure, which is defined in the Non-GAAP Measures section of this MD&A. |
| (2) | In continued support of Encana’s strategy, organizational structure changes were formalized in Q2 2015 and resulted in a revision to the Q1 2015 Operating Earnings to exclude restructuring charges incurred in the first quarter. |
| (3) | Excludes the impact of the PrairieSky Royalty Ltd. divestiture and the Athlon Energy Inc. acquisition during 2014, as summarized in the Net Capital Investment section of this MD&A. |
| (4) | 2014 and 2013 have been restated due to the early adoption of Accounting Standard Update 2015-17, Balance Sheet Classification of Deferred Taxes, as discussed in the Accounting Policies and Estimates section of this MD&A. |
10 Encana Corporation | ANNUAL REPORT 2015
MD&A
PREPARED USING U.S. GAAP IN US$
Factors Impacting Quarterly Net Earnings
Encana’s quarterly net earnings can be significantly impacted by fluctuations in commodity prices, realized and unrealized hedging gains and losses, production volumes, foreign exchange rates, ceiling test impairments and gains or losses on divestitures, which are provided in the Financial Results table and Prices and Foreign Exchange Rates table within this MD&A. Quarterly net earnings are also impacted by Encana’s interim income tax expense calculated using the estimated annual effective income tax rate as discussed in the Critical Accounting Estimates section of this MD&A, and by acquisition and divestiture transactions as discussed in the Net Capital Investment section of this MD&A.
Ceiling Test Impairments
Under full cost accounting, the carrying amount of Encana’s natural gas and oil properties within each country cost centre is subject to a ceiling test performed quarterly. Ceiling test impairments are recognized when the capitalized costs, net of accumulated depletion and the related deferred income taxes, exceed the sum of the estimated after-tax future net cash flows from proved reserves as calculated under Securities and Exchange Commission (“SEC”) requirements using the 12-month average trailing prices and discounted at 10 percent.
In 2015, the Company recognized after-tax non-cash ceiling test impairments of $4,130 million in the USA Operations. The non-cash ceiling test impairments primarily resulted from the decline in the 12-month average trailing prices. Further declines in the 12-month average trailing prices could reduce proved reserves volumes and values and result in the recognition of future ceiling test impairments.
Future ceiling test impairments are difficult to reasonably predict and depend on commodity prices, as well as changes to reserves estimates, future development costs, capitalized costs and unproved property costs. Proceeds received from natural gas and oil property divestitures are generally deducted from the Company’s capitalized costs and can reduce the likelihood of ceiling test impairments.
The Company has calculated the estimated effects that certain price changes would have had on its ceiling test impairment for the year ended December 31, 2015. Using the average of the price on the first day of each month from the most recent nine months of 2015 and commodity futures prices for the first three months of 2016, the 12- month average trailing prices for the year ended December 31, 2015 would have been $47.28 per bbl for WTI, C$58.61 per bbl for Edmonton Light Sweet, $2.47 per MMBtu for Henry Hub, and C$2.59 per MMBtu for AECO, while holding all other inputs and assumptions constant. Based on these estimated prices, an additional after-tax ceiling test impairment of $174 million for the USA Operations and $2 million for the Canadian Operations would have been recognized for the year ended December 31, 2015. The additional estimated after-tax ceiling test impairment is partly a result of an 11 percent decrease in proved undeveloped reserves as certain locations would not be economic at these revised prices. This estimate strictly isolates the potential impact of commodity prices on the Company’s proved reserves volumes and values. Due to uncertainties in estimating proved reserves, the additional after-tax ceiling test impairment described and resulting implications may not be indicative of Encana’s future development plans, operating or financial results.
The Company believes that the discounted after-tax future net cash flows from proved reserves required to be used in the ceiling test calculation are not indicative of the fair market value of Encana’s natural gas and oil properties or the future net cash flows expected to be generated from such properties. Additional information on the ceiling test calculation can be found in the Critical Accounting Estimates section of this MD&A.
ANNUAL REPORT 2015 | Encana Corporation 11
MD&A
PREPARED USING U.S. GAAP IN US$
Q4 2015 versus Q4 2014
Cash Flow of $383 million increased $6 million during the three months ended December 31, 2015 and was impacted by the following significant items:
| · | Average realized natural gas prices, excluding financial hedges, were $2.13 per Mcf compared to $3.94 per Mcf in 2014 reflecting lower benchmark prices. Lower realized natural gas prices decreased revenues $263 million. Average realized liquids prices, excluding financial hedges, were $31.43 per bbl compared to $57.35 per bbl in 2014 reflecting lower benchmark prices. Lower realized liquids prices decreased revenues $330 million. |
| · | Average natural gas production volumes of 1,571 MMcf/d decreased 290 MMcf/d from 1,861 MMcf/d in 2014 primarily due to divestitures, natural declines in Haynesville and Piceance and lower production from Deep Panuke, partially offset by successful drilling programs in Montney and Duvernay. Lower natural gas volumes decreased revenues $107 million. Average oil and NGL production volumes of 145.0 Mbbls/d increased 38.6 Mbbls/d from 106.4 Mbbls/d in 2014 primarily due to acquisitions and successful drilling programs in liquids rich plays. Higher oil and NGL volumes increased revenues $191 million. |
| · | Realized financial hedging gains before tax were $287 million compared to $124 million in 2014. |
| · | Transportation and processing expense decreased $56 million primarily due to the lower U.S./Canadian dollar exchange rate, divestitures and lower production from Deep Panuke, partially offset by higher volumes in Montney. |
| · | Interest expense decreased $146 million primarily due to a one-time outlay of $125 million associated with the early redemption of senior notes assumed in conjunction with the acquisition of Athlon Energy Inc. (“Athlon”) in the fourth quarter of 2014. |
| · | Other expense decreased $38 million primarily due to transaction costs of $31 million associated with the acquisition of Athlon in the fourth quarter of 2014. |
| · | Current tax expense was $4 million compared to $2 million in 2014. Cash Flow excludes cash tax on the sale of assets as discussed in the Non-GAAP measures section of this MD&A. |
Operating Earnings in the fourth quarter of 2015 were $111 million compared to $35 million in 2014 primarily due to the items discussed in the Cash Flow section. Operating Earnings in the fourth quarter of 2015 were also impacted by lower depreciation, depletion and amortization (“DD&A”), lower long-term compensation costs due to the decrease in the Encana share price, higher foreign exchange losses on the revaluation of other monetary assets and liabilities and settlements, and changes in deferred tax.
Net Loss Attributable to Common Shareholders in the fourth quarter of 2015 was $612 million compared to Net Earnings Attributable to Common Shareholders of $198 million in 2014 primarily due to an after-tax non-cash ceiling test impairment and the items discussed in the Cash Flow and Operating Earnings sections. Net Loss in the fourth quarter of 2015 was also impacted by after-tax unrealized hedging losses.
12 Encana Corporation | ANNUAL REPORT 2015
MD&A
PREPARED USING U.S. GAAP IN US$
2015 versus 2014
Cash Flow of $1,430 million decreased $1,504 million in the year ended December 31, 2015 and was impacted by the following significant items:
| · | Average realized natural gas prices, excluding financial hedges, were $2.69 per Mcf compared to $4.78 per Mcf in 2014 reflecting lower benchmark prices. Lower realized natural gas prices decreased revenues $1,198 million. Average realized liquids prices, excluding financial hedges, were $35.80 per bbl compared to $67.24 per bbl in 2014 reflecting lower benchmark prices. Lower realized liquids prices decreased revenues $1,151 million. |
| · | Average natural gas production volumes of 1,635 MMcf/d decreased 715 MMcf/d from 2,350 MMcf/d in 2014 primarily due to divestitures, natural declines in Haynesville and Piceance and lower production from Deep Panuke, partially offset by successful drilling programs in Montney and Duvernay. Lower natural gas volumes decreased revenues $1,305 million. Average oil and NGL production volumes of 133.4 Mbbls/d increased 46.6 Mbbls/d from 86.8 Mbbls/d in 2014 primarily due to acquisitions and successful drilling programs in liquids rich plays, partially offset by divestitures. Higher oil and NGL volumes increased revenues $766 million. |
| · | Realized financial hedging gains before tax were $901 million compared to losses of $91 million in 2014. |
| · | Transportation and processing expense decreased $244 million primarily due to divestitures, the lower U.S./Canadian dollar exchange rate and lower production from Deep Panuke, partially offset by higher volumes in Montney. |
| · | Current tax was a recovery of $34 million compared to an expense of $243 million in 2014 as discussed in the Other Operating Results section of this MD&A. Cash Flow excludes cash tax on the sale of assets as discussed in the Non-GAAP measures section of this MD&A. |
Operating Loss in 2015 was $61 million compared to Operating Earnings of $1,002 million in 2014 primarily due to the items discussed in the Cash Flow section. Operating Loss in 2015 was also impacted by higher foreign exchange losses on settlements and the revaluation of other monetary assets and liabilities, lower DD&A and changes in deferred tax.
Net Loss Attributable to Common Shareholders in 2015 was $5,165 million compared to Net Earnings Attributable to Common Shareholders of $3,392 million in 2014 primarily due to after-tax non-cash ceiling test impairments, a lower after-tax gain on divestitures and the items discussed in the Cash Flow and Operating Earnings sections. Net Loss in 2015 was also impacted by after-tax unrealized hedging losses, a higher after-tax non-operating foreign exchange loss and changes in deferred tax.
ANNUAL REPORT 2015 | Encana Corporation 13
MD&A
PREPARED USING U.S. GAAP IN US$
2014 versus 2013
Cash Flow of $2,934 million increased $353 million in the year ended December 31, 2014 and was impacted by the following significant items:
| · | Average realized natural gas prices, excluding financial hedges, were $4.78 per Mcf compared to $3.57 per Mcf in 2013 reflecting higher benchmark prices, including the impact of higher realized prices from Deep Panuke production. Higher realized natural gas prices increased revenues $1,067 million. Average realized liquids prices, excluding financial hedges, were $67.24 per bbl compared to $67.30 per bbl in 2013 reflecting lower WTI prices. Lower realized liquids prices decreased revenues $23 million. |
| · | Average natural gas production volumes of 2,350 MMcf/d decreased 427 MMcf/d from 2,777 MMcf/d in 2013 primarily due to divestitures resulting from the Company’s strategic transition to a more balanced commodity portfolio and natural declines, partially offset by production from Deep Panuke. Lower natural gas volumes decreased revenues $602 million. Average oil and NGL production volumes of 86.8 Mbbls/d increased 32.9 Mbbls/d from 53.9 Mbbls/d in 2013 primarily due to acquisitions and successful drilling programs in liquids rich plays, partially offset by divestitures and the sale of the Company’s investment in PrairieSky Royalty Ltd. (“PrairieSky”). Higher oil and NGL volumes increased revenues $829 million. |
| · | Realized financial hedging losses before tax were $91 million compared to gains of $544 million in 2013. |
| · | Operating expense decreased $162 million primarily due to lower salaries and benefits related to workforce reductions resulting from the 2013 restructuring, divestitures and the lower U.S./Canadian dollar exchange rate, partially offset by acquisitions. The decrease also reflects lower non-cash long-term compensation costs resulting from the decrease in the Encana share price. |
| · | Administrative expense decreased $112 million primarily due to lower restructuring charges of $52 million and the lower U.S./Canadian dollar exchange rate. The decrease also reflects lower non-cash long-term compensation costs resulting from the decrease in the Encana share price. |
| · | Interest expense increased $91 million primarily due to a one-time outlay associated with the early redemption of senior notes assumed in conjunction with the acquisition of Athlon. |
| · | Other expense increased $70 million primarily due to transaction costs of $40 million associated with the acquisitions of Athlon and Eagle Ford. The increase also reflects non-cash reclamation charges relating to non-producing assets. |
| · | Current tax expense was $243 million compared to a recovery of $191 million in 2013 as discussed in the Other Operating Results section of this MD&A. Cash Flow excludes cash tax on the sale of assets as discussed in the Non-GAAP Measures section of this MD&A. |
Operating Earnings of $1,002 million increased $200 million primarily due to the items discussed in the Cash Flow section. Operating Earnings in 2014 were also impacted by a higher foreign exchange gain on the revaluation of other monetary assets and higher DD&A. Operating Earnings excludes restructuring charges as described in the Non-GAAP Measures section of this MD&A.
Net Earnings Attributable to Common Shareholders of $3,392 million increased $3,156 million primarily due to gains on divestitures as well as the items discussed in the Cash Flow and Operating Earnings sections. Net Earnings Attributable to Common Shareholders in 2014 were also impacted by after-tax unrealized hedging gains, a higher after-tax non-operating foreign exchange loss and changes in deferred tax.
14 Encana Corporation | ANNUAL REPORT 2015
MD&A
PREPARED USING U.S. GAAP IN US$
Prices and Foreign Exchange Rates
| 2015 | 2014 | 2013 | ||||||||||||||||||||||||||||||||||||||||||||||
| (average for the period) |
Annual |
Q4 |
Q3 |
Q2 |
Q1 |
Annual |
Q4 |
Q3 |
Q2 |
Q1 |
Annual | |||||||||||||||||||||||||||||||||||||
| Encana Realized Pricing |
||||||||||||||||||||||||||||||||||||||||||||||||
| Including Hedging |
||||||||||||||||||||||||||||||||||||||||||||||||
| Natural Gas ($/Mcf) |
$ 3.89 | $ | 3.43 | $ | 3.71 | $ | 3.52 | $ | 4.78 | $ 4.59 | $ | 4.16 | $ | 4.03 | $ | 4.08 | $ | 5.82 | $ | 4.09 | ||||||||||||||||||||||||||||
| Oil & NGLs ($/bbl) |
||||||||||||||||||||||||||||||||||||||||||||||||
| Oil |
49.68 | 49.77 | 49.38 | 53.08 | 46.17 | 86.03 | 80.38 | 90.22 | 89.55 | 86.34 | 88.19 | |||||||||||||||||||||||||||||||||||||
| NGLs |
21.66 | 21.36 | 19.57 | 24.28 | 21.92 | 48.09 | 40.87 | 48.76 | 49.39 | 53.79 | 48.95 | |||||||||||||||||||||||||||||||||||||
| Total Oil & NGLs |
39.93 | 39.11 | 39.09 | 43.78 | 37.83 | 69.70 | 66.40 | 73.50 | 69.53 | 69.19 | 67.75 | |||||||||||||||||||||||||||||||||||||
| Total ($/BOE) |
28.81 | 27.19 | 28.17 | 28.53 | 31.24 | 35.21 | 35.55 | 35.06 | 30.75 | 39.22 | 29.05 | |||||||||||||||||||||||||||||||||||||
| Excluding Hedging |
||||||||||||||||||||||||||||||||||||||||||||||||
| Natural Gas ($/Mcf) |
2.69 | 2.13 | 2.60 | 2.37 | 3.53 | 4.78 | 3.94 | 3.88 | 4.46 | 6.37 | 3.57 | |||||||||||||||||||||||||||||||||||||
| Oil & NGLs ($/bbl) |
||||||||||||||||||||||||||||||||||||||||||||||||
| Oil |
43.35 | 37.48 | 42.40 | 53.15 | 40.53 | 81.71 | 66.38 | 90.18 | 92.93 | 86.43 | 87.25 | |||||||||||||||||||||||||||||||||||||
| NGLs |
21.66 | 21.36 | 19.57 | 24.28 | 21.92 | 48.09 | 40.87 | 48.76 | 49.39 | 53.79 | 48.95 | |||||||||||||||||||||||||||||||||||||
| Total Oil & NGLs |
35.80 | 31.43 | 34.52 | 43.83 | 34.13 | 67.24 | 57.35 | 73.48 | 71.23 | 69.23 | 67.30 | |||||||||||||||||||||||||||||||||||||
| Total ($/BOE) |
22.61 | 19.44 | 22.26 | 23.90 | 24.82 | 35.67 | 32.25 | 34.36 | 32.93 | 42.12 | 26.20 | |||||||||||||||||||||||||||||||||||||
| Natural Gas Price Benchmarks |
||||||||||||||||||||||||||||||||||||||||||||||||
| NYMEX ($/MMBtu) |
2.66 | 2.27 | 2.77 | 2.64 | 2.98 | 4.41 | 4.00 | 4.06 | 4.67 | 4.94 | 3.65 | |||||||||||||||||||||||||||||||||||||
| AECO (C$/Mcf) |
2.77 | 2.65 | 2.80 | 2.67 | 2.95 | 4.42 | 4.01 | 4.22 | 4.68 | 4.76 | 3.16 | |||||||||||||||||||||||||||||||||||||
| Algonquin City Gate ($/MMBtu) |
4.74 | 3.05 | 2.37 | 2.24 | 11.41 | 8.06 | 4.99 | 2.97 | 4.23 | 20.28 | 6.97 | |||||||||||||||||||||||||||||||||||||
| Basis Differential ($/MMBtu) |
||||||||||||||||||||||||||||||||||||||||||||||||
| AECO/NYMEX |
0.49 | 0.27 | 0.61 | 0.50 | 0.57 | 0.39 | 0.44 | 0.16 | 0.40 | 0.60 | 0.57 | |||||||||||||||||||||||||||||||||||||
| Oil Price Benchmarks |
||||||||||||||||||||||||||||||||||||||||||||||||
| West Texas Intermediate (WTI) ($/bbl) |
48.80 | 42.18 | 46.43 | 57.94 | 48.64 | 93.00 | 73.15 | 97.17 | 102.99 | 98.68 | 97.97 | |||||||||||||||||||||||||||||||||||||
| Edmonton Light Sweet (C$/bbl) |
57.21 | 52.95 | 56.23 | 67.71 | 51.94 | 94.57 | 75.69 | 97.16 | 105.61 | 99.83 | 93.11 | |||||||||||||||||||||||||||||||||||||
| Foreign Exchange |
||||||||||||||||||||||||||||||||||||||||||||||||
| Average U.S./Canadian Dollar Exchange Rate |
0.782 | 0.749 | 0.764 | 0.813 | 0.806 | 0.905 | 0.881 | 0.918 | 0.917 | 0.906 | 0.971 | |||||||||||||||||||||||||||||||||||||
Encana’s financial results are influenced by fluctuations in commodity prices, price differentials and the U.S./Canadian dollar exchange rate. In 2015, Encana’s average realized natural gas price, excluding hedging, reflected lower benchmark prices compared to 2014. Hedging activities contributed $1.20 per Mcf to Encana’s average realized natural gas price in 2015. The average realized natural gas price for production from Deep Panuke was $8.19 per Mcf in 2015 and increased Encana’s average realized natural gas price $0.22 per Mcf. In 2015, Encana’s average realized oil and NGL prices, excluding hedging, reflected lower benchmark prices compared to 2014. Hedging activities contributed $6.33 per bbl to Encana’s average realized oil price in 2015.
In 2014, Encana’s average realized natural gas price, excluding hedging, reflected higher benchmark prices compared to 2013. Hedging activities reduced Encana’s average realized natural gas price $0.19 per Mcf in 2014. Realized natural gas prices for production from Deep Panuke were $8.34 per Mcf in 2014, which increased Encana’s average realized natural gas price $0.31 per Mcf in 2014. In 2014, Encana’s average realized oil and NGL prices, excluding hedging, reflected generally lower benchmark prices compared to 2013. Hedging activities contributed $4.32 per bbl to Encana’s average realized oil price in 2014.
ANNUAL REPORT 2015 | Encana Corporation 15
MD&A
PREPARED USING U.S. GAAP IN US$
Financial Hedge Agreements
As a means of managing commodity price volatility and its impact on cash flows, Encana enters into various financial hedge agreements. Unsettled derivative financial contracts are recorded at the date of the financial statements based on the fair value of the contracts. Changes in fair value result from volatility in forward commodity prices and changes in the balance of unsettled contracts between periods. The changes in fair value are recognized in revenue as unrealized hedging gains and losses. Realized hedging gains and losses are recognized in revenue when derivative financial contracts are settled.
During 2015, Encana entered into NYMEX and WTI three-way options and NYMEX costless collars. The three-way options are a combination of a sold call, bought put and a sold put. These contracts allow the Company to participate in the upside of commodity prices to the ceiling of the call option and provide the Company with partial downside price protection through the combination of the put options. The NYMEX costless collars are a combination of a sold call and a bought put. These contracts allow Encana to participate in the upside of commodity prices to the ceiling of the call option and provide downside price protection below the floor of the put option.
During 2016, Encana has entered into additional hedging agreements. The tables below summarize Encana’s hedging contracts on expected future production as at December 31, 2015 and expected March to December 2016 production as at February 19, 2016.
Natural Gas
| As at February 19, 2016 | As at December 31, 2015 | |||||||||||||||||||||||||
| Term | Notional Volumes (MMcf/d) |
Average Price ($/Mcf) |
Term | Notional Volumes (MMcf/d) |
Average Price ($/Mcf) |
|||||||||||||||||||||
| NYMEX Fixed Price Contracts |
2016 | 740 | 2.76 | 2016 | 370 | 2.82 | ||||||||||||||||||||
| NYMEX Fixed Price Swaptions (1) |
2017 | 345 | 2.70 | - | - | - | ||||||||||||||||||||
| NYMEX Three-Way Options |
2017 | 255 | 2016 | 25 | ||||||||||||||||||||||
| Sold call price |
3.07 | 3.43 | ||||||||||||||||||||||||
| Bought put price |
2.75 | 3.21 | ||||||||||||||||||||||||
| Sold put price |
2.26 | 2.72 | ||||||||||||||||||||||||
| NYMEX Costless Collars |
2016 | 335 | 2016 | 335 | ||||||||||||||||||||||
| Sold call price |
2.46 | 2.46 | ||||||||||||||||||||||||
| Bought put price |
2.22 | 2.22 | ||||||||||||||||||||||||
|
(1) The NYMEX Fixed Price Swaptions give the counterparty the option to extend 2016 fixed price swaps to December 31, 2017 at the strike price. | ||||||||||||||
|
Crude Oil
| ||||||||||||||
| As at February 19, 2016 | As at December 31, 2015 | |||||||||||||||||||||||||
| Term | Notional Volumes (Mbbls/d) |
Average Price ($/bbl) |
Term | Notional Volumes (Mbbls/d) |
Average Price ($/bbl) |
|||||||||||||||||||||
| WTI Fixed Price Contracts |
2016 | 54.1 | 56.33 | 2016 | 49.0 | 58.51 | ||||||||||||||||||||
| WTI Three-Way Options |
2016 | 14.6 | 2016 | 18.3 | ||||||||||||||||||||||
| Sold call price |
63.01 | 63.03 | ||||||||||||||||||||||||
| Bought put price |
55.00 | 55.00 | ||||||||||||||||||||||||
| Sold put price |
47.14 | 47.24 | ||||||||||||||||||||||||
The Company’s hedging program helps sustain Cash Flow and Operating Netbacks during periods of lower prices. For additional information, see the Risk Management – Financial Risks section of this MD&A.
16 Encana Corporation | ANNUAL REPORT 2015
MD&A
PREPARED USING U.S. GAAP IN US$
Foreign Exchange
As disclosed in the Prices and Foreign Exchange Rates table, the average U.S./Canadian dollar exchange rate decreased 0.123 in 2015 compared to 2014 and 0.066 in 2014 compared to 2013. The table below summarizes selected foreign exchange impacts on Encana’s financial results when compared to the same periods in the prior years.
| 2015 | 2014 | 2013 | ||||||||||||||||||||||||||
|
$ millions |
$/BOE |
$ millions |
$/BOE |
$ millions |
$/BOE |
|||||||||||||||||||||||
| Increase (Decrease) in: |
||||||||||||||||||||||||||||
| Capital Investment |
$ (168) | $ (100) | $ (45) | |||||||||||||||||||||||||
| Transportation and Processing Expense (1) |
(111) | $ (0.75) | (51) | $ (0.29) | (17) | $ (0.09) | ||||||||||||||||||||||
| Operating Expense (1) |
(36) | (0.24) | (12) | (0.07) | (10) | (0.05) | ||||||||||||||||||||||
| Administrative Expense |
(24) | (0.16) | (23) | (0.13) | (12) | (0.06) | ||||||||||||||||||||||
| Depreciation, Depletion and Amortization |
(84) | (0.57) | (41) | (0.23) | (23) | (0.10) | ||||||||||||||||||||||
| (1) | 2014 and 2013 have been updated to reflect the reclassification of property taxes and certain other levied charges from transportation and processing expense and/or operating expense to production, mineral and other taxes. |
Price Sensitivities
Natural gas and liquids prices fluctuate in response to changing market forces, creating varying impacts on Encana’s financial results. The Company’s potential exposure to commodity price fluctuations is summarized in the table below, which shows the estimated effects that certain price changes would have had on the Company’s Cash Flow and Operating Earnings (Loss) for 2015. The price sensitivities below are based on business conditions, transactions and production volumes during 2015. Accordingly, these sensitivities may not be indicative of financial results for other periods, under other economic circumstances or with additional fluctuations in commodity prices.
| Impact On | ||||||||||||||||
|
($ millions, except as indicated) |
Price Change (1) |
Cash Flow |
Operating Earnings (Loss) |
|||||||||||||
| Increase or Decrease in: |
||||||||||||||||
| NYMEX Natural Gas Price |
+/- $0.50/MMBtu | $ 25 | $ 18 | |||||||||||||
| WTI Oil Price |
+/- $10.00/bbl | 30 | 20 | |||||||||||||
(1) Assumes only one variable changes while all other variables, including the Company’s financial hedging positions, are held constant.
ANNUAL REPORT 2015 | Encana Corporation 17
MD&A
PREPARED USING U.S. GAAP IN US$
| Reserves Quantities |
Since its formation in 2002, Encana has retained independent qualified reserves evaluators (“IQREs”) to evaluate and prepare reports on 100 percent of the Company’s natural gas, oil and NGL reserves annually. The Company has a Reserves Committee composed of independent Board of Directors (“Board”) members that reviews the qualifications and appointment of the IQREs. The Reserves Committee also reviews the procedures for providing information to the IQREs. All booked reserves are based upon annual evaluations by the IQREs.
As required by Canadian regulatory standards, Encana’s disclosure of reserves data is in accordance with National Instrument 51-101 Standards of Disclosure for Oil and Gas Activities (“NI 51-101”). Encana’s 2015 Canadian protocol disclosure includes proved reserves quantities before and after royalties employing forecast prices and costs and is available in Encana’s Annual Information Form (“AIF”). Canadian standards require reconciliations in this section to include barrels of oil equivalent. The conversion of natural gas volumes to BOE is on the basis of six Mcf to one bbl based on a generic energy equivalency conversion method primarily applicable at the burner tip. This energy equivalency conversion method does not represent economic value equivalency at the wellhead, as the current price of oil and NGLs compared to natural gas is significantly higher.
Supplementary oil and gas information, including proved reserves on an after royalties basis, is provided in accordance with U.S. disclosure requirements in Note 27 to the December 31, 2015 Consolidated Financial Statements. As Encana follows U.S. GAAP full cost accounting for oil and gas activities, the U.S. protocol reserves estimates are key inputs to the Company’s depletion and ceiling test impairment calculations. Encana’s 2015 U.S. protocol disclosure is also available in the AIF.
The Canadian standards require the use of forecast prices in the estimation of reserves and the disclosure of before and after royalties volumes. The U.S. standards require the use of 12-month average trailing prices in the estimation of reserves and the disclosure of after royalties volumes. The following sections provide Encana’s Canadian protocol and U.S. protocol reserves quantities.
18 Encana Corporation | ANNUAL REPORT 2015
MD&A
PREPARED USING U.S. GAAP IN US$
Canadian Protocol Reserves Quantities
Proved Reserves by Country (1)
(Forecast Prices and Costs; Before Royalties)
| Natural Gas (Bcf) | Oil & NGLs (MMbbls) | |||||||||||||||||||||||||
| (as at December 31) |
2015 |
2014 |
2013 |
2015 |
2014 |
2013 |
||||||||||||||||||||
| Canada |
2,938 | 3,752 | 5,031 | 112.2 | 97.2 | 141.1 | ||||||||||||||||||||
| United States |
1,646 | 2,712 | 4,887 | 366.6 | 357.6 | 136.2 | ||||||||||||||||||||
|
Total |
|
4,584 |
|
|
6,463 |
|
|
9,918 |
|
|
478.8 |
|
|
454.7 |
|
|
277.3 |
| ||||||||
(1) Numbers may not add due to rounding.
Proved Reserves Reconciliation (1)
(Forecast Prices and Costs; Before Royalties)
| Natural Gas (Bcf) | Oil & NGLs (MMbbls) | |||||||||||||||||||||||||||||||
| Canada | United States |
Total | Canada | United States |
Total | Total (MMBOE) |
||||||||||||||||||||||||||
| December 31, 2014 |
3,752 | 2,712 | 6,463 | 97.2 | 357.6 | 454.7 | 1,532.0 | |||||||||||||||||||||||||
| Extensions and improved recovery |
460 | 154 | 614 | 39.9 | 96.4 | 136.2 | 238.5 | |||||||||||||||||||||||||
| Technical revisions |
(157) | 241 | 84 | (4.3) | 31.5 | 27.2 | 41.2 | |||||||||||||||||||||||||
| Economic factors |
(274) | (244) | (518) | (6.8) | (64.4) | (71.2) | (157.5) | |||||||||||||||||||||||||
| Dispositions |
(459) | (923) | (1,382) | (2.0) | (5.7) | (7.7) | (238.1) | |||||||||||||||||||||||||
| Production |
(383) | (295) | (677) | (11.8) | (48.7) | (60.5) | (173.4) | |||||||||||||||||||||||||
|
December 31, 2015 |
|
2,938 |
|
|
1,646 |
|
|
4,584 |
|
|
112.2 |
|
|
366.6 |
|
|
478.8 |
|
|
1,242.8 |
| |||||||||||
(1) Numbers may not add due to rounding.
Encana’s 2015 proved natural gas reserves before royalties of approximately 4.6 Tcf decreased 1.9 Tcf from 2014 primarily due to dispositions of approximately 1.4 Tcf resulting from the Company’s strategic transition to a more balanced commodity portfolio. Extensions and improved recovery of approximately 0.6 Tcf were mostly offset by economic factors of approximately 0.5 Tcf due to a reduction in the forecast prices. Extensions and improved recovery replaced 91 percent of production before royalties during the year.
Encana’s 2015 proved oil and NGL reserves before royalties of approximately 478.8 MMbbls increased 24.1 MMbbls from 2014 primarily due to extensions and improved recovery of approximately 136.2 MMbbls, partially offset by negative economic factors of approximately 71.2 MMbbls due to a reduction in the forecast prices. Extensions and improved recovery replaced 225 percent of production before royalties during the year.
Proved Reserves by Country (1)
(Forecast Prices and Costs; After Royalties)
| Natural Gas (Bcf) | Oil & NGLs (MMbbls) | |||||||||||||||||||||||||
|
(as at December 31) |
2015 |
2014 |
2013 |
2015 |
2014 |
2013 |
||||||||||||||||||||
| Canada |
2,666 | 3,252 | 4,550 | 91.5 | 76.2 | 122.2 | ||||||||||||||||||||
| United States |
1,411 | 2,270 | 4,026 | 288.7 | 280.3 | 112.7 | ||||||||||||||||||||
|
Total |
|
4,076 |
|
|
5,522 |
|
|
8,576 |
|
|
380.1 |
|
|
356.5 |
|
|
234.9 |
| ||||||||
(1) Numbers may not add due to rounding.
ANNUAL REPORT 2015 | Encana Corporation 19
MD&A
PREPARED USING U.S. GAAP IN US$
Proved Reserves Reconciliation (1)
(Forecast Prices and Costs; After Royalties)
| Natural Gas (Bcf) | Oil & NGLs (MMbbls) | |||||||||||||||||||||||||||||||
| Canada | United States |
Total | Canada | United States |
Total | Total (MMBOE) |
||||||||||||||||||||||||||
| December 31, 2014 |
3,252 | 2,270 | 5,522 | 76.2 | 280.3 | 356.5 | 1,276.9 | |||||||||||||||||||||||||
| Extensions and discoveries |
421 | 121 | 542 | 33.1 | 74.8 | 107.9 | 198.2 | |||||||||||||||||||||||||
| Revisions (2) |
(224) | (4) | (228) | (5.8) | (23.3) | (29.1) | (67.1) | |||||||||||||||||||||||||
| Dispositions |
(430) | (734) | (1,164) | (1.7) | (4.8) | (6.5) | (200.5) | |||||||||||||||||||||||||
| Production |
(354) | (241) | (596) | (10.4) | (38.3) | (48.7) | (148.0) | |||||||||||||||||||||||||
|
December 31, 2015 |
|
2,666 |
|
|
1,411 |
|
|
4,076 |
|
|
91.5 |
|
|
288.7 |
|
|
380.1 |
|
|
1,059.5 |
| |||||||||||
(1) Numbers may not add due to rounding.
(2) Includes economic factors.
Encana’s 2015 proved natural gas reserves after royalties of approximately 4.1 Tcf decreased 1.4 Tcf from 2014 primarily due to dispositions of approximately 1.2 Tcf resulting from the Company’s strategic transition to a more balanced commodity portfolio. Negative revisions of approximately 0.2 Tcf were mainly due to negative economic factors of 0.4 Tcf offset by positive technical revisions of 0.2 Tcf. Extensions and discoveries replaced 91 percent of production after royalties during the year.
Encana’s 2015 proved oil and NGL reserves after royalties of approximately 380.1 MMbbls increased 23.6 MMbbls from 2014 primarily due to extensions and discoveries of approximately 107.9 MMbbls. Extensions and discoveries replaced 222 percent of production after royalties during the year.
Forecast Prices
The reference prices below were utilized in the determination of reserves.
| Natural Gas | Oil & NGLs | |||||||||||||||||
| Henry Hub ($/MMBtu) |
AECO (C$/MMBtu) |
WTI ($/bbl) |
Edmonton |
|||||||||||||||
| 2013 Price Assumptions |
||||||||||||||||||
| 2014 |
4.25 | 4.03 | 97.50 | 92.76 | ||||||||||||||
| 2015 - 2023 |
4.50 - 5.97 | 4.26 - 5.66 | 97.50 - 104.57 | 97.37 - 106.93 | ||||||||||||||
| Thereafter |
+2%/yr | +2%/yr | +2%/yr | +2%/yr | ||||||||||||||
| 2014 Price Assumptions |
||||||||||||||||||
| 2015 |
3.31 | 3.31 | 62.50 | 64.71 | ||||||||||||||
| 2016 - 2024 |
3.75 - 5.68 | 3.77 - 5.71 | 75.00 - 104.57 | 80.00 - 112.67 | ||||||||||||||
| Thereafter |
+2%/yr | +2%/yr | +2%/yr | +2%/yr | ||||||||||||||
| 2015 Price Assumptions |
||||||||||||||||||
| 2016 |
2.45 | 2.57 | 44.67 | 55.89 | ||||||||||||||
| 2017 - 2030 |
3.02 - 5.11 | 3.14 - 5.15 | 55.20 - 97.40 | 66.47 - 109.49 | ||||||||||||||
| Thereafter |
+1.8%/yr | +1.8%/yr | +1.8%/yr | +1.8%/yr | ||||||||||||||
20 Encana Corporation | ANNUAL REPORT 2015
MD&A
PREPARED USING U.S. GAAP IN US$
U.S. Protocol Reserves Quantities
Proved Reserves by Country (1)
(12-month average trailing prices; After Royalties)
| Natural Gas (Bcf) | Oil & NGLs (MMbbls) | |||||||||||||||||||||||||
|
(as at December 31) |
2015 |
2014 |
2013 |
2015 |
2014 |
2013 |
||||||||||||||||||||
| Canada |
1,952 | 3,229 | 3,975 | 69.2 | 77.5 | 110.2 | ||||||||||||||||||||
| United States |
1,112 | 2,265 | 3,877 | 219.7 | 284.3 | 110.6 | ||||||||||||||||||||
|
Total |
|
3,064 |
|
|
5,494 |
|
|
7,852 |
|
|
288.8 |
|
|
361.7 |
|
|
220.8 |
| ||||||||
(1) Numbers may not add due to rounding.
Proved Reserves Reconciliation (1)
(12-month average trailing prices; After Royalties)
| Natural Gas (Bcf) | Oil & NGLs (MMbbls) | |||||||||||||||||||||||||||||||
| Canada | United States |
Total | Canada | United States |
Total | Total (MMBOE) |
||||||||||||||||||||||||||
| December 31, 2014 |
3,229 | 2,265 | 5,494 | 77.5 | 284.3 | 361.7 | 1,277.4 | |||||||||||||||||||||||||
| Revisions and improved recovery |
(801) | (342) | (1,144) | (15.8) | (114.7) | (130.5) | (321.1) | |||||||||||||||||||||||||
| Extensions and discoveries |
313 | 159 | 472 | 19.8 | 93.3 | 113.0 | 191.7 | |||||||||||||||||||||||||
| Sale of reserves in place |
(434) | (728) | (1,163) | (1.9) | (4.8) | (6.8) | (200.6) | |||||||||||||||||||||||||
| Production |
(354) | (241) | (596) | (10.4) | (38.3) | (48.7) | (148.0) | |||||||||||||||||||||||||
|
December 31, 2015 |
|
1,952 |
|
|
1,112 |
|
|
3,064 |
|
|
69.2 |
|
|
219.7 |
|
|
288.8 |
|
|
799.4 |
| |||||||||||
(1) Numbers may not add due to rounding.
Encana’s 2015 proved natural gas reserves after royalties of approximately 3.1 Tcf decreased 2.4 Tcf from 2014 primarily due to the sale of reserves in place of approximately 1.2 Tcf resulting from the Company’s strategic transition to a more balanced commodity portfolio and approximately 1.1 Tcf due to a lower 12-month average trailing natural gas price. Extensions and discoveries of approximately 0.5 Tcf replaced 79 percent of production after royalties during the year.
Encana’s 2015 proved oil and NGL reserves after royalties of approximately 288.8 MMbbls decreased 72.9 MMbbls from 2014 primarily due to reductions included in revisions and improved recovery of approximately 112.5 MMbbls due to lower 12-month average trailing oil and NGL prices. Extensions and discoveries of approximately 113.0 MMbbls replaced 232 percent of production after royalties during the year.
12-Month Average Trailing Prices
The reference prices below were utilized in the determination of reserves. The 12-month average trailing prices were calculated as the average of the prices on the first day of each month within the trailing 12-month period.
| Natural Gas | Oil & NGLs | |||||||||||||||||
| Henry Hub ($/MMBtu) |
AECO (C$/MMBtu) |
WTI ($/bbl) |
Edmonton |
|||||||||||||||
| Reserves Pricing (1) |
||||||||||||||||||
| 2013 |
3.67 | 3.14 | 96.94 | 93.44 | ||||||||||||||
| 2014 |
4.34 | 4.63 | 94.99 | 96.40 | ||||||||||||||
| 2015 |
2.58 | 2.69 | 50.28 | 58.82 | ||||||||||||||
(1) All prices were held constant in all future years when estimating reserves.
ANNUAL REPORT 2015 | Encana Corporation 21
MD&A
PREPARED USING U.S. GAAP IN US$
| Net Capital Investment |
| ($ millions) | 2015 | 2014 | 2013 | |||||||||
| Canadian Operations |
$ | 380 | $ | 1,226 | $ | 1,365 | ||||||
| USA Operations |
1,847 | 1,285 | 1,283 | |||||||||
| Market Optimization |
1 | - | 3 | |||||||||
| Corporate & Other |
4 | 15 | 61 | |||||||||
| Capital Investment |
2,232 | 2,526 | 2,712 | |||||||||
| Acquisitions |
70 | 3,016 | 184 | |||||||||
| Divestitures |
(1,908 | ) | (4,345 | ) | (705 | ) | ||||||
| Net Acquisitions & (Divestitures) |
(1,838 | ) | (1,329 | ) | (521 | ) | ||||||
| Net Capital Investment |
$ | 394 | $ | 1,197 | $ | 2,191 | ||||||
|
Capital Investment by Play
|
||||||||||||
| ($ millions) | 2015 | 2014 | 2013 | |||||||||
| Canadian Operations |
||||||||||||
| Montney (1) |
$ | 159 | $ | 781 | $ | 624 | ||||||
| Duvernay |
205 | 328 | 155 | |||||||||
| Other Upstream Operations |
||||||||||||
| Wheatland (2) |
5 | 48 | 193 | |||||||||
| Bighorn |
- | 22 | 304 | |||||||||
| Deep Panuke |
4 | 8 | 46 | |||||||||
| Other and emerging (1) |
7 | 39 | 43 | |||||||||
| Total Canadian Operations |
$ | 380 | $ | 1,226 | $ | 1,365 | ||||||
| USA Operations |
||||||||||||
| Eagle Ford |
$ | 570 | $ | 274 | $ | - | ||||||
| Permian |
916 | 117 | - | |||||||||
| Other Upstream Operations |
||||||||||||
| DJ Basin |
169 | 277 | 181 | |||||||||
| San Juan |
58 | 287 | 166 | |||||||||
| Piceance |
12 | 48 | 266 | |||||||||
| Haynesville |
34 | 51 | 220 | |||||||||
| Jonah |
- | 25 | 58 | |||||||||
| East Texas |
- | 9 | 106 | |||||||||
| Other and emerging |
88 | 197 | 286 | |||||||||
| Total USA Operations |
$ | 1,847 | $ | 1,285 | $ | 1,283 | ||||||
|
Capital Investment – Core Assets (1) |
$ |
1,850 |
|
$ |
1,500 |
|
$ |
779 |
| |||
(1) Montney has been realigned to include certain capital investments which were previously reported in Other and emerging.
(2) Wheatland was previously presented as Clearwater.
Encana’s core assets include Montney, Duvernay, Eagle Ford and Permian and reflect the Company’s focus on accelerating growth from these high return and scalable projects in the current price environment. Prior to 2015, Encana’s growth assets included these core assets as well as the DJ Basin, San Juan and the Tuscaloosa Marine Shale (“TMS”), which is reported within Other and emerging in the USA Operations. As at December 31, 2015, the DJ Basin and San Juan have been realigned to Other Upstream Operations as a result of the Company’s current capital investment strategy.
Capital investment associated with the Clearwater lands transferred to PrairieSky was included in Encana’s Wheatland play until September 25, 2014, after which Encana no longer held an interest in PrairieSky.
22 Encana Corporation | ANNUAL REPORT 2015
MD&A
PREPARED USING U.S. GAAP IN US$
2015
Capital Investment
Capital investment during 2015 was $2,232 million compared to $2,526 million in 2014 which reflected disciplined capital spending focused on the Company’s core assets. During 2015, capital spending in Encana’s core assets totaled $1,850 million, representing approximately 83 percent of 2015 capital investment.
Divestitures
Divestitures in 2015 were $959 million in the Canadian Operations and $896 million in the USA Operations, which primarily included the transactions discussed below, as well as the sale of certain properties that do not complement Encana’s existing portfolio of assets.
The Canadian Operations included approximately C$557 million ($467 million), after closing adjustments, for the sale of the Company’s working interest in certain assets included in Wheatland located in central and southern Alberta which comprised approximately 1.2 million net acres of land that contained over 6,800 producing wells. Encana retained a working interest in approximately 0.8 million net acres in Wheatland. In addition, the Canadian Operations included approximately C$450 million ($355 million), after closing adjustments, in cash consideration net to Encana for the sale of certain natural gas gathering and compression assets in Montney in northeastern British Columbia to VMLP. In conjunction with the sale, VMLP will undertake the expansion of future midstream services and will also provide natural gas gathering and processing in Montney to Encana and the Cutbank Ridge Partnership. Further information regarding VMLP can be found in Note 19 to the Consolidated Financial Statements.
The USA Operations included approximately $769 million, after closing adjustments, for the sale of the Company’s Haynesville natural gas assets, comprising approximately 112,000 net acres of leasehold, plus additional fee mineral lands, located in northern Louisiana, to GeoSouthern.
ANNUAL REPORT 2015 | Encana Corporation 23
MD&A
PREPARED USING U.S. GAAP IN US$
2014
Capital Investment
Capital investment during 2014 was $2,526 million compared to $2,712 million in 2013. The Company’s disciplined capital spending focused on the Company’s growth assets as well as executing drilling programs with joint venture partners.
Acquisitions
Acquisitions in 2014 were $21 million in the Canadian Operations and $2,995 million in the USA Operations, which primarily included land and property purchases with oil and liquids rich production potential.
The USA Operations included approximately $2.9 billion, after closing adjustments, related to the acquisition of certain properties in the Eagle Ford shale formation in south Texas. Further information on the acquisition of Eagle Ford can be found in Note 3 to the Consolidated Financial Statements.
Divestitures
Divestitures in 2014 were $1,847 million in the Canadian Operations and $2,264 million in the USA Operations, which primarily included the sale of land and properties to balance the commodity mix in support of the Company’s business strategy.
The Canadian Operations included approximately $1.7 billion, after closing adjustments, for the sale of the Company’s Bighorn assets in west central Alberta. The USA Operations included approximately $1.6 billion, after closing adjustments, for the sale of the Jonah properties in Wyoming and approximately $495 million, after closing adjustments, for the sale of certain properties in East Texas.
Amounts received from the Company’s divestiture transactions have been deducted from the respective Canadian and U.S. full cost pools, except for divestitures that resulted in a significant alteration between capitalized costs and proved reserves in the respective country cost centre. For divestitures that resulted in a gain or loss and constituted a business, goodwill was allocated to the divestiture. Accordingly, for the year ended December 31, 2014, Encana recognized a gain of approximately $1,014 million, before tax, on the sale of the Company’s Bighorn assets in the Canadian cost centre and allocated goodwill of $257 million. In addition, for the year ended December 31, 2014, Encana recognized a gain of approximately $209 million, before tax, on the sale of the Jonah properties in the U.S. cost centre and allocated goodwill of $68 million.
Other Capital Transactions
The following transactions involved the acquisition or disposition of common shares and, therefore, are excluded from the Net Capital Investment table.
Acquisition of Athlon
On November 13, 2014, Encana completed the acquisition of all of the issued and outstanding shares of common stock of Athlon for $5.93 billion, or $58.50 per share. As part of the acquisition, Encana assumed Athlon’s $1.15 billion senior notes and repaid and terminated Athlon’s credit facility with indebtedness outstanding of $335 million. Athlon’s operations focused on the acquisition and development of oil and gas properties located in the Permian Basin in west Texas. Further information on the acquisition of Athlon can be found in Note 3 to the Consolidated Financial Statements.
Divestiture of Investment in PrairieSky
During the second quarter of 2014, PrairieSky acquired Encana’s royalty business with assets in Clearwater located predominantly in central and southern Alberta. Subsequently, Encana completed the initial public offering of 59.8 million common shares at a price of C$28.00 per common share for aggregate gross proceeds of approximately C$1.67 billion. Encana retained 70.2 million common shares of PrairieSky, representing a 54 percent ownership interest. For the period in which Encana held an ownership interest, the Company
24 Encana Corporation | ANNUAL REPORT 2015
MD&A
PREPARED USING U.S. GAAP IN US$
consolidated the financial position and results of operations of PrairieSky and recognized a noncontrolling interest for the third party ownership.
On September 26, 2014, Encana completed the secondary offering of 70.2 million common shares of PrairieSky at a price of C$36.50 per common share for aggregate gross proceeds of approximately C$2.6 billion. Following the completion of the secondary offering, Encana no longer held an interest in PrairieSky. As the sale of the investment in PrairieSky resulted in a significant alteration between capitalized costs and proved reserves in the Canadian cost centre, Encana recognized a gain on divestiture of approximately $2.1 billion, before tax.
Further information on the PrairieSky transactions can be found in Note 18 to the Consolidated Financial Statements.
2013
Capital Investment
Capital investment during 2013 was $2,712 million and reflected the Company’s disciplined capital spending which focused on investment in Encana’s highest return plays, investments in opportunities where development has demonstrated success and executing drilling programs with joint venture partners.
Acquisitions
Acquisitions in 2013 were $28 million in the Canadian Operations and $156 million in the USA Operations, which primarily included land and property purchases with oil and liquids rich production potential.
Divestitures
Divestitures in 2013 were $685 million in the Canadian Operations and $18 million in the USA Operations. The Canadian Operations included the sale of the Company’s Jean Marie natural gas assets in northeast British Columbia and other assets.
ANNUAL REPORT 2015 | Encana Corporation 25
MD&A
PREPARED USING U.S. GAAP IN US$
| Production Volumes |
| (average daily, after royalties) | 2015 | 2014 | 2013 | |||||||||||||||||||||||
| Natural Gas (MMcf/d) |
1,635 | 2,350 | 2,777 | |||||||||||||||||||||||
| Oil (Mbbls/d) |
87.0 | 49.4 | 25.8 | |||||||||||||||||||||||
| NGLs (Mbbls/d) |
46.4 | 37.4 | 28.1 | |||||||||||||||||||||||
| Total Oil & NGLs (Mbbls/d) |
133.4 | 86.8 | 53.9 | |||||||||||||||||||||||
| Total Production (MBOE/d) |
405.9 | 478.5 | 516.7 | |||||||||||||||||||||||
| Production Mix (%) |
||||||||||||||||||||||||||
| Natural Gas |
67 | 82 | 90 | |||||||||||||||||||||||
| Oil & NGLs |
33 | 18 | 10 | |||||||||||||||||||||||
|
Production Volumes by Play
|
||||||||||||||||||||||||||
| (average daily, after royalties) | Natural Gas (MMcf/d) | Oil & NGLs (Mbbls/d) | ||||||||||||||||||||||||
|
2015 |
2014 |
2013 |
2015 |
2014 |
2013 |
|||||||||||||||||||||
| Canadian Operations |
||||||||||||||||||||||||||
| Montney (1) |
723 | 639 | 639 | 22.5 | 18.9 | 10.5 | ||||||||||||||||||||
| Duvernay |
27 | 11 | 4 | 4.8 | 2.1 | 0.7 | ||||||||||||||||||||
| Other Upstream Operations |
||||||||||||||||||||||||||
| Wheatland (2) |
86 | 292 | 335 | 0.9 | 8.6 | 9.9 | ||||||||||||||||||||
| Bighorn |
1 | 158 | 255 | - | 7.5 | 8.9 | ||||||||||||||||||||
| Deep Panuke |
63 | 190 | 41 | - | - | - | ||||||||||||||||||||
| Other and emerging (1) |
71 | 88 | 158 | 0.2 | 0.1 | 0.4 | ||||||||||||||||||||
| Total Canadian Operations |
971 | 1,378 | 1,432 | 28.4 | 37.2 | 30.4 | ||||||||||||||||||||
| USA Operations |
||||||||||||||||||||||||||
| Eagle Ford |
44 | 19 | - | 42.8 | 19.8 | - | ||||||||||||||||||||
| Permian |
44 | 5 | - | 32.8 | 3.5 | - | ||||||||||||||||||||
| Other Upstream Operations |
||||||||||||||||||||||||||
| DJ Basin |
55 | 43 | 39 | 14.9 | 11.6 | 8.4 | ||||||||||||||||||||
| San Juan |
13 | 8 | 3 | 6.2 | 3.9 | 1.4 | ||||||||||||||||||||
| Piceance |
320 | 402 | 455 | 3.5 | 5.0 | 5.1 | ||||||||||||||||||||
| Haynesville |
173 | 311 | 348 | - | - | - | ||||||||||||||||||||
| Jonah |
- | 100 | 323 | - | 1.8 | 4.7 | ||||||||||||||||||||
| East Texas |
- | 57 | 136 | - | 0.5 | 1.0 | ||||||||||||||||||||
| Other and emerging |
15 | 27 | 41 | 4.8 | 3.5 | 2.9 | ||||||||||||||||||||
| Total USA Operations |
664 | 972 | 1,345 | 105.0 | 49.6 | 23.5 | ||||||||||||||||||||
| Total Production Volumes |
1,635 | 2,350 | 2,777 | 133.4 | 86.8 | 53.9 | ||||||||||||||||||||
| Total Production Volumes – Core Assets (1) |
838 | 674 | 643 | 102.9 | 44.3 | 11.2 | ||||||||||||||||||||
(1) Montney has been realigned to include certain production volumes which were previously reported in Other and emerging.
(2) Wheatland was previously presented as Clearwater.
Encana’s core assets include Montney, Duvernay, Eagle Ford and Permian and reflect the Company’s focus on accelerating growth from these high return and scalable projects in the current price environment. Prior to 2015, Encana’s growth assets included these core assets as well as the DJ Basin, San Juan and the TMS, which is reported within Other and emerging in the USA Operations. As at December 31, 2015, the DJ Basin and San Juan have been realigned to Other Upstream Operations as a result of the Company’s current capital investment strategy.
The production volumes associated with the Clearwater lands transferred to PrairieSky were included in Encana’s Wheatland play until September 25, 2014, after which Encana no longer held an interest in PrairieSky.
26 Encana Corporation | ANNUAL REPORT 2015
MD&A
PREPARED USING U.S. GAAP IN US$
2015 versus 2014
Natural Gas Production Volumes
In 2015, average natural gas production volumes of 1,635 MMcf/d decreased 715 MMcf/d from 2014. The Canadian Operations volumes were lower primarily due to the sale of certain assets included in Wheatland in January 2015, the sale of the Bighorn assets in the third quarter of 2014 and shut-in production at Deep Panuke as a result of the implementation of a seasonal operating strategy in 2015 and a higher water production rate, partially offset by successful drilling programs in Montney and Duvernay. The USA Operations volumes were lower primarily due to natural declines in Haynesville and Piceance and the sales of the Jonah and East Texas properties in the second quarter of 2014.
Oil and NGL Production Volumes
In 2015, average oil and NGL production volumes of 133.4 Mbbls/d increased 46.6 Mbbls/d from 2014. The USA Operations volumes were higher primarily due to the acquisitions of Eagle Ford and the Permian assets in the second and fourth quarters of 2014, respectively, and successful drilling programs in these plays. The Canadian Operations volumes were lower primarily due to the sales of the Bighorn assets and the Company’s investment in PrairieSky in the third quarter of 2014, partially offset by successful drilling programs in Montney and Duvernay.
2014 versus 2013
Natural Gas Production Volumes
In 2014, average natural gas production volumes of 2,350 MMcf/d decreased 427 MMcf/d from 2013. The Canadian Operations volumes were lower in 2014 primarily due to the sale of the Bighorn assets, the sale of the Jean Marie natural gas assets and natural declines, partially offset by higher production volumes from Deep Panuke and a successful drilling program in Montney. The USA Operations volumes were lower in 2014 primarily due to the sale of the Jonah and East Texas properties and natural declines mainly in Piceance and Haynesville.
Oil and NGL Production Volumes
In 2014, average oil and NGL production volumes of 86.8 Mbbls/d increased 32.9 Mbbls/d from 2013. The Canadian Operations volumes were higher in 2014 primarily due to successful drilling programs, mainly in Montney, partially offset by the sale of the Bighorn assets. The Canadian Operations volumes were also impacted by the sale of the Company’s investment in PrairieSky, partially offset by higher royalty volumes in Clearwater associated with the lands transferred to PrairieSky. The USA Operations volumes were higher in 2014 primarily due to the acquisition of Eagle Ford and the Permian assets and successful drilling programs in the DJ Basin and San Juan, partially offset by the sale of the Jonah properties.
ANNUAL REPORT 2015 | Encana Corporation 27
MD&A
PREPARED USING U.S. GAAP IN US$
| Results of Operations |
Canadian Operations
Operating Cash Flow (1)
| Natural Gas | Oil & NGLs | Total (2) | ||||||||||||||||||||||||||||||||||||||
| ($ millions) | 2015 | 2014 | 2013 | 2015 | 2014 | 2013 | 2015 | 2014 | 2013 | |||||||||||||||||||||||||||||||
| Revenues, Net of Royalties, excluding Hedging |
$ | 976 | $ | 2,468 | $ | 1,771 | $ | 333 | $ | 872 | $ | 722 | $ | 1,327 | $ | 3,366 | $ | 2,548 | ||||||||||||||||||||||
| Realized Financial Hedging Gain (Loss) |
479 | (74 | ) | 271 | 16 | 18 | 5 | 495 | (56 | ) | 276 | |||||||||||||||||||||||||||||
| Revenues, Net of Royalties |
1,455 | 2,394 | 2,042 | 349 | 890 | 727 | 1,822 | 3,310 | 2,824 | |||||||||||||||||||||||||||||||
| Expenses |
||||||||||||||||||||||||||||||||||||||||
| Production, mineral and other taxes |
26 | 53 | 48 | 2 | 11 | 12 | 28 | 64 | 60 | |||||||||||||||||||||||||||||||
| Transportation and processing |
605 | 764 | 715 | 49 | 62 | 32 | 654 | 826 | 747 | |||||||||||||||||||||||||||||||
| Operating |
135 | 240 | 287 | 15 | 27 | 38 | 152 | 274 | 336 | |||||||||||||||||||||||||||||||
| Operating Cash Flow |
$ | 689 | $ | 1,337 | $ | 992 | $ | 283 | $ | 790 | $ | 645 | $ | 988 | $ | 2,146 | $ | 1,681 | ||||||||||||||||||||||
|
Production Volumes
|
| |||||||||||||||||||||||||||||||||||||||
| Natural Gas (MMcf/d) |
Oil & NGLs (Mbbls/d) |
Total (MBOE/d) |
||||||||||||||||||||||||||||||||||||||
| 2015 | 2014 | 2013 | 2015 | 2014 | 2013 | 2015 | 2014 | 2013 | ||||||||||||||||||||||||||||||||
| Production Volumes – After Royalties |
971 | 1,378 | 1,432 | 28.4 | 37.2 | 30.4 | 190.2 | 266.9 | 269.0 | |||||||||||||||||||||||||||||||
|
Operating Netback (1), (3)
|
| |||||||||||||||||||||||||||||||||||||||
| Natural Gas ($/Mcf) |
Oil & NGLs ($/bbl) |
Total ($/BOE) |
||||||||||||||||||||||||||||||||||||||
| 2015 | 2014 | 2013 | 2015 | 2014 | 2013 | 2015 | 2014 | 2013 | ||||||||||||||||||||||||||||||||
| Revenues, Net of Royalties, excluding Hedging |
$ | 2.75 | $ | 4.89 | $ | 3.35 | $ | 32.10 | $ | 64.16 | $ | 65.06 | $ | 18.84 | $ | 34.21 | $ | 25.13 | ||||||||||||||||||||||
| Realized Financial Hedging Gain (Loss) |
1.35 | (0.15 | ) | 0.51 | 1.56 | 1.36 | 0.46 | 7.13 | (0.57 | ) | 2.78 | |||||||||||||||||||||||||||||
| Revenues, Net of Royalties |
4.10 | 4.74 | 3.86 | 33.66 | 65.52 | 65.52 | 25.97 | 33.64 | 27.91 | |||||||||||||||||||||||||||||||
| Expenses |
||||||||||||||||||||||||||||||||||||||||
| Production, mineral and other taxes |
0.07 | 0.11 | 0.09 | 0.18 | 0.85 | 1.05 | 0.41 | 0.66 | 0.61 | |||||||||||||||||||||||||||||||
| Transportation and processing |
1.71 | 1.50 | 1.36 | 4.71 | 4.49 | 2.88 | 9.42 | 8.45 | 7.52 | |||||||||||||||||||||||||||||||
| Operating |
0.38 | 0.48 | 0.54 | 1.48 | 1.98 | 3.48 | 2.17 | 2.73 | 3.29 | |||||||||||||||||||||||||||||||
| Operating Netback |
$ | 1.94 | $ | 2.65 | $ | 1.87 | $ | 27.29 | $ | 58.20 | $ | 58.11 | $ | 13.97 | $ | 21.80 | $ | 16.49 | ||||||||||||||||||||||
| (1) | Updated to reflect the reclassification of property taxes and certain other levied charges as discussed below. |
| (2) | Also includes other revenues and expenses, such as third party processing, with no associated volumes. |
| (3) | A Non-GAAP measure as defined in the Non-GAAP Measures section of this MD&A. |
Comparative figures for 2014 and 2013 above have been updated to present property taxes and certain other levied charges within production, mineral and other taxes. Formerly, these costs were presented in either transportation and processing expense or operating expense. As a result, for 2014, the Canadian Operations has reclassified $9 million from transportation and processing expense and $40 million from operating expense to production, mineral and other taxes. For 2013, the Canadian Operations has reclassified $9 million from transportation and processing expense and $36 million from operating expense to production, mineral and other taxes. There were no changes to the reported totals for Operating Cash Flow or Operating Netback.
28 Encana Corporation | ANNUAL REPORT 2015
MD&A
PREPARED USING U.S. GAAP IN US$
2015 versus 2014
Operating Cash Flow of $988 million decreased $1,158 million and was impacted by the following significant items:
| · | Lower natural gas prices reflected lower benchmark prices, which decreased revenues $759 million. The average realized natural gas price for production from Deep Panuke was $8.19 per Mcf compared to $8.34 per Mcf in 2014 and increased the average realized natural gas price $0.37 per Mcf compared to $0.54 per Mcf in 2014. Lower liquids prices reflected lower benchmark prices, which decreased revenues $332 million. |
| · | Average natural gas production volumes of 971 MMcf/d were lower by 407 MMcf/d, which decreased revenues $733 million. Average oil and NGL production volumes of 28.4 Mbbls/d were lower by 8.8 Mbbls/d, which decreased revenues $207 million. Changes in production volumes are discussed in the Production Volumes section of this MD&A. |
| · | Realized financial hedging gains were $495 million compared to losses of $56 million in 2014. |
| · | Transportation and processing expense decreased $172 million primarily due to the sale of the Bighorn assets in the third quarter of 2014, the lower U.S./Canadian dollar exchange rate, the sale of certain assets included in Wheatland in January 2015, and shut-in production at Deep Panuke as a result of the implementation of a seasonal operating strategy in 2015 and a higher water production rate, partially offset by higher volumes in Montney. |
| · | Operating expense decreased $122 million primarily due to the sale of certain assets included in Wheatland in January 2015, the lower U.S./Canadian dollar exchange rate, the sale of the Bighorn assets in the third quarter of 2014 and lower long-term compensation costs due to the decrease in the Encana share price. |
2014 versus 2013
Operating Cash Flow of $2,146 million increased $465 million and was impacted by the following significant items:
| · | Higher natural gas prices reflected higher benchmark prices. Realized natural gas prices for production from Deep Panuke were $8.34 per Mcf which increased the average realized natural gas price $0.54 per Mcf. Higher realized natural gas prices for production, including Deep Panuke, increased revenues $780 million. Lower liquids prices decreased revenues $13 million. |
| · | Average natural gas production volumes of 1,378 MMcf/d were lower by 54 MMcf/d, which decreased revenues $83 million. Average oil and NGL production volumes of 37.2 Mbbls/d were higher by 6.8 Mbbls/d, which increased revenues $163 million. Changes in production volumes are discussed in the Production Volumes section of this MD&A. |
| · | Realized financial hedging losses were $56 million compared to gains of $276 million in 2013. |
| · | Transportation and processing expense increased $79 million primarily due to costs related to Deep Panuke production and higher liquids volumes processed, partially offset by the lower U.S./Canadian dollar exchange rate and the sale of the Bighorn assets. The Deep Panuke offshore natural gas facility commenced commercial operations in December 2013. |
| · | Operating expense decreased $62 million primarily due to lower salaries and benefits related to workforce reductions as a result of the 2013 restructuring, the lower U.S./Canadian dollar exchange rate, the sale of the Bighorn assets, the sale of the Jean Marie natural gas assets in the second quarter of 2013 and lower long-term compensation costs due to the decrease in the Encana share price. |
ANNUAL REPORT 2015 | Encana Corporation 29
MD&A
PREPARED USING U.S. GAAP IN US$
Other Expenses
| ($ millions, except as indicated) | 2015 | 2014 | 2013 | |||||||||
| Depreciation, depletion & amortization | $ | 305 | $ | 625 | $ | 601 | ||||||
| Depletion rate ($/BOE) | 4.39 | 6.40 | 6.06 | |||||||||
DD&A decreased in 2015 compared to 2014 primarily due to lower production volumes, a lower depletion rate and the lower U.S./Canadian dollar exchange rate. The depletion rate was impacted by the sales of the Bighorn assets and the Company’s investment in PrairieSky in the third quarter of 2014 and the lower U.S./Canadian dollar exchange rate.
DD&A increased in 2014 compared to 2013 primarily due to a higher depletion rate, partially offset by the lower U.S./Canadian dollar exchange rate. The depletion rate was impacted by the sale of the Bighorn assets, the sale of the Company’s investment in PrairieSky, a decline in proved reserves due to Encana’s change in development plans as the Company strategically transitioned to a more balanced commodity portfolio and the lower U.S./Canadian dollar exchange rate.
30 Encana Corporation | ANNUAL REPORT 2015
MD&A
PREPARED USING U.S. GAAP IN US$
USA Operations
Operating Cash Flow (1)
| Natural Gas | Oil & NGLs | Total (2) | ||||||||||||||||||||||||||||||||||||||
| ($ millions) | 2015 | 2014 | 2013 | 2015 | 2014 | 2013 | 2015 | 2014 | 2013 | |||||||||||||||||||||||||||||||
| Revenues, Net of Royalties, excluding Hedging |
$ | 629 | $ | 1,640 | $ | 1,872 | $ | 1,412 | $ | 1,258 | $ | 602 | $ | 2,066 | $ | 2,927 | $ | 2,499 | ||||||||||||||||||||||
| Realized Financial Hedging Gain (Loss) |
239 | (85 | ) | 260 | 185 | 60 | 4 | 425 | (25 | ) | 264 | |||||||||||||||||||||||||||||
| Revenues, Net of Royalties |
868 | 1,555 | 2,132 | 1,597 | 1,318 | 606 | 2,491 | 2,902 | 2,763 | |||||||||||||||||||||||||||||||
| Expenses |
||||||||||||||||||||||||||||||||||||||||
| Production, mineral and other taxes |
27 | 57 | 72 | 89 | 89 | 41 | 116 | 146 | 113 | |||||||||||||||||||||||||||||||
| Transportation and processing |
566 | 651 | 722 | 14 | 7 | - | 580 | 658 | 722 | |||||||||||||||||||||||||||||||
| Operating |
158 | 222 | 344 | 357 | 100 | 60 | 519 | 326 | 417 | |||||||||||||||||||||||||||||||
| Operating Cash Flow |
$ | 117 | $ | 625 | $ | 994 | $ | 1,137 | $ | 1,122 | $ | 505 | $ | 1,276 | $ | 1,772 | $ | 1,511 | ||||||||||||||||||||||
|
Production Volumes
|
| |||||||||||||||||||||||||||||||||||||||
| Natural Gas (MMcf/d) |
Oil & NGLs (Mbbls/d) |
Total (MBOE/d) |
||||||||||||||||||||||||||||||||||||||
| 2015 | 2014 | 2013 | 2015 | 2014 | 2013 | 2015 | 2014 | 2013 | ||||||||||||||||||||||||||||||||
| Production Volumes – After Royalties |
664 | 972 | 1,345 | 105.0 | 49.6 | 23.5 | 215.7 | 211.6 | 247.7 | |||||||||||||||||||||||||||||||
|
Operating Netback (1), (3)
|
| |||||||||||||||||||||||||||||||||||||||
| Natural Gas ($/Mcf) |
Oil & NGLs ($/bbl) |
Total ($/BOE) |
||||||||||||||||||||||||||||||||||||||
| 2015 | 2014 | 2013 | 2015 | 2014 | 2013 | 2015 | 2014 | 2013 | ||||||||||||||||||||||||||||||||
| Revenues, Net of Royalties, excluding Hedging |
$ | 2.60 | $ | 4.62 | $ | 3.81 | $ | 36.80 | $ | 69.54 | $ | 70.18 | $ | 25.93 | $ | 37.53 | $ | 27.37 | ||||||||||||||||||||||
| Realized Financial Hedging Gain (Loss) |
0.99 | (0.24 | ) | 0.53 | 4.83 | 3.29 | 0.44 | 5.39 | (0.33 | ) | 2.93 | |||||||||||||||||||||||||||||
| Revenues, Net of Royalties |
3.59 | 4.38 | 4.34 | 41.63 | 72.83 | 70.62 | 31.32 | 37.20 | 30.30 | |||||||||||||||||||||||||||||||
| Expenses |
||||||||||||||||||||||||||||||||||||||||
| Production, mineral and other taxes |
0.11 | 0.16 | 0.15 | 2.30 | 4.93 | 4.71 | 1.47 | 1.89 | 1.25 | |||||||||||||||||||||||||||||||
| Transportation and processing |
2.34 | 1.82 | 1.47 | 0.35 | 0.39 | - | 7.37 | 8.51 | 7.98 | |||||||||||||||||||||||||||||||
| Operating |
0.65 | 0.63 | 0.70 | 9.33 | 5.53 | 7.10 | 6.55 | 4.18 | 4.48 | |||||||||||||||||||||||||||||||
| Operating Netback |
$ | 0.49 | $ | 1.77 | $ | 2.02 | $ | 29.65 | $ | 61.98 | $ | 58.81 | $ | 15.93 | $ | 22.62 | $ | 16.59 | ||||||||||||||||||||||
| (1) | Updated to reflect the reclassification of property taxes and certain other levied charges as discussed below. |
| (2) | Also includes other revenues and expenses, such as third party processing, with no associated volumes. |
| (3) | A Non-GAAP measure as defined in the Non-GAAP Measures section of this MD&A. |
Comparative figures for 2014 and 2013 above have been updated to present property taxes and certain other levied charges within production, mineral and other taxes. Formerly, these costs were presented in either transportation and processing expense or operating expense. As a result, for 2014, the USA Operations has reclassified $28 million from operating expense to production, mineral and other taxes. For 2013, the USA Operations has reclassified $6 million from operating expense to production, mineral and other taxes. There were no changes to the reported totals for Operating Cash Flow or Operating Netback.
ANNUAL REPORT 2015 | Encana Corporation 31
MD&A
PREPARED USING U.S. GAAP IN US$
2015 versus 2014
Operating Cash Flow of $1,276 million decreased $496 million and was impacted by the following significant items:
| · | Lower natural gas prices reflected lower benchmark prices, which decreased revenues $439 million. Lower liquids prices reflected lower benchmark prices, which decreased revenues $819 million. |
| · | Average natural gas production volumes of 664 MMcf/d were lower by 308 MMcf/d, which decreased revenues $572 million. Average oil and NGL production volumes of 105.0 Mbbls/d were higher by 55.4 Mbbls/d, which increased revenues $973 million. Changes in production volumes are discussed in the Production Volumes section of this MD&A. |
| · | Realized financial hedging gains were $425 million compared to losses of $25 million in 2014. |
| · | Transportation and processing expense decreased $78 million primarily due to divestitures, which includes the sales of the Jonah and East Texas properties in the second quarter of 2014, partially offset by the acquisitions of Eagle Ford and the Permian assets in the second and fourth quarters of 2014, respectively. |
| · | Operating expense increased $193 million primarily due to the acquisitions of Eagle Ford and the Permian assets in the second and fourth quarters of 2014, respectively, and successful drilling programs in these plays during 2015, partially offset by the sales of the Jonah and East Texas properties in the second quarter of 2014. |
2014 versus 2013
Operating Cash Flow of $1,772 million increased $261 million and was impacted by the following significant items:
| · | Higher natural gas prices reflected higher benchmark prices, which increased revenues $287 million. Lower liquids prices decreased revenues $10 million. |
| · | Average natural gas production volumes of 972 MMcf/d were lower by 373 MMcf/d, which decreased revenues $519 million. Average oil and NGL production volumes of 49.6 Mbbls/d were higher by 26.1 Mbbls/d, which increased revenues $666 million. Changes in production volumes are discussed in the Production Volumes section of this MD&A. |
| · | Realized financial hedging losses were $25 million compared to gains of $264 million in 2013. |
| · | Transportation and processing expense decreased $64 million primarily due to the sale of the Jonah and East Texas properties. |
| · | Operating expense decreased $91 million primarily due to lower salaries and benefits related to workforce reductions as a result of the 2013 restructuring, the sale of the Jonah properties and lower long-term compensation costs due to the decrease in the Encana share price, partially offset by the acquisition of Eagle Ford and the Permian assets. |
32 Encana Corporation | ANNUAL REPORT 2015
MD&A
PREPARED USING U.S. GAAP IN US$
Other Expenses
| ($ millions, except as indicated) | 2015 | 2014 | 2013 | |||||||||
| Depreciation, depletion & amortization | $ | 1,088 | $ | 992 | $ | 818 | ||||||
| Depletion rate ($/BOE) | 13.66 | 12.85 | 9.05 | |||||||||
| Impairments | 6,473 | - | - | |||||||||
DD&A increased in 2015 compared to 2014 primarily due to a higher depletion rate and higher production volumes. The depletion rate was higher primarily due to the acquisitions of Eagle Ford and the Permian assets in the second and fourth quarters of 2014, respectively, partially offset by the impact of ceiling test impairments recognized in the first nine months of 2015 and the sales of the Haynesville natural gas assets and Jonah properties in the fourth quarter of 2015 and second quarter of 2014, respectively.
DD&A increased in 2014 compared to 2013 due to a higher depletion rate, partially offset by lower production volumes. The higher depletion rate in 2014 resulted primarily from the acquisition of Eagle Ford and the Permian assets, the sale of the Jonah properties and a decline in proved reserves due to Encana’s change in development plans as the Company strategically transitioned to a more balanced commodity portfolio.
In 2015, the USA Operations recognized before-tax non-cash ceiling test impairments of $6,473 million. The impairments primarily resulted from the decline in the 12-month average trailing prices, which reduced the USA Operations proved reserves volumes and values as calculated under SEC requirements.
ANNUAL REPORT 2015 | Encana Corporation 33
MD&A
PREPARED USING U.S. GAAP IN US$
Market Optimization
| ($ millions) | 2015 | 2014 | 2013 | |||||||||
| Revenues |
$ | 365 | $ | 1,248 | $ | 512 | ||||||
| Expenses |
||||||||||||
| Transportation and processing |
12 | - | - | |||||||||
| Operating |
33 | 39 | 38 | |||||||||
| Purchased product |
323 | 1,191 | 441 | |||||||||
| Depreciation, depletion and amortization |
- | 4 | 12 | |||||||||
| $ | (3) | $ | 14 | $ | 21 | |||||||
Market Optimization revenues and purchased product expense relate to activities that provide operational flexibility and cost mitigation for transportation commitments, product type, delivery points and customer diversification. Revenues and purchased product expense decreased in 2015 compared to 2014 primarily due to lower commodity prices and lower third-party volumes resulting from transitional services related to the Company’s divestiture activity. Transportation and processing in 2015 relates to downstream transportation contracts and commitments as a result of the Company’s property divestitures. Revenues and purchased product expense increased in 2014 compared to 2013 primarily due to generally higher commodity prices, and higher third party purchases and sales of product resulting from transitional services related to the Company’s divestiture activity.
Corporate and Other
| ($ millions) | 2015 | 2014 | 2013 | |||||||||
| Revenues |
$ | (256) | $ | 559 | $ | (241) | ||||||
| Expenses |
||||||||||||
| Transportation and processing |
6 | 12 | (2) | |||||||||
| Operating |
19 | 28 | 38 | |||||||||
| Depreciation, depletion and amortization |
95 | 124 | 134 | |||||||||
| Impairments |
- | - | 21 | |||||||||
| $ | (376) | $ | 395 | $ | (432) | |||||||
Revenues mainly includes unrealized hedging gains or losses recorded on derivative financial contracts which result from the volatility in forward curves of commodity prices and changes in the balance of unsettled contracts between periods. Transportation and processing expense reflects unrealized financial hedging gains or losses related to the Company’s power financial derivative contracts. DD&A includes amortization of corporate assets, such as computer equipment, office buildings, furniture and leasehold improvements. Impairments relates to certain corporate assets.
Corporate and Other results include revenues and operating expenses related to the sublease of office space in The Bow office building. Further information on The Bow office sublease can be found in Note 14 to the Consolidated Financial Statements.
34 Encana Corporation | ANNUAL REPORT 2015
MD&A
PREPARED USING U.S. GAAP IN US$
| Other Operating Results |
Expenses
| ($ millions) | 2015 | 2014 | 2013 | |||||||||
| Accretion of asset retirement obligation |
$ | 45 | $ | 52 | $ | 53 | ||||||
| Administrative |
275 | 327 | 439 | |||||||||
| Interest |
614 | 654 | 563 | |||||||||
| Foreign exchange (gain) loss, net |
1,082 | 403 | 325 | |||||||||
| (Gain) loss on divestitures |
(14) | (3,426) | (7) | |||||||||
| Other |
27 | 71 | 1 | |||||||||
| $ | 2,029 | $ | (1,919) | $ | 1,374 | |||||||
Administrative expense in 2015 decreased from 2014 primarily due to the lower U.S./Canadian dollar exchange rate, lower salaries and benefits as a result of lower headcount and lower long-term compensation costs due to the decrease in the Encana share price, partially offset by higher restructuring costs. During the second quarter of 2015, Encana revised its plans to align the organizational structure in continued support of the Company’s strategy, which resulted in restructuring costs of $62 million in 2015. Restructuring costs attributable to work force reductions associated with the 2013 restructuring were $2 million in 2015. Administrative expense in 2014 decreased from 2013 primarily due to lower restructuring costs, lower long-term compensation costs and the lower U.S./Canadian dollar exchange rate. Restructuring costs incurred in 2014 were approximately $36 million compared to $88 million in 2013.
Interest expense in 2015 decreased from 2014 primarily due to lower interest on debt following the April 2015 early debt redemptions. Interest expense was also impacted by a one-time interest payment of approximately $165 million associated with the April 2015 redemptions compared to a $125 million one-time outlay in 2014 associated with the early redemption of senior notes assumed in conjunction with the acquisition of Athlon. Interest expense in 2014 increased from 2013 primarily due to the one-time outlay of approximately $125 million associated with the redemption of the Athlon senior notes and higher interest related to the Deep Panuke Production Field Centre (“PFC”), partially offset by lower interest on debt resulting from the long-term debt repayment and redemption in the first six months of 2014.
Foreign exchange gains and losses result from the impact of the fluctuations in the Canadian to U.S. dollar exchange rate. In 2015 compared to 2014, Encana recorded higher foreign exchange losses on settlements and on the translation of U.S. dollar long-term debt issued from Canada. In 2014 compared to 2013, Encana recorded higher foreign exchange losses on the translation of U.S. dollar long-term debt issued from Canada.
Gain on divestitures in 2015 primarily includes a before tax gain on the sale of the Encana Place office building in Calgary. Gain on divestitures in 2014 primarily includes the before tax impact of the sales of Encana’s investment in PrairieSky, the Bighorn assets and the Jonah properties, as discussed in the Net Capital Investment section of this MD&A.
Other in 2015 decreased from 2014 due to transaction costs associated with the acquisitions of Athlon and Eagle Ford incurred in 2014. Other in 2014 increased from 2013 due to acquisition transaction costs as well as reclamation charges relating to non-producing assets.
ANNUAL REPORT 2015 | Encana Corporation 35
MD&A
PREPARED USING U.S. GAAP IN US$
Income Tax
| ($ millions) | 2015 | 2014 | 2013 | |||||||||
| Current Income Tax (Recovery) |
$ | (34) | $ | 243 | $ | (191) | ||||||
| Deferred Income Tax (Recovery) |
(2,811) | 960 | (57) | |||||||||
|
Income Tax Expense (Recovery) |
$ | (2,845) | $ | 1,203 | $ | (248) | ||||||
The current income tax recovery of $34 million in 2015 was primarily due to amounts in respect of prior periods. The current income tax expense in 2014 was primarily due to taxes incurred on divestitures. The current income tax recovery in 2013 was primarily due to amounts in respect of prior periods.
Total income tax recovery of $2,845 million in 2015 was primarily due to lower net earnings before tax, mainly resulting from non-cash ceiling test impairments. Total income tax was an expense in 2014 due to higher net earnings before tax primarily from gains on divestitures and unrealized hedging gains. Total income tax was a recovery in 2013 primarily due to amounts in respect of prior periods. The net earnings variances are discussed in the Financial Results section of this MD&A.
Encana’s annual effective tax rate is impacted by earnings, statutory rate and other foreign differences, the effect of legislative changes, non-taxable capital gains and losses, tax differences on divestitures and transactions, and partnership tax allocations in excess of funding.
Tax interpretations, regulations and legislation in the various jurisdictions in which the Company and its Subsidiaries operate are subject to change. As a result, there are tax matters under review. The Company believes that the provision for taxes is adequate.
36 Encana Corporation | ANNUAL REPORT 2015
MD&A
PREPARED USING U.S. GAAP IN US$
| Liquidity and Capital Resources |
| ($ millions) | 2015 | 2014 | 2013 | |||||||||
| Net Cash From (Used In) |
||||||||||||
| Operating activities |
$ | 1,681 | $ | 2,667 | $ | 2,289 | ||||||
| Investing activities |
(665) | (4,729) | (1,895) | |||||||||
| Financing activities |
(1,054) | (39) | (909) | |||||||||
| Foreign exchange gain (loss) on cash and cash |
(29) | (127) | (98) | |||||||||
| Increase (Decrease) in Cash and Cash Equivalents |
$ | (67) | $ | (2,228) | $ | (613) | ||||||
| Cash and Cash Equivalents, End of Year |
$ | 271 | $ | 338 | $ | 2,566 | ||||||
Operating Activities
Net cash from operating activities in 2015 of $1,681 million decreased $986 million from 2014. Net cash from operating activities in 2014 of $2,667 million increased $378 million from 2013. These changes are primarily a result of the Cash Flow variances discussed in the Financial Results section of this MD&A. In 2015, the net change in non-cash working capital was a surplus of $262 million compared to a deficit of $9 million in 2014 and a deficit of $179 million in 2013.
The Company had a working capital surplus of $274 million at December 31, 2015 compared to $583 million at December 31, 2014. The decrease in working capital is primarily due to a decrease in accounts receivable and accrued revenues, risk management assets and income tax receivable, partially offset by a decrease in accounts payable and accrued liabilities. At December 31, 2015, working capital included cash and cash equivalents of $271 million compared to $338 million at December 31, 2014. Encana expects it will continue to meet the payment terms of its suppliers.
Investing Activities
Net cash used in investing activities in 2015 was $665 million compared to $4,729 million in 2014. The change was primarily due to the acquisitions of Athlon and Eagle Ford in 2014, partially offset by lower proceeds from divestitures and the sale of the Company’s investment in PrairieSky in 2014. Net cash used in investing activities in 2014 was $4,729 million compared to $1,895 million in 2013. The increase was primarily due to the acquisitions of Athlon and Eagle Ford, partially offset by proceeds from the Bighorn, Jonah and East Texas divestitures and proceeds from the sale of the Company’s investment in PrairieSky. Further information on acquisitions and divestitures can be found in the Net Capital Investment section of this MD&A.
ANNUAL REPORT 2015 | Encana Corporation 37
MD&A
PREPARED USING U.S. GAAP IN US$
Financing Activities
Net cash used in financing activities in 2015 was $1,054 million compared to $39 million in 2014. The change was primarily due to a net repayment of revolving long-term debt of $627 million in 2015 compared with a net issuance in 2014 of $942 million, and the sale of a noncontrolling interest in PrairieSky in the second quarter of 2014 for proceeds of $1,462 million, partially offset by proceeds of $1,088 million from the issuance of common shares pursuant to the Share Offering in the first quarter of 2015 and lower long-term debt repayments in 2015 of $850 million. Net cash used in financing activities in 2014 was $39 million compared to $909 million in 2013. The decrease primarily resulted from the sale of a noncontrolling interest in PrairieSky and the net issuance of revolving long-term debt, partially offset by the repayment of long-term debt.
Credit Facilities
The following table outlines the Company’s committed revolving bank credit facilities at December 31, 2015:
| ($ billions) | Capacity | Unused | Maturity Date | |||||||||
| Committed Revolving Bank Credit Facilities |
||||||||||||
| Encana Credit Facility (1) |
3.0 | 2.4 | July 2020 | |||||||||
| U.S. Subsidiary Credit Facility |
1.5 | 1.5 | July 2020 | |||||||||
| (1) | At December 31, 2015, $440 million fully supported the U.S. Commercial Paper program and $210 million of LIBOR loans were drawn, as discussed in the Long-Term Debt section below. |
Encana is currently in compliance with, and expects that it will continue to be in compliance with, all financial covenants under its credit facility agreements. Management monitors Debt to Adjusted Capitalization as a proxy for Encana’s financial covenant under its credit facility agreements, which requires debt to adjusted capitalization to be less than 60 percent. The definitions used in the covenant under the credit facilities adjust capitalization for cumulative historical ceiling test impairments that were recorded as at December 31, 2011 in conjunction with the Company’s January 1, 2012 adoption of U.S. GAAP. Debt to Adjusted Capitalization was 28 percent at December 31, 2015 and 30 percent at December 31, 2014.
Management believes that the downgrade in Encana’s credit rating by Moody’s Investors Service on February 18, 2016, along with recently confirmed investment grade credit ratings by Standard & Poor’s Ratings Services and DBRS Limited, will have limited implications for the Company’s ability to fund its operations, development activities and capital program. The split ratings eliminates the Company’s access to its U.S. Commercial Paper (“U.S. CP”) program; however, the Company continues to have full access to its $4.5 billion committed revolving bank credit facilities of which $3.9 billion remained unused at December 31, 2015. The facilities remain committed through July 2020. The cost of short-term borrowing on the Company’s credit facilities will increase modestly as a result of the split ratings. For further information on credit ratings, refer to the Company’s AIF.
Long-Term Debt
Encana’s long-term debt totaled $5,363 million at December 31, 2015 and $7,340 million at December 31, 2014. There was no current portion of long-term debt outstanding at December 31, 2015 or December 31, 2014.
On April 6, 2015, the Company used the net proceeds from the Share Offering and cash on hand to complete the redemption of its $700 million 5.90 percent notes due December 1, 2017 and its C$750 million 5.80 percent medium-term notes due January 18, 2018. The early note redemptions required an aggregate one-time interest payment of approximately $165 million and is expected to save Encana a gross amount of approximately $205 million in future interest expense, based on foreign exchange and treasury rates at the time of the redemptions.
During the first quarter of 2015, Encana implemented a U.S. CP program which is fully supported by the Company’s revolving credit facility. At December 31, 2015, Encana had an outstanding balance of $440 million which reflected U.S. CP issuances maturing at various dates with a weighted average interest rate of 1.13 percent. At December 31, 2015, Encana also had an outstanding balance of $210 million under the Company’s revolving credit facility which reflected principal obligations related to LIBOR loans maturing at various dates with
38 Encana Corporation | ANNUAL REPORT 2015
MD&A
PREPARED USING U.S. GAAP IN US$
a weighted average interest rate of 1.87 percent. These amounts are fully supported and Management expects they will continue to be supported by the revolving credit facility that has no repayment requirements within the next year.
At December 31, 2014, Encana had an outstanding balance of $1,277 million under the Company’s revolving credit facility, which reflected principal obligations related to LIBOR loans maturing at various dates with a weighted average interest rate of 1.62 percent. During the first quarter of 2015, Encana repaid the outstanding balance relating to LIBOR loans using proceeds from the U.S. CP program and cash on hand.
Encana has the flexibility to refinance maturing long-term debt or repay debt maturities from existing sources of liquidity. Encana’s primary sources of liquidity include cash and cash equivalents, revolving bank credit facilities, working capital, operating cash flow and proceeds from asset divestitures.
Shelf Prospectus
On June 27, 2014, Encana filed a short form base shelf prospectus, whereby the Company may issue from time to time up to $6.0 billion, or the equivalent in foreign currencies, of debt securities, common shares, preferred shares, subscription receipts, warrants and units in Canada and/or the U.S. On March 5, 2015, the Company filed a prospectus supplement to the base shelf prospectus for the issuance of 85,616,500 common shares of Encana and granted an over-allotment option for up to an additional 12,842,475 common shares of Encana at a price of C$14.60 per common share, pursuant to an underwriting agreement. The Share Offering of 98,458,975 common shares of Encana was completed during March 2015 for aggregate gross proceeds of approximately C$1.44 billion ($1.13 billion). After deducting underwriter’s fees and costs of the Share Offering, the net proceeds received were approximately C$1.39 billion ($1.09 billion). At December 31, 2015, $4.9 billion, or the equivalent in foreign currencies, remained accessible under the shelf prospectus, the availability of which is dependent upon market conditions. The shelf prospectus expires in July 2016.
Outstanding Share Data
| (millions) | February 19, 2016 | December 31, 2015 | December 31, 2014 | |||||||||
| Common Shares Outstanding |
849.8 | 849.8 | 741.2 | |||||||||
| Stock Options with Tandem Stock Appreciation Rights attached |
||||||||||||
| Outstanding |
16.3 | 18.3 | 21.3 | |||||||||
| Exercisable |
11.5 | 10.0 | 10.0 | |||||||||
During the first quarter of 2015, Encana issued common shares pursuant to the Share Offering as discussed above.
During 2015, Encana issued 10,246,221 common shares under the Company’s dividend reinvestment plan (“DRIP”) compared with 240,839 common shares in 2014. The number of common shares issued under the DRIP increased in 2015 primarily as a result of Encana’s February 25, 2015 announcement that, effective with the dividend payable on March 31, 2015, any dividends in conjunction with the DRIP would be issued from its treasury with a two percent discount to the average market price of the common shares. On December 14, 2015, the Company announced that any dividends subsequent to December 31, 2015 distributed to shareholders participating in the DRIP will be issued from its treasury without a discount to the average market price of the common shares unless otherwise announced by the Company via news release.
Eligible employees have been granted stock options to purchase common shares in accordance with Encana’s Employee Stock Option Plan. A Tandem Stock Appreciation Right (“TSAR”) gives the option holder the right to receive a cash payment equal to the excess of the market price of Encana’s common shares at the time of exercise over the original grant price. Historically, most holders of these options have elected to exercise their stock options as a TSAR in exchange for a cash payment. The exercise of a TSAR for a cash payment does not result in the issuance of any Encana common shares and, therefore, has no dilutive effect.
ANNUAL REPORT 2015 | Encana Corporation 39
MD&A
PREPARED USING U.S. GAAP IN US$
Dividends
Encana pays quarterly dividends to shareholders at the discretion of the Board.
| ($ millions, except as indicated) | 2015 | 2014 | ||||||
| Dividend Payments |
$ | 225 | $ | 207 | ||||
| Dividend Payments ($/share) |
0.28 | 0.28 | ||||||
The dividends paid in 2015 included $73 million in common shares issued in lieu of cash dividends under the DRIP compared to $5 million for 2014. Common shares issued in the Share Offering were not eligible to receive the dividend that was paid during the first quarter of 2015. On December 14, 2015, the Company announced that it planned to reset its annualized 2016 dividend to $0.06 per share.
On February 23, 2016, the Board declared a dividend of $0.015 per share payable on March 31, 2016 to common shareholders of record as of March 15, 2016.
Capital Structure
The Company’s capital structure consists of total shareholders’ equity plus long-term debt, including the current portion. The Company’s objectives when managing its capital structure are to maintain financial flexibility to preserve Encana’s access to capital markets and its ability to meet financial obligations and finance internally generated growth, as well as potential acquisitions. Encana has a long-standing practice of maintaining capital discipline and managing and adjusting its capital structure according to market conditions to maintain flexibility while achieving the Company’s objectives.
To manage the capital structure, the Company may adjust capital spending, adjust dividends paid to shareholders, issue new shares, issue new debt or repay existing debt. In managing its capital structure, the Company monitors the following non-GAAP financial metrics as indicators of its overall financial strength, which are defined in the Non-GAAP Measures section of this MD&A.
| 2015 | 2014 | 2013 | ||||||||||
| Debt to Debt Adjusted Cash Flow |
2.8x | 2.1x | 2.4x | |||||||||
| Debt to Adjusted Capitalization |
28% | 30% | 36% | |||||||||
40 Encana Corporation | ANNUAL REPORT 2015
MD&A
PREPARED USING U.S. GAAP IN US$
| Contractual Obligations and Contingencies |
Commitments
The following table outlines the Company’s commitments at December 31, 2015:
| ($ millions, undiscounted) | Expected Future Payments | |||||||||||||||||||||||||||
| 2016 | 2017 | 2018 | 2019 | 2020 | Thereafter | Total | ||||||||||||||||||||||
| Long-Term Debt (1) |
$ | - | $ | - | $ | - | $ | 500 | $ | 650 | $ | 4,200 | $ | 5,350 | ||||||||||||||
| Asset Retirement Obligation |
42 | 58 | 96 | 105 | 24 | 2,251 | 2,576 | |||||||||||||||||||||
| Other Long-Term Obligations |
68 | 68 | 69 | 69 | 70 | 1,315 | 1,659 | |||||||||||||||||||||
| Capital Leases |
98 | 99 | 99 | 99 | 99 | 133 | 627 | |||||||||||||||||||||
| Obligations (2) |
208 | 225 | 264 | 773 | 843 | 7,899 | 10,212 | |||||||||||||||||||||
| Transportation and Processing |
693 | 679 | 685 | 588 | 491 | 2,507 | 5,643 | |||||||||||||||||||||
| Drilling and Field Services |
164 | 106 | 59 | 29 | 17 | 1 | 376 | |||||||||||||||||||||
| Operating Leases |
30 | 24 | 23 | 11 | 3 | 19 | 110 | |||||||||||||||||||||
| Commitments |
887 | 809 | 767 | 628 | 511 | 2,527 | 6,129 | |||||||||||||||||||||
| Total Contractual Obligations |
$ | 1,095 | $ | 1,034 | $ | 1,031 | $ | 1,401 | $ | 1,354 | $ | 10,426 | $ | 16,341 | ||||||||||||||
| Sublease Recoveries |
$ | (34 | ) | $ | (34 | ) | $ | (34 | ) | $ | (34 | ) | $ | (34 | ) | $ | (646 | ) | $ | (816) | ||||||||
| (1) | Principal component only. See Note 13 to the Consolidated Financial Statements. |
| (2) | The Company has recorded $7,818 million in liabilities related to these obligations. |
Contractual obligations arising from long-term debt, asset retirement obligations, The Bow office building and capital leases are recognized on the Company’s balance sheet. Further information can be found in the note disclosures to the Consolidated Financial Statements.
Other Long-Term Obligations relates to the 25-year lease agreement with a third party developer for The Bow office building. Encana has recognized the accumulated construction costs for The Bow office building as an asset with a related liability. In 2012, Encana commenced payments to the third party developer. At the conclusion of the 25-year term, the remaining asset and corresponding liability are expected to be derecognized. Encana has subleased part of The Bow office space to a subsidiary of Cenovus Energy Inc. (“Cenovus”). Sublease Recoveries in the table above include the amounts expected to be recovered from Cenovus. Encana’s undiscounted payments for The Bow are $1,659 million, of which $816 million is expected to be recovered from Cenovus.
Capital Leases primarily includes the obligation related to the Deep Panuke PFC, which commenced commercial operations in December 2013 following issuance of the Production Acceptance Notice. Encana’s undiscounted future lease payments for the Deep Panuke PFC total $534 million ($340 million discounted).
Included in Transportation and Processing in the table above are certain commitments associated with midstream service agreements with VMLP. Additional information can be found in Note 19 to the Consolidated Financial Statements. Encana also has significant development commitments with joint venture partners, a portion of which may be satisfied by the Drilling and Field Services commitments included in the table above.
Further to the Commitments disclosed above, Encana also has obligations related to its risk management program and to fund its defined benefit pension and other post-employment benefit plans. Additional information can be found in the note disclosures to the Consolidated Financial Statements.
Divestiture transactions can reduce certain commitments and obligations disclosed above. The Company expects to fund its 2016 commitments and obligations from Cash Flow and cash and cash equivalents.
ANNUAL REPORT 2015 | Encana Corporation 41
MD&A
PREPARED USING U.S. GAAP IN US$
Contingencies
Encana is involved in various legal claims and actions arising in the course of the Company’s operations. Although the outcome of these claims cannot be predicted with certainty, the Company does not expect these matters to have a material adverse effect on Encana’s financial position, cash flows or results of operations. If an unfavourable outcome were to occur, there exists the possibility of a material adverse impact on the Company’s consolidated net earnings or loss in the period in which the outcome is determined. Accruals for litigation and claims are recognized if the Company determines that the loss is probable and the amount can be reasonably estimated. The Company believes it has made adequate provision for such legal claims.
42 Encana Corporation | ANNUAL REPORT 2015
MD&A
PREPARED USING U.S. GAAP IN US$
| Risk Management |
Encana’s business, prospects, financial condition, results of operations and cash flows, and in some cases its reputation, are impacted by risks that can be categorized as follows:
| · | financial risks; |
| · | operational risks; and |
| · | environmental, regulatory, reputational and safety risks. |
Encana aims to strengthen its position as a leading North American energy producer and grow shareholder value through a disciplined focus on generating profitable growth. Encana continues to focus on developing a balanced portfolio of low-risk and low-cost long-life plays, enabling the Company to respond to market uncertainties. Management adjusts financial and operational risk strategies to proactively respond to changing economic conditions and to mitigate or reduce risk.
Issues that can affect Encana’s reputation are generally strategic or emerging issues that can be identified early and then appropriately managed, but can also include unforeseen issues that must be managed on a more urgent basis. Encana takes a proactive approach to the identification and management of issues that affect the Company’s reputation and has established appropriate policies, procedures, guidelines and responsibilities for identifying and managing these risks.
Financial Risks
Encana defines financial risks as the risk of loss or lost opportunity resulting from financial management and market conditions that could have an impact on Encana’s business.
Financial risks include, but are not limited to:
| · | market pricing of natural gas and liquids; |
| · | credit and liquidity; |
| · | foreign exchange rates; and |
| · | interest rates. |
Encana partially mitigates its exposure to financial risks through the use of various financial instruments and physical contracts. The use of derivative financial instruments is governed under formal policies and is subject to limits established by the Board. All derivative financial agreements are with major global financial institutions or with corporate counterparties having investment grade credit ratings. Encana has in place policies and procedures with respect to the required documentation and approvals for the use of derivative financial instruments and specifically ties their use to the mitigation of financial risk in order to support capital plans and strategic objectives.
To partially mitigate commodity price risk, the Company may enter into transactions that fix, set a floor or combine to set floors and caps on price exposures. To help protect against regional price differentials, Encana executes transactions to manage the price differentials between its production areas and various sales points. Further information, including the details of Encana’s financial instruments as at December 31, 2015, is disclosed in Note 24 to the Consolidated Financial Statements.
Counterparty credit risks are regularly and proactively managed. A substantial portion of Encana’s credit exposure is with customers in the oil and gas industry or financial institutions. Credit exposures are managed through the use of Board-approved credit policies governing the Company’s credit portfolio, including credit practices that limit transactions and grant payment terms according to industry standards and counterparties’ credit quality.
The Company manages liquidity risk using cash and debt management programs. The Company has access to cash equivalents and a range of funding alternatives at competitive rates through committed revolving bank credit
ANNUAL REPORT 2015 | Encana Corporation 43
MD&A
PREPARED USING U.S. GAAP IN US$
facilities as well as debt and equity capital markets. Encana closely monitors the Company’s ability to access cost-effective credit and ensures that sufficient liquidity is in place to fund capital expenditures and dividend payments. The Company minimizes its liquidity risk by managing its capital structure which may include adjusting capital spending, adjusting dividends paid to shareholders, issuing new shares, issuing new debt or repaying existing debt.
As a means of mitigating the exposure to fluctuations in the U.S./Canadian dollar exchange rate, Encana may enter into foreign exchange contracts. Realized gains or losses on these contracts are recognized on settlement. By maintaining U.S. and Canadian operations, Encana has a natural hedge to some foreign exchange exposure.
Encana may also maintain a mix of both U.S. dollar and Canadian dollar debt to help offset exposure to the fluctuations in the U.S./Canadian dollar exchange rate. In addition to direct issuance of U.S. dollar denominated debt, the Company may enter into cross currency swaps on a portion of its debt as a means of managing the U.S./Canadian dollar debt mix.
The Company partially mitigates its exposure to interest rate changes by holding a mix of both fixed and floating rate debt. Encana may enter into interest rate swap transactions from time to time as an additional means of managing the fixed/floating rate debt portfolio mix.
Operational Risks
Operational risks are defined as the risk of loss or lost opportunity resulting from the following:
| · | operating activities; |
| · | capital activities, including the ability to complete projects; and |
| · | reserves and resources replacement. |
The Company’s ability to operate, generate cash flows, complete projects, and value reserves and resources is subject to financial risks, including commodity price volatility mentioned above, continued market demand for its products and other factors outside of its control. These factors include: general business and market conditions; economic recessions and financial market turmoil; the overall state of the capital markets, including investor appetite for investments in the oil and gas industry generally and the Company’s securities in particular; the ability to secure and maintain cost-effective financing for its commitments; legislative, environmental and regulatory matters; unexpected cost increases; royalties; taxes; partner funding for their share of joint venture and partnership commitments; the availability of drilling and other equipment; the ability to retain leases and access lands; the ability to access water for hydraulic fracturing operations; weather; the availability and proximity of processing and pipeline capacity; transportation interruption and constraints; technology failures; the ability to assess and integrate new assets; cyber security breaches; accidents; the availability and ability to attract qualified personnel and service providers; type curve performance; and reservoir quality. If Encana fails to acquire or find additional natural gas and liquids reserves and resources, its reserves, resources and production will decline materially from their current levels and, therefore, its cash flows are highly dependent upon successfully exploiting current reserves and resources and acquiring, discovering or developing additional reserves and resources. To mitigate these risks, as part of the capital approval process, the Company’s projects are evaluated on a fully risked basis, including geological risk, engineering risk and reliance on third party service providers.
In addition, Encana undertakes a thorough review of previous capital programs to identify key learnings, which often include operational issues that positively and negatively impact project results. Mitigation plans are developed for the operational issues that had a negative impact on results. These mitigation plans are then incorporated into the current year plan for the project. On an annual basis, these results are analyzed for Encana’s capital program with the results and identified learnings shared across the Company.
An internal peer review process is used to ensure that capital projects are appropriately risked and that knowledge is shared across the Company. Internal peer reviews are undertaken primarily for exploration projects and early stage plays, although they may occur for any type of project.
44 Encana Corporation | ANNUAL REPORT 2015
MD&A
PREPARED USING U.S. GAAP IN US$
When making operating and investing decisions, Encana’s highly disciplined, dynamic and centrally controlled capital allocation program ensures investment dollars are directed in a manner that is consistent with the Company’s strategy. Encana also mitigates operational risks through a number of other policies, systems and processes as well as by maintaining a comprehensive insurance program.
In January 2016, the Alberta Government released the Modernized Royalty Framework (“MRF”) outlining changes to the province’s royalty structure. The MRF will result in the modernization and simplification of the royalty structure with changes to the royalty framework for crude oil, liquids and natural gas applying to new wells drilled after January 1, 2017 and existing royalties remaining in effect for 10 years on wells drilled (spud) before 2017. The Company is currently assessing the full impact of the changes to the royalty structure on its operations.
Environmental, Regulatory, Reputational and Safety Risks
The Company is committed to safety in its operations and has high regard for the environment and stakeholders, including the public and regulators. The Company’s business is subject to all of the operating risks normally associated with the exploration for, development of and production of natural gas, oil and NGLs and the operation of midstream facilities. When assessing the materiality of environmental risk factors, Encana takes into account a number of qualitative and quantitative factors, including, but not limited to, the financial, operational, reputational and regulatory aspects of each identified risk factor. These risks are managed by executing policies and standards that are designed to comply with or exceed government regulations and industry standards. In addition, Encana maintains a system that identifies, assesses and controls safety, security and environmental risk and requires regular reporting to the Executive Leadership Team and the Board. The Corporate Responsibility, Environment, Health and Safety Committee of Encana’s Board provides recommended environmental policies for approval by Encana’s Board and oversees compliance with government laws and regulations. Monitoring and reporting programs for environmental, health and safety performance in day-to-day operations, as well as inspections and audits, are designed to provide assurance that environmental and regulatory standards are met. Emergency response plans are in place to provide guidance during times of crisis. Contingency plans are in place for a timely response to environmental events and remediation/reclamation strategies are utilized to restore the environment.
Encana’s operations are subject to regulation and intervention by governments that can affect or prohibit the drilling, completion, including hydraulic fracturing and tie-in of wells, production, the construction or expansion of facilities and the operation and abandonment of fields. Changes in government regulation could impact the Company’s existing and planned projects as well as impose a cost of compliance.
One of the processes Encana monitors relates to hydraulic fracturing. Hydraulic fracturing is used throughout the oil and gas industry where fracturing fluids are utilized to develop the reservoir. This process has been used in the oil and gas industry for approximately 60 years. Encana uses multiple techniques to fully understand the effect of each hydraulic fracturing operation it conducts. In all Encana operations, rigorous water management and protection is an essential part of this process.
Hydraulic fracturing processes are strictly regulated by various state and provincial government agencies. Encana meets or exceeds the requirements set out by the regulators. The U.S. and Canadian federal governments and certain U.S. state and Canadian provincial governments continue to review certain aspects of the scientific, regulatory and policy framework under which hydraulic fracturing operations are conducted. At present, most of these governments are primarily engaged in the collection, review and assessment of technical information regarding the hydraulic fracturing process and have not provided specific details with respect to any significant actual, proposed or contemplated changes to hydraulic fracturing regulations.
In the state of Colorado, several cities have passed local ordinances limiting or banning certain oil and gas activities, including hydraulic fracturing. These local rule-making initiatives have not significantly impacted the Company’s operations or development plans in the state to date. Encana continues to work with state and local governments, academics and industry leaders to respond to hydraulic fracturing related concerns in Colorado. The Company recognizes that additional hydraulic fracturing ballot and/or local rule-making limiting or restricting oil and gas development activities are a possibility in the future and will continue to monitor and respond to these developments in 2016.
ANNUAL REPORT 2015 | Encana Corporation 45
MD&A
PREPARED USING U.S. GAAP IN US$
Encana is committed to and supports the disclosure of hydraulic fracturing chemical information. Encana participates in the FracFocus Chemical Disclosure Registry (the “Registry”) in the U.S. and the Alberta and British Columbia versions of the Registry. Encana works collaboratively with industry peers, trade associations, fluid suppliers and regulators to identify, develop and advance responsible hydraulic fracturing best practices.
Climate Change Regulations
A number of federal, provincial and state governments have announced intentions to regulate greenhouse gases (“GHG”) and certain other air emissions. While some jurisdictions have provided details on these regulations, it is anticipated that other jurisdictions will announce emission reduction plans in the future. As these federal and regional programs are under development, Encana is unable to predict the total impact of the potential regulations upon its business. Therefore, it is possible that the Company could face increases in operating and capital costs in order to comply with GHG emissions legislation. However, Encana will continue to work with governments to develop an approach to deal with climate change issues that protects the industry’s competitiveness, limits the cost and administrative burden of compliance and supports continued investment in the sector.
In Canada, the federal government and several provincial governments, including Alberta and British Columbia, have announced an enhanced focus on climate change policy in 2016. Encana continues to monitor developments, engage in consultations as appropriate and is actively managing the implementation of new climate-related policy and regulations in order to minimize the potential impact on its business.
On June 25, 2015, the Alberta Government announced that it was renewing and updating the Specified Gas Emitters Regulation (the “Regulation”), which governs carbon emissions and was set to expire on June 30, 2015. The Regulation requires any facility that emits 100,000 tonnes or more of greenhouse gases per year to reduce their emissions intensity. The renewed Regulation increases the reduction target from 12 percent to 20 percent by 2017 and increases the cost of carbon from C$15 per tonne to C$30 per tonne by 2017 for those facilities that are unable to meet the specified reduction targets. Encana does not own or operate any facilities which exceed the 100,000 tonne threshold and, as a result, is not currently subject to the Regulation.
In the U.S., the federal government has noted climate change action as a priority for the current administration and the Environmental Protection Agency (“EPA”) has outlined a series of steps to address methane and volatile organic compound emissions from the oil and gas industry, including a new goal to reduce oil and gas methane emissions by 40 to 45 percent from 2012 levels by 2025. The reductions will be achieved through proposed regulatory and voluntary measures. Encana continues to monitor these developments, provide comment as appropriate and assess the potential impact on its business.
Encana intends to continue its activity to reduce its emissions intensity and improve its energy efficiency. The Company’s efforts with respect to emissions management are founded with a focus on energy efficiency, the deployment of technology to reduce GHG emissions and active involvement in the creation of industry best practices.
46 Encana Corporation | ANNUAL REPORT 2015
MD&A
PREPARED USING U.S. GAAP IN US$
Encana has a proactive strategy for addressing the implications of emerging carbon regulations, which is composed of three principal elements:
| ● | Active Management. When regulations are implemented, a cost is placed on Encana’s emissions (or a portion thereof) and, while these are not material at this stage, they are being actively managed to ensure compliance. Factors such as effective emissions tracking and attention to fuel consumption help to support and drive the Company’s focus on cost reduction. |
| ● | Anticipate and Respond to Price Signals. As regulatory regimes for GHG develop in the jurisdictions where Encana operates, inevitably price signals begin to emerge. The price of potential carbon reductions plays a role in the economics of the projects that are implemented. In response to the anticipated price of carbon, Encana is also attempting, where appropriate, to realize the associated value of its reduction projects. |
| ● | Work with Industry Groups. Encana continues to work with governments, academics and industry leaders to develop and respond to emerging GHG regulations. By continuing to stay engaged in the debate on the most appropriate means to regulate these emissions, the Company gains useful knowledge that allows it to explore different strategies for managing its emissions and costs. These scenarios influence Encana’s long-range planning and its analyses on the implications of regulatory trends. |
Encana monitors developments in emerging climate change policy and legislation, and considers the associated costs of carbon in its planning. Management and the Board review the impact of a variety of carbon constrained scenarios on its business plans, with a current price range from approximately $20 to $125 per tonne of emissions applied to a range of emissions coverage levels. Although uncertainty remains regarding potential future emissions regulation, Encana’s plan is to continue to assess and evaluate the cost of carbon relative to its investments across a range of scenarios.
Encana recognizes that there is a cost associated with carbon emissions. Encana is confident that GHG regulations and the cost of carbon at various price levels have been adequately considered as part of its business planning and scenarios analyses. Encana believes that the resource play strategy is an effective way to develop the resource, generate shareholder returns and coordinate overall environmental objectives with respect to carbon, air emissions, water and land. Encana is committed to transparency with its stakeholders and will keep them apprised of how these issues affect operations.
ANNUAL REPORT 2015 | Encana Corporation 47
MD&A
PREPARED USING U.S. GAAP IN US$
| Controls and Procedures |
Disclosure Controls and Procedures
The Company’s President and Chief Executive Officer (“CEO”) and Executive Vice-President and Chief Financial Officer (“CFO”) have designed, or caused to be designed under their supervision, disclosure controls and procedures to provide reasonable assurance that:
| · | Material information relating to the Company is made known to the CEO and CFO by others; and |
| · | Information required to be disclosed by the Company in its annual filings, interim filings or other reports filed or submitted under securities legislation is recorded, processed, summarized and reported within the time period specified in securities legislation. |
Such officers have evaluated, or caused to be evaluated under their supervision, the effectiveness of the Company’s disclosure controls and procedures at the financial year end of the Company. Based on their evaluation, the officers have concluded that Encana’s disclosure controls and procedures were effective as at December 31, 2015.
Internal Control over Financial Reporting
Management is responsible for establishing and maintaining adequate internal control over the Company’s financial reporting, which is a process designed by, or designed under the supervision of the CEO and CFO, and effected by the Board, Management and other personnel, to provide reasonable assurance regarding the reliability of financial reporting and the preparation of financial statements for external purposes in accordance with U.S. GAAP.
Under their supervision and with the participation of Management, including the CEO and CFO, an evaluation of the effectiveness of the Company’s internal control over financial reporting was conducted at December 31, 2015, based on the Internal Control – Integrated Framework (2013) issued by the Committee of Sponsoring Organizations of the Treadway Commission. Based on this evaluation, Management has concluded that the Company’s internal control over financial reporting was effectively designed and operating effectively as at that date.
Encana previously limited the scope and design and subsequent evaluation of internal controls over financial reporting to exclude the controls, policies and procedures of Athlon, acquired through a business combination on November 13, 2014. During the second quarter of 2015, the Company completed the evaluation and integration of the controls, policies and procedures of Athlon and no material weaknesses were noted during the integration. There have been no changes to the Company’s internal control over financial reporting during the year ended December 31, 2015 that have materially affected, or are reasonably likely to materially affect, the effectiveness of the internal control over financial reporting.
Limitations of the Effectiveness of Controls
The Company’s control system was designed to provide reasonable assurance to Management regarding the preparation and presentation of the Consolidated Financial Statements. Control systems, no matter how well designed, have inherent limitations. Therefore, even those systems determined to be effective can provide only reasonable assurance with respect to financial statement preparation and presentation and should not be expected to prevent all errors or fraud. Also, projections of any evaluation of effectiveness to future periods are subject to the risk that controls may become inadequate because of changes in conditions, or that the degree of compliance with the policies or procedures may deteriorate.
PricewaterhouseCoopers LLP, an independent firm of chartered professional accountants, was appointed by a vote of shareholders at the Company’s last annual meeting to audit and provide independent opinions on both the Consolidated Financial Statements and the Company’s internal control over financial reporting as at December 31, 2015, as stated in their Auditor’s Report which is included in our audited Consolidated Financial Statements for the year ended December 31, 2015.
48 Encana Corporation | ANNUAL REPORT 2015
MD&A
PREPARED USING U.S. GAAP IN US$
| Accounting Policies and Estimates |
Critical Accounting Estimates
Management is required to make judgments, assumptions and estimates in applying its accounting policies and practices, which have a significant impact on the financial results of the Company. A summary of Encana’s significant accounting policies can be found in Note 1 to the Consolidated Financial Statements for the year ended December 31, 2015. The following discussion outlines the accounting policies and practices involving the use of estimates that are critical to determining Encana’s financial results.
Upstream Assets and Reserves
Encana follows U.S. GAAP full cost accounting for natural gas, oil and NGL activities. Reserves estimates can have a significant impact on net earnings, as they are a key input to the Company’s depletion, gain or loss and ceiling test impairment calculations. A downward revision in reserves estimates may increase depletion expense and may also result in a ceiling test impairment. A ceiling test impairment is recognized in net earnings when the carrying amount of a country cost centre exceeds the country cost centre ceiling. The carrying amount of a cost centre includes capitalized costs of proved oil and gas properties, net of accumulated depletion and the related deferred income taxes. The cost centre ceiling is the sum of the estimated after-tax future net cash flows from proved reserves as calculated under SEC requirements, using the 12-month average trailing prices and unescalated future development and production costs, discounted at 10 percent, plus unproved property costs. The 12-month average trailing price is calculated as the average of the price on the first day of each month within the trailing 12-month period. Any excess of the carrying amount over the calculated ceiling is recognized as an impairment in net earnings. During 2015, Encana recorded ceiling test impairments, which are discussed further in the Results of Operations section of this MD&A.
Annually, all of Encana’s natural gas, oil and NGL reserves and resources are evaluated and reported on by IQREs. The estimation of reserves is a subjective process. Estimates are based on engineering data, projected future rates of production, and the timing of future expenditures, all of which are subject to numerous uncertainties and various interpretations. Reserves estimates can be revised upward or downward based on the results of future drilling, testing, production levels and economics of recovery.
The Company believes that the discounted after-tax future net cash flows from proved reserves required to be used in the ceiling test calculation are not indicative of the fair market value of Encana’s natural gas and oil properties or the future net cash flows expected to be generated from such properties. The discounted after-tax future net cash flows do not consider the fair market value of unamortized unproved properties, or probable or possible natural gas and liquids reserves. In addition, there is no consideration given to the effect of future changes in commodity prices. Encana manages its business using estimates of reserves and resources based on forecast prices and costs.
Business Combinations
Encana follows the acquisition method of accounting for business combinations. Assets acquired and liabilities assumed are recognized at the date of acquisition at their respective estimated fair values. Any excess of the purchase price over the estimated fair values of the net assets acquired is recorded as goodwill. Any deficiency of the purchase price over the estimated fair values of the net assets acquired is recorded as a gain in net earnings. In determining fair value, Encana utilized valuation methodologies including the income approach.
The assumptions made in performing these valuations include discount rates, future commodity prices and costs, the timing of development activities, projections of oil and gas reserves, estimates to abandon and reclaim producing wells and tax amortization benefits available to a market participant. Any significant change in key assumptions may cause the acquisition accounting to be revised, including the recognition of additional goodwill or discount on acquisition.
The valuation of fair values are determined based on information that existed at the time of the acquisition, utilizing expectations and assumptions that would be available to and made by a market participant. However,
ANNUAL REPORT 2015 | Encana Corporation 49
MD&A
PREPARED USING U.S. GAAP IN US$
there is no assurance the underlying assumptions or estimates associated with the valuation will occur as initially expected. Changes in key assumptions and estimates can impact net earnings through ceiling test impairments, impairments of goodwill, or lower future operating results.
Goodwill
Goodwill, which represents the excess of purchase price over fair value of net assets acquired, is assessed for impairment at least annually at December 31. Goodwill and all other assets and liabilities are allocated to reporting units, which are Encana’s country cost centres. To assess impairment, the carrying amount of each reporting unit is determined and compared to the fair value of the reporting unit. If the carrying amount of the reporting unit is higher than its related fair value then goodwill is written down to the reporting unit’s implied fair value of goodwill. The implied fair value of goodwill is determined by deducting the fair value of the reporting unit’s assets and liabilities from the fair value of the reporting unit as if the reporting entity had been acquired in a business combination. Any excess of the carrying value of goodwill over the implied fair value of goodwill is recognized as an impairment and charged to net earnings. Subsequent measurement of goodwill is at cost less accumulated impairments.
The fair value used in the impairment test is based on estimates of discounted future cash flows which involves assumptions of natural gas and liquids reserves, including commodity prices, future costs and discount rates. Encana has assessed its goodwill for impairment at December 31, 2015 and has determined that no write-down is required.
Asset Retirement Obligation
Asset retirement obligations are those legal obligations where the Company will be required to retire tangible long-lived assets such as producing well sites, offshore production platforms and natural gas processing plants. The fair value of estimated asset retirement obligations is recognized in the Consolidated Balance Sheet when incurred and a reasonable estimate of fair value can be made. The asset retirement cost, equal to the initially estimated fair value of the asset retirement obligation, is capitalized as part of the cost of the related long-lived asset. Changes in the estimated obligation resulting from revisions to estimated timing or amount of future cash flows are recognized as a change in the asset retirement obligation and the related asset retirement cost.
The asset retirement obligation is estimated by discounting the expected future cash flows of the settlement. The discounted cash flows are based on estimates of such factors as reserves lives, retirement costs, timing of settlements, credit-adjusted risk-free rates and inflation rates. These estimates will impact net earnings through accretion of the asset retirement obligation in addition to depletion of the asset retirement cost included in property, plant and equipment. Actual expenditures incurred are charged against the accumulated asset retirement obligation.
Income Taxes
Encana follows the liability method of accounting for income taxes. Under this method, deferred income taxes are recorded for the effect of any temporary difference between the accounting and income tax basis of an asset or liability, using the enacted income tax rates and laws expected to apply when the assets are realized and liabilities are settled. Current income taxes are measured at the amount expected to be recoverable from or payable to the taxation authorities based on the income tax rates and laws enacted at the end of the reporting period. The effect of a change in the enacted tax rates or laws is recognized in net earnings in the period of enactment.
Deferred income tax assets are routinely assessed for realizability. If it is more likely than not that deferred tax assets will not be realized, a valuation allowance is recorded to reduce the deferred tax assets. Encana considers available positive and negative evidence when assessing the realizability of deferred tax assets, including historic and expected future taxable earnings, available tax planning strategies and carry forward periods. The assumptions used in determining expected future taxable earnings are consistent with those used in the goodwill impairment assessment.
50 Encana Corporation | ANNUAL REPORT 2015
MD&A
PREPARED USING U.S. GAAP IN US$
Encana’s interim income tax expense is determined using an estimated annual effective income tax rate applied to year-to-date net earnings before income tax plus the effect of legislative changes and amounts in respect of prior periods. The estimated annual effective income tax rate is impacted by the expected annual earnings, statutory rate and other foreign differences, non-taxable capital gains and losses, tax differences on divestitures and transactions, and partnership tax allocations in excess of funding.
Encana recognizes the financial statement effects of a tax position when it is more likely than not, based on the technical merits, that the position will be sustained upon examination by a taxing authority. A recognized tax position is initially and subsequently measured as the largest amount of tax benefit that is greater than 50 percent likely of being realized upon settlement with a taxing authority. Liabilities for unrecognized tax benefits that are not expected to be settled within the next 12 months are included in other liabilities and provisions.
Tax interpretations, regulations and legislation in the various jurisdictions in which the Company and its subsidiaries operate are subject to change. As such, income taxes are subject to measurement uncertainty and the interpretations can impact net earnings through the income tax expense arising from the changes in deferred income tax assets or liabilities.
Derivative Financial Instruments
As described in the Risk Management section of this MD&A, derivative financial instruments are used by Encana to manage its exposure to market risks relating to commodity prices, foreign currency exchange rates and interest rates. The Company’s policy is not to utilize derivative financial instruments for speculative purposes.
Derivative financial instruments are measured at fair value with changes in fair value recognized in net earnings. The fair values recorded in the Consolidated Balance Sheet reflect netting the asset and liability positions where counterparty master netting arrangements contain provisions for net settlement. Realized gains or losses from financial derivatives related to natural gas and oil commodity prices are recognized in revenues as the contracts are settled. Realized gains or losses from other derivative contracts related to certain payment obligations are recognized in revenues as the obligations are settled. Realized gains or losses from financial derivatives related to power commodity prices are recognized in transportation and processing expense as the related power contracts are settled. Unrealized gains and losses are recognized in revenues and transportation and processing expense accordingly, at the end of each respective reporting period based on the changes in fair value of the contracts.
The estimate of fair value of all derivative instruments is based on quoted market prices or, in their absence, third party market indications and forecasts. The estimated fair value of financial assets and liabilities is subject to measurement uncertainty.
ANNUAL REPORT 2015 | Encana Corporation 51
MD&A
PREPARED USING U.S. GAAP IN US$
Recent Accounting Pronouncements
Changes in Accounting Policies and Practices
On January 1, 2015, Encana adopted Accounting Standard Update (“ASU”) 2014-08, Reporting Discontinued Operations and Disclosures of Disposals of Components of an Entity as issued by the Financial Accounting Standards Board (“FASB”). The update amends the criteria and expands the disclosures for reporting discontinued operations. Under the new criteria, only disposals representing a strategic shift in operations would qualify as a discontinued operation. The amendments have been applied prospectively and have not had a material impact on the Company’s Consolidated Financial Statements.
On December 31, 2015, Encana early adopted ASU 2015-17, Balance Sheet Classification of Deferred Taxes, which requires deferred income tax assets and liabilities to be classified as non-current on the balance sheet. Previously, deferred income tax assets and liabilities were classified as current and non-current on the balance sheet. The amendments have been applied retrospectively and had no impact on the Company’s results of operations or cash flows. The impacts on the Company’s Consolidated Balance Sheet are as follows:
| As at December 31 ($ millions) | 2015 | 2014 | 2013 | |||||||||
| Prior to Adoption of ASU 2015-17: |
||||||||||||
|
Deferred Income Taxes |
||||||||||||
|
Current Assets |
$ | 22 | $ | - | $ | 118 | ||||||
|
Non-current Assets |
1,060 | 296 | 939 | |||||||||
| Current Liabilities |
1 | 128 | 3 | |||||||||
|
Non-current Liabilities |
24 | 1,829 | - | |||||||||
| Adoption of ASU 2015-17: |
||||||||||||
|
Deferred Income Taxes |
||||||||||||
|
Non-current Assets |
$ | 1,081 | $ | 206 | $ | 1,054 | ||||||
| Non-current Liabilities |
24 | 1,867 | - | |||||||||
New Standards Issued Not Yet Adopted
As of January 1, 2016, Encana will be required to adopt the following pronouncements issued by the FASB:
| ● | ASU 2014-12, Compensation – Stock Compensation: Accounting for Share-Based Payments When the Terms of an Award Provide That a Performance Target Could Be Achieved After the Requisite Service Period. The update requires that a performance target that affects vesting and could be achieved after the requisite service period be treated as a performance condition. The amendments will be applied prospectively and are not expected to have a material impact on the Company’s Consolidated Financial Statements. |
| ● | ASU 2015-02, Amendments to the Consolidation Analysis. The update requires limited partnerships and similar entities to be evaluated under the variable interest and voting interest models, eliminate the presumption that a general partner should consolidate a limited partnership, and simplify the identification of variable interests and related effect on the primary beneficiary criterion when fees are paid to a decision maker. The amendments can be applied using either a full retrospective approach or a modified retrospective approach at the date of adoption. The amendments are not expected to have a material impact on the Company’s Consolidated Financial Statements. |
52 Encana Corporation | ANNUAL REPORT 2015
MD&A
PREPARED USING U.S. GAAP IN US$
| ● | ASU 2015-03, Simplifying the Presentation of Debt Issuance Costs. The update requires debt issuance costs to be presented on the balance sheet as a deduction from the carrying amount of the related liability. Currently, debt issuance costs are presented as a deferred charge within assets. In August 2015, the FASB issued ASU 2015-15, Presentation and Subsequent Measurement of Debt Issuance Costs Associated with Line-of-Credit Arrangements. The update further clarifies that regardless of whether there are outstanding borrowings, debt issuance costs arising from credit arrangements can be presented as an asset and subsequently amortized ratably over the term of the arrangement. These amendments will be applied retrospectively. As at December 31, 2015, $30 million of debt issuance costs were presented in Other Assets on the Company’s Consolidated Balance Sheet ($39 million as at December 31, 2014). |
As of January 1, 2018, Encana will be required to adopt ASU 2014-09, Revenue from Contracts with Customers under Topic 606, which was the result of a joint project by the FASB and International Accounting Standards Board. The new standard replaces Topic 605, Revenue Recognition, and other industry-specific guidance in the Accounting Standards Codification. The new standard is based on the principle that revenue is recognized on the transfer of promised goods or services to customers in an amount that reflects the consideration the company expects to be entitled to in exchange for those goods or services. In August 2015, the FASB issued ASU 2015-14, Deferral of Effective Date for Revenue from Contracts with Customers, which deferred the effective date of ASU 2014-09, but permits early adoption using the original effective date of January 1, 2017. The standard can be applied using one of two retrospective application methods at the date of adoption. Encana is currently assessing the potential impact of the standard on the Company’s Consolidated Financial Statements.
ANNUAL REPORT 2015 | Encana Corporation 53
MD&A
PREPARED USING U.S. GAAP IN US$
| Non-GAAP Measures |
Certain measures in this document do not have any standardized meaning as prescribed by U.S. GAAP and, therefore, are considered non-GAAP measures. These measures may not be comparable to similar measures presented by other issuers. These measures are commonly used in the oil and gas industry and by Encana to provide shareholders and potential investors with additional information regarding the Company’s liquidity and its ability to generate funds to finance its operations. Non-GAAP measures include: Cash Flow; Free Cash Flow; Operating Earnings (Loss); Upstream Operating Cash Flow, excluding Hedging; Operating Netback; Debt to Debt Adjusted Cash Flow; and Debt to Adjusted Capitalization. Management’s use of these measures is discussed further below.
Cash Flow and Free Cash Flow
Cash Flow is a non-GAAP measure commonly used in the oil and gas industry and by Encana to assist Management and investors in measuring the Company’s ability to finance capital programs and meet financial obligations. Cash Flow is defined as cash from operating activities excluding net change in other assets and liabilities, net change in non-cash working capital and cash tax on sale of assets.
Free Cash Flow is a non-GAAP measure defined as Cash Flow in excess of capital investment, excluding net acquisitions and divestitures, and is used to determine the funds available for other investing and/or financing activities.
| 2015 | 2014 | 2013 | ||||||||||||||||||||||||||||||||||||||||||||||
| ($ millions) | Annual | Q4 | Q3 | Q2 | Q1 | Annual | Q4 | Q3 | Q2 | Q1 | Annual | |||||||||||||||||||||||||||||||||||||
| Cash From (Used in) |
$1,681 | $ | 448 | $ | 453 | $ | 298 | $ | 482 | $ | 2,667 | $ | 261 | $ | 696 | $ | 767 | $ | 943 | $ | 2,289 | |||||||||||||||||||||||||||
| (Add back) deduct: |
||||||||||||||||||||||||||||||||||||||||||||||||
| Net change in other assets and liabilities |
(11 | ) | 7 | (18 | ) | 7 | (7 | ) | (43 | ) | (15 | ) | (11 | ) | (8 | ) | (9 | ) | (80 | ) | ||||||||||||||||||||||||||||
| Net change in non-cash working capital |
262 | 58 | 100 | 110 | (6 | ) | (9 | ) | (141 | ) | 155 | 119 | (142 | ) | (179 | ) | ||||||||||||||||||||||||||||||||
| Cash tax on sale of assets |
- | - | - | - | - | (215 | ) | 40 | (255 | ) | - | - | (33 | ) | ||||||||||||||||||||||||||||||||||
| Cash Flow |
$1,430 | $ | 383 | $ | 371 | $ | 181 | $ | 495 | $ | 2,934 | $ | 377 | $ | 807 | $ | 656 | $ | 1,094 | $ | 2,581 | |||||||||||||||||||||||||||
| Deduct: |
||||||||||||||||||||||||||||||||||||||||||||||||
| Capital investment |
2,232 | 280 | 473 | 743 | 736 | 2,526 | 857 | 598 | 560 | 511 | 2,712 | |||||||||||||||||||||||||||||||||||||
| Free Cash Flow |
$ (802 | ) | $ | 103 | $ | (102 | ) | $ | (562 | ) | $ | (241 | ) | $ | 408 | $ | (480 | ) | $ | 209 | $ | 96 | $ | 583 | $ | (131 | ) | |||||||||||||||||||||
54 Encana Corporation | ANNUAL REPORT 2015
MD&A
PREPARED USING U.S. GAAP IN US$
Operating Earnings
Operating Earnings (Loss) is a non-GAAP measure that adjusts Net Earnings (Loss) Attributable to Common Shareholders by non-operating items that Management believes reduces the comparability of the Company’s underlying financial performance between periods. Operating Earnings (Loss) is commonly used in the oil and gas industry and by Encana to provide investors with information that is more comparable between periods.
Operating Earnings (Loss) is defined as Net Earnings (Loss) Attributable to Common Shareholders excluding non-recurring or non-cash items that Management believes reduces the comparability of the Company’s financial performance between periods. These after-tax items may include, but are not limited to, unrealized hedging gains/losses, impairments, restructuring charges, non-operating foreign exchange gains/losses, gains/losses on divestitures, income taxes related to divestitures and adjustments to normalize the effect of income taxes calculated using the estimated annual effective income tax rate.
| 2015 | 2014 | 2013 | ||||||||||||||||||||||||||||||||||||||||||||||
| ($ millions) | Annual | Q4 | Q3 | Q2 | Q1 | Annual | Q4 | Q3 | Q2 | Q1 | Annual | |||||||||||||||||||||||||||||||||||||
| Net Earnings (Loss) Attributable to Common Shareholders |
$ | (5,165 | ) | $ | (612 | ) | $ | (1,236 | ) | $ | (1,610 | ) | $ | (1,707 | ) | $ | 3,392 | $ | 198 | $ | 2,807 | $ | 271 | $ | 116 | $ | 236 | |||||||||||||||||||||
| After-tax (addition) / deduction: |
||||||||||||||||||||||||||||||||||||||||||||||||
| Unrealized hedging gain (loss) |
(244 | ) | (66 | ) | 107 | (187 | ) | (98 | ) | 306 | 341 | 160 | 8 | (203 | ) | (232 | ) | |||||||||||||||||||||||||||||||
| Impairments |
(4,130 | ) | (514 | ) | (1,066 | ) | (1,328 | ) | (1,222 | ) | - | - | - | - | - | (16 | ) | |||||||||||||||||||||||||||||||
| Restructuring charges (1) |
(45 | ) | (5 | ) | (20 | ) | (10 | ) | (10 | ) | (24 | ) | (4 | ) | (5 | ) | (5 | ) | (10 | ) | (64 | ) | ||||||||||||||||||||||||||
| Non-operating foreign exchange gain (loss) |
(702 | ) | (96 | ) | (212 | ) | 114 | (508 | ) | (407 | ) | (151 | ) | (218 | ) | 156 | (194 | ) | (282 | ) | ||||||||||||||||||||||||||||
| Gain (loss) on divestitures |
9 | - | (2 | ) | 1 | 10 | 2,523 | (11 | ) | 2,399 | 135 | - | - | |||||||||||||||||||||||||||||||||||
| Income tax adjustments |
8 | (42 | ) | (19 | ) | (33 | ) | 102 | (8 | ) | (12 | ) | 190 | (194 | ) | 8 | 28 | |||||||||||||||||||||||||||||||
| Operating Earnings (Loss) (1) |
$ | (61 | ) | $ | 111 | $ | (24 | ) | $ | (167 | ) | $ | 19 | $ | 1,002 | $ | 35 | $ | 281 | $ | 171 | $ | 515 | $ | 802 | |||||||||||||||||||||||
| (1) | In continued support of Encana’s strategy, organizational structure changes were formalized in Q2 2015 and resulted in a revision to the Q1 2015 Operating Earnings to exclude restructuring charges incurred in the first quarter. |
ANNUAL REPORT 2015 | Encana Corporation 55
MD&A
PREPARED USING U.S. GAAP IN US$
Upstream Operating Cash Flow, excluding Hedging
Upstream Operating Cash Flow, excluding Hedging is a non-GAAP measure that adjusts the Canadian and USA Operations revenues, net of royalties for production, mineral and other taxes, transportation and processing expense, operating expense and the impacts of realized hedging. Management monitors Upstream Operating Cash Flow, excluding Hedging as it reflects operating performance and measures the Company’s portfolio transition to higher margin production. Upstream Operating Cash Flow, excluding Hedging is reconciled to GAAP measures in the Results of Operations section of this MD&A. The table below totals Upstream Operating Cash Flow for Encana.
| 2015 | 2014 | 2013 | ||||||||||||||||||||||||||||||||||||||||||||||
| ($ millions) | Annual | Q4 | Q3 | Q2 | Q1 | Annual | Q4 | Q3 | Q2 | Q1 | Annual | |||||||||||||||||||||||||||||||||||||
| Upstream Operating Cash Flow |
||||||||||||||||||||||||||||||||||||||||||||||||
| Canadian Operations |
$ 988 | $ | 204 | $ | 200 | $ | 171 | $ | 413 | $ | 2,146 | $ | 341 | $ | 477 | $ | 447 | $ | 881 | $ | 1,681 | |||||||||||||||||||||||||||
| USA Operations |
1,276 | 348 | 331 | 308 | 289 | 1,772 | 480 | 505 | 353 | 434 | 1,511 | |||||||||||||||||||||||||||||||||||||
| $2,264 | $ | 552 | $ | 531 | $ | 479 | $ | 702 | $ | 3,918 | $ | 821 | $ | 982 | $ | 800 | $ | 1,315 | $ | 3,192 | ||||||||||||||||||||||||||||
| (Add back) deduct: |
||||||||||||||||||||||||||||||||||||||||||||||||
| Realized Hedging Gain (Loss) |
||||||||||||||||||||||||||||||||||||||||||||||||
| Canadian Operations |
$ 495 | $ | 129 | $ | 109 | $ | 101 | $ | 156 | $ | (56 | ) | $ | 49 | $ | 19 | $ | (49 | ) | $ | (75 | ) | $ | 276 | ||||||||||||||||||||||||
| USA Operations |
425 | 162 | 108 | 63 | 92 | (25 | ) | 78 | 11 | (49 | ) | (65 | ) | 264 | ||||||||||||||||||||||||||||||||||
| $ 920 | $ | 291 | $ | 217 | $ | 164 | $ | 248 | $ | (81 | ) | $ | 127 | $ | 30 | $ | (98 | ) | $ | (140 | ) | $ | 540 | |||||||||||||||||||||||||
| Upstream Operating Cash Flow, excluding Hedging |
||||||||||||||||||||||||||||||||||||||||||||||||
| Canadian Operations |
$ 493 | $ | 75 | $ | 91 | $ | 70 | $ | 257 | $ | 2,202 | $ | 292 | $ | 458 | $ | 496 | $ | 956 | $ | 1,405 | |||||||||||||||||||||||||||
| USA Operations |
851 | 186 | 223 | 245 | 197 | 1,797 | 402 | 494 | 402 | 499 | 1,247 | |||||||||||||||||||||||||||||||||||||
| $1,344 | $ | 261 | $ | 314 | $ | 315 | $ | 454 | $ | 3,999 | $ | 694 | $ | 952 | $ | 898 | $ | 1,455 | $ | 2,652 | ||||||||||||||||||||||||||||
Operating Netback
Operating Netback is a common metric used in the oil and gas industry to measure operating performance by product. Operating Netbacks are calculated by determining product revenues, net of royalties and deducting costs associated with delivering the product to market, including production, mineral and other taxes, transportation and processing expense and operating expense. The Operating Netback calculation is shown in the Results of Operations section of this MD&A.
56 Encana Corporation | ANNUAL REPORT 2015
MD&A
PREPARED USING U.S. GAAP IN US$
Debt to Debt Adjusted Cash Flow
Debt to Debt Adjusted Cash Flow is a non-GAAP measure monitored by Management as an indicator of the Company’s overall financial strength. Debt Adjusted Cash Flow is a non-GAAP measure defined as Cash Flow on a trailing 12-month basis excluding interest expense after tax.
| ($ millions) | 2015 | 2014 | 2013 | |||||||||
| Debt |
$ | 5,363 | $ | 7,340 | $ | 7,124 | ||||||
| Cash Flow |
1,430 | 2,934 | 2,581 | |||||||||
| Interest Expense, after tax |
452 | 486 | 421 | |||||||||
| Debt Adjusted Cash Flow |
$ | 1,882 | $ | 3,420 | $ | 3,002 | ||||||
| Debt to Debt Adjusted Cash Flow |
2.8x | 2.1x | 2.4x | |||||||||
Debt to Adjusted Capitalization
Debt to Adjusted Capitalization is a non-GAAP measure which adjusts capitalization for historical ceiling test impairments that were recorded as at December 31, 2011. Management monitors Debt to Adjusted Capitalization as a proxy for Encana’s financial covenant under its credit facility agreements which require debt to adjusted capitalization to be less than 60 percent. Adjusted Capitalization includes debt, total shareholders’ equity and an equity adjustment for cumulative historical ceiling test impairments recorded as at December 31, 2011 in conjunction with the Company’s January 1, 2012 adoption of U.S. GAAP.
| ($ millions) | 2015 | 2014 | 2013 | |||||||||
| Debt |
$ | 5,363 | $ | 7,340 | $ | 7,124 | ||||||
| Total Shareholders’ Equity |
6,167 | 9,685 | 5,147 | |||||||||
| Equity Adjustment for Impairments at December 31, 2011 |
7,746 | 7,746 | 7,746 | |||||||||
| Adjusted Capitalization |
$ | 19,276 | $ | 24,771 | $ | 20,017 | ||||||
| Debt to Adjusted Capitalization |
28% | 30% | 36% | |||||||||
ANNUAL REPORT 2015 | Encana Corporation 57
MD&A
PREPARED USING U.S. GAAP IN US$
| Advisory |
Forward-Looking Statements
This document contains certain forward-looking statements or information (collectively, “forward-looking statements”) within the meaning of applicable securities legislation. Forward-looking statements include:
Readers are cautioned against unduly relying on forward-looking statements which, by their nature, involve numerous assumptions, risks and uncertainties that may cause such statements not to occur, or results to differ materially from those expressed or implied. These assumptions include:
58 Encana Corporation | ANNUAL REPORT 2015
MD&A
PREPARED USING U.S. GAAP IN US$
Risks and uncertainties that may affect these business outcomes include: the ability to generate sufficient Cash Flow to meet the Company’s obligations; risks inherent to closing announced divestitures on a timely basis or at all and adjustments that may reduce the expected proceeds and value to Encana; commodity price volatility; ability to secure adequate product transportation and potential pipeline curtailments; variability and discretion of Encana’s Board to declare and pay dividends, if any; the timing and costs of well, facilities and pipeline construction; business interruption and casualty losses or unexpected technical difficulties; counterparty and credit risk; risk and effect of a downgrade in credit rating, including below an investment-grade credit rating, and its impact on access to capital markets and other sources of liquidity; fluctuations in currency and interest rates; assumptions based upon the Company’s 2016 corporate guidance; failure to achieve anticipated results from cost and efficiency initiatives; risks inherent in marketing operations; risks associated with technology; changes in or interpretation of royalty, tax, environmental, greenhouse gas, carbon, accounting and other laws or regulations; the Company’s ability to acquire or find additional reserves; imprecision of reserves estimates and estimates of recoverable quantities of natural gas and liquids from resource plays and other sources not currently classified as proved, probable or possible reserves or economic contingent resources, including future net revenue estimates; risks associated with past and future divestitures of certain assets or other transactions or receive amounts contemplated under the transaction agreements (such transactions may include third-party capital investments, farm-outs or partnerships, which Encana may refer to from time to time as “partnerships” or “joint ventures” and the funds received in respect thereof which Encana may refer to from time to time as “proceeds”, “deferred purchase price” and/or “carry capital”, regardless of the legal form) as a result of various conditions not being met; and other risks and uncertainties impacting Encana’s business as described from time to time in its most recent MD&A, financial statements, AIF and Form 40-F, as filed on SEDAR and EDGAR.
Although Encana believes the expectations represented by such forward-looking statements are reasonable, there can be no assurance that such expectations will prove to be correct. Readers are cautioned that the assumptions, risks and uncertainties referenced above are not exhaustive. Forward-looking statements are made as of the date of this document and, except as required by law, Encana undertakes no obligation to update publicly or revise any forward-looking statements. The forward-looking statements contained in this document are expressly qualified by these cautionary statements.
Encana is required to disclose events and circumstances that occurred during the period to which this MD&A relates that are reasonably likely to cause actual results to differ materially from material forward-looking statements for a period that is not yet complete that Encana has previously disclosed to the public and the expected differences thereto. Such disclosure can be found in Encana’s news release dated February 24, 2016, which is available on Encana’s website at www.encana.com, on SEDAR at www.sedar.com and EDGAR at www.sec.gov.
ANNUAL REPORT 2015 | Encana Corporation 59
MD&A
PREPARED USING U.S. GAAP IN US$
Oil and Gas Information
NI 51-101 of the Canadian Securities Administrators imposes oil and gas disclosure standards for Canadian public companies engaged in oil and gas activities. The Canadian protocol disclosure is contained in Appendix A and under “Narrative Description of the Business” in the AIF. In addition, certain disclosures have been prepared in accordance with U.S. disclosure requirements. The Company’s U.S. protocol disclosure is included in Note 27 (unaudited) to the Company’s Consolidated Financial Statements for the year ended December 31, 2015 and in Appendix D of the AIF.
A description of the primary differences between the disclosure requirements under the Canadian standards and under the U.S. standards is set forth under the heading “Reserves and Other Oil and Gas Information” in the AIF.
Natural Gas, Oil and NGLs Conversions
The conversion of natural gas volumes to BOE is on the basis of six thousand cubic feet to one barrel. BOE is based on a generic energy equivalency conversion method primarily applicable at the burner tip and does not represent economic value equivalency at the wellhead. Readers are cautioned that BOE may be misleading, particularly if used in isolation.
Play and Resource Play
Play is a term used by Encana which encompasses resource plays, geological formations and conventional plays. Resource play is a term used by Encana to describe an accumulation of hydrocarbons known to exist over a large areal expanse and/or thick vertical section, which, when compared to a conventional play, typically has a lower geological and/or commercial development risk and lower average decline rate.
Additional Information
Further information regarding Encana Corporation, including its AIF, can be accessed under the Company’s public filings found on SEDAR at www.sedar.com, on EDGAR at www.sec.gov and on the Company’s website at www.encana.com.
60 Encana Corporation | ANNUAL REPORT 2015
MANAGEMENT
REPORT
Management Report
Management’s Responsibility for Consolidated Financial Statements
The accompanying Consolidated Financial Statements of Encana Corporation (the “Company”) are the responsibility of Management. The Consolidated Financial Statements have been prepared by Management in United States dollars in accordance with generally accepted accounting principles in the United States and include certain estimates that reflect Management’s best judgments.
The Company’s Board of Directors has approved the information contained in the Consolidated Financial Statements. The Board of Directors fulfills its responsibility regarding the financial statements mainly through its Audit Committee, which has a written mandate that complies with the current requirements of Canadian securities legislation and the United States Sarbanes-Oxley Act of 2002 and voluntarily complies, in principle, with the Audit Committee guidelines of the New York Stock Exchange. The Audit Committee meets at least on a quarterly basis.
Management’s Assessment of Internal Control over Financial Reporting
Management is also responsible for establishing and maintaining adequate internal control over the Company’s financial reporting. The internal control system was designed to provide reasonable assurance to the Company’s Management regarding the preparation and presentation of the Consolidated Financial Statements.
Internal control systems, no matter how well designed, have inherent limitations. Therefore, even those systems determined to be effective can provide only reasonable assurance with respect to financial statement preparation and presentation. Also, projections of any evaluation of effectiveness to future periods are subject to the risk that controls may become inadequate because of changes in conditions, or that the degree of compliance with the policies or procedures may deteriorate.
Management has assessed the design and effectiveness of the Company’s internal control over financial reporting as at December 31, 2015. In making its assessment, Management has used the Internal Control – Integrated Framework (2013) issued by the Committee of Sponsoring Organizations of the Treadway Commission to evaluate the effectiveness of the Company’s internal control over financial reporting. Based on our evaluation, Management has concluded that the Company’s internal control over financial reporting was effectively designed and operating effectively as at that date.
PricewaterhouseCoopers LLP, an independent firm of chartered professional accountants, was appointed by a vote of shareholders at the Company’s last annual meeting to audit and provide independent opinions on both the Consolidated Financial Statements and the Company’s internal control over financial reporting as at December 31, 2015, as stated in their Auditor’s Report. PricewaterhouseCoopers LLP has provided such opinions.

|

| |
| Douglas J. Suttles | Sherri A. Brillon | |
| President & | Executive Vice-President & | |
| Chief Executive Officer | Chief Financial Officer | |
February 29, 2016
ANNUAL REPORT 2015 | Encana Corporation 61
AUDITOR’S
REPORT
Auditor’s Report
Report of Independent Registered Public Accounting Firm
To the Shareholders of Encana Corporation
We have audited the accompanying Consolidated Balance Sheet of Encana Corporation as at December 31, 2015 and December 31, 2014 and the related Consolidated Statements of Earnings, Comprehensive Income, Changes in Shareholders’ Equity and Cash Flows for each of the years in the three-year period ended December 31, 2015. We also have audited Encana Corporation’s internal control over financial reporting as at December 31, 2015, based on criteria established in Internal Control - Integrated Framework (2013) issued by the Committee of Sponsoring Organizations of the Treadway Commission (COSO). Management is responsible for these Consolidated Financial Statements, for maintaining effective internal control over financial reporting, and for its assessment of the effectiveness of internal control over financial reporting, included in the accompanying Management’s Assessment of Internal Control over Financial Reporting. Our responsibility is to express an opinion on these Consolidated Financial Statements and an opinion on the company’s internal control over financial reporting based on our integrated audits.
We conducted our audits in accordance with the standards of the Public Company Accounting Oversight Board (United States). Those standards require that we plan and perform the audit to obtain reasonable assurance about whether the Consolidated Financial Statements are free of material misstatement and whether effective internal control over financial reporting was maintained in all material respects. Our audits of the Consolidated Financial Statements included examining, on a test basis, evidence supporting the amounts and disclosures in the Consolidated Financial Statements, assessing the accounting principles used and significant estimates made by management, and evaluating the overall consolidated financial statement presentation. Our audit of internal control over financial reporting included obtaining an understanding of internal control over financial reporting, assessing the risk that a material weakness exists, and testing and evaluating the design and operating effectiveness of internal control based on the assessed risk. Our audits also included performing such other procedures as we considered necessary in the circumstances. We believe that our audits provide a reasonable basis for our opinions.
A company’s internal control over financial reporting is a process designed to provide reasonable assurance regarding the reliability of financial reporting and the preparation of financial statements for external purposes in accordance with generally accepted accounting principles. A company’s internal control over financial reporting includes those policies and procedures that: (i) pertain to the maintenance of records that, in reasonable detail, accurately and fairly reflect the transactions and dispositions of the assets of the company; (ii) provide reasonable assurance that transactions are recorded as necessary to permit preparation of financial statements in accordance with generally accepted accounting principles, and that receipts and expenditures of the company are being made only in accordance with authorizations of management and directors of the company; and (iii) provide reasonable assurance regarding prevention or timely detection of unauthorized acquisition, use, or disposition of the company’s assets that could have a material effect on the financial statements. Because of its inherent limitations, internal control over financial reporting may not prevent or detect misstatements. Also, projections of any evaluation of effectiveness to future periods are subject to the risk that controls may become inadequate because of changes in conditions, or that the degree of compliance with the policies or procedures may deteriorate.
In our opinion, the Consolidated Financial Statements referred to above present fairly, in all material respects, the financial position of Encana Corporation as at December 31, 2015 and December 31, 2014 and the results of its operations and its cash flows for each of the years in the three-year period ended December 31, 2015 in conformity with accounting principles generally accepted in the United States of America. Also, in our opinion, Encana Corporation maintained, in all material respects, effective internal control over financial reporting as at December 31, 2015, based on criteria established in Internal Control - Integrated Framework (2013) issued by COSO.
62 Encana Corporation | ANNUAL REPORT 2015
AUDITOR’S
REPORT
As discussed in Note 1Y) to the Consolidated Financial Statements, Encana Corporation retrospectively changed its method of balance sheet classification for deferred taxes due to the adoption of ASU 2015-17, Balance Sheet Classification of Deferred Taxes, in December 2015.

PricewaterhouseCoopers LLP
Chartered Professional Accountants
Calgary, Alberta, Canada
February 29, 2016
ANNUAL REPORT 2015 | Encana Corporation 63
CONSOLIDATED FINANCIAL STATEMENTS PREPARED
IN ACCORDANCE WITH U.S. GAAP IN US$MM
Consolidated Statement of Earnings
| For the years ended December 31 ($ millions, except per share amounts) | 2015 | 2014 | 2013 | |||||||||||
| Revenues, Net of Royalties |
(Note 2) | $ | 4,422 | $ | 8,019 | $ | 5,858 | |||||||
| Expenses |
(Note 2) | |||||||||||||
|
Production, mineral and other taxes |
144 | 210 | 173 | |||||||||||
|
Transportation and processing |
1,252 | 1,496 | 1,467 | |||||||||||
|
Operating |
723 | 667 | 829 | |||||||||||
|
Purchased product |
323 | 1,191 | 441 | |||||||||||
|
Depreciation, depletion and amortization |
1,488 | 1,745 | 1,565 | |||||||||||
|
Impairments |
(Note 9) | 6,473 | - | 21 | ||||||||||
|
Accretion of asset retirement obligation |
(Note 15) | 45 | 52 | 53 | ||||||||||
|
Administrative |
(Note 20) | 275 | 327 | 439 | ||||||||||
|
Interest |
(Note 5) | 614 | 654 | 563 | ||||||||||
|
Foreign exchange (gain) loss, net |
(Note 6) | 1,082 | 403 | 325 | ||||||||||
|
(Gain) loss on divestitures |
(Notes 4, 18) | (14) | (3,426 | ) | (7 | ) | ||||||||
|
Other |
(Notes 3, 13) | 27 | 71 | 1 | ||||||||||
|
|
12,432 |
|
3,390 | 5,870 | ||||||||||
|
Net Earnings (Loss) Before Income Tax |
(8,010) | 4,629 | (12 | ) | ||||||||||
|
Income tax expense (recovery) |
(Note 7) | (2,845) | 1,203 | (248 | ) | |||||||||
|
Net Earnings (Loss) |
(5,165) | 3,426 | 236 | |||||||||||
|
Net earnings attributable to noncontrolling interest |
(Note 18) | - | (34 | ) | - | |||||||||
|
Net Earnings (Loss) Attributable to Common Shareholders |
$ | (5,165) | $ | 3,392 | $ | 236 | ||||||||
| Net Earnings (Loss) per Common Share |
||||||||||||||
|
Basic & Diluted |
(Note 16) | $ | (6.28) | $ | 4.58 | $ | 0.32 | |||||||
|
Consolidated Statement of Comprehensive Income |
||||||||||||||
|
For the years ended December 31 ($ millions) |
2015 | 2014 | 2013 | |||||||||||
| Net Earnings (Loss) |
$ | (5,165) | $ | 3,426 | $ | 236 | ||||||||
|
Other Comprehensive Income, Net of Tax |
||||||||||||||
|
Foreign currency translation adjustment |
(Note 17) | 668 | 22 | (46 | ) | |||||||||
|
Pension and other post-employment benefit plans |
(Notes 17, 22) | 33 | (17 | ) | 60 | |||||||||
|
Other Comprehensive Income |
701 | 5 | 14 | |||||||||||
|
Comprehensive Income (Loss) |
(4,464) | 3,431 | 250 | |||||||||||
|
Comprehensive Income Attributable to Noncontrolling Interest |
(Note 18) | - | (34 | ) | - | |||||||||
|
Comprehensive Income (Loss) Attributable to Common Shareholders |
$ | (4,464) | $ | 3,397 | $ | 250 | ||||||||
See accompanying Notes to Consolidated Financial Statements
64 Encana Corporation | ANNUAL REPORT 2015
CONSOLIDATED FINANCIAL STATEMENTS PREPARED
IN ACCORDANCE WITH U.S. GAAP IN US$MM
Consolidated Balance Sheet
| As at December 31 ($ millions) | 2015 | 2014 | ||||||||
| Assets |
||||||||||
|
Current Assets |
||||||||||
|
Cash and cash equivalents |
$ | 271 | $ | 338 | ||||||
|
Accounts receivable and accrued revenues |
(Note 8) | 645 | 1,307 | |||||||
|
Risk management |
(Notes 23, 24) | 367 | 707 | |||||||
|
Income tax receivable |
324 | 509 | ||||||||
| 1,607 | 2,861 | |||||||||
|
Property, Plant and Equipment, at cost: |
(Note 9) | |||||||||
|
Natural gas and oil properties, based on full cost accounting |
||||||||||
|
Proved properties |
40,647 | 42,615 | ||||||||
|
Unproved properties |
5,616 | 6,133 | ||||||||
|
Other |
2,181 | 2,711 | ||||||||
|
Property, plant and equipment |
48,444 | 51,459 | ||||||||
|
Less: Accumulated depreciation, depletion and amortization |
(38,587) | (33,444 | ) | |||||||
|
Property, plant and equipment, net |
(Note 2) | 9,857 | 18,015 | |||||||
|
Cash in Reserve |
2 | 73 | ||||||||
|
Other Assets |
(Note 10) | 296 | 394 | |||||||
|
Risk Management |
(Notes 23, 24) | 11 | 65 | |||||||
|
Deferred Income Taxes |
(Notes 1, 7) | 1,081 | 206 | |||||||
|
Goodwill |
(Notes 2, 3, 4, 11, 18) | 2,790 | 2,917 | |||||||
| (Note 2) |
$ |
15,644 |
|
$ | 24,531 | |||||
| Liabilities and Shareholders’ Equity |
||||||||||
|
Current Liabilities |
||||||||||
|
Accounts payable and accrued liabilities |
(Note 12) | $ | 1,311 | $ | 2,243 | |||||
|
Income tax payable |
6 | 15 | ||||||||
|
Risk management |
(Notes 23, 24) | 16 | 20 | |||||||
|
|
1,333 |
|
2,278 | |||||||
|
Long-Term Debt |
(Note 13) | 5,363 | 7,340 | |||||||
|
Other Liabilities and Provisions |
(Note 14) | 1,975 | 2,484 | |||||||
|
Risk Management |
(Notes 23, 24) | 9 | 7 | |||||||
|
Asset Retirement Obligation |
(Note 15) | 773 | 870 | |||||||
|
Deferred Income Taxes |
(Notes 1, 7) | 24 | 1,867 | |||||||
|
|
9,477 |
|
14,846 | |||||||
|
Commitments and Contingencies |
(Note 26) | |||||||||
|
Shareholders’ Equity |
||||||||||
|
Share capital - authorized unlimited
common shares, without par value |
(Note 16) | 3,621 | 2,450 | |||||||
|
Paid in surplus |
(Notes 18, 21) | 1,358 | 1,358 | |||||||
|
Retained earnings (Accumulated deficit) |
(202) | 5,188 | ||||||||
|
Accumulated other comprehensive income |
(Note 17) | 1,390 | 689 | |||||||
|
Total Shareholders’ Equity |
|
6,167 |
|
9,685 | ||||||
|
$ |
15,644 |
|
$ | 24,531 | ||||||
See accompanying Notes to Consolidated Financial Statements
Approved by the Board of Directors

|

| |
| Clayton H. Woitas | Jane L. Peverett | |
| Director | Director | |
ANNUAL REPORT 2015 | Encana Corporation 65
CONSOLIDATED FINANCIAL STATEMENTS PREPARED
IN ACCORDANCE WITH U.S. GAAP IN US$MM
Consolidated Statement of Changes in Shareholders’ Equity
| For the year ended December 31, 2015 ($ millions) | Share Capital |
Paid in Surplus |
Retained Earnings (Accumulated Deficit) |
Accumulated Other Comprehensive Income |
Non- Controlling Interest |
Total Shareholders’ Equity |
||||||||||||||||||||
| Balance, December 31, 2014 |
$ | 2,450 | $ | 1,358 | $ | 5,188 | $ | 689 | $ | - | $ | 9,685 | ||||||||||||||
|
Net Earnings (Loss) |
- | - | (5,165 | ) | - | - | (5,165 | ) | ||||||||||||||||||
|
Dividends on Common Shares |
(Note 16) | - | - | (225 | ) | - | - | (225 | ) | |||||||||||||||||
|
Common Shares Issued |
(Note 16) | 1,098 | - | - | - | - | 1,098 | |||||||||||||||||||
|
Common Shares Issued Under |
||||||||||||||||||||||||||
| Dividend Reinvestment Plan |
(Note 16) | 73 | - | - | - | - | 73 | |||||||||||||||||||
|
Other Comprehensive Income |
(Note 17) | - | - | - | 701 | - | 701 | |||||||||||||||||||
|
Balance, December 31, 2015 |
$ | 3,621 | $ | 1,358 | $ | (202 | ) | $ | 1,390 | $ | - | $ | 6,167 | |||||||||||||
| For the year ended December 31, 2014 ($ millions) | Share Capital |
Paid in Surplus |
Retained Earnings |
Accumulated Other Comprehensive Income |
Non- Controlling Interest |
Total Shareholders’ Equity |
||||||||||||||||||||
| Balance, December 31, 2013 |
$ | 2,445 | $ | 15 | $ | 2,003 | $ | 684 | $ | - | $ | 5,147 | ||||||||||||||
|
Share-Based Compensation |
(Note 21) | - | (2 | ) | - | - | - | (2 | ) | |||||||||||||||||
|
Net Earnings |
- | - | 3,392 | - | 34 | 3,426 | ||||||||||||||||||||
|
Dividends on Common Shares |
(Note 16) | - | - | (207 | ) | - | - | (207 | ) | |||||||||||||||||
|
Common Shares Issued Under |
||||||||||||||||||||||||||
| Dividend Reinvestment Plan |
(Note 16) | 5 | - | - | - | - | 5 | |||||||||||||||||||
|
Other Comprehensive Income |
(Note 17) | - | - | - | 5 | - | 5 | |||||||||||||||||||
|
Sale of Noncontrolling Interest |
(Note 18) | - | 1,345 | - | - | 117 | 1,462 | |||||||||||||||||||
|
Distributions to Noncontrolling |
||||||||||||||||||||||||||
|
Interest Owners |
(Note 18) | - | - | - | - | (18 | ) | (18 | ) | |||||||||||||||||
|
Sale of Investment in PrairieSky |
(Note 18) | - | - | - | - | (133 | ) | (133 | ) | |||||||||||||||||
|
Balance, December 31, 2014 |
$ | 2,450 | $ | 1,358 | $ | 5,188 | $ | 689 | $ | - | $ | 9,685 | ||||||||||||||
| For the year ended December 31, 2013 ($ millions) | Share Capital |
Paid in Surplus |
Retained Earnings |
Accumulated Other Comprehensive Income |
Non- Controlling Interest |
Total Shareholders’ Equity |
||||||||||||||||||||
| Balance, December 31, 2012 |
$ | 2,354 | $ | 10 | $ | 2,261 | $ | 670 | $ | - | $ | 5,295 | ||||||||||||||
|
Share-Based Compensation |
(Note 21) | - | 3 | - | - | - | 3 | |||||||||||||||||||
|
Net Earnings |
- | - | 236 | - | - | 236 | ||||||||||||||||||||
|
Common Shares Cancelled |
(2 | ) | 2 | - | - | - | - | |||||||||||||||||||
|
Dividends on Common Shares |
(Note 16) | - | - | (494 | ) | - | - | (494 | ) | |||||||||||||||||
|
Common Shares Issued Under |
||||||||||||||||||||||||||
|
Dividend Reinvestment Plan |
(Note 16) | 93 | - | - | - | - | 93 | |||||||||||||||||||
|
Other Comprehensive Income |
- | - | - | 14 | - | 14 | ||||||||||||||||||||
|
Balance, December 31, 2013 |
$ | 2,445 | $ | 15 | $ | 2,003 | $ | 684 | $ | - | $ | 5,147 | ||||||||||||||
See accompanying Notes to Consolidated Financial Statements
66 Encana Corporation | ANNUAL REPORT 2015
CONSOLIDATED FINANCIAL STATEMENTS PREPARED
IN ACCORDANCE WITH U.S. GAAP IN US$MM
Consolidated Statement of Cash Flows
| For the years ended December 31 ($ millions) | 2015 | 2014 | 2013 | |||||||||||
| Operating Activities |
||||||||||||||
|
Net earnings (loss) |
$ | (5,165) | $ | 3,426 | $ | 236 | ||||||||
|
Depreciation, depletion and amortization |
1,488 | 1,745 | 1,565 | |||||||||||
|
Impairments |
(Note 9) | 6,473 | - | 21 | ||||||||||
|
Accretion of asset retirement obligation |
(Note 15) | 45 | 52 | 53 | ||||||||||
|
Deferred income taxes |
(Note 7) | (2,811) | 960 | (57 | ) | |||||||||
|
Unrealized (gain) loss on risk management |
(Note 24) | 331 | (444 | ) | 345 | |||||||||
|
Unrealized foreign exchange (gain) loss |
(Note 6) | 687 | 440 | 330 | ||||||||||
|
Foreign exchange on settlements |
(Note 6) | 358 | 28 | 20 | ||||||||||
|
(Gain) loss on divestitures |
(Notes 4, 18) | (14) | (3,426 | ) | (7 | ) | ||||||||
|
Other |
38 | (62 | ) | 42 | ||||||||||
|
Net change in other assets and liabilities |
(11) | (43 | ) | (80 | ) | |||||||||
|
Net change in non-cash working capital |
(Note 25) | 262 | (9 | ) | (179 | ) | ||||||||
|
Cash From (Used in) Operating Activities |
1,681 | 2,667 | 2,289 | |||||||||||
|
Investing Activities |
||||||||||||||
|
Capital expenditures |
(Note 2) | (2,232) | (2,526 | ) | (2,712 | ) | ||||||||
|
Acquisitions |
(Note 4) | (70) | (3,016 | ) | (184 | ) | ||||||||
|
Corporate acquisition |
(Note 3) | - | (5,962 | ) | - | |||||||||
|
Proceeds from divestitures |
(Note 4) | 1,908 | 4,345 | 705 | ||||||||||
|
Proceeds from sale of investment in PrairieSky |
(Notes 4, 18) | - | 2,172 | - | ||||||||||
|
Cash in reserve |
71 | (63 | ) | 44 | ||||||||||
|
Net change in investments and other |
(342) | 321 | 252 | |||||||||||
|
Cash From (Used in) Investing Activities |
(665) | (4,729 | ) | (1,895 | ) | |||||||||
|
Financing Activities |
||||||||||||||
|
Net issuance (repayment) of revolving long-term debt |
(Notes 3, 13) | (627) | 942 | - | ||||||||||
|
Repayment of long-term debt |
(Note 13) | (1,302) | (2,152 | ) | (500 | ) | ||||||||
|
Issuance of common shares |
(Note 16) | 1,088 | - | - | ||||||||||
|
Dividends on common shares |
(Note 16) | (152) | (202 | ) | (401 | ) | ||||||||
|
Proceeds from sale of noncontrolling interest |
(Note 18) | - | 1,462 | - | ||||||||||
|
Distributions to noncontrolling interest owners |
(Note 18) | - | (18 | ) | - | |||||||||
|
Capital lease payments and other financing arrangements |
(Note 14) | (61) | (71 | ) | (8 | ) | ||||||||
|
Cash From (Used in) Financing Activities |
(1,054) | (39 | ) | (909 | ) | |||||||||
|
Foreign Exchange Gain (Loss) on Cash and Cash Equivalents Held in Foreign Currency |
(29) | (127 | ) | (98 | ) | |||||||||
|
Increase (Decrease) in Cash and Cash Equivalents |
(67) | (2,228 | ) | (613 | ) | |||||||||
|
Cash and Cash Equivalents, Beginning of Year |
338 | 2,566 | 3,179 | |||||||||||
|
Cash and Cash Equivalents, End of Year |
$ | 271 | $ | 338 | $ | 2,566 | ||||||||
| Cash, End of Year |
$ | 58 | $ | 142 | $ | 161 | ||||||||
|
Cash Equivalents, End of Year |
213 | 196 | 2,405 | |||||||||||
|
Cash and Cash Equivalents, End of Year |
$ | 271 | $ | 338 | $ | 2,566 | ||||||||
| Supplementary Cash Flow Information |
(Note 25) | |||||||||||||
See accompanying Notes to Consolidated Financial Statements
ANNUAL REPORT 2015 | Encana Corporation 67
CONSOLIDATED FINANCIAL STATEMENTS PREPARED
IN ACCORDANCE WITH U.S. GAAP IN US$MM
| Notes to Consolidated Financial Statements |
| (All amounts in $ millions, unless otherwise specified) |
| 1. | Summary of Significant Accounting Policies |
| A) | NATURE OF OPERATIONS |
Encana Corporation and its subsidiaries (“Encana” or “the Company”) are in the business of the exploration for, the development of, and the production and marketing of natural gas, oil and natural gas liquids (“NGLs”). The term liquids is used to represent Encana’s oil, NGLs and condensate.
| B) | BASIS OF PRESENTATION |
The Consolidated Financial Statements include the accounts of Encana and are presented in accordance with accounting principles generally accepted in the United States (“U.S. GAAP”).
In these Consolidated Financial Statements, unless otherwise indicated, all dollar amounts are expressed in United States (“U.S.”) dollars. Encana’s financial results are consolidated in Canadian dollars; however, the Company has adopted the U.S. dollar as its reporting currency to facilitate a more direct comparison to other North American oil and gas companies. All references to US$ or to $ are to United States dollars and references to C$ are to Canadian dollars.
| C) | PRINCIPLES OF CONSOLIDATION |
The Consolidated Financial Statements include the accounts of Encana and entities in which it holds a controlling interest. The noncontrolling interest represented the third party equity ownership in a former consolidated subsidiary, PrairieSky Royalty Ltd. (“PrairieSky”), as presented in the Consolidated Statement of Changes in Shareholders’ Equity. As of September 26, 2014, Encana no longer held an interest in PrairieSky. See Note 18 for further details regarding the noncontrolling interest. All intercompany balances and transactions are eliminated on consolidation. For upstream joint interest operations where Encana retains an undivided interest in jointly owned property, the Company records its proportionate share of assets, liabilities, revenues and expenses. Investments in non-controlled entities over which Encana has the ability to exercise significant influence are accounted for using the equity method.
| D) | FOREIGN CURRENCY TRANSLATION |
Monetary assets and liabilities of the Company that are denominated in foreign currencies are translated at the rates of exchange in effect at the period end date. Any gains or losses are recorded in the Consolidated Statement of Earnings. Foreign currency revenues and expenses are translated at the rates of exchange in effect at the time of the transaction.
Assets and liabilities of foreign operations are translated at period end exchange rates, while the related revenues and expenses are translated using average rates over the period. Translation gains and losses relating to the foreign operations are included in accumulated other comprehensive income (“AOCI”). Recognition of Encana’s accumulated translation gains and losses into net earnings occurs upon complete or substantially complete liquidation of the Company’s investment in the foreign operation.
For financial statement presentation, assets and liabilities are translated into the reporting currency at period end exchange rates, while revenues and expenses are translated using average rates over the period. Gains and losses relating to the financial statement translation are included in AOCI.
| E) | USE OF ESTIMATES |
Preparation of the Consolidated Financial Statements in conformity with U.S. GAAP requires Management to make informed estimates and assumptions and use judgments that affect reported amounts of assets and liabilities and disclosures of contingent assets and liabilities at the date of the Consolidated Financial Statements and the reported amounts of revenues and expenses during the period. Such estimates primarily relate to
68 Encana Corporation | ANNUAL REPORT 2015
CONSOLIDATED FINANCIAL STATEMENTS PREPARED
IN ACCORDANCE WITH U.S. GAAP IN US$MM
| Notes to Consolidated Financial Statements |
| (All amounts in $ millions, unless otherwise specified) |
unsettled transactions and events as of the date of the Consolidated Financial Statements. Accordingly, actual results may differ from estimated amounts as future events occur.
Significant items subject to estimates and assumptions are:
| · | Estimates of proved reserves and related future cash flows used for depletion and ceiling test impairment calculations |
| · | Estimated fair value of long-term assets used for impairment calculations |
| · | Fair value of reporting units used for the assessment of goodwill |
| · | Estimates of future taxable earnings used to assess the realizable value of deferred tax assets |
| · | Fair value of asset retirement obligations and costs |
| · | Fair value of derivative instruments |
| · | Fair value attributed to assets acquired and liabilities assumed in business combinations |
| · | Tax interpretations, regulations and legislation in the various jurisdictions in which the Company and its subsidiaries operate |
| · | Accruals for long-term performance-based compensation arrangements, including whether or not the performance criteria will be met and measurement of the ultimate payout amount |
| · | Recognized values of pension assets and obligations, as well as the pension costs charged to net earnings, depend on certain actuarial and economic assumptions |
| · | Accruals for legal claims, environmental risks and exposures |
| F) | REVENUE RECOGNITION |
Revenues associated with Encana’s natural gas and liquids are recognized when production is sold to a purchaser at a fixed or determinable price, delivery has occurred, title has transferred and collectability of the revenue is probable. Realized gains and losses from the Company’s financial derivatives related to natural gas and oil commodity prices are recognized in revenue when the contract is settled. Unrealized gains and losses related to these contracts are recognized in revenue based on the changes in fair value of the contracts at the end of the respective periods.
Market optimization revenues and purchased product expenses are recorded on a gross basis when Encana takes title to the product and has the risks and rewards of ownership. Purchases and sales of products that are entered into in contemplation of each other with the same counterparty are recorded on a net basis. Revenues associated with the services provided where Encana acts as agent are recorded as the services are provided.
| G) | PRODUCTION, MINERAL AND OTHER TAXES |
Costs paid by Encana for taxes based on production or revenues from natural gas and liquids are recognized when the product is produced. Costs paid by Encana for taxes on the valuation of upstream assets and reserves are recognized when incurred.
| H) | TRANSPORTATION AND PROCESSING |
Costs paid by Encana for the transportation and processing of natural gas and liquids are recognized when the product is delivered and the services provided.
| I) | OPERATING |
Operating costs paid by Encana for oil and gas properties in which the Company has a working interest. Expenses are net of amounts capitalized in accordance with the full cost method of accounting.
ANNUAL REPORT 2015 | Encana Corporation 69
CONSOLIDATED FINANCIAL STATEMENTS PREPARED
IN ACCORDANCE WITH U.S. GAAP IN US$MM
| Notes to Consolidated Financial Statements |
| (All amounts in $ millions, unless otherwise specified) |
| J) | EMPLOYEE BENEFIT PLANS |
The Company sponsors defined contribution and defined benefit plans, providing pension and other post-employment benefits to its employees in Canada and the U.S. As of January 1, 2003, the defined benefit pension plan was closed to new entrants.
Pension expense for the defined contribution pension plan is recorded as the benefits are earned by the employees covered by the plans. Encana accrues for its obligations under its employee defined benefit plans, net of plan assets. The cost of defined benefit pensions and other post-employment benefits is actuarially determined using the projected benefit method based on length of service and reflects Management’s best estimate of salary escalation, retirement ages of employees and expected future health care costs. The expected return on plan assets is based on historical and projected rates of return for assets in the investment plan portfolio. The actual return is based on the fair value of plan assets. The projected benefit obligation is discounted using the market interest rate on high-quality corporate debt instruments as at the measurement date.
Pension expense for the defined benefit pension plan includes the cost of pension benefits earned during the current year, the interest cost on pension obligations, the expected return on pension plan assets, the amortization of adjustments arising from pension plan amendments, the amortization of prior service costs, and the amortization of the excess of the net actuarial gain or loss over 10 percent of the greater of the benefit obligation and the fair value of plan assets. Amortization is on a straight-line basis over a period covering the expected average remaining service lives of employees covered by the plans. Actuarial gains and losses related to the change in the over-funded or under-funded status of the defined benefit pension plan and other post-employment benefit plans are recognized in other comprehensive income.
| K) | INCOME TAXES |
Encana follows the liability method of accounting for income taxes. Under this method, deferred income taxes are recorded for the effect of any temporary difference between the accounting and income tax basis of an asset or liability, using the enacted income tax rates and laws expected to apply when the assets are realized and liabilities are settled. Current income taxes are measured at the amount expected to be recoverable from or payable to the taxation authorities based on the income tax rates and laws enacted at the end of the reporting period. The effect of a change in the enacted tax rates or laws is recognized in net earnings in the period of enactment. Income taxes are recognized in net earnings except to the extent that they relate to items recognized directly in shareholders’ equity, in which case the income taxes are recognized directly in shareholders’ equity.
Deferred income tax assets are routinely assessed for realizability. If it is more likely than not that deferred tax assets will not be realized, a valuation allowance is recorded to reduce the deferred tax assets. Encana considers available positive and negative evidence when assessing the realizability of deferred tax assets including historic and expected future taxable earnings, available tax planning strategies and carry forward periods. The assumptions used in determining expected future taxable earnings are consistent with those used in the goodwill impairment assessment.
Encana recognizes the financial statement effects of a tax position when it is more likely than not, based on the technical merits, that the position will be sustained upon examination by a taxing authority. A recognized tax position is initially and subsequently measured as the largest amount of tax benefit that is greater than 50 percent likely of being realized upon settlement with a taxing authority. Liabilities for unrecognized tax benefits that are not expected to be settled within the next 12 months are included in other liabilities and provisions.
| L) | EARNINGS PER SHARE AMOUNTS |
Basic net earnings per common share is computed by dividing the net earnings by the weighted average number of common shares outstanding during the period. Diluted net earnings per common share amounts are calculated giving effect to the potential dilution that would occur if stock options were exercised or other contracts to issue common shares were exercised, fully vested, or converted to common shares. The treasury stock method is used to determine the dilutive effect of stock options and other dilutive instruments. The treasury stock method
70 Encana Corporation | ANNUAL REPORT 2015
CONSOLIDATED FINANCIAL STATEMENTS PREPARED
IN ACCORDANCE WITH U.S. GAAP IN US$MM
| Notes to Consolidated Financial Statements |
| (All amounts in $ millions, unless otherwise specified) |
assumes that proceeds received from the exercise of in-the-money stock options and other dilutive instruments are used to repurchase common shares at the average market price.
| M) | CASH AND CASH EQUIVALENTS |
Cash and cash equivalents include cash on hand and short-term investments, such as money market deposits or similar type instruments, with a maturity of three months or less when purchased. Outstanding disbursements issued in excess of applicable bank account balances are excluded from cash and cash equivalents and are recorded in accounts payable and accrued liabilities. Cash in reserve represents cash amounts segregated or held in escrow which are not available for general operating use.
| N) | PROPERTY, PLANT AND EQUIPMENT |
UPSTREAM
Encana uses the full cost method of accounting for its acquisition, exploration and development activities. Under this method, all costs directly associated with the acquisition of, the exploration for, and the development of natural gas and liquids reserves are capitalized on a country-by-country cost centre basis. Capitalized costs exclude costs relating to production, general overhead or similar activities.
Under the full cost method of accounting, the carrying amount of Encana’s natural gas and oil properties within each country cost centre is subject to a ceiling test performed quarterly. A ceiling test impairment is recognized in net earnings when the carrying amount of a country cost centre exceeds the country cost centre ceiling. The carrying amount of a cost centre includes capitalized costs of proved oil and gas properties, net of accumulated depletion and the related deferred income taxes.
The cost centre ceiling is the sum of the estimated after-tax future net cash flows from proved reserves, using the 12-month average trailing prices and unescalated future development and production costs, discounted at 10 percent, plus unproved property costs. The 12-month average trailing price is calculated as the average of the price on the first day of each month within the trailing 12-month period. Any excess of the carrying amount over the calculated ceiling amount is recognized as an impairment in net earnings.
Capitalized costs accumulated within each cost centre are depleted using the unit-of-production method based on proved reserves. Depletion is calculated using the capitalized costs, including estimated retirement costs, plus the undiscounted future expenditures to be incurred in developing proved reserves.
Costs associated with unproved properties are excluded from the depletion calculation until it is determined that proved reserves are attributable or impairment has occurred. Unproved properties are assessed separately for impairment on a quarterly basis. Costs that have been impaired are included in the costs subject to depletion within the full cost pool.
Proceeds from the divestiture of properties are normally deducted from the full cost pool without recognition of gain or loss unless the deduction significantly alters the relationship between capitalized costs and proved reserves in the cost centre, in which case a gain or loss is recognized in net earnings. Generally, a gain or loss on a divestiture would be recognized when 25 percent or more of the Company’s proved reserves quantities in a particular country are sold. For divestitures that result in the recognition of a gain or loss on the sale and constitute a business, goodwill is allocated to the divestiture.
CORPORATE
Costs associated with office furniture, fixtures, leasehold improvements, information technology and aircraft are carried at cost and depreciated on a straight-line basis over the estimated service lives of the assets, which range from three to 25 years. Costs associated with The Bow office building are carried at cost and depreciated on a straight-line basis over the 60-year estimated life of the building. Assets under construction are not subject to depreciation until put into use. Land is carried at cost.
ANNUAL REPORT 2015 | Encana Corporation 71
CONSOLIDATED FINANCIAL STATEMENTS PREPARED
IN ACCORDANCE WITH U.S. GAAP IN US$MM
| Notes to Consolidated Financial Statements |
| (All amounts in $ millions, unless otherwise specified) |
| O) | CAPITALIZATION OF COSTS |
Expenditures related to renewals or betterments that improve the productive capacity or extend the life of an asset are capitalized. Maintenance and repairs are expensed as incurred. Interest is capitalized during the construction phase of major development projects.
| P) | BUSINESS COMBINATIONS |
Business combinations are accounted for using the acquisition method. The acquired identifiable net assets are measured at their fair value at the date of acquisition. Deferred taxes are recognized for any differences between the fair value of net assets acquired and their tax bases. Any excess of the purchase price over the fair value of the net assets acquired is recognized as goodwill. Any deficiency of the purchase price below the fair value of the net assets acquired is recorded as a gain in net earnings. Associated transaction costs are expensed when incurred.
| Q) | GOODWILL |
Goodwill, which represents the excess of purchase price over fair value of net assets acquired, is assessed for impairment at least annually at December 31. Goodwill and all other assets and liabilities are allocated to reporting units, which are Encana’s country cost centres. To assess impairment, the carrying amount of each reporting unit is determined and compared to the fair value of the reporting unit. If the carrying amount of the reporting unit is higher than its related fair value then goodwill is written down to the reporting unit’s implied fair value of goodwill. The implied fair value of goodwill is determined by deducting the fair value of the reporting unit’s assets and liabilities from the fair value of the reporting unit as if the reporting entity had been acquired in a business combination. Any excess of the carrying value of goodwill over the implied fair value of goodwill is recognized as an impairment and charged to net earnings. Subsequent measurement of goodwill is at cost less any accumulated impairments.
| R) | IMPAIRMENT OF LONG-TERM ASSETS |
The carrying value of long-term assets, excluding goodwill and upstream assets included in property, plant and equipment, is assessed for impairment when indicators suggest that the carrying value of an asset or asset group may not be recoverable. If the carrying amount exceeds the sum of the undiscounted cash flows expected to result from the continued use and eventual disposition of the asset or asset group, an impairment is recognized for the excess of the carrying amount over its estimated fair value.
| S) | ASSET RETIREMENT OBLIGATION |
Asset retirement obligations are those legal obligations where the Company will be required to retire tangible long-lived assets such as producing well sites, offshore production platforms and natural gas processing plants. The fair value of estimated asset retirement obligations is recognized in the Consolidated Balance Sheet when incurred and a reasonable estimate of fair value can be made. The asset retirement cost, equal to the initially estimated fair value of the asset retirement obligation, is capitalized as part of the cost of the related long-lived asset. Changes in the estimated obligation resulting from revisions to estimated timing or amount of future cash flows are recognized as a change in the asset retirement obligation and the related asset retirement cost.
Amortization of asset retirement costs is included in depreciation, depletion and amortization in the Consolidated Statement of Earnings. Increases in the asset retirement obligations resulting from the passage of time are recorded as accretion of asset retirement obligation in the Consolidated Statement of Earnings.
Actual expenditures incurred are charged against the accumulated asset retirement obligation.
72 Encana Corporation | ANNUAL REPORT 2015
CONSOLIDATED FINANCIAL STATEMENTS PREPARED
IN ACCORDANCE WITH U.S. GAAP IN US$MM
| Notes to Consolidated Financial Statements |
| (All amounts in $ millions, unless otherwise specified) |
| T) | STOCK-BASED COMPENSATION |
Obligations for payments of cash or common shares under Encana’s stock-based compensation plans are accrued over the vesting period, net of forfeitures, using fair values. Fair values are determined using observable share prices and/or pricing models such as the Black-Scholes-Merton option-pricing model. For equity-settled stock-based compensation plans, fair values are determined at the grant date and are recognized over the vesting period as compensation costs with a corresponding credit to shareholders’ equity. For cash-settled stock-based compensation plans, fair values are determined at each reporting date and periodic changes are recognized as compensation costs, with a corresponding change to liabilities.
| U) | LEASES |
Leases entered into for the use of an asset are classified as either capital or operating leases. Capital leases transfer to the Company substantially all of the risks and benefits incidental to ownership of the leased item. Capital leases are capitalized upon commencement of the lease term at the lower of the fair value of the leased asset or the present value of the minimum lease payments. Capitalized leased assets are amortized over the estimated useful life of the asset if the lease arrangement contains a bargain purchase option or ownership of the leased asset transfers at the end of the lease term. Otherwise, the leased assets are amortized over the lease term. Amortization of capitalized leased assets is included in depreciation, depletion and amortization in the Consolidated Statement of Earnings. All other leases are classified as operating leases and the payments are recognized on a straight-line basis over the lease term.
| V) | FAIR VALUE MEASUREMENTS |
Fair value is defined as the price that would be received to sell an asset or paid to transfer a liability in an orderly transaction between market participants at the measurement date. Valuation techniques include the market, income and cost approach. The market approach uses information generated by market transactions involving identical or comparable assets or liabilities; the income approach converts estimated future amounts to a present value; the cost approach is based on the amount that currently would be required to replace an asset.
Inputs used in determining fair value are characterized according to a hierarchy that prioritizes those inputs based on the degree to which they are observable. The three input levels of the fair value hierarchy are as follows:
| · | Level 1 - Inputs represent quoted prices in active markets for identical assets or liabilities, such as exchange-traded commodity derivatives. |
| · | Level 2 - Inputs other than quoted prices included within Level 1 that are observable for the asset or liability, either directly or indirectly, such as quoted market prices for similar assets or liabilities in active markets or other market corroborated inputs. |
| · | Level 3 - Inputs that are not observable from objective sources, such as forward prices supported by little or no market activity or internally developed estimates of future cash flows used in a present value model. |
In determining fair value, the Company utilizes the most observable inputs available. If a fair value measurement reflects inputs at multiple levels within the hierarchy, the fair value measurement is characterized based on the lowest level of input that is significant to the fair value measurement.
The carrying amount of cash and cash equivalents, accounts receivable and accounts payable reported on the Consolidated Balance Sheet approximates fair value. The fair value of long-term debt is disclosed in Note 13. Fair value information related to pension plan assets is included in Note 22. Recurring fair value measurements are performed for risk management assets and liabilities and other derivative contracts as discussed in Note 23.
Certain non-financial assets and liabilities are initially measured at fair value, such as asset retirement obligations and assets and liabilities acquired in business combinations or certain non-monetary exchange transactions.
ANNUAL REPORT 2015 | Encana Corporation 73
CONSOLIDATED FINANCIAL STATEMENTS PREPARED
IN ACCORDANCE WITH U.S. GAAP IN US$MM
| Notes to Consolidated Financial Statements |
| (All amounts in $ millions, unless otherwise specified) |
| W) | RISK MANAGEMENT ASSETS AND LIABILITIES |
Risk management assets and liabilities are derivative financial instruments used by Encana to manage economic exposure to market risks relating to commodity prices, foreign currency exchange rates and interest rates. The use of these derivative instruments is governed under formal policies and is subject to limits established by the Board of Directors (“Board”). The Company’s policy is not to utilize derivative financial instruments for speculative purposes.
Derivative instruments that do not qualify for the normal purchases and sales exemption are measured at fair value with changes in fair value recognized in net earnings. The fair values recorded in the Consolidated Balance Sheet reflect netting the asset and liability positions where counterparty master netting arrangements contain provisions for net settlement. Realized gains or losses from financial derivatives related to natural gas and oil commodity prices are recognized in revenues as the contracts are settled. Realized gains or losses from financial derivatives related to power commodity prices are recognized in transportation and processing expense as the related power contracts are settled. Realized gains or losses from other derivative contracts related to certain payment obligations are recognized in revenues as the obligations are settled. Unrealized gains and losses are recognized in revenues and transportation and processing expense accordingly, at the end of each respective reporting period based on the changes in fair value of the contracts.
| X) | COMMITMENTS AND CONTINGENCIES |
Liabilities for loss contingencies arising from claims, assessments, litigation, environmental and other sources are recorded when it is probable that a liability has been incurred and the amount can be reasonably estimated. These accruals are adjusted as additional information becomes available or circumstances change.
| Y) | RECENT ACCOUNTING PRONOUNCEMENTS |
CHANGES IN ACCOUNTING POLICIES AND PRACTICES
On January 1, 2015, Encana adopted Accounting Standards Update (“ASU”) 2014-08, “Reporting Discontinued Operations and Disclosures of Disposals of Components of an Entity” as issued by the Financial Accounting Standards Board (“FASB”). The update amends the criteria and expands the disclosures for reporting discontinued operations. Under the new criteria, only disposals representing a strategic shift in operations would qualify as a discontinued operation. The amendments have been applied prospectively and have not had a material impact on the Company’s Consolidated Financial Statements.
On December 31, 2015, Encana early adopted ASU 2015-17, “Balance Sheet Classification of Deferred Taxes” which requires deferred income tax assets and liabilities to be classified as non-current on the balance sheet. Previously, deferred income tax assets and liabilities were classified as current and non-current on the balance sheet. The amendments have been applied retrospectively and had no impact on the Company’s results of operations or cash flows. The impacts on the Company’s Consolidated Balance Sheets are as follows:
| As at December 31 ($ millions) | 2015 | 2014 | ||||||||
| Prior to Adoption of ASU 2015-17: |
||||||||||
| Deferred Income Taxes |
||||||||||
| Current Assets |
$ | 22 | $ | - | ||||||
| Non-current Assets |
1,060 | 296 | ||||||||
| Current Liabilities |
1 | 128 | ||||||||
| Non-current Liabilities |
24 | 1,829 | ||||||||
| Adoption of ASU 2015-17: |
||||||||||
| Deferred Income Taxes |
||||||||||
| Non-current Assets |
$ | 1,081 | $ | 206 | ||||||
| Non-current Liabilities |
24 | 1,867 | ||||||||
74 Encana Corporation | ANNUAL REPORT 2015
CONSOLIDATED FINANCIAL STATEMENTS PREPARED
IN ACCORDANCE WITH U.S. GAAP IN US$MM
| Notes to Consolidated Financial Statements |
| (All amounts in $ millions, unless otherwise specified) |
NEW STANDARDS ISSUED NOT YET ADOPTED
As of January 1, 2016, Encana will be required to adopt the following pronouncements issued by FASB:
| · | ASU 2014-12, “Compensation - Stock Compensation: Accounting for Share-Based Payments When the Terms of an Award Provide That a Performance Target Could Be Achieved After the Requisite Service Period”. The update requires that a performance target that affects vesting and could be achieved after the requisite service period be treated as a performance condition. The amendments will be applied prospectively and are not expected to have a material impact on the Company’s Consolidated Financial Statements. |
| · | ASU 2015-02, “Amendments to the Consolidation Analysis”. The update requires limited partnerships and similar entities to be evaluated under the variable interest and voting interest models, eliminate the presumption that a general partner should consolidate a limited partnership, and simplify the identification of variable interests and related effect on the primary beneficiary criterion when fees are paid to a decision maker. The amendments can be applied using either a full retrospective approach or a modified retrospective approach at the date of adoption. The amendments are not expected to have a material impact on the Company’s Consolidated Financial Statements. |
| · | ASU 2015-03, “Simplifying the Presentation of Debt Issuance Costs”. The update requires debt issuance costs to be presented on the balance sheet as a deduction from the carrying amount of the related liability. Currently, debt issuance costs are presented as a deferred charge within assets. In August 2015, the FASB issued ASU 2015-15, “Presentation and Subsequent Measurement of Debt Issuance Costs Associated with Line-of-Credit Arrangements”. The update further clarifies that regardless of whether there are outstanding borrowings, debt issuance costs arising from credit arrangements can be presented as an asset and subsequently amortized ratably over the term of the arrangement. These amendments will be applied retrospectively. As at December 31, 2015, $30 million of debt issuance costs were presented in Other Assets on the Company’s Consolidated Balance Sheet (2014 – $39 million). |
As of January 1, 2018, Encana will be required to adopt ASU 2014-09, “Revenue from Contracts with Customers” under Topic 606, which was the result of a joint project by the FASB and International Accounting Standards Board. The new standard replaces Topic 605, “Revenue Recognition”, and other industry-specific guidance in the Accounting Standards Codification. The new standard is based on the principle that revenue is recognized on the transfer of promised goods or services to customers in an amount that reflects the consideration the company expects to be entitled to in exchange for those goods or services. In August 2015, the FASB issued ASU 2015-14, “Deferral of Effective Date for Revenue from Contracts with Customers”, which deferred the effective date of ASU 2014-09, but permits early adoption using the original effective date of January 1, 2017. The standard can be applied using one of two retrospective application methods at the date of adoption. Encana is currently assessing the potential impact of the standard on the Company’s Consolidated Financial Statements.
ANNUAL REPORT 2015 | Encana Corporation 75
CONSOLIDATED FINANCIAL STATEMENTS PREPARED
IN ACCORDANCE WITH U.S. GAAP IN US$MM
| Notes to Consolidated Financial Statements |
| (All amounts in $ millions, unless otherwise specified) |
| 2. Segmented Information |
Encana’s reportable segments are determined based on the Company’s operations and geographic locations as follows:
| · | Canadian Operations includes the exploration for, development of, and production of natural gas, oil and NGLs and other related activities within the Canadian cost centre. |
| · | USA Operations includes the exploration for, development of, and production of natural gas, oil and NGLs and other related activities within the U.S. cost centre. |
| · | Market Optimization is primarily responsible for the sale of the Company’s proprietary production. These results are included in the Canadian and USA Operations. Market optimization activities include third party purchases and sales of product to provide operational flexibility and cost mitigation for transportation commitments, product type, delivery points and customer diversification. These activities are reflected in the Market Optimization segment. Market Optimization sells substantially all of the Company’s upstream production to third party customers. Transactions between segments are based on market values and are eliminated on consolidation. |
Corporate and Other mainly includes unrealized gains or losses recorded on derivative financial instruments. Once the instruments are settled, the realized gains and losses are recorded in the reporting segment to which the derivative instruments relate.
The Consolidated Statement of Earnings for the comparative periods ended December 31, 2014 and December 31, 2013 and the accompanying segmented information disclosed in this note have been updated to present property taxes and certain other levied charges within production, mineral and other taxes. Formerly, these property taxes and other charges were presented in either transportation and processing expense or operating expense. Encana has updated its presentation to more accurately reflect these charges within the Consolidated Statement of Earnings based on the nature of the expense recognized and to more closely align with the Company’s peers. As a result, for the year ended December 31, 2014, the Canadian Operations has reclassified $9 million (2013 – $9 million) from transportation and processing expense and $40 million (2013 – $36 million) from operating expense to production, mineral and other taxes. In addition, for the year ended December 31, 2014, the USA Operations has reclassified $28 million (2013 – $6 million) from operating expense to production, mineral and other taxes.
76 Encana Corporation | ANNUAL REPORT 2015
CONSOLIDATED FINANCIAL STATEMENTS PREPARED
IN ACCORDANCE WITH U.S. GAAP IN US$MM
| Notes to Consolidated Financial Statements |
| (All amounts in $ millions, unless otherwise specified) |
Results of Operations
Segment and Geographic Information
| Canadian Operations | USA Operations | Market Optimization | ||||||||||||||||||||||||||||||
| For the years ended December 31 | 2015 | 2014 | 2013 | 2015 | 2014 | 2013 | 2015 | 2014 | 2013 | |||||||||||||||||||||||
| Revenues, Net of Royalties |
$ | 1,822 | $ | 3,310 | $ 2,824 | $ 2,491 | $ | 2,902 | $ | 2,763 | $ | 365 | $ | 1,248 | $ | 512 | ||||||||||||||||
| Expenses |
||||||||||||||||||||||||||||||||
| Production, mineral and other taxes |
28 | 64 | 60 | 116 | 146 | 113 | - | - | - | |||||||||||||||||||||||
| Transportation and processing |
654 | 826 | 747 | 580 | 658 | 722 | 12 | - | - | |||||||||||||||||||||||
| Operating |
152 | 274 | 336 | 519 | 326 | 417 | 33 | 39 | 38 | |||||||||||||||||||||||
| Purchased product |
- | - | - | - | - | - | 323 | 1,191 | 441 | |||||||||||||||||||||||
| 988 | 2,146 | 1,681 | 1,276 | 1,772 | 1,511 | (3 | ) | 18 | 33 | |||||||||||||||||||||||
| Depreciation, depletion and amortization |
305 | 625 | 601 |
1,088 |
992 | 818 | - | 4 | 12 | |||||||||||||||||||||||
| Impairments |
- | - | - |
6,473 |
- | - | - | - | - | |||||||||||||||||||||||
| $ | 683 | $ | 1,521 | $ 1,080 | $ (6,285) | $ | 780 | $ | 693 | $ | (3 | ) | $ | 14 | $ | 21 | ||||||||||||||||
| Corporate & Other | Consolidated | |||||||||||||||||||||||||||||||
| 2015 | 2014 | 2013 | 2015 | 2014 | 2013 | |||||||||||||||||||||||||||
| Revenues, Net of Royalties |
$ (256) | $ | 559 | $ | (241 | ) | $ | 4,422 | $ | 8,019 | $ | 5,858 | ||||||||||||||||||||
| Expenses |
||||||||||||||||||||||||||||||||
| Production, mineral and other taxes |
- |
- | - | 144 | 210 | 173 | ||||||||||||||||||||||||||
| Transportation and processing |
6 |
12 | (2 | ) | 1,252 | 1,496 | 1,467 | |||||||||||||||||||||||||
| Operating |
19 |
28 | 38 | 723 | 667 | 829 | ||||||||||||||||||||||||||
| Purchased product |
- |
- | - | 323 | 1,191 | 441 | ||||||||||||||||||||||||||
| (281) | 519 | (277 | ) | 1,980 | 4,455 | 2,948 | ||||||||||||||||||||||||||
| Depreciation, depletion and amortization |
95 |
124 | 134 | 1,488 | 1,745 | 1,565 | ||||||||||||||||||||||||||
| Impairments |
- |
- | 21 | 6,473 | - | 21 | ||||||||||||||||||||||||||
| $ (376) | $ | 395 | $ | (432 | ) | (5,981 | ) | 2,710 | 1,362 | |||||||||||||||||||||||
| Accretion of asset retirement obligation |
|
45 | 52 | 53 | ||||||||||||||||||||||||||||
| Administrative |
|
275 | 327 | 439 | ||||||||||||||||||||||||||||
| Interest |
|
614 | 654 | 563 | ||||||||||||||||||||||||||||
| Foreign exchange (gain) loss, net |
|
1,082 | 403 | 325 | ||||||||||||||||||||||||||||
| (Gain) loss on divestitures |
|
(14 | ) | (3,426 | ) | (7 | ) | |||||||||||||||||||||||||
| Other |
|
27 | 71 | 1 | ||||||||||||||||||||||||||||
| 2,029 | (1,919 | ) | 1,374 | |||||||||||||||||||||||||||||
| Net Earnings (Loss) Before Income Tax |
|
(8,010 | ) | 4,629 | (12 | ) | ||||||||||||||||||||||||||
| Income tax expense (recovery) |
|
(2,845 | ) | 1,203 | (248 | ) | ||||||||||||||||||||||||||
| Net Earnings (Loss) |
|
(5,165 | ) | 3,426 | 236 | |||||||||||||||||||||||||||
| Net earnings attributable to noncontrolling interest |
|
- | (34 | ) | - | |||||||||||||||||||||||||||
| Net Earnings (Loss) Attributable to Common Shareholders |
$ | (5,165 | ) | $ | 3,392 | $ | 236 | |||||||||||||||||||||||||
ANNUAL REPORT 2015 | Encana Corporation 77
CONSOLIDATED FINANCIAL STATEMENTS PREPARED
IN ACCORDANCE WITH U.S. GAAP IN US$MM
| Notes to Consolidated Financial Statements |
| (All amounts in $ millions, unless otherwise specified) |
Intersegment Information
| Market Optimization | ||||||||||||||||||||||||||||||||||||
| Marketing Sales | Upstream Eliminations | Total | ||||||||||||||||||||||||||||||||||
| For the years ended December 31 | 2015 | 2014 | 2013 | 2015 | 2014 | 2013 | 2015 | 2014 | 2013 | |||||||||||||||||||||||||||
| Revenues, Net of Royalties |
$ | 4,309 | $ | 7,371 | $ | 5,662 | $ | (3,944) | $ | (6,123) | $ | (5,150) | $ | 365 | $ | 1,248 | $ | 512 | ||||||||||||||||||
| Expenses |
||||||||||||||||||||||||||||||||||||
| Transportation and processing |
348 | 458 | 516 | (336) | (458) | (516) | 12 | - | - | |||||||||||||||||||||||||||
| Operating |
33 | 62 | 75 | - | (23) | (37) | 33 | 39 | 38 | |||||||||||||||||||||||||||
| Purchased product |
3,931 | 6,822 | 4,993 | (3,608) | (5,631) | (4,552) | 323 | 1,191 | 441 | |||||||||||||||||||||||||||
| Operating Cash Flow |
$ | (3) | $ | 29 | $ | 78 | $ | - | $ | (11) | $ | (45) | $ | (3) | $ | 18 | $ | 33 | ||||||||||||||||||
Capital Expenditures
| For the years ended December 31 | 2015 | 2014 | 2013 | |||||||||
| Canadian Operations |
$ | 380 | $ | 1,226 | $ | 1,365 | ||||||
| USA Operations |
1,847 | 1,285 | 1,283 | |||||||||
| Market Optimization |
1 | - | 3 | |||||||||
| Corporate & Other |
4 | 15 | 61 | |||||||||
| $ | 2,232 | $ | 2,526 | $ | 2,712 | |||||||
Goodwill, Property, Plant and Equipment and Total Assets by Segment
| Goodwill | Property, Plant and Equipment | Total Assets (1) | ||||||||||||||||||||||
| As at December 31 | 2015 | 2014 | 2015 | 2014 | 2015 | 2014 | ||||||||||||||||||
| Canadian Operations |
$ | 661 | $ | 788 | $ | 1,100 | $ | 2,338 | $ | 2,036 | $ | 3,544 | ||||||||||||
| USA Operations |
2,129 | 2,129 | 7,249 | 13,817 | 10,405 | 16,798 | ||||||||||||||||||
| Market Optimization |
- | - | 1 | 1 | 95 | 181 | ||||||||||||||||||
| Corporate & Other |
- | - | 1,507 | 1,859 | 3,108 | 4,008 | ||||||||||||||||||
| $ | 2,790 | $ | 2,917 | $ | 9,857 | $ | 18,015 | $ | 15,644 | $ | 24,531 | |||||||||||||
| (1) | Total Assets for 2014 has been restated due to the early adoption of ASU 2015-17, “Balance Sheet Classification of Deferred Taxes”, as described in Note 1. |
Goodwill, Property, Plant and Equipment and Total Assets by Geographic Region
| Goodwill | Property, Plant and Equipment | Total Assets (1) | ||||||||||||||||||||||
| As at December 31 | 2015 | 2014 | 2015 | 2014 | 2015 | 2014 | ||||||||||||||||||
| Canada |
$ | 661 | $ | 788 | $ | 2,495 | $ | 4,070 | $ | 5,063 | $ | 7,182 | ||||||||||||
| United States |
2,129 | 2,129 | 7,362 | 13,945 | 10,570 | 17,271 | ||||||||||||||||||
| Other Countries |
- | - | - | - | 11 | 78 | ||||||||||||||||||
| $ | 2,790 | $ | 2,917 | $ | 9,857 | $ | 18,015 | $ | 15,644 | $ | 24,531 | |||||||||||||
| (1) | Total Assets for 2014 has been restated due to the early adoption of ASU 2015-17, “Balance Sheet Classification of Deferred Taxes”, as described in Note 1. |
Export Sales
Sales of natural gas and liquids produced or purchased in Canada delivered to customers outside of Canada were $153 million (2014 – $338 million; 2013 – $243 million).
Major Customers
In connection with the marketing and sale of Encana’s own and purchased natural gas and liquids for the year ended December 31, 2015, the Company had one customer which individually accounted for more than 10 percent of Encana’s consolidated revenues, net of royalties. Sales to this customer, which has an investment
78 Encana Corporation | ANNUAL REPORT 2015
CONSOLIDATED FINANCIAL STATEMENTS PREPARED
IN ACCORDANCE WITH U.S. GAAP IN US$MM
| Notes to Consolidated Financial Statements |
| (All amounts in $ millions, unless otherwise specified) |
grade credit rating, were approximately $446 million which comprised $138 million in Canada and $308 million in the United States (2014 – one customer with sales of approximately $1,043 million; 2013 – one customer with sales of approximately $815 million).
| 3. Business Combinations |
Eagle Ford Acquisition
On June 20, 2014, Encana completed the acquisition of properties located in the Eagle Ford shale formation for approximately $2.9 billion, after closing adjustments. The acquisition included an interest in certain producing properties and undeveloped lands in the Karnes, Wilson and Atascosa counties of south Texas. Encana funded the acquisition with cash on hand. Transaction costs of approximately $9 million were included in other expenses. The assets acquired generated revenues of $585 million and net earnings of $222 million for the period from June 20, 2014 to December 31, 2014.
Athlon Energy Inc. Acquisition
On November 13, 2014, Encana completed the acquisition of all of the issued and outstanding shares of common stock of Athlon Energy Inc. (“Athlon”) for $5.93 billion, or $58.50 per share. In addition, Encana assumed Athlon’s $1.15 billion senior notes and repaid and terminated Athlon’s credit facility with indebtedness outstanding of $335 million. Encana funded the acquisition of Athlon with cash on hand. Transaction costs of approximately $31 million were included in other expenses. Following completion of the acquisition, Athlon’s $1.15 billion senior notes were redeemed in accordance with the provisions of the governing indentures as discussed in Note 13. Athlon’s operations focused on the acquisition and development of oil and gas properties located in the Permian Basin in west Texas. The assets acquired generated revenues of $176 million and a net loss of $3 million for the period from November 13, 2014 to December 31, 2014.
Purchase Price Allocations
The transactions were accounted for under the acquisition method, which requires that the assets acquired and liabilities assumed be recognized at their fair values as of the acquisition date. The final purchase price allocations, representing consideration paid and the fair values of the assets acquired and liabilities assumed as of the acquisition date, are shown in the table below.
| Purchase Price Allocation | Eagle Ford | Athlon (1) | ||||||
|
Assets Acquired: |
||||||||
|
Cash |
$ | - | $ | 2 | ||||
|
Accounts receivable and other current assets |
4 | 133 | ||||||
|
Risk management |
- | 80 | ||||||
|
Proved properties |
2,873 | 2,124 | ||||||
|
Unproved properties |
78 | 5,338 | ||||||
|
Other property, plant and equipment |
- | 2 | ||||||
|
Other assets |
- | 2 | ||||||
|
Goodwill |
- | 1,724 | ||||||
|
Liabilities Assumed: |
||||||||
|
Accounts payable and accrued liabilities |
- | (195) | ||||||
|
Long-term debt, including revolving credit facility |
- | (1,497) | ||||||
|
Asset retirement obligation |
(32) | (25) | ||||||
|
Deferred income taxes |
- | (1,724) | ||||||
|
Total Purchase Price |
$ | 2,923 | $ | 5,964 | ||||
| (1) | The purchase price includes cash consideration paid for issued and outstanding shares of common stock of Athlon of $58.50 per share totaling $5.93 billion, as well as payments to terminate certain employment agreements with Athlon’s management and payments for certain other existing obligations of Athlon. |
ANNUAL REPORT 2015 | Encana Corporation 79
CONSOLIDATED FINANCIAL STATEMENTS PREPARED
IN ACCORDANCE WITH U.S. GAAP IN US$MM
| Notes to Consolidated Financial Statements |
| (All amounts in $ millions, unless otherwise specified) |
The Company used the income approach valuation technique for the fair value of assets acquired and liabilities assumed. The carrying amounts of cash, accounts receivable and other current assets, and accounts payable and accrued liabilities approximate their fair values due to the short-term maturity of the instruments. The fair values of the risk management assets and long-term debt, including the revolving credit facility, are categorized within Level 2 of the fair value hierarchy and were determined using quoted prices and rates from an available pricing source. The fair values of the proved and unproved properties, other property, plant and equipment, other assets, goodwill, and asset retirement obligation are categorized within Level 3 and were determined using relevant market assumptions, including discount rates, future commodity prices and costs, timing of development activities, projections of oil and gas reserves, and estimates to abandon and reclaim producing wells.
Goodwill arose from the Athlon acquisition primarily from the requirement to recognize deferred taxes on the difference between the fair value of the assets acquired and liabilities assumed and the respective carry-over tax basis. Goodwill is not amortized and is not deductible for tax purposes.
Unaudited Pro Forma Financial Information
The following unaudited pro forma financial information combines the historical financial results of Encana with Eagle Ford and Athlon, and has been prepared assuming the acquisitions occurred on January 1, 2014. The pro forma information is not intended to reflect the actual results of operations that would have occurred if the business combinations had been completed at the date indicated. In addition, the pro forma information does not project Encana’s results of operations for any future period. The Company’s consolidated results for the year ended December 31, 2015 include the results from Eagle Ford and Athlon.
| For the year ended December 31, 2014 ($ millions, except per share amounts) | Eagle Ford | Athlon | ||||||
| Revenues, Net of Royalties |
$ | 8,760 | $ | 8,572 | ||||
| Net Earnings Attributable to Common Shareholders |
$ | 3,641 | $ | 3,486 | ||||
|
Net Earnings per Common Share |
||||||||
| Basic & Diluted |
$ | 4.91 | $ | 4.71 | ||||
| 4. Acquisitions and Divestitures |
| For the years ended December 31 | 2015 | 2014 | 2013 | |||||||||
| Acquisitions |
||||||||||||
| Canadian Operations |
$ | 9 | $ | 21 | $ | 28 | ||||||
| USA Operations |
27 | 2,995 | 156 | |||||||||
| Corporate & Other |
34 | - | - | |||||||||
| Total Acquisitions |
70 | 3,016 | 184 | |||||||||
| Divestitures |
||||||||||||
| Canadian Operations |
(959) | (1,847) | (685) | |||||||||
| USA Operations |
(896) | (2,264) | (18) | |||||||||
| Market Optimization |
- | (205) | - | |||||||||
| Corporate & Other |
(53) | (29) | (2) | |||||||||
| Total Divestitures |
(1,908) | (4,345) | (705) | |||||||||
| Net Acquisitions & (Divestitures) |
$ | (1,838) | $ | (1,329) | $ | (521) | ||||||
ACQUISITIONS
Acquisitions in 2014 primarily included the purchase of certain properties in the Eagle Ford shale formation in south Texas as described in Note 3.
80 Encana Corporation | ANNUAL REPORT 2015
CONSOLIDATED FINANCIAL STATEMENTS PREPARED
IN ACCORDANCE WITH U.S. GAAP IN US$MM
| Notes to Consolidated Financial Statements |
| (All amounts in $ millions, unless otherwise specified) |
DIVESTITURES
For the year ended December 31, 2015, amounts received on the sale of assets were $1,908 million (2014 – $4,345 million; 2013 – $705 million). In 2015, divestitures were $959 million in the Canadian Operations and $896 million in the USA Operations.
Amounts received from the divestiture transactions have been deducted from the respective Canadian and U.S. full cost pools, except for divestitures that resulted in a significant alteration between capitalized costs and proved reserves in the respective country cost centre. For divestitures that resulted in a gain or loss and constituted a business, goodwill was allocated to the divestiture. During the year ended December 31, 2015, there was no goodwill allocated to divestitures.
Canadian Operations
In 2015, divestitures in the Canadian Operations primarily included the sale of certain assets in Wheatland located in central and southern Alberta for proceeds of approximately C$557 million ($467 million), after closing adjustments, the sale of certain natural gas gathering and compression assets in Montney in northeastern British Columbia for proceeds of approximately C$450 million ($355 million), after closing adjustments, and certain properties that do not complement Encana’s existing portfolio of assets.
In 2014, divestitures in the Canadian Operations primarily included the sale of the Company’s Bighorn assets in west central Alberta for approximately $1,725 million, after closing adjustments. For the year ended December 31, 2014, Encana recognized a gain of approximately $1,014 million, before tax, on the sale of the Company’s Bighorn assets in the Canadian cost centre and allocated goodwill of $257 million.
In 2013, divestitures in the Canadian Operations included the sale of the Company’s Jean Marie natural gas assets in northeast British Columbia and other assets.
USA Operations
In 2015, divestitures in the USA Operations primarily included the sale of the Haynesville natural gas assets located in northern Louisiana for proceeds of approximately $769 million, after closing adjustments, and certain properties that do not complement Encana’s existing portfolio of assets.
In 2014, divestitures in the USA Operations primarily included the sale of the Jonah properties for proceeds of approximately $1,636 million, after closing adjustments, and the sale of certain properties in East Texas for proceeds of approximately $495 million, after closing adjustments. For the year ended December 31, 2014, Encana recognized a gain of approximately $209 million, before tax, on the sale of the Jonah properties in the U.S. cost centre and allocated goodwill of $68 million.
Market Optimization
For the year ended December 31, 2014, divestitures in Market Optimization were $205 million and primarily included the Company’s electricity generation assets.
Corporate and Other
For the year ended December 31, 2015, Corporate and Other acquisitions and divestitures primarily included the purchase and subsequent sale of the Encana Place office building located in Calgary, which resulted in a gain on divestiture of approximately $12 million.
OTHER CAPITAL TRANSACTIONS
The following transactions involved the acquisition or disposition of common shares and, therefore, have been excluded from the acquisitions and divestitures table above.
ANNUAL REPORT 2015 | Encana Corporation 81
CONSOLIDATED FINANCIAL STATEMENTS PREPARED
IN ACCORDANCE WITH U.S. GAAP IN US$MM
| Notes to Consolidated Financial Statements |
| (All amounts in $ millions, unless otherwise specified) |
Acquisition of Athlon
On November 13, 2014, Encana acquired all of the issued and outstanding shares of common stock of Athlon for $5.93 billion, or $58.50 per share. See Note 3 for further details regarding the Athlon transaction.
Divestiture of Investment in PrairieSky
On September 26, 2014, Encana completed the secondary offering of 70.2 million common shares of PrairieSky at a price of C$36.50 per common share for aggregate gross proceeds of approximately C$2.6 billion. As the sale of the investment in PrairieSky resulted in a significant alteration between capitalized costs and proved reserves in the Canadian cost centre, Encana recognized a gain on divestiture of approximately $2.1 billion, before tax. See Note 18 for further details regarding the PrairieSky transactions.
| 5. Interest |
| For the years ended December 31 | 2015 | 2014 | 2013 | |||||||||
| Interest Expense on: |
||||||||||||
| Debt |
$ | 497 | $ | 509 | $ | 460 | ||||||
| The Bow office building |
65 | 75 | 76 | |||||||||
| Capital leases |
28 | 37 | 9 | |||||||||
| Other |
24 | 33 | 18 | |||||||||
| $ | 614 | $ | 654 | $ | 563 | |||||||
Interest Expense on Debt for the year ended December 31, 2015 included a one-time interest payment of approximately $165 million resulting from the April 2015 early redemption of the Company’s $700 million 5.90 percent notes due December 1, 2017 and C$750 million 5.80 percent medium-term notes due January 18, 2018 as discussed in Note 13.
Interest Expense on Debt for the year ended December 31, 2014 included a one-time outlay of approximately $125 million associated with the early redemption of senior notes assumed in conjunction with the Athlon acquisition as described in Note 13.
Interest on Capital leases and Other were previously reported together in 2013.
| 6. Foreign Exchange (Gain) Loss, Net |
| For the years ended December 31 | 2015 | 2014 | 2013 | |||||||||
| Unrealized Foreign Exchange (Gain) Loss on: |
||||||||||||
| Translation of U.S. dollar debt issued from Canada |
$ | 754 | $ | 456 | $ | 349 | ||||||
| Translation of U.S. dollar risk management contracts issued from Canada |
(67 | ) | (16 | ) | (19) | |||||||
| 687 | 440 | 330 | ||||||||||
| Foreign Exchange on Settlements |
358 | 28 | 20 | |||||||||
| Other Monetary Revaluations |
37 | (65 | ) | (25) | ||||||||
| $ | 1,082 | $ | 403 | $ | 325 | |||||||
Foreign Exchange on Settlements included foreign exchange on intercompany transactions and foreign exchange on settlement of long-term debt previously reported in Other Monetary Revaluations.
82 Encana Corporation | ANNUAL REPORT 2015
CONSOLIDATED FINANCIAL STATEMENTS PREPARED
IN ACCORDANCE WITH U.S. GAAP IN US$MM
| Notes to Consolidated Financial Statements |
| (All amounts in $ millions, unless otherwise specified) |
| 7. Income Taxes |
The provision for income taxes is as follows:
| For the years ended December 31 | 2015 | 2014 | 2013 | |||||||||
| Current Tax |
||||||||||||
| Canada |
$ | (25) | $ | 249 | $ | (152) | ||||||
| United States |
(17) | (21) | (64) | |||||||||
| Other Countries |
8 | 15 | 25 | |||||||||
| Total Current Tax Expense (Recovery) |
(34) | 243 | (191) | |||||||||
| Deferred Tax |
||||||||||||
| Canada |
(316) | 713 | (106) | |||||||||
| United States |
(2,495) | 246 | 52 | |||||||||
| Other Countries |
- | 1 | (3) | |||||||||
| Total Deferred Tax Expense (Recovery) |
(2,811) | 960 | (57) | |||||||||
| Income Tax Expense (Recovery) |
$ | (2,845) | $ | 1,203 | $ | (248) | ||||||
The following table reconciles income taxes calculated at the Canadian statutory rate with the actual income taxes:
| For the years ended December 31 | 2015 | 2014 | 2013 | |||||||||
| Net Earnings (Loss) Before Income Tax |
||||||||||||
| Canada |
$ | (2,014) | $ | 3,744 | $ | (316) | ||||||
| United States |
(6,963) | 665 | 46 | |||||||||
| Other Countries |
967 | 220 | 258 | |||||||||
| Total Net Earnings (Loss) Before Income Tax |
(8,010) | 4,629 | (12) | |||||||||
| Canadian Statutory Rate |
26.4% | 25.7% | 25.1% | |||||||||
| Expected Income Tax |
(2,115) | 1,190 | (3) | |||||||||
| Effect on Taxes Resulting From: |
||||||||||||
| Statutory rate and other foreign differences |
(776) | 7 | (42) | |||||||||
| Effect of legislative changes |
(11) | - | (70) | |||||||||
| Non-taxable capital (gains) losses |
132 | 64 | 48 | |||||||||
| Tax differences on divestitures and transactions |
(8) | 8 | (28) | |||||||||
| Partnership tax allocations in excess of funding |
(21) | (53) | (41) | |||||||||
| Amounts in respect of prior periods |
(8) | (19) | (103) | |||||||||
| Other |
(38) | 6 | (9) | |||||||||
| $ | (2,845) | $ | 1,203 | $ | (248) | |||||||
| Effective Tax Rate |
35.5% | 26.0% | 2,066.7% | |||||||||
ANNUAL REPORT 2015 | Encana Corporation 83
CONSOLIDATED FINANCIAL STATEMENTS PREPARED
IN ACCORDANCE WITH U.S. GAAP IN US$MM
| Notes to Consolidated Financial Statements |
| (All amounts in $ millions, unless otherwise specified) |
The net deferred income tax asset (liability) consists of:
| As at December 31 | 2015 | 2014 | ||||||
| Deferred Income Tax Assets |
||||||||
| Property, plant and equipment |
$ | 226 | $ | 217 | ||||
| Compensation plans |
72 | 91 | ||||||
| Interest and other deferred deductions |
224 | 59 | ||||||
| Unrealized foreign exchange losses |
36 | - | ||||||
| Non-capital and net capital losses carried forward |
1,009 | 492 | ||||||
| Alternative minimum tax and foreign tax credits |
208 | 205 | ||||||
| Less valuation allowance |
(12) | (12) | ||||||
| Other |
99 | 72 | ||||||
| Deferred Income Tax Liabilities |
||||||||
| Property, plant and equipment |
(660) | (2,485) | ||||||
| Risk management |
(122) | (226) | ||||||
| Unrealized foreign exchange gains |
- | (48) | ||||||
| Other |
(23) | (26) | ||||||
| Net Deferred Income Tax Asset (Liability) |
$ | 1,057 | $ | (1,661) | ||||
The net deferred income tax asset (liability) for the following jurisdictions is reflected in the Consolidated Balance Sheet as follows:
| As at December 31 | 2015 | 2014 (1) | ||||||
| Deferred Income Tax Assets |
||||||||
| Canada |
$ | 411 | $ | 178 | ||||
| United States |
670 | 28 | ||||||
| 1,081 | 206 | |||||||
| Deferred Income Tax Liabilities |
||||||||
| Canada |
(24) | (22) | ||||||
| United States |
- | (1,845) | ||||||
| (24) | (1,867) | |||||||
| Net Deferred Income Tax Asset (Liability) |
$ | 1,057 | $ | (1,661) | ||||
| (1) | 2014 has been restated due to the early adoption of ASU 2015-17, “Balance Sheet Classification of Deferred Taxes”, as described in Note 1. |
Tax pools, loss carryforwards, charitable donations and tax credits that can be utilized in future years are as follows:
| As at December 31 | 2015 | Expiration Date |
||||||
| Canada |
||||||||
| Tax pools |
$ | 1,458 | Indefinite | |||||
| Net capital losses |
129 | Indefinite | ||||||
| Non-capital losses |
84 | 2027 –2035 | ||||||
| Charitable donations |
1 | 2020 | ||||||
| United States |
||||||||
| Tax basis |
$ | 5,195 | Indefinite | |||||
| Non-capital losses (Federal) |
2,659 | 2031 – 2035 | ||||||
| Interest and other deferred deductions |
619 | Indefinite | ||||||
| Charitable donations |
10 | 2018 – 2019 | ||||||
| Alternative minimum tax credits |
10 | Indefinite | ||||||
| Foreign tax credits (net of valuation allowance) |
186 | 2021 – 2025 | ||||||
84 Encana Corporation | ANNUAL REPORT 2015
CONSOLIDATED FINANCIAL STATEMENTS PREPARED
IN ACCORDANCE WITH U.S. GAAP IN US$MM
| Notes to Consolidated Financial Statements |
| (All amounts in $ millions, unless otherwise specified) |
As at December 31, 2015, approximately $2.2 billion of Encana’s unremitted earnings from its foreign subsidiaries were considered to be permanently reinvested outside of Canada and, accordingly, Encana has not recognized a deferred tax liability for Canadian income taxes in respect of such earnings. If such earnings were to be remitted to Canada, Encana may be subject to Canadian income taxes and foreign withholding taxes. However, determination of any potential amount of unrecognized deferred income tax liabilities is not practicable.
The following table presents changes in the balance of Encana’s unrecognized tax benefits excluding interest:
| For the years ended December 31 | 2015 | 2014 | ||||||
| Balance, Beginning of Year |
$ | (382) | $ | (119) | ||||
| Additions for tax positions taken in the current year |
- | (289) | ||||||
| Additions for tax positions of prior years |
(6) | (1) | ||||||
| Reductions for tax positions of prior years |
1 | 2 | ||||||
| Lapse of statute of limitations |
4 | - | ||||||
| Settlements |
5 | 2 | ||||||
| Foreign currency translation |
61 | 23 | ||||||
| Balance, End of Year |
$ | (317) | $ | (382) | ||||
The unrecognized tax benefit is reflected in the Consolidated Balance Sheet as follows:
| For the years ended December 31 | 2015 | 2014 | ||||||
| Income tax receivable |
$ | (61) | $ | (36) | ||||
| Other liabilities and provisions (See Note 14) |
(189) | (279) | ||||||
| Deferred income tax asset (1) |
(67) | (67) | ||||||
| Balance, End of Year |
$ | (317) | $ | (382) | ||||
| (1) | The 2014 deferred income tax asset balance has been restated due to the early adoption of ASU 2015-17, “Balance Sheet Classification of Deferred Taxes”, as described in Note 1. |
If recognized, all of Encana’s unrecognized tax benefits as at December 31, 2015 would affect Encana’s effective income tax rate. Encana does not anticipate that the amount of unrecognized tax benefits will significantly change during the next 12 months.
Encana recognizes interest accrued in respect of unrecognized tax benefits in interest expense. During 2015, Encana recognized $2 million (2014 – expense of $1 million; 2013 – recovery of $6 million) in interest expense. As at December 31, 2015, Encana had a liability of $3 million (2014 – $2 million) for interest accrued in respect of unrecognized tax benefits.
Included below is a summary of the tax years, by jurisdiction, that remain subject to examination by the taxation authorities.
| Jurisdiction |
Taxation Year | |
| Canada - Federal |
2006 – 2015 | |
| Canada - Provincial |
2006 – 2015 | |
| United States - Federal |
2011 – 2015 | |
| United States - State |
2010 – 2015 | |
| Other |
2015 | |
Encana and its subsidiaries file income tax returns primarily in Canada and the United States. Issues in dispute for audited years and audits for subsequent years are ongoing and in various stages of completion.
ANNUAL REPORT 2015 | Encana Corporation 85
CONSOLIDATED FINANCIAL STATEMENTS PREPARED
IN ACCORDANCE WITH U.S. GAAP IN US$MM
| Notes to Consolidated Financial Statements |
| (All amounts in $ millions, unless otherwise specified) |
| 8. Accounts Receivable and Accrued Revenues |
| As at December 31 | 2015 | 2014 | ||||||
| Trade Receivables and Accrued Revenue |
$ | 606 | $ | 1,223 | ||||
| Prepaids |
25 | 60 | ||||||
| Deposits and Other |
18 | 30 | ||||||
| 649 | 1,313 | |||||||
| Allowance for Doubtful Accounts |
(4) | (6) | ||||||
| $ | 645 | $ | 1,307 | |||||
Trade receivables are non-interest bearing. In determining the recoverability of trade receivables, the Company considers the age of the outstanding receivable and the credit worthiness of the counterparties. See Note 24 for further information about credit risk.
| 9. Property, Plant and Equipment, Net |
| As at December 31 | 2015 | 2014 | ||||||||||||||||||||||
| Cost |
Accumulated |
Net | Cost | Accumulated DD&A (1) |
Net | |||||||||||||||||||
| Canadian Operations |
||||||||||||||||||||||||
| Proved properties |
$ | 14,866 | $ | (14,170) | $ | 696 | $ | 18,271 | $ | (16,566) | $ | 1,705 | ||||||||||||
| Unproved properties |
334 | - | 334 | 478 | - | 478 | ||||||||||||||||||
| Other |
70 | - | 70 | 155 | - | 155 | ||||||||||||||||||
| 15,270 | (14,170) | 1,100 | 18,904 | (16,566) | 2,338 | |||||||||||||||||||
| USA Operations |
||||||||||||||||||||||||
| Proved properties |
25,723 | (23,822) | 1,901 | 24,279 | (16,260) | 8,019 | ||||||||||||||||||
| Unproved properties |
5,282 | - | 5,282 | 5,655 | - | 5,655 | ||||||||||||||||||
| Other |
66 | - | 66 | 143 | - | 143 | ||||||||||||||||||
| 31,071 | (23,822) | 7,249 | 30,077 | (16,260) | 13,817 | |||||||||||||||||||
| Market Optimization |
5 | (4) | 1 | 8 | (7) | 1 | ||||||||||||||||||
| Corporate & Other |
2,098 | (591) | 1,507 | 2,470 | (611) | 1,859 | ||||||||||||||||||
| $ | 48,444 | $ | (38,587) | $ | 9,857 | $ | 51,459 | $ | (33,444) | $ | 18,015 | |||||||||||||
| (1) | Depreciation, depletion and amortization. |
Canadian Operations and USA Operations property, plant and equipment include internal costs directly related to exploration, development and construction activities of $217 million which have been capitalized during the year ended December 31, 2015 (2014 – $306 million). Included in Corporate and Other are $58 million (2014 – $65 million) of international property costs, which have been fully impaired.
For the year ended December 31, 2015, the Company recognized before-tax ceiling test impairments of $6,473 million (2014 – nil; 2013 – nil) in the U.S. cost centre, which are included within accumulated DD&A in the table above. The impairments resulted primarily from the decline in the 12-month average trailing commodity prices which reduced proved reserves volumes and values. There were no ceiling test impairments in the Canadian cost centre for the year ended December 31, 2015 (2014 – nil; 2013 – nil).
The 12-month average trailing prices used in the ceiling test calculations reflect benchmark prices adjusted for basis differentials to determine local reference prices, transportation costs and tariffs, heat content and quality. The benchmark prices are disclosed in Note 27.
86 Encana Corporation | ANNUAL REPORT 2015
CONSOLIDATED FINANCIAL STATEMENTS PREPARED
IN ACCORDANCE WITH U.S. GAAP IN US$MM
| Notes to Consolidated Financial Statements |
| (All amounts in $ millions, unless otherwise specified) |
Capital Lease Arrangements
The Company has several lease arrangements that are accounted for as capital leases, including an office building, equipment and an offshore production platform.
In December 2013, Encana commenced commercial operations at its Deep Panuke facility located offshore Nova Scotia at which time the Company recorded a capital lease asset and a corresponding capital lease obligation related to the Production Field Centre (“PFC”). Variable interests related to the PFC are described in Note 19.
As at December 31, 2015, the total carrying value of assets under capital lease was $376 million (2014 – $547 million), net of accumulated amortization of $310 million (2014 – $225 million). Liabilities for the capital lease arrangements are included in other liabilities and provisions in the Consolidated Balance Sheet and are disclosed in Note 14.
Other Arrangement
As at December 31, 2015, Corporate and Other property, plant and equipment and total assets include a carrying value of $1,179 million (2014 – $1,431 million) related to The Bow office building, which is under a 25-year lease agreement. The Bow asset is being depreciated over the 60-year estimated life of the building. At the conclusion of the 25-year term, the remaining asset and corresponding liability are expected to be derecognized as disclosed in Note 14.
| 10. Other Assets |
| As at December 31 | 2015 | 2014 | ||||||
| Long-Term Investments |
$ | 161 | $ | 163 | ||||
| Long-Term Receivables |
70 | 136 | ||||||
| Debt Issuance Costs (See Note 1) |
30 | 39 | ||||||
| Deferred Charges |
11 | 9 | ||||||
| Other |
24 | 47 | ||||||
| $ | 296 | $ | 394 | |||||
| 11. Goodwill |
| As at December 31 | 2015 | 2014 | ||||||
| Canada |
$ | 661 | $ | 788 | ||||
| United States |
2,129 | 2,129 | ||||||
| $ | 2,790 | $ | 2,917 | |||||
There were no additions or dispositions of goodwill during 2015. The change in the Canada goodwill balance reflects the movements due to foreign currency translation.
During 2014, the Company recognized goodwill of $1,724 million in conjunction with the Athlon acquisition in the United States as described in Note 3. In Canada, the Company allocated goodwill of $257 million to the Bighorn divestiture and derecognized $39 million upon the divestiture of Encana’s investment in PrairieSky as described in Notes 4 and 18. In the United States, the Company allocated goodwill of $68 million to the Jonah divestiture as described in Note 4.
Goodwill was assessed for impairment as at December 31, 2015 and December 31, 2014. The fair values of the Canada and United States reporting units were determined to be greater than the respective carrying values of the reporting units. Accordingly, no goodwill impairments were recognized.
ANNUAL REPORT 2015 | Encana Corporation 87
CONSOLIDATED FINANCIAL STATEMENTS PREPARED
IN ACCORDANCE WITH U.S. GAAP IN US$MM
| Notes to Consolidated Financial Statements |
| (All amounts in $ millions, unless otherwise specified) |
| 12. Accounts Payable and Accrued Liabilities | ||
| As at December 31 | 2015 | 2014 | ||||||||
| Trade Payables |
$ | 254 | $ | 396 | ||||||
| Capital Accruals |
257 | 729 | ||||||||
| Royalty and Production Accruals |
345 | 527 | ||||||||
| Other Accruals |
280 | 385 | ||||||||
| Interest Payable |
80 | 100 | ||||||||
| Outstanding Disbursements |
- | 4 | ||||||||
| Current Portion of Capital Lease Obligations (See Note 14) |
54 | 59 | ||||||||
| Current Portion of Asset Retirement Obligation (See Note 15) |
41 | 43 | ||||||||
| $ | 1,311 | $ | 2,243 | |||||||
Payables and accruals are non-interest bearing. Interest payable represents amounts accrued related to Encana’s unsecured notes as disclosed in Note 13.
| 13. Long-Term Debt | ||
| As at December 31 | Note | 2015 | 2014 | |||||||
| Canadian Dollar Denominated Debt |
||||||||||
| Canadian Unsecured Notes: |
B | |||||||||
| 5.80% due January 18, 2018 |
$ | - | $ | 647 | ||||||
| - | 647 | |||||||||
|
U.S. Dollar Denominated Debt |
||||||||||
| Revolving credit and term loan borrowings |
A | 650 | 1,277 | |||||||
| U.S. Unsecured Notes: |
B | |||||||||
| 5.90% due December 1, 2017 |
- | 700 | ||||||||
| 6.50% due May 15, 2019 |
500 | 500 | ||||||||
| 3.90% due November 15, 2021 |
600 | 600 | ||||||||
| 8.125% due September 15, 2030 |
300 | 300 | ||||||||
| 7.20% due November 1, 2031 |
350 | 350 | ||||||||
| 7.375% due November 1, 2031 |
500 | 500 | ||||||||
| 6.50% due August 15, 2034 |
750 | 750 | ||||||||
| 6.625% due August 15, 2037 |
500 | 500 | ||||||||
| 6.50% due February 1, 2038 |
800 | 800 | ||||||||
| 5.15% due November 15, 2041 |
400 | 400 | ||||||||
| 5,350 | 6,677 | |||||||||
| Total Principal |
F | 5,350 | 7,324 | |||||||
| Increase in Value of Debt Acquired |
C | 27 | 34 | |||||||
| Debt Discounts |
D | (14) | (18 | ) | ||||||
| Current Portion of Long-Term Debt |
E | - | - | |||||||
| $ | 5,363 | $ | 7,340 | |||||||
88 Encana Corporation | ANNUAL REPORT 2015
CONSOLIDATED FINANCIAL STATEMENTS PREPARED
IN ACCORDANCE WITH U.S. GAAP IN US$MM
| Notes to Consolidated Financial Statements |
| (All amounts in $ millions, unless otherwise specified) |
| A) | REVOLVING CREDIT AND TERM LOAN BORROWINGS |
U.S. Dollar Denominated Revolving Credit and Term Loan Borrowings
At December 31, 2015, Encana had in place committed revolving bank credit facilities totaling $4.5 billion which included $3.0 billion on a revolving bank credit facility for Encana and $1.5 billion on a revolving bank credit facility for a U.S. subsidiary. The facilities are extendible from time to time, but not more than once per year, for a period not longer than five years plus 90 days from the date of the extension request, at the option of the lenders and upon notice from Encana. The facilities mature in July 2020, and are fully revolving up to maturity. Encana is subject to certain financial covenants in its credit facility agreements and is in compliance with all financial covenants as at December 31, 2015.
The Encana facility is unsecured and bears interest at the lenders’ rates for Canadian prime, U.S. base rate, Bankers’ Acceptances or LIBOR, plus applicable margins. As at December 31, 2015, the Company had borrowed LIBOR loans of $210 million maturing at various dates with a weighted average interest rate of 1.87 percent. The Encana facility also backstopped commercial paper of $440 million maturing at various dates with a weighted average interest rate of 1.13 percent. These amounts are fully supported and Management expects that they will continue to be supported by revolving credit facilities that have no repayment requirements within the next year. Of the $3.0 billion revolving bank credit facility, $2,350 million remained unused.
The U.S. subsidiary facility, which remained unused as at December 31, 2015, bears interest at either the lenders’ U.S. base rate or LIBOR, plus applicable margins.
Standby fees paid in 2015 relating to revolving credit and term loan agreements were approximately $11 million (2014 – $12 million; 2013 – $14 million).
| B) | UNSECURED NOTES |
Shelf Prospectus
In 2014, Encana filed a short form base shelf prospectus, whereby the Company may issue from time to time up to $6.0 billion, or the equivalent in foreign currencies, of debt securities, common shares, preferred shares, subscription receipts, warrants and units in Canada and/or the U.S. During March 2015, the Company filed a prospectus supplement to the base shelf prospectus for the issuance of common shares as described in Note 16. At December 31, 2015, $4.9 billion remained accessible under the shelf prospectus, the availability of which is dependent upon market conditions. The shelf prospectus expires in July 2016.
U.S. and Canadian Unsecured Notes
Unsecured notes include medium-term notes and senior notes that are issued from time to time under trust indentures and have equal priority with respect to the payment of both principal and interest.
On March 5, 2015, Encana provided notice to noteholders that it would redeem the Company’s $700 million 5.90 percent notes due December 1, 2017 and C$750 million 5.80 percent medium-term notes due January 18, 2018. On April 6, 2015, the Company used net proceeds from the common shares issued, as disclosed in Note 16, and cash on hand to complete the note redemptions. In conjunction with the early note redemptions, the Company incurred a one-time interest payment of approximately $165 million as discussed in Note 5.
On February 28, 2014, Encana announced a cash tender offer and consent solicitation for any and all of the Company’s outstanding $1,000 million 5.80 percent notes due May 1, 2014. The Company paid $1,004.59 for each $1,000 principal amount of the notes plus accrued and unpaid interest up to, but not including, the settlement date and a consent payment equal to $2.50 per $1,000 principal amount of the notes.
On March 28, 2014, the tender offer and consent solicitation expired and on March 31, 2014, Encana paid the consenting noteholders an aggregate of approximately $792 million in cash reflecting a $768 million principal debt repayment, $2 million for the consent payment and $22 million of accrued and unpaid interest.
ANNUAL REPORT 2015 | Encana Corporation 89
CONSOLIDATED FINANCIAL STATEMENTS PREPARED
IN ACCORDANCE WITH U.S. GAAP IN US$MM
| Notes to Consolidated Financial Statements |
| (All amounts in $ millions, unless otherwise specified) |
On April 28, 2014, pursuant to the Notice of Redemption issued on March 28, 2014, the Company redeemed the remaining principal amount of the 5.80 percent notes not tendered in the tender offer. Encana paid approximately $239 million in cash reflecting a $232 million principal debt repayment and $7 million of accrued and unpaid interest.
On December 16, 2014, Encana completed the redemption of the $500 million 7.375 percent senior notes due April 15, 2021 and the $650 million 6.00 percent senior notes due May 1, 2022, which were assumed by Encana in conjunction with the Athlon acquisition as discussed in Note 3. The Company recognized a one-time outlay of approximately $125 million as a result of the early redemption as discussed in Note 5. Encana used proceeds from the Company’s revolving credit facility of $1,277 million to redeem the senior notes.
| C) | INCREASE IN VALUE OF DEBT ACQUIRED |
Certain of the notes and debentures of the Company were acquired in business combinations and were accounted for at their fair value at the dates of acquisition. The difference between the fair value and the principal amount of the debt is being amortized over the remaining life of the outstanding debt acquired, which is approximately 15 years.
In conjunction with the Athlon acquisition in 2014, the Company recorded an increase in the fair value of the debt acquired of approximately $12 million, which was expensed upon redemption of the senior notes and is included in other expenses in the Company’s Consolidated Statement of Earnings.
| D) | DEBT DISCOUNTS |
Long-term debt premiums and discounts are capitalized within long-term debt and are being amortized using the effective interest method. During 2015 and 2014, no debt discounts were capitalized.
| E) | CURRENT PORTION OF LONG-TERM DEBT |
As at December 31, 2015 and 2014, there was no current portion of long-term debt.
| F) | MANDATORY DEBT PAYMENTS |
| As at December 31 | Principal Amount |
|||
|
2016 |
$ | - | ||
| 2017 |
- | |||
| 2018 |
- | |||
| 2019 |
500 | |||
| 2020 |
650 | |||
| Thereafter |
4,200 | |||
| Total |
$ | 5,350 | ||
The revolving credit facilities are fully revolving for a period of up to five years. Based on the current maturity dates of the credit facilities, the payments are included in 2020.
As at December 31, 2015, total long-term debt had a carrying value of $5,363 million and a fair value of $4,630 million (2014 – carrying value of $7,340 million and a fair value of $7,788 million). The estimated fair value of long-term borrowings is categorized within Level 2 of the fair value hierarchy and has been determined based on market information, or by discounting future payments of interest and principal at interest rates expected to be available to the Company at period end.
90 Encana Corporation | ANNUAL REPORT 2015
CONSOLIDATED FINANCIAL STATEMENTS PREPARED
IN ACCORDANCE WITH U.S. GAAP IN US$MM
| Notes to Consolidated Financial Statements |
| (All amounts in $ millions, unless otherwise specified) |
| 14. Other Liabilities and Provisions |
| As at December 31 | 2015 | 2014 | ||||||
|
The Bow Office Building (See Note 9) |
$ | 1,238 | $ | 1,486 | ||||
| Capital Lease Obligations (See Note 9) |
353 | 473 | ||||||
| Unrecognized Tax Benefits (See Note 7) |
189 | 279 | ||||||
| Pensions and Other Post-Employment Benefits |
115 | 144 | ||||||
| Long-Term Incentives (See Note 21) |
23 | 70 | ||||||
| Other Derivative Contracts (See Notes 23, 24) |
23 | - | ||||||
| Other |
34 | 32 | ||||||
| $ | 1,975 | $ | 2,484 | |||||
The Bow Office Building
As described in Note 9, Encana has recognized the accumulated costs for The Bow office building, which is under a 25-year lease agreement. At the conclusion of the 25-year term, the remaining asset and corresponding liability are expected to be derecognized. Encana has also subleased part of The Bow office space to a subsidiary of Cenovus Energy Inc. (“Cenovus”). The total undiscounted future payments related to the lease agreement and the total undiscounted future amounts expected to be recovered from the Cenovus sublease are outlined below.
| (undiscounted) | 2016 | 2017 | 2018 | 2019 | 2020 | Thereafter | Total | |||||||||||||||||||||
|
Expected Future Lease Payments |
$ | 68 | $ | 68 | $ | 69 | $ | 69 | $ | 70 | $ | 1,315 | $ | 1,659 | ||||||||||||||
| Sublease Recoveries |
$ | (34) | $ | (34) | $ | (34) | $ | (34) | $ | (34) | $ | (646 | ) | $ | (816 | ) | ||||||||||||
Capital Lease Obligations
As described in Note 9, the Company has several lease arrangements that are accounted for as capital leases, including an office building, equipment and the PFC. Variable interests related to the PFC are described in Note 19.
The total expected future lease payments related to the Company’s capital lease obligations are outlined below.
| 2016 | 2017 | 2018 | 2019 | 2020 | Thereafter | Total | ||||||||||||||||||||||
|
Expected Future Lease Payments |
$ | 98 | $ | 99 | $ | 99 | $ | 99 | $ | 99 | $ | 133 | $ | 627 | ||||||||||||||
| Less Amounts Representing Interest |
44 | 42 | 38 | 34 | 31 | 31 | 220 | |||||||||||||||||||||
| Present Value of Expected |
$ | 54 | $ | 57 | $ | 61 | $ | 65 | $ | 68 | $ | 102 | $ | 407 | ||||||||||||||
ANNUAL REPORT 2015 | Encana Corporation 91
CONSOLIDATED FINANCIAL STATEMENTS PREPARED
IN ACCORDANCE WITH U.S. GAAP IN US$MM
| Notes to Consolidated Financial Statements |
| (All amounts in $ millions, unless otherwise specified) |
| 15. Asset Retirement Obligation |
| As at December 31 | 2015 | 2014 | ||||||
|
Asset Retirement Obligation, Beginning of Year |
$ | 913 | $ | 966 | ||||
| Liabilities Incurred and Acquired |
19 | 85 | ||||||
| Liabilities Settled and Divested |
(217 | ) | (188 | ) | ||||
| Change in Estimated Future Cash Outflows |
115 | 35 | ||||||
| Accretion Expense |
45 | 52 | ||||||
| Foreign Currency Translation |
(61 | ) | (37 | ) | ||||
| Asset Retirement Obligation, End of Year |
$ | 814 | $ | 913 | ||||
|
Current Portion (See Note 12) |
$ | 41 | $ | 43 | ||||
| Long-Term Portion |
773 | 870 | ||||||
| $ | 814 | $ | 913 | |||||
| 16. Share Capital | ||
AUTHORIZED
The Company is authorized to issue an unlimited number of no par value common shares and Class A Preferred Shares limited to a number equal to not more than 20 percent of the issued and outstanding number of common shares at the time of issuance.
ISSUED AND OUTSTANDING
| As at December 31 |
2015 |
2014 |
||||||||||||||
|
Number (millions) |
Amount | Number (millions) |
Amount | |||||||||||||
|
Common Shares Outstanding, Beginning of Year |
741.2 | $ | 2,450 | 740.9 | $ | 2,445 | ||||||||||
| Common Shares Issued |
98.4 | 1,098 | - | - | ||||||||||||
| Common Shares Issued under Dividend Reinvestment Plan |
10.2 | 73 | 0.3 | 5 | ||||||||||||
| Common Shares Outstanding, End of Year |
849.8 | $ | 3,621 | 741.2 | $ | 2,450 | ||||||||||
On March 5, 2015, Encana filed a prospectus supplement (the “Share Offering”) to the Company’s base shelf prospectus for the issuance of 85,616,500 common shares and granted an over-allotment option for up to an additional 12,842,475 common shares at a price of C$14.60 per common share, pursuant to an underwriting agreement. The aggregate gross proceeds from the Share Offering were approximately C$1.44 billion ($1.13 billion). After deducting underwriter’s fees and costs of the Share Offering, the net proceeds received were approximately C$1.39 billion ($1.09 billion).
During the year ended December 31, 2015, Encana issued 10,246,221 common shares totaling $73 million under the Company’s dividend reinvestment plan (“DRIP”). During the year ended December 31, 2014, Encana issued 240,839 common shares totaling $5 million under the DRIP.
DIVIDENDS
For the year ended December 31, 2015, Encana paid dividends of $0.28 per common share totaling $225 million (2014 – $0.28 per common share totaling $207 million; 2013 – $0.67 per common share totaling $494 million). The Company’s quarterly dividend payment in 2015 and 2014 was $0.07 per common share. The quarterly dividend payment in 2013 was $0.20 per common share for the first three quarters and $0.07 per common share for the fourth quarter. Common shares issued as part of the Share Offering as described above were not eligible to receive the dividend paid on March 31, 2015.
92 Encana Corporation | ANNUAL REPORT 2015
CONSOLIDATED FINANCIAL STATEMENTS PREPARED
IN ACCORDANCE WITH U.S. GAAP IN US$MM
| Notes to Consolidated Financial Statements |
| (All amounts in $ millions, unless otherwise specified) |
For the year ended December 31, 2015, the dividends paid included $73 million in common shares as disclosed above, which were issued in lieu of cash dividends under the DRIP (2014 – $5 million; 2013 – $93 million).
On February 23, 2016, the Board declared a dividend of $0.015 per common share payable on March 31, 2016 to common shareholders of record as of March 15, 2016.
EARNINGS PER COMMON SHARE
The following table presents the computation of net earnings per common share:
| For the years ended December 31 (millions, except per share amounts) | 2015 | 2014 | 2013 | |||||||||
|
Net Earnings (Loss) Attributable to Common Shareholders |
$ | (5,165) | $ | 3,392 | $ | 236 | ||||||
| Number of Common Shares: |
||||||||||||
| Weighted average common shares outstanding - Basic |
822.1 | 741.0 | 737.7 | |||||||||
| Effect of dilutive securities |
- | - | - | |||||||||
| Weighted average common shares outstanding - Diluted |
822.1 | 741.0 | 737.7 | |||||||||
|
Net Earnings (Loss) per Common Share |
||||||||||||
| Basic |
$ | (6.28) | $ | 4.58 | $ | 0.32 | ||||||
| Diluted |
$ | (6.28) | $ | 4.58 | $ | 0.32 | ||||||
ENCANA STOCK OPTION PLAN
Encana has share-based compensation plans that allow employees to purchase common shares of the Company. Option exercise prices are not less than the market value of the common shares on the date the options are granted. Options granted are exercisable at 30 percent of the number granted after one year, an additional 30 percent of the number granted after two years, are fully exercisable after three years and expire five years after the date granted. Commencing in March 2015, options granted expire seven years after the date granted.
All options outstanding as at December 31, 2015 have associated Tandem Stock Appreciation Rights (“TSARs”) attached. In lieu of exercising the option, the associated TSARs give the option holder the right to receive a cash payment equal to the excess of the market price of Encana’s common shares at the time of the exercise over the original grant price. In addition, certain stock options granted are performance-based. The Performance TSARs vest and expire under the same terms and conditions as the underlying option. Vesting is also subject to Encana attaining prescribed performance relative to predetermined key measures. Historically, most holders of options with TSARs have elected to exercise their stock options as a Stock Appreciation Right (“SAR”) in exchange for a cash payment. As a result, Encana does not consider outstanding TSARs to be potentially dilutive securities. See Note 21 for further information on Encana’s outstanding and exercisable TSARs and Performance TSARs.
At December 31, 2015, there were 30.3 million common shares reserved for issuance under stock option plans (2014 – 27.3 million; 2013 – 19.1 million).
ENCANA RESTRICTED SHARE UNITS (“RSUs”)
Encana has a share-based compensation plan whereby eligible employees are granted RSUs. An RSU is a conditional grant to receive an Encana common share, or the cash equivalent, as determined by Encana, upon vesting of the RSUs and in accordance with the terms of the RSU Plan and Grant Agreement. The value of one RSU is notionally equivalent to one Encana common share. RSUs vest three years from the date granted, provided the employee remains actively employed with Encana on the vesting date. The Company intends to settle vested RSUs in cash on the vesting date. As a result, Encana does not consider RSUs to be potentially dilutive securities. See Note 21 for further information on Encana’s outstanding RSUs.
ANNUAL REPORT 2015 | Encana Corporation 93
CONSOLIDATED FINANCIAL STATEMENTS PREPARED
IN ACCORDANCE WITH U.S. GAAP IN US$MM
| Notes to Consolidated Financial Statements |
| (All amounts in $ millions, unless otherwise specified) |
| 17. Accumulated Other Comprehensive Income |
| For the years ended December 31 | 2015 | 2014 | ||||
| Foreign Currency Translation Adjustment |
||||||
| Balance, Beginning of Year |
$ 715 | $ | 693 | |||
| Change in Foreign Currency Translation Adjustment |
668 | 22 | ||||
| Balance, End of Year |
$ 1,383 | $ | 715 | |||
| Pension and Other Post-Employment Benefit Plans |
||||||
| Balance, Beginning of Year |
$ (26) | $ | (9) | |||
| Net Actuarial Gains and (Losses) and Plan Amendment (See Note 22) |
46 | (22) | ||||
| Income Taxes |
(15) | 7 | ||||
| Reclassification of Net Actuarial (Gains) and Losses to Net Earnings (See Note 22) |
2 | (1) | ||||
| Income Taxes |
- | - | ||||
| Reclassification of Net Prior Service Costs and (Credits) to Net Earnings (See Note 22) |
- | (1) | ||||
| Income Taxes |
- | - | ||||
| Balance, End of Year |
$ 7 | $ | (26) | |||
| Total Accumulated Other Comprehensive Income |
$ 1,390 | $ | 689 | |||
| 18. Noncontrolling Interest |
Initial Public Offering of Common Shares of PrairieSky
On May 29, 2014, Encana completed an initial public offering (“IPO”) of 52.0 million common shares of PrairieSky at a price of C$28.00 per common share for gross proceeds of approximately C$1.46 billion. On June 3, 2014, the over-allotment option granted to the underwriters to purchase up to an additional 7.8 million common shares was exercised in full for gross proceeds of approximately C$218.4 million. Encana received aggregate gross proceeds from the IPO of approximately C$1.67 billion ($1.54 billion). Subsequent to the IPO, Encana owned 70.2 million common shares of PrairieSky, representing a 54 percent ownership interest. Accordingly, Encana consolidated 100 percent of the financial position and results of operations of PrairieSky and recognized a noncontrolling interest for the third party ownership.
The noncontrolling interest in the former consolidated subsidiary, PrairieSky, was reflected as a separate component in the Consolidated Statement of Changes in Shareholders’ Equity for the year ended December 31, 2014. Encana recorded $117 million of the proceeds from the IPO as a noncontrolling interest and the remainder of the proceeds of $1,427 million, less transaction costs of $82 million, was recognized as paid in surplus as at December 31, 2014.
Secondary Public Offering of Common Shares of PrairieSky
On September 26, 2014, Encana completed the secondary offering of 70.2 million common shares of PrairieSky at a price of C$36.50 per common share, for aggregate gross proceeds to Encana of approximately C$2.6 billion. Following the completion of the secondary offering, Encana no longer held an interest in PrairieSky. As discussed in Note 4, the PrairieSky divestiture resulted in a significant alteration between capitalized costs and proved reserves in the Canadian cost centre. Accordingly, Encana recognized a gain on the divestiture of approximately $2,094 million, which is included in (gain) loss on divestitures in the Company’s Consolidated Statement of Earnings. In conjunction with the divestiture, Encana derecognized the carrying amount of the net assets of $258 million, including goodwill of $39 million, and the noncontrolling interest of $133 million.
Distributions to Noncontrolling Interest Owners
During the period from May 29, 2014 to September 25, 2014, PrairieSky paid dividends of C$0.3174 per common share totaling $38 million, of which $18 million was attributable to the noncontrolling interest as presented in the Consolidated Statement of Changes in Shareholders’ Equity and Consolidated Statement of Cash Flows.
94 Encana Corporation | ANNUAL REPORT 2015
CONSOLIDATED FINANCIAL STATEMENTS PREPARED
IN ACCORDANCE WITH U.S. GAAP IN US$MM
| Notes to Consolidated Financial Statements |
| (All amounts in $ millions, unless otherwise specified) |
Net Earnings Attributable to Noncontrolling Interest
During the period from May 29, 2014 to September 25, 2014, the Company held a controlling interest in PrairieSky. Accordingly, Encana consolidated 100 percent of the financial position and results of operations of PrairieSky and recognized a noncontrolling interest for the third party ownership. For the year ended December 31, 2014, net earnings and comprehensive income of $34 million were attributable to the noncontrolling interest as presented in the Consolidated Statement of Earnings and Consolidated Statement of Comprehensive Income.
| 19. Variable Interest Entities |
Production Field Centre
In 2008, Encana entered into a contract for the design, construction and operation of the PFC at its Deep Panuke facility. Upon commencement of operations in December 2013, Encana recognized the PFC as a capital lease asset as described in Note 9. Under the lease contract, Encana has a purchase option and the option to extend the lease for 12 one-year terms at fixed prices after the initial lease term expires in 2021.
As a result of the purchase option and fixed price renewal options, Encana has determined it holds variable interests and that the related leasing entity qualifies as a variable interest entity (“VIE”). Encana is not the primary beneficiary of the VIE as the Company does not have the power to direct the activities that most significantly impact the VIE’s economic performance. Encana is not required to provide any financial support or guarantees to the leasing entity or its affiliates, other than the contractual payments under the lease and operating agreements. Encana’s maximum exposure is the expected lease payments over the initial contract term. As at December 31, 2015, Encana had a capital lease obligation of $340 million (2014 – $462 million) related to the PFC.
Veresen Midstream Limited Partnership
On March 31, 2015, Encana, along with the Cutbank Ridge Partnership (“CRP”), entered into natural gas gathering and compression agreements with Veresen Midstream Limited Partnership (“VMLP”), under an initial term of 30 years with two potential five-year renewal terms. As part of the agreement, VMLP agreed to undertake future expansion of midstream services if required by Encana and the CRP in support of the anticipated future development of the Montney play. In addition, VMLP provides to Encana and the CRP natural gas gathering and processing under agreements that were contributed to VMLP by its partner Veresen Inc., and have remaining terms of 17 years and up to a potential maximum of 10 one-year renewal terms.
Encana has determined that VMLP is a VIE and that Encana holds variable interests in VMLP. Encana is not the primary beneficiary as the Company does not have the power to direct the activities that most significantly impact VMLP’s economic performance. These key activities relate to the construction, operation, maintenance and marketing of the assets owned by VMLP. The variable interests arise from certain terms under the long-term service agreements which include: i) a take or pay for volumes committed to certain gathering and processing assets; ii) an operating fee of which a portion can be converted into a fixed fee once VMLP assumes operatorship of certain compression assets; and iii) a potential payout of minimum costs associated with certain gathering and compression assets. The potential payout of minimum costs will be assessed in the eighth year of the assets’ service period and is based on whether there is an overall shortfall of total system cash flows from natural gas gathered and compressed under certain service agreements. The potential payout amount can be reduced in the event VMLP markets unutilized capacity to third party users. Encana is not required to provide any financial support or guarantees to VMLP.
As a result of Encana’s involvement with VMLP, the maximum total exposure, which represents the potential exposure to Encana in the event the assets under the agreements are deemed worthless, is estimated to be $1,195 million as at December 31, 2015. The estimate comprises the take or pay volume commitments and the potential payout of minimum costs. The take or pay volume commitments associated with certain gathering and processing assets are included in Note 26 under Transportation and Processing. The potential payout requirement is highly uncertain as the amount is contingent on future production estimates, pace of development
ANNUAL REPORT 2015 | Encana Corporation 95
CONSOLIDATED FINANCIAL STATEMENTS PREPARED
IN ACCORDANCE WITH U.S. GAAP IN US$MM
| Notes to Consolidated Financial Statements |
| (All amounts in $ millions, unless otherwise specified) |
and the amount of capacity contracted to third parties. As at December 31, 2015, there were no accounts payable and accrued liabilities outstanding related to the take or pay commitment.
| 20. Restructuring Charges |
In November 2013, Encana announced its plans to align the organizational structure in support of the Company’s strategy. Since the announcement, total restructuring charges primarily related to severance costs of $126 million, before tax, have been incurred, of which $4 million remained accrued as at December 31, 2015. For the year ended December 31, 2015, $2 million in restructuring charges were incurred (2014 – $36 million).
During the second quarter of 2015, Encana revised its plans to align the organizational structure in continued support of the Company’s strategy. During 2015, transition and severance costs of $62 million, before tax, were incurred, of which $9 million remained accrued as at December 31, 2015.
The remaining amounts accrued as noted above will be paid in early 2016. Restructuring charges are included in administrative expense in the Consolidated Statement of Earnings.
| 21. Compensation Plans |
Encana has a number of compensation arrangements under which the Company awards various types of long-term incentive grants to eligible employees. They include TSARs, Performance TSARs, SARs, Performance Share Units (“PSUs”), Deferred Share Units (“DSUs”) and RSUs. These compensation arrangements are share-based.
Encana accounts for TSARs, Performance TSARs, SARs, PSUs, and RSUs held by employees as cash-settled share-based payment transactions and, accordingly, accrues compensation costs over the vesting period based on the fair value of the rights determined using the Black-Scholes-Merton and other fair value models. TSARs and SARs granted vest and are exercisable at 30 percent of the number granted after one year, an additional 30 percent of the number granted after two years, are fully exercisable after three years and expire five years after the date granted. Commencing in March 2015, TSARs and SARs granted expire seven years after the date granted. Performance TSARs vest over a four-year period based on prescribed performance targets and expire if not eligible to vest after that time. PSUs and RSUs vest three years from the date of grant, provided the employee remains actively employed with Encana on the vesting date.
The following weighted average assumptions were used to determine the fair value of the share units held by employees:
| As at December 31, 2015 | US$ Share Units | C$ Share Units | ||||||
| Risk Free Interest Rate |
0.48% | 0.48% | ||||||
| Dividend Yield |
1.18% | 1.09% | ||||||
| Expected Volatility Rate |
39.16% | 36.45% | ||||||
| Expected Term |
1.4 yrs | 1.5 yrs | ||||||
| Market Share Price |
US$5.09 | C$7.03 | ||||||
| As at December 31, 2014 | US$ Share Units | C$ Share Units | ||||||
| Risk Free Interest Rate |
1.01% | 1.01% | ||||||
| Dividend Yield |
2.02% | 1.91% | ||||||
| Expected Volatility Rate |
30.66% | 29.11% | ||||||
| Expected Term |
1.5 yrs | 1.7 yrs | ||||||
| Market Share Price |
US$13.87 | C$16.17 | ||||||
Volatility was estimated using historical rates.
96 Encana Corporation | ANNUAL REPORT 2015
CONSOLIDATED FINANCIAL STATEMENTS PREPARED
IN ACCORDANCE WITH U.S. GAAP IN US$MM
| Notes to Consolidated Financial Statements |
| (All amounts in $ millions, unless otherwise specified) |
The Company has recognized the following share-based compensation costs:
| For the years ended December 31 | 2015 | 2014 | 2013 | |||||||
| Compensation Costs of Transactions Classified as Cash-Settled |
$ (29) | $ | 25 | $ | 63 | |||||
| Compensation Costs of Transactions Classified as Equity-Settled (1) |
- | (2 | ) | 3 | ||||||
| Total Share-Based Compensation Costs |
(29) | 23 | 66 | |||||||
| Less: Total Share-Based Compensation Costs Capitalized |
10 | (6 | ) | (22 | ) | |||||
| Total Share-Based Compensation Expense |
$ (19) | $ | 17 | $ | 44 | |||||
| Recognized on the Consolidated Statement of Earnings in: |
||||||||||
| Operating expense |
$ (7) | $ | 12 | $ | 18 | |||||
| Administrative expense |
(12) | 5 | 26 | |||||||
| $ (19) | $ | 17 | $ | 44 | ||||||
| (1) | RSUs may be settled in cash or equity as determined by Encana. The Company’s decision to cash settle RSUs was made subsequent to the original grant date. |
Included in the total share-based compensation for 2014 and 2013 are share units related to the 2009 corporate reorganization which include TSARs, Performance TSARs and SARs. During 2014 and 2013, Encana recorded a reduction in compensation costs of $2 million and $15 million related to the Cenovus share units, respectively. As at December 31, 2014, all remaining share units held by Cenovus employees have expired and there were no remaining obligations associated with the share plans from the 2009 corporate reorganization.
As at December 31, 2015, the liability for share-based payment transactions totaled $51 million (2014 – $99 million), of which $28 million (2014 – $29 million) is recognized in accounts payable and accrued liabilities and $23 million (2014 – $70 million) is recognized in other liabilities and provisions in the Consolidated Balance Sheet.
| For the years ended December 31 | 2015 | 2014 | 2013 | |||||||
| Liability for Cash-Settled Share-Based Payment Transactions: |
||||||||||
| Unvested |
$ 47 | $ | 78 | $ | 121 | |||||
| Vested |
4 | 21 | 48 | |||||||
| $ 51 | $ | 99 | $ | 169 | ||||||
ANNUAL REPORT 2015 | Encana Corporation 97
CONSOLIDATED FINANCIAL STATEMENTS PREPARED
IN ACCORDANCE WITH U.S. GAAP IN US$MM
| Notes to Consolidated Financial Statements |
| (All amounts in $ millions, unless otherwise specified) |
The following sections outline certain information related to Encana’s compensation plans as at December 31, 2015.
| A) | TANDEM STOCK APPRECIATION RIGHTS |
All options to purchase common shares issued under the Encana Stock Option Plan have associated TSARs attached. In lieu of exercising the option, the associated TSARs give the option holder the right to receive a cash payment equal to the excess of the market price of Encana’s common shares at the time of exercise over the original grant price. The TSARs vest and expire under the same terms and conditions as the underlying option.
The following tables summarize information related to the TSARs held by employees:
| As at December 31 | 2015 | 2014 | ||||||||||||||||||||||
| (thousands of units) | Outstanding TSARs |
Weighted Average Exercise Price (C$) |
Outstanding TSARs |
Weighted Average Exercise Price (C$) |
||||||||||||||||||||
|
Outstanding, Beginning of Year |
20,401 | 22.30 | 22,512 | 23.11 | ||||||||||||||||||||
| Granted |
1,934 | 14.42 | 5,271 | 20.57 | ||||||||||||||||||||
| Exercised - SARs |
- | - | (1,443 | ) | 19.84 | |||||||||||||||||||
| Exercised - Options |
- | - | (1 | ) | 18.06 | |||||||||||||||||||
| Forfeited |
(2,574 | ) | 20.89 | (4,656 | ) | 23.16 | ||||||||||||||||||
| Expired |
(2,392 | ) | 32.63 | (1,282 | ) | 29.06 | ||||||||||||||||||
| Outstanding, End of Year |
17,369 | 20.21 | 20,401 | 22.30 | ||||||||||||||||||||
| Exercisable, End of Year |
9,981 | 21.71 | 9,951 | 25.40 | ||||||||||||||||||||
| As at December 31, 2015 |
Outstanding TSARs |
Exercisable TSARs | ||||||||||||||||||||||
| Range of Exercise Price (C$) | Number of TSARs |
Weighted Average Remaining Contractual Life (years) |
Weighted Average Exercise Price (C$) |
Number of TSARs |
Weighted Average Exercise Price (C$) |
|||||||||||||||||||
|
10.00 to 19.99 |
8,015 | 3.06 | 17.25 | 3,606 | 18.10 | |||||||||||||||||||
| 20.00 to 29.99 |
7,659 | 2.15 | 20.90 | 4,680 | 21.09 | |||||||||||||||||||
| 30.00 to 39.99 |
1,695 | 0.14 | 31.08 | 1,695 | 31.08 | |||||||||||||||||||
| 17,369 | 2.37 | 20.21 | 9,981 | 21.71 | ||||||||||||||||||||
During the year, Encana recorded a reduction in compensation costs of $12 million related to the TSARs (2014 – reduction of compensation costs of $15 million; 2013 – compensation costs of $21 million).
As at December 31, 2015, there was approximately $1 million of total unrecognized compensation costs (2014 – $5 million) related to unvested TSARs held by employees. The costs are expected to be recognized over a weighted average period of 1.5 years.
| B) | PERFORMANCE TANDEM STOCK APPRECIATION RIGHTS |
In 2013, Encana granted Performance TSARs to the President & Chief Executive Officer. The Performance TSARs vest and expire over the same terms and conditions as the underlying option. Under this 2013 grant, vesting is also subject to Encana achieving prescribed performance targets over a four-year period based on Encana’s share price performance. Performance TSARs that do not vest when eligible are forfeited and cancelled. As at December 31, 2015, there were 934,830 outstanding (exercisable – nil) Performance TSARs under this grant with a weighted average exercise price of C$18.00 and a weighted average remaining contractual life of 2.45 years.
98 Encana Corporation | ANNUAL REPORT 2015
CONSOLIDATED FINANCIAL STATEMENTS PREPARED
IN ACCORDANCE WITH U.S. GAAP IN US$MM
| Notes to Consolidated Financial Statements |
| (All amounts in $ millions, unless otherwise specified) |
During the year, Encana recorded a reduction in compensation costs of $1 million related to the Performance TSARs (2014 – compensation costs of $1 million; 2013 – compensation costs of $1 million).
As at December 31, 2015, there were no unrecognized compensation costs (2014 – $1 million) related to unvested Performance TSARs.
| C) | STOCK APPRECIATION RIGHTS |
Since 2010, U.S. dollar denominated SARs have been granted to eligible U.S. based employees, which entitle the employee to receive a cash payment equal to the excess of the market price of Encana’s common shares at the time of exercise over the original grant price of the right.
The following tables summarize information related to U.S. dollar denominated SARs held by employees:
| As at December 31 | 2015 | 2014 | ||||||||||||||||||
| (thousands of units) | Outstanding SARs |
Weighted |
Outstanding SARs |
Weighted Average Exercise Price (US$) |
||||||||||||||||
| Outstanding, Beginning of Year |
12,264 | 23.04 | 14,930 | 23.79 | ||||||||||||||||
| Granted |
1,444 | 12.30 | 3,139 | 19.10 | ||||||||||||||||
| Exercised |
- | - | (1,095 | ) | 19.96 | |||||||||||||||
| Forfeited |
(1,338 | ) | 20.00 | (4,667 | ) | 23.49 | ||||||||||||||
| Expired |
(2,233 | ) | 30.58 | (43 | ) | 26.04 | ||||||||||||||
| Outstanding, End of Year |
10,137 | 20.26 | 12,264 | 23.04 | ||||||||||||||||
| Exercisable, End of Year |
6,149 | 22.49 | 7,310 | 25.97 | ||||||||||||||||
| As at December 31, 2015 | Outstanding SARs | Exercisable SARs | ||||||||||||||||||
| Range of Exercise Price (US$) | Number of SARs (thousands of units) |
Weighted |
Weighted Average Exercise Price (US$) |
Number of SARs (thousands of units) |
Weighted Average Exercise Price (US$) |
|||||||||||||||
| 10.00 to 19.99 |
5,747 | 3.20 | 16.96 | 2,102 | 18.12 | |||||||||||||||
| 20.00 to 29.99 |
2,978 | 1.26 | 21.31 | 2,635 | 21.15 | |||||||||||||||
| 30.00 to 39.99 |
1,412 | 0.13 | 31.49 | 1,412 | 31.49 | |||||||||||||||
| 10,137 | 2.20 | 20.26 | 6,149 | 22.49 | ||||||||||||||||
During the year, Encana recorded a reduction of compensation costs of $5 million related to the SARs (2014 – reduction of compensation costs of $2 million; 2013 – compensation costs of $1 million).
As at December 31, 2015, there were no unrecognized compensation costs (2014 – $2 million) related to unvested SARs held by employees.
| D) | PERFORMANCE SHARE UNITS |
Since 2010, PSUs have been granted to eligible employees, which entitle the employee to receive, upon vesting, a cash payment equal to the value of one common share of Encana for each PSU held, depending upon the terms of the PSU Plan. PSUs vest three years from the date granted, provided the employee remains actively employed with Encana on the vesting date. Based on the performance assessment, up to a maximum of two times the original PSU grant may be eligible to vest in respect of the year being measured. The respective proportion of the original PSU grant deemed eligible to vest for each year will be valued and the notional cash value deposited to a PSU account, with payout deferred to the final vesting date.
ANNUAL REPORT 2015 | Encana Corporation 99
CONSOLIDATED FINANCIAL STATEMENTS PREPARED
IN ACCORDANCE WITH U.S. GAAP IN US$MM
| Notes to Consolidated Financial Statements |
| (All amounts in $ millions, unless otherwise specified) |
The ultimate value of the PSUs will depend upon Encana’s performance relative to predetermined corresponding performance targets measured over a three-year period. For grants during 2010 through 2012, performance is measured relative to an internal recycle ratio as assessed by the Board on an annual basis to determine whether the performance criteria have been met. For grants commencing in 2013, performance is measured over a three-year period relative to a specified peer group.
The following tables summarize information related to the PSUs:
| (thousands of units) | Canadian Dollar Denominated Outstanding PSUs | |||
| As at December 31 |
2015 |
2014 | ||
| Unvested and Outstanding, Beginning of Year |
1,222 | 1,134 | ||
| Granted |
1,438 | 457 | ||
| Deemed Eligible to Vest |
(36) | (211) | ||
| Units, in Lieu of Dividends |
97 | 18 | ||
| Forfeited |
(118) | (176) | ||
| Unvested and Outstanding, End of Year |
2,603 | 1,222 | ||
| (thousands of units) | U.S. Dollar Denominated Outstanding PSUs | |||
| As at December 31 |
2015 |
2014 | ||
|
Unvested and Outstanding, Beginning of Year |
278 | 363 | ||
| Granted |
845 | 167 | ||
| Deemed Eligible to Vest |
(5) | (173) | ||
| Units, in Lieu of Dividends |
40 | 4 | ||
| Forfeited |
(133) | (83) | ||
| Unvested and Outstanding, End of Year |
1,025 | 278 | ||
During the year, Encana recorded compensation costs of $1 million related to the outstanding PSUs (2014 – $4 million; 2013 – $11 million).
As at December 31, 2015, there was approximately $10 million of total unrecognized compensation costs (2014 – $12 million) related to unvested PSUs held by employees. The costs are expected to be recognized over a weighted average period of 1.5 years.
| E) | DEFERRED SHARE UNITS |
The Company has in place a program whereby Directors and certain key employees are issued DSUs, which vest immediately, are equivalent in value to a common share of the Company and are settled in cash.
Under the DSU Plan, employees have the option to convert either 25 or 50 percent of their annual High Performance Results (“HPR”) award into DSUs. The number of DSUs converted is based on the value of the award divided by the closing value of Encana’s share price at the end of the performance period of the HPR award.
For both Directors and employees, DSUs can only be redeemed following departure from Encana in accordance with the terms of the respective DSU Plan and must be redeemed prior to December 15th of the year following the departure from Encana.
100 Encana Corporation | ANNUAL REPORT 2015
CONSOLIDATED FINANCIAL STATEMENTS PREPARED
IN ACCORDANCE WITH U.S. GAAP IN US$MM
| Notes to Consolidated Financial Statements |
| (All amounts in $ millions, unless otherwise specified) |
The following table summarizes information related to the DSUs:
| (thousands of units) | Canadian Dollar Denominated Outstanding DSUs |
|||||||
| As at December 31 |
2015 |
2014 | ||||||
|
Outstanding, Beginning of Year |
891 | 1,027 | ||||||
| Granted |
41 | 152 | ||||||
| Converted from HPR awards |
139 | - | ||||||
| Units, in Lieu of Dividends |
32 | 14 | ||||||
| Redeemed |
(350 | ) | (302 | ) | ||||
| Outstanding, End of Year |
753 | 891 | ||||||
During the year, Encana recorded a reduction of compensation costs of $5 million related to the outstanding DSUs (2014 – compensation costs of $1 million; 2013 – compensation costs of $2 million).
| F) | RESTRICTED SHARE UNITS |
Since 2011, RSUs have been granted to eligible employees. An RSU is a conditional grant to receive an Encana common share, or the cash equivalent, as determined by Encana, upon vesting of the RSUs and in accordance with the terms of the RSU Plan and Grant Agreement. The value of one RSU is notionally equivalent to one Encana common share. RSUs vest three years from the date granted, provided the employee remains actively employed with Encana on the vesting date. As at December 31, 2015, Encana plans to settle the RSUs in cash on the vesting date.
The following tables summarize information related to the RSUs:
| (thousands of units) | Canadian Dollar Denominated Outstanding RSUs |
|||||||
| As at December 31 |
2015 |
2014 | ||||||
|
Unvested and Outstanding, Beginning of Year |
5,887 | 5,130 | ||||||
| Granted |
3,381 | 2,785 | ||||||
| Units, in Lieu of Dividends |
306 | 94 | ||||||
| Vested and Released |
(206 | ) | (1,368 | ) | ||||
| Forfeited |
(1,254 | ) | (754 | ) | ||||
| Unvested and Outstanding, End of Year |
8,114 | 5,887 | ||||||
| (thousands of units) | U.S. Dollar Denominated Outstanding RSUs |
|||||||
| As at December 31 |
2015 |
2014 | ||||||
|
Unvested and Outstanding, Beginning of Year |
3,110 | 3,475 | ||||||
| Granted |
3,206 | 1,767 | ||||||
| Units, in Lieu of Dividends |
218 | 51 | ||||||
| Vested and Released |
(51 | ) | (1,071 | ) | ||||
| Forfeited |
(574 | ) | (1,112 | ) | ||||
| Unvested and Outstanding, End of Year |
5,909 | 3,110 | ||||||
During the year, Encana recorded a reduction of compensation costs of $7 million related to the outstanding RSUs (2014 – compensation costs of $36 million; 2013 – compensation costs of $45 million). As at December 31, 2015, $11 million of the paid in surplus balance related to the RSUs (2014 – $11 million).
As at December 31, 2015, there was approximately $26 million of total unrecognized compensation costs (2014 – $57 million) related to unvested RSUs held by employees. The costs are expected to be recognized over a weighted average period of 1.3 years.
ANNUAL REPORT 2015 | Encana Corporation 101
CONSOLIDATED FINANCIAL STATEMENTS PREPARED
IN ACCORDANCE WITH U.S. GAAP IN US$MM
| Notes to Consolidated Financial Statements |
| (All amounts in $ millions, unless otherwise specified) |
| 22. Pension and Other Post-Employment Benefits | ||
The Company sponsors defined benefit and defined contribution plans and provides pension and other post-employment benefits (“OPEB”) to its employees in Canada and the U.S. As of January 1, 2003, the defined benefit pension plan was closed to new entrants. The average remaining service period of active employees participating in the defined benefit pension plan is four years. The average remaining service period of the active employees participating in the OPEB plan is 13 years.
The Company is required to file an actuarial valuation of its pension plans with the provincial regulator at least every three years, or more frequently if directed by the regulator. The most recent filing was dated December 31, 2013 and the next required filing is expected to be as at December 31, 2016.
The following tables set forth changes in the benefit obligations and fair value of plan assets for the Company’s defined benefit pension and other post-employment benefit plans for the years ended December 31, 2015 and 2014, as well as the funded status of the plans and amounts recognized in the Consolidated Financial Statements as at December 31, 2015 and 2014.
| Pension Benefits | OPEB | |||||||||||||||
| As at December 31 | 2015 | 2014 | 2015 | 2014 | ||||||||||||
| Change in Benefit Obligations |
||||||||||||||||
| Projected Benefit Obligation, Beginning of Year |
$ | 279 | $ | 287 | $ | 114 | $ 93 | |||||||||
| Service cost |
2 | 3 | 10 | 10 | ||||||||||||
| Interest cost |
9 | 12 | 4 | 4 | ||||||||||||
| Actuarial (gains) losses |
(23 | ) | 19 | (24 | ) | 14 | ||||||||||
| Exchange differences |
(38 | ) | (22 | ) | (3 | ) | (3) | |||||||||
| Employee contributions |
- | - | 1 | 1 | ||||||||||||
| Benefits paid |
(17 | ) | (20 | ) | (6 | ) | (5) | |||||||||
| Projected Benefit Obligation, End of Year |
$ | 212 | $ | 279 | $ | 96 | $ 114 | |||||||||
| Change in Plan Assets |
||||||||||||||||
| Fair Value of Plan Assets, Beginning of Year |
$ | 264 | $ | 291 | $ | - | $ - | |||||||||
| Actual return on plan assets |
11 | 26 | - | - | ||||||||||||
| Exchange differences |
(41 | ) | (25 | ) | - | - | ||||||||||
| Employee contributions |
- | - | |
1 |
|
1 | ||||||||||
| Employer contributions |
- | 2 | 5 | 4 | ||||||||||||
| Benefits paid |
(17 | ) | (20 | ) | (6 | ) | (5) | |||||||||
| Transfers to defined contribution plan |
(9 | ) | (10 | ) | - | - | ||||||||||
| Fair Value of Plan Assets, End of Year |
$ | 208 | $ | 264 | $ | - | $ - | |||||||||
|
Funded Status of Plan Assets, End of Year |
$ | (4 | ) | $ | (15 | ) | $ | (96 | ) | $ (114) | ||||||
| Total Recognized Amounts in the Consolidated Balance Sheet Consist of: |
||||||||||||||||
| Other assets |
$ | 2 | $ | 4 | $ | - | $ - | |||||||||
| Current liabilities |
- | - | (6 | ) | (7) | |||||||||||
| Non-current liabilities |
(6 | ) | (19 | ) | (90 | ) | (107) | |||||||||
| Total |
$ | (4 | ) | $ | (15 | ) | $ | (96 | ) | $ (114) | ||||||
| Total Recognized Amounts in Accumulated Other Comprehensive Income Consist of: |
||||||||||||||||
| Net actuarial (gain) loss |
$ | 20 | $ | 44 | $ | (15 | ) | $ 9 | ||||||||
| Prior service costs |
(5 | ) | (5 | ) | (7 | ) | (7) | |||||||||
| Total recognized in accumulated other comprehensive income, before tax |
$ | 15 | $ | 39 | $ | (22 | ) | $ 2 | ||||||||
102 Encana Corporation | ANNUAL REPORT 2015
CONSOLIDATED FINANCIAL STATEMENTS PREPARED
IN ACCORDANCE WITH U.S. GAAP IN US$MM
| Notes to Consolidated Financial Statements |
| (All amounts in $ millions, unless otherwise specified) |
The accumulated defined benefit obligation for all defined benefit plans was $293 million as at December 31, 2015 (2014 – $374 million).
The following table sets forth the defined benefit plans with accumulated benefit obligation and projected benefit obligation in excess of the plan assets fair value:
|
Pension Benefits |
OPEB | |||||||||||||||
| As at December 31 | 2015 | 2014 | 2015 | 2014 | ||||||||||||
| Projected Benefit Obligation |
$ | (64 | ) | $ | (279) | $ | (96 | ) | $ | (114 | ) | |||||
| Accumulated Benefit Obligation |
(51 | ) | (260) | (96 | ) | (114 | ) | |||||||||
| Fair Value of Plan Assets |
58 | 260 | - | - | ||||||||||||
Following are the weighted average assumptions used by the Company in determining the defined benefit pension and other post-employment benefit obligations:
|
Pension Benefits |
OPEB | |||||||||||||
| As at December 31 | 2015 | 2014 | 2015 | 2014 | ||||||||||
| Discount Rate |
3.75% | 3.75% | 4.02% | 3.67% | ||||||||||
| Rates of Increase in Compensation Levels |
3.49% | 3.99% | 5.04% | 6.39% | ||||||||||
The following sets forth total benefit plan expense recognized by the Company:
|
Pension Benefits |
OPEB | |||||||||||||||||||||
| For the years ended December 31 | 2015 | 2014 | 2013 | 2015 | 2014 | 2013 | ||||||||||||||||
| Defined Benefit Plan Expense |
$ | 1 | $ | - | $ | 21 | $ | 14 | $ | 12 | $11 | |||||||||||
| Defined Contribution Plan Expense |
33 | 34 | 43 | - | - | - | ||||||||||||||||
| Total Benefit Plans Expense |
$ | 34 | $ | 34 | $ | 64 | $ | 14 | $ | 12 | $ 11 | |||||||||||
|
Of the total benefit plans expense, $39 million (2014 – $36 million; 2013 – $60 million) was included in operating expense and $9 million (2014 – $10 million; 2013 – $15 million) was included in administrative expense.
The defined periodic pension and OPEB expense are as follows:
| ||||||||||||||||||||||
|
Pension Benefits |
OPEB | |||||||||||||||||||||
| For the years ended December 31 | 2015 | 2014 | 2013 | 2015 | 2014 | 2013 | ||||||||||||||||
| Current service cost |
$ | 2 | $ | 3 | $ | 4 | $ | 10 | $ | 10 | $ 12 | |||||||||||
| Interest cost |
9 | 12 | 12 | 4 | 4 | 4 | ||||||||||||||||
| Expected return on plan assets |
(12 | ) | (15 | ) | (16 | ) | - | - | - | |||||||||||||
| Amounts reclassified from accumulated other comprehensive income: |
||||||||||||||||||||||
| Amortization of net actuarial (gains) and losses |
2 | - | 11 | - | (1 | ) | - | |||||||||||||||
| Amortization of net prior service costs |
- | - | - | - | (1 | ) | - | |||||||||||||||
| Settlement |
- | - | 5 | - | - | - | ||||||||||||||||
| Curtailment |
- | - | 1 | - | - | (5) | ||||||||||||||||
| Special termination benefits |
- | - | 4 | - | - | - | ||||||||||||||||
| Total Defined Benefit Plan Expense |
$ | 1 | $ | - | $ | 21 | $ | 14 | $ | 12 | $ 11 | |||||||||||
ANNUAL REPORT 2015 | Encana Corporation 103
CONSOLIDATED FINANCIAL STATEMENTS PREPARED
IN ACCORDANCE WITH U.S. GAAP IN US$MM
| Notes to Consolidated Financial Statements |
| (All amounts in $ millions, unless otherwise specified) |
The amounts recognized in other comprehensive income are as follows:
|
Pension Benefits |
OPEB | |||||||||||||||||||||||||
| For the years ended December 31 | 2015 | 2014 | 2013 | 2015 | 2014 | 2013 | ||||||||||||||||||||
| Net actuarial (gains) losses |
$ | (22 | ) | $ | 8 | $ | (46 | ) | $ | (24 | ) | $ | 14 | $ | (6 | ) | ||||||||||
| Plan amendment |
- | - | - | - | - | |
(13 |
) | ||||||||||||||||||
| Amortization of net actuarial gains and (losses) |
(2 | ) | - | (11 | ) | - | 1 | - | ||||||||||||||||||
| Amortization of net prior service costs |
- | - | - | - | 1 | - | ||||||||||||||||||||
| Settlement and curtailment |
- | - | (6 | ) | - | - | - | |||||||||||||||||||
| Total amounts recognized in other comprehensive (income) loss, before tax |
$ | (24 | ) | $ | 8 | $ | (63 | ) | $ | (24 | ) | $ | 16 | $ | (19 | ) | ||||||||||
| Total amounts recognized in other comprehensive (income) loss, after tax |
$ | (17 | ) | $ | 6 | $ | (46 | ) | $ | (16 | ) | $ | 11 | $ | (14 | ) | ||||||||||
The estimated net actuarial loss and net prior service costs for the pension and other post-retirement plans that will be amortized from accumulated other comprehensive income into net benefit plan recovery in 2016 is $1 million.
Following are the weighted average assumptions used by the Company in determining the net periodic pension and other post-retirement benefit costs:
|
Pension Benefits |
OPEB | |||||||||||||||||||||
| For the years ended December 31 | 2015 | 2014 | 2013 | 2015 | 2014 | 2013 | ||||||||||||||||
| Discount Rate |
3.75% | 4.50% | 4.25% | 3.66% | 4.49% | 3.59% | ||||||||||||||||
| Long-Term Rate of Return on Plan Assets |
6.25% | 6.50% | 6.75% | - | - | - | ||||||||||||||||
| Rates of Increase in Compensation Levels |
3.99% | 3.99% | 3.99% | 6.47% | 6.50% | 6.35% | ||||||||||||||||
|
The Company’s assumed health care cost trend rates are as follows:
| ||||||||||||||||||||||
| For the years ended December 31 | 2015 | 2014 | 2013 | |||||||||||||||||||
| Health care cost trend rate for next year |
7.41% | 7.00% | 7.31% | |||||||||||||||||||
| Rate to which the cost trend rate is assumed to decline (ultimate trend rate) |
|
5.00% | 4.59% | 4.61% | ||||||||||||||||||
| Year that the rate reaches the ultimate trend rate |
2026 | 2024 | 2026 | |||||||||||||||||||
A one percent change in the assumed health care cost trend rate over the projected period would have the following effects:
|
1% Increase |
1% Decrease | |||||||
| Effect on total of service and interest cost components |
$ | 2 | $ | (2) | ||||
| Effect on other post-retirement benefit obligations |
$ | 7 | $ | (6) | ||||
The Company does not expect to contribute to its defined benefit pension plans in 2016. The Company’s OPEB plans are funded on an as required basis.
104 Encana Corporation | ANNUAL REPORT 2015
CONSOLIDATED FINANCIAL STATEMENTS PREPARED
IN ACCORDANCE WITH U.S. GAAP IN US$MM
| Notes to Consolidated Financial Statements |
| (All amounts in $ millions, unless otherwise specified) |
The following provides an estimate of benefit payments for the next 10 years. These estimates reflect benefit increases due to continuing employee service.
| Defined Benefit Pension Payments |
Other Benefit Payments |
|||||||
| 2016 |
$ | 15 | $ | 6 | ||||
| 2017 |
15 | 7 | ||||||
| 2018 |
15 | 7 | ||||||
| 2019 |
15 | 8 | ||||||
| 2020 |
16 | 8 | ||||||
| 2021 – 2025 |
72 | 42 | ||||||
The Company’s defined benefit pension plan assets are presented by investment asset category and input level within the fair value hierarchy as follows:
| As at December 31 | 2015 | |||||||||||||||
| Level 1 | Level 2 | Level 3 | Total | |||||||||||||
| Investments: |
||||||||||||||||
| Cash and Cash Equivalents |
$ | 28 | $ | 1 | $ | - | $ | 29 | ||||||||
| Fixed Income – Canadian Bond Funds |
- | 66 | - | 66 | ||||||||||||
| Equity – Domestic |
13 | 36 | - | 49 | ||||||||||||
| Equity – International |
- | 53 | - | 53 | ||||||||||||
| Real Estate and Other |
1 | - | 10 | 11 | ||||||||||||
| Fair Value of Plan Assets, End of Year |
$ | 42 | $ | 156 | $ | 10 | $ | 208 | ||||||||
| As at December 31 | 2014 | |||||||||||||||
| Level 1 | Level 2 | Level 3 | Total | |||||||||||||
| Investments: |
||||||||||||||||
| Cash and Cash Equivalents |
$ | 34 | $ | 1 | $ | - | $ | 35 | ||||||||
| Fixed Income – Canadian Bond Funds |
- | 82 | - | 82 | ||||||||||||
| Equity – Domestic |
20 | 50 | - | 70 | ||||||||||||
| Equity – International |
- | 64 | - | 64 | ||||||||||||
| Real Estate and Other |
1 | - | 12 | 13 | ||||||||||||
| Fair Value of Plan Assets, End of Year |
$ | 55 | $ | 197 | $ | 12 | $ | 264 | ||||||||
Fixed income investments consist of Canadian bonds issued by investment grade companies. Equity investments consist of both domestic and international securities. The fair values of these securities are based on dealer quotes, quoted market prices, and net asset values as provided by the investment managers. Real Estate and Other consists mainly of commercial properties and is valued based on a discounted cash flow model.
A summary in changes in Level 3 fair value measurements is presented below:
| Real Estate and Other | ||||||||
| As at December 31 | 2015 | 2014 | ||||||
| Balance, Beginning of Year |
$ | 12 | $ | 13 | ||||
| Purchases, issuances and settlements |
||||||||
| Purchases |
- | - | ||||||
| Settlements |
- | - | ||||||
| Actual return on plan assets |
||||||||
| Relating to assets sold during the reporting period |
- | - | ||||||
| Relating to assets still held at the reporting date |
(2 | ) | (1 | ) | ||||
| Transfers in and out of Level 3 |
- | - | ||||||
| Balance, End of Year |
$ | 10 | $ | 12 | ||||
ANNUAL REPORT 2015 | Encana Corporation 105
CONSOLIDATED FINANCIAL STATEMENTS PREPARED
IN ACCORDANCE WITH U.S. GAAP IN US$MM
| Notes to Consolidated Financial Statements |
| (All amounts in $ millions, unless otherwise specified) |
The Company’s pension plan assets were invested in the following as at December 31, 2015: 24 percent Domestic Equity (2014 – 26 percent), 26 percent Foreign Equity (2014 – 24 percent), 44 percent Bonds (2014 – 44 percent), and 6 percent Real Estate and Other (2014 – 6 percent). The expected long-term rate of return is 6.25 percent. The expected rate of return on pension plan assets is based on historical and projected rates of return for each asset class in the plan investment portfolio. The actual return on plan assets was $11 million (2014 – $26 million). The asset allocation structure is subject to diversification requirements and constraints, which reduce risk by limiting exposure to individual equity investment, credit rating categories and foreign currency exposure.
| 23. Fair Value Measurements |
The fair values of cash and cash equivalents, accounts receivable and accrued revenues, and accounts payable and accrued liabilities approximate their carrying amounts due to the short-term maturity of those instruments. The fair value of cash in reserve approximates its carrying amount due to the nature of the instrument held. Fair value information related to pension plan assets is included in Note 22.
Recurring fair value measurements are performed for risk management assets and liabilities and other derivative liabilities, as discussed further in Note 24. These items are carried at fair value in the Consolidated Balance Sheet and are classified within the three levels of the fair value hierarchy in the following tables. There have been no transfers between the hierarchy levels during the period.
| As at December 31, 2015 |
Level
1 |
Level 2 Other |
Level 3 Significant Unobservable Inputs |
Total Fair Value |
Netting (1) | Carrying Amount |
||||||||||||||||||
| Risk Management |
||||||||||||||||||||||||
| Risk Management Assets |
||||||||||||||||||||||||
| Current |
$ | 1 | $ | 356 | $ | 37 | $ | 394 | $ | (27) | $ | 367 | ||||||||||||
| Long-term |
- | 11 | - | 11 | - | 11 | ||||||||||||||||||
| Risk Management Liabilities |
||||||||||||||||||||||||
| Current |
- | 31 | 12 | 43 | (27) | 16 | ||||||||||||||||||
| Long-term |
- | - | 9 | 9 | - | 9 | ||||||||||||||||||
| Other Derivative Liabilities |
||||||||||||||||||||||||
| Current in accounts payable and accrued liabilities |
$ | - | $ | 6 | $ | - | $ | 6 | $ | - | $ | 6 | ||||||||||||
| Long-term in other liabilities and provisions |
- | 23 | - | 23 | - | 23 | ||||||||||||||||||
| As at December 31, 2014 |
Level
1 |
Level 2 Other |
Level 3 Significant Unobservable Inputs |
Total Fair Value |
Netting (1) | Carrying Amount |
||||||||||||||||||
| Risk Management |
||||||||||||||||||||||||
| Risk Management Assets |
||||||||||||||||||||||||
| Current |
$ | - | $ | 718 | $ | - | $ | 718 | $ | (11) | $ | 707 | ||||||||||||
| Long-term |
- | 67 | - | 67 | (2) | 65 | ||||||||||||||||||
| Risk Management Liabilities |
||||||||||||||||||||||||
| Current |
6 | 14 | 11 | 31 | (11) | 20 | ||||||||||||||||||
| Long-term |
- | 2 | 7 | 9 | (2) | 7 | ||||||||||||||||||
| (1) | Netting to offset derivative assets and liabilities where the legal right and intention to offset exists, or where counterparty master netting arrangements contain provisions for net settlement. |
106 Encana Corporation | ANNUAL REPORT 2015
CONSOLIDATED FINANCIAL STATEMENTS PREPARED
IN ACCORDANCE WITH U.S. GAAP IN US$MM
| Notes to Consolidated Financial Statements |
| (All amounts in $ millions, unless otherwise specified) |
The Company’s Level 1 and Level 2 risk management assets and liabilities consist of commodity fixed price contracts, NYMEX three-way options, NYMEX costless collars and basis swaps with terms to 2018. Level 2 also includes other derivative liabilities as discussed in Note 24. The fair values of these contracts are based on a market approach and are estimated using inputs which are either directly or indirectly observable at the reporting date, such as exchange and other published prices, broker quotes and observable trading activity.
Level 3 Fair Value Measurements
As at December 31, 2015, the Company’s Level 3 risk management assets and liabilities consist of power purchase contracts with terms to 2017 and WTI three-way options with terms to 2016. The fair values of the power purchase contracts are based on the income approach and are modelled internally using observable and unobservable inputs such as forward power prices in less active markets. The WTI three-way options are a combination of a sold call, bought put and a sold put. These contracts allow the Company to participate in the upside of commodity prices to the ceiling of the call option and provide the Company with partial downside price protection through the combination of the put options. The fair values of the WTI three-way options are based on the income approach and are modelled using observable and unobservable inputs such as implied volatility. The unobservable inputs are obtained from third parties whenever possible and reviewed by the Company for reasonableness.
Changes in amounts related to risk management assets and liabilities are recognized in revenues and transportation and processing expense according to their purpose.
A summary of changes in Level 3 fair value measurements is presented below:
| Risk Management | ||||||||
| 2015 | 2014 | |||||||
| Balance, Beginning of Year |
$ (18) | $ (7) | ||||||
| Total gains (losses) |
18 | (19) | ||||||
| Purchases, issuances and settlements: |
||||||||
| Purchases |
- | - | ||||||
| Settlements |
16 | 8 | ||||||
| Transfers in and out of Level 3 |
- | - | ||||||
| Balance, End of Year |
$ 16 | $ (18) | ||||||
| Change in unrealized gains (losses) related to assets and liabilities held at end of year |
$ 24 | $ (13) | ||||||
|
Quantitative information about unobservable inputs used in Level 3 fair value measurements is presented below:
| ||||||||
| As at December 31 | Valuation Technique | Unobservable Input | 2015 | 2014 | ||||
| Risk Management – Power |
Discounted Cash Flow |
Forward prices ($/Megawatt Hour) |
$34.50 - $40.25 | $40.70 - $48.50 | ||||
| Risk Management – WTI Three-Way Options |
Option Model | Implied Volatility | 33% - 64% | - | ||||
A 10 percent increase or decrease in estimated forward power prices would cause a corresponding $4 million (2014 – $5 million) increase or decrease to net risk management assets and liabilities. A 10 percent increase or decrease in implied volatility for the WTI three-way options would cause a corresponding $2 million increase or decrease to net risk management assets and liabilities (2014 – nil).
ANNUAL REPORT 2015 | Encana Corporation 107
CONSOLIDATED FINANCIAL STATEMENTS PREPARED
IN ACCORDANCE WITH U.S. GAAP IN US$MM
| Notes to Consolidated Financial Statements |
| (All amounts in $ millions, unless otherwise specified) |
| 24. Financial Instruments and Risk Management |
| A) | FINANCIAL INSTRUMENTS |
Encana’s financial assets and liabilities are recognized in cash and cash equivalents, accounts receivable and accrued revenues, cash in reserve, accounts payable and accrued liabilities, risk management assets and liabilities, other liabilities and provisions and long-term debt.
| B) | RISK MANAGEMENT ASSETS AND LIABILITIES |
Risk management assets and liabilities arise from the use of derivative financial instruments and are measured at fair value. See Note 23 for a discussion of fair value measurements.
UNREALIZED RISK MANAGEMENT POSITION
| As at December 31 | 2015 | 2014 | ||||||
| Risk Management Assets |
||||||||
| Current |
$ | 367 | $ | 707 | ||||
| Long-term |
11 | 65 | ||||||
| 378 | 772 | |||||||
| Risk Management Liabilities |
||||||||
| Current |
16 | 20 | ||||||
| Long-term |
9 | 7 | ||||||
| 25 | 27 | |||||||
| Other Derivative Liabilities |
||||||||
| Current in accounts payable and accrued liabilities |
6 | - | ||||||
| Long-term in other liabilities and provisions |
23 | - | ||||||
| Net Risk Management Assets and Other Derivative Liabilities |
$ | 324 | $ | 745 | ||||
SUMMARY OF UNREALIZED RISK MANAGEMENT POSITIONS
| As at December 31 |
2015 |
2014 |
||||||||||||||||||||||
| Risk Management | Risk Management | |||||||||||||||||||||||
| Asset | Liability | Net | Asset | Liability | Net | |||||||||||||||||||
| Commodity Prices |
||||||||||||||||||||||||
| Natural gas |
$ | 53 | $ | 4 | $ | 49 | $ | 609 | $ | 5 | $ | 604 | ||||||||||||
| Crude oil |
325 | - | 325 | 163 | 4 | 159 | ||||||||||||||||||
| Power and other derivative contracts |
- | 50 | (50) | - | 18 | (18) | ||||||||||||||||||
| Total Fair Value |
$ | 378 | $ | 54 | $ | 324 | $ | 772 | $ | 27 | $ | 745 | ||||||||||||
108 Encana Corporation | ANNUAL REPORT 2015
CONSOLIDATED FINANCIAL STATEMENTS PREPARED
IN ACCORDANCE WITH U.S. GAAP IN US$MM
| Notes to Consolidated Financial Statements |
| (All amounts in $ millions, unless otherwise specified) |
COMMODITY PRICE POSITIONS AS AT DECEMBER 31, 2015
| Notional Volumes | Term | Average Price | Fair Value | |||||||||||
| Natural Gas Contracts |
||||||||||||||
| Fixed Price Contracts |
||||||||||||||
| NYMEX Fixed Price |
370 MMcf/d | 2016 | 2.82 US$/Mcf | $ | 43 | |||||||||
| NYMEX Three-Way Options |
25 MMcf/d | 2016 | 5 | |||||||||||
| Sold call price |
3.43 US$/Mcf | |||||||||||||
| Bought put price |
3.21 US$/Mcf | |||||||||||||
| Sold put price |
2.72 US$/Mcf | |||||||||||||
| NYMEX Costless Collars |
335 MMcf/d | 2016 | (15 | ) | ||||||||||
| Sold call price |
2.46 US$/Mcf | |||||||||||||
| Bought put price |
2.22 US$/Mcf | |||||||||||||
| Basis Contracts (1) |
2016-2018 | 15 | ||||||||||||
| Other Financial Positions |
1 | |||||||||||||
| Natural Gas Fair Value Position |
49 | |||||||||||||
| Crude Oil Contracts |
||||||||||||||
| Fixed Price Contracts |
||||||||||||||
| WTI Fixed Price |
49.0 Mbbls/d | 2016 | 58.51 US$/bbl | 303 | ||||||||||
| WTI Three-Way Options |
18.3 Mbbls/d | 2016 | 37 | |||||||||||
| Sold call price |
63.03 US$/bbl | |||||||||||||
| Bought put price |
55.00 US$/bbl | |||||||||||||
| Sold put price |
47.24 US$/bbl | |||||||||||||
| Basis Contracts (2) |
2016-2017 | (15 | ) | |||||||||||
| Crude Oil Fair Value Position |
325 | |||||||||||||
| Power Purchase Contracts and Other Derivative Contracts |
|
|||||||||||||
| Fair Value Position |
(50 | ) | ||||||||||||
| Total Fair Value |
$ | 324 | ||||||||||||
| (1) | Encana has entered into swaps to protect against widening natural gas price differentials between benchmark and regional sales prices. These basis swaps are priced using differentials determined as a percentage of NYMEX. |
| (2) | Encana has entered into swaps to protect against widening Midland differentials to WTI. These basis swaps are priced using fixed price differentials. |
ANNUAL REPORT 2015 | Encana Corporation 109
CONSOLIDATED FINANCIAL STATEMENTS PREPARED
IN ACCORDANCE WITH U.S. GAAP IN US$MM
| Notes to Consolidated Financial Statements |
| (All amounts in $ millions, unless otherwise specified) |
EARNINGS IMPACT OF REALIZED AND UNREALIZED GAINS (LOSSES) ON RISK MANAGEMENT POSITIONS
| Realized Gain (Loss) | ||||||||||||
| For the years ended December 31 | 2015 | 2014 | 2013 | |||||||||
| Revenues, Net of Royalties |
$ | 917 | $ | (84 | ) | $ | 544 | |||||
| Transportation and Processing |
(16 | ) | (7 | ) | - | |||||||
| Gain (Loss) on Risk Management |
$ | 901 | $ | (91 | ) | $ | 544 | |||||
|
Unrealized Gain (Loss) |
||||||||||||
| For the years ended December 31 | 2015 | 2014 | 2013 | |||||||||
| Revenues, Net of Royalties |
$ | (325 | ) | $ | 456 | $ | (347) | |||||
| Transportation and Processing |
(6 | ) | (12 | ) | 2 | |||||||
| Gain (Loss) on Risk Management |
$ | (331 | ) | $ | 444 | $ | (345) | |||||
RECONCILIATION OF UNREALIZED RISK MANAGEMENT POSITIONS FROM JANUARY 1 TO DECEMBER 31
| 2015 | 2014 | 2013 | ||||||||||||||
| Fair Value | Total Unrealized |
Total Unrealized |
Total Unrealized |
|||||||||||||
| Fair Value of Contracts, Beginning of Year |
$ | 745 | ||||||||||||||
| Change in Fair Value of Contracts in Place at Beginning of Year and Contracts Entered into During the Year |
570 | $ | 570 | $ | 353 | $ | 199 | |||||||||
| Foreign Exchange Translation Adjustment on Canadian Dollar Contracts |
2 | |||||||||||||||
| Settlement of Athlon Crude Oil Contracts from Business Combination |
(63 | ) | ||||||||||||||
| Fair Value of Other Derivative Contracts Entered into During the Year |
(29 | ) | ||||||||||||||
| Fair Value of Contracts Realized During the Year |
(901 | ) | (901 | ) | 91 | (544 | ) | |||||||||
| Fair Value of Contracts, End of Year |
$ | 324 | $ | (331 | ) | $ | 444 | $ | (345 | ) | ||||||
| C) | RISKS ASSOCIATED WITH FINANCIAL ASSETS AND LIABILITIES |
The Company is exposed to financial risks including market risks (such as commodity prices, foreign exchange and interest rates), credit risk and liquidity risk. Future cash flows may fluctuate due to movement in market prices and the exposure to credit and liquidity risks.
COMMODITY PRICE RISK
Commodity price risk arises from the effect fluctuations in future commodity prices may have on future cash flows. To partially mitigate exposure to commodity price risk, the Company has entered into various derivative financial instruments. The use of these derivative instruments is governed under formal policies and is subject to limits established by the Board. The Company’s policy is to not use derivative financial instruments for speculative purposes.
Natural Gas – To partially mitigate natural gas commodity price risk, the Company uses contracts such as NYMEX-based fixed price contracts, NYMEX-based options and costless collars. Encana also enters into basis swaps to manage against widening price differentials between various production areas and various sales points.
Crude Oil – To partially mitigate crude oil commodity price risk, the Company uses contracts such as WTI-based fixed price contracts and WTI-based options. Encana also enters into basis swaps to manage against widening price differentials between various production areas and various sales points.
110 Encana Corporation | ANNUAL REPORT 2015
CONSOLIDATED FINANCIAL STATEMENTS PREPARED
IN ACCORDANCE WITH U.S. GAAP IN US$MM
| Notes to Consolidated Financial Statements |
| (All amounts in $ millions, unless otherwise specified) |
Power – The Company has entered into Canadian dollar denominated derivative contracts to manage its electricity consumption costs.
The table below summarizes the sensitivity of the fair value of the Company’s risk management positions to fluctuations in commodity prices, with all other variables held constant. The Company has used a 10 percent variability to assess the potential impact of commodity price changes. Fluctuations in commodity prices could have resulted in unrealized gains (losses) impacting pre-tax net earnings as at December 31 as follows:
| 2015 | 2014 | |||||||||||||||||
| 10% Price Increase |
10% Price Decrease |
10% Price Increase |
10% Price Decrease |
|||||||||||||||
| Natural gas price |
$ | (57) | 56 | $ | (105) | $ | 105 | |||||||||||
| Crude oil price |
(83) | 81 | (22) | 22 | ||||||||||||||
| Power price |
4 | (4) | 5 | (5) | ||||||||||||||
CREDIT RISK
Credit risk arises from the potential that the Company may incur a loss if a counterparty to a financial instrument fails to meet its obligation in accordance with agreed terms. This credit risk exposure is mitigated through the use of Board-approved credit policies governing the Company’s credit portfolio including credit practices that limit transactions according to counterparties’ credit quality. Mitigation strategies may include master netting arrangements, requesting collateral and/or transacting credit derivatives. The Company executes commodity derivative financial instruments under master agreements that have netting provisions that provide for offsetting payables against receivables. As at December 31, 2015, the Company had no significant credit derivatives in place and no collateral balances were posted or received.
As at December 31, 2015, cash equivalents include high-grade, short-term securities, placed primarily with financial institutions and companies with strong investment grade ratings. Any foreign currency agreements entered into are with major financial institutions in Canada and the U.S. or with counterparties having investment grade credit ratings.
A substantial portion of the Company’s accounts receivable are with customers in the oil and gas industry and are subject to normal industry credit risks. As at December 31, 2015, approximately 95 percent (2014 – 94 percent) of Encana’s accounts receivable and financial derivative credit exposures were with investment grade counterparties.
As at December 31, 2015, Encana had two counterparties (2014 – three counterparties) whose net settlement position individually accounted for more than 10 percent of the fair value of the outstanding in-the-money net risk management contracts by counterparty. As at December 31, 2015, these counterparties accounted for 13 percent and 11 percent (2014 – 16 percent, 16 percent and 15 percent) of the fair value of the outstanding in-the-money net risk management contracts.
During the year ended December 31, 2015, Encana entered into agreements resulting from divestitures, which may require Encana to fulfill certain payment obligations on the take or pay volume commitments assumed by the purchaser. The circumstances that would require Encana to perform under the agreement includes events where the purchaser fails to make payment to the guaranteed party and/or the purchaser is subject to an insolvency event. The agreements have remaining terms from five to nine years with a fair value of $29 million as at December 31, 2015. The maximum potential amount of undiscounted future payments is $472 million as at December 31, 2015, and is considered unlikely.
ANNUAL REPORT 2015 | Encana Corporation 111
CONSOLIDATED FINANCIAL STATEMENTS PREPARED
IN ACCORDANCE WITH U.S. GAAP IN US$MM
| Notes to Consolidated Financial Statements |
| (All amounts in $ millions, unless otherwise specified) |
LIQUIDITY RISK
Liquidity risk arises from the potential that the Company will encounter difficulties in meeting a demand to fund its financial liabilities as they come due. The Company manages liquidity risk using cash and debt management programs.
The Company has access to cash equivalents and a range of funding alternatives at competitive rates through committed revolving bank credit facilities and debt and equity capital markets. As at December 31, 2015, the Company had committed revolving bank credit facilities totaling $4.5 billion which included $3.0 billion on a revolving bank credit facility for Encana and $1.5 billion on a revolving bank credit facility for a U.S. subsidiary, the latter of which remained unused. Of the $3.0 billion revolving bank credit facility, $210 million of LIBOR loans were drawn, $440 million fully supported the U.S. Commercial Paper Program and $2,350 million remained unused. The facilities remain committed through July 2020.
Encana also has accessible capacity under a shelf prospectus for up to $4.9 billion, or the equivalent in foreign currencies, the availability of which is dependent on market conditions, to issue debt and/or equity securities in Canada and/or the U.S. as discussed in Note 13. The shelf prospectus expires in July 2016.
The Company believes it has sufficient funding through the use of these facilities to meet foreseeable borrowing requirements.
The Company minimizes its liquidity risk by managing its capital structure. The Company’s capital structure consists of shareholders’ equity plus long-term debt, including the current portion. The Company’s objectives when managing its capital structure are to maintain financial flexibility to preserve Encana’s access to capital markets and its ability to meet financial obligations and to finance internally generated growth as well as potential acquisitions. To manage the capital structure, the Company may adjust capital spending, adjust dividends paid to shareholders, issue new shares, issue new debt or repay existing debt.
The timing of expected cash outflows relating to financial liabilities is outlined in the table below:
| Less Than 1 Year |
1 - 3 Years | 4 - 5 Years | 6 - 9 Years | Thereafter | Total | |||||||||||||||||
|
| ||||||||||||||||||||||
| Accounts Payable and Accrued Liabilities |
$ | 1,311 | $ | - | $ | - | $ | - | $ | - | $ 1,311 | |||||||||||
| Risk Management Liabilities |
16 | 9 | - | - | - | 25 | ||||||||||||||||
| Long-Term Debt (1) |
306 | 611 | 1,701 | 1,587 | 6,151 | 10,356 | ||||||||||||||||
| Other Liabilities and Provisions |
- | 17 | 2 | - | 4 | 23 | ||||||||||||||||
|
| ||||||||||||||||||||||
| (1) | Principal and interest. |
Included in Encana’s long-term debt obligations of $10,356 million at December 31, 2015 are $650 million in principal obligations related to U.S. Commercial Paper and LIBOR loans. These amounts are fully supported and Management expects they will continue to be supported by credit facilities that have no repayment requirements within the next year and are fully revolving for up to five years. Based on the current maturity dates of the credit facilities, these amounts are included in cash outflows for the period disclosed as 4 - 5 Years. Further information on Long-Term Debt is contained in Note 13.
FOREIGN EXCHANGE RISK
Foreign exchange risk arises from changes in foreign exchange rates that may affect the fair value or future cash flows of the Company’s financial assets or liabilities. As Encana operates primarily in North America, fluctuations in the exchange rate between the U.S. and Canadian dollars can have a significant effect on the Company’s reported results. Encana’s financial results are consolidated in Canadian dollars; however, the Company reports its results in U.S. dollars as most of its revenue is closely tied to the U.S. dollar and to facilitate a more direct comparison to other North American oil and gas companies. As the effects of foreign exchange fluctuations are embedded in the Company’s results, the total effect of foreign exchange fluctuations is not separately identifiable.
112 Encana Corporation | ANNUAL REPORT 2015
CONSOLIDATED FINANCIAL STATEMENTS PREPARED
IN ACCORDANCE WITH U.S. GAAP IN US$MM
| Notes to Consolidated Financial Statements |
| (All amounts in $ millions, unless otherwise specified) |
As at December 31, 2015, Encana had $5.4 billion in U.S. dollar debt issued from Canada that was subject to foreign exchange exposure. As at December 31, 2014, Encana had $6.7 billion in debt that was subject to foreign exchange exposure and $0.6 billion that was not subject to foreign exchange exposure. To mitigate the exposure to the fluctuating U.S./Canadian dollar exchange rate, Encana may enter into foreign exchange derivatives. There were no foreign exchange derivatives outstanding as at December 31, 2015.
Encana’s foreign exchange (gain) loss primarily includes foreign exchange gains and losses on the translation and settlement of U.S. dollar denominated debt issued from Canada, unrealized foreign exchange gains and losses on the translation of U.S. dollar denominated risk management assets and liabilities held in Canada, foreign exchange gains and losses on the translation and settlement of foreign denominated intercompany balances and foreign exchange gains and losses on U.S. dollar denominated cash and short-term investments held in Canada. A $0.01 change in the U.S. to Canadian dollar exchange rate would have resulted in a $39 million change in foreign exchange (gain) loss as at December 31, 2015 (2014 – $61 million; 2013 – $48 million).
INTEREST RATE RISK
Interest rate risk arises from changes in market interest rates that may affect the fair value or future cash flows from the Company’s financial assets or liabilities. The Company partially mitigates its exposure to interest rate changes by holding a mix of both fixed and floating rate debt and may also enter into interest rate derivatives to partially mitigate effects of fluctuations in market interest rates. There were no interest rate derivatives outstanding as at December 31, 2015.
As at December 31, 2015, the Company had floating rate debt of $650 million (2014 – $1,277 million). Accordingly, the sensitivity in net earnings for each one percent change in interest rates on floating rate debt was $5 million (2014 – $10 million; 2013 – nil).
| 25. Supplementary Information |
| A) | NET CHANGE IN NON-CASH WORKING CAPITAL |
| For the years ended December 31 | 2015 | 2014 | 2013 | |||||||||
| Operating Activities |
||||||||||||
| Accounts receivable and accrued revenues |
$ | 314 | $ | (411) | $ | (75) | ||||||
| Accounts payable and accrued liabilities |
(14) | 188 | (81) | |||||||||
| Income tax payable and receivable |
(38) | 214 | (23) | |||||||||
| $ | 262 | $ | (9) | $ | (179) | |||||||
|
B) SUPPLEMENTARY CASH FLOW INFORMATION
|
||||||||||||
| For the years ended December 31 | 2015 | 2014 | 2013 | |||||||||
| Interest Paid |
$ | 602 | $ | 648 | $ | 575 | ||||||
| Income Taxes Paid, net of Amounts (Recovered) |
$ | (105) | $ | 43 | $ | (186) | ||||||
ANNUAL REPORT 2015 | Encana Corporation 113
CONSOLIDATED FINANCIAL STATEMENTS PREPARED
IN ACCORDANCE WITH U.S. GAAP IN US$MM
| Notes to Consolidated Financial Statements |
| (All amounts in $ millions, unless otherwise specified) |
| 26. Commitments and Contingencies |
COMMITMENTS
The following table outlines the Company’s commitments as at December 31, 2015:
| Expected Future Payments | ||||||||||||||||||||||||||||
| (undiscounted) | 2016 | 2017 | 2018 | 2019 | 2020 | Thereafter | Total | |||||||||||||||||||||
| Transportation and Processing |
$ | 693 | $ | 679 | $ | 685 | $ | 588 | $ | 491 | $ | 2,507 | $ | 5,643 | ||||||||||||||
| Drilling and Field Services |
164 | 106 | 59 | 29 | 17 | 1 | 376 | |||||||||||||||||||||
| Operating Leases |
30 | 24 | 23 | 11 | 3 | 19 | 110 | |||||||||||||||||||||
| Total |
$ | 887 | $ | 809 | $ | 767 | $ | 628 | $ | 511 | $ | 2,527 | $ | 6,129 | ||||||||||||||
Included within transportation and processing in the table above are certain commitments associated with midstream service agreements with VMLP as described in Note 19. Divestiture transactions can reduce certain commitments disclosed above.
CONTINGENCIES
Encana is involved in various legal claims and actions arising in the course of the Company’s operations. Although the outcome of these claims cannot be predicted with certainty, the Company does not expect these matters to have a material adverse effect on Encana’s financial position, cash flows or results of operations. If an unfavourable outcome were to occur, there exists the possibility of a material adverse impact on the Company’s consolidated net earnings or loss in the period in which the outcome is determined. Accruals for litigation and claims are recognized if the Company determines that the loss is probable and the amount can be reasonably estimated. The Company believes it has made adequate provision for such legal claims.
| 27. Supplementary Oil and Gas Information (unaudited) |
STANDARDIZED MEASURE OF DISCOUNTED FUTURE NET CASH FLOWS AND CHANGES THEREIN
In calculating the standardized measure of discounted future net cash flows, constant price and cost assumptions were applied to Encana’s annual future production from proved reserves to determine cash inflows. Future production and development costs assume the continuation of existing economic, operating and regulatory conditions. Future income taxes are calculated by applying statutory income tax rates to future pre-tax cash flows after provision for the tax cost of the oil and natural gas properties based upon existing laws and regulations. The discount was computed by application of a 10 percent discount factor to the future net cash flows. The calculation of the standardized measure of discounted future net cash flows is based upon the discounted future net cash flows prepared by Encana’s independent qualified reserves evaluators in relation to the reserves they respectively evaluated, and adjusted to the extent provided by contractual arrangements, such as price risk management activities, in existence at year end and to account for asset retirement obligations and future income taxes.
Encana cautions that the discounted future net cash flows relating to proved oil and gas reserves are an indication of neither the fair market value of Encana’s oil and gas properties, nor the future net cash flows expected to be generated from such properties. The discounted future net cash flows do not include the fair market value of exploratory properties and probable or possible oil and gas reserves, nor is consideration given to the effect of anticipated future changes in oil and natural gas prices, development, asset retirement and production costs, and possible changes to tax and royalty regulations. The prescribed discount rate of 10 percent may not appropriately reflect future interest rates.
114 Encana Corporation | ANNUAL REPORT 2015
CONSOLIDATED FINANCIAL STATEMENTS PREPARED
IN ACCORDANCE WITH U.S. GAAP IN US$MM
| Notes to Consolidated Financial Statements |
| (All amounts in $ millions, unless otherwise specified) |
NET PROVED RESERVES (1, 2)
(12-MONTH AVERAGE TRAILING PRICES; AFTER ROYALTIES)
| Natural Gas (Bcf) |
Oil (MMbbls) |
NGLs (MMbbls) |
||||||||||||||||||||||||||||||||||||
| Canada | United States |
Total | Canada | United States |
Total | Canada | United States |
Total | ||||||||||||||||||||||||||||||
| 2013 |
||||||||||||||||||||||||||||||||||||||
| Beginning of year |
4,550 | 4,242 | 8,792 | 13.0 | 46.0 | 59.0 | 88.6 | 62.4 | 151.0 | |||||||||||||||||||||||||||||
| Revisions and improved recovery (3) |
(256 | ) | (362 | ) | (618 | ) | 2.6 | (1.2 | ) | 1.4 | (9.6 | ) | (16.1 | ) | (25.7 | ) | ||||||||||||||||||||||
| Extensions and discoveries |
499 | 482 | 981 | 11.5 | 14.3 | 25.8 | 16.7 | 13.3 | 30.0 | |||||||||||||||||||||||||||||
| Purchase of reserves in place |
- | 7 | 7 | - | 0.5 | 0.5 | - | 0.1 | 0.1 | |||||||||||||||||||||||||||||
| Sale of reserves in place |
(295 | ) | (1 | ) | (296 | ) | - | - | - | (1.5 | ) | (0.1 | ) | (1.6 | ) | |||||||||||||||||||||||
| Production |
(523 | ) | (491 | ) | (1,014 | ) | (4.3 | ) | (5.1 | ) | (9.4 | ) | (6.8 | ) | (3.5 | ) | (10.3 | ) | ||||||||||||||||||||
| End of year |
3,975 | 3,877 | 7,852 | 22.8 | 54.5 | 77.3 | 87.4 | 56.1 | 143.5 | |||||||||||||||||||||||||||||
| Developed |
2,744 | 2,619 | 5,363 | 16.5 | 31.1 | 47.6 | 44.6 | 24.1 | 68.7 | |||||||||||||||||||||||||||||
| Undeveloped |
1,231 | 1,258 | 2,489 | 6.3 | 23.4 | 29.7 | 42.8 | 32.0 | 74.8 | |||||||||||||||||||||||||||||
| Total |
3,975 | 3,877 | 7,852 | 22.8 | 54.5 | 77.3 | 87.4 | 56.1 | 143.5 | |||||||||||||||||||||||||||||
| 2014 |
||||||||||||||||||||||||||||||||||||||
| Beginning of year |
3,975 | 3,877 | 7,852 | 22.8 | 54.5 | 77.3 | 87.4 | 56.1 | 143.5 | |||||||||||||||||||||||||||||
| Revisions and improved recovery (4) |
250 | (511 | ) | (261 | ) | (5.0 | ) | (2.7 | ) | (7.7 | ) | 10.9 | (2.6 | ) | 8.3 | |||||||||||||||||||||||
| Extensions and discoveries |
385 | 493 | 879 | 4.7 | 21.4 | 26.1 | 22.3 | 8.8 | 31.1 | |||||||||||||||||||||||||||||
| Purchase of reserves in place |
6 | 234 | 240 | - | 148.2 | 148.2 | 0.1 | 52.9 | 53.0 | |||||||||||||||||||||||||||||
| Sale of reserves in place |
(885 | ) | (1,473 | ) | (2,358 | ) | (6.6 | ) | (14.2 | ) | (20.8 | ) | (45.5 | ) | (20.0 | ) | (65.4 | ) | ||||||||||||||||||||
| Production |
(503 | ) | (355 | ) | (858 | ) | (5.0 | ) | (13.1 | ) | (18.0 | ) | (8.6 | ) | (5.0 | ) | (13.6 | ) | ||||||||||||||||||||
| End of year |
3,229 | 2,265 | 5,494 | 10.9 | 194.1 | 205.0 | 66.6 | 90.2 | 156.7 | |||||||||||||||||||||||||||||
| Developed |
2,282 | 1,606 | 3,887 | 8.2 | 112.3 | 120.5 | 31.6 | 53.4 | 85.0 | |||||||||||||||||||||||||||||
| Undeveloped |
947 | 660 | 1,607 | 2.8 | 81.8 | 84.5 | 34.9 | 36.8 | 71.7 | |||||||||||||||||||||||||||||
| Total |
3,229 | 2,265 | 5,494 | 10.9 | 194.1 | 205.0 | 66.6 | 90.2 | 156.7 | |||||||||||||||||||||||||||||
| 2015 |
||||||||||||||||||||||||||||||||||||||
| Beginning of year |
3,229 | 2,265 | 5,494 | 10.9 | 194.1 | 205.0 | 66.6 | 90.2 | 156.7 | |||||||||||||||||||||||||||||
| Revisions and improved recovery (5) |
(801 | ) | (342 | ) | (1,144 | ) | (0.9 | ) | (73.6 | ) | (74.6 | ) | (14.8 | ) | (41.1 | ) | (55.9 | ) | ||||||||||||||||||||
| Extensions and discoveries |
313 | 159 | 472 | - | 68.4 | 68.4 | 19.8 | 24.9 | 44.7 | |||||||||||||||||||||||||||||
| Purchase of reserves in place |
- | - | - | - | - | - | - | - | - | |||||||||||||||||||||||||||||
| Sale of reserves in place |
(434 | ) | (728 | ) | (1,163 | ) | (1.6 | ) | (1.2 | ) | (2.8 | ) | (0.4 | ) | (3.6 | ) | (4.0 | ) | ||||||||||||||||||||
| Production |
(354 | ) | (241 | ) | (596 | ) | (2.0 | ) | (29.7 | ) | (31.8 | ) | (8.3 | ) | (8.6 | ) | (16.9 | ) | ||||||||||||||||||||
| End of year |
1,952 | 1,112 | 3,064 | 6.4 | 157.9 | 164.3 | 62.8 | 61.7 | 124.5 | |||||||||||||||||||||||||||||
| Developed |
1,295 | 928 | 2,223 | 5.0 | 91.6 | 96.6 | 31.8 | 37.8 | 69.5 | |||||||||||||||||||||||||||||
| Undeveloped |
657 | 184 | 841 | 1.3 | 66.3 | 67.7 | 31.0 | 24.0 | 55.0 | |||||||||||||||||||||||||||||
| Total |
1,952 | 1,112 | 3,064 | 6.4 | 157.9 | 164.3 | 62.8 | 61.7 | 124.5 | |||||||||||||||||||||||||||||
* Numbers may not add due to rounding
Notes:
| (1) | Definitions: |
| a. | “Net” reserves are the remaining reserves of Encana, after deduction of estimated royalties and including royalty interests. |
| b. | “Proved” oil and gas reserves are those quantities of oil and gas which, by analysis of geoscience and engineering data, can be estimated with reasonable certainty to be economically producible from a given date forward, from known reservoirs, and under existing economic conditions, operating methods and government regulations. |
| c. | “Developed” oil and gas reserves are reserves of any category that are expected to be recovered through existing wells with existing equipment and operating methods or in which the cost of the required equipment is relatively minor compared to the cost of a new well. |
| d. | “Undeveloped” oil and gas reserves are reserves of any category that are expected to be recovered from new wells on undrilled acreage, or from existing wells where a relatively major expenditure is required for recompletion. |
| (2) | Encana does not file any estimates of total net proved natural gas, oil and NGLs reserves with any U.S. federal authority or agency other than the Securities and Exchange Commission. |
| (3) | In 2013, revisions and improved recovery of natural gas included a reduction of 2,872 Bcf due to lower proved undeveloped reserves bookings, partially offset by additions of 2,233 Bcf due to significantly higher 12-month average trailing natural gas prices and minor positive revisions. |
| (4) | In 2014, revisions and improved recovery of natural gas included a reduction of 520 Bcf due to changes in the proved undeveloped reserves bookings in the U.S. |
| (5) | In 2015, revisions and improved recovery of natural gas included a reduction of 1,106 Bcf due to a significantly lower 12-month average trailing natural gas price. Revisions and improved recovery of oil and NGLs included reductions of 59.9 MMbbls and 52.6 MMbbls, respectively, due to significantly lower 12-month average trailing oil and NGL prices. |
ANNUAL REPORT 2015 | Encana Corporation 115
CONSOLIDATED FINANCIAL STATEMENTS PREPARED
IN ACCORDANCE WITH U.S. GAAP IN US$MM
| Notes to Consolidated Financial Statements |
| (All amounts in $ millions, unless otherwise specified) |
12-MONTH AVERAGE TRAILING PRICES
The following reference prices were utilized in the determination of reserves and future net revenue:
|
Natural Gas |
Oil & NGLs | |||||||||||||||||
| Henry Hub ($/MMBtu) |
AECO (C$/MMBtu) |
WTI ($/bbl) |
Edmonton Light Sweet (C$/bbl) |
|||||||||||||||
| Reserves Pricing (1) |
||||||||||||||||||
| 2013 |
3.67 | 3.14 | 96.94 | 93.44 | ||||||||||||||
| 2014 |
4.34 | 4.63 | 94.99 | 96.40 | ||||||||||||||
| 2015 |
2.58 | 2.69 | 50.28 | 58.82 | ||||||||||||||
| (1) | All prices were held constant in all future years when estimating net revenues and reserves. |
STANDARDIZED MEASURE OF DISCOUNTED FUTURE NET CASH FLOWS RELATING TO PROVED OIL AND GAS RESERVES
| Canada | United States | |||||||||||||||||||||||
| 2015 | 2014 | 2013 | 2015 | 2014 | 2013 | |||||||||||||||||||
| Future cash inflows |
6,284 | 19,255 | 19,039 | 9,462 | 26,742 | 17,217 | ||||||||||||||||||
| Less future: |
||||||||||||||||||||||||
| Production costs |
3,800 | 7,456 | 7,377 | 3,959 | 6,673 | 4,484 | ||||||||||||||||||
| Development costs |
1,725 | 3,276 | 4,515 | 3,092 | 4,087 | 3,982 | ||||||||||||||||||
| Income taxes |
- | 1,727 | 652 | - | 2,886 | 1,615 | ||||||||||||||||||
| Future net cash flows |
759 | 6,796 | 6,495 | 2,411 | 13,096 | 7,136 | ||||||||||||||||||
| Less 10% annual discount for estimated timing of cash flows |
122 | 2,320 | 1,836 | 984 | 6,015 | 2,978 | ||||||||||||||||||
| Discounted future net cash flows |
637 | 4,476 | 4,659 | 1,427 | 7,081 | 4,158 | ||||||||||||||||||
| Total | ||||||||||||||||||||||||
| 2015 | 2014 | 2013 | ||||||||||||||||||||||
| Future cash inflows |
15,746 | 45,997 | 36,256 | |||||||||||||||||||||
| Less future: |
||||||||||||||||||||||||
| Production costs |
7,759 | 14,129 | 11,861 | |||||||||||||||||||||
| Development costs |
4,817 | 7,363 | 8,497 | |||||||||||||||||||||
| Income taxes |
- | 4,613 | 2,267 | |||||||||||||||||||||
| Future net cash flows |
3,170 | 19,892 | 13,631 | |||||||||||||||||||||
| Less 10% annual discount for estimated timing of cash flows |
1,106 | 8,335 | 4,814 | |||||||||||||||||||||
| Discounted future net cash flows |
2,064 | 11,557 | 8,817 | |||||||||||||||||||||
116 Encana Corporation | ANNUAL REPORT 2015
CONSOLIDATED FINANCIAL STATEMENTS PREPARED
IN ACCORDANCE WITH U.S. GAAP IN US$MM
| Notes to Consolidated Financial Statements |
| (All amounts in $ millions, unless otherwise specified) |
CHANGES IN STANDARDIZED MEASURE OF DISCOUNTED FUTURE NET CASH FLOWS RELATING TO PROVED OIL AND GAS RESERVES
| Canada | United States | |||||||||||||||||||||||
| 2015 | 2014 | 2013 | 2015 | 2014 | 2013 | |||||||||||||||||||
| Balance, beginning of year |
4,476 | 4,659 | 3,002 | 7,081 | 4,158 | 3,015 | ||||||||||||||||||
| Changes resulting from: |
||||||||||||||||||||||||
| Sales of oil and gas produced during the period |
(969 | ) | (2,120 | ) | (1,649 | ) | (1,250 | ) | (1,746 | ) | (1,490 | ) | ||||||||||||
| Discoveries and extensions, net of related costs |
109 | 827 | 725 | 504 | 1,429 | 633 | ||||||||||||||||||
| Purchases of proved reserves in place |
- | 9 | - | - | 3,052 | 16 | ||||||||||||||||||
| Sales and transfers of proved reserves in place |
(674 | ) | (1,320 | ) | (304 | ) | (1,604 | ) | (1,902 | ) | (2 | ) | ||||||||||||
| Net change in prices and production costs |
(3,094 | ) | 1,777 | 2,703 | (3,266 | ) | 2,567 | 1,891 | ||||||||||||||||
| Revisions to quantity estimates |
(1,355 | ) | 314 | (178 | ) | (2,183 | ) | (616 | ) | (324 | ) | |||||||||||||
| Accretion of discount |
565 | 515 | 311 | 834 | 503 | 333 | ||||||||||||||||||
| Previously estimated development costs incurred, net of change in future development costs |
435 | 532 | 417 | 263 | (3 | ) | 708 | |||||||||||||||||
| Other |
(32 | ) | (36 | ) | 14 | (210 | ) | 24 | (68 | ) | ||||||||||||||
| Net change in income taxes |
1,176 | (681 | ) | (382 | ) | 1,258 | (385 | ) | (554 | ) | ||||||||||||||
| Balance, end of year |
637 | 4,476 | 4,659 | 1,427 | 7,081 | 4,158 | ||||||||||||||||||
| Total | ||||||||||||||||||||||||
| 2015 | 2014 | 2013 | ||||||||||||||||||||||
| Balance, beginning of year |
11,557 | 8,817 | 6,017 | |||||||||||||||||||||
| Changes resulting from: |
||||||||||||||||||||||||
| Sales of oil and gas produced during the period |
(2,219 | ) | (3,866 | ) | (3,139 | ) | ||||||||||||||||||
| Discoveries and extensions, net of related costs |
613 | 2,256 | 1,358 | |||||||||||||||||||||
| Purchases of proved reserves in place |
- | 3,061 | 16 | |||||||||||||||||||||
| Sales and transfers of proved reserves in place |
(2,278 | ) | (3,222 | ) | (306 | ) | ||||||||||||||||||
| Net change in prices and production costs |
(6,360 | ) | 4,344 | 4,594 | ||||||||||||||||||||
| Revisions to quantity estimates |
(3,538 | ) | (302 | ) | (502 | ) | ||||||||||||||||||
| Accretion of discount |
1,399 | 1,018 | 644 | |||||||||||||||||||||
| Previously estimated development costs incurred, net of change in future development costs |
698 | 529 | 1,125 | |||||||||||||||||||||
| Other |
(242 | ) | (12 | ) | (54 | ) | ||||||||||||||||||
| Net change in income taxes |
2,434 | (1,066 | ) | (936 | ) | |||||||||||||||||||
| Balance, end of year |
2,064 | 11,557 | 8,817 | |||||||||||||||||||||
ANNUAL REPORT 2015 | Encana Corporation 117
CONSOLIDATED FINANCIAL STATEMENTS PREPARED
IN ACCORDANCE WITH U.S. GAAP IN US$MM
| Notes to Consolidated Financial Statements |
| (All amounts in $ millions, unless otherwise specified) |
| RESULTS OF OPERATIONS | ||||||||||||||||||||||||
| Canada | United States | |||||||||||||||||||||||
| 2015 | 2014 | 2013 | 2015 | 2014 | 2013 | |||||||||||||||||||
| Oil and gas revenues, net of royalties, transportation and processing |
1,168 | 2,475 | 2,068 | 1,911 | 2,244 | 2,041 | ||||||||||||||||||
| Less: |
||||||||||||||||||||||||
| Operating costs, production, mineral and other taxes, and accretion of asset retirement obligations |
199 | 355 | 419 | 661 | 498 | 551 | ||||||||||||||||||
| Depreciation, depletion and amortization |
305 | 625 | 601 | 1,088 | 992 | 818 | ||||||||||||||||||
| Impairments |
- | - | - | 6,473 | - | - | ||||||||||||||||||
| Operating income (loss) |
664 | 1,495 | 1,048 | (6,311 | ) | 754 | 672 | |||||||||||||||||
| Income taxes |
179 | 376 | 264 | (2,285 | ) | 273 | 243 | |||||||||||||||||
| Results of operations |
485 | 1,119 | 784 | (4,026 | ) | 481 | 429 | |||||||||||||||||
| Total | ||||||||||||||||||||||||
| 2015 | 2014 | 2013 | ||||||||||||||||||||||
| Oil and gas revenues, net of royalties, transportation and processing |
3,079 | 4,719 | 4,109 | |||||||||||||||||||||
| Less: |
||||||||||||||||||||||||
| Operating costs, production, mineral and other taxes, and accretion of asset retirement obligations |
860 | 853 | 970 | |||||||||||||||||||||
| Depreciation, depletion and amortization |
1,393 | 1,617 | 1,419 | |||||||||||||||||||||
| Impairments |
6,473 | - | - | |||||||||||||||||||||
| Operating income (loss) |
(5,647 | ) | 2,249 | 1,720 | ||||||||||||||||||||
| Income taxes |
(2,106 | ) | 649 | 507 | ||||||||||||||||||||
| Results of operations |
(3,541 | ) | 1,600 | 1,213 | ||||||||||||||||||||
| CAPITALIZED COSTS | ||||||||||||||||||||||||
| Canada | United States | |||||||||||||||||||||||
| 2015 | 2014 | 2013 | 2015 | 2014 | 2013 | |||||||||||||||||||
| Proved oil and gas properties |
14,866 | 18,271 | 25,003 | 25,723 | 24,279 | 26,529 | ||||||||||||||||||
| Unproved oil and gas properties |
334 | 478 | 598 | 5,282 | 5,655 | 470 | ||||||||||||||||||
| Total capital cost |
15,200 | 18,749 | 25,601 | 31,005 | 29,934 | 26,999 | ||||||||||||||||||
| Accumulated DD&A |
14,170 | 16,566 | 23,012 | 23,822 | 16,260 | 22,074 | ||||||||||||||||||
| Net capitalized costs |
1,030 | 2,183 | 2,589 | 7,183 | 13,674 | 4,925 | ||||||||||||||||||
| Other | Total | |||||||||||||||||||||||
| 2015 | 2014 | 2013 | 2015 | 2014 | 2013 | |||||||||||||||||||
| Proved oil and gas properties |
58 | 65 | 71 | 40,647 | 42,615 | 51,603 | ||||||||||||||||||
| Unproved oil and gas properties |
- | - | - | 5,616 | 6,133 | 1,068 | ||||||||||||||||||
| Total capital cost |
58 | 65 | 71 | 46,263 | 48,748 | 52,671 | ||||||||||||||||||
| Accumulated DD&A |
58 | 65 | 71 | 38,050 | 32,891 | 45,157 | ||||||||||||||||||
| Net capitalized costs |
- | - | - | 8,213 | 15,857 | 7,514 | ||||||||||||||||||
118 Encana Corporation | ANNUAL REPORT 2015
CONSOLIDATED FINANCIAL STATEMENTS PREPARED
IN ACCORDANCE WITH U.S. GAAP IN US$MM
| Notes to Consolidated Financial Statements |
| (All amounts in $ millions, unless otherwise specified) |
COSTS INCURRED
| Canada | United States (1,2) | |||||||||||||||||||||||
| 2015 | 2014 | 2013 | 2015 | 2014 | 2013 | |||||||||||||||||||
| Acquisitions |
||||||||||||||||||||||||
| Unproved |
2 | 15 | 26 | 15 | 5,452 | 111 | ||||||||||||||||||
| Proved |
7 | 6 | 2 | 12 | 5,008 | 45 | ||||||||||||||||||
| Total acquisitions |
9 | 21 | 28 | 27 | 10,460 | 156 | ||||||||||||||||||
| Exploration costs |
3 | 10 | 22 | 3 | 38 | 412 | ||||||||||||||||||
| Development costs |
377 | 1,216 | 1,343 | 1,844 | 1,247 | 871 | ||||||||||||||||||
| Total costs incurred |
389 | 1,247 | 1,393 | 1,874 | 11,745 | 1,439 | ||||||||||||||||||
| Total (1,2) | ||||||||||||||||||||||||
| 2015 | 2014 | 2013 | ||||||||||||||||||||||
| Acquisitions |
||||||||||||||||||||||||
| Unproved |
17 | 5,467 | 137 | |||||||||||||||||||||
| Proved |
19 | 5,014 | 47 | |||||||||||||||||||||
| Total acquisitions |
36 | 10,481 | 184 | |||||||||||||||||||||
| Exploration costs |
6 | 48 | 434 | |||||||||||||||||||||
| Development costs |
2,221 | 2,463 | 2,214 | |||||||||||||||||||||
| Total costs incurred |
2,263 | 12,992 | 2,832 | |||||||||||||||||||||
| (1) | 2014 Unproved includes $5,338 million from the acquisition of Athlon. |
| (2) | 2014 Proved includes $2,127 million from the acquisition of Athlon. |
COSTS NOT SUBJECT TO DEPLETION OR AMORTIZATION
Upstream costs in respect of significant unproved properties are excluded from the country cost centre’s depletable base as follows:
| As at December 31 | 2015 | 2014 | ||||||
| Canada |
334 | $ | 478 | |||||
| United States |
5,282 | 5,655 | ||||||
| 5,616 | $ | 6,133 | ||||||
The following is a summary of the costs related to Encana’s unproved properties as at December 31, 2015:
| 2015 | 2014 | 2013 | Prior to 2013 | Total | ||||||||||||||||
| Acquisition Costs |
$ | 27 | $ | 5,207 | $ | 30 | $ | 223 | $ | 5,487 | ||||||||||
| Exploration Costs |
8 | 50 | 38 | 33 | 129 | |||||||||||||||
| $ | 35 | $ | 5,257 | $ | 68 | $ | 256 | $ | 5,616 | |||||||||||
Ultimate recoverability of these costs and the timing of inclusion within the applicable country cost centre’s depletable base is dependent upon either the finding of proved natural gas and liquids reserves, expiration of leases or recognition of impairments. Acquisition costs primarily include costs incurred to acquire or lease properties. Exploration costs primarily include costs related to geological and geophysical studies and costs of drilling and equipping exploratory wells.
ANNUAL REPORT 2015 | Encana Corporation 119
SUPPLEMENTAL INFORMATION
U.S. DOLLARS/U.S. PROTOCOL
| Supplemental Financial Information (unaudited) |
Financial Results
| 2015 | 2014 | |||||||||||||||||||||||||||||||||||||||
|
($ millions, except per share amounts) |
Year | Q4 | Q3 | Q2 | Q1 | Year | Q4 | Q3 | Q2 | Q1 | ||||||||||||||||||||||||||||||
| Cash Flow (1) |
1,430 | 383 | 371 | 181 | 495 | 2,934 | 377 | 807 | 656 | 1,094 | ||||||||||||||||||||||||||||||
| Per share - Diluted (4) |
1.74 | 0.45 | 0.44 | 0.22 | 0.65 | 3.96 | 0.51 | 1.09 | 0.89 | 1.48 | ||||||||||||||||||||||||||||||
| Operating Earnings (Loss) (2,3) |
(61) | 111 | (24 | ) | (167 | ) | 19 | 1,002 | 35 | 281 | 171 | 515 | ||||||||||||||||||||||||||||
| Per share - Diluted (4) |
(0.07) | 0.13 | (0.03 | ) | (0.20 | ) | 0.03 | 1.35 | 0.05 | 0.38 | 0.23 | 0.70 | ||||||||||||||||||||||||||||
| Net Earnings (Loss) Attributable to Common Shareholders |
(5,165) | (612 | ) | (1,236 | ) | (1,610 | ) | (1,707 | ) | 3,392 | 198 | 2,807 | 271 | 116 | ||||||||||||||||||||||||||
| Per share - Diluted (4) |
(6.28) | (0.72 | ) | (1.47 | ) | (1.91 | ) | (2.25 | ) | 4.58 | 0.27 | 3.79 | 0.37 | 0.16 | ||||||||||||||||||||||||||
| Effective Tax Rate using |
||||||||||||||||||||||||||||||||||||||||
| Canadian Statutory Rate |
26.4% | 25.7% | ||||||||||||||||||||||||||||||||||||||
| Foreign Exchange Rates (US$ per C$1) |
||||||||||||||||||||||||||||||||||||||||
| Average |
0.782 | 0.749 | 0.764 | 0.813 | 0.806 | 0.905 | 0.881 | 0.918 | 0.917 | 0.906 | ||||||||||||||||||||||||||||||
| Period end |
0.723 | 0.723 | 0.747 | 0.802 | 0.789 | 0.862 | 0.862 | 0.892 | 0.937 | 0.905 | ||||||||||||||||||||||||||||||
| Cash Flow Summary |
||||||||||||||||||||||||||||||||||||||||
| Cash From (Used in) Operating Activities |
1,681 | 448 | 453 | 298 | 482 | 2,667 | 261 | 696 | 767 | 943 | ||||||||||||||||||||||||||||||
| Deduct (Add back): |
||||||||||||||||||||||||||||||||||||||||
| Net change in other assets and liabilities |
(11) | 7 | (18 | ) | 7 | (7 | ) | (43) | (15 | ) | (11 | ) | (8 | ) | (9 | ) | ||||||||||||||||||||||||
| Net change in non-cash working capital |
262 | 58 | 100 | 110 | (6 | ) | (9) | (141 | ) | 155 | 119 | (142 | ) | |||||||||||||||||||||||||||
| Cash tax on sale of assets |
- | - | - | - | - | (215) | 40 | (255 | ) | - | - | |||||||||||||||||||||||||||||
| Cash Flow (1) |
1,430 | 383 | 371 | 181 | 495 | 2,934 | 377 | 807 | 656 | 1,094 | ||||||||||||||||||||||||||||||
| Operating Earnings Summary |
||||||||||||||||||||||||||||||||||||||||
| Net Earnings (Loss) Attributable to Common Shareholders |
(5,165) | (612 | ) | (1,236 | ) | (1,610 | ) | (1,707 | ) | 3,392 | 198 | 2,807 | 271 | 116 | ||||||||||||||||||||||||||
| After-tax (addition) deduction: |
||||||||||||||||||||||||||||||||||||||||
| Unrealized hedging gain (loss) |
(244) | (66 | ) | 107 | (187 | ) | (98 | ) | 306 | 341 | 160 | 8 | (203 | ) | ||||||||||||||||||||||||||
| Impairments |
(4,130) | (514 | ) | (1,066 | ) | (1,328 | ) | (1,222 | ) | - | - | - | - | - | ||||||||||||||||||||||||||
| Restructuring charges (3) |
(45) | (5 | ) | (20 | ) | (10 | ) | (10 | ) | (24) | (4 | ) | (5 | ) | (5 | ) | (10 | ) | ||||||||||||||||||||||
| Non-operating foreign exchange gain (loss) |
(702) | (96 | ) | (212 | ) | 114 | (508 | ) | (407) | (151 | ) | (218 | ) | 156 | (194 | ) | ||||||||||||||||||||||||
| Gain (loss) on divestitures |
9 | - | (2 | ) | 1 | 10 | 2,523 | (11 | ) | 2,399 | 135 | - | ||||||||||||||||||||||||||||
| Income tax adjustments |
8 | (42 | ) | (19 | ) | (33 | ) | 102 | (8) | (12 | ) | 190 | (194 | ) | 8 | |||||||||||||||||||||||||
| Operating Earnings (Loss) (2,3) |
(61) | 111 | (24 | ) | (167 | ) | 19 | 1,002 | 35 | 281 | 171 | 515 | ||||||||||||||||||||||||||||
| (1) | Cash Flow is a non-GAAP measure defined as cash from operating activities excluding net change in other assets and liabilities, net change in non-cash working capital and cash tax on sale of assets. |
| (2) | Operating Earnings (Loss) is a non-GAAP measure defined as net earnings (loss) attributable to common shareholders excluding non-recurring or non-cash items that Management believes reduces the comparability of the Company’s financial performance between periods. These after-tax items may include, but are not limited to, unrealized hedging gains/losses, impairments, restructuring charges, non-operating foreign exchange gains/losses, gains/losses on divestitures, income taxes related to divestitures and adjustments to normalize the effect of income taxes calculated using the estimated annual effective income tax rate. |
| (3) | In continued support of Encana’s strategy, organizational structure changes were formalized in Q2 2015 and resulted in a revision to the Q1 2015 Operating Earnings to exclude restructuring charges incurred in the first quarter. |
| (4) | Net earnings (loss) attributable to common shareholders, operating earnings (loss) and cash flow per common share are calculated using the weighted average number of Encana common shares outstanding as follows: |
| 2015 | 2014 | |||||||||||||||||||||||||||||||||||||||
| (millions) |
Year |
Q4 | Q3 | Q2 | Q1 | Year | Q4 | Q3 | Q2 | Q1 | ||||||||||||||||||||||||||||||
| Weighted Average Common Shares Outstanding |
||||||||||||||||||||||||||||||||||||||||
| Basic |
822.1 | 846.5 | 843.1 | 841.2 | 757.8 | 741.0 | 741.1 | 741.1 | 741.0 | 741.0 | ||||||||||||||||||||||||||||||
| Diluted |
822.1 | 846.5 | 843.1 | 841.2 | 757.8 | 741.0 | 741.1 | 741.1 | 741.0 | 741.0 | ||||||||||||||||||||||||||||||
120 Encana Corporation | ANNUAL REPORT 2015
SUPPLEMENTAL INFORMATION
U.S. DOLLARS/U.S. PROTOCOL
Supplemental Financial & Operating Information (unaudited)
Financial Metrics
| 2015 | 2014 | |||||||||||||||||||||||||||
|
Year |
Year |
|||||||||||||||||||||||||||
| Debt to Debt Adjusted Cash Flow |
2.8x | 2.1x | ||||||||||||||||||||||||||
| Debt to Adjusted Capitalization |
28% | 30% | ||||||||||||||||||||||||||
The financial metrics disclosed above are non-GAAP measures monitored by Management as indicators of the Company’s overall financial strength. These non-GAAP measures are defined and calculated in the Non-GAAP Measures section of Encana’s Management’s Discussion and Analysis.
|
Net Capital Investment
|
| |||||||||||||||||||||||||||||||||||||||
| 2015 |
2014 |
|||||||||||||||||||||||||||||||||||||||
|
($ millions) |
Year | Q4 | Q3 | Q2 | Q1 | Year | Q4 | Q3 | Q2 | Q1 | ||||||||||||||||||||||||||||||
| Capital Investment |
||||||||||||||||||||||||||||||||||||||||
| Canadian Operations |
380 | 39 | 76 | 114 | 151 | 1,226 | 302 | 293 | 350 | 281 | ||||||||||||||||||||||||||||||
| USA Operations |
1,847 | 242 | 394 | 628 | 583 | 1,285 | 548 | 305 | 206 | 226 | ||||||||||||||||||||||||||||||
| Market Optimization |
1 | - | 1 | - | - | - | - | (2 | ) | 1 | 1 | |||||||||||||||||||||||||||||
| Corporate & Other |
4 | (1 | ) | 2 | 1 | 2 | 15 | 7 | 2 | 3 | 3 | |||||||||||||||||||||||||||||
| Capital Investment |
2,232 | 280 | 473 | 743 | 736 | 2,526 | 857 | 598 | 560 | 511 | ||||||||||||||||||||||||||||||
| Net Acquisitions & (Divestitures) |
(1,838 | ) | (761 | ) | (99 | ) | (140 | ) | (838) | (1,329 | ) | 50 | (2,007 | ) | 652 | (24) | ||||||||||||||||||||||||
| Net Capital Investment |
394 | (481 | ) | 374 | 603 | (102) | 1,197 | 907 | (1,409 | ) | 1,212 | 487 | ||||||||||||||||||||||||||||
|
Capital Investment |
||||||||||||||||||||||||||||||||||||||||
| 2015 | 2014 | |||||||||||||||||||||||||||||||||||||||
|
($ millions) |
Year | Q4 | Q3 | Q2 | Q1 | Year | Q4 | Q3 | Q2 | Q1 | ||||||||||||||||||||||||||||||
| Capital Investment |
||||||||||||||||||||||||||||||||||||||||
| Montney (1) |
159 | 15 | 17 | 48 | 79 | 781 | 159 | 204 | 210 | 208 | ||||||||||||||||||||||||||||||
| Duvernay |
205 | 20 | 58 | 57 | 70 | 328 | 118 | 58 | 81 | 71 | ||||||||||||||||||||||||||||||
| Eagle Ford |
570 | 56 | 142 | 175 | 197 | 274 | 149 | 113 | 12 | - | ||||||||||||||||||||||||||||||
| Permian |
916 | 155 | 219 | 325 | 217 | 117 | 117 | - | - | - | ||||||||||||||||||||||||||||||
| 1,850 | 246 | 436 | 605 | 563 | 1,500 | 543 | 375 | 303 | 279 | |||||||||||||||||||||||||||||||
| Other Upstream Operations (1, 2) |
377 | 35 | 34 | 137 | 171 | 1,011 | 307 | 223 | 253 | 228 | ||||||||||||||||||||||||||||||
| Market Optimization |
1 | - | 1 | - | - | - | - | (2 | ) | 1 | 1 | |||||||||||||||||||||||||||||
| Corporate & Other |
4 | (1 | ) | 2 | 1 | 2 | 15 | 7 | 2 | 3 | 3 | |||||||||||||||||||||||||||||
| Capital Investment |
2,232 | 280 | 473 | 743 | 736 | 2,526 | 857 | 598 | 560 | 511 | ||||||||||||||||||||||||||||||
| (1) | Montney has been realigned to include certain capital investments which were previously reported in Other Upstream Operations. |
| (2) | Other Upstream Operations includes capital investment from plays that are not part of the Company’s current strategic focus. |
ANNUAL REPORT 2015 | Encana Corporation 121
SUPPLEMENTAL INFORMATION
U.S. DOLLARS/U.S. PROTOCOL
Supplemental Financial & Operating Information (unaudited)
Production Volumes - After Royalties
| 2015 | 2014 | |||||||||||||||||||||||||||||||||||||||||
|
(average) |
Year | Q4 | Q3 | Q2 | Q1 | Year | Q4 | Q3 | Q2 | Q1 | ||||||||||||||||||||||||||||||||
| Natural Gas (MMcf/d) |
1,635 | 1,571 | 1,547 | 1,568 | 1,857 | 2,350 | 1,861 | 2,199 | 2,541 | 2,809 | ||||||||||||||||||||||||||||||||
| Oil (Mbbls/d) |
87.0 | 90.6 | 91.9 | 86.2 | 79.2 | 49.4 | 68.8 | 62.1 | 34.2 | 32.1 | ||||||||||||||||||||||||||||||||
|
NGLs (Mbbls/d) |
46.4 | 54.4 | 48.5 | 41.1 | 41.5 | 37.4 | 37.6 | 41.9 | 34.0 | 35.8 | ||||||||||||||||||||||||||||||||
|
Oil & NGLs (Mbbls/d) |
133.4 | 145.0 | 140.4 | 127.3 | 120.7 | 86.8 | 106.4 | 104.0 | 68.2 | 67.9 | ||||||||||||||||||||||||||||||||
| Total (MBOE/d) |
405.9 | 406.8 | 398.3 | 388.7 | 430.1 | 478.5 | 416.7 | 470.6 | 491.8 | 536.1 | ||||||||||||||||||||||||||||||||
|
Production Volumes - After Royalties |
||||||||||||||||||||||||||||||||||||||||||
|
2015 |
2014 | |||||||||||||||||||||||||||||||||||||||||
|
(average) |
Year | Q4 | Q3 | Q2 | Q1 | Year | Q4 | Q3 | Q2 | Q1 | ||||||||||||||||||||||||||||||||
| Natural Gas (MMcf/d) |
||||||||||||||||||||||||||||||||||||||||||
| Canadian Operations |
971 | 1,001 | 876 | 881 | 1,128 | 1,378 | 1,111 | 1,374 | 1,463 | 1,568 | ||||||||||||||||||||||||||||||||
| USA Operations |
664 | 570 | 671 | 687 | 729 | 972 | 750 | 825 | 1,078 | 1,241 | ||||||||||||||||||||||||||||||||
| 1,635 | 1,571 | 1,547 | 1,568 | 1,857 | 2,350 | 1,861 | 2,199 | 2,541 | 2,809 | |||||||||||||||||||||||||||||||||
| Oil (Mbbls/d) |
||||||||||||||||||||||||||||||||||||||||||
| Canadian Operations |
5.6 | 4.0 | 5.3 | 6.5 | 6.6 | 13.6 | 9.4 | 14.7 | 13.9 | 16.4 | ||||||||||||||||||||||||||||||||
| USA Operations |
81.4 | 86.6 | 86.6 | 79.7 | 72.6 | 35.8 | 59.4 | 47.4 | 20.3 | 15.7 | ||||||||||||||||||||||||||||||||
| 87.0 | 90.6 | 91.9 | 86.2 | 79.2 | 49.4 | 68.8 | 62.1 | 34.2 | 32.1 | |||||||||||||||||||||||||||||||||
| NGLs (Mbbls/d) |
||||||||||||||||||||||||||||||||||||||||||
| Canadian Operations |
22.8 | 28.2 | 21.9 | 19.8 | 21.2 | 23.6 | 18.8 | 27.6 | 23.5 | 24.6 | ||||||||||||||||||||||||||||||||
| USA Operations |
23.6 | 26.2 | 26.6 | 21.3 | 20.3 | 13.8 | 18.8 | 14.3 | 10.5 | 11.2 | ||||||||||||||||||||||||||||||||
| 46.4 | 54.4 | 48.5 | 41.1 | 41.5 | 37.4 | 37.6 | 41.9 | 34.0 | 35.8 | |||||||||||||||||||||||||||||||||
| Oil & NGLs (Mbbls/d) |
||||||||||||||||||||||||||||||||||||||||||
| Canadian Operations |
28.4 | 32.2 | 27.2 | 26.3 | 27.8 | 37.2 | 28.2 | 42.3 | 37.4 | 41.0 | ||||||||||||||||||||||||||||||||
| USA Operations |
105.0 | 112.8 | 113.2 | 101.0 | 92.9 | 49.6 | 78.2 | 61.7 | 30.8 | 26.9 | ||||||||||||||||||||||||||||||||
| 133.4 | 145.0 | 140.4 | 127.3 | 120.7 | 86.8 | 106.4 | 104.0 | 68.2 | 67.9 | |||||||||||||||||||||||||||||||||
| Total (MBOE/d) |
||||||||||||||||||||||||||||||||||||||||||
| Canadian Operations |
190.2 | 199.1 | 173.2 | 173.2 | 215.8 | 266.9 | 213.4 | 271.4 | 281.4 | 302.4 | ||||||||||||||||||||||||||||||||
| USA Operations |
215.7 | 207.7 | 225.1 | 215.5 | 214.3 | 211.6 | 203.3 | 199.2 | 210.4 | 233.7 | ||||||||||||||||||||||||||||||||
| 405.9 | 406.8 | 398.3 | 388.7 | 430.1 | 478.5 | 416.7 | 470.6 | 491.8 | 536.1 | |||||||||||||||||||||||||||||||||
|
Oil & NGLs Production Volumes - After Royalties |
| |||||||||||||||||||||||||||||||||||||||||
|
2015 |
2014 | |||||||||||||||||||||||||||||||||||||||||
| (average Mbbls/d) | Year | % of Total |
Year | % of Total |
||||||||||||||||||||||||||||||||||||||
| Oil |
87.0 | 65 | 49.4 | 57 | ||||||||||||||||||||||||||||||||||||||
| Plant Condensate |
16.8 | 13 | 12.0 | 14 | ||||||||||||||||||||||||||||||||||||||
| Butane |
7.5 | 6 | 6.8 | 8 | ||||||||||||||||||||||||||||||||||||||
| Propane |
12.2 | 9 | 10.2 | 11 | ||||||||||||||||||||||||||||||||||||||
| Ethane |
9.9 | 7 | 8.4 | 10 | ||||||||||||||||||||||||||||||||||||||
| 133.4 | 100 | 86.8 | 100 | |||||||||||||||||||||||||||||||||||||||
122 Encana Corporation | ANNUAL REPORT 2015
SUPPLEMENTAL INFORMATION
U.S. DOLLARS/U.S. PROTOCOL
Supplemental Financial & Operating Information (unaudited)
Results of Operations
Product and Operational Information, Including the Impact of Realized Financial Hedging
| 2015 (1) | 2014 (1) | |||||||||||||||||||||||||||||||||||||||||
|
($ millions) |
Year | Q4 | Q3 | Q2 | Q1 | Year | Q4 | Q3 | Q2 | Q1 | ||||||||||||||||||||||||||||||||
| Natural Gas - Canadian Operations |
||||||||||||||||||||||||||||||||||||||||||
| Revenues, Net of Royalties, excluding Hedging |
976 | 188 | 199 | 193 | 396 | 2,468 | 402 | 480 | 569 | 1,017 | ||||||||||||||||||||||||||||||||
| Realized Financial Hedging Gain (Loss) |
479 | 115 | 104 | 106 | 154 | (74 | ) | 25 | 20 | (44 | ) | (75 | ) | |||||||||||||||||||||||||||||
| Expenses |
||||||||||||||||||||||||||||||||||||||||||
| Production, mineral and other taxes |
26 | 5 | 6 | 7 | 8 | 53 | 15 | 14 | 11 | 13 | ||||||||||||||||||||||||||||||||
| Transportation and processing |
605 | 146 | 141 | 157 | 161 | 764 | 175 | 184 | 206 | 199 | ||||||||||||||||||||||||||||||||
| Operating |
135 | 41 | 30 | 34 | 30 | 240 | 46 | 55 | 64 | 75 | ||||||||||||||||||||||||||||||||
| Operating Cash Flow |
689 | 111 | 126 | 101 | 351 | 1,337 | 191 | 247 | 244 | 655 | ||||||||||||||||||||||||||||||||
| Natural Gas - USA Operations |
||||||||||||||||||||||||||||||||||||||||||
| Revenues, Net of Royalties, excluding Hedging |
629 | 118 | 170 | 146 | 195 | 1,640 | 274 | 307 | 463 | 596 | ||||||||||||||||||||||||||||||||
| Realized Financial Hedging Gain (Loss) |
239 | 73 | 54 | 58 | 54 | (85 | ) | 13 | 10 | (43 | ) | (65 | ) | |||||||||||||||||||||||||||||
| Expenses |
||||||||||||||||||||||||||||||||||||||||||
| Production, mineral and other taxes |
27 | 5 | 9 | 7 | 6 | 57 | 14 | (7 | ) | 18 | 32 | |||||||||||||||||||||||||||||||
| Transportation and processing |
566 | 121 | 152 | 142 | 151 | 651 | 149 | 162 | 177 | 163 | ||||||||||||||||||||||||||||||||
| Operating |
158 | 31 | 36 | 44 | 47 | 222 | 49 | 47 | 61 | 65 | ||||||||||||||||||||||||||||||||
| Operating Cash Flow |
117 | 34 | 27 | 11 | 45 | 625 | 75 | 115 | 164 | 271 | ||||||||||||||||||||||||||||||||
| Natural Gas - Total Operations |
||||||||||||||||||||||||||||||||||||||||||
| Revenues, Net of Royalties, excluding Hedging |
1,605 | 306 | 369 | 339 | 591 | 4,108 | 676 | 787 | 1,032 | 1,613 | ||||||||||||||||||||||||||||||||
| Realized Financial Hedging Gain (Loss) |
718 | 188 | 158 | 164 | 208 | (159 | ) | 38 | 30 | (87 | ) | (140 | ) | |||||||||||||||||||||||||||||
| Expenses |
||||||||||||||||||||||||||||||||||||||||||
| Production, mineral and other taxes |
53 | 10 | 15 | 14 | 14 | 110 | 29 | 7 | 29 | 45 | ||||||||||||||||||||||||||||||||
| Transportation and processing |
1,171 | 267 | 293 | 299 | 312 | 1,415 | 324 | 346 | 383 | 362 | ||||||||||||||||||||||||||||||||
| Operating |
293 | 72 | 66 | 78 | 77 | 462 | 95 | 102 | 125 | 140 | ||||||||||||||||||||||||||||||||
| Operating Cash Flow |
806 | 145 | 153 | 112 | 396 | 1,962 | 266 | 362 | 408 | 926 | ||||||||||||||||||||||||||||||||
| Oil & NGLs - Canadian Operations |
||||||||||||||||||||||||||||||||||||||||||
| Revenues, Net of Royalties, excluding Hedging |
333 | 90 | 75 | 91 | 77 | 872 | 149 | 251 | 227 | 245 | ||||||||||||||||||||||||||||||||
| Realized Financial Hedging Gain (Loss) |
16 | 14 | 5 | (5 | ) | 2 | 18 | 24 | (1 | ) | (5 | ) | - | |||||||||||||||||||||||||||||
| Expenses |
||||||||||||||||||||||||||||||||||||||||||
| Production, mineral and other taxes |
2 | 1 | - | 1 | - | 11 | - | 3 | 5 | 3 | ||||||||||||||||||||||||||||||||
| Transportation and processing |
49 | 12 | 10 | 13 | 14 | 62 | 16 | 16 | 16 | 14 | ||||||||||||||||||||||||||||||||
| Operating |
15 | 2 | 3 | 4 | 6 | 27 | 10 | 8 | 3 | 6 | ||||||||||||||||||||||||||||||||
| Operating Cash Flow |
283 | 89 | 67 | 68 | 59 | 790 | 147 | 223 | 198 | 222 | ||||||||||||||||||||||||||||||||
| Oil & NGLs - USA Operations |
||||||||||||||||||||||||||||||||||||||||||
| Revenues, Net of Royalties, excluding Hedging |
1,412 | 332 | 371 | 414 | 295 | 1,258 | 412 | 452 | 215 | 179 | ||||||||||||||||||||||||||||||||
| Realized Financial Hedging Gain (Loss) |
185 | 88 | 54 | 5 | 38 | 60 | 65 | 1 | (6 | ) | - | |||||||||||||||||||||||||||||||
| Expenses |
||||||||||||||||||||||||||||||||||||||||||
| Production, mineral and other taxes |
89 | 20 | 23 | 23 | 23 | 89 | 32 | 29 | 15 | 13 | ||||||||||||||||||||||||||||||||
| Transportation and processing |
14 | 5 | 3 | 2 | 4 | 7 | 3 | 4 | - | - | ||||||||||||||||||||||||||||||||
| Operating |
357 | 87 | 101 | 102 | 67 | 100 | 42 | 38 | 12 | 8 | ||||||||||||||||||||||||||||||||
| Operating Cash Flow |
1,137 | 308 | 298 | 292 | 239 | 1,122 | 400 | 382 | 182 | 158 | ||||||||||||||||||||||||||||||||
| Oil & NGLs - Total Operations |
||||||||||||||||||||||||||||||||||||||||||
| Revenues, Net of Royalties, excluding Hedging |
1,745 | 422 | 446 | 505 | 372 | 2,130 | 561 | 703 | 442 | 424 | ||||||||||||||||||||||||||||||||
| Realized Financial Hedging Gain (Loss) |
201 | 102 | 59 | - | 40 | 78 | 89 | - | (11 | ) | - | |||||||||||||||||||||||||||||||
| Expenses |
||||||||||||||||||||||||||||||||||||||||||
| Production, mineral and other taxes |
91 | 21 | 23 | 24 | 23 | 100 | 32 | 32 | 20 | 16 | ||||||||||||||||||||||||||||||||
| Transportation and processing |
63 | 17 | 13 | 15 | 18 | 69 | 19 | 20 | 16 | 14 | ||||||||||||||||||||||||||||||||
| Operating |
372 | 89 | 104 | 106 | 73 | 127 | 52 | 46 | 15 | 14 | ||||||||||||||||||||||||||||||||
| Operating Cash Flow |
1,420 | 397 | 365 | 360 | 298 | 1,912 | 547 | 605 | 380 | 380 | ||||||||||||||||||||||||||||||||
| (1) | Updated to reflect the reclassification of property taxes and certain other levied charges from transportation and processing expense and/or operating expense to production, mineral and other taxes. There were no changes to the reported totals for Operating Cash Flow or Netbacks. |
ANNUAL REPORT 2015 | Encana Corporation 123
SUPPLEMENTAL INFORMATION
U.S. DOLLARS/U.S. PROTOCOL
Supplemental Oil and Gas Operating Statistics (unaudited)
Operating Statistics - After Royalties
Per-unit Results, Excluding the Impact of Realized Financial Hedging
| 2015 (1) | 2014 (1) | |||||||||||||||||||||||||||||||||||||||||
| Year |
Q4 |
Q3 | Q2 | Q1 | Year | Q4 | Q3 | Q2 | Q1 | |||||||||||||||||||||||||||||||||
| Natural Gas - Canadian Operations ($/Mcf) |
||||||||||||||||||||||||||||||||||||||||||
| Price (2) |
2.75 | 2.04 | 2.48 | 2.39 | 3.89 | 4.89 | 3.93 | 3.78 | 4.27 | 7.17 | ||||||||||||||||||||||||||||||||
| Production, mineral and other taxes |
0.07 | 0.06 | 0.08 | 0.08 | 0.08 | 0.11 | 0.14 | 0.11 | 0.08 | 0.09 | ||||||||||||||||||||||||||||||||
| Transportation and processing |
1.71 | 1.59 | 1.75 | 1.95 | 1.58 | 1.50 | 1.71 | 1.45 | 1.55 | 1.40 | ||||||||||||||||||||||||||||||||
| Operating |
0.38 | 0.44 | 0.38 | 0.43 | 0.29 | 0.48 | 0.44 | 0.44 | 0.49 | 0.53 | ||||||||||||||||||||||||||||||||
| Netback |
0.59 | (0.05 | ) | 0.27 | (0.07 | ) | 1.94 | 2.80 | 1.64 | 1.78 | 2.15 | 5.15 | ||||||||||||||||||||||||||||||
| Natural Gas - USA Operations ($/Mcf) |
||||||||||||||||||||||||||||||||||||||||||
| Price |
2.60 | 2.29 | 2.75 | 2.33 | 2.97 | 4.62 | 3.95 | 4.05 | 4.72 | 5.34 | ||||||||||||||||||||||||||||||||
| Production, mineral and other taxes |
0.11 | 0.10 | 0.14 | 0.12 | 0.09 | 0.16 | 0.21 | (0.11 | ) | 0.18 | 0.29 | |||||||||||||||||||||||||||||||
| Transportation and processing |
2.34 | 2.31 | 2.47 | 2.26 | 2.30 | 1.82 | 2.16 | 2.13 | 1.81 | 1.46 | ||||||||||||||||||||||||||||||||
| Operating |
0.65 | 0.58 | 0.59 | 0.71 | 0.72 | 0.63 | 0.71 | 0.62 | 0.63 | 0.58 | ||||||||||||||||||||||||||||||||
| Netback |
(0.50) | (0.70 | ) | (0.45 | ) | (0.76 | ) | (0.14 | ) | 2.01 | 0.87 | 1.41 | 2.10 | 3.01 | ||||||||||||||||||||||||||||
| Natural Gas - Total Operations ($/Mcf) |
||||||||||||||||||||||||||||||||||||||||||
| Price (3) |
2.69 | 2.13 | 2.60 | 2.37 | 3.53 | 4.78 | 3.94 | 3.88 | 4.46 | 6.37 | ||||||||||||||||||||||||||||||||
| Production, mineral and other taxes |
0.09 | 0.07 | 0.11 | 0.10 | 0.09 | 0.13 | 0.17 | 0.03 | 0.12 | 0.18 | ||||||||||||||||||||||||||||||||
| Transportation and processing |
1.96 | 1.85 | 2.06 | 2.09 | 1.86 | 1.65 | 1.89 | 1.70 | 1.66 | 1.43 | ||||||||||||||||||||||||||||||||
| Operating |
0.49 | 0.49 | 0.47 | 0.55 | 0.46 | 0.54 | 0.55 | 0.51 | 0.55 | 0.55 | ||||||||||||||||||||||||||||||||
| Netback |
0.15 | (0.28 | ) | (0.04 | ) | (0.37 | ) | 1.12 | 2.46 | 1.33 | 1.64 | 2.13 | 4.21 | |||||||||||||||||||||||||||||
| Oil & NGLs - Canadian Operations ($/bbl) |
||||||||||||||||||||||||||||||||||||||||||
| Price |
32.10 | 30.08 | 29.75 | 38.57 | 30.65 | 64.16 | 57.50 | 64.79 | 66.13 | 66.36 | ||||||||||||||||||||||||||||||||
| Production, mineral and other taxes |
0.18 | 0.13 | 0.19 | 0.23 | 0.18 | 0.85 | 0.38 | 0.80 | 1.23 | 0.90 | ||||||||||||||||||||||||||||||||
| Transportation and processing |
4.71 | 3.90 | 3.95 | 5.40 | 5.78 | 4.49 | 5.87 | 4.16 | 4.57 | 3.77 | ||||||||||||||||||||||||||||||||
| Operating |
1.48 | 1.04 | 1.01 | 1.74 | 2.21 | 1.98 | 3.77 | 1.97 | 0.98 | 1.68 | ||||||||||||||||||||||||||||||||
| Netback |
25.73 | 25.01 | 24.60 | 31.20 | 22.48 | 56.84 | 47.48 | 57.86 | 59.35 | 60.01 | ||||||||||||||||||||||||||||||||
| Oil & NGLs - USA Operations ($/bbl) |
||||||||||||||||||||||||||||||||||||||||||
| Price |
36.80 | 31.81 | 35.66 | 45.21 | 35.18 | 69.54 | 57.30 | 79.43 | 77.46 | 73.61 | ||||||||||||||||||||||||||||||||
| Production, mineral and other taxes |
2.30 | 1.91 | 2.17 | 2.46 | 2.77 | 4.93 | 4.29 | 5.23 | 5.49 | 5.53 | ||||||||||||||||||||||||||||||||
| Transportation and processing |
0.35 | 0.44 | 0.31 | 0.24 | 0.43 | 0.39 | 0.49 | 0.63 | - | - | ||||||||||||||||||||||||||||||||
| Operating |
9.33 | 8.43 | 9.73 | 11.08 | 7.99 | 5.53 | 5.98 | 6.75 | 3.99 | 3.09 | ||||||||||||||||||||||||||||||||
| Netback |
24.82 | 21.03 | 23.45 | 31.43 | 23.99 | 58.69 | 46.54 | 66.82 | 67.98 | 64.99 | ||||||||||||||||||||||||||||||||
| Oil & NGLs - Total Operations ($/bbl) |
||||||||||||||||||||||||||||||||||||||||||
| Price |
35.80 | 31.43 | 34.52 | 43.83 | 34.13 | 67.24 | 57.35 | 73.48 | 71.23 | 69.23 | ||||||||||||||||||||||||||||||||
| Production, mineral and other taxes |
1.85 | 1.52 | 1.79 | 2.00 | 2.17 | 3.18 | 3.25 | 3.43 | 3.14 | 2.74 | ||||||||||||||||||||||||||||||||
| Transportation and processing |
1.28 | 1.21 | 1.02 | 1.31 | 1.66 | 2.15 | 1.92 | 2.07 | 2.51 | 2.29 | ||||||||||||||||||||||||||||||||
| Operating |
7.65 | 6.80 | 8.03 | 9.15 | 6.67 | 4.02 | 5.40 | 4.80 | 2.34 | 2.23 | ||||||||||||||||||||||||||||||||
| Netback |
25.02 | 21.90 | 23.68 | 31.37 | 23.63 | 57.89 | 46.78 | 63.18 | 63.24 | 61.97 | ||||||||||||||||||||||||||||||||
| Total - Canadian Operations ($/BOE) |
||||||||||||||||||||||||||||||||||||||||||
| Price |
18.84 | 15.14 | 17.22 | 18.05 | 24.30 | 34.21 | 28.06 | 29.21 | 31.02 | 46.20 | ||||||||||||||||||||||||||||||||
| Production, mineral and other taxes |
0.41 | 0.31 | 0.42 | 0.45 | 0.46 | 0.66 | 0.80 | 0.67 | 0.60 | 0.61 | ||||||||||||||||||||||||||||||||
| Transportation and processing |
9.42 | 8.64 | 9.47 | 10.77 | 9.00 | 8.45 | 9.69 | 8.00 | 8.64 | 7.77 | ||||||||||||||||||||||||||||||||
| Operating |
2.17 | 2.38 | 2.09 | 2.43 | 1.82 | 2.73 | 2.78 | 2.54 | 2.66 | 2.96 | ||||||||||||||||||||||||||||||||
| Netback |
6.84 | 3.81 | 5.24 | 4.40 | 13.02 | 22.37 | 14.79 | 18.00 | 19.12 | 34.86 | ||||||||||||||||||||||||||||||||
| Total - USA Operations ($/BOE) |
||||||||||||||||||||||||||||||||||||||||||
| Price |
25.93 | 23.55 | 26.13 | 28.61 | 25.34 | 37.53 | 36.64 | 41.38 | 35.48 | 36.82 | ||||||||||||||||||||||||||||||||
| Production, mineral and other taxes |
1.47 | 1.31 | 1.52 | 1.53 | 1.50 | 1.89 | 2.44 | 1.17 | 1.73 | 2.16 | ||||||||||||||||||||||||||||||||
| Transportation and processing |
7.37 | 6.57 | 7.52 | 7.34 | 8.02 | 8.51 | 8.17 | 9.04 | 9.23 | 7.75 | ||||||||||||||||||||||||||||||||
| Operating |
6.55 | 6.18 | 6.63 | 7.46 | 5.91 | 4.18 | 4.91 | 4.66 | 3.83 | 3.43 | ||||||||||||||||||||||||||||||||
| Netback |
10.54 | 9.49 | 10.46 | 12.28 | 9.91 | 22.95 | 21.12 | 26.51 | 20.69 | 23.48 | ||||||||||||||||||||||||||||||||
| Total Operations Netback ($/BOE) |
||||||||||||||||||||||||||||||||||||||||||
| Price |
22.61 | 19.44 | 22.26 | 23.90 | 24.82 | 35.67 | 32.25 | 34.36 | 32.93 | 42.12 | ||||||||||||||||||||||||||||||||
| Production, mineral and other taxes |
0.97 | 0.82 | 1.04 | 1.05 | 0.98 | 1.20 | 1.60 | 0.88 | 1.08 | 1.29 | ||||||||||||||||||||||||||||||||
| Transportation and processing |
8.33 | 7.58 | 8.38 | 8.87 | 8.50 | 8.49 | 8.95 | 8.45 | 8.90 | 7.77 | ||||||||||||||||||||||||||||||||
| Operating (4) |
4.50 | 4.32 | 4.66 | 5.22 | 3.85 | 3.37 | 3.82 | 3.43 | 3.16 | 3.16 | ||||||||||||||||||||||||||||||||
| Netback |
8.81 | 6.72 | 8.18 | 8.76 | 11.49 | 22.61 | 17.88 | 21.60 | 19.79 | 29.90 | ||||||||||||||||||||||||||||||||
| (1) | Updated to reflect the reclassification of property taxes and certain other levied charges from transportation and processing expense and/or operating expense to production, mineral and other taxes. There were no changes to the reported totals for Operating Cash Flow or Netbacks. |
| (2) | Canadian Operations price reflects Deep Panuke price for 2015 year-to-date of $8.19/Mcf on natural gas production volumes of 63 MMcf/d. Excluding the impact of the Deep Panuke operations, the natural gas price for 2015 year-to-date is $2.38/Mcf. |
| (3) | Excluding the impact of the Deep Panuke operations, the natural gas price for 2015 year-to-date is $2.47/Mcf. |
| (4) | 2015 year-to-date operating expense includes a recovery of costs related to long-term incentives of $0.04/BOE (2014 year-to-date - costs of $0.06/BOE). |
124 Encana Corporation | ANNUAL REPORT 2015
SUPPLEMENTAL INFORMATION
U.S. DOLLARS/U.S. PROTOCOL
Supplemental Oil and Gas Operating Statistics (unaudited)
Operating Statistics - After Royalties (continued)
Impact of Realized Financial Hedging
| 2015 | 2014 | |||||||||||||||||||||||||||||||||||||||||
|
Year |
Q4 | Q3 | Q2 | Q1 | Year | Q4 | Q3 | Q2 | Q1 | |||||||||||||||||||||||||||||||||
| Natural Gas ($/Mcf) |
||||||||||||||||||||||||||||||||||||||||||
| Canadian Operations |
1.35 | 1.25 | 1.28 | 1.32 | 1.52 | (0.15 | ) | 0.24 | 0.16 | (0.33 | ) | (0.53 | ) | |||||||||||||||||||||||||||||
| USA Operations |
0.99 | 1.39 | 0.88 | 0.93 | 0.82 | (0.24 | ) | 0.19 | 0.12 | (0.44 | ) | (0.58 | ) | |||||||||||||||||||||||||||||
| Total Operations |
1.20 | 1.30 | 1.11 | 1.15 | 1.25 | (0.19 | ) | 0.22 | 0.15 | (0.38 | ) | (0.55 | ) | |||||||||||||||||||||||||||||
| Oil & NGLs ($/bbl) |
||||||||||||||||||||||||||||||||||||||||||
| Canadian Operations |
1.56 | 4.80 | 2.09 | (2.21 | ) | 0.78 | 1.36 | 9.35 | (0.31 | ) | (1.22 | ) | (0.09 | ) | ||||||||||||||||||||||||||||
| USA Operations |
4.83 | 8.50 | 5.17 | 0.52 | 4.58 | 3.29 | 8.94 | 0.25 | (2.28 | ) | 0.04 | |||||||||||||||||||||||||||||||
| Total Operations |
4.13 | 7.68 | 4.57 | (0.05 | ) | 3.70 | 2.46 | 9.05 | 0.02 | (1.70 | ) | (0.04 | ) | |||||||||||||||||||||||||||||
| Total ($/BOE) |
||||||||||||||||||||||||||||||||||||||||||
| Canadian Operations |
7.13 | 7.05 | 6.82 | 6.39 | 8.04 | (0.57 | ) | 2.49 | 0.78 | (1.89 | ) | (2.77 | ) | |||||||||||||||||||||||||||||
| USA Operations |
5.39 | 8.43 | 5.21 | 3.22 | 4.78 | (0.33 | ) | 4.15 | 0.58 | (2.57 | ) | (3.07 | ) | |||||||||||||||||||||||||||||
| Total Operations |
6.20 | 7.75 | 5.91 | 4.63 | 6.42 | (0.46 | ) | 3.30 | 0.70 | (2.18 | ) | (2.90 | ) | |||||||||||||||||||||||||||||
| Per-unit Results, Including the Impact of Realized Financial Hedging | ||||||||||||||||||||||||||||||||||||||||||
| 2015 | 2014 | |||||||||||||||||||||||||||||||||||||||||
| Year | Q4 |
Q3 |
Q2 | Q1 | Year | Q4 | Q3 | Q2 | Q1 | |||||||||||||||||||||||||||||||||
| Natural Gas Price ($/Mcf) |
||||||||||||||||||||||||||||||||||||||||||
| Canadian Operations |
4.10 | 3.29 | 3.76 | 3.71 | 5.41 | 4.74 | 4.17 | 3.94 | 3.94 | 6.64 | ||||||||||||||||||||||||||||||||
| USA Operations |
3.59 | 3.68 | 3.63 | 3.26 | 3.79 | 4.38 | 4.14 | 4.17 | 4.28 | 4.76 | ||||||||||||||||||||||||||||||||
| Total Operations |
3.89 | 3.43 | 3.71 | 3.52 | 4.78 | 4.59 | 4.16 | 4.03 | 4.08 | 5.82 | ||||||||||||||||||||||||||||||||
| Natural Gas Netback ($/Mcf) |
||||||||||||||||||||||||||||||||||||||||||
| Canadian Operations |
1.94 | 1.20 | 1.55 | 1.25 | 3.46 | 2.65 | 1.88 | 1.94 | 1.82 | 4.62 | ||||||||||||||||||||||||||||||||
| USA Operations |
0.49 | 0.69 | 0.43 | 0.17 | 0.68 | 1.77 | 1.06 | 1.53 | 1.66 | 2.43 | ||||||||||||||||||||||||||||||||
| Total Operations |
1.35 | 1.02 | 1.07 | 0.78 | 2.37 | 2.27 | 1.55 | 1.79 | 1.75 | 3.66 | ||||||||||||||||||||||||||||||||
| Oil & NGLs Price ($/bbl) |
||||||||||||||||||||||||||||||||||||||||||
| Canadian Operations |
33.66 | 34.88 | 31.84 | 36.36 | 31.43 | 65.52 | 66.85 | 64.48 | 64.91 | 66.27 | ||||||||||||||||||||||||||||||||
| USA Operations |
41.63 | 40.31 | 40.83 | 45.73 | 39.76 | 72.83 | 66.24 | 79.68 | 75.18 | 73.65 | ||||||||||||||||||||||||||||||||
| Total Operations |
39.93 | 39.11 | 39.09 | 43.78 | 37.83 | 69.70 | 66.40 | 73.50 | 69.53 | 69.19 | ||||||||||||||||||||||||||||||||
| Oil & NGLs Netback ($/bbl) |
||||||||||||||||||||||||||||||||||||||||||
| Canadian Operations |
27.29 | 29.81 | 26.69 | 28.99 | 23.26 | 58.20 | 56.83 | 57.55 | 58.13 | 59.92 | ||||||||||||||||||||||||||||||||
| USA Operations |
29.65 | 29.53 | 28.62 | 31.95 | 28.57 | 61.98 | 55.48 | 67.07 | 65.70 | 65.03 | ||||||||||||||||||||||||||||||||
| Total Operations |
29.15 | 29.58 | 28.25 | 31.32 | 27.33 | 60.35 | 55.83 | 63.20 | 61.54 | 61.93 | ||||||||||||||||||||||||||||||||
| Total Price ($/BOE) |
||||||||||||||||||||||||||||||||||||||||||
| Canadian Operations |
25.97 | 22.19 | 24.04 | 24.44 | 32.34 | 33.64 | 30.55 | 29.99 | 29.13 | 43.43 | ||||||||||||||||||||||||||||||||
| USA Operations |
31.32 | 31.98 | 31.34 | 31.83 | 30.12 | 37.20 | 40.79 | 41.96 | 32.91 | 33.75 | ||||||||||||||||||||||||||||||||
| Total Operations |
28.81 | 27.19 | 28.17 | 28.53 | 31.24 | 35.21 | 35.55 | 35.06 | 30.75 | 39.22 | ||||||||||||||||||||||||||||||||
| Total Netback ($/BOE) |
||||||||||||||||||||||||||||||||||||||||||
| Canadian Operations |
13.97 | 10.86 | 12.06 | 10.79 | 21.06 | 21.80 | 17.28 | 18.78 | 17.23 | 32.09 | ||||||||||||||||||||||||||||||||
| USA Operations |
15.93 | 17.92 | 15.67 | 15.50 | 14.69 | 22.62 | 25.27 | 27.09 | 18.12 | 20.41 | ||||||||||||||||||||||||||||||||
| Total Operations |
15.01 | 14.47 | 14.09 | 13.39 | 17.91 | 22.15 | 21.18 | 22.30 | 17.61 | 27.00 | ||||||||||||||||||||||||||||||||
ANNUAL REPORT 2015 | Encana Corporation 125
SUPPLEMENTAL INFORMATION
U.S. DOLLARS/U.S. PROTOCOL
Supplemental Oil and Gas Operating Statistics (unaudited)
Results by Play
| 2015 | 2014 | |||||||||||||||||||||||||||||||||||||||
| (after royalties) | Year | Q4 | Q3 | Q2 | Q1 | Year | Q4 | Q3 | Q2 | Q1 | ||||||||||||||||||||||||||||||
| Natural Gas Production (MMcf/d) |
||||||||||||||||||||||||||||||||||||||||
| Canadian Operations |
||||||||||||||||||||||||||||||||||||||||
| Montney (1) |
723 | 778 | 711 | 685 | 717 | 639 | 687 | 644 | 604 | 620 | ||||||||||||||||||||||||||||||
| Duvernay |
27 | 48 | 26 | 17 | 16 | 11 | 12 | 15 | 9 | 8 | ||||||||||||||||||||||||||||||
| Other Upstream Operations (2) |
||||||||||||||||||||||||||||||||||||||||
| Wheatland (3) |
86 | 78 | 80 | 76 | 111 | 292 | 249 | 291 | 305 | 324 | ||||||||||||||||||||||||||||||
| Bighorn |
1 | - | - | - | 4 | 158 | (3 | ) | 162 | 230 | 246 | |||||||||||||||||||||||||||||
| Deep Panuke |
63 | 40 | - | 32 | 182 | 190 | 79 | 186 | 243 | 253 | ||||||||||||||||||||||||||||||
| Other and emerging (1) |
71 | 57 | 59 | 71 | 98 | 88 | 87 | 76 | 72 | 117 | ||||||||||||||||||||||||||||||
| Total Canadian Operations |
971 | 1,001 | 876 | 881 | 1,128 | 1,378 | 1,111 | 1,374 | 1,463 | 1,568 | ||||||||||||||||||||||||||||||
| USA Operations |
||||||||||||||||||||||||||||||||||||||||
| Eagle Ford |
44 | 57 | 48 | 36 | 36 | 19 | 35 | 35 | 5 | - | ||||||||||||||||||||||||||||||
| Permian |
44 | 49 | 54 | 38 | 34 | 5 | 20 | - | - | - | ||||||||||||||||||||||||||||||
| Other Upstream Operations (2) |
||||||||||||||||||||||||||||||||||||||||
| DJ Basin |
55 | 59 | 55 | 55 | 49 | 43 | 49 | 38 | 43 | 40 | ||||||||||||||||||||||||||||||
| San Juan |
13 | 11 | 15 | 15 | 13 | 8 | 8 | 9 | 7 | 7 | ||||||||||||||||||||||||||||||
| Piceance |
320 | 301 | 311 | 324 | 343 | 402 | 367 | 398 | 407 | 436 | ||||||||||||||||||||||||||||||
| Haynesville |
173 | 84 | 177 | 204 | 230 | 311 | 252 | 298 | 365 | 331 | ||||||||||||||||||||||||||||||
| Jonah |
- | - | - | - | - | 100 | - | - | 124 | 282 | ||||||||||||||||||||||||||||||
| East Texas |
- | - | - | - | - | 57 | - | 21 | 97 | 113 | ||||||||||||||||||||||||||||||
| Other and emerging |
15 | 9 | 11 | 15 | 24 | 27 | 19 | 26 | 30 | 32 | ||||||||||||||||||||||||||||||
| Total USA Operations |
664 | 570 | 671 | 687 | 729 | 972 | 750 | 825 | 1,078 | 1,241 | ||||||||||||||||||||||||||||||
| Oil & NGLs Production (Mbbls/d) |
||||||||||||||||||||||||||||||||||||||||
| Canadian Operations |
||||||||||||||||||||||||||||||||||||||||
| Montney (1) |
22.5 | 23.2 | 21.8 | 21.6 | 23.3 | 18.9 | 24.8 | 20.8 | 13.3 | 16.2 | ||||||||||||||||||||||||||||||
| Duvernay |
4.8 | 8.5 | 4.9 | 3.0 | 2.8 | 2.1 | 2.5 | 2.6 | 1.8 | 1.4 | ||||||||||||||||||||||||||||||
| Other Upstream Operations (2) |
||||||||||||||||||||||||||||||||||||||||
| Wheatland (3) |
0.9 | 0.5 | 0.4 | 1.2 | 1.7 | 8.6 | 2.0 | 9.9 | 11.3 | 11.3 | ||||||||||||||||||||||||||||||
| Bighorn |
- | - | - | - | - | 7.5 | (1.5 | ) | 8.7 | 11.0 | 12.1 | |||||||||||||||||||||||||||||
| Other and emerging (1) |
0.2 | - | 0.1 | 0.5 | - | 0.1 | 0.4 | 0.3 | - | - | ||||||||||||||||||||||||||||||
| Total Canadian Operations |
28.4 | 32.2 | 27.2 | 26.3 | 27.8 | 37.2 | 28.2 | 42.3 | 37.4 | 41.0 | ||||||||||||||||||||||||||||||
| USA Operations |
||||||||||||||||||||||||||||||||||||||||
| Eagle Ford |
42.8 | 49.1 | 46.0 | 39.8 | 36.0 | 19.8 | 36.1 | 37.6 | 5.0 | - | ||||||||||||||||||||||||||||||
| Permian |
32.8 | 38.4 | 36.7 | 29.5 | 26.7 | 3.5 | 13.8 | - | - | - | ||||||||||||||||||||||||||||||
| Other Upstream Operations (2) |
||||||||||||||||||||||||||||||||||||||||
| DJ Basin |
14.9 | 13.9 | 16.1 | 15.3 | 14.3 | 11.6 | 14.0 | 11.8 | 10.1 | 10.5 | ||||||||||||||||||||||||||||||
| San Juan |
6.2 | 5.0 | 6.8 | 6.4 | 6.7 | 3.9 | 5.6 | 3.5 | 3.9 | 2.7 | ||||||||||||||||||||||||||||||
| Piceance |
3.5 | 3.0 | 3.5 | 3.7 | 3.7 | 5.0 | 4.3 | 4.8 | 5.3 | 5.4 | ||||||||||||||||||||||||||||||
| Jonah |
- | - | - | - | - | 1.8 | - | 0.2 | 2.5 | 4.7 | ||||||||||||||||||||||||||||||
| East Texas |
- | - | - | - | - | 0.5 | - | - | 1.0 | 1.2 | ||||||||||||||||||||||||||||||
| Other and emerging |
4.8 | 3.4 | 4.1 | 6.3 | 5.5 | 3.5 | 4.4 | 3.8 | 3.0 | 2.4 | ||||||||||||||||||||||||||||||
| Total USA Operations |
105.0 | 112.8 | 113.2 | 101.0 | 92.9 | 49.6 | 78.2 | 61.7 | 30.8 | 26.9 | ||||||||||||||||||||||||||||||
| (1) | Montney has been realigned to include certain production volumes which were previously reported in Other and emerging. |
| (2) | Other Upstream Operations includes production volumes from plays that are not part of the Company’s current strategic focus, including the TMS which is reported in Other and emerging in the USA Operations. |
| (3) | Wheatland was previously presented as Clearwater. |
126 Encana Corporation | ANNUAL REPORT 2015
SUPPLEMENTAL INFORMATION
U.S. DOLLARS/U.S. PROTOCOL
Supplemental Oil and Gas Operating Statistics (unaudited)
Results by Play (continued)
| 2015 | 2014 | |||||||||||||||||||||||||||||||||||||||
|
Year |
Q4 |
Q3 | Q2 | Q1 | Year | Q4 | Q3 | Q2 | Q1 | |||||||||||||||||||||||||||||||
|
Drilling Activity (net wells drilled) |
||||||||||||||||||||||||||||||||||||||||
| Canadian Operations |
||||||||||||||||||||||||||||||||||||||||
| Montney |
15 | 1 | - | 6 | 8 | 79 | 14 | 15 | 23 | 27 | ||||||||||||||||||||||||||||||
| Duvernay |
15 | 6 | 2 | 1 | 6 | 24 | 5 | 7 | 6 | 6 | ||||||||||||||||||||||||||||||
| Other Upstream Operations (1) |
||||||||||||||||||||||||||||||||||||||||
| Wheatland (2) |
105 | - | 34 | - | 71 | 174 | 84 | 24 | - | 66 | ||||||||||||||||||||||||||||||
| Bighorn |
- | - | - | - | - | 1 | - | 1 | - | - | ||||||||||||||||||||||||||||||
| Other and emerging |
- | - | - | - | - | 1 | - | 1 | - | - | ||||||||||||||||||||||||||||||
| Total Canadian Operations |
135 | 7 | 36 | 7 | 85 | 279 | 103 | 48 | 29 | 99 | ||||||||||||||||||||||||||||||
|
USA Operations |
||||||||||||||||||||||||||||||||||||||||
| Eagle Ford |
65 | 14 | 10 | 14 | 27 | 35 | 21 | 14 | - | - | ||||||||||||||||||||||||||||||
| Permian |
177 | 35 | 44 | 52 | 46 | 28 | 28 | - | - | - | ||||||||||||||||||||||||||||||
| Other Upstream Operations (1) |
||||||||||||||||||||||||||||||||||||||||
| DJ Basin |
17 | 2 | - | 2 | 13 | 64 | 15 | 17 | 14 | 18 | ||||||||||||||||||||||||||||||
| San Juan |
1 | - | - | - | 1 | 43 | 19 | 15 | 5 | 4 | ||||||||||||||||||||||||||||||
| Piceance |
- | - | - | - | - | 1 | - | - | - | 1 | ||||||||||||||||||||||||||||||
| Haynesville |
2 | - | 2 | - | - | - | - | - | - | - | ||||||||||||||||||||||||||||||
| Jonah |
- | - | - | - | - | 18 | - | - | 6 | 12 | ||||||||||||||||||||||||||||||
| East Texas |
- | - | - | - | - | - | - | - | - | - | ||||||||||||||||||||||||||||||
| Other and emerging |
3 | - | - | - | 3 | 15 | 5 | 4 | 4 | 2 | ||||||||||||||||||||||||||||||
| Total USA Operations |
265 | 51 | 56 | 68 | 90 | 204 | 88 | 50 | 29 | 37 | ||||||||||||||||||||||||||||||
| (1) | Other Upstream Operations includes net wells drilled in plays that are not part of the Company’s current strategic focus, including the TMS which is reported in Other and emerging in the USA Operations. |
| (2) | Wheatland was previously presented as Clearwater. |
ANNUAL REPORT 2015 | Encana Corporation 127
|
|
OUR EXECUTIVE LEADERSHIP
AND BOARD
Strong leadership
| EXECUTIVE LEADERSHIP TEAM
Doug Suttles President & Chief Executive Officer
Doug Suttles joined Encana as President & CEO in June 2013. With over 30 years of experience in the oil and gas industry in various leadership and engineering roles, he is responsible for the overall success of Encana and for creating, planning, implementing, and integrating the strategic direction of the organization.
Mike McAllister Executive Vice-President & Chief Operating Officer
Responsible for Encana’s upstream and production activities across the company’s assets, tasked with relentlessly pursuing greater efficiency and operational excellence.
Sherri Brillon Executive Vice-President & Chief Financial Officer
Responsible for the development and execution of a disciplined and dynamic capital allocation process strongly linked to the company’s strategic direction and the provision of financial expertise across the organization.
David Hill Executive Vice-President, Exploration & Business Development
Responsible for reviewing the company’s asset base and ensuring Encana has the right assets today and in the future, as well as, securing a top-tier resource portfolio for the company. |
Joanne Alexander Executive Vice-President, General Counsel & Corporate Secretary
Responsible for overseeing the legal, corporate secretarial and government relations groups.
Mike Williams Executive Vice-President, Corporate Services
Responsible for overseeing Encana’s Corporate Services including the information technology, communications, human resources, facilities and administration services groups.
Reneé Zemljak Executive Vice-President, Midstream, Marketing & Fundamentals
Responsible for driving strategic direction through industry-leading market fundamentals, maintaining Encana’s status as a supplier of choice and maximizing profitability through optimization of netback prices. |
BOARD OF DIRECTORS
Clayton Woitas Chairman Calgary, Alberta
Peter Dea Denver, Colorado
Fred Fowler Houston, Texas
Howard Mayson Breckenridge, Colorado
Lee McIntire Denver, Colorado
Margaret McKenzie Calgary, Alberta
Suzanne Nimocks Houston, Texas
Jane Peverett West Vancouver, British Columbia
Brian Shaw Toronto, Ontario
Doug Suttles Calgary, Alberta
Bruce Waterman Calgary, Alberta |
128 Encana Corporation | ANNUAL REPORT 2015
|
|
TO OUR SHAREHOLDERS
Corporate and
investor information
| TRANSFER AGENTS AND REGISTRAR
COMMON SHARES
CST Trust Company Calgary, Montreal and Toronto
Computershare Jersey City, New Jersey
Shareholders are encouraged to contact CST Trust Company for information regarding security holdings.
Answerline: 416.682.3863 Toll-free (North America): 1.866.580.7145 Facsimile: 1.888.249.6189
MAILING ADDRESS
CST Trust Company P.O. Box 700, Station B Montreal, Quebec, Canada H3B 3K3
INTERNET ADDRESS
www.canstockta.com
AUDITOR
PricewaterhouseCoopers LLP Chartered Professional Accountants Calgary, Alberta
INDEPENDENT QUALIFIED RESERVES EVALUATORS
GLJ Petroleum Consultants Ltd. Calgary, Alberta
McDaniel & Associates Consultants Ltd. Calgary, Alberta
Netherland, Sewell & Associates, Inc. Dallas, Texas |
STOCK EXCHANGES
COMMON SHARES (ECA)
Toronto Stock Exchange New York Stock Exchange
ANNUAL INFORMATION FORM (AIF) (FORM 40-F)
Encana’s AIF is filed with the securities regulators in Canada and the United States. Under the Multi Jurisdictional Disclosure System, Encana’s AIF is filed as part of its Form 40-F with the U.S. Securities and Exchange Commission.
SHAREHOLDER ACCOUNT MATTERS
To change your address, transfer shares, eliminate duplicate mailings, have dividends deposited directly into accounts at financial institutions in Canada that provide electronic fund-transfer services, etc., please contact CST Trust Company.
ANNUAL MEETING OF SHAREHOLDERS
Shareholders are invited to attend the Annual Meeting of Shareholders being held on Tuesday, May 3, 2016 at 10 a.m. Calgary time at:
Palomino Room BMO Centre (formerly the Roundup Centre) Stampede Park, 20 Roundup Way SE Calgary, Alberta, Canada
Those unable to attend are asked to vote by proxy on the internet, by telephone or by fax or to sign and return the form of proxy mailed to them. |
ENCANA WEBSITE
www.encana.com
Encana’s website contains a variety of corporate and investor information, including, among other information, the following:
¡ Current stock prices
¡ Annual and Interim Reports
¡ Information Circular
¡ News releases
¡ Investor presentations
¡ Dividend information
¡ Dividend reinvestment plan
¡ Shareholder support information
¡ Corporate Responsibility information
Additional information, including copies of the Encana Corporation 2015 Annual Report, may be obtained from Encana Corporation.
ENCANA CORPORATION
Investor Relations & Communications 500 Centre Street SE, P.O. Box 2850 Calgary, Alberta, Canada T2P 2S5
Phone: 403.645.3550 Email: [email protected] Web: www.encana.com
INVESTOR INQUIRIES SHOULD BE DIRECTED TO:
Brendan McCracken Vice-President, Investor Relations Phone: 403.645.2978 Email: [email protected]
Brian Dutton Phone: 403.645.2285 Email: [email protected]
Patti Posadowski Phone: 403.645.2252 Email: [email protected]
Katie Freeman Phone: 403.645.2453 Email: [email protected] |
ANNUAL REPORT 2015 | Encana Corporation 129
Abbreviations
| bbls | barrels | MMbbls | million barrels | |||||
| bbls/d | barrels per day | Mcf | thousand cubic feet | |||||
| BOE | barrels of oil equivalent | MM | million | |||||
| BOE/d | barrels of oil equivalent per day | MMBOE | million barrels of oil equivalent | |||||
| Bcf | billion cubic feet | MMBtu | million British thermal units | |||||
| Bcf/d | billion cubic feet per day | MMcf | million cubic feet | |||||
| Mbbls | thousand barrels | MMcf/d | million cubic feet per day | |||||
| Mbbls/d | thousand barrels per day | NGLs | natural gas liquids | |||||
| MBOE | thousand barrels of oil equivalent | Tcf | trillion cubic feet | |||||
| MBOE/d | thousand barrels of oil equivalent per day | /d | per day | |||||

|
|
Please recycle this publication | |
|
Printed in Canada at Blanchette Press | ||

|
Encana Corporation
500 Centre Street SE PO Box 2850 Calgary AB T2P 2S5 CANADA
encana.com/investors
TSX: ECA — NYSE: ECA
|

|
Serious News for Serious Traders! Try StreetInsider.com Premium Free!
You May Also Be Interested In
- LeapCharger Selected as Top Innovator for Prestigious Bedayat Program
- UK Interchangeable Panel Bags: 2024 Fashion Accessory Collection Released
- Life Science Cares Launches in Switzerland
Create E-mail Alert Related Categories
SEC FilingsSign up for StreetInsider Free!
Receive full access to all new and archived articles, unlimited portfolio tracking, e-mail alerts, custom newswires and RSS feeds - and more!
