

Form 6-K DIAGEO PLC For: Feb 05
 Tweet
Tweet Share
Share�
�
�
UNITED STATES
SECURITIES AND EXCHANGE COMMISSION
WASHINGTON, D.C. 20549
�
FORM�6-K
�
Report of Foreign Private Issuer
Pursuant to Rule�13a-16 or 15d-16 of the
Securities Exchange Act of 1934
�
5 February�2015
�
Commission File Number 1-10691
�
DIAGEO plc
(Translation of registrant�s name into English)
�
Lakeside Drive, Park Royal, London NW10 7HQ, England
(Address of principal executive offices)
�
Indicate by check mark whether the registrant files or will file annual reports under cover Form�20-F or Form�40-F.
�
|
� |
Form�20-F��x |
Form�40-F��o |
�
Indicate by check mark whether the registrant is submitting the Form�6-K in paper as permitted by Regulation S-T Rule�101(b)(1): o
�
Indicate by check mark whether the registrant is submitting the Form�6-K in paper as permitted by Regulation S-T Rule�101(b)(7): o
�
This report on Form�6-K shall be deemed to be filed and incorporated by reference in the registration statements on Form�F-3 (File No.�333-110804, 333-132732, 333-153488 and 333-179426) and registration statements on Form�S-8 (File Nos. 333-169934, 333-162490, 333-153481, 333-154338 and 333-182315) and to be a part thereof from the date on which this report is furnished, to the extent not superseded by documents or reports subsequently filed or furnished.
�
�
�
�
�
|
� |
� |
Page |
|
� |
3 | |
|
� |
3 | |
|
� |
3 | |
|
� |
4 | |
|
� |
� |
� |
|
� |
6 | |
|
� |
� |
� |
|
� |
9 | |
|
� |
� |
� |
|
� |
10 | |
|
� |
10 | |
|
� |
10 | |
|
� |
10 | |
|
� |
11 | |
|
� |
31 | |
|
� |
32 | |
|
Definitions and reconciliation of non-GAAP measures to GAAP measures |
� |
32 |
|
� |
� |
� |
|
� |
38 | |
|
� |
� |
� |
|
� |
F-1 | |
|
� |
F-2 | |
|
Unaudited condensed consolidated statement of comprehensive income |
� |
F-3 |
|
� |
F-4 | |
|
Unaudited condensed consolidated statement of changes in equity |
� |
F-5 |
|
� |
F-6 | |
|
Notes to the unaudited condensed consolidated financial information |
� |
F-7 |
|
� |
� |
� |
|
� |
A-1 | |
|
� |
� |
� |
|
� |
� |
�
�
�
Diageo plc is a public limited company incorporated under the laws of England and Wales. As used herein, except as the context otherwise requires, the term �company� refers to Diageo plc and the terms �group� and �Diageo� refer to the company and its consolidated subsidiaries. References used herein to �shares� and �ordinary shares� are, except where otherwise specified, to Diageo plc�s ordinary shares.
�
PRESENTATION OF FINANCIAL INFORMATION
�
Diageo plc�s fiscal year ends on 30 June. The company publishes its consolidated financial statements in pounds sterling. In this document, references to �pounds sterling�, �sterling�, ���, �pence� or �p� are to UK currency, references to �US dollars�, �US$�, �$� or ��� are to US currency and references to the �euro� or ��� are to the euro currency. For the convenience of the reader, this document contains translations of certain pounds sterling amounts into US dollars at specified rates, or, if not so specified, the noon buying rate in New York City for cable transfers in pounds sterling as certified for customs purposes by the Federal Reserve Bank of New York (the �noon buying rate�) on 31 December�2014 of �1 = $1.56. No representation is made that the pounds sterling amounts have been, could have been or could be converted into US dollars at the rates indicated or at any other rates.
�
Diageo�s condensed consolidated financial information has been prepared in accordance with IAS 34 �Interim Financial Reporting� as adopted for use in the European Union (EU) and International Financial Reporting standards (IFRS) as issued by the International Accounting Standards Board (IASB). References to IFRS hereafter should be construed as references to both IFRS as adopted by the EU and IFRS as issued by the IASB. Unless otherwise indicated, all financial information contained in this document has been prepared in accordance with IFRS. This interim condensed consolidated financial information is unaudited and has been prepared on the basis of accounting policies consistent with those applied in the consolidated financial statements for the year ended 30 June�2014.
�
The business review, selected consolidated financial data and financial information included in this document for the six months ended 31 December�2014 and 31 December�2013 have been derived from the published Diageo interim condensed consolidated financial information.
�
The principal executive office of the company is located at Lakeside Drive, Park Royal, London NW10 7HQ, England and its telephone number is +44 (0)20 8978 6000.
�
TRADEMARKS, TRADE NAMES AND MARKET DATA
�
This report on Form�6-K includes names of Diageo�s products which constitute trademarks or trade names which Diageo owns or which others own and license to Diageo for use. All rights reserved. � Diageo plc 2015.
�
The market data and competitive set classifications are taken from independent industry sources in the markets in which Diageo operates.
�
�
CAUTIONARY STATEMENT CONCERNING FORWARD-LOOKING STATEMENTS
�
This document contains �forward-looking� statements. These statements can be identified by the fact that they do not relate only to historical or current facts. In particular, forward-looking statements include all statements that express forecasts, expectations, plans, outlook and projections with respect to future matters, including trends in results of operations, margins, growth rates, overall market trends, the impact of changes in interest or exchange rates, the availability or cost of financing to Diageo, anticipated cost savings or synergies, expected investments, the completion of Diageo�s strategic transactions and restructuring programmes, anticipated tax rates, expected cash payments, outcomes of litigation, anticipated deficit reductions in relation to pension schemes and general economic conditions. By their nature, forward-looking statements involve risk and uncertainty because they relate to events and depend on circumstances that will occur in the future. There are a number of factors that could cause actual results and developments to differ materially from those expressed or implied by these forward-looking statements, including factors that are outside Diageo�s control.
�
These factors include, but are not limited to:
�
������������������ changes in political or economic conditions in countries and markets in which Diageo operates, including changes in levels of consumer spending, failure of customer, supplier and financial counterparties or imposition of import, investment or currency restrictions;
������������������ changes in consumer preferences and tastes, demographic trends or perceptions about health related issues, or contamination, counterfeiting or other circumstances which could harm the integrity or sales of Diageo�s brands;
������������������ developments in any litigation or other similar proceedings (including with tax, customs and other regulatory authorities) directed at the drinks and spirits industry generally or at Diageo in particular, or the impact of a product recall or product liability claim on Diageo�s profitability or reputation;
������������������ the effects of climate change and regulations and other measures to address climate change including any resulting impact on the cost and supply of water;
������������������ changes in the cost or supply of raw materials, labour and/or energy;
������������������ legal and regulatory developments, including changes in regulations regarding production, product liability, distribution, importation, labelling, packaging, consumption or advertising; changes in tax law, rates or requirements (including with respect to the impact of excise tax increases) or accounting standards; and changes in environmental laws, health regulations and the laws governing labour and pensions;
������������������ the costs associated with monitoring and maintaining compliance with anti-corruption and other laws and regulations, and the costs associated with investigating alleged breaches of internal policies, laws or regulations, whether initiated internally or by external regulators, and any penalties or fines imposed as a result of any breaches;
������������������ ability to maintain Diageo�s brand image and corporate reputation, and exposure to adverse publicity, whether or not justified, and any resulting impacts on Diageo�s reputation and the likelihood that consumers choose products offered by Diageo�s competitors;
������������������ increased competitive product and pricing pressures and unanticipated actions by competitors that could impact Diageo�s market share, increase expenses and hinder growth potential;
������������������ the effects of Diageo�s strategic focus on premium drinks, the effects of business combinations, partnerships, acquisitions or disposals, existing or future, and the ability to realise expected synergies and/or costs savings;
������������������ Diageo�s ability to complete existing or future business combinations, restructuring programmes, acquisitions and disposals;
������������������ contamination, counterfeiting or other events that could adversely affect the perception of Diageo�s brands;
������������������ increased costs or shortages of talent;
������������������ disruption to production facilities or business service centres, and systems change programmes, existing or future, and the ability to derive expected benefits from such programmes;
������������������ changes in financial and equity markets, including significant interest rate and foreign currency exchange rate fluctuations and changes in the cost of capital, which may reduce or eliminate Diageo�s access to or increase the cost of financing or which may affect Diageo�s financial results and movements to the value of Diageo�s pension funds;
������������������ renewal of supply, distribution, manufacturing or licence agreements (or related rights) and licences on favourable terms when they expire;
������������������ technological developments that may affect the distribution of products or impede Diageo�s ability to protect its intellectual property rights.
�
All oral and written forward-looking statements made on or after the date of this document and attributable to Diageo are expressly qualified in their entirety by the above factors and the �Risk factors� contained in the annual report on Form 20-F for the year ended 30 June 2014 filed with the US Securities and Exchange Commission (SEC). Any forward-looking statements made by or on behalf of Diageo speak only as of the date they are made. Diageo does not undertake to update forward-looking statements to reflect any changes in Diageo�s expectations with regard thereto or any changes in events, conditions or circumstances on which any such statement is based. The reader should, however, consult any additional disclosures that Diageo may make in any documents which it publishes and/or files with the US Securities and Exchange Commission (SEC). All readers, wherever located, should take note of these disclosures.
�
This document includes names of Diageo�s products, which constitute trademarks or trade names which Diageo owns, or which others own and license to Diageo for use. All rights reserved. � Diageo plc 2015.
�
�
The information in this document does not constitute an offer to sell or an invitation to buy shares in Diageo plc or an invitation or inducement to engage in any other investment activities.
�
This document includes information about Diageo�s target debt rating. A security rating is not a recommendation to buy, sell or hold securities and may be subject to revision or withdrawal at any time by the assigning rating organisation. Each rating should be evaluated independently of any other rating.
�
Past performance cannot be relied upon as a guide to future performance.
�
The contents of the company�s website (www.diageo.com) should not be considered to form part of or be incorporated into this document.
�
�
SELECTED CONSOLIDATED FINANCIAL DATA
�
The selected consolidated financial data set out below has been prepared in accordance with International Financial Reporting Standards (IFRS) as adopted for use in the European Union (EU) and IFRS as issued by the International Accounting Standards Board (IASB) and should be read in conjunction with, and are qualified in their entirety by reference to, the unaudited financial information and notes presented elsewhere in this document and to Diageo�s annual report on Form�20-F for the year ended 30 June�2014.
�
The following table presents selected consolidated financial data for Diageo: for the six months ended 31 December�2014 and 31 December�2013 and as at the respective period ends, derived from the unaudited interim condensed consolidated financial information presented elsewhere in this document; and for the five years ended 30 June�2014 and as at the respective year ends, derived from Diageo�s consolidated financial statements audited by Diageo�s independent auditor. The unaudited interim condensed consolidated financial information, in the opinion of Diageo management, includes all adjustments, consisting solely of normal, recurring adjustments, necessary to present fairly the information contained therein. The results of operations for the six months ended 31 December�2014 are not necessarily indicative of the results for the year ending 30 June�2015.
�
|
� |
� |
Six�months�ended�31�December |
� |
Year�ended�30�June |
� | ||||||||||||
|
Income�statement |
� |
2014 |
� |
2014 |
� |
2013 |
� |
2014 |
� |
2013 |
� |
2012 |
� |
2011 |
� |
2010 |
� |
|
data(1)(6) |
� |
$�million |
� |
� million |
� |
� million |
� |
� million |
� |
� million |
� |
� million |
� |
� million |
� |
� million |
� |
|
Sales |
� |
13,609 |
� |
8,724 |
� |
8,014 |
� |
13,980 |
� |
15,276 |
� |
14,392 |
� |
13,043 |
� |
12,793 |
� |
|
Operating profit |
� |
2,602 |
� |
1,668 |
� |
2,040 |
� |
2,707 |
� |
3,380 |
� |
3,108 |
� |
2,552 |
� |
2,538 |
� |
|
Profit for the period |
� |
� |
� |
� |
� |
� |
� |
� |
� |
� |
� |
� |
� |
� |
� |
� |
� |
|
Continuing operations(2) |
� |
2,128 |
� |
1,364 |
� |
1,746 |
� |
2,264 |
� |
2,550 |
� |
2,032 |
� |
1,960 |
� |
1,727 |
� |
|
Discontinued operations(3) |
� |
� |
� |
� |
� |
(92 |
) |
(83 |
) |
� |
� |
(11 |
) |
� |
� |
(19 |
) |
|
Total profit for the period(2) |
� |
2,128 |
� |
1,364 |
� |
1,654 |
� |
2,181 |
� |
2,550 |
� |
2,021 |
� |
1,960 |
� |
1,708 |
� |
�
|
Per�share�data |
� |
$ |
� |
pence |
� |
pence |
� |
pence |
� |
pence |
� |
pence |
� |
pence |
� |
pence |
� |
|
Dividend per share(4) |
� |
0.34 |
� |
21.5 |
� |
19.7 |
� |
51.7 |
� |
47.4 |
� |
43.5 |
� |
40.4 |
� |
38.1 |
� |
|
Earnings per share |
� |
� |
� |
� |
� |
� |
� |
� |
� |
� |
� |
� |
� |
� |
� |
� |
� |
|
Basic |
� |
� |
� |
� |
� |
� |
� |
� |
� |
� |
� |
� |
� |
� |
� |
� |
� |
|
Continuing operations(2) |
� |
0.82 |
� |
52.3 |
� |
67.5 |
� |
93.0 |
� |
98.0 |
� |
76.6 |
� |
74.3 |
� |
65.2 |
� |
|
Discontinued operations(3) |
� |
� |
� |
� |
� |
(3.7 |
) |
(3.3 |
) |
� |
� |
(0.4 |
) |
� |
� |
(0.8 |
) |
|
Basic earnings per share |
� |
0.82 |
� |
52.3 |
� |
63.8 |
� |
89.7 |
� |
98.0 |
� |
76.2 |
� |
74.3 |
� |
64.4 |
� |
|
Diluted |
� |
� |
� |
� |
� |
� |
� |
� |
� |
� |
� |
� |
� |
� |
� |
� |
� |
|
Continuing operations(2) |
� |
0.81 |
� |
52.2 |
� |
67.2 |
� |
92.6 |
� |
97.4 |
� |
76.2 |
� |
74.1 |
� |
65.1 |
� |
|
Discontinued operations(3) |
� |
� |
� |
� |
� |
(3.7 |
) |
(3.3 |
) |
� |
� |
(0.4 |
) |
� |
� |
(0.8 |
) |
|
Diluted earnings per share |
� |
0.81 |
� |
52.2 |
� |
63.5 |
� |
89.3 |
� |
97.4 |
� |
75.8 |
� |
74.1 |
� |
64.3 |
� |
�
|
� |
� |
million |
� |
million |
� |
million |
� |
million |
� |
million |
� |
million |
� |
million |
� |
million |
� |
|
Average shares |
� |
2,506 |
� |
2,506 |
� |
2,507 |
� |
2,506 |
� |
2,502 |
� |
2,495 |
� |
2,493 |
� |
2,486 |
� |
�
|
� |
� |
As�at�31�December |
� |
As�at�30�June |
� | ||||||||||||
|
� |
� |
2014 |
� |
2014 |
� |
2013 |
� |
2014 |
� |
2013 |
� |
2012 |
� |
2011 |
� |
2010 |
� |
|
Balance�sheet�data(1)(6) |
� |
$�million |
� |
� million |
� |
� million |
� |
� million |
� |
� million |
� |
� million |
� |
� million |
� |
� million |
� |
|
Total assets |
� |
43,540 |
� |
27,910 |
� |
24,245 |
� |
22,964 |
� |
24,991 |
� |
22,269 |
� |
19,720 |
� |
19,394 |
� |
|
Net assets |
� |
13,566 |
� |
8,696 |
� |
8,038 |
� |
7,590 |
� |
8,088 |
� |
6,792 |
� |
5,959 |
� |
4,762 |
� |
|
Net borrowings(5) |
� |
16,642 |
� |
10,668 |
� |
9,096 |
� |
8,850 |
� |
8,403 |
� |
7,573 |
� |
6,480 |
� |
6,980 |
� |
|
Equity attributable to the parent company�s equity shareholders |
� |
11,276 |
� |
7,228 |
� |
7,086 |
� |
6,823 |
� |
7,036 |
� |
5,588 |
� |
5,245 |
� |
4,007 |
� |
|
Share capital |
� |
1,243 |
� |
797 |
� |
797 |
� |
797 |
� |
797 |
� |
797 |
� |
797 |
� |
797 |
� |
�
This information should be read in conjunction with the notes on pages�7 to 8.
�
�
Notes to the selected consolidated financial data
�
(1)�IFRS accounting policies The unaudited condensed consolidated financial information for the six months ended 31 December�2014 has been prepared in accordance with IAS 34 �Interim Financial Reporting� as issued by the International Accounting Standards Board (IASB) and adopted for use in the European Union.
�
(2)�Exceptional items Exceptional items are charges or credits which, in management�s judgement, need to be disclosed by virtue of their size or incidence in order for the user to obtain a proper understanding of the financial information. Such items are included within the income statement caption to which they relate. An analysis of exceptional items is as follows:
�
|
� |
� |
Six�months�ended |
� |
Year�ended�30�June |
� | ||||||||||
|
� |
� |
2014 |
� |
2013 |
� |
2014 |
� |
2013 |
� |
2012 |
� |
2011 |
� |
2010 |
� |
|
� |
� |
� million |
� |
� million |
� |
� million |
� |
� million |
� |
� million |
� |
� million |
� |
� million |
� |
|
Items included in operating profit |
� |
� |
� |
� |
� |
� |
� |
� |
� |
� |
� |
� |
� |
� |
� |
|
Restructuring programmes |
� |
(26 |
) |
(20 |
) |
(163 |
) |
(69 |
) |
(96 |
) |
(111 |
) |
(142 |
) |
|
Duty settlements |
� |
(145 |
) |
� |
� |
� |
� |
� |
� |
� |
� |
(127 |
) |
� |
� |
|
Brand impairment |
� |
� |
� |
� |
� |
(264 |
) |
(50 |
) |
(59 |
) |
(39 |
) |
(35 |
) |
|
Pension changes � past service credits |
� |
� |
� |
� |
� |
� |
� |
20 |
� |
115 |
� |
� |
� |
� |
� |
|
SEC settlement |
� |
� |
� |
� |
� |
� |
� |
� |
� |
� |
� |
(12 |
) |
� |
� |
|
� |
� |
(171 |
) |
(20 |
) |
(427 |
) |
(99 |
) |
(40 |
) |
(289 |
) |
(177 |
) |
|
Non-operating items |
� |
98 |
� |
138 |
� |
140 |
� |
(83 |
) |
147 |
� |
(14 |
) |
(15 |
) |
|
� |
� |
� |
� |
� |
� |
� |
� |
� |
� |
� |
� |
� |
� |
� |
� |
|
Items included in taxation |
� |
� |
� |
� |
� |
� |
� |
� |
� |
� |
� |
� |
� |
� |
� |
|
Tax credit on exceptional operating items |
� |
38 |
� |
3 |
� |
99 |
� |
27 |
� |
19 |
� |
51 |
� |
39 |
� |
|
Tax on non-operating items |
� |
� |
� |
� |
� |
� |
� |
28 |
� |
� |
� |
3 |
� |
10 |
� |
|
Loss of future tax amortisation |
� |
� |
� |
� |
� |
� |
� |
� |
� |
(524 |
) |
� |
� |
� |
� |
|
Settlements with tax authorities |
� |
� |
� |
� |
� |
� |
� |
� |
� |
� |
� |
66 |
� |
� |
� |
|
� |
� |
38 |
� |
3 |
� |
99 |
� |
55 |
� |
(505 |
) |
120 |
� |
49 |
� |
|
Exceptional items included in continuing operations |
� |
(35 |
) |
121 |
� |
(188 |
) |
(127 |
) |
(398 |
) |
(183 |
) |
(143 |
) |
|
Discontinued operations net of taxation (note 3) |
� |
� |
� |
(92 |
) |
(83 |
) |
� |
� |
(11 |
) |
� |
� |
(19 |
) |
|
Exceptional items |
� |
(35 |
) |
29 |
� |
(271 |
) |
(127 |
) |
(409 |
) |
(183 |
) |
(162 |
) |
�
(3)�Discontinued operations In the six months ended 31 December�2013 discontinued operations represented a charge after taxation of �92 million (year ended 30 June�2014 � �83 million; 2013�� �nil; 2012� �11 million; 2011�� �nil; 2010� �19 million) in respect of the settlement of the litigation in Australia and New Zealand and anticipated future payments to thalidomide injured individuals and thalidomide organisations.
�
(4)�Dividends The board expects that Diageo will pay an interim dividend in April�and a final dividend in October�of each year. Approximately 40% of the total dividend in respect of any financial year is expected to be paid as an interim dividend and approximately 60% as a final dividend. The payment of any future dividends, subject to shareholder approval, will depend upon Diageo�s earnings, financial condition and such other factors as the board deems relevant. Proposed dividends are not considered to be a liability until they are approved by the board for the interim dividend and by the shareholders at the annual general meeting for the final dividend.
�
The table below sets out the amounts of interim, final and total cash dividends paid by the company on each ordinary share. The dividends are translated into US dollars per ADS (each ADS representing four ordinary shares) at the actual rate on each of the respective dividend payment dates.
�
|
� |
� |
� |
� |
Six�months�ended |
� |
Year�ended�30�June |
� | ||||||||||
|
� |
� |
� |
� |
2014 |
� |
2013 |
� |
2014 |
� |
2013 |
� |
2012 |
� |
2011 |
� |
2010 |
� |
|
� |
� |
� |
� |
pence |
� |
pence |
� |
pence |
� |
pence |
� |
pence |
� |
pence |
� |
pence |
� |
|
Per ordinary share |
� |
Interim |
� |
21.5 |
� |
19.7 |
� |
19.7 |
� |
18.1 |
� |
16.6 |
� |
15.5 |
� |
14.6 |
� |
|
� |
� |
Final |
� |
� |
� |
� |
� |
32.0 |
� |
29.3 |
� |
26.9 |
� |
24.9 |
� |
23.5 |
� |
|
� |
� |
Total |
� |
21.5 |
� |
19.7 |
� |
51.7 |
� |
47.4 |
� |
43.5 |
� |
40.4 |
� |
38.1 |
� |
�
|
� |
� |
� |
� |
$ |
� |
$ |
� |
$ |
� |
$ |
� |
$ |
� |
$ |
� |
$ |
� |
|
Per ADS |
� |
Interim |
� |
1.29 |
� |
1.31 |
� |
1.31 |
� |
1.10 |
� |
1.05 |
� |
1.01 |
� |
0.89 |
� |
|
� |
� |
Final |
� |
� |
� |
� |
� |
2.06 |
� |
1.89 |
� |
1.72 |
� |
1.59 |
� |
1.48 |
� |
|
� |
� |
Total |
� |
1.29 |
� |
1.31 |
� |
3.37 |
� |
2.99 |
� |
2.77 |
� |
2.60 |
� |
2.37 |
� |
�
�
Note: The interim dividend for the six months ended 31 December�2014 will be paid on 7 April�2015, and payment to US ADR holders will be made on 10 April�2015. In the table above, an exchange rate of �1 = $1.50 has been assumed for this dividend, but the exact amount of the payment to US ADR holders will be determined by the rate of exchange on 7 April�2015.
�
Diageo�s dividend philosophy has been�a consistent increase in the annual dividend payable while maintaining dividend cover between 1.8 and 2.2 times earnings per share. In recent years this has allowed the group to increase its dividend by 9% a year. Given the economic slowdown in emerging markets and the associated currency weakness expected in the future both of which had such a significant impact on Diageo�s reported results in the year ended 30 June�2014, the group�s dividend coverage ratio is now below the lower end of the range set.�However cash flow is improving as these results show and the strength of the dollar is providing some offset to emerging market currency weakness. Therefore the interim dividend growth was maintained at 9%,�but this will be reviewed for the full year and if necessary the rate of increase may be changed for the final dividend in order to maintain the coverage ratio, albeit at the lower end of the range.
�
(5)�Net borrowings definition Net borrowings are defined as gross borrowings (short term borrowings and long term borrowings plus finance lease liabilities plus interest rate hedging instruments, cross currency interest rate swaps and funding foreign currency forwards and swaps used to manage borrowings) less cash and cash equivalents.
�
(6)�Exchange rates A substantial portion of the group�s assets, liabilities, revenues and expenses is denominated in currencies other than pounds sterling. For the convenience of the reader, selected consolidated financial information for the six months ended 31�December�2014 has been translated into US dollars at the noon buying rate on 31 December�2014 of �1 = $1.56.
�
The following table shows period end and average US dollar/pound sterling noon buying exchange rates, for the periods indicated, expressed in US dollars per �1.
�
|
� |
� |
Six�months�ended |
� |
Year�ended�30�June |
� | ||||||||||
|
� |
� |
2014 |
� |
2013 |
� |
2014 |
� |
2013 |
� |
2012 |
� |
2011 |
� |
2010 |
� |
|
� |
� |
$ |
� |
$ |
� |
$ |
� |
$ |
� |
$ |
� |
$ |
� |
$ |
� |
|
Period/year end |
� |
1.56 |
� |
1.66 |
� |
1.71 |
� |
1.52 |
� |
1.57 |
� |
1.61 |
� |
1.50 |
� |
|
Average rate* |
� |
1.62 |
� |
1.60 |
� |
1.64 |
� |
1.57 |
� |
1.59 |
� |
1.59 |
� |
1.57 |
� |
�
* The average of the noon buying rates on the last business day of each month during the six months ended 31 December�and during the years ended 30 June.
�
The average exchange rate for the period 1 January�to 30 January�2015 was �1=$1.51 and the noon buying rate on 30 January�2015 was �1=$1.50.
�
These rates have been provided for information only. They are not necessarily the rates that have been used in this document for currency translations or in the preparation of the consolidated financial information. See note 2 to the unaudited condensed consolidated financial information for the actual rates used in the preparation of the consolidated financial information.
�
�
CAPITALISATION AND INDEBTEDNESS
�
The following table sets out on an IFRS basis the unaudited capitalisation of Diageo as at 31 December�2014:
�
|
� |
� |
31�December�2014 |
� |
|
� |
� |
� million |
� |
|
Short term borrowings and bank overdrafts (including current portion of long term borrowings) |
� |
2,845 |
� |
|
� |
� |
� |
� |
|
Long term borrowings |
� |
� |
� |
|
Due from one to five years |
� |
4,077 |
� |
|
Due after five years |
� |
4,441 |
� |
|
� |
� |
8,518 |
� |
|
Finance lease obligations |
� |
276 |
� |
|
Non-controlling interests |
� |
1,468 |
� |
|
� |
� |
� |
� |
|
Equity attributable to the equity shareholders of the parent company |
� |
� |
� |
|
Share capital |
� |
797 |
� |
|
Share premium |
� |
1,345 |
� |
|
Capital redemption reserve |
� |
3,146 |
� |
|
Fair value, hedging and exchange reserve |
� |
(753 |
) |
|
Own shares |
� |
(2,241 |
) |
|
Other retained earnings |
� |
4,934 |
� |
|
� |
� |
7,228 |
� |
|
Total capitalisation |
� |
20,335 |
� |
�
Notes
�
(1)�������������������������������� At 31 December�2014, the group had cash and cash equivalents of �802 million.
�
(2)�������������������������������� At 31 December�2014, 2,754,258,478 ordinary shares of 28 101/108�pence each were issued, all of which were fully paid, including shares issued, shares issued and held in employee share trusts and those held as treasury shares.
�
(3)�������������������������������� There have been no material changes to the performance guarantees or indemnities in respect of liabilities of third parties from those reported in Diageo�s Annual Report on Form�20-F for the year ended 30 June�2014.
�
(4)�������������������������������� At 31 December 2014, �256 million of the group�s net borrowings were secured on assets of the group.
�
(5)�������������������������������� Since 31 December�2014 no shares have been acquired by Diageo as part of the share buyback programs or to be held as treasury shares for hedging share scheme grants provided to employees.
�
(6)�������������������������������� Save as disclosed above there has been no material change since 31 December�2014 in the group�s net borrowings, performance guarantees, indemnities and capitalisation.
�
�
�
�
Diageo is the world�s leading premium drinks business and operates on an international scale selling all types of beverage alcohol. It is one of a small number of premium drinks companies that operate globally across spirits, beer and wine.
�
The following discussion is based on Diageo�s results for the six months ended 31 December�2014 compared with the six months ended 31 December�2013.
�
Unless otherwise stated in this section, percentage movements are organic movements. These movements and organic operating margin are before exceptional items. Commentary, unless otherwise stated, refers to organic movements. Share, unless otherwise stated, refers to value share. See �Definitions and reconciliations of non-GAAP measures to GAAP measures� for an explanation of organic movements on page 32.
�
REVISED SEGMENTAL INFORMATION FOR PRIOR REPORTING PERIODS
�
In the six months ended 31 December�2014 Diageo changed its internal reporting structure to reflect changes made to management responsibilities as announced on 30 July�2014. As a result of this change, Diageo reports the following geographical segments both for management reporting purposes and in the external financial statements: North America; Europe; Africa; Latin America and Caribbean; Asia Pacific and Corporate. As a consequence of these changes, comparative prior period figures have been restated. Restated segmental information for volume, sales, net sales, marketing spend and operating profit before exceptional items for prior periods with a reconciliation to previously reported figures is provided in �Definitions and reconciliations of non-GAAP measures to GAAP measures� on page�32.
�
�
Ivan Menezes, Chief Executive of Diageo, commenting on the six months ended 31 December�2014 said:
�
�We have improved our performance during the half and we have again shown: the strength of our brands, which is driving our share gains; our strong innovation capability, which has enabled us to access new growth opportunities, and our focus on cost.� We delivered the planned savings from our global efficiency programme together with procurement benefits in marketing spend which we have reinvested in our brands and we increased our investment in our routes to consumer� while again expanding our margins.
�
We have already taken action to improve the performance of those brands and markets that have not performed as well as we would expect. This contributed to our stronger second quarter performance and I expect to maintain this momentum through the year.
�
The half saw Diageo acquire control of USL, putting us in the position to create an iconic leader in spirits in an attractive market.� We have also reached agreement to acquire all of Don Julio, which will significantly strengthen our position in one of our fastest growing categories.
�
The quality of these results in a tough environment, with depletions ahead of shipments and improving cash flow, reinforce my confidence that Diageo can realise its full potential and deliver our performance ambition.�
�
The above comments were made by Ivan Menezes, Chief Executive of Diageo, in connection with the release of the Interim Announcement published on 29 January�2015.
�
�
OPERATING RESULTS FOR THE SIX MONTHS ENDED 31 DECEMBER 2014 COMPARED WITH THE SIX MONTHS ENDED 31 DECEMBER 2013
�
Key highlights
�
������������������ Organic net sales in the half were broadly flat (-0.1%) with volume down 1.9%.� Performance improved in Q2
������������������ Continued strong performance of reserve brands, up 10%, was a key driver of positive overall price/mix
������������������ Marketing spend was in line with net sales, as effective spend benefitted from procurement efficiencies worth 3% of total marketing investment
������������������ Restructuring benefits drove operating margin improvement of 28bps with organic operating profit up 0.7%
������������������ Free cash flow was �699 million, up �373 million on the first half last year
������������������ Eps before exceptional items was 53.7 pence per share, down 8.9 pence per share driven mainly by negative exchange impacts and lower income from associates and joint ventures
������������������ Interim dividend up 9% to 21.5 pence per share
�
|
Key�performance�indicators |
� |
� |
� |
First� |
� |
First� |
� | |
|
Organic net sales growth |
� |
% |
� |
� |
� |
2 |
� | |
|
Organic operating margin improvement |
� |
basis points |
� |
28 |
� |
37 |
� | |
|
Earnings per share before exceptional items |
� |
pence |
� |
53.7 |
� |
62.6 |
� | |
|
Free cash flow |
� |
� |
� million |
� |
699 |
� |
326 |
� |
|
Return on average invested capital |
� |
% |
� |
13.9 |
� |
17.8 |
� | |
�
|
Other�financial�information |
� |
� |
� |
First�Half |
� |
First�Half |
� |
Organic� |
� |
Reported |
� | |
|
Volume |
� |
EUm |
� |
134.1 |
� |
84.3 |
� |
(2 |
) |
59 |
� | |
|
Net sales |
� |
� |
� million |
� |
5,900 |
� |
5,932 |
� |
� |
� |
(1 |
) |
|
Marketing spend |
� |
� |
� million |
� |
896 |
� |
903 |
� |
� |
� |
(1 |
) |
|
Operating profit before exceptional items (a) |
� |
� |
� million |
� |
1,839 |
� |
2,060 |
� |
1 |
� |
(11 |
) |
|
Operating profit (b) |
� |
� |
� million |
� |
1,668 |
� |
2,040 |
� |
� |
� |
(18 |
) |
|
Share of associates and joint ventures profit after tax |
� |
� |
� million |
� |
113 |
� |
181 |
� |
� |
� |
(38 |
) |
|
Net finance charges |
� |
� |
� million |
� |
239 |
� |
225 |
� |
� |
� |
6 |
� |
|
Reported tax rate |
� |
% |
� |
16.8 |
� |
18.2 |
� |
� |
� |
(8 |
) | |
|
Reported tax rate before exceptional items� |
� |
% |
� |
18.3 |
� |
19.4 |
� |
� |
� |
(6 |
) | |
|
Profit attributable to parent company�s shareholders |
� |
� |
� million |
� |
1,311 |
� |
1,599 |
� |
� |
� |
(18 |
) |
|
Basic earnings per share |
� |
pence |
� |
52.3 |
� |
63.8 |
� |
� |
� |
(18 |
) | |
|
Interim dividend per share |
� |
pence |
� |
21.5 |
� |
19.7 |
� |
� |
� |
9 |
� | |
�
(a)�������� Operating profit before exceptional items included attributable transaction and integration costs of �10 million in the six months ended 31 December�2013 in respect of business acquisitions.
(b)�������� Operating profit includes an exceptional charge of �171 million, an analysis for which is provided on page�16.
�
�
Key performance indicators
�
Net sales growth (� million)
�
Reported net sales were flat. Adverse foreign exchange was offset by the full consolidation of USL. Growth in reserve brands and pricing in Venezuela offset volume decline
�

�
(a)�������� Impact of acquisitions and disposals on the first half F14 and the first half F15. See page�34 for further details.
�
Reported net sales were flat. Adverse foreign exchange was offset by the full consolidation of USL. Organic volume decline was largely driven by currency related market contraction in West LAC and South East Asia, a challenging environment in Venezuela and weakness in the standard price segment in North America. Positive price/mix was largely driven by the strong performance of reserve brands and price increases in Venezuela.
�
Operating margin improvement (%)
�
Cost savings delivered 28bps of organic margin improvement
�

�
The full consolidation of USL has rebased Diageo�s operating margin by 2pps. Adverse foreign exchange, primarily in respect of the Venezuelan bolivar, reduced reported margins while the organic increase in operating margin was 28bps driven by cost savings from the global efficiency programme.
�
�
Earnings per share before exceptional items (pence)
�
Eps before exceptionals impacted by adverse foreign exchange, decrease in associate profit and increase in finance charges
�

�
Eps fell 8.9 pence largely as a result of adverse foreign exchange movements, which reduced eps 8.4 pence.� Operating profit after tax and excluding foreign exchange movements had a positive impact on eps as a result of organic growth and the lower tax rate.� Lower income from associates and joint ventures and the increase in other finance charges, which largely reflects updated projections for dividends payable in respect of the Zacapa agreement, also had a negative impact on eps.
�
Basic eps was 52.3 pence (2013 � 63.8 pence), with exceptionals reducing eps by 1.4 pence (2013 � 1.2 pence favourable).
�
For movements in net finance charges see below:
�
|
Movement�in�net�finance�charges |
� |
� million |
� |
|
First Half F14 Reported |
� |
225 |
� |
|
Net interest charge |
� |
6 |
� |
|
Post employment charges |
� |
1 |
� |
|
Venezuela hyperinflation adjustment |
� |
(3 |
) |
|
Other finance charges |
� |
10 |
� |
|
First Half F15 Reported |
� |
239 |
� |
�
|
� |
� |
First�Half |
� |
First�Half� |
� |
|
Average monthly net borrowings (� million) |
� |
10,698 |
� |
9,160 |
� |
|
Effective interest rate |
� |
3.7% |
� |
4.1% |
� |
�
For the calculation of the effective interest rate, the net interest charge excludes fair value adjustments to derivative financial instruments and borrowings. Average monthly net borrowings include the impact of interest rate swaps that are no longer in a hedge relationship but excludes the market value adjustment for cross currency interest rate swaps.
�
The increase in average net borrowings was principally the result of the acquisition of the controlling interest in USL, completed on 2 July�2014, and the inclusion of USL�s net borrowings. The effective interest rate decreased in the six months ended 31 December 2014 principally as a results of lower interest rates on new debt issues.
�
�
Free cash flow (� million)
�
Positive working capital movement, lower interest and tax payments offset the impact of reduced operating profit and the full consolidation of USL on cash flow
�

�
(a)�������� Operating profit adjusted for non cash items including depreciation and amortisation.
(b)�������� Other movements includes dividends received from associates and joint ventures, movements in loans receivable and other investments, and payments in respect of the settlement of Thalidomide litigations.
�
The increase in free cash flow was primarily driven by the positive working capital movement, largely due to increases in creditor balances. Lower interest and tax payments are due to phasing. Contributions to pension plans were lower than the same period last year, largely driven by the one off payment made into the Irish pension scheme last year.
�
Return on average invested capital (ROIC) (a)
�
The investment in USL has rebased ROIC and adverse FX reduced ROIC in the period
�

�
(a)��� ROIC calculation excludes exceptional items
�
The full consolidation of USL reduced ROIC by 2.1pps. Foreign exchange movements which reduced operating profit, were partially offset by the impact of foreign exchange on invested capital.
�
�
Additional financial information
�
Income statement
�
|
� |
� |
31�December |
� |
Exchange |
� |
Acquisitions |
� |
Organic |
� |
31�December |
� |
|
� |
� |
� million |
� |
� million |
� |
� million |
� |
� million |
� |
� million |
� |
|
Sales |
� |
8,014 |
� |
(637 |
) |
1,225 |
� |
122 |
� |
8,724 |
� |
|
Excise duties |
� |
(2,082 |
) |
149 |
� |
(762 |
) |
(129 |
) |
(2,824 |
) |
|
Net sales |
� |
5,932 |
� |
(488 |
) |
463 |
� |
(7 |
) |
5,900 |
� |
|
Cost of sales* |
� |
(2,184 |
) |
129 |
� |
(359 |
) |
(4 |
) |
(2,418 |
) |
|
Gross profit |
� |
3,748 |
� |
(359 |
) |
104 |
� |
(11 |
) |
3,482 |
� |
|
Marketing |
� |
(903 |
) |
43 |
� |
(35 |
) |
(1 |
) |
(896 |
) |
|
Other operating expenses* |
� |
(785 |
) |
48 |
� |
(35 |
) |
25 |
� |
(747 |
) |
|
Operating profit before exceptional items |
� |
2,060 |
� |
(268 |
) |
34 |
� |
13 |
� |
1,839 |
� |
|
Exceptional operating items (c) |
� |
(20 |
) |
� |
� |
� |
� |
� |
� |
(171 |
) |
|
Operating profit |
� |
2,040 |
� |
� |
� |
� |
� |
� |
� |
1,668 |
� |
|
Non-operating items (c) |
� |
138 |
� |
� |
� |
� |
� |
� |
� |
98 |
� |
|
Net finance charges |
� |
(225 |
) |
� |
� |
� |
� |
� |
� |
(239 |
) |
|
Share of after tax results of associates and joint ventures |
� |
181 |
� |
� |
� |
� |
� |
� |
� |
113 |
� |
|
Profit before taxation |
� |
2,134 |
� |
� |
� |
� |
� |
� |
� |
1,640 |
� |
|
Taxation |
� |
(388 |
) |
� |
� |
� |
� |
� |
� |
(276 |
) |
|
Profit from continuing operations |
� |
1,746 |
� |
� |
� |
� |
� |
� |
� |
1,364 |
� |
|
Discontinued operations (c) |
� |
(92 |
) |
� |
� |
� |
� |
� |
� |
� |
� |
|
Profit for the period |
� |
1,654 |
� |
� |
� |
� |
� |
� |
� |
1,364 |
� |
�
* before exceptional operating items
�
(a)�Exchange
�
The impact of movements in exchange rates on reported figures is principally in respect of the Venezuelan bolivar, the Russian rouble and the euro.
�
In March�2014, the Central Bank of Venezuela opened the Second Ancillary Foreign Currency Administration System (Sicad II) that allows private and public companies to trade foreign currency at a higher exchange rate than the official exchange rate. As a result, the group has applied Sicad II exchange rate to consolidate its Venezuelan operations for the year ended 30 June�2014 ($1 = VEF49.98; �1 = VEF85.47). Applying the consolidation rate of $1 = VEF49.99 (�1 = VEF77.98) at 31 December 2014 compared to the rate of $1�= VEF9 (�1 = VEF14.94) at 31 December 2013 reduced the net assets and cash and cash equivalents as at 31 December 2014 by �583 million and �404 million, respectively. The impact of applying the consolidation rate for the six months ended 31 December 2014 would have reduced the previously reported net sales and operating profit for the six months ended 31 December 2013 by �237�million and �183 million, respectively.
�
�
The effect of movements in exchange rates, associated finance charge movements and mark to market impact on interest expense on profit before exceptional items and taxation for the six months ended 31 December�2014 is set out in the table below.
�
|
� |
� |
� |
� |
Gains/ |
� |
|
� |
� |
� |
� |
(losses) |
� |
|
� |
� |
� |
� |
� million |
� |
|
Translation impact |
� |
� |
� |
(221 |
) |
|
Transaction impact |
� |
� |
� |
(47 |
) |
|
Operating profit before exceptional items |
� |
� |
� |
(268 |
) |
|
Net finance charges � translation impact |
� |
� |
� |
(1 |
) |
|
Mark to market impact of IAS 39 on interest expense |
� |
� |
� |
5 |
� |
|
Impact of IAS 21 and IAS 39 on net other finance charges |
� |
� |
� |
1 |
� |
|
Interest and other finance charges |
� |
� |
� |
5 |
� |
|
Associates � translation impact |
� |
� |
� |
(11 |
) |
|
Profit before exceptional items and taxation |
� |
� |
� |
(274 |
) |
�
|
� |
� |
Six�months�ended |
� |
Six�months�ended |
� |
|
� |
� |
31�December�2014 |
� |
31�December�2013 |
� |
|
Exchange rates |
� |
� |
� |
� |
� |
|
Translation �1 = |
� |
$1.61 |
� |
$1.60 |
� |
|
Transaction �1 = |
� |
$1.58 |
� |
$1.58 |
� |
|
Translation �1 = |
� |
�1.26 |
� |
�1.18 |
� |
|
Transaction �1 = |
� |
�1.24 |
� |
�1.23 |
� |
�
(b)�Acquisitions and disposals
�
The impact of acquisitions and disposals on the reported figures was primarily attributable to the acquisition of United Spirits Limited (USL).
�
(c)�Exceptional items
�
Exceptional operating charges of �171 million (2013 � �20 million) in the six months ended 31 December�2014 comprise:
�
������������������ �18 million (2013 � �nil) in respect of the Global efficiency programme announced in January�2014;
������������������ �11 million (2013 � �3 million) in respect of the Supply excellence restructuring programme;
������������������ a gain of �3 million (2013 � charge of �17 million) arising from a property sale in respect of the restructuring of the group�s supply operations; and
������������������ �145 million (2013 � �nil) representing an estimate of the income statement charge for the settlement cost of several related disputes with the Korean customs authorities regarding the transfer pricing methodology applicable to imported spirits. Payments to be made pursuant to settlement of these related disputes will be reduced by �88 million which was paid to the customs authorities prior to 30 June�2014, and was previously accounted for as a receivable from Korea customs.
�
In the second half of the year an exceptional operating charge of approximately �80 million is expected to be incurred primarily in respect of the Global efficiency and Supply excellence programmes.
�
Non-operating items in the six months ended 31 December�2014 include a gain of �103 million (2013 � gain of �140 million) following the acquisition of additional equity shares in USL which increased the group�s investment in USL from 25.02% to 54.78% excluding the 2.38% interest owned by the USL Benefit Trust (2013 � 10.04% to 25.02%). As a result of USL becoming a subsidiary of the group a gain is recognised on the difference between the book value of the 25.02% investment and the market value on the acquisition of the controlling stake on 2 July 2014. The gain includes a �79 million cumulative exchange loss recycled from other comprehensive income and �10 million of transaction costs.
�
Exceptional non-operating items comprise transaction costs of �5 million (2013 � �nil) in respect of the expected disposal of Bushmills.
�
Discontinued operations in the six months ended 31 December�2013 represent a charge after taxation of �92 million in respect of the settlement of the thalidomide litigation in Australia and New Zealand and anticipated future payments to thalidomide organisations.
�
Cash payments in the six months ended 31 December�2014 in respect of exceptional restructuring items and thalidomide were �62 million (2013 � �41 million) and �8 million (2013 � �2 million), respectively. Cash expenditure on exceptional restructuring items in the second half of the year is expected to be approximately �120 million.
�
(d)�Dividend
�
An interim dividend of 21.5 pence per share will be paid to holders of ordinary shares and ADRs on the register as of 27 February�2015. This represents an increase of 9% on last year�s interim dividend. The interim dividend will be paid to shareholders on 7 April�2015. Payment to US ADR holders will be made on 10 April�2015. A dividend reinvestment plan is available to holders of ordinary shares in respect of the interim dividend and the plan notice date is 12 March�2015.
�
�
Movement in net borrowings
�
|
� |
� |
2014 |
� |
2013 |
� |
|
� |
� |
� million |
� |
� million |
� |
|
Net borrowings at 30 June |
� |
(8,850 |
) |
(8,403 |
) |
|
Free cash flow (a) |
� |
699 |
� |
326 |
� |
|
Acquisition less sale of businesses (b) |
� |
(664 |
) |
(420 |
) |
|
Net purchase of own shares for share schemes (c) |
� |
(7 |
) |
(61 |
) |
|
Dividends paid to non-controlling interests |
� |
(34 |
) |
(61 |
) |
|
Purchase of shares of non-controlling interests (d) |
� |
� |
� |
(35 |
) |
|
Net movements in bonds (e) |
� |
(371 |
) |
(983 |
) |
|
Net movements in other borrowings (f) |
� |
1,316 |
� |
1,122 |
� |
|
Equity dividends paid |
� |
(801 |
) |
(735 |
) |
|
Net increase/(decrease) in cash and cash equivalents |
� |
138 |
� |
(847 |
) |
|
Net increase in bonds and other borrowings |
� |
(945 |
) |
(139 |
) |
|
Exchange differences (g) |
� |
(143 |
) |
337 |
� |
|
Borrowings acquired on acquisition of USL |
� |
(849 |
) |
� |
� |
|
Other non-cash items |
� |
(19 |
) |
(44 |
) |
|
Net borrowings at 31 December |
� |
(10,668 |
) |
(9,096 |
) |
�
(a)�See page�14 for the analysis of free cash flow.
�
(b)�On 2 July�2014 the group acquired an additional 26% investment in USL for INR 114.5 billion (�1,118 million). On 31 October�2014 the sale of the Whyte and Mackay Group by USL resulted in a net cash receipt of �395 million. In the six months ended 31 December�2013 cash payments primarily comprised �474 million in respect of the acquisition of a 18.74% investment in USL.
�
(c)�Net purchase of own shares comprised purchase of treasury shares for the future settlement of obligations under the employee share option schemes of �39 million (2013 � �116 million) less receipts from employees on the exercise of share options of �32 million (2013 � �55 million).
�
(d)�In the six months ended 31 December�2013 Diageo purchased the remaining 7% equity stake in Sichuan Chengdu Shuijingfang Group Co.,�Ltd.
�
(e)�In the six months ended 31 December�2014, the group repaid bonds of �1,000 million (�792 million) and issued bonds of �1,000 million (�791 million). In the comparable period, the group repaid bonds of �1,150 million (�983 million). A bond of �370 million acquired on the purchase of USL was repaid using the proceeds from the sale of the Whyte and Mackay Group.
�
(f)�Net movements in other borrowings are primarily in respect of the net drawdown of short term commercial paper which is used to finance day-to-day operations.
�
(g)�Exchange differences primarily arose on US dollar and euro denominated borrowings partially offset by the favourable change on foreign exchange swaps and forwards.
�
�
Movement in equity
�
|
� |
� |
2014 |
� |
2013 |
� |
|
� |
� |
� million |
� |
� million |
� |
|
Equity at 30 June |
� |
7,590 |
� |
8,088 |
� |
|
Profit for the period |
� |
1,364 |
� |
1,654 |
� |
|
Exchange adjustments (a) |
� |
266 |
� |
(770 |
) |
|
Net remeasurement of post employment plans |
� |
(341 |
) |
(89 |
) |
|
Exchange recycled to the income statement (b) |
� |
79 |
� |
� |
� |
|
Fair value movements on available-for-sale investments (b) |
� |
11 |
� |
(90 |
) |
|
Non-controlling interests acquired (b) |
� |
594 |
� |
� |
� |
|
Purchase of shares of non-controlling interests |
� |
� |
� |
(35 |
) |
|
Dividends to non-controlling interests |
� |
(34 |
) |
(61 |
) |
|
Dividends paid |
� |
(801 |
) |
(735 |
) |
|
Other reserve movements |
� |
(32 |
) |
76 |
� |
|
Equity at 31 December |
� |
8,696 |
� |
8,038 |
� |
�
(a)�Movement in the six months ended 31 December�2014 primarily arose on the US dollar, the euro, Brazilian real and the Indian rupee denominated net investments.
�
(b)�Following the change in accounting for USL from an associate to a subsidiary,�an exchange loss of �79 million has been recycled to the income statement in the six months ended 31 December�2014 and a 43.9% non-controlling interest has been recognised of �594 million. In the six months ended 31 December�2013 a gain of �85 million, in respect of USL, was recycled to the income statement reflecting the step up from available-for-sale investment to associate.
�
Post employment plans
�
The deficit in respect of post employment plans before taxation increased by �313 million from �475 million at 30 June�2014 to �788 million at 31 December�2014. The increase was primarily due to the reduction in returns from �AA� rated corporate bonds used to calculate the discount rates on the liabilities of the post employment plans (United Kingdom reduced from 4.2% to 3.5% and Ireland from 3% to 2.1%) partially offset by a reduction in long term inflation and an increase in the value of the assets held by the plans. Total cash contributions to the group�s post employment plans for the year ending 30 June�2015 are expected to be approximately �185 million.
�
Analysis by reporting segments
�
The organic movements for volume, net sales, marketing spend and operating profit before exceptional items by reporting segment for the six months ended 31 December�2014 were as follows:
�
|
� |
� |
Volume |
� |
Net�sales |
� |
Marketing�spend |
� |
Operating profit (a) |
� | ||||||||
|
Organic�growth�by�region |
� |
% |
� |
EUm |
� |
% |
� |
� million |
� |
% |
� |
� million |
� |
% |
� |
� million |
� |
|
North America |
� |
(2 |
) |
(0.6 |
) |
� |
� |
(1 |
) |
3 |
� |
8 |
� |
(1 |
) |
(7 |
) |
|
Europe |
� |
(1 |
) |
(0.2 |
) |
� |
� |
(4 |
) |
3 |
� |
6 |
� |
1 |
� |
3 |
� |
|
Africa |
� |
9 |
� |
1.1 |
� |
5 |
� |
38 |
� |
12 |
� |
9 |
� |
4 |
� |
7 |
� |
|
Latin America and Caribbean |
� |
(10 |
) |
(1.3 |
) |
(1 |
) |
(4 |
) |
3 |
� |
3 |
� |
7 |
� |
13 |
� |
|
Asia Pacific |
� |
(7 |
) |
(0.6 |
) |
(5 |
) |
(39 |
) |
(15 |
) |
(24 |
) |
(7 |
) |
(14 |
) |
|
Corporate |
� |
� |
� |
� |
� |
8 |
� |
3 |
� |
(20 |
) |
(1 |
) |
16 |
� |
11 |
� |
|
Diageo |
� |
(2 |
) |
(1.6 |
) |
� |
� |
(7 |
) |
� |
� |
1 |
� |
1 |
� |
13 |
� |
�
(a)�������� Before exceptional items.
�
�
North America
�
�Net sales in North America were in line with last year, given the slowdown in the US spirits market as a result of weaker pricing and our comparison against a strong first half last year. In our US Spirits and Wines business volume was down but continued strong performance of reserve brands was the main driver of 2.6 percentage points of price/mix.� Given our already premium price position in many categories, we have taken fewer price increases and engaged in more tactical promotional activities in the most competitive segments. Scotch shipments were down 9% against the prior period which benefitted from a number of innovations.� Depletions, however, were up for our scotch malts portfolio and Buchanan�s and both gained share, and Buchanan�s became the number two super premium scotch by value behind Johnnie Walker.� Our strength in innovation continues to be a key growth driver and C�roc Pineapple and Crown Royal Regal Apple contributed to overall growth in Diageo�s vodka and North American whiskey categories, up 6% and 3% respectively, while Captain Morgan gained share in rum driven by Captain Morgan White Rum.� Smirnoff saw improved consumer offtake driven by promotional activities and the new campaign and packaging, with the core brand gaining share.� Consumer demand for more authentic deluxe brands continued and our reserve brand business grew 10%, with strong performance from Don Julio and Bulleit which both outperformed their categories and gained share. In DGUSA net sales were broadly flat as ready to drink performance stabilised and the success of Guinness Blonde American Lager contributed to overall growth of the Guinness brand.� Diageo Canada has already seen some benefit from our new distribution system with net sales up 1%. Brand investment was up 3% focused on our innovation launches and Smirnoff.� Gross margin was negatively impacted by lower scotch shipments together with the one off impact on net sales from the change in the distribution system in Canada. This was only partially offset by lower overheads in the region and operating margin declined by 35 basis points.�
�
|
Key financials |
� |
First�Half |
� |
Exchange |
� |
Acquisitions |
� |
Organic |
� |
First�Half |
� |
Reported |
� |
|
Net sales |
� |
1,904 |
� |
(25 |
) |
(11 |
) |
(1 |
) |
1,867 |
� |
(2 |
) |
|
Marketing spend |
� |
293 |
� |
(4 |
) |
7 |
� |
8 |
� |
304 |
� |
4 |
� |
|
Operating profit before exceptional items |
� |
851 |
� |
(21 |
) |
(4 |
) |
(7 |
) |
819 |
� |
(4 |
) |
|
Exceptional items |
� |
(1 |
) |
� |
� |
� |
� |
� |
� |
(11 |
) |
� |
� |
|
Operating profit |
� |
850 |
� |
� |
� |
� |
� |
� |
� |
808 |
� |
(5 |
) |
�
|
� |
� |
Organic |
� |
Organic |
� |
Reported |
� |
|
� |
� |
volume |
� |
net�sales |
� |
net�sales |
� |
|
� |
� |
movement (a) |
� |
movement |
� |
movement |
� |
|
Markets and categories |
� |
% |
� |
% |
� |
% |
� |
|
North America |
� |
(2 |
) |
� |
� |
(2 |
) |
|
� |
� |
� |
� |
� |
� |
� |
� |
|
US Spirits and Wines |
� |
(3 |
) |
� |
� |
(1 |
) |
|
DGUSA |
� |
(2 |
) |
� |
� |
(1 |
) |
|
Canada |
� |
� |
� |
1 |
� |
(8 |
) |
|
� |
� |
� |
� |
� |
� |
� |
� |
|
Spirits (b) |
� |
(2 |
) |
� |
� |
(1 |
) |
|
Beer |
� |
(3 |
) |
(3 |
) |
(5 |
) |
|
Wine |
� |
2 |
� |
1 |
� |
1 |
� |
|
Ready to drink |
� |
(1 |
) |
1 |
� |
(12 |
) |
�
|
� |
� |
Organic |
� |
Organic |
� |
Reported |
� |
|
� |
� |
volume |
� |
net�sales |
� |
net�sales |
� |
|
� |
� |
movement (a) |
� |
movement |
� |
movement |
� |
|
Global giants and local stars (b) |
� |
% |
� |
% |
� |
% |
� |
|
Smirnoff |
� |
(5 |
) |
(7 |
) |
(8 |
) |
|
Crown Royal |
� |
� |
� |
(1 |
) |
(2 |
) |
|
Captain Morgan |
� |
(7 |
) |
(8 |
) |
(9 |
) |
|
Johnnie Walker |
� |
(4 |
) |
(14 |
) |
(15 |
) |
|
C�roc |
� |
27 |
� |
27 |
� |
26 |
� |
|
Ketel One vodka |
� |
(1 |
) |
(1 |
) |
(1 |
) |
|
Guinness |
� |
� |
� |
(1 |
) |
(3 |
) |
|
Baileys |
� |
(4 |
) |
(6 |
) |
(8 |
) |
|
Tanqueray |
� |
� |
� |
2 |
� |
1 |
� |
|
Don Julio |
� |
13 |
� |
21 |
� |
20 |
� |
|
Buchanan�s |
� |
30 |
� |
32 |
� |
31 |
� |
|
Bulleit |
� |
52 |
� |
59 |
� |
58 |
� |
�
|
(a) |
Organic equals reported movement for volume except for North America (3)%, US Spirits and Wines (4)%, spirits (3)% and ready to drink (17)% reflecting the termination of the transitional arrangements following the disposal of Jose Cuervo. |
|
(b) |
Spirits brands excluding ready to drink. |
�
|
|
|


�
�
|
� |
In US Spirits and Wines, which represents 82% of the net sales in the region, net sales were broadly flat, with 2.6pps of positive price/mix, driven by the double digit growth of reserve brands and innovation launches. Net sales in vodka grew 6% on the back of the successful launch of C�roc Pineapple which resulted in an overall net sales growth of 28% for the C�roc brand. High stock levels impacted Smirnoff net sales which were down 8%, however the relaunch of the brand with a new packaging and marketing campaign, coupled with targeted promotional activities have improved the core brand�s performance, which gained share. Captain Morgan net sales were down 9% as Captain Morgan Spiced Rum suffered from increasing competition in the spiced rum category and from lapping the launch of Captain Morgan White Rum last year, which performed well and gained share. Net sales in North American whiskey increased 3%, Bulleit continued to outperform the category with net sales up 58%, Crown Royal net sales declined 1%, with strong growth from the launch of Crown Royal Regal Apple offset by lapping the launch of Crown Royal XO in the same period last year. Johnnie Walker net sales were down 17% as it lapped the launch in the first half last year of super premium variants Johnnie Walker Platinum Label and Johnnie Walker Gold Label Reserve and the promotional activities and phasing of shipments in Johnnie Walker Black Label and Johnnie Walker Blue Label respectively. Buchanan�s net sales were up 33% as it continued to leverage its strong connection with the Hispanic community and it is now the second largest super premium scotch in value behind Johnnie Walker. Net sales of tequila were up 37%, driven by the continued success of Don Julio, with net sales up 21%, and the launches under Diageo�s ownership of the newly acquired Peligroso and DeLe�n brands. |
|
� |
DGUSA net sales were broadly flat, with volume down 2%. Guinness net sales were up 1%, driven by the successful launch of Guinness Blonde American Lager, but the core brand was still impacted by the decline in the on trade. Ready to drink net sales were up 2% as it benefitted from comparison against last year�s destocking in the pouches segment. |
|
� |
Net sales in Canada benefitted from the change in distribution system and increased 1%, with volume broadly flat. Growth in Johnnie Walker Black Label and reserve brands�partially offset the decline of Guinness, which was impacted by weakness in the on trade. |
|
� |
Marketing spend increased 3%, with the upweighted investment largely focused on supporting Smirnoff, with the new �Exclusively for Everybody� campaign, innovations such as C�roc Pineapple, Guinness Blonde American Lager, Crown Royal Regal Apple and Peligroso. |
�
�
Europe
�
�Diageo�s performance in Europe reflected a stable performance in Western Europe, strong growth in Turkey, and tough trading conditions in Russia and Eastern Europe.� In Western Europe, we continued our strategy to improve efficiency and invest behind our brands.� Great Britain, France and Italy were all in growth, driven by�successful innovation launches and�reserve�brands, which were up double digit.� We continued to invest behind our route to consumer, which coupled with our focus on cost, enabled us to increase our coverage without increasing overheads.� In Turkey, net sales grew mainly through the continued premiumisation of the raki category, driven by Yen� Raki, the leading brand.� Share increased in the premium segment as a result of strong focus in the on trade.� Performance in Russia and Eastern Europe was significantly impacted by the economic environment in Russia, where consumer confidence is weak due to sanctions, currency devaluation and tighter credit.� In this challenging environment we gained share in scotch and rum.� Marketing spend was up 3%, up 44 basis points as a percentage of net sales, largely supporting the launch of Haig Club in Western Europe.� Margins in Western Europe were broadly flat, and despite weakness in Russia the strong performance of Turkey resulted in margin improvement of 30 basis points.�
�
|
� |
� |
First�Half |
� |
Exchange |
� |
Acquisitions |
� |
Organic |
� |
First�Half |
� |
Reported |
� |
|
Key financials |
� |
� million |
� |
� million |
� |
� million |
� |
� million |
� |
� million |
� |
% |
� |
|
Net sales |
� |
1,560 |
� |
(92 |
) |
(5 |
) |
(4 |
) |
1,459 |
� |
(6 |
) |
|
Marketing spend |
� |
231 |
� |
(12 |
) |
� |
� |
6 |
� |
225 |
� |
(3 |
) |
|
Operating profit before exceptional items |
� |
509 |
� |
(31 |
) |
(1 |
) |
3 |
� |
480 |
� |
(6 |
) |
|
Exceptional items |
� |
� |
� |
� |
� |
� |
� |
� |
� |
(4 |
) |
� |
� |
|
Operating profit |
� |
509 |
� |
� |
� |
� |
� |
� |
� |
476 |
� |
(6 |
) |
�
|
� |
� |
Organic |
� |
Organic |
� |
Reported |
� |
|
� |
� |
volume |
� |
net�sales |
� |
net�sales |
� |
|
� |
� |
movement (a) |
� |
movement |
� |
movement |
� |
|
Markets and categories |
� |
% |
� |
% |
� |
% |
� |
|
Europe |
� |
(1 |
) |
� |
� |
(6 |
) |
|
� |
� |
� |
� |
� |
� |
� |
� |
|
Western Europe |
� |
(1 |
) |
� |
� |
(4 |
) |
|
Russia and Eastern Europe |
� |
(8 |
) |
(12 |
) |
(25 |
) |
|
Turkey |
� |
5 |
� |
11 |
� |
(1 |
) |
|
� |
� |
� |
� |
� |
� |
� |
� |
|
Spirits (b) |
� |
(1 |
) |
� |
� |
(8 |
) |
|
Beer |
� |
� |
� |
� |
� |
(4 |
) |
|
Wine |
� |
4 |
� |
2 |
� |
(3 |
) |
|
Ready to drink |
� |
(5 |
) |
2 |
� |
� |
� |
�
|
� |
� |
Organic |
� |
Organic |
� |
Reported |
� |
|
� |
� |
volume |
� |
net�sales |
� |
net�sales |
� |
|
� |
� |
movement (a) |
� |
movement |
� |
movement |
� |
|
Global giants and local stars (b) |
� |
% |
� |
% |
� |
% |
� |
|
Guinness |
� |
(2 |
) |
(1 |
) |
(4 |
) |
|
Johnnie Walker |
� |
(10 |
) |
(13 |
) |
(20 |
) |
|
Smirnoff |
� |
(3 |
) |
(5 |
) |
(8 |
) |
|
Yen� Raki |
� |
(2 |
) |
10 |
� |
(2 |
) |
|
Baileys |
� |
(3 |
) |
(4 |
) |
(10 |
) |
|
J�B |
� |
(2 |
) |
(5 |
) |
(10 |
) |
|
Captain Morgan |
� |
7 |
� |
6 |
� |
(2 |
) |
�
(a)�������� Organic equals reported movement for volume.
(b)�������� Spirits brands excluding ready to drink.
�
|
|
|


�
�
������������������ Western Europe net sales were broadly flat as the performance of individual markets continued to reflect the mixed economic recovery across Europe.
������������������ In Great Britain, net sales increased 2% with 2pps of positive price/mix, driven by strong growth of ready to drink and reserve brands. Innovation, including the launches of Haig Club and C�roc Amaretto, and increased consumer focused activations such as the Global World Class�Finals in London last summer and the London cocktail week, were the main drivers of the 50% net sales growth in reserve brands. In the more price competitive standard segment, Captain Morgan and Baileys performed well with net sales up 6% and 2% respectively.� Smirnoff net sales were flat, as it lapped the launch of Smirnoff Gold last year but with good performance from Smirnoff Red, which was up 3% and gained share.� Net sales in beer were down 2% as Guinness was impacted by weakness in the on trade, however it maintained share.� Ready to drink net sales were up 23% principally driven by Captain Morgan Original Spiced,� Gordon�s�& Tonic� and Gordon�s Slimline�& Tonic.
������������������ In Ireland, net sales declined 2%, largely driven by the transfer of sales of wines to Diageo Wines Europe which was worth 2pps of growth.� Guinness net sales were up 1%, growing after more than six years of decline. The growth came from increased focus on execution in the on trade, partially offset by softness in spirits following last year�s duty increase.
������������������ In Southern Europe, net sales declined 1% with 0.5pps of positive price/mix. While still a challenging trading environment, the performance in these countries has improved, as Italy and Greece were in growth and the decline in Spain moderated to 2%. In Spain, category performance was mixed with Tanqueray and Smirnoff net sales up 24% and 7% respectively, however largely offset by a soft performance of Johnnie Walker.� Reserve brands performed well and net sales grew double digit with a strong performance from scotch malts, C�roc, which nearly trebled in Italy, and Zacapa.
������������������ Net sales in Germany and Austria declined 13%. In Germany, net sales were down 9% largely driven by commercial negotiations and the transfer of sales of Yen� Raki to Mey 0�ki, which was worth 5pps of growth.� Scotch net sales declined 12% due to Johnnie Walker Black Label performance lapping a year of upweighted marketing investments. In Austria, performance was impacted by the comparison against the prior period which saw forward buying ahead of the January�2014 duty increase.
������������������ In France net sales increased 2%, driven by a good performance in scotch malts and reserve brands. Smirnoff and Baileys were impacted by a competitive pricing environment and both net sales declined 7%, while Captain Morgan continued to perform well and doubled its net sales following its successful launch last year.
������������������ Net sales in Benelux decreased 12% mainly driven by price realignment in Johnnie Walker and Smirnoff with both brands gaining share.
������������������ Diageo Wines Europe net sales increased 7%, driven by strong growth in [yellow tail], expansion in other countries and the transfer of sales of wines from Diageo Ireland, which was worth 2pps of growth.� Blossom Hill net sales were down 1% as it lapped prior year strong promotional activities.
��������������������� The consumer environment in Russia and Eastern Europe has been severely impacted by the economic and political events there and net sales declined 12%.� Scotch, Diageo�s largest category in Russia, was hardest hit and declined 17%, although Johnnie Walker Red Label maintained its leadership position in standard scotch, and White Horse gained share.� Locally produced innovations, Rowson�s Reserve, an Irish whiskey drink, and Shark Tooth, which competes in rum, were successful with distribution gains and strong rates of sales, and Shark Tooth is now the third largest brand in the category in its second year in the market.� In Poland, net sales declined 18% as there was forward buying before an excise duty increase in the comparable period.� Johnnie Walker regained its leadership position in whisk(e)y, but net sales declined 24% and while depletions stabilised, Smirnoff Black was down 35%.� In Eastern Europe the conflict in Ukraine and route to market disruptions in Kazakhstan and Azerbaijan led to double digit net sales decline on Johnnie Walker Red Label and Baileys.� This was partially offset by the strong performance of Captain Morgan across Eastern Europe resulting in a net decline of 7%.
���������������������� Net sales in Turkey were up 11%, driven by raki and included the transfer of sales from the German former distributor to Mey 0�ki which was worth 2pps of growth.� Yen� Raki continued to drive premiumisation with Yen� Seri in the premium segment and Yen� Raki Ala in the super premium segment, recruiting consumers through perfect serve trade activations and limited edition innovations.� Tekirda gained share and a new ultra premium variant, Tekirda No: 10, was launched to reinforce the upper end of Diageo�s raki range.� The lower priced raki portfolio reached its highest market share in three years, driven by distribution gains and consumption shifting to lower priced tiers following excise duty increases.� Diageo�s international spirits continued to gain share with Johnnie Walker and the whiskey portfolio up 50 and 130 basis points respectively.
���������������������� Marketing spend in the region increased 3% largely driven by increased spend in Western Europe, up 4%, focused on innovations, including the launch of Haig Club, and reserve brands. In Russia and Eastern Europe, marketing spend declined 4%, reflecting the challenging macroeconomic environment, and spend was focused on driving penetration, awareness and trial as opposed to image building, with accelerated spend in digital.� In Turkey, marketing spend declined slightly as the mix of programmes changed following the introduction of greater restrictions in advertising legislation and spend was also cut from non-core categories such as wine and re-directed to higher priorities such as raki and scotch initiatives.
�
�
Africa
�
�Our overall performance in Africa has improved, with net sales up 5%.� We have begun to lap the excise duty change on Senator in Kenya in the half, performance in our Africa Regional Markets has improved as beer in Ghana and Cameroon is in good growth, we have delivered strong growth in spirits in Angola as a result of improved route to consumer and our performance in Nigeria improved.� Nigeria remains a challenging market, though, as consumers continue to trade down into value beer.� However, the successful launch of Orijin and the improved performance of Satzenbrau drove growth in beer despite softness in other brands and destocking.� In South Africa Smirnoff 1818 and Johnnie Walker delivered very strong performances.� Spirits in Africa were up 19% with double digit growth in every market, driven by both mainstream international spirits and our strong local spirits brands.� Across Africa we have continued to build our route to consumer and invested in our brands, with marketing spend up 12%, driven by the global Guinness platform �Made of More� and our latest execution �Made of Black�.� Reserve has gone from strength to strength with net sales up 25% and we have driven out costs from all of our markets.� Operating margin however was down 26 basis points.� Mix in South Africa and price and mix in East Africa drove margin improvement in these two markets, but margin declined in Nigeria and despite strong margin expansion in Ghana and Angola, net sales declines in other countries in Africa Regional Markets eroded margin for that market.�
�
|
Key financials |
� |
First�half |
� |
Exchange |
� |
Acquisitions |
� |
Organic |
� |
First�half |
� |
Reported |
� |
|
Net sales |
� |
774 |
� |
(67 |
) |
� |
� |
39 |
� |
746 |
� |
(4 |
) |
|
Marketing spend |
� |
81 |
� |
(5 |
) |
� |
� |
9 |
� |
85 |
� |
5 |
� |
|
Operating profit before exceptional items |
� |
188 |
� |
(20 |
) |
� |
� |
7 |
� |
175 |
� |
(7 |
) |
|
Exceptional items |
� |
(2 |
) |
� |
� |
� |
� |
� |
� |
(1 |
) |
� |
� |
|
Operating profit |
� |
186 |
� |
� |
� |
� |
� |
� |
� |
174 |
� |
(6 |
) |
�
|
� |
� |
Organic |
� |
Organic |
� |
Reported |
� |
|
� |
� |
volume |
� |
net�sales |
� |
net�sales |
� |
|
� |
� |
movement (a) |
� |
movement |
� |
movement |
� |
|
Markets and categories |
� |
% |
� |
% |
� |
% |
� |
|
Africa |
� |
9 |
� |
5 |
� |
(4 |
) |
|
� |
� |
� |
� |
� |
� |
� |
� |
|
Nigeria |
� |
14 |
� |
1 |
� |
(6 |
) |
|
East Africa |
� |
7 |
� |
11 |
� |
5 |
� |
|
Africa Regional Markets |
� |
15 |
� |
16 |
� |
(3 |
) |
|
South Africa |
� |
2 |
� |
(6 |
) |
(16 |
) |
|
� |
� |
� |
� |
� |
� |
� |
� |
|
Spirits (b) |
� |
25 |
� |
19 |
� |
9 |
� |
|
Beer |
� |
1 |
� |
5 |
� |
(4 |
) |
|
Ready to drink |
� |
(37 |
) |
(32 |
) |
(38 |
) |
�
|
� |
� |
Organic |
� |
Organic |
� |
Reported |
� |
|
� |
� |
volume |
� |
net�sales |
� |
net�sales |
� |
|
� |
� |
movement (a) |
� |
movement |
� |
movement |
� |
|
Global giants and local stars (b) |
� |
% |
� |
% |
� |
% |
� |
|
Guinness |
� |
(9 |
) |
(11 |
) |
(19 |
) |
|
Malta |
� |
(12 |
) |
(15 |
) |
(26 |
) |
|
Johnnie Walker |
� |
19 |
� |
15 |
� |
8 |
� |
|
Smirnoff |
� |
21 |
� |
18 |
� |
6 |
� |
|
Tusker |
� |
(3 |
) |
13 |
� |
7 |
� |
|
Harp |
� |
(39 |
) |
(52 |
) |
(55 |
) |
|
Senator |
� |
(28 |
) |
(33 |
) |
(36 |
) |
�
(a)�������� Organic equals reported movement for volume.
(b)�������� Spirits brands excluding ready to drink.
�
|
|
|


�
�
������������������ In Nigeria, volume and net sales were up driven by the national launch of Orijin, for which extra capacity has been introduced to support growth, but performance of the beer portfolio remained relatively flat as the stout category continued to lose share to lager which impacted Guinness. Value lagers outperformed the mainstream and premium segments, which benefitted Satzenbrau but exacerbated pricing issues and the planned destocking of Harp.� While spirits net sales were up 29% in total, driven by strong local spirits performance, international spirits net sales declined by approximately a third as a result of a strategic decision to reduce inventory levels in the market.
������������������ East Africa�s performance, with volume and net sales up 7% and 11% respectively was driven by robust performances in both beer and spirits.� Double digit net sales growth of both Tusker and Guinness for East Africa, along with value offerings Balozi in Kenya and Kibo Gold in Tanzania, more than offset the continued decline of Senator that resulted from excise duty changes in the comparable period and accounted for 5pps of net sales growth.� Spirits net sales growth was driven by Kane Extra and Johnnie Walker, which benefitted from increased distribution and new �Tavern Packs� which combine 20 cl pack sizes of Red Label with ginger beer and a cup and are targeted at premium pubs and mainstream outlets that previously did not stock the brand.
������������������ In Africa Regional Markets net sales grew 16%. Spirits performance in Angola recovered with the implementation of a new route to consumer strategy and the appointment of a new distributor.� In Ghana, Malta also benefitted from an improved route to consumer, along with a new advertising campaign and new packaging launched in the previous fiscal year that have driven 2.4pps of share gains.� Spirits in Ghana also performed well, up over 50%, driven by Johnnie Walker and Baileys.� Both beer and spirits in Cameroon were key drivers of performance, with share gains from Harp, a resilient Guinness performance despite short term supply constraints and Johnnie Walker which more than doubled net sales.� In the rest of Africa Regional Markets, the strong net sales growth of Malta was offset by the decline of Meta in Ethiopia in an increasingly competitive pricing environment.
������������������ In a challenging economic environment, net sales in South Africa were down 6%.� This was driven by Smirnoff Ice Double Black and Guarana as the brand lapped very strong net sales and high stock levels in the comparable period, and transferred to DHN in the second quarter of this fiscal year. The underlying performance of the business was driven by spirits, notably Smirnoff 1818, which was up 23% with new packaging and sampling programmes.� Johnnie Walker also delivered a strong performance with Black Label and Red Label net sales up 13% and 17% respectively, supported by the �King of Flavours� and �Johnnie and Ginger� campaigns that focus on quality and liquid credentials.
������������������ Marketing spend in Africa increased 12%.� Net sales of spirits was up 19% supported by a double digit increase in investment driven by South Africa where spend was significantly upweighted on vodka, both Smirnoff 1818 and C�roc, as well as scotch and local spirits in East Africa.� A marketing services agreement with the new distributor in Angola drove spirits marketing spend efficiencies.� Spend on beer was up 6% as investments on Guinness and the �Made of More� platform increased 20%, and Orijin was rolled out nationally in Nigeria.
�
�
Latin America and Caribbean
�
�In LAC we have delivered a good performance across the domestic business while the border business remains challenging.� Currency volatility continues to impact underlying demand in the border trade and therefore inventory levels reduced to reflect this. Together with reduced imports into Venezuela, this has impacted net sales of our scotch brands which were down 7% in the half.� A strong contribution from our domestic markets mitigated the impact on net sales. In Venezuela, the actions we are taking to maximise our import and local portfolios, given limited access to foreign exchange, delivered net sales growth.� In Brazil, our decision to harmonise interstate price variances and our continued work on route to consumer led to inventory reduction in the distributor channel, the impact of which was partially offset by price increases.� Performance in Colombia was strong with share gains, and in Mexico the strength of our scotch portfolio delivered good growth.� Chile, Peru and Jamaica benefitted from our route to consumer interventions and all delivered good growth.� A reduction in overheads, particularly in Venezuela, led to an operating margin increase of 2.3 percentage points for the region.�
�
|
Key financials |
� |
First�half |
� |
Exchange |
� |
Acquisitions |
� |
Organic |
� |
First�Half |
� |
Reported |
� |
|
Net sales |
� |
900 |
� |
(277 |
) |
� |
� |
(4 |
) |
619 |
� |
(31 |
) |
|
Marketing spend |
� |
123 |
� |
(16 |
) |
� |
� |
3 |
� |
110 |
� |
(11 |
) |
|
Operating profit before exceptional items |
� |
386 |
� |
(192 |
) |
� |
� |
13 |
� |
207 |
� |
(46 |
) |
|
Exceptional items |
� |
(1 |
) |
� |
� |
� |
� |
� |
� |
(4 |
) |
� |
� |
|
Operating profit |
� |
385 |
� |
� |
� |
� |
� |
� |
� |
203 |
� |
(47 |
) |
�
|
� |
� |
Organic |
� |
Organic |
� |
Reported |
� |
|
� |
� |
volume |
� |
net�sales |
� |
net�sales |
� |
|
� |
� |
movement (a) |
� |
movement |
� |
movement |
� |
|
Markets and categories |
� |
% |
� |
% |
� |
% |
� |
|
Latin America and Caribbean |
� |
(10 |
) |
(1 |
) |
(31 |
) |
|
� |
� |
� |
� |
� |
� |
� |
� |
|
PUB |
� |
(9 |
) |
� |
� |
(7 |
) |
|
Venezuela |
� |
(44 |
) |
6 |
� |
(79 |
) |
|
Colombia |
� |
10 |
� |
12 |
� |
2 |
� |
|
Mexico |
� |
4 |
� |
7 |
� |
� |
� |
|
West LAC |
� |
(11 |
) |
(11 |
) |
(17 |
) |
|
� |
� |
� |
� |
� |
� |
� |
� |
|
Spirits (b) |
� |
(11 |
) |
(4 |
) |
(34 |
) |
|
Beer |
� |
8 |
� |
19 |
� |
7 |
� |
|
Wine |
� |
(14 |
) |
(3 |
) |
(29 |
) |
|
Ready to drink |
� |
2 |
� |
30 |
� |
(10 |
) |
�
|
� |
� |
Organic |
� |
Organic |
� |
Reported |
� |
|
� |
� |
volume |
� |
net�sales |
� |
net�sales |
� |
|
� |
� |
movement (a) |
� |
movement |
� |
movement |
� |
|
Global giants and local stars (b) |
� |
% |
� |
% |
� |
% |
� |
|
Johnnie Walker |
� |
(13 |
) |
(10 |
) |
(24 |
) |
|
Buchanan�s |
� |
(13 |
) |
(4 |
) |
(50 |
) |
|
Old Parr |
� |
(8 |
) |
(12 |
) |
(47 |
) |
|
Smirnoff |
� |
(11 |
) |
18 |
� |
� |
� |
|
Ypi�ca |
� |
(7 |
) |
(5 |
) |
(12 |
) |
|
Baileys |
� |
(5 |
) |
3 |
� |
(13 |
) |
�
(a)�������� Organic equals reported movement for volume.
(b)�������� Spirits brands excluding ready to drink.
�
|
|
|
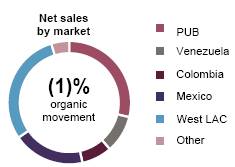

�
�
������������������ Net sales in Paraguay, Uruguay and Brazil (PUB) were flat as price increases in Brazil partially offset volume decline as Diageo�s strategy to address interstate tax variances and to reduce commercial discounts together with route to consumer initiatives reduced stock levels held by distributors.� Net sales of Johnnie Walker were down 11% as competitor pricing activity in the off trade increased Johnnie Walker Red Label�s price premium over competitor brands.� Old Parr and White Horse performed well up 18% and 28% respectively and gained share following acceleration of recruitment platforms in the on trade and media campaigns.� Net sales growth in vodka was driven by Smirnoff, up 23% following price increases and ready to drink net sales increased 22% following the launch of Smirnoff Ice Green Apple.� Net sales of the Ypi�ca brand, which declined 5%, were affected by a change in distribution and a decline in flavours.� While the brand has performed strongly in its core region, last year coverage was expanded to new areas and changes were made to distribution for that roll out which impacted performance in the half.
������������������ In Venezuela, the impact of high inflation together with restrictions on imported goods led to scotch volume declining 40% and net sales declining 13%. The strong performance of local brands led to total net sales increasing 6%, despite a shortage of glass impacting volumes.� Price increases on Cacique rum resulted in net sales growing 39% supported by strong equity scores and trade activations, while Gordon�s Vodka gained share supported by the �Vive Simple, Vive Gordon�s� campaign led to an increase in net sales of 215%, albeit off a small base.� Reserve brands increased 84% predominantly driven by Johnnie Walker super premium variants and Buchanan�s Special Reserve.
������������������ Net sales in Colombia increased 12% as Diageo�s brands gained share with the expansion of the route to consumer programme.� Within scotch, Old Parr grew 19% benefitting from the launch of Old Parr Tribute and Buchanan�s delivered 13% growth with a strong contribution from Buchanan�s Special Reserve.� Johnnie Walker net sales were flat following price repositioning during the half, however share gains were made across all variants following consumer events and trade activations.
�����Mexico delivered 7% net sales growth driven by the strong performance of scotch.� Johnnie Walker Red Label drove 40% of the overall growth benefitting from great visibility with the �Keep Walking Mexico� campaign and digital activations. This was the main contributor to total Johnnie Walker net sales up 8%.� The introduction of Black�& White supported by the Buchanan�s family connection resulted in net sales growth of 70% and the brand gained 4.1pps of share.
����������������� Net sales in West LAC declined 11% driven by further market contraction in the border zones, down 50%, as a result of currency volatility.� In the domestic markets net sales grew 4% with strong contributions from Peru, Chile and Jamaica.� In Peru net sales grew 20% with strong contributions from across the Johnnie Walker portfolio and Baileys following the introduction of the Dulce de Leche flavour variant.� Standard scotch brands, including White Horse and Johnnie Walker Red Label along with Pampero, contributed to 8% net sales growth in Chile and in Jamaica strong consumer campaigns on Red Stripe along with the introduction of new formats led to net sales growth of 14%, which together with a good performance of Guinness in West LAC led to the beer category growth in the region.� There was also good net sales growth in Costa Rica and Venture Central America.
������������������ An increase in marketing spend of 3% supported the expansion of brand portfolios in the region.� Smirnoff spend increased behind the new global positioning as distribution expanded in Brazil, Mexico and Chile. Scotch spend was focused on Old Parr in Colombia and the launch of Old Parr Tribute, Johnnie Walker Black Label and Red Label in Mexico and Colombia. Elsewhere spend also increased on Red Stripe driving greater consumer engagement around the football platform and to maintain Cacique�s leading position in Venezuela.
�
�
Asia Pacific
�
�Performance for Asia Pacific reflects inventory reductions and a tough comparison against high shipments� in South East Asia last year and weakness in scotch in China.� Elsewhere, North Asia, Taiwan,�India and GTME delivered growth and Australia�s� performance improved, led by innovation in the ready to drink segment.� Innovation contributed significantly to the region�s net sales performance, with the high profile�launch of Haig Club� in South East Asia, Korea, China and GTME an important driver of this.� Our reserve performance was good, up 7%, with 36% growth of the reserve scotch malts, and all markets except South East Asia grew their reserve portfolio double digit.� The weaker� top line and cost inflation has impacted margin and despite cost efficiencies, gross margin was down.� Marketing spend is lower as a result of reduced spend in China and South East Asia.� We have reviewed our investment priorities in these markets to improve returns while also supporting long term growth drivers, such as the premiumisation of scotch and expanding scotch to new consumer occasions in China, and upweighted investment behind Johnnie Walker Red Label in Thailand to encourage consumers to step up to international brands from beer and local spirits.� We have also invested to extend our coverage and influence through route to consumer interventions in a number of markets, and as a result overheads for the region increased, with� operating margin� down 50 basis points.�
�
|
Key financials |
� |
First�half |
� |
Exchange |
� |
Acquisitions |
� |
Organic |
� |
First�half |
� |
Reported |
� |
|
Net sales |
� |
752 |
� |
(26 |
) |
479 |
� |
(39 |
) |
1,166 |
� |
55 |
� |
|
Marketing spend |
� |
170 |
� |
(6 |
) |
28 |
� |
(24 |
) |
168 |
� |
(1 |
) |
|
Operating profit before exceptional items |
� |
193 |
� |
(4 |
) |
39 |
� |
(14 |
) |
214 |
� |
11 |
� |
|
Exceptional items |
� |
� |
� |
� |
� |
� |
� |
� |
� |
(147 |
) |
� |
� |
|
Operating profit |
� |
193 |
� |
� |
� |
� |
� |
� |
� |
67 |
� |
(65 |
) |
�
|
� |
� |
Organic |
� |
Organic |
� |
Reported |
� |
|
� |
� |
volume |
� |
net�sales |
� |
net�sales |
� |
|
� |
� |
movement (a) |
� |
movement |
� |
movement |
� |
|
Markets and categories |
� |
% |
� |
% |
� |
% |
� |
|
Asia Pacific |
� |
(8 |
) |
(5 |
) |
55 |
� |
|
� |
� |
� |
� |
� |
� |
� |
� |
|
South East Asia |
� |
(31 |
) |
(31 |
) |
(33 |
) |
|
Greater China |
� |
(20 |
) |
(3 |
) |
(7 |
) |
|
India |
� |
12 |
� |
6 |
� |
1690 |
� |
|
Global Travel Asia and Middle East |
� |
13 |
� |
12 |
� |
11 |
� |
|
Australia |
� |
(4 |
) |
(1 |
) |
(6 |
) |
|
North Asia |
� |
1 |
� |
4 |
� |
1 |
� |
|
� |
� |
� |
� |
� |
� |
� |
� |
|
Spirits (b) |
� |
(7 |
) |
(7 |
) |
69 |
� |
|
Beer |
� |
(9 |
) |
(4 |
) |
(11 |
) |
|
Ready to drink |
� |
1 |
� |
8 |
� |
1 |
� |
�
|
� |
� |
Organic |
� |
Organic |
� |
Reported |
� |
|
� |
� |
volume |
� |
net�sales |
� |
net�sales |
� |
|
� |
� |
movement (a) |
� |
movement |
� |
movement |
� |
|
Global giants and local stars (b) |
� |
% |
� |
% |
� |
% |
� |
|
Johnnie Walker |
� |
(16 |
) |
(17 |
) |
(19 |
) |
|
Windsor |
� |
(4 |
) |
(2 |
) |
(2 |
) |
|
Smirnoff |
� |
(4 |
) |
(12 |
) |
(15 |
) |
|
Guinness |
� |
(8 |
) |
(2 |
) |
(9 |
) |
|
Bundaberg |
� |
(21 |
) |
(17 |
) |
(22 |
) |
|
Baileys |
� |
(2 |
) |
(11 |
) |
(15 |
) |
�
|
(a) |
Organic equals reported movement for volume except for Asia Pacific 622%,�India 6,707% and spirits 723%, reflecting the full consolidation of USL. |
|
(b) |
Spirits brands excluding ready to drink. |
|
� |
� |
�
|
|
|


�
�
|
� |
In South East Asia net sales were down, as wholesale channels which accounted for 31% of South East Asia�s net sales in the same period last year, saw a decline of over 80%. This decline was as a result of the comparison against the prior period when increased shipments were followed by a period when currency weakness led to a significant reduction in underlying demand. This resulted in higher inventory levels which have now partially reduced. Performance in these channels was also impacted by the transfer of net sales, relating to Indian travel retail customers, to the Global Travel Asia business. In Thailand, net sales declined 13%, lapping a strong first quarter last year when the impact of the excise duty increase and political unrest were not yet affecting performance. The rate of decline in Thailand slowed in the second quarter.� In Indonesia, the beer category declined and Guinness was impacted by consumers trading down to value beer and in Vietnam, net sales declined double digit largely due to pressures on household income and later timing of TET in 2015. |
|
� |
In Greater China, international brands represented 81% of Diageo�s net sales in the half, with Taiwan contributing half of this and following the significant decline of Shuijingfang last year, baijiu now accounts for 19%.� Net sales performance in the second quarter reflected the improved performance of Shuijingfang, up 25%, benefitting from weak performance in the comparable period and the performance of Master Distiller�s No.8 which competes in the premium baijiu segment.� Shuijingfang volumes declined due to lower bulk sales and this was the main driver of positive price/mix for Greater China. In mainland China, scotch was down 22% as the effects of the government�s anti extravagance measures persist.� Closure of traditional� on trade outlets, leading to increased brand competition in the modern on trade, significantly impacted Johnnie Walker Black Label as did a reduction in wholesaler inventory levels. Lower demand for super premium variants impacted Johnnie Walker Blue Label and other ultra premium variants.� Despite the challenging environment in China, Diageo grew share in premium scotch and super premium and above scotch with the launch of Haig Club and growth of scotch malts contributing to this.� In Taiwan, net sales were up 5% driven by continued success of The Singleton which grew its share of whisky. |
|
� |
Diageo India continued to grow, driven by category growth and share gains across scotch and vodka, as the business benefitted from the sales promotion agreement in place with USL since October�2013.� Johnnie Walker Black Label and Double Black led growth, supported by the marketing campaign �Johnnie Walker the Journey�, on trade activations and limited edition packs.� Smirnoff also gained share benefitting from the first marketing campaign for the brand in India, �Unfake It�, and momentum in the flavoured vodka category. |
|
� |
Global Travel Asia and Middle East net sales grew 12%, with 5pps of growth coming from the transfer of sales for some Indian travel retail customers from the South East Asia market.� Johnnie Walker Black Label and Double Black led the growth supported by increased marketing spend and gift with purchase promotions.� Johnnie Walker Blue Label, scotch malts, especially Mortlach, and the launch of Haig Club further contributed to a 14% net sales growth in scotch and increased share.� Growth in travel retail was tempered by the geo political environment in the Middle East, which led to softness in domestic markets. |
|
� |
Australia net sales were down 1%, with 8% growth of ready to drink driving improved performance.� While the ready to drink segment continued to decline and traditional premix offerings such as Bundaberg�& Cola and Johnnie Walker�& Cola were most impacted as increased excise duty adversely impacted the price relative to beer, this was more than offset by innovations in the segment targeted at wine occasions, including the launch of Smirnoff frozen pouches, Smirnoff flavours and Gordon�s 500ml.� This performance and a price increase within the segment drove positive price/mix for the market.� In spirits, Captain Morgan performed strongly with net sales up 61% and share gains of 2.8pps.� Captain Morgan is now the number 2 rum behind Bundaberg and this growth was supported by a significant increase in marketing spend focused on sampling to drive trial.� However, increased pressure on prices led to a decline in spirit net sales of 7%, with Smirnoff and Bundaberg particularly impacted. |
|
� |
North Asia net sales grew 4%, with Guinness up 34% in Korea as it grew share following the introduction of the �Made of More� campaign, in store promotions and expanded outlet coverage.� Innovation also contributed to growth, with the performance of Windsor Black and Haig Club driving growth of scotch in Korea and the launch of Smirnoff Ice flavours driving growth in ready to drink in Japan and Korea.� Decline of whisk(e)y in Japan partially offset this growth, as Johnnie Walker Red Label was impacted by the brand�s price premium to competitors and as a result of the decline of I.W. Harper. |
|
� |
Marketing spend decreased 15%, with a significant reduction in Shui Jing Fang investment and lower spend in international spirits in China and South East Asia.� In mainland China, the 20% reduction in marketing spend� for Johnnie Walker reflects optimised spend in the modern on trade to improve profitability, and a repositioning of some of this spend to launch Johnnie Walker Double Black and to test new campaigns in the more profitable off trade channel to build new occasions for scotch.� Marketing spend in China was also focused on Johnnie Walker Blue Label and the Johnnie Walker Houses with the Johnnie Walker Blue Label ��White Tiger� media campaign and mentoring programme and the addition of the Johnnie Walker House in Chengdu.� In South East Asia, while marketing spend reduced in response to slowing demand, the percentage decline was lower than the net sales decline as the business continued to invest to maintain brand equity and capture sales in the festive season. Ready to drink benefitted from increased marketing spend, supporting the excise duty led price increase and ready to drink innovations in Australia and the earlier phasing of Smirnoff Ice media in Japan to support the launch of new Smirnoff flavour variants in the peak season.� Investment was prioritised to Haig Club in launch markets. |
�
Corporate
�
|
Key financials |
� |
First�half |
� |
Exchange |
� |
Acquisitions |
� |
Organic |
� |
First�half |
� |
Reported |
� |
|
Net sales |
� |
42 |
� |
(2 |
) |
� |
� |
3 |
� |
43 |
� |
2 |
� |
|
Marketing spend |
� |
5 |
� |
� |
� |
� |
� |
(1 |
) |
4 |
� |
(20 |
) |
|
Operating profit before exceptional items |
� |
(67 |
) |
� |
� |
� |
� |
11 |
� |
(56 |
) |
16 |
� |
|
Exceptional items |
� |
� |
� |
� |
� |
� |
� |
� |
� |
(7 |
) |
� |
� |
|
Operating profit |
� |
(67 |
) |
� |
� |
� |
� |
� |
� |
(63 |
) |
6 |
� |
�
�
Category and brand review
�

�
|
� |
� |
Organic |
� |
Organic |
� |
Reported |
� |
|
� |
� |
volume |
� |
net�sales |
� |
net�sales |
� |
|
� |
� |
movement (a) |
� |
movement |
� |
movement |
� |
|
Key categories |
� |
% |
� |
% |
� |
% |
� |
|
Spirits (b) |
� |
(2 |
) |
(1 |
) |
1 |
� |
|
Scotch |
� |
(5 |
) |
(6 |
) |
(19 |
) |
|
North American whiskey |
� |
1 |
� |
3 |
� |
1 |
� |
|
Vodka |
� |
(1 |
) |
4 |
� |
1 |
� |
|
Rum |
� |
(6 |
) |
(2 |
) |
(14 |
) |
|
Liqueurs |
� |
(5 |
) |
(6 |
) |
(11 |
) |
|
Tequila |
� |
32 |
� |
35 |
� |
22 |
� |
|
Gin |
� |
7 |
� |
7 |
� |
2 |
� |
|
Beer |
� |
� |
� |
2 |
� |
(4 |
) |
|
Ready to drink |
� |
(10 |
) |
(1 |
) |
(12 |
) |
|
Wine |
� |
1 |
� |
� |
� |
(4 |
) |
|
Total |
� |
(2 |
) |
� |
� |
(1 |
) |
�
(a)�������� Organic equals reported movement for volume except for total 59%, spirits 74%, ready to drink (14)%, liqueurs (5)%, and tequila (35)%, largely reflecting the full consolidation of USL� and the termination of agency brand distribution agreements, including Jose Cuervo.
(b)�������� Spirits brands excluding ready to drink.
�
|
� |
� |
Organic |
� |
Organic |
� |
Reported |
� |
|
� |
� |
volume |
� |
net�sales |
� |
net�sales |
� |
|
� |
� |
movement (a) |
� |
movement |
� |
movement |
� |
|
Global giants, local stars and reserve (b) |
� |
% |
� |
% |
� |
% |
� |
|
Global giants |
� |
� |
� |
� |
� |
� |
� |
|
Johnnie Walker |
� |
(9 |
) |
(12 |
) |
(18 |
) |
|
Smirnoff |
� |
(3 |
) |
(3 |
) |
(7 |
) |
|
Captain Morgan |
� |
(2 |
) |
(4 |
) |
(7 |
) |
|
Baileys |
� |
(4 |
) |
(5 |
) |
(10 |
) |
|
Tanqueray |
� |
9 |
� |
12 |
� |
9 |
� |
|
Guinness |
� |
(4 |
) |
(4 |
) |
(9 |
) |
|
Local stars |
� |
� |
� |
� |
� |
� |
� |
|
Crown Royal |
� |
1 |
� |
(1 |
) |
(2 |
) |
|
Yen� Raki |
� |
(2 |
) |
10 |
� |
(3 |
) |
|
J�B |
� |
(2 |
) |
(5 |
) |
(10 |
) |
|
Buchanan�s |
� |
(3 |
) |
5 |
� |
(38 |
) |
|
Windsor |
� |
(4 |
) |
(1 |
) |
(1 |
) |
|
Old Parr |
� |
(11 |
) |
(14 |
) |
(47 |
) |
|
Bundaberg |
� |
(21 |
) |
(17 |
) |
(22 |
) |
|
Bells |
� |
(4 |
) |
(4 |
) |
(15 |
) |
|
White Horse |
� |
4 |
� |
(3 |
) |
(21 |
) |
|
Ypioca |
� |
(6 |
) |
(3 |
) |
(11 |
) |
|
Cacique |
� |
(45 |
) |
8 |
� |
(63 |
) |
|
Shui Jing Fang |
� |
170 |
� |
101 |
� |
96 |
� |
|
Reserve |
� |
� |
� |
� |
� |
� |
� |
|
Scotch malts |
� |
8 |
� |
10 |
� |
5 |
� |
|
C�roc |
� |
27 |
� |
27 |
� |
26 |
� |
|
Ketel One vodka |
� |
(2 |
) |
(1 |
) |
(2 |
) |
|
Don Julio |
� |
16 |
� |
21 |
� |
19 |
� |
|
Bulleit |
� |
44 |
� |
57 |
� |
55 |
� |
�
(a)�������� Organic equals reported movement for volume.
(b)�������� Spirits brands excluding ready to drink. See page 37 for a description of brands categorised by Diageo as global giants, local stars and reserve.
�
�
���������������������� Global giants represent 30% of Diageo�s net sales.
�
������������������ Johnnie Walker�s net sales and volume decline was largely driven by currency related inventory reductions in South East Asia and the border zones in West LAC, but it was also impacted by the challenging environment in Russia and Eastern Europe, and the lapping of strong innovation shipments in the United States.� Elsewhere the brand performed well. In Africa net sales were up double digit as Johnnie Walker more than doubled in Angola and delivered strong growth in other African countries, including South Africa where Johnnie Walker Red Label was up 17%.� In Western Europe, soft performance in Spain and Benelux was partially offset by growth of 8% in Great Britain driven by the performance of Johnnie Walker Black and Blue Label.
������������������ Smirnoff net sales declined 3% largely driven by the lapping of high shipments in the prior period in the United States.� However, the relaunch of the brand with new packaging and the marketing campaign �Exclusively for Everybody� and targeted price promotions improved the performance of Smirnoff Red, which gained 0.2pps of share. In Western Europe the brand was impacted by price realignment in Benelux, however it performed well in other countries including Great Britain where Smirnoff Red gained 1.7pps of share. Net sales were down in Australia, due to increased price pressure, but up double digit in Latin America, with a strong performance in Brazil, where net sales grew 24% driven by the launch of the new marketing campaign �Cheers to Real Life�, and in Africa, where net sales of� Smirnoff 1818 in South Africa were up 23%.
������������������ Captain Morgan net sales were down 4% largely driven by the performance of the brand in the United States where it suffered from increased competition in the spiced rum category and lapped the launch of Captain Morgan White Rum last year. Captain Morgan White Rum is performing well as it gained share in the United States and was also launched in Mexico, with further roll outs planned in the second half.� In Great Britain, Captain Morgan net sales grew 6% and the brand gained 1.2pps of share.� In Australia, the brand grew net sales 61% as a result of strong consumer sampling activities.
������������������ Baileys net sales declined 5% as the brand entered the year with high inventory levels�and saw softer depletions in the United States, Greater China and Nigeria. In Western Europe, net sales declined 4% as the brand lapped successful innovation launches in the prior period, however brand equity scores remain strong supported by the�launch of the �Here�s to Us� campaign, celebrating the spirit of women.
������������������ Tanqueray net sales were up 12% with 3pps of positive price/mix, driven by strong double digit growth across Western Europe, particularly Spain and Great Britain.� The �Tonight we Tanqueray� campaign supported the performance of Tanqueray 10, with net sales up double digit in nearly every region.
������������������ Guinness net sales declined 4% primarily driven by weakness in Nigeria where consumers continued to trade down into value lager.� The brand performed well in Africa Regional Markets and Kenya where net sales grew double digit driven by an increased focus on trade visibility. In Great Britain the brand maintained share in a competitive beer category and in Ireland net sales were up 1% and Guinness gained share supported by the �Made of More� campaign.� In the United States, net sales were up 1% driven by the successful launch of Guinness Blonde American Lager.
�
���������������������� Local stars represent 16% of Diageo�s net sales. Performance was mixed with net sales broadly flat. Growth from Buchanan�s, which continued to outperform the category in the United States, and Yen� Raki in Turkey was offset by net sales decline of Old Parr in the border zones in West LAC, while in Venezuela, high inflation and import restrictions impacted demand of imported spirits, led to strong double digit growth of our local portfolio. In Asia Pacific improved performance in baijiu was partially offset by net sales decline from Bundaberg in Australia.
�
���������������������� Reserve brands continued to perform well and net sales grew 10%, driven by the successful launch of C�roc Pineapple in the United States, the strong performance of Bulleit, which outperformed the category and continued to gain share, and the double digit growth of scotch malts. Zacapa also continued to perform well with net sales growth in every region, while net sales in Ketel One vodka declined 1% as the brand was impacted by pricing pressure in the United States.� The recent launch of Haig Club also brought new momentum to the reserve portfolio accessing new consumers and occasions in the markets where it was launched.� Don Julio net sales grew 21% and the brand continued to gain share in the fast growing super premium tequila category in the United States.
�
Other Key Highlights
�
������������������ Spirits represent 72% of Diageo�s net sales, with net sales down 1% largely driven by inventory reductions in South East Asia and the border zones in West LAC and the challenging environment in Russia and Eastern Europe.
������������������ Scotch represents 26% of Diageo�s net sales. Performance was strong in Africa, where net sales were up double digit, however the category was impacted by the inventory reductions in South East Asia and West LAC and overall net sales declined 6%. Johnnie Walker�s performance was soft, while Buchanan�s in the United States, scotch malts, Haig Club and The Singleton all performed strongly.
������������������ North American whiskey represents 6% of Diageo�s net sales and grew 3%, delivering 1.6pps of positive price/mix.� The performance was mostly driven by Bulleit with net sales up 57%.� Crown Royal net sales declined 1% as it lapped innovation launches in the comparable period last year, partially offset by the successful launch of Crown Royal Regal Apple.
������������������ Vodka represents 13% of Diageo�s net sales and grew 4%, delivering 5.4pps of positive price/mix, mainly driven by the strong performance of C�roc in the United States, Africa and Western Europe.� In the United States, the successful launch of C�roc Pineapple supported by increasing marketing investment, partially offset a soft performance by Smirnoff.
������������������ Beer, which represents 17% of Diageo�s net sales, grew 2% and delivered 2.1pps of positive price/mix.� Beer in Africa was up 5% driven by an improved performance in Africa Regional Markets and a double digit growth of Tusker and Guinness in East Africa.� In Nigeria the successful launch of Orijin offset the decline of Harp and Guinness.� Elsewhere performance of Guinness was good with improvement in Ireland and DGUSA, driven by the launch of Guinness Blonde American Lager.
������������������ Ready to drink represents 5% of Diageo�s with net sales down 1% as the impact of the fall in production volumes of Smirnoff Ice Double Black and Guarana in South Africa was partially offset by growth in Australia, largely driven by innovation, and also positive performance of Smirnoff Ice in Brazil and Kenya.� In Great Britain, net sales were up 23% driven by good performance of ready to drink cans and pouches.
������������������ Wine represents 4% of Diageo�s net sales and was broadly flat.� In the United States, net sales grew 2% mainly driven by innovation and growth in the premium segment. In Western Europe, net sales grew 1%, driven by good performance in [yellow tail].
�
�
LIQUIDITY AND CAPITAL RESOURCES
�
The primary source of the group�s liquidity has been cash generated from operations. These funds have generally been used to pay interest, taxes and dividends, and to fund capital expenditure and acquisitions.
�
Analysis of cash flow, movement in net borrowings and equity
�
For an analysis of movement in net borrowings, movement in equity and post-employment deficit please refer to pages 17-18. For an analysis of free cash flow please refer to page 14.
�
Analysis of borrowings
�
The group policy with regard to the expected maturity profile of borrowings of group finance companies is to limit the proportion of such borrowings maturing within 12 months to 50% of gross borrowings less money market demand deposits, and the level of commercial paper to 30% of gross borrowings less money market demand deposits. In addition, it is group policy to maintain backstop facility terms from relationship banks to support commercial paper obligations.
�
The group�s net borrowings and gross borrowings in the tables below are measured at amortised cost with the exception of borrowings designated in fair value hedge relationships, interest rate hedging instruments and foreign currency swaps and forwards. For borrowings designated in fair value hedge relationships, Diageo recognises a fair value adjustment for the risk being hedged in the balance sheet, whereas interest rate hedging instruments and foreign currency swaps and forwards are measured at fair value. Net borrowings, reported on this basis, comprise the following:
�
|
� |
� |
31�December |
� |
|
� |
� |
2014 |
� |
|
� |
� |
� million |
� |
|
Overdrafts |
� |
(117 |
) |
|
Other borrowings due within one year |
� |
(2,728 |
) |
|
Borrowings due within one year |
� |
(2,845 |
) |
|
Borrowings due between one and three years |
� |
(2,452 |
) |
|
Borrowings due between three and five years |
� |
(1,625 |
) |
|
Borrowings due after five years |
� |
(4,441 |
) |
|
Fair value of foreign currency forwards and swaps |
� |
170 |
� |
|
Fair value of interest rate hedging instruments |
� |
(1 |
) |
|
Finance lease obligations |
� |
(276 |
) |
|
Gross borrowings |
� |
(11,470 |
) |
|
Offset by: |
� |
� |
� |
|
Cash and cash equivalents |
� |
802 |
� |
|
Net borrowings |
� |
(10,668 |
) |
�
The group�s gross borrowings and cash and cash equivalents at 31 December�2014 were denominated in the following currencies:
�
|
� |
� |
Total |
� |
US |
� |
Sterling |
� |
Euro |
� |
Indian |
� |
Korean |
� |
Venezuelan |
� |
Other* |
� |
|
� |
� |
� million |
� |
% |
� |
% |
� |
% |
� |
% |
� |
% |
� |
% |
� |
% |
� |
|
Gross borrowings ** |
� |
(11,470 |
) |
22 |
� |
52 |
� |
17 |
� |
4 |
� |
2 |
� |
� |
� |
3 |
� |
|
Cash and cash equivalents |
� |
802 |
� |
11 |
� |
5 |
� |
6 |
� |
2 |
� |
29 |
� |
11 |
� |
36 |
� |
�
* �������� No currency included within the other category exceeds 10% of the total cash and cash equivalents balance.
**� Including foreign exchange forwards and swaps.
�
Based on average monthly net borrowings and net interest charge, the effective interest rate for the six months ended 31 December 2014 was 3.7%. For this calculation, net interest charge excludes fair value adjustments to derivative financial instruments and borrowings and average monthly net borrowings include the impact of interest rate swaps that are no longer in a hedge relationship but exclude the market value adjustment for cross currency interest rate swaps.
�
In the six months ended 31 December 2014, the group repaid bonds of �1,000 million (�792 million) and issued bonds of �1,000 million (�791 million). In the comparable period, the group repaid bonds of �1,150 million (�983 million). A bond of �370 million acquired on the purchase of USL was repaid using the proceeds from the sale of the Whyte and Mackay Group.
�
The �1,818 million increase in net borrowings from 30 June 2014 to 31 December 2014 was principally the result of �801 million equity dividends paid, a net �661 million paid on the acquisition of United Spirits Limited (USL) less proceeds received from the sale of the Whyte and Mackay Group, borrowings acquired on the acquisition of USL of �849 million and �143 million adverse exchange movements partially offset by free cash flow of �699 million.
�
The group issues short term commercial paper regularly in order to finance its day-to-day operations.
�
The group had available undrawn committed bank facilities as follows:
�
|
� |
� |
31�December |
� |
|
� |
� |
2014 |
� |
|
� |
� |
� million |
� |
|
Expiring within one year |
� |
401 |
� |
|
Expiring between one and two years |
� |
692 |
� |
|
Expiring after two years |
� |
1,151 |
� |
|
� |
� |
2,244 |
� |
�
�
These facilities can be used for general corporate purposes and, together with cash and cash equivalents, support the group�s commercial paper programmes.
�
There are no financial covenants on the group�s material short and long term borrowings. However, certain of these borrowings contain cross default provisions, covenants on pari passu ranking, negative pledges and restrictions on certain sale and leaseback transactions.
�
The committed bank facilities are subject to a single financial covenant, being minimum interest cover ratio of two times (defined as the ratio of operating profit before exceptional items, aggregated with share of after tax results of associates and joint ventures, to net interest). They are also subject to pari passu ranking and negative pledge covenants.
�
Any non-compliance with covenants underlying Diageo�s financing arrangements could, if not waived, constitute an event of default with respect to any such arrangements, and any non-compliance with covenants may, in particular circumstances, lead to an acceleration of maturity on certain borrowings and the inability to access committed facilities. Diageo was in full compliance with its financial and other covenants throughout each of the years presented.
�
Capital management
�
The group�s management is committed to enhancing shareholder value in the long term, both by investing in the businesses and brands so as to deliver continued improvement in the return from those investments and by managing the capital structure. Diageo manages its capital structure to achieve capital efficiency, provide flexibility to invest through the economic cycle and give efficient access to debt markets at attractive cost levels. This is achieved by targeting a net borrowing to EBITDA leverage of 2.5 � 3.0x, this range for Diageo being currently broadly consistent with an A band credit rating. Diageo has and would in the future consider operating outside of this range in order to effect strategic initiatives within its stated goals, which could have an impact on its rating. It is Diageo�s current policy that in the event that the financing of an acquisition negatively impacts Diageo�s leverage, it will seek over time to return to the range of 2.5 � 3.0x. The group regularly assesses its debt and equity capital levels against its stated policy for capital structure. For this calculation net borrowings is adjusted by the pension deficit whilst EBITDA equals operating profit less exceptional operating items and depreciation, amortisation and impairment and includes share of after tax results of associates and joint ventures.
�
Capital repayments
�
Authorisation was given by shareholders on 18 September�2014 to purchase a maximum of 251,215,000 shares at a minimum price of 28101/108�pence and a maximum price of the higher of (a)�105% of the average of the middle market quotations for an ordinary share for the five preceding business days and (b)�the higher of the price of the last independent trade and the highest current independent bid on the London Stock Exchange at the time the purchase is carried out. The programme expires at the conclusion of the next Annual General Meeting or on 17 December 2015, if earlier.
�
OFF-BALANCE SHEET ARRANGEMENTS
�
Neither Diageo plc nor any member of the Diageo group has any off-balance sheet financing arrangements that currently have or are reasonably likely to have a material future effect on the group�s financial condition, changes in financial condition, results of operations, liquidity, capital expenditure or capital resources.
�
DEFINITIONS AND RECONCILIATION OF NON-GAAP MEASURES TO GAAP MEASURES
�
Diageo�s strategic planning process is based on the following non-GAAP measures. They are chosen for planning and reporting, and some of them are used for incentive purposes. The group�s management believes these measures provide valuable additional information for users of the financial statements in understanding the group�s performance. These non-GAAP measures should be viewed as complementary to, and not replacements for, the comparable GAAP measures and reported movements therein.
�
Volume
�
Volume is a non-GAAP measure that is measured on an equivalent units basis to nine-litre cases of spirits. An equivalent unit represents one nine-litre case of spirits, which is approximately 272 servings. A serving comprises 33ml of spirits, 165ml of wine, or 330ml of ready to drink or beer. Therefore, to convert volume of products other than spirits to equivalent units, the following guide has been used: beer in hectolitres divide by 0.9; wine in nine-litre cases, divide by five; ready to drink in nine-litre cases, divide by 10; and certain pre-mixed products that are classified as ready to drink in nine-litre cases, divide by five.
�
Organic movements
�
In the discussion of the performance of the business, �organic� information is presented using pounds sterling amounts on a constant currency basis excluding the impact of exceptional items and acquisitions and disposals. Organic measures enable users to focus on the performance of the business which is common to both periods and which represents those measures that local managers are most directly able to influence.
�
�
Calculation of organic movements
�
The organic movement percentage is the amount in the row headed �Organic movement� in the tables below, expressed as a percentage of the amount in the row headed �2013 adjusted�. Organic operating margin is calculated by dividing operating profit before exceptional items by net sales after excluding the impact of exchange rate movements and acquisitions and disposals.
�
(a) Exchange rates
�
�Exchange� in the organic movement calculation reflects the adjustment to recalculate the prior period results as if they had been generated at the current period�s exchange rates.
�
Exchange impacts in respect of the external hedging of intergroup sales of products and the inter group recharging of third party services are allocated to the geographical segment to which they relate. Residual exchange impacts are reported in Corporate.
�
(b) Acquisitions and disposals
�
For acquisitions in the current period, the post acquisition results are excluded from the organic movement calculations. For acquisitions in the prior period, post acquisition results are included in full in the prior period but are included in�the organic movement calculation from the anniversary of the acquisition date in the current period. The acquisition row also eliminates the impact of transaction costs that have been charged to operating profit in the current or prior period in respect of acquisitions that, in management�s judgement, are expected to complete.
�
Where a business, brand, brand distribution right or agency agreement was disposed of, or terminated, in the current or prior period, the group, in the organic movement calculations, excludes the results for that business from the current and prior period. In the calculation of operating profit, the overheads included in disposals are only those directly attributable to the businesses disposed of, and do not result from subjective judgements of management.
�
(c) Exceptional items
�
Exceptional items are those which, in management�s judgement, need to be disclosed by virtue of their size or incidence in order for the user to obtain a proper understanding of the financial information. Such items are included within the income statement caption to which they relate but are excluded from the organic movement calculations.
�
Organic movement calculations for the six months ended 31 December 2014 were as follows:
�
|
� |
� |
North |
� |
Europe |
� |
Africa |
� |
Latin�America |
� |
Asia |
� |
Corporate |
� |
Total |
� |
|
Volume (equivalent units) |
� |
� |
� |
� |
� |
� |
� |
� |
� |
� |
� |
� |
� |
� |
� |
|
2013 reported (restated) |
� |
26.5 |
� |
24.3 |
� |
12.8 |
� |
12.5 |
� |
8.2 |
� |
� |
� |
84.3 |
� |
|
Disposals** |
� |
(0.4 |
) |
(0.1 |
) |
� |
� |
� |
� |
� |
� |
� |
� |
(0.5 |
) |
|
2013 adjusted |
� |
26.1 |
� |
24.2 |
� |
12.8 |
� |
12.5 |
� |
8.2 |
� |
� |
� |
83.8 |
� |
|
Acquisitions and disposals** |
� |
0.1 |
� |
� |
� |
� |
� |
� |
� |
51.8 |
� |
� |
� |
51.9 |
� |
|
Organic movement |
� |
(0.6 |
) |
(0.2 |
) |
1.1 |
� |
(1.3 |
) |
(0.6 |
) |
� |
� |
(1.6 |
) |
|
2014 reported |
� |
25.6 |
� |
24.0 |
� |
13.9 |
� |
11.2 |
� |
59.4 |
� |
� |
� |
134.1 |
� |
|
Organic movement % |
� |
(2 |
) |
(1 |
) |
9 |
� |
(10 |
) |
(7 |
) |
n/a |
� |
(2 |
) |
�
|
� |
� |
North |
� |
Europe |
� |
Africa |
� |
Latin America |
� |
Asia |
� |
Corporate |
� |
Total |
� |
|
Sales |
� |
� |
� |
� |
� |
� |
� |
� |
� |
� |
� |
� |
� |
� |
� |
|
2013 reported (restated) |
� |
2,149 |
� |
2,707 |
� |
1,002 |
� |
1,102 |
� |
1,012 |
� |
42 |
� |
8,014 |
� |
|
Exchange* |
� |
(27 |
) |
(156 |
) |
(87 |
) |
(327 |
) |
(39 |
) |
(1 |
) |
(637 |
) |
|
Disposals** |
� |
(24 |
) |
(7 |
) |
� |
� |
� |
� |
� |
� |
� |
� |
(31 |
) |
|
2013 adjusted |
� |
2,098 |
� |
2,544 |
� |
915 |
� |
775 |
� |
973 |
� |
41 |
� |
7,346 |
� |
|
Acquisitions and disposals** |
� |
9 |
� |
1 |
� |
� |
� |
� |
� |
1,246 |
� |
� |
� |
1,256 |
� |
|
Organic movement |
� |
(5 |
) |
51 |
� |
77 |
� |
11 |
� |
(14 |
) |
2 |
� |
122 |
� |
|
2014 reported |
� |
2,102 |
� |
2,596 |
� |
992 |
� |
786 |
� |
2,205 |
� |
43 |
� |
8,724 |
� |
|
Organic movement % |
� |
� |
� |
2 |
� |
8 |
� |
1 |
� |
(1 |
) |
5 |
� |
2 |
� |
|
� |
� |
� |
� |
� |
� |
� |
� |
� |
� |
� |
� |
� |
� |
� |
� |
|
Net sales |
� |
� |
� |
� |
� |
� |
� |
� |
� |
� |
� |
� |
� |
� |
� |
|
2013 reported (restated) |
� |
1,904 |
� |
1,560 |
� |
774 |
� |
900 |
� |
752 |
� |
42 |
� |
5,932 |
� |
|
Exchange* |
� |
(25 |
) |
(92 |
) |
(66 |
) |
(277 |
) |
(26 |
) |
(2 |
) |
(488 |
) |
|
Disposals** |
� |
(19 |
) |
(5 |
) |
� |
� |
� |
� |
� |
� |
� |
� |
(24 |
) |
|
2013 adjusted |
� |
1,860 |
� |
1,463 |
� |
708 |
� |
623 |
� |
726 |
� |
40 |
� |
5,420 |
� |
|
Acquisitions and disposals** |
� |
8 |
� |
� |
� |
� |
� |
� |
� |
479 |
� |
� |
� |
487 |
� |
|
Organic movement |
� |
(1 |
) |
(4 |
) |
38 |
� |
(4 |
) |
(39 |
) |
3 |
� |
(7 |
) |
|
2014 reported |
� |
1,867 |
� |
1,459 |
� |
746 |
� |
619 |
� |
1,166 |
� |
43 |
� |
5,900 |
� |
|
Organic movement % |
� |
� |
� |
� |
� |
5 |
� |
(1 |
) |
(5 |
) |
8 |
� |
� |
� |
�
�
|
� |
� |
North |
� |
Europe |
� |
Africa |
� |
Latin�America |
� |
Asia |
� |
Corporate |
� |
Total |
� |
|
Marketing |
� |
� |
� |
� |
� |
� |
� |
� |
� |
� |
� |
� |
� |
� |
� |
|
2013 reported (restated) |
� |
293 |
� |
231 |
� |
81 |
� |
123 |
� |
170 |
� |
5 |
� |
903 |
� |
|
Exchange* |
� |
(4 |
) |
(12 |
) |
(5 |
) |
(16 |
) |
(6 |
) |
� |
� |
(43 |
) |
|
Disposals** |
� |
� |
� |
� |
� |
� |
� |
� |
� |
� |
� |
� |
� |
� |
� |
|
2013 adjusted |
� |
289 |
� |
219 |
� |
76 |
� |
107 |
� |
164 |
� |
5 |
� |
860 |
� |
|
Acquisitions and disposals** |
� |
7 |
� |
� |
� |
� |
� |
� |
� |
28 |
� |
� |
� |
35 |
� |
|
Organic movement |
� |
8 |
� |
6 |
� |
9 |
� |
3 |
� |
(24 |
) |
(1 |
) |
1 |
� |
|
2014 reported |
� |
304 |
� |
225 |
� |
85 |
� |
110 |
� |
168 |
� |
4 |
� |
896 |
� |
|
Organic movement % |
� |
3 |
� |
3 |
� |
12 |
� |
3 |
� |
(15 |
) |
(20 |
) |
� |
� |
|
� |
� |
� |
� |
� |
� |
� |
� |
� |
� |
� |
� |
� |
� |
� |
� |
|
Operating profit before exceptional items |
� |
� |
� |
� |
� |
� |
� |
� |
� |
� |
� |
� |
� |
� |
� |
|
2013 reported (restated) |
� |
851 |
� |
509 |
� |
188 |
� |
386 |
� |
193 |
� |
(67 |
) |
2,060 |
� |
|
Exchange* |
� |
(21 |
) |
(31 |
) |
(20 |
) |
(192 |
) |
(4 |
) |
� |
� |
(268 |
) |
|
Acquisitions and disposals** |
� |
4 |
� |
(1 |
) |
� |
� |
� |
� |
8 |
� |
� |
� |
11 |
� |
|
2013 adjusted |
� |
834 |
� |
477 |
� |
168 |
� |
194 |
� |
197 |
� |
(67 |
) |
1,803 |
� |
|
Acquisitions and disposals** |
� |
(8 |
) |
� |
� |
� |
� |
� |
� |
31 |
� |
� |
� |
23 |
� |
|
Organic movement |
� |
(7 |
) |
3 |
� |
7 |
� |
13 |
� |
(14 |
) |
11 |
� |
13 |
� |
|
2014 reported |
� |
819 |
� |
480 |
� |
175 |
� |
207 |
� |
214 |
� |
(56 |
) |
1,839 |
� |
|
Organic movement % |
� |
(1 |
) |
1 |
� |
4 |
� |
7 |
� |
(7 |
) |
16 |
� |
1 |
� |
|
� |
� |
� |
� |
� |
� |
� |
� |
� |
� |
� |
� |
� |
� |
� |
� |
|
Organic operating margin % |
� |
� |
� |
� |
� |
� |
� |
� |
� |
� |
� |
� |
� |
� |
� |
|
2014 |
� |
44.5% |
� |
32.9% |
� |
23.5% |
� |
33.4% |
� |
26.6% |
� |
n/a |
� |
33.5% |
� |
|
2013 |
� |
44.8% |
� |
32.6% |
� |
23.7% |
� |
31.1% |
� |
27.1% |
� |
n/a |
� |
33.3% |
� |
|
Margin improvement (bps) |
� |
(35 |
) |
30 |
� |
(27 |
) |
230 |
� |
(50 |
) |
n/a |
� |
28 |
� |
�
������������������ For the reconciliation of sales to net sales and operating profit before exceptional items to operating profit see page 15 and page F-8.
�
Notes: Information in respect of the organic movement calculations
�
*����������� The exchange adjustments for sales, net sales, marketing and operating profit are principally in respect of the Venezuelan bolivar, the Russian rouble and the euro.
**���� In the six months ended 31 December 2014 the acquisitions and disposals that affected volume, sales, net sales, marketing and operating profit were as follows:
�
|
� |
� |
� |
� |
� |
� |
� |
� |
� |
� |
Operating |
� |
|
� |
� |
Volume |
� |
Sales |
� |
Net�sales |
� |
Marketing |
� |
profit |
� |
|
� |
� |
units�million |
� |
� million |
� |
� million |
� |
� million |
� |
� million |
� |
|
Six months ended 31 December 2013 |
� |
� |
� |
� |
� |
� |
� |
� |
� |
� |
� |
|
Acquisitions |
� |
� |
� |
� |
� |
� |
� |
� |
� |
� |
� |
|
Transaction costs |
� |
� |
� |
� |
� |
� |
� |
� |
� |
2 |
� |
|
Integration costs |
� |
� |
� |
� |
� |
� |
� |
� |
� |
8 |
� |
|
� |
� |
� |
� |
� |
� |
� |
� |
� |
� |
10 |
� |
|
Disposals |
� |
� |
� |
� |
� |
� |
� |
� |
� |
� |
� |
|
Jose Cuervo |
� |
(0.4 |
) |
(25 |
) |
(19 |
) |
� |
� |
3 |
� |
|
Other disposals |
� |
(0.1 |
) |
(6 |
) |
(5 |
) |
� |
� |
(2 |
) |
|
� |
� |
(0.5 |
) |
(31 |
) |
(24 |
) |
� |
� |
1 |
� |
|
� |
� |
� |
� |
� |
� |
� |
� |
� |
� |
� |
� |
|
Acquisitions and disposals |
� |
(0.5 |
) |
(31 |
) |
(24 |
) |
� |
� |
11 |
� |
|
� |
� |
� |
� |
� |
� |
� |
� |
� |
� |
� |
� |
|
Six months ended 31 December 2014 |
� |
� |
� |
� |
� |
� |
� |
� |
� |
� |
� |
|
Acquisitions |
� |
� |
� |
� |
� |
� |
� |
� |
� |
� |
� |
|
United Spirits Limited |
� |
51.8 |
� |
1,246 |
� |
479 |
� |
28 |
� |
31 |
� |
|
DeLe�n |
� |
� |
� |
5 |
� |
5 |
� |
7 |
� |
(8 |
) |
|
� |
� |
51.8 |
� |
1,251 |
� |
484 |
� |
35 |
� |
23 |
� |
|
Disposals |
� |
� |
� |
� |
� |
� |
� |
� |
� |
� |
� |
|
Jose Cuervo |
� |
0.1 |
� |
4 |
� |
3 |
� |
� |
� |
� |
� |
|
Other disposals |
� |
� |
� |
1 |
� |
� |
� |
� |
� |
� |
� |
|
� |
� |
0.1 |
� |
5 |
� |
3 |
� |
� |
� |
� |
� |
|
� |
� |
� |
� |
� |
� |
� |
� |
� |
� |
� |
� |
|
Acquisitions and disposals |
� |
51.9 |
� |
1,256 |
� |
487 |
� |
35 |
� |
23 |
� |
�
�
Revised segmental information for the six months ended 31 December 2013
�
In the six months ended 31 December 2014 Diageo changed its internal reporting structure to reflect changes made to management responsibilities as announced on 30 July 2014. As a result of this change, Diageo reports the following geographical segments both for management reporting purposes and in the external financial statements: North America; Europe; Africa; Latin America and Caribbean; Asia Pacific and Corporate. The reconciliation to previously reported figures for volume, net sales, marketing spend and operating profit before exceptional items for the six months ended 31 December 2013 is as follows:
�
|
� |
� |
As�reported |
� |
Reclass |
� |
Restated |
� |
|
Volume�(equivalent�units) |
� |
million |
� |
million |
� |
million |
� |
|
� |
� |
� |
� |
� |
� |
� |
� |
|
North America |
� |
26.5 |
� |
� |
� |
26.5 |
� |
|
Europe |
� |
� |
� |
24.3 |
� |
24.3 |
� |
|
Western Europe |
� |
17.7 |
� |
(17.7 |
) |
� |
� |
|
Africa |
� |
� |
� |
12.8 |
� |
12.8 |
� |
|
Africa, Eastern Europe and Turkey |
� |
19.4 |
� |
(19.4 |
) |
� |
� |
|
Latin America and Caribbean |
� |
12.5 |
� |
� |
� |
12.5 |
� |
|
Asia Pacific |
� |
8.2 |
� |
� |
� |
8.2 |
� |
|
� |
� |
84.3 |
� |
� |
� |
84.3 |
� |
�
|
� |
� |
As�reported |
� |
Reclass |
� |
Restated |
� |
|
Sales |
� |
� million |
� |
� million |
� |
� million |
� |
|
� |
� |
� |
� |
� |
� |
� |
� |
|
North America |
� |
2,149 |
� |
� |
� |
2,149 |
� |
|
Europe |
� |
� |
� |
2,707 |
� |
2,707 |
� |
|
Western Europe |
� |
1,970 |
� |
(1,970 |
) |
� |
� |
|
Africa |
� |
� |
� |
1,002 |
� |
1,002 |
� |
|
Africa, Eastern Europe and Turkey |
� |
1,739 |
� |
(1,739 |
) |
� |
� |
|
Latin America and Caribbean |
� |
1,102 |
� |
� |
� |
1,102 |
� |
|
Asia Pacific |
� |
1,012 |
� |
� |
� |
1,012 |
� |
|
Corporate |
� |
42 |
� |
� |
� |
42 |
� |
|
� |
� |
8,014 |
� |
� |
� |
8,014 |
� |
�
|
� |
� |
As�reported |
� |
Reclass |
� |
Restated |
� |
|
Net sales |
� |
� million |
� |
� million |
� |
� million |
� |
|
� |
� |
� |
� |
� |
� |
� |
� |
|
North America |
� |
1,904 |
� |
� |
� |
1,904 |
� |
|
Europe |
� |
� |
� |
1,560 |
� |
1,560 |
� |
|
Western Europe |
� |
1,179 |
� |
(1,179 |
) |
� |
� |
|
Africa |
� |
� |
� |
774 |
� |
774 |
� |
|
Africa, Eastern Europe and Turkey |
� |
1,155 |
� |
(1,155 |
) |
� |
� |
|
Latin America and Caribbean |
� |
900 |
� |
� |
� |
900 |
� |
|
Asia Pacific |
� |
752 |
� |
� |
� |
752 |
� |
|
Corporate |
� |
42 |
� |
� |
� |
42 |
� |
|
� |
� |
5,932 |
� |
� |
� |
5,932 |
� |
�
|
� |
� |
As�reported |
� |
Reclass |
� |
Restated |
� |
|
Marketing spend |
� |
� million |
� |
� million |
� |
� million |
� |
|
� |
� |
� |
� |
� |
� |
� |
� |
|
North America |
� |
293 |
� |
� |
� |
293 |
� |
|
Europe |
� |
� |
� |
231 |
� |
231 |
� |
|
Western Europe |
� |
177 |
� |
(177 |
) |
� |
� |
|
Africa |
� |
� |
� |
81 |
� |
81 |
� |
|
Africa, Eastern Europe and Turkey |
� |
135 |
� |
(135 |
) |
� |
� |
|
Latin America and Caribbean |
� |
123 |
� |
� |
� |
123 |
� |
|
Asia Pacific |
� |
170 |
� |
� |
� |
170 |
� |
|
Corporate |
� |
5 |
� |
� |
� |
5 |
� |
|
� |
� |
903 |
� |
� |
� |
903 |
� |
�
|
Operating�profit�before |
� |
As�reported |
� |
Reclass |
� |
Restated |
� |
|
exceptional�items |
� |
� million |
� |
� million |
� |
� million |
� |
|
� |
� |
� |
� |
� |
� |
� |
� |
|
North America |
� |
851 |
� |
� |
� |
851 |
� |
|
Europe |
� |
� |
� |
509 |
� |
509 |
� |
|
Western Europe |
� |
370 |
� |
(370 |
) |
� |
� |
|
Africa |
� |
� |
� |
188 |
� |
188 |
� |
|
Africa, Eastern Europe and Turkey |
� |
327 |
� |
(327 |
) |
� |
� |
|
Latin America and Caribbean |
� |
386 |
� |
� |
� |
386 |
� |
|
Asia Pacific |
� |
193 |
� |
� |
� |
193 |
� |
|
Corporate |
� |
(67 |
) |
� |
� |
(67 |
) |
|
� |
� |
2,060 |
� |
� |
� |
2,060 |
� |
�
�
Earnings per share before exceptional items
�
Earnings per share before exceptional items is calculated by dividing profit attributable to equity shareholders of the parent company before exceptional items by the weighted average number of shares in issue.
�
Earnings per share before exceptional items for the six months ended 31 December�2014 and 31 December�2013 are set out in the table below.
�
|
� |
� |
2014 |
� |
2013 |
� |
|
� |
� |
� million |
� |
� million |
� |
|
� |
� |
� |
� |
� |
� |
|
Profit attributable to equity shareholders of the parent company |
� |
1,311 |
� |
1,599 |
� |
|
Exceptional operating items attributable to equity shareholders of the parent company |
� |
170 |
� |
20 |
� |
|
Non-operating items |
� |
(98 |
) |
(138 |
) |
|
Tax in respect of exceptional operating and non-operating items |
� |
(38 |
) |
(3 |
) |
|
Discontinued operations |
� |
� |
� |
92 |
� |
|
� |
� |
1,345 |
� |
1,570 |
� |
|
� |
� |
� |
� |
� |
� |
|
� |
� |
million |
� |
million |
� |
|
Weighted average number of shares in issue |
� |
2,506 |
� |
2,507 |
� |
|
� |
� |
� |
� |
� |
� |
|
� |
� |
pence |
� |
pence |
� |
|
Earnings per share before exceptional items |
� |
53.7 |
� |
62.6 |
� |
�
Free cash flow
�
Free cash flow comprises the net cash flow from operating activities aggregated with the net movements in loans receivable and other investments and with the net purchase of property, plant and equipment and computer software that are included in net cash flow from investing activities.
�
The remaining components of net cash flow from investing activities that do not form part of free cash flow, as defined by the group�s management, are in respect of the acquisition and sale of businesses.
�
The group�s management regards the purchase and disposal of property, plant and equipment and computer software as ultimately non-discretionary since ongoing investment in plant, machinery and technology is required to support the day-to-day operations, whereas acquisitions and sales of businesses are discretionary.
�
Where appropriate, separate explanations are given for the impacts of acquisitions and sale of businesses, dividends paid and the purchase of own shares, each of which arises from decisions that are independent from the running of the ongoing underlying business.
�
Free cash flow reconciliations for the six months ended 31 December�2014 and 31 December�2013 are set out in the table below:
�
|
� |
� |
Six�months�ended |
� |
Six�months�ended |
� |
|
� |
� |
31�December�2014 |
� |
31�December�2013 |
� |
|
� |
� |
� million |
� |
� million |
� |
|
� |
� |
� |
� |
� |
� |
|
Net cash from operating activities |
� |
957 |
� |
606 |
� |
|
Disposal of property, plant and equipment and computer software |
� |
36 |
� |
64 |
� |
|
Purchase of property, plant and equipment and computer software |
� |
(270 |
) |
(343 |
) |
|
Movements in loans and other investments |
� |
(24 |
) |
(1 |
) |
|
Free cash flow |
� |
699 |
� |
326 |
� |
�
Return on average total invested capital
�
Return on average total invested capital is used by management to assess the return obtained from the group�s asset base and is calculated to aid evaluation of the performance of the business.
�
The profit used in assessing the return on average total invested capital reflects operating profit before exceptional items plus share of after tax results of associates and joint ventures after applying the tax rate before exceptional items for the period. Average total invested capital is calculated using the average derived from the consolidated balance sheets at the beginning and end of the period. Average capital employed comprises average net assets for the period, excluding post employment benefit net liabilities (net of deferred tax) and average net borrowings. This average capital employed is then aggregated with the average restructuring and integration costs net of tax, and goodwill written off to reserves at 1�July�2004, the date of transition to IFRS, to obtain the average total invested capital.
�
�
Calculations for the return on average total invested capital for the six months ended 31 December�2014 and 31 December�2013 are set out in the table below:
�
|
� |
� |
2014 |
� |
2013 |
� |
|
� |
� |
� million |
� |
� million |
� |
|
� |
� |
� |
� |
� |
� |
|
Operating profit |
� |
1,668 |
� |
2,040 |
� |
|
Exceptional operating items |
� |
171 |
� |
20 |
� |
|
Share of after tax results of associates and joint ventures |
� |
113 |
� |
181 |
� |
|
Tax at the tax rate before exceptional items of 18.3% (2013 � 19.4%) |
� |
(357 |
) |
(435 |
) |
|
� |
� |
1,595 |
� |
1,806 |
� |
|
� |
� |
� |
� |
� |
� |
|
Average net assets (excluding net post employment liabilities) |
� |
8,649 |
� |
8,468 |
� |
|
Average net borrowings |
� |
9,759 |
� |
8,750 |
� |
|
Average integration and restructuring costs (net of tax) |
� |
1,587 |
� |
1,457 |
� |
|
Goodwill at 1 July�2004 |
� |
1,562 |
� |
1,562 |
� |
|
Adjustment in respect of acquisition of USL |
� |
1,351 |
� |
� |
� |
|
Average total invested capital |
� |
22,908 |
� |
20,237 |
� |
|
� |
� |
� |
� |
� |
� |
|
Return on average total invested capital |
� |
13.9% |
� |
17.8% |
� |
�
Tax rate before exceptional items
�
Tax rate before exceptional items is calculated by dividing the total tax charge on continuing operations before tax charges and credits, classified as or in respect of exceptional items, by profit before taxation adjusted to exclude the impact of exceptional operating and non-operating items, expressed as a percentage. The measure is used by management to assess the rate of tax applied to the group�s continuing operations before tax on exceptional items.
�
The tax rate from continuing operations before exceptional items and the reported tax rate for the six months ended 31 December�2014 and 31 December�2013 are set out in the table below:
�
|
� |
� |
2014 |
� |
2013 |
� |
|
� |
� |
� |
� |
� |
� |
|
Tax before exceptional items (a) |
� |
314 |
� |
391 |
� |
|
Tax in respect of exceptional items |
� |
(38 |
) |
(3 |
) |
|
Taxation on profit from continuing operations (b) |
� |
276 |
� |
388 |
� |
|
� |
� |
� |
� |
� |
� |
|
Profit from continuing operations before taxation and exceptional items (c) |
� |
1,713 |
� |
2,016 |
� |
|
Non-operating items |
� |
98 |
� |
138 |
� |
|
Exceptional operating items |
� |
(171 |
) |
(20 |
) |
|
Profit before taxation (d) |
� |
1,640 |
� |
2,134 |
� |
|
� |
� |
� |
� |
� |
� |
|
Tax rate before exceptional items (a/c) |
� |
18.3% |
� |
19.4% |
� |
|
Reported tax rate (b/d) |
� |
16.8% |
� |
18.2% |
� |
�
Other definitions
�
Volume share is a brand�s retail volume expressed as a percentage of the retail volume of all brands in its segment. Value share is a brand�s retail sales expressed as a percentage of the retail sales of all brands in its segment. Unless otherwise stated, share refers to value share.
�
Net sales are sales less excise duties. Diageo incurs excise duties throughout the world. In some countries excise duties are based on sales and are separately identified on the face of the invoice to the external customer. In others it is effectively a production tax which is incurred when the spirit is removed from bonded warehouses. In these countries excise duties are part of the cost of goods sold and are not separately identified on the sales invoice. Changes in the level of excise duties can significantly affect the level of reported sales and cost of sales without directly reflecting changes in volume, mix or profitability, which are the variables that have an impact on the element of sales retained by the group.
�
Price/mix is the number of percentage points by which the organic movement in net sales exceeds the organic movement in volume. The difference arises because of changes in the composition of sales between higher and lower priced variants/markets or as price changes are implemented.
�
References to emerging markets include Russia, Eastern Europe, Turkey, Africa, Latin America and Caribbean, and Asia Pacific (excluding Australia, Korea and Japan).
�
References to reserve brands include Johnnie Walker Blue Label, Johnnie Walker Green Label, Johnnie Walker Gold Label 18 year old, Johnnie Walker Gold Label Reserve, Johnnie Walker Platinum Label 18 year old, John Walker�& Sons Collection, Johnnie Walker The Gold Route, Johnnie Walker The Royal Route, and other Johnnie Walker super premium brands; The Singleton, Cardhu, Talisker, Lagavulin and other malt brands; Buchanan�s Special Reserve, Buchanan�s Red Seal; Bulleit Bourbon, Bulleit Rye; Tanqueray No.�TEN, Tanqueray Malacca; C�roc, Ketel One vodka; Don Julio, Zacapa, Bundaberg SDlx, Haig Club whiskey and DeLe�n Tequila.
�
References to Global giants include the following brand families: Johnnie Walker, Smirnoff, Captain Morgan, Baileys, Tanqueray and Guinness. Local stars spirits excluding ready to drink include, but are not limited to, Bells, Buchanan�s, Bundaberg, Bulleit, Cacique, Crown Royal, Don Julio, J&B, Old Parr, Yen� Raki, Ketel One vodka, scotch malts, Shui Jing Fang, White Horse, Windsor and Ypi�ca.
�
References to ready to drink� also include ready to serve products, such as pre-mix cans in some markets, and progressive adult beverages in the United States and certain markets supplied by the United States.
�
References to beer include non-alcoholic products such as Guinness Malta and Orijin a flavoured mixed drink.
�
�
NEW INTERNATIONAL FINANCIAL REPORTING STANDARDS
�
A number of IFRS standards and interpretations have been issued by the IASB or IFRIC. Those that are of relevance to the group are discussed in note�1 to the unaudited condensed consolidated financial information.
�
�
INDEX TO THE UNAUDITED CONDENSED FINANCIAL INFORMATION
FOR THE SIX MONTHS ENDED 31 DECEMBER 2014 AND 31 DECEMBER 2013
�
�
The unaudited condensed consolidated financial information was approved by the board of directors on 28 January�2015.
�
�
UNAUDITED CONDENSED CONSOLIDATED INCOME STATEMENT
�
|
� |
� |
� |
� |
Six�months�ended |
� |
Six�months�ended |
� |
|
� |
� |
� |
� |
31�December�2014 |
� |
31�December�2013 |
� |
|
� |
� |
Notes |
� |
� million |
� |
� million |
� |
|
� |
� |
� |
� |
� |
� |
� |
� |
|
Sales |
� |
2 |
� |
8,724 |
� |
8,014 |
� |
|
Excise duties |
� |
� |
� |
(2,824 |
) |
(2,082 |
) |
|
Net sales |
� |
2 |
� |
5,900 |
� |
5,932 |
� |
|
Cost of sales |
� |
� |
� |
(2,428 |
) |
(2,200 |
) |
|
Gross profit |
� |
� |
� |
3,472 |
� |
3,732 |
� |
|
Marketing |
� |
� |
� |
(896 |
) |
(903 |
) |
|
Other operating expenses |
� |
� |
� |
(908 |
) |
(789 |
) |
|
Operating profit |
� |
2 |
� |
1,668 |
� |
2,040 |
� |
|
Non-operating items |
� |
3 |
� |
98 |
� |
138 |
� |
|
Finance income |
� |
4 |
� |
159 |
� |
130 |
� |
|
Finance charges |
� |
4 |
� |
(398 |
) |
(355 |
) |
|
Share of after tax results of associates and joint ventures |
� |
� |
� |
113 |
� |
181 |
� |
|
Profit before taxation |
� |
� |
� |
1,640 |
� |
2,134 |
� |
|
Taxation |
� |
5 |
� |
(276 |
) |
(388 |
) |
|
Profit from continuing operations |
� |
� |
� |
1,364 |
� |
1,746 |
� |
|
Discontinued operations |
� |
3 |
� |
� |
� |
(92 |
) |
|
Profit for the period |
� |
� |
� |
1,364 |
� |
1,654 |
� |
|
� |
� |
� |
� |
� |
� |
� |
� |
|
Attributable to: |
� |
� |
� |
� |
� |
� |
� |
|
Equity shareholders of the parent company |
� |
� |
� |
1,311 |
� |
1,599 |
� |
|
Non-controlling interests |
� |
� |
� |
53 |
� |
55 |
� |
|
� |
� |
� |
� |
1,364 |
� |
1,654 |
� |
|
� |
� |
� |
� |
� |
� |
� |
� |
|
� |
� |
� |
� |
pence |
� |
pence |
� |
|
Basic earnings per share |
� |
� |
� |
� |
� |
� |
� |
|
Continuing operations |
� |
� |
� |
52.3 |
� |
67.5 |
� |
|
Discontinued operations |
� |
� |
� |
� |
� |
(3.7 |
) |
|
� |
� |
� |
� |
52.3 |
� |
63.8 |
� |
|
� |
� |
� |
� |
� |
� |
� |
� |
|
Diluted earnings per share |
� |
� |
� |
� |
� |
� |
� |
|
Continuing operations |
� |
� |
� |
52.2 |
� |
67.2 |
� |
|
Discontinued operations |
� |
� |
� |
� |
� |
(3.7 |
) |
|
� |
� |
� |
� |
52.2 |
� |
63.5 |
� |
|
� |
� |
� |
� |
� |
� |
� |
� |
|
� |
� |
� |
� |
million |
� |
million |
� |
|
Weighted average number of shares |
� |
� |
� |
� |
� |
� |
� |
|
Shares in issue excluding own shares |
� |
� |
� |
2,506 |
� |
2,507 |
� |
|
Dilutive potential ordinary shares |
� |
� |
� |
7 |
� |
13 |
� |
|
� |
� |
� |
� |
2,513 |
� |
2,520 |
� |
�
�
UNAUDITED CONDENSED CONSOLIDATED STATEMENT OF COMPREHENSIVE INCOME
�
|
� |
� |
Six�months�ended |
� |
Six�months�ended |
� |
|
� |
� |
31�December�2014 |
� |
31�December�2013 |
� |
|
� |
� |
� million |
� |
� million |
� |
|
Other comprehensive income |
� |
� |
� |
� |
� |
|
Items that will not be recycled subsequently to the income statement |
� |
� |
� |
� |
� |
|
Net remeasurement of post employment plans |
� |
� |
� |
� |
� |
|
� group |
� |
(337 |
) |
(90 |
) |
|
� associates and joint ventures |
� |
(4 |
) |
1 |
� |
|
Tax on post employment plans |
� |
53 |
� |
11 |
� |
|
� |
� |
(288 |
) |
(78 |
) |
|
Items that may be recycled subsequently to the income statement |
� |
� |
� |
� |
� |
|
Exchange differences on translation of foreign operations excluding borrowings |
� |
� |
� |
� |
� |
|
� group |
� |
384 |
� |
(862 |
) |
|
� non-controlling interests |
� |
83 |
� |
(82 |
) |
|
� associates and joint ventures |
� |
(51 |
) |
(191 |
) |
|
Exchange loss recycled to the income statement in respect of USL |
� |
79 |
� |
� |
� |
|
Exchange differences on borrowings and derivative net investment hedges |
� |
(150 |
) |
365 |
� |
|
Tax on exchange differences on borrowings and derivative net investment hedges |
� |
5 |
� |
(7 |
) |
|
Effective portion of changes in fair value of cash flow hedges |
� |
� |
� |
� |
� |
|
� (losses)/gains to other comprehensive income - group |
� |
(34 |
) |
29 |
� |
|
� (losses)/gains to other comprehensive income - associates and joint ventures |
� |
(2 |
) |
1 |
� |
|
� recycled to income statement |
� |
(96 |
) |
49 |
� |
|
Tax on effective portion of changes in fair value of cash flow hedges |
� |
15 |
� |
2 |
� |
|
Fair value movements on available-for-sale investments |
� |
� |
� |
� |
� |
|
� gains to other comprehensive income - group |
� |
6 |
� |
56 |
� |
|
� gains to other comprehensive income - non-controlling interests |
� |
5 |
� |
� |
� |
|
� recycled to income statement |
� |
� |
� |
(146 |
) |
|
Hyperinflation adjustment |
� |
29 |
� |
51 |
� |
|
Tax on hyperinflation adjustment |
� |
(1 |
) |
(11 |
) |
|
� |
� |
272 |
� |
(746 |
) |
|
Other comprehensive (loss) net of tax, for the period |
� |
(16 |
) |
(824 |
) |
|
Profit for the period |
� |
1,364 |
� |
1,654 |
� |
|
Total comprehensive income for the period |
� |
1,348 |
� |
830 |
� |
|
� |
� |
� |
� |
� |
� |
|
Attributable to: |
� |
� |
� |
� |
� |
|
Equity shareholders of the parent company |
� |
1,207 |
� |
859 |
� |
|
Non-controlling interests |
� |
141 |
� |
(29 |
) |
|
Total comprehensive income for the period |
� |
1,348 |
� |
830 |
� |
�
�
UNAUDITED CONDENSED CONSOLIDATED BALANCE SHEET
�
|
� |
� |
� |
� |
31�December�2014 |
� |
30�June�2014 |
� |
31�December�2013 |
� | ||||||
|
� |
� |
Notes |
� |
� million |
� |
� million |
� |
� million |
� |
� million |
� |
� million |
� |
� million |
� |
|
Non-current assets |
� |
� |
� |
� |
� |
� |
� |
� |
� |
� |
� |
� |
� |
� |
� |
|
Intangible assets |
� |
� |
� |
11,379 |
� |
� |
� |
7,891 |
� |
� |
� |
8,324 |
� |
� |
� |
|
Property, plant and equipment |
� |
� |
� |
3,754 |
� |
� |
� |
3,433 |
� |
� |
� |
3,393 |
� |
� |
� |
|
Biological assets |
� |
� |
� |
66 |
� |
� |
� |
53 |
� |
� |
� |
34 |
� |
� |
� |
|
Investments in associates and joint ventures |
� |
� |
� |
2,491 |
� |
� |
� |
3,201 |
� |
� |
� |
3,329 |
� |
� |
� |
|
Other investments |
� |
� |
� |
161 |
� |
� |
� |
63 |
� |
� |
� |
68 |
� |
� |
� |
|
Other receivables |
� |
� |
� |
52 |
� |
� |
� |
107 |
� |
� |
� |
110 |
� |
� |
� |
|
Other financial assets |
� |
9 |
� |
279 |
� |
� |
� |
250 |
� |
� |
� |
276 |
� |
� |
� |
|
Deferred tax assets |
� |
� |
� |
291 |
� |
� |
� |
246 |
� |
� |
� |
229 |
� |
� |
� |
|
Post employment benefit assets |
� |
� |
� |
137 |
� |
� |
� |
251 |
� |
� |
� |
177 |
� |
� |
� |
|
� |
� |
� |
� |
� |
� |
18,610 |
� |
� |
� |
15,495 |
� |
� |
� |
15,940 |
� |
|
Current assets |
� |
� |
� |
� |
� |
� |
� |
� |
� |
� |
� |
� |
� |
� |
� |
|
Inventories |
� |
6 |
� |
4,597 |
� |
� |
� |
4,222 |
� |
� |
� |
4,320 |
� |
� |
� |
|
Trade and other receivables |
� |
� |
� |
3,462 |
� |
� |
� |
2,499 |
� |
� |
� |
2,957 |
� |
� |
� |
|
Assets held for sale |
� |
12 |
� |
325 |
� |
� |
� |
8 |
� |
� |
� |
8 |
� |
� |
� |
|
Other financial assets |
� |
9 |
� |
114 |
� |
� |
� |
118 |
� |
� |
� |
129 |
� |
� |
� |
|
Cash and cash equivalents |
� |
7 |
� |
802 |
� |
� |
� |
622 |
� |
� |
� |
891 |
� |
� |
� |
|
� |
� |
� |
� |
� |
� |
9,300 |
� |
� |
� |
7,469 |
� |
� |
� |
8,305 |
� |
|
Total assets |
� |
� |
� |
� |
� |
27,910 |
� |
� |
� |
22,964 |
� |
� |
� |
24,245 |
� |
|
Current liabilities |
� |
� |
� |
� |
� |
� |
� |
� |
� |
� |
� |
� |
� |
� |
� |
|
Borrowings and bank overdrafts |
� |
7 |
� |
(2,845 |
) |
� |
� |
(1,576 |
) |
� |
� |
(3,007 |
) |
� |
� |
|
Other financial liabilities |
� |
9 |
� |
(156 |
) |
� |
� |
(146 |
) |
� |
� |
(153 |
) |
� |
� |
|
Trade and other payables |
� |
� |
� |
(3,297 |
) |
� |
� |
(2,800 |
) |
� |
� |
(3,040 |
) |
� |
� |
|
Liabilities held for sale |
� |
12 |
� |
(45 |
) |
� |
� |
� |
� |
� |
� |
� |
� |
� |
� |
|
Corporate tax payable |
� |
� |
� |
(284 |
) |
� |
� |
(197 |
) |
� |
� |
(276 |
) |
� |
� |
|
Provisions |
� |
� |
� |
(188 |
) |
� |
� |
(132 |
) |
� |
� |
(90 |
) |
� |
� |
|
� |
� |
� |
� |
� |
� |
(6,815 |
) |
� |
� |
(4,851 |
) |
� |
� |
(6,566 |
) |
|
Non-current liabilities |
� |
� |
� |
� |
� |
� |
� |
� |
� |
� |
� |
� |
� |
� |
� |
|
Borrowings |
� |
7 |
� |
(8,518 |
) |
� |
� |
(7,638 |
) |
� |
� |
(6,716 |
) |
� |
� |
|
Other financial liabilities |
� |
9 |
� |
(475 |
) |
� |
� |
(447 |
) |
� |
� |
(453 |
) |
� |
� |
|
Other payables |
� |
� |
� |
(83 |
) |
� |
� |
(94 |
) |
� |
� |
(103 |
) |
� |
� |
|
Provisions |
� |
� |
� |
(251 |
) |
� |
� |
(253 |
) |
� |
� |
(268 |
) |
� |
� |
|
Deferred tax liabilities |
� |
� |
� |
(2,147 |
) |
� |
� |
(1,365 |
) |
� |
� |
(1,437 |
) |
� |
� |
|
Post employment benefit liabilities |
� |
� |
� |
(925 |
) |
� |
� |
(726 |
) |
� |
� |
(664 |
) |
� |
� |
|
� |
� |
� |
� |
� |
� |
(12,399 |
) |
� |
� |
(10,523 |
) |
� |
� |
(9,641 |
) |
|
Total liabilities |
� |
� |
� |
� |
� |
(19,214 |
) |
� |
� |
(15,374 |
) |
� |
� |
(16,207 |
) |
|
Net assets |
� |
� |
� |
� |
� |
8,696 |
� |
� |
� |
7,590 |
� |
� |
� |
8,038 |
� |
|
� |
� |
� |
� |
� |
� |
� |
� |
� |
� |
� |
� |
� |
� |
� |
� |
|
Equity |
� |
� |
� |
� |
� |
� |
� |
� |
� |
� |
� |
� |
� |
� |
� |
|
Share capital |
� |
� |
� |
797 |
� |
� |
� |
797 |
� |
� |
� |
797 |
� |
� |
� |
|
Share premium |
� |
� |
� |
1,345 |
� |
� |
� |
1,345 |
� |
� |
� |
1,344 |
� |
� |
� |
|
Other reserves |
� |
� |
� |
2,393 |
� |
� |
� |
2,243 |
� |
� |
� |
2,540 |
� |
� |
� |
|
Retained earnings |
� |
� |
� |
2,693 |
� |
� |
� |
2,438 |
� |
� |
� |
2,405 |
� |
� |
� |
|
Equity attributable to equity shareholders of the parent company |
� |
� |
� |
� |
� |
7,228 |
� |
� |
� |
6,823 |
� |
� |
� |
7,086 |
� |
|
Non-controlling interests |
� |
� |
� |
� |
� |
1,468 |
� |
� |
� |
767 |
� |
� |
� |
952 |
� |
|
Total equity |
� |
� |
� |
� |
� |
8,696 |
� |
� |
� |
7,590 |
� |
� |
� |
8,038 |
� |
�
�
UNAUDITED CONDENSED CONSOLIDATED STATEMENT OF CHANGES IN EQUITY
�
|
� |
� |
� |
� |
� |
� |
� |
� |
� |
� |
Equity |
� |
� |
� |
� |
� | ||||
|
� |
� |
� |
� |
� |
� |
� |
� |
Retained earnings/(deficit) |
� |
attributable |
� |
� |
� |
� |
� | ||||
|
� |
� |
� |
� |
� |
� |
� |
� |
� |
� |
Other |
� |
� |
� |
to parent |
� |
Non- |
� |
� |
� |
|
� |
� |
Share |
� |
Share |
� |
Other |
� |
Own |
� |
retained |
� |
� |
� |
company |
� |
controlling |
� |
Total |
� |
|
� |
� |
capital |
� |
premium |
� |
reserves |
� |
shares |
� |
earnings |
� |
Total |
� |
shareholders |
� |
interests |
� |
equity |
� |
|
� |
� |
� million |
� |
� million |
� |
� million |
� |
� million |
� |
� million |
� |
� million |
� |
� million |
� |
� million |
� |
� million |
� |
|
� |
� |
� |
� |
� |
� |
� |
� |
� |
� |
� |
� |
� |
� |
� |
� |
� |
� |
� |
� |
|
� |
� |
� |
� |
� |
� |
� |
� |
� |
� |
� |
� |
� |
� |
� |
� |
� |
� |
� |
� |
|
At 30 June�2014 |
� |
797 |
� |
1,345 |
� |
2,243 |
� |
(2,280 |
) |
4,718 |
� |
2,438 |
� |
6,823 |
� |
767 |
� |
7,590 |
� |
|
Total comprehensive income |
� |
� |
� |
� |
� |
150 |
� |
� |
� |
1,057 |
� |
1,057 |
� |
1,207 |
� |
141 |
� |
1,348 |
� |
|
Employee share schemes |
� |
� |
� |
� |
� |
� |
� |
39 |
� |
(44 |
) |
(5 |
) |
(5 |
) |
� |
� |
(5 |
) |
|
Share-based incentive plans |
� |
� |
� |
� |
� |
� |
� |
� |
� |
18 |
� |
18 |
� |
18 |
� |
� |
� |
18 |
� |
|
Share-based incentive plans in respect of associates |
� |
� |
� |
� |
� |
� |
� |
� |
� |
1 |
� |
1 |
� |
1 |
� |
� |
� |
1 |
� |
|
Tax on share-based incentive plans |
� |
� |
� |
� |
� |
� |
� |
� |
� |
(6 |
) |
(6 |
) |
(6 |
) |
� |
� |
(6 |
) |
|
Acquisitions |
� |
� |
� |
� |
� |
� |
� |
� |
� |
� |
� |
� |
� |
� |
� |
594 |
� |
594 |
� |
|
Change in fair value of put options |
� |
� |
� |
� |
� |
� |
� |
� |
� |
(9 |
) |
(9 |
) |
(9 |
) |
� |
� |
(9 |
) |
|
Dividends paid |
� |
� |
� |
� |
� |
� |
� |
� |
� |
(801 |
) |
(801 |
) |
(801 |
) |
(34 |
) |
(835 |
) |
|
At 31 December�2014 |
� |
797 |
� |
1,345 |
� |
2,393 |
� |
(2,241 |
) |
4,934 |
� |
2,693 |
� |
7,228 |
� |
1,468 |
� |
8,696 |
� |
|
� |
� |
� |
� |
� |
� |
� |
� |
� |
� |
� |
� |
� |
� |
� |
� |
� |
� |
� |
� |
|
At 30 June�2013 |
� |
797 |
� |
1,344 |
� |
3,154 |
� |
(2,232 |
) |
3,973 |
� |
1,741 |
� |
7,036 |
� |
1,052 |
� |
8,088 |
� |
|
Total comprehensive income |
� |
� |
� |
� |
� |
(614 |
) |
� |
� |
1,473 |
� |
1,473 |
� |
859 |
� |
(29 |
) |
830 |
� |
|
Employee share schemes |
� |
� |
� |
� |
� |
� |
� |
(9 |
) |
(51 |
) |
(60 |
) |
(60 |
) |
� |
� |
(60 |
) |
|
Share-based incentive plans |
� |
� |
� |
� |
� |
� |
� |
� |
� |
19 |
� |
19 |
� |
19 |
� |
� |
� |
19 |
� |
|
Share-based incentive plans in respect of associates |
� |
� |
� |
� |
� |
� |
� |
� |
� |
1 |
� |
1 |
� |
1 |
� |
� |
� |
1 |
� |
|
Tax on share-based incentive plans |
� |
� |
� |
� |
� |
� |
� |
� |
� |
(13 |
) |
(13 |
) |
(13 |
) |
� |
� |
(13 |
) |
|
Acquisitions |
� |
� |
� |
� |
� |
� |
� |
� |
� |
� |
� |
� |
� |
� |
� |
8 |
� |
8 |
� |
|
Change in fair value of put options |
� |
� |
� |
� |
� |
� |
� |
� |
� |
(4 |
) |
(4 |
) |
(4 |
) |
� |
� |
(4 |
) |
|
Purchase of non-controlling interests |
� |
� |
� |
� |
� |
� |
� |
� |
� |
(17 |
) |
(17 |
) |
(17 |
) |
(18 |
) |
(35 |
) |
|
Dividends paid |
� |
� |
� |
� |
� |
� |
� |
� |
� |
(735 |
) |
(735 |
) |
(735 |
) |
(61 |
) |
(796 |
) |
|
At 31 December�2013 |
� |
797 |
� |
1,344 |
� |
2,540 |
� |
(2,241 |
) |
4,646 |
� |
2,405 |
� |
7,086 |
� |
952 |
� |
8,038 |
� |
�
�
UNAUDITED CONDENSED CONSOLIDATED STATEMENT OF CASH FLOWS
�
|
� |
� |
Six�months�ended |
� |
Six�months�ended |
� | ||||
|
� |
� |
31�December�2014 |
� |
31�December�2013 |
� | ||||
|
� |
� |
� million |
� |
� million |
� |
� million |
� |
� million |
� |
|
Cash flows from operating activities |
� |
� |
� |
� |
� |
� |
� |
� |
� |
|
Profit for the period |
� |
1,364 |
� |
� |
� |
1,654 |
� |
� |
� |
|
Discontinued operations |
� |
� |
� |
� |
� |
92 |
� |
� |
� |
|
Taxation |
� |
276 |
� |
� |
� |
388 |
� |
� |
� |
|
Share of after tax results of associates and joint ventures |
� |
(113 |
) |
� |
� |
(181 |
) |
� |
� |
|
Net finance charges |
� |
239 |
� |
� |
� |
225 |
� |
� |
� |
|
Non-operating items |
� |
(98 |
) |
� |
� |
(138 |
) |
� |
� |
|
Operating profit |
� |
� |
� |
1,668 |
� |
� |
� |
2,040 |
� |
|
Increase in inventories |
� |
(175 |
) |
� |
� |
(213 |
) |
� |
� |
|
Increase in trade and other receivables |
� |
(668 |
) |
� |
� |
(693 |
) |
� |
� |
|
Increase/(decrease) in trade and other payables and provisions |
� |
366 |
� |
� |
� |
(7 |
) |
� |
� |
|
Net increase in working capital |
� |
� |
� |
(477 |
) |
� |
� |
(913 |
) |
|
Depreciation, amortisation and impairment |
� |
190 |
� |
� |
� |
186 |
� |
� |
� |
|
Dividends received |
� |
10 |
� |
� |
� |
8 |
� |
� |
� |
|
Post employment payments less amounts included in operating profit |
� |
(32 |
) |
� |
� |
(122 |
) |
� |
� |
|
Other items |
� |
20 |
� |
� |
� |
(30 |
) |
� |
� |
|
� |
� |
� |
� |
188 |
� |
� |
� |
42 |
� |
|
Cash generated from operations |
� |
� |
� |
1,379 |
� |
� |
� |
1,169 |
� |
|
Interest received |
� |
88 |
� |
� |
� |
71 |
� |
� |
� |
|
Interest paid |
� |
(312 |
) |
� |
� |
(346 |
) |
� |
� |
|
Taxation paid |
� |
(198 |
) |
� |
� |
(288 |
) |
� |
� |
|
� |
� |
� |
� |
(422 |
) |
� |
� |
(563 |
) |
|
Net cash from operating activities |
� |
� |
� |
957 |
� |
� |
� |
606 |
� |
|
Cash flows from investing activities |
� |
� |
� |
� |
� |
� |
� |
� |
� |
|
Disposal of property, plant and equipment and computer software |
� |
36 |
� |
� |
� |
64 |
� |
� |
� |
|
Purchase of property, plant and equipment and computer software |
� |
(270 |
) |
� |
� |
(343 |
) |
� |
� |
|
Movements in loans and other investments |
� |
(24 |
) |
� |
� |
(1 |
) |
� |
� |
|
Sale of businesses |
� |
396 |
� |
� |
� |
� |
� |
� |
� |
|
Acquisition of businesses |
� |
(1,060 |
) |
� |
� |
(420 |
) |
� |
� |
|
Net cash outflow from investing activities |
� |
� |
� |
(922 |
) |
� |
� |
(700 |
) |
|
Cash flows from financing activities |
� |
� |
� |
� |
� |
� |
� |
� |
� |
|
Net purchase of own shares for share schemes |
� |
(7 |
) |
� |
� |
(61 |
) |
� |
� |
|
Dividends paid to non-controlling interests |
� |
(34 |
) |
� |
� |
(61 |
) |
� |
� |
|
Purchase of shares of non-controlling interests |
� |
� |
� |
� |
� |
(35 |
) |
� |
� |
|
Proceeds from bonds |
� |
791 |
� |
� |
� |
� |
� |
� |
� |
|
Repayment of bonds |
� |
(1,162 |
) |
� |
� |
(983 |
) |
� |
� |
|
Net movements on other borrowings |
� |
1,316 |
� |
� |
� |
1,122 |
� |
� |
� |
|
Equity dividends paid |
� |
(801 |
) |
� |
� |
(735 |
) |
� |
� |
|
Net cash inflow/(outflow) from financing activities |
� |
� |
� |
103 |
� |
� |
� |
(753 |
) |
|
� |
� |
� |
� |
� |
� |
� |
� |
� |
� |
|
Net increase/(decrease) in net cash and cash equivalents |
� |
� |
� |
138 |
� |
� |
� |
(847 |
) |
|
Exchange differences |
� |
� |
� |
15 |
� |
� |
� |
(41 |
) |
|
Net cash and cash equivalents at beginning of the period |
� |
� |
� |
532 |
� |
� |
� |
1,645 |
� |
|
Net cash and cash equivalents at end of the period |
� |
� |
� |
685 |
� |
� |
� |
757 |
� |
|
� |
� |
� |
� |
� |
� |
� |
� |
� |
� |
|
Net cash and cash equivalents consist of: |
� |
� |
� |
� |
� |
� |
� |
� |
� |
|
Cash and cash equivalents |
� |
� |
� |
802 |
� |
� |
� |
891 |
� |
|
Bank overdrafts |
� |
� |
� |
(117 |
) |
� |
� |
(134 |
) |
|
� |
� |
� |
� |
685 |
� |
� |
� |
757 |
� |
�
�
�
1. Basis of preparation
�
This condensed set of financial information has been prepared in accordance with IAS 34 Interim Financial Reporting as issued by the International Accounting Standards Board (IASB) and as adopted by the EU.
�
The annual financial statements of the group are prepared in accordance with International Financial Reporting Standards (IFRSs) as issued by the IASB and as adopted by the EU. As required by the Disclosure and Transparency Rules�of the Financial Conduct Authority, the condensed set of financial information has been prepared applying the accounting policies and presentation that were applied in the preparation of the company�s published consolidated financial statements for the year ended 30 June�2014. IFRS is subject to ongoing review and endorsement by the EU or possible amendment by interpretative guidance and the issuance of new standards by the IASB.
�
The directors have a reasonable expectation that the group has adequate resources to continue in operational existence for the foreseeable future. Accordingly, they continue to adopt the going concern basis in preparing the condensed consolidated financial statements.
�
New accounting standards
�
The following amendments to the accounting standards, issued by the IASB or International Financial Reporting Interpretations Committee (IFRIC) and endorsed by the EU, have been adopted by the group from 1 July�2014 with no significant impact on the group�s performance, financial position or disclosures:
�
IFRIC 21 � Levies
Amendment to IAS 19 � Defined benefit plans: Employee contributions
Amendment to IAS 32 � Offsetting financial assets and financial liabilities
Amendment to IAS 39 � Novation of derivatives and continuation of hedge accounting
Amendment to IFRS 2 � Share based payments � Definition of vesting conditions
Amendment to IFRS 3 � Accounting for contingent consideration in a business combination
Amendment to IFRS 3 � Scope exceptions for joint ventures
Amendment to IFRS 8 � Aggregation of operating segments and reconciliation of segment assets to entity�s assets
Amendment to IFRS 13 � Short-term receivables and payables
�
The following standards issued by the IASB (not yet endorsed by the EU) have not yet been adopted by the group:
�
IFRS 9 � Financial instruments (effective in the year ending 30 June�2019, not yet endorsed by the EU) is ultimately intended to replace IAS 39 and covers the classification, measurement and derecognition of financial instruments together with a new hedge accounting model and new impairment methodology. The group is currently considering the impact of IFRS 9 on its consolidated results and financial position.
�
IFRS 15 � Revenue from contracts with customers (effective in the year ending 30 June�2018, not yet endorsed by the EU) is based on the principle that revenue is recognised when control of goods or services is transferred to the customer and provides a single, principles based five-step model to be applied to all sales contracts. It replaces the separate models for goods, services and construction contracts under current IFRS. Based on a preliminary assessment the group currently believes that the adoption of IFRS 15 will have no significant impact on its consolidated results or financial position.
�
The comparative figures for the financial year ended 30 June�2014 are not the company�s statutory accounts for that financial year. Those accounts have been reported on by the company�s auditor and delivered to the registrar of companies. The report of the auditor was (i)�unqualified, (ii)�did not include a reference to any matters to which the auditor drew attention by way of emphasis without qualifying their report and (iii)�did not contain a statement under section 498 (2)�or (3)�of the Companies Act 2006.
�
�
2. Segmental information
�
The segmental information presented is consistent with management reporting provided to the executive committee (the chief operating decision maker).
�
The executive committee considers the business principally from a geographical perspective based on the location of third party sales and the business analysis is presented by geographical segment.
�
In the six months ended 31 December�2014 Diageo changed its internal reporting structure to reflect changes made to management responsibilities as announced on 30 July�2014. As a result of this change, Diageo reports the following geographical segments both for management reporting purposes and in the external financial statements: North America; Europe; Africa; Latin America and Caribbean; Asia Pacific and Corporate. As a consequence of this change, the financial information by geographical segments for comparative years has been amended and restated segmental information has been provided in the tables below.
�
Continuing operations also include the Corporate function. Corporate revenues and costs are in respect of central costs, including finance, corporate relations, human resources and legal, as well as certain information systems, facilities and employee costs that are not allocable to the geographical segments or to ISC. They also include rents receivable and payable in respect of properties not used by the group in the manufacture, sale or distribution of premium drinks and the results of Gleneagles Hotel.
�
Diageo uses shared services operations, including captive and outsourced centres, to deliver transaction processing activities for markets and operational entities. These centres are located in Hungary, Romania, Kenya, Colombia and the Philippines. The captive business service centre in Budapest also performs certain central finance activities, including elements of financial planning and reporting and treasury. The results of shared service operations are recharged to the regions.
�
The segmental information for net sales and operating profit before exceptional items is reported at budgeted exchange rates in line with management reporting. For management reporting purposes the group measures the current period at, and restates the prior period net sales and operating profit to, the current year�s budgeted exchange rates. These exchange rates are set prior to the financial year as part of the financial planning process and provide a consistent exchange rate to measure the performance of the business throughout the year. The adjustments required to retranslate the segmental information to actual exchange rates and to reconcile it to the group�s reported results are shown in the tables below. The comparative segmental information, prior to retranslation, has not been restated at the current year�s budgeted exchange rates but is presented at the budgeted rates for the year ended 30 June�2014.
�
In addition, for management reporting purposes Diageo presents separately the result of acquisitions and disposals completed in the current and prior year from the results of the geographical segments. The impact of acquisitions and disposals on net sales and operating profit is disclosed under the appropriate geographical segments in the tables below at budgeted exchange rates.
�
|
Six�months�ended |
� |
North America |
� |
Europe |
� |
Africa |
� |
Latin America and |
� |
Asia |
� |
ISC |
� |
Eliminate |
� |
Total |
� |
Corporate |
� |
Total |
� |
|
31�December�2014 |
� |
� million |
� |
� million |
� |
� million |
� |
� million |
� |
� million |
� |
� million |
� |
� million |
� |
� million |
� |
� million |
� |
� million |
� |
|
� |
� |
� |
� |
� |
� |
� |
� |
� |
� |
� |
� |
� |
� |
� |
� |
� |
� |
� |
� |
� |
� |
|
Sales |
� |
2,102 |
� |
2,596 |
� |
992 |
� |
786 |
� |
2,205 |
� |
797 |
� |
(797 |
) |
8,681 |
� |
43 |
� |
8,724 |
� |
|
Net sales |
� |
� |
� |
� |
� |
� |
� |
� |
� |
� |
� |
� |
� |
� |
� |
� |
� |
� |
� |
� |
� |
|
At budgeted exchange rates* |
� |
1,916 |
� |
1,463 |
� |
753 |
� |
608 |
� |
687 |
� |
836 |
� |
(797 |
) |
5,466 |
� |
44 |
� |
5,510 |
� |
|
Acquisitions and disposals |
� |
8 |
� |
� |
� |
� |
� |
� |
� |
478 |
� |
� |
� |
� |
� |
486 |
� |
� |
� |
486 |
� |
|
ISC allocation |
� |
6 |
� |
24 |
� |
1 |
� |
4 |
� |
4 |
� |
(39 |
) |
� |
� |
� |
� |
� |
� |
� |
� |
|
Retranslation to actual exchange rates |
� |
(63 |
) |
(28 |
) |
(8 |
) |
7 |
� |
(3 |
) |
� |
� |
� |
� |
(95 |
) |
(1 |
) |
(96 |
) |
|
Net sales |
� |
1,867 |
� |
1,459 |
� |
746 |
� |
619 |
� |
1,166 |
� |
797 |
� |
(797 |
) |
5,857 |
� |
43 |
� |
5,900 |
� |
|
Operating profit/(loss) |
� |
� |
� |
� |
� |
� |
� |
� |
� |
� |
� |
� |
� |
� |
� |
� |
� |
� |
� |
� |
� |
|
At budgeted exchange rates* |
� |
851 |
� |
459 |
� |
174 |
� |
198 |
� |
176 |
� |
52 |
� |
� |
� |
1,910 |
� |
(55 |
) |
1,855 |
� |
|
Acquisitions and disposals |
� |
(8 |
) |
� |
� |
� |
� |
� |
� |
30 |
� |
� |
� |
� |
� |
22 |
� |
� |
� |
22 |
� |
|
ISC allocation |
� |
7 |
� |
31 |
� |
3 |
� |
6 |
� |
5 |
� |
(52 |
) |
� |
� |
� |
� |
� |
� |
� |
� |
|
Retranslation to actual exchange rates |
� |
(31 |
) |
(10 |
) |
(2 |
) |
3 |
� |
3 |
� |
� |
� |
� |
� |
(37 |
) |
(1 |
) |
(38 |
) |
|
Operating profit/(loss) before exceptional items |
� |
819 |
� |
480 |
� |
175 |
� |
207 |
� |
214 |
� |
� |
� |
� |
� |
1,895 |
� |
(56 |
) |
1,839 |
� |
|
Exceptional items |
� |
(11 |
) |
(4 |
) |
(1 |
) |
(4 |
) |
(147 |
) |
3 |
� |
� |
� |
(164 |
) |
(7 |
) |
(171 |
) |
|
Operating profit/(loss) |
� |
808 |
� |
476 |
� |
174 |
� |
203 |
� |
67 |
� |
3 |
� |
� |
� |
1,731 |
� |
(63 |
) |
1,668 |
� |
|
Non-operating items |
� |
� |
� |
� |
� |
� |
� |
� |
� |
� |
� |
� |
� |
� |
� |
� |
� |
� |
� |
98 |
� |
|
Net finance charges |
� |
� |
� |
� |
� |
� |
� |
� |
� |
� |
� |
� |
� |
� |
� |
� |
� |
� |
� |
(239 |
) |
|
Share of after tax results of associates and joint ventures |
� |
� |
� |
� |
� |
� |
� |
� |
� |
� |
� |
� |
� |
� |
� |
� |
� |
� |
� |
113 |
� |
|
Profit before taxation |
� |
� |
� |
� |
� |
� |
� |
� |
� |
� |
� |
� |
� |
� |
� |
� |
� |
� |
� |
1,640 |
� |
�
�
|
Six�months�ended |
� |
North America |
� |
Europe |
� |
Africa |
� |
Latin and |
� |
Asia |
� |
ISC |
� |
Eliminate |
� |
Total |
� |
Corporate |
� |
Total |
� |
|
(restated) |
� |
� million |
� |
� million |
� |
� million |
� |
� million |
� |
� million |
� |
� million |
� |
� million |
� |
� million |
� |
� million |
� |
� million |
� |
|
� |
� |
� |
� |
� |
� |
� |
� |
� |
� |
� |
� |
� |
� |
� |
� |
� |
� |
� |
� |
� |
� |
|
Sales |
� |
2,149 |
� |
2,707 |
� |
1,002 |
� |
1,102 |
� |
1,012 |
� |
821 |
� |
(821 |
) |
7,972 |
� |
42 |
� |
8,014 |
� |
|
Net sales |
� |
� |
� |
� |
� |
� |
� |
� |
� |
� |
� |
� |
� |
� |
� |
� |
� |
� |
� |
� |
� |
|
At budgeted exchange rates* |
� |
1,934 |
� |
1,539 |
� |
786 |
� |
741 |
� |
792 |
� |
864 |
� |
(821 |
) |
5,835 |
� |
42 |
� |
5,877 |
� |
|
Acquisitions and disposals |
� |
20 |
� |
3 |
� |
� |
� |
� |
� |
� |
� |
� |
� |
� |
� |
23 |
� |
� |
� |
23 |
� |
|
ISC allocation |
� |
6 |
� |
26 |
� |
3 |
� |
4 |
� |
4 |
� |
(43 |
) |
� |
� |
� |
� |
� |
� |
� |
� |
|
Retranslation to actual exchange rates |
� |
(56 |
) |
(8 |
) |
(15 |
) |
155 |
� |
(44 |
) |
� |
� |
� |
� |
32 |
� |
� |
� |
32 |
� |
|
Net sales |
� |
1,904 |
� |
1,560 |
� |
774 |
� |
900 |
� |
752 |
� |
821 |
� |
(821 |
) |
5,890 |
� |
42 |
� |
5,932 |
� |
|
Operating profit/(loss) |
� |
� |
� |
� |
� |
� |
� |
� |
� |
� |
� |
� |
� |
� |
� |
� |
� |
� |
� |
� |
� |
|
At budgeted exchange rates* |
� |
866 |
� |
490 |
� |
199 |
� |
263 |
� |
217 |
� |
56 |
� |
� |
� |
2,091 |
� |
(69 |
) |
2,022 |
� |
|
Acquisitions and disposals |
� |
(4 |
) |
1 |
� |
� |
� |
� |
� |
(7 |
) |
� |
� |
� |
� |
(10 |
) |
� |
� |
(10 |
) |
|
ISC allocation |
� |
8 |
� |
34 |
� |
3 |
� |
6 |
� |
5 |
� |
(56 |
) |
� |
� |
� |
� |
� |
� |
� |
� |
|
Retranslation to actual exchange rates |
� |
(19 |
) |
(16 |
) |
(14 |
) |
117 |
� |
(22 |
) |
� |
� |
� |
� |
46 |
� |
2 |
� |
48 |
� |
|
Operating profit/(loss) before exceptional items |
� |
851 |
� |
509 |
� |
188 |
� |
386 |
� |
193 |
� |
� |
� |
� |
� |
2,127 |
� |
(67 |
) |
2,060 |
� |
|
Exceptional items |
� |
(1 |
) |
� |
� |
(2 |
) |
(1 |
) |
� |
� |
(16 |
) |
� |
� |
(20 |
) |
� |
� |
(20 |
) |
|
Operating profit/(loss) |
� |
850 |
� |
509 |
� |
186 |
� |
385 |
� |
193 |
� |
(16 |
) |
� |
� |
2,107 |
� |
(67 |
) |
2,040 |
� |
|
Non-operating items |
� |
� |
� |
� |
� |
� |
� |
� |
� |
� |
� |
� |
� |
� |
� |
� |
� |
� |
� |
138 |
� |
|
Net finance charges |
� |
� |
� |
� |
� |
� |
� |
� |
� |
� |
� |
� |
� |
� |
� |
� |
� |
� |
� |
(225 |
) |
|
Share of after tax results of associates and joint ventures |
� |
� |
� |
� |
� |
� |
� |
� |
� |
� |
� |
� |
� |
� |
� |
� |
� |
� |
� |
181 |
� |
|
Profit before taxation |
� |
� |
� |
� |
� |
� |
� |
� |
� |
� |
� |
� |
� |
� |
� |
� |
� |
� |
� |
2,134 |
� |
�
* These items represent the IFRS 8 performance measures for the geographical and ISC segments.
�
(i)������������ The net sales figures for ISC reported to the executive committee primarily comprise inter-segment sales and these are eliminated in a separate column in the above segmental analysis. Apart from sales by the ISC segment to the other operating segments, inter-segmental sales are not material.
�
(ii)��������� The group�s net finance charges are managed centrally and are not attributable to individual operating segments.
�
(iii)������ Approximately 40% of annual net sales occur in the last four months of each calendar year.
�
Weighted average exchange rates used in the translation of income statements were US dollar � �1 = $1.61 (2013 � �1 = $1.60) and euro � �1 = �1.26 (2013 � �1 = �1.18). Exchange rates used to translate assets and liabilities at the balance sheet date were US dollar � �1 = $1.56 (30 June�2014 � �1 = $1.71, 31 December�2013 � �1 = $1.66) and euro � �1 = �1.29 (30 June�2014 � �1 = �1.25, 31 December�2013 � �1 = �1.20). The group uses foreign exchange transaction hedges to mitigate the effect of exchange rate movements.
�
�
3. Exceptional items
�
Exceptional items are those which, in management�s judgement, need to be disclosed by virtue of their size or incidence in order for the user to obtain a proper understanding of the financial information.
�
|
� |
� |
Six�months�ended |
� |
Six�months�ended |
� |
|
� |
� |
31�December�2014 |
� |
31�December�2013 |
� |
|
� |
� |
� million |
� |
� million |
� |
|
Items included in operating profit |
� |
� |
� |
� |
� |
|
Global efficiency programme |
� |
(18 |
) |
� |
� |
|
Supply excellence review |
� |
(11 |
) |
(3 |
) |
|
Restructuring of Irish brewing operations |
� |
3 |
� |
(17 |
) |
|
� |
� |
(26 |
) |
(20 |
) |
|
� |
� |
� |
� |
� |
� |
|
Korea settlement |
� |
(145 |
) |
� |
� |
|
� |
� |
(171 |
) |
(20 |
) |
|
� |
� |
� |
� |
� |
� |
|
Non-operating items |
� |
� |
� |
� |
� |
|
Fair value gain on USL |
� |
103 |
� |
140 |
� |
|
Sale of business |
� |
(5 |
) |
(2 |
) |
|
� |
� |
98 |
� |
138 |
� |
|
� |
� |
� |
� |
� |
� |
|
Exceptional items before taxation |
� |
(73 |
) |
118 |
� |
|
� |
� |
� |
� |
� |
� |
|
Items included in taxation |
� |
� |
� |
� |
� |
|
Tax on exceptional operating items |
� |
38 |
� |
3 |
� |
|
� |
� |
38 |
� |
3 |
� |
|
� |
� |
� |
� |
� |
� |
|
Exceptional items in continuing operations |
� |
(35 |
) |
121 |
� |
|
� |
� |
� |
� |
� |
� |
|
Discontinued operations net of taxation |
� |
� |
� |
� |
� |
|
Thalidomide |
� |
� |
� |
(92 |
) |
|
� |
� |
� |
� |
� |
� |
|
Total exceptional items |
� |
(35 |
) |
29 |
� |
|
� |
� |
� |
� |
� |
� |
|
Attributable to: |
� |
� |
� |
� |
� |
|
Equity shareholders of the parent company |
� |
(34 |
) |
29 |
� |
|
Non-controlling interests |
� |
(1 |
) |
� |
� |
|
Total exceptional items |
� |
(35 |
) |
29 |
� |
|
� |
� |
� |
� |
� |
� |
|
Exceptional items included in operating profit are charged to: |
� |
� |
� |
� |
� |
|
Cost of sales |
� |
(10 |
) |
(16 |
) |
|
Other operating expenses |
� |
(161 |
) |
(4 |
) |
|
� |
� |
(171 |
) |
(20 |
) |
�
Cash generated from operations includes �62 million (2013 � �41 million) of cash outflows in respect of exceptional operating items and �8 million (2013 � �2 million) in respect of thalidomide.
�
�
4. Finance income and charges
�
|
� |
� |
Six�months�ended |
� |
Six�months�ended |
� |
|
� |
� |
31�December�2014 |
� |
31�December�2013 |
� |
|
� |
� |
� million |
� |
� million |
� |
|
� |
� |
� |
� |
� |
� |
|
Interest income |
� |
81 |
� |
52 |
� |
|
Fair value gain on interest rate instruments |
� |
65 |
� |
69 |
� |
|
Total interest income |
� |
146 |
� |
121 |
� |
|
Interest charges |
� |
(279 |
) |
(239 |
) |
|
Fair value loss on interest rate instruments |
� |
(61 |
) |
(70 |
) |
|
Total interest charges |
� |
(340 |
) |
(309 |
) |
|
Net interest charges |
� |
(194 |
) |
(188 |
) |
|
� |
� |
� |
� |
� |
� |
|
Net finance income in respect of post employment plans in surplus |
� |
6 |
� |
8 |
� |
|
Other finance income |
� |
7 |
� |
1 |
� |
|
Total other finance income |
� |
13 |
� |
9 |
� |
|
Net finance charge in respect of post employment plans in deficit |
� |
(14 |
) |
(15 |
) |
|
Unwinding of discounts |
� |
(6 |
) |
(3 |
) |
|
Change in financial liability |
� |
(12 |
) |
� |
� |
|
Hyperinflation adjustment on Venezuela operations |
� |
(24 |
) |
(27 |
) |
|
Other finance charges |
� |
(2 |
) |
(1 |
) |
|
Total other finance charges |
� |
(58 |
) |
(46 |
) |
|
Net other finance charges |
� |
(45 |
) |
(37 |
) |
�
5. Taxation
�
For the six months ended 31 December�2014, the �276 million taxation charge from continuing operation (2013 � �388 million) comprises a UK tax charge of �60 million (2013 � �37 million) and a foreign tax charge of �216 million (2013 � �351 million).
�
6. Inventories
�
|
� |
� |
31�December |
� |
30�June |
� |
31�December |
� |
|
� |
� |
��million |
� |
��million |
� |
��million |
� |
|
� |
� |
� |
� |
� |
� |
� |
� |
|
Raw materials and consumables |
� |
386 |
� |
306 |
� |
387 |
� |
|
Work in progress |
� |
95 |
� |
59 |
� |
65 |
� |
|
Maturing inventories |
� |
3,470 |
� |
3,300 |
� |
3,234 |
� |
|
Finished goods and goods for resale |
� |
646 |
� |
557 |
� |
634 |
� |
|
� |
� |
4,597 |
� |
4,222 |
� |
4,320 |
� |
�
7. Net borrowings
�
|
� |
� |
31�December |
� |
30�June |
� |
31�December |
� |
|
� |
� |
��million |
� |
��million |
� |
��million |
� |
|
� |
� |
� |
� |
� |
� |
� |
� |
|
Borrowings due within one year and bank overdrafts |
� |
(2,845 |
) |
(1,576 |
) |
(3,007 |
) |
|
Borrowings due after one year |
� |
(8,518 |
) |
(7,638 |
) |
(6,716 |
) |
|
Fair value of foreign currency forwards and swaps |
� |
170 |
� |
25 |
� |
35 |
� |
|
Fair value of interest rate hedging instruments |
� |
(1 |
) |
8 |
� |
� |
� |
|
Finance lease liabilities |
� |
(276 |
) |
(291 |
) |
(299 |
) |
|
� |
� |
(11,470 |
) |
(9,472 |
) |
(9,987 |
) |
|
Cash and cash equivalents |
� |
802 |
� |
622 |
� |
891 |
� |
|
� |
� |
(10,668 |
) |
(8,850 |
) |
(9,096 |
) |
�
�
8. Reconciliation of movement in net borrowings
�
|
� |
� |
Six�months�ended |
� |
Six�months�ended |
� |
|
� |
� |
31�December�2014 |
� |
31�December�2013 |
� |
|
� |
� |
��million |
� |
��million |
� |
|
� |
� |
� |
� |
� |
� |
|
Net increase/(decrease) in cash and cash equivalents before exchange |
� |
138 |
� |
(847 |
) |
|
Net increase in bonds and other borrowings |
� |
(945 |
) |
(139 |
) |
|
Increase in net borrowings from cash flows |
� |
(807 |
) |
(986 |
) |
|
Exchange differences on net borrowings |
� |
(143 |
) |
337 |
� |
|
Borrowings acquired on acquisition of USL |
� |
(849 |
) |
� |
� |
|
Other non-cash items |
� |
(19 |
) |
(44 |
) |
|
Net borrowings at beginning of the period |
� |
(8,850 |
) |
(8,403 |
) |
|
Net borrowings at end of the period |
� |
(10,668 |
) |
(9,096 |
) |
�
Other non-cash items primarily comprise fair value changes on bonds, interest rate derivatives and new finance leases.
�
In the six months ended 31 December�2014, the group repaid bonds of �1,000 million (�792 million) and issued bonds of �1,000 million (�791 million), consisting of �500 million (�400 million) of 1.125% bonds due May�2019 and �500 million (�391 million) of 1.75% bonds due September�2023. A bond of �370 million acquired on the purchase of USL was repaid using the proceeds from the sale of the Whyte and Mackay Group.
�
All bonds, medium-term notes and commercial paper issued by the group�s 100% owned subsidiaries are fully and unconditionally guaranteed by Diageo plc.
�
9. Financial instruments
�
Fair value measurements of financial instruments are presented through the use of a three-level fair value hierarchy that prioritises the valuation techniques used in fair value calculations.
�
The group maintains policies and procedures to value instruments using the most relevant data available. If multiple inputs that fall into different levels of the hierarchy are used in the valuation of an instrument, the instrument is categorised on the basis of the most subjective input.
�
Foreign currency forwards and swaps, cross currency swaps and interest rate swaps are valued using discounted cash flow techniques. These techniques incorporate inputs at levels 1 and 2, such as foreign exchange rates and interest rates. These market inputs are used in the discounted cash flow calculation incorporating the instrument�s term, notional amount and discount rate, and taking credit risk into account. As significant inputs to the valuation are observable in active markets, these instruments are categorised as level 2 in the hierarchy.
�
There were no significant changes in the measurement and valuation techniques, or significant transfers between the levels of the financial assets and liabilities in the six months ended 31 December�2014.
�
The group�s financial assets and liabilities measured at fair value are categorised as follows:
�
|
� |
� |
31�December�2014 |
� |
30�June |
� |
31�December�2013 |
� |
|
� |
� |
� million |
� |
� million |
� |
� million |
� |
|
Available-for-sale investments |
� |
72 |
� |
� |
� |
� |
� |
|
Unadjusted quoted prices in active markets (Level 1) |
� |
72 |
� |
� |
� |
� |
� |
|
Derivative assets |
� |
393 |
� |
368 |
� |
405 |
� |
|
Derivative liabilities |
� |
(215 |
) |
(194 |
) |
(198 |
) |
|
Valuation techniques based on observable market input (Level 2) |
� |
178 |
� |
174 |
� |
207 |
� |
|
Other financial liabilities |
� |
(140 |
) |
(108 |
) |
(109 |
) |
|
Valuation techniques based on unobservable market input (Level 3) |
� |
(140 |
) |
(108 |
) |
(109 |
) |
�
Finance lease liabilities amounted to �276 million at 31 December�2014 (30 June�2014 � �291 million).
�
The carrying amount of the group�s financial assets and liabilities are generally the same as their fair value apart from borrowings. At 31 December�2014 the fair value of gross borrowings (excluding finance lease liabilities and the fair value of derivative instruments) was �11,937 million and the carrying value was �11,363 million (30 June�2014 � �9,662 million and �9,214 million respectively).
�
�
10. Dividends and other reserves
�
|
� |
� |
Six�months�ended |
� |
Six�months�ended |
� |
|
� |
� |
31�December�2014 |
� |
31�December�2013 |
� |
|
� |
� |
� million |
� |
� million |
� |
|
Amounts recognised as distributions to equity shareholders in the period |
� |
� |
� |
� |
� |
|
Final dividend paid for the year ended 30 June�2014 of 32.0 pence per share (2013 � 29.3 pence) |
� |
801 |
� |
735 |
� |
�
An interim dividend of 21.5 pence per share (2013 � 19.7 pence) was approved by the board on 28 January�2015. As the approval was after the balance sheet date, it has not been included as a liability.
�
Other reserves of �2,393 million at 31 December�2014 (2013 � �2,540 million) include a capital redemption reserve of �3,146 million (2013 � �3,146 million) and hedging and exchange reserve of �753 million deficit (2013 � �606 million deficit).
�
11. Acquisition of business � United Spirits Limited
�
On 2 July�2014, on the completion of a tender offer the group acquired an additional 26% (37.79 million shares) investment in United Spirits Limited (USL) at a cost of INR 3030 per share for a total consideration of INR 114.5 billion (�1,118 million). This took the group�s investment to 54.78% (excluding 2.38% owned by the USL Benefit Trust) and a non-controlling interest representing 43.9% of the net assets acquired, was established. A gain of �103 million reflecting the step up from associate to subsidiary was recognised as a non-operating exceptional item in the consolidated income statement in the six months ended 31 December�2014. The gain includes a �79 million cumulative exchange loss recycled from other comprehensive income and �10 million of transaction costs.
�
In the prior year Diageo had purchased a 14.98% investment (21.77 million shares) in USL at a cost of INR 1440 per share totalling INR 31.3 billion (�342 million). This took the group�s investment in USL at that time to 25.02% and changed its accounting treatment from available-for-sale investments to associates.
�
In addition, during the year ended 30 June�2014, Diageo acquired a further 3.76% investment in USL through on-market purchases on the Bombay Stock Exchange at a cost totalling INR 13.4 billion (�132 million). This brought the aggregate investment in USL held by Diageo to 28.78% at 30 June�2014.
�
USL continues to prepare its reported figures under Indian GAAP. USL contributed �479 million to net sales and a �3 million loss (after integration costs) to profit after tax in the six months ended 31 December�2014. These amounts are adjusted to Diageo�s IFRS accounting policies and are after fair value adjustments.
�
A provisional fair value assessment of the USL net assets acquired under Diageo IFRS accounting policies, as at 2 July�2014, is as follows:
�
|
� |
� |
� million |
� |
|
Brands and other intangibles |
� |
1,846 |
� |
|
Property, plant and equipment |
� |
253 |
� |
|
Investments |
� |
58 |
� |
|
Inventories |
� |
220 |
� |
|
Assets and liabilities held for sale |
� |
392 |
� |
|
Other working capital |
� |
62 |
� |
|
Current and deferred tax |
� |
(681 |
) |
|
Cash |
� |
51 |
� |
|
Borrowings |
� |
(849 |
) |
|
Fair value of assets and liabilities |
� |
1,352 |
� |
|
Goodwill arising on acquisition |
� |
1,342 |
� |
|
Non-controlling interests |
� |
(594 |
) |
|
Transfer from associate to subsidiary |
� |
(790 |
) |
|
Step up gain (excluding �79 million loss in respect of exchange) |
� |
(192 |
) |
|
Consideration paid |
� |
1,118 |
� |
|
Satisfied by: |
� |
� |
� |
|
Cash consideration paid |
� |
1,118 |
� |
|
Cash acquired |
� |
(51 |
) |
|
Deposit refunded |
� |
(11 |
) |
|
Net cash outflow on acquisition of businesses |
� |
1,056 |
� |
�
12. Assets and liabilities held for sale
�
In November�2014, Diageo agreed with Casa Cuervo to acquire the 50% equity interest in Don Julio BV that it did not already own (giving Diageo full global ownership and the control of Tequila Don Julio), the termination of Casa Cuervo�s production and distribution agreement for Smirnoff in Mexico and the sale by Diageo of Bushmills to Jose Cuervo Overseas. The transaction is expected to complete in early 2015 subject to certain regulatory approvals. The assets and liabilities of Bushmills are reclassified to assets held for sale and liabilities held for sale as at 31 December�2014 (�316 million and �43 million, respectively).
�
�
13. Contingent liabilities and legal proceedings
�
(a)�Guarantees
As of 31 December�2014 the group has no material guarantees or indemnities in respect of liabilities of third parties with the exception of a conditional back-stop guarantee issued by Diageo Holdings Netherlands B.V. (DHN) to Standard Chartered Bank (Standard Chartered), pursuant to a guarantee commitment agreement (the guarantee agreement) in respect of the liabilities of Watson Limited (Watson), a company affiliated with Dr Vijay Mallya, under a $135 million (�81 million) facility from Standard Chartered. The guarantee agreement was entered into as part of the arrangements put in place at closing of the USL transaction and announced by Diageo on 4 July�2013. The term of this facility and the DHN guarantee have since been renewed and extended to 2 March�2015, with the monetary limits of both the facility and the guarantee remaining unchanged. The terms of the guarantee continue to require that the right of Standard Chartered to call on the guarantee is subject to Standard Chartered having first taken certain agreed steps to recover from Watson, including defined steps towards enforcement of its security package. In addition, DHN has, in respect of its potential liability under this guarantee, the benefit of counter-indemnities from Watson and Dr Vijay Mallya as well as the security package put in place for the facility.
�
(b)�Colombian litigation
An action was filed on 8 October�2004 in the United States District Court for the Eastern District of New York by the Republic of Colombia and a number of its local government entities against Diageo and other spirits companies, alleging several causes of action, including violations of the Federal RICO Act. This claim was dismissed in November�2012. The dismissal was without prejudice and as such, plaintiffs are not barred from bringing a similar action in future, although the company currently believes any such future action to be unlikely. Diageo remains committed to continued dialogue with the Colombian governmental entities to address the underlying issues.
�
(c)�Korean customs dispute
On 5 January�2015, Diageo Korea accepted the Korean court recommendation to settle litigation against Korea customs regarding the transfer pricing methodology applicable to spirits imported between 2004 and 2010. For the six months period ended 31 December�2014 Diageo has charged �145 million before tax in respect of resolving this dispute as well as other related matters. Payments to be made pursuant to settlement of these related disputes will be reduced by �88 million which was paid to customs authorities prior to 30 June�2014 and was previously accounted for as a receivable from Korea customs.
�
(d)�Thalidomide litigation
In June 2014, claims alleging product liability and negligence for injuries arising from the consumption of thalidomide were filed in the High Court in London against Distillers Company (Biochemicals) Limited, its parent Diageo Scotland Limited (formerly Distillers Company Limited), as well as against Gr�nenthal GmbH, the developer of the drug (not a member of the group). The Particulars of Claim on behalf of ten claimants in these proceedings were served on Diageo on 6 December�2014. Diageo is unable to quantify meaningfully the possible loss or range of loss to which these lawsuits may give rise.
�
Distillers Company (Biochemicals) Limited distributed thalidomide in the United Kingdom for a period in the late 1950s and early 1960s. Diageo has worked voluntarily for many years with various thalidomide organisations and has provided significant financial support.
�
(e)�Acquisition of USL shares from UBHL, winding-up petitions against UBHL and other proceedings in relation to the USL transaction
On 4 July�2013 Diageo completed its acquisition, under a share purchase agreement with United Breweries (Holdings) Limited (UBHL) and various other sellers (the SPA) of 21,767,749 shares (14.98%) in USL for a total consideration of INR 31.3 billion (�342 million), including 10,141,437 shares (6.98%) from UBHL. Through a series of further transactions, as of 2 July�2014, Diageo has a 54.78% investment in USL (excluding 2.38% owned by the USL Benefit Trust).
�
Prior to the acquisition from UBHL on 4 July�2013, the High Court of Karnataka (the High Court) had granted leave to UBHL under sections 536 and 537 of the Indian Companies Act (the Leave Order) to enable the sale by UBHL to Diageo to take place (the UBHL Share Sale) notwithstanding the continued existence of five winding-up petitions (the Original Petitions) that were pending against UBHL on 9 November�2012, being the date of the SPA. Additional winding-up petitions have been brought against UBHL since 9 November�2012, and the Leave Order did not extend to them. At the time of the completion of the UBHL Share Sale, the Leave Order remained subject to review on appeal. However, as stated by Diageo at the time of closing on 4 July�2013, it was considered unlikely that any appeal process in respect of the Leave Order would definitively conclude on a timely basis and, accordingly, Diageo waived the conditionality under the SPA relating to the absence of insolvency proceedings in relation to UBHL and acquired the 10,141,437 USL shares from UBHL at that time.
�
Following closing of the UBHL Share Sale, appeals were filed by various petitioners in respect of the Leave Order. On 20 December�2013, the division bench of the High Court set aside the Leave Order (the 20 December�Order). Following the 20 December�Order, Diageo filed special leave petitions (SLPs) in the Supreme Court of India against the 20 December�Order.
�
�
On 10 February�2014, the Supreme Court of India issued an order admitting the SLPs and ordering that the status quo be maintained with regard to the UBHL Share Sale. The SLPs are scheduled for a next hearing date in the Supreme Court on 21 April�2015.
�
In separate proceedings, the various winding-up petitions against UBHL have been progressing through the High Court since closing of the UBHL Share Sale. In separate rulings issued by the High Court on 22 November�2013 and 13 December�2013, the High Court admitted two of the winding-up petitions against UBHL. An appeal filed by UBHL against the first ruling issued on 22 November�2013 was dismissed by a division bench of the High Court on 16 December�2013. That dismissal is now the subject of a further appeal by UBHL before the Supreme Court of India. On 6 February�2014, UBHL filed an appeal with a division bench of the High Court against the second ruling issued on 13 December�2013 and that appeal is still pending. The High Court admitted a further six winding-up petitions against UBHL on 2 January�2015 and ordered that notice of the petitions be published by the first week of February�2015, with the next hearing date scheduled for 26 February�2015.
�
Diageo continues to believe that the acquisition price of INR 1440 paid to UBHL for the USL shares is fair and reasonable as regards UBHL, UBHL�s shareholders and UBHL�s secured and unsecured creditors. However, adverse results for Diageo in the proceedings referred to above could, absent leave or relief in other proceedings, ultimately result in Diageo losing title to the 10,141,437 USL shares acquired from UBHL. Diageo believes it would remain in control of USL and be able to consolidate USL as a subsidiary regardless of the outcome of this litigation. There can be no certainty as to the outcome of the existing or any further related legal proceedings or the timeframe within which they would be concluded.
�
Diageo also has the benefit of certain contractual undertakings and commitments from the relevant sellers in relation to potential challenges to its unencumbered title to the USL shares acquired on 4 July�2013, including relating to the winding-up petitions described above and/or certain losses and costs that may be incurred in the event of third party actions relating to the acquisition of the USL shares.
�
Separately, Diageo continues to pursue completion of the acquisition of an additional 3,459,090 USL shares (representing 2.38% of the share capital of USL) under the SPA from the USL Benefit Trust. Currently certain lenders to USL are refusing to release security that they hold over those shares notwithstanding that they have been repaid in full. USL is taking steps including proceedings before the High Court to expedite the release of the security. As previously disclosed, if it is not ultimately possible to complete the acquisition in relation to these shares, they would instead continue to be held by the USL Benefit Trust subject to an undertaking that the trustees would only vote the shares at the direction of USL.
�
(f)�Other
The group has extensive international operations and is defendant in a number of legal, customs and tax proceedings incidental to these operations, the outcome of which cannot at present be foreseen. In particular, the group is currently the defendant in various customs proceedings that challenge the declared customs value of products imported by certain Diageo companies. Diageo continues to defend its position vigorously in these proceedings.
�
Save as disclosed above, neither Diageo, nor any member of the Diageo group, is or has been engaged in, nor (so far as Diageo is aware) is there pending or threatened by or against it, any legal or arbitration proceedings which may have a significant effect on the financial position of the Diageo group.
�
14. Related party transactions
�
The group�s significant related parties are its associates, joint ventures, key management personnel and pension plans. There have been no transactions with these related parties during the six months ended 31 December�2014 on terms other than those that prevail in arm�s length transactions.
�
�
UNAUDITED COMPUTATION OF RATIO OF EARNINGS TO FIXED CHARGES
�
|
� |
� |
Six�months�ended |
� |
Year�ended�30�June |
� | ||||||||||
|
� |
� |
2014 |
� |
2013 |
� |
2014 |
� |
2013 |
� |
2012 |
� |
2011 |
� |
2010 |
� |
|
� |
� |
� |
� |
(restated)* |
� |
� |
� |
� |
� |
� |
� |
� |
� |
� |
� |
|
� |
� |
� million |
� |
� million |
� |
� million |
� |
� million |
� |
� million |
� |
� million |
� |
� million |
� |
|
Earnings |
� |
� |
� |
� |
� |
� |
� |
� |
� |
� |
� |
� |
� |
� |
� |
|
Income before taxes on income, non-controlling interests and discontinued operations |
� |
1,640 |
� |
2,134 |
� |
2,711 |
� |
3,057 |
� |
3,043 |
� |
2,281 |
� |
2,188 |
� |
|
Less: capitalised interest |
� |
� |
� |
� |
� |
(4 |
) |
(2 |
) |
(5 |
) |
(4 |
) |
(5 |
) |
|
Less: Share of after tax results of associates and joint ventures |
� |
(113 |
) |
(181 |
) |
(252 |
) |
(217 |
) |
(229 |
) |
(192 |
) |
(155 |
) |
|
Add: Dividends received from associates and joint ventures |
� |
10 |
� |
8 |
� |
228 |
� |
220 |
� |
190 |
� |
150 |
� |
123 |
� |
|
Add: Fixed charges |
� |
418 |
� |
375 |
� |
671 |
� |
758 |
� |
752 |
� |
766 |
� |
998 |
� |
|
� |
� |
1,955 |
� |
2,336 |
� |
3,354 |
� |
3,816 |
� |
3,751 |
� |
3,001 |
� |
3,149 |
� |
|
Fixed charges |
� |
� |
� |
� |
� |
� |
� |
� |
� |
� |
� |
� |
� |
� |
� |
|
Interest payable and other finance charges (note 1) |
� |
398 |
� |
355 |
� |
629 |
� |
716 |
� |
709 |
� |
727 |
� |
963 |
� |
|
Add: Interest capitalised |
� |
� |
� |
� |
� |
4 |
� |
2 |
� |
5 |
� |
4 |
� |
5 |
� |
|
Add: One third of rental expense |
� |
20 |
� |
20 |
� |
38 |
� |
40 |
� |
38 |
� |
35 |
� |
30 |
� |
|
� |
� |
418 |
� |
375 |
� |
671 |
� |
758 |
� |
752 |
� |
766 |
� |
998 |
� |
�
|
� |
� |
ratio |
� |
ratio |
� |
ratio |
� |
ratio |
� |
ratio |
� |
ratio |
� |
ratio |
� |
|
Ratio |
� |
4.7 |
� |
6.2 |
� |
5.0 |
� |
5.0 |
� |
5.0 |
� |
3.9 |
� |
3.2 |
� |
�
* The group has adopted the amendments to IAS 19. Ratio as previously reported for the six months ended 31 December 2013 was 6.3.
�
Notes:
�
(1)�Interest payable and other finance charges for the six months ended 31 December�2014� includes a �61 million charge (31 December�2013 � �70 million; 30 June�2014 � �117 million; 30 June�2013 � �151 million; 30 June�2012 � �151 million; 30 June�2011 � �107 million; 30 June�2010 � �275 million) in respect of fair value adjustments to the group�s derivative instruments. In addition, in the year ended 30 June�2010 a charge of �10 million was recognised in respect of exchange rate translation differences on inter-company funding arrangements where hedge accounting was not applicable.
�
�
�
Pursuant to the requirements of the Securities Exchange Act of 1934, the registrant has duly caused this report to be signed on its behalf by the undersigned, thereunto duly authorised.
�
�
Diageo plc
(Registrant)
�
�
|
/s/ John Nicholls |
� |
|
Name: John Nicholls |
� |
|
Title: Deputy Company Secretary |
� |
|
5 February�2015 |
� |
�
Serious News for Serious Traders! Try StreetInsider.com Premium Free!
You May Also Be Interested In
- BALCONES DISTILLING SEES "WHISKY FROM A NEW PERSPECTIVE" IN LATEST CAMPAIGN
- AirIQ Joins Competitive Carriers Association and Announces Participation in Mobile Carriers Show
- /C O R R E C T I O N -- Smirnoff ICE/
Create E-mail Alert Related Categories
SEC FilingsSign up for StreetInsider Free!
Receive full access to all new and archived articles, unlimited portfolio tracking, e-mail alerts, custom newswires and RSS feeds - and more!
