

Form 6-K DENISON MINES CORP. For: Nov 06
 Tweet
Tweet Share
Share
UNITED STATES
SECURITIES AND EXCHANGE COMMISSION
Washington, D.C. 20549
FORM 6-K
Report of Foreign Private Issuer
Pursuant to Rule 13a-16 or 15d-16
of the Securities Exchange Act of 1934
Date: November 6, 2015
Commission File Number: 001-33414
Denison Mines Corp.
(Translation of registrant’s name into English)
1100 – 40 University Avenue, Toronto, Ontario, M5J 1T1
(Address of principal executive offices)
Indicate by check mark whether the registrant files or will file annual reports under cover Form 20-F or Form 40-F.
Form 20-F ¨ Form 40-F x
Indicate by check mark if the registrant is submitting the Form 6-K in paper as permitted by Regulation S-T Rule 101(b)(1): ¨
Indicate by check mark if the registrant is submitting the Form 6-K in paper as permitted by Regulation S-T Rule 101(b)(7): ¨
Signatures
Pursuant to the requirements of the Securities Exchange Act of 1934, the registrant has duly caused this report to be signed on its behalf by the undersigned, thereunto duly authorized.
| Denison Mines Corp. | ||||||
| Date: November 6, 2015 | /s/ “Sheila Colman” | |||||
| Sheila Colman | ||||||
| Vice President, Legal and Corporate Secretary | ||||||
EXHIBIT INDEX
| Exhibit Number |
Description | |
| 99.1 | Press Release dated November 5, 2015 | |
| 99.2 | Financial Statements for the period ended September 30, 2015 | |
| 99.3 | Management’s Discussion and Analysis for the period ended September 30, 2015 | |
| 99.4 | Certification of Interim Filings – CEO | |
| 99.5 | Certification of Interim Filings – CFO | |
Exhibit 99.1
| Denison Mines Corp. 1100 – 40 University Avenue Toronto, ON M5J 1T1 Ph. 416-979-1991 • Fx. 416-979-5893 • www.denisonmines.com |

|
PRESS RELEASE
DENISON MINES CORP. REPORTS THIRD QUARTER 2015 RESULTS
Toronto, ON – November 5, 2015. Denison Mines Corp. (“Denison” or the “Company”) (DML: TSX, DNN: NYSE MKT) today reported its results for the three- and nine months ended September 30, 2015. All amounts in this release are in U.S. dollars unless otherwise stated.
Highlights
| • | Gryphon Deposit adds 43 Million Pounds of Uranium Resource at the Wheeler River Property: The Company completed an initial mineral resource estimate for the basement hosted Gryphon uranium deposit, which is located three kilometres to the northwest of the high-grade Phoenix deposit. |
The Gryphon deposit is estimated to contain an inferred mineral resource of 43.0 million U3O8 at an average grade of 2.3% U3O8. When combined with the high-grade Phoenix deposit, Wheeler River now contains an indicated resource of 70.2 million pounds U3O8 at a grade of 19.1% U3O8 and inferred resources totaling 44.1 million pounds U3O8 at a combined grade of 2.4%. The significant increase to the mineral resource estimate at Denison’s 60% owned Wheeler River property establishes the project as one of the largest and highest grade undeveloped uranium projects in the Athabasca Basin region.
| • | Appointment of Lukas Lundin as the Company’s Executive Chairman: Throughout his career, Mr. Lundin has been responsible for various resource discoveries, including the multi-million ounce Veladero gold deposit. Mr. Lundin has also led numerous companies through very profitable business acquisitions and mergers, including the sale of Red Back Mining Inc. Mr. Lundin currently sits on the Board of a number of publicly traded companies and has served as a director of Denison since 1997. |
| • | Continued Exploration Success at the Wheeler River Property: The summer drilling program was completed with a total of 24,468 metres of drilling in 34 drill holes. The best result was drill hole WR-604, which intersected 6.3% U3O8 over 5.5 metres (779.0 to 784.5 metres), followed by 11.6% U3O8 over 1.0 metres (790.0 to 791.0 metres), extending the Gryphon Zone of mineralization approximately 50 metres in the down-dip direction. |
Twenty additional drill holes were completed in the general K North area surrounding the Gryphon Zone, to evaluate a variety of targets and identify additional mineralization. The best result from these targets was in drill hole WR-612, located 200 metres south of the unconformity mineralization identified on the WR-595/597 section during the winter 2015 exploration program. WR-612 intersected 2.4% U3O8 over 2.5 metres, approximately 25 metres below the unconformity.
| • | Other pipeline exploration properties provide exciting Summer 2015 Drilling results: Promising results were achieved at some of Denison’s pipeline properties, including at Denison’s 58.94% owned Murphy Lake project, where the first drill hole of the summer 2015 program intersected a new zone of uranium mineralization. Drill hole MP-15-03 returned 0.25% U3O8 over 6.0 metres (270.0 to 276.0 metres) at the unconformity. |
| • | Positive Cash flow from toll milling on track to exceed initial 2015 guidance: The McClean Lake mill, in which Denison holds a 22.5% interest, packaged approximately 6.7 million pounds U3O8 in the first nine months of 2015 for the Cigar Lake Joint Venture (“CLJV”), generating toll milling revenues for Denison of $1.9 million. If production continues at current rates, the McClean Lake mill could produce more than 10 million packaged pounds of U3O8 by the end of this year (previously targeted at six to eight million packaged pounds). The Company’s share of toll milling revenues for the year is now expected to be approximately $2.5 million. |
| • | Update on sale of Mongolian interests: During the second quarter, Denison entered into a share purchase agreement with Uranium Industry a.s. (“UI”), of the Czech Republic, which provided that UI would acquire all of Denison’s interest in uranium projects and operations located in Mongolia in exchange for cash consideration of $20 million, payable upon the achievement of specified milestones and subject to various conditions on closing (the “Mongolian Transaction”). The sale did not close as expected by September 8, 2015, as certain conditions were not satisfied. Denison remains the owner of its Mongolian interests and continues to pursue the closing of a transaction to sell its Mongolian interests to UI. |
| • | Denison and Fission Uranium Corp. (“Fission”) terminate arrangement agreement: On July 27, 2015, Denison entered into an agreement to combine its business with Fission by way of a court approved plan of arrangement (the “Arrangement”). Denison’s shareholders strongly supported the Arrangement. Although a majority of the Fission shareholders approved the Arrangement by the proxy voting deadline, the required two-thirds approval was not obtained. As a result, on October 13, 2015, the Arrangement was terminated. |
Mineral Property Exploration
Global exploration expenditures were $3,919,000 and $13,065,000 during the three and nine months ended September 30, 2015, with approximately 92% of exploration expenditures being incurred in Canada.
Denison’s share of exploration spending on its Canadian properties was $3,753,000 and $12,007,000 during the three and nine months ended September 30, 2015, as compared to $3,099,000 and $12,593,000 during the same periods in 2014. Exploration spending in Canada is seasonal with spending higher during the winter drilling programs (January to mid-April) and summer drilling programs (June to mid-October) in the Athabasca Basin.
Wheeler River
The Wheeler River property lies in close proximity to existing mining and milling infrastructure between the McArthur River Mine and the Key Lake mill complex in the Athabasca Basin in northern Saskatchewan – this infrastructure includes the provincial power grid, provincial highways, air transportation and multiple uranium processing facilities, including the 22.5% Denison owned McClean Lake mill. Denison is the operator and holds a 60% interest in the project, while Cameco holds a 30% interest and JCU (Canada) Exploration Company, Limited (“JCU”) holds a 10% interest. Denison’s share of exploration costs at Wheeler River amounted to $1,829,000 and $4,604,000, respectively, during the three and nine months ended September 30, 2015, compared to $1,423,000 and $4,209,000 in the same periods in 2014.
A total of 24,468 metres of drilling was completed in 34 drill holes during the summer program at Wheeler River, all of which were completed by September 30, 2015. The winter 2015 drilling program was completed in April 2015, with a total of 17,700 metres in 26 holes.
Increased Mineral Resource Estimate at Wheeler River
With the receipt of the final chemical assays from the drilling completed at Gryphon this summer, the Company completed an initial mineral resource estimate for the basement hosted Gryphon uranium deposit, which is located three kilometres to the northwest of the high-grade Phoenix deposit. When combined with the Phoenix deposit, Wheeler River now contains an indicated resource of 70.2 million pounds U3O8 at a grade of 19.1% U3O8 and inferred resources totaling 44.1 million pounds U3O8 at a combined grade of 2.4% – establishing Wheeler River as one of the largest and highest grade undeveloped uranium projects in the Athabasca Basin region.
The following table summarizes the mineral resource estimate for Wheeler River by deposit and classification. Mineral resources for the Phoenix deposit were last updated in 2014 to reflect the expansion of the high-grade zone. As no drilling has been completed since 2014, the resource estimate for the Phoenix deposit remains current.
2015 Wheeler River Property Mineral Resource Estimate Summary(1)(4)
| Deposit |
Category | Tonnes | Grade (% U3O8) |
Million Pounds
U3O8 (100% Basis) |
Million Pounds
U3O8 (Denison’s Share) |
|||||||||||||||
| Gryphon(2) |
Inferred | 834,000 | 2.3 | 43.0 | 25.8 | |||||||||||||||
| Phoenix(3) |
Indicated | 166,000 | 19.1 | 70.2 | 42.1 | |||||||||||||||
| Phoenix(3) |
Inferred | 9,000 | 5.8 | 1.1 | 0.7 | |||||||||||||||
| (1) | CIM Definitions were followed for classification of mineral resources. |
| (2) | Mineral resources for the Gryphon deposit are reported above a cut-off grade of 0.2% U3O8. The cut-off grade is based on internal conceptual studies and a price of US$50 per lb U3O8. |
| (3) | Mineral resources for the Phoenix deposit are reported above a cut-off grade of 0.8% U3O8. The cut-off grade is based on internal conceptual studies and a price of US$50 per lb U3O8. |
| (4) | Numbers may not add due to rounding. |
- 2 -
The mineral resource estimate was completed by RPA Inc (“RPA”), in accordance with National Instrument 43-101 (“NI 43-101”). For the Gryphon deposit, RPA used data collected from four surface diamond drilling campaigns completed during the last two years. Uranium grade data is comprised of chemical assays on half split drill core samples. Drill core recovery in the Gryphon deposit area is good, and therefore no down-hole gamma probe data was required for the estimate. The mineral resource estimate for the Gryphon deposit was classified as inferred based on the drill hole spacing and apparent continuity of mineralization.
Gryphon Drilling
The Gryphon deposit, located approximately three kilometres northwest of the high grade Phoenix uranium deposit, was discovered in 2014. The highest grade intersection to date at Gryphon was returned from drill hole WR-573D1, which intersected 22.2% U3O8 over 2.5 metres.
Seven of the 12 drill holes completed during the winter 2015 program, targeting extensions of the Gryphon zone, intersected significant uranium mineralization. As a result, the zone was extended up-plunge, down-plunge, and up-dip on two sections. Following up on the success from the winter program, seven drill holes completed during the summer 2015 program were designed to complete a 50 metre x 50 metre spaced drill pattern at Gryphon and outline the extent of the mineralization in the down-dip and down-plunge directions. The best result was in drill hole WR-604, which intersected 6.3% U3O8 over 5.5 metres (779.0 to 784.5 metres), followed by 11.6% U3O8 over 1.0 metres (790.0 to 791.0 metres)—extending the previously identified zone of mineralization approximately 50 metres in the down-dip direction.
Exploration in the K North Area
The K North Area is a new area of highly prospective targets surrounding the Gryphon Zone. This Area together with the K Central Area define a contiguous geological trend that runs along the western side of the Wheeler River property for approximately six kilometers and remains largely untested.
During the winter 2015 exploration program, 14 drill holes were completed to explore for other areas of mineralization along strike to the south of the Gryphon deposit. This resulted in the discovery of a new zone of uranium mineralization, occurring at the unconformity, 800 metres to the south of Gryphon. The discovery was highlighted by the results in drill holes WR-595 and WR-597.
Following the discovery of the new zone of uranium mineralization occurring at the unconformity, the summer 2015 exploration program followed up with 20 drill holes in the K North Area, to the south, north and west of Gryphon, to evaluate a variety of targets and identify additional mineralization. The best result from these targets was in drill hole WR-612, located 200 metres south of the unconformity mineralization identified on the WR-595/597 section during the winter 2015 exploration program. WR-612 intersected 2.4% U3O8 over 2.5 metres, approximately 25 metres below the unconformity.
Exploration Pipeline Properties
During the summer 2015 exploration program, Denison carried out exploration or geophysical surveys on nine other properties within its landholdings on the eastern side of the Athabasca Basin. Work on these pipeline exploration projects continues to deliver encouraging results.
Murphy Lake – The first drill hole of the summer 2015 program intersected a new zone of uranium mineralization. Assays for drill hole MP-15-03 returned 0.25% U3O8 over 6.0 metres (270.0 to 276.0 metres). As the mineralization is interpreted to be horizontal and the drill holes are steeply inclined, the true thickness is expected to be at least 75% of the intersection length. Murphy Lake is located approximately 30 kilometres northwest of the McClean Lake mill and is a joint venture with Eros Resources Inc. (41.06% interest). The 2015 program at Murphy Lake is being fully funded by Denison as a result of Eros’ choice to dilute its interest.
Waterbury Lake – Work was focused on the Oban target area. Ground geophysical surveys completed earlier in the year improved the geological interpretation of the area and highlighted several drill targets that were tested during the summer drilling program. The best result was obtained from drill hole WL-425, which intersected 6.5 metres of elevated uranium from 239.5 to 246.0 metres that included 0.3% U3O8 over 0.5 metres and 0.1% U3O8 over 0.5 metres. Waterbury Lake is a joint venture between Denison (61.55% interest and operator) and the Korea Waterbury Uranium Limited Partnership (38.45% interest). On September 30, 2015, Denison earned an additional 1.55% interest in the Waterbury Lake project.
- 3 -
Crawford Lake – A large zone of intense sandstone alteration along the CR-2 and CR-5 conductors was extended by the summer drilling program and has now been confirmed over a strike length of 2.9 kilometres. While no significant uranium mineralization was intersected in 2015, the volume and tenor of the alteration system is encouraging and remains a priority for future exploration activities. Crawford Lake is 100% owned by Denison.
Africa
Exploration expenses in Africa during the three and nine months ended September 30, 2015 were $153,000 and $677,000, respectively. During the same periods in 2014, exploration expenses were $288,000 and $689,000. Exploration activity planned for 2015 has been designed to maintain the Company’s claims in good standing while advancing the exploration potential of its assets as part of a strategy to pursue a spin-out or disposal transaction when market conditions permit.
In Zambia, an excavator trenching program was completed during the second quarter of 2015 and a program of surficial geochemistry was subsequently completed during the third quarter of 2015. Results of the trenching and geochemistry programs are positive and several drill-ready targets have been identified.
In Mali, an application was made to renew the Falea exploration permit in February 2015. The convention for a new permit was signed by the Minister of Mines in July 2015 and the final exploration permit was issued during the third quarter.
An independent mineral resource estimate has been completed for the Falea deposit and is summarized in the table below.
2015 Falea Property Mineral Resource Estimate Summary
| Category | Tonnes (Million tonnes) |
U3O8 (%) |
Cu (%) |
Ag (Grams per Tonne) |
U3O8 (Million Pounds) |
Cu (Million Pounds) |
Ag (Million Ounces) |
|||||||||||||||||||||
| Indicated |
6.88 | 0.115 | 0.161 | 72.8 | 17.4 | 24.4 | 16.11 | |||||||||||||||||||||
| Inferred |
8.78 | 0.069 | 0.200 | 17.3 | 13.4 | 38.7 | 4.90 | |||||||||||||||||||||
The Falea deposit mineral resource estimate was completed by RPA in accordance with NI 43-101.
Mongolia
Exploration expenditures on the GSJV properties totaled $13,000 and $381,000 during the three and nine months ended September 30, 2015, compared to $42,000 and $332,000 during the same periods in 2014. Expenditures in both periods were primarily related to annual license payments, required to maintain the GSJV properties in good standing while the Company explored strategic alternatives regarding its ownership interest in the GSJV.
Financial Results
| (in thousands) | As at September 30, 2015 |
As at December 31, 2014 |
||||||
| Financial Position: |
||||||||
| Cash and cash equivalents |
$ | 7,061 | $ | 18,640 | ||||
| Short term investments |
7,527 | 4,381 | ||||||
| Long term investments |
466 | 954 | ||||||
|
|
|
|
|
|||||
| Cash, cash equivalents and investments |
$ | 15,054 | $ | 23,975 | ||||
| Working capital |
$ | 13,687 | $ | 22,542 | ||||
| Property, plant and equipment |
$ | 227,192 | $ | 270,388 | ||||
| Total assets |
$ | 257,035 | $ | 311,330 | ||||
| Total long-term liabilities |
$ | 35,427 | $ | 42,291 | ||||
|
|
|
|
|
|||||
| Three Months Ended | Nine Months Ended | |||||||||||||||
| (in thousands, except for per share amounts) | September 30, 2015 |
September 30, 2014 |
September 30, 2015 |
September 30, 2014 |
||||||||||||
| Results of Operations: |
||||||||||||||||
| Total revenues |
$ | 3,526 | $ | 2,351 | $ | 8,783 | $ | 6,883 | ||||||||
| Net loss |
$ | (21,432 | ) | $ | (2,820 | ) | $ | (35,360 | ) | $ | (27,051 | ) | ||||
| Basic and diluted loss per share |
$ | (0.04 | ) | $ | (0.01 | ) | $ | (0.07 | ) | $ | (0.06 | ) | ||||
|
|
|
|
|
|
|
|
|
|||||||||
- 4 -
Revenue
During 2015, the McClean Lake mill continued to process ore received from the Cigar Lake mine under a toll milling agreement. The mill packaged approximately 6.7 million pounds U3O8 for the CLJV. The Company’s share of toll milling revenue from processing Cigar Lake ore at the McClean Lake mill, during the three and nine months ended September 30, 2015, totaled $982,000 and $1,904,000, respectively. In 2014, toll milling revenue was only recognized in the fourth quarter, as the first drums of CLJV uranium were packaged in October 2014.
Revenue from DES during the three and nine months ended September 30, 2015 was $2,113,000 and $5,527,000, respectively, compared to $1,956,000 and $5,263,000 during the same periods in 2014. In the nine months ended September 20, 2015, DES experienced an increase in Canadian dollar revenues due to an increase in activity at certain care and maintenance sites, which was largely offset by the unfavourable fluctuation in foreign exchange rates applicable on the translation of revenues earned in Canadian dollars.
Revenue from the Company’s management contract with UPC was $431,000 and $1,352,000 during the three and nine months ended September 30, 2015, compared to $395,000 and $1,620,000 for the same periods in 2014. The decrease in revenues during 2015 was due to a reduction in purchase commissions earned from UPC’s purchases of uranium and a decrease in management fees earned based on UPC’s monthly net asset value during the period.
Operating Expenses
McClean Lake is comprised of several uranium deposits and a high-grade uranium mill and is located on the eastern edge of the Athabasca Basin in northern Saskatchewan, approximately 750 kilometres north of Saskatoon. The McClean Lake uranium mill is one of the world’s largest uranium processing facilities. Expansion of the mill from 13 million to 24 million pounds annual U3O8 production capacity is ongoing while the mill processes ore from Cigar Lake under a toll milling agreement. Commissioning of the mill up to 18 million pounds annual U3O8 production capacity has begun and is expected to be completed in late 2015 or early 2016. The expansion remains fully funded by the CLJV.
Operating expenses in Canada were $617,000 and $1,283,000 during the three and nine months ended September 30, 2015, compared to $140,000 and $397,000 in the same periods in 2014. Most of the operating expenses are attributable to activity involving the McClean Lake joint venture. Operating costs were higher during 2015 primarily due to depreciation of mill capital assets, as a result of the processing of Cigar Lake ore at the McClean Lake mill.
Operating expenses during the three and nine months ended September 30, 2015 include costs relating to Denison Environmental Services (“DES”) totaling $1,858,000 and $5,062,000, respectively, compared to $1,764,000 and $4,967,000 in the same periods in 2014. During 2015, DES experienced an increase in Canadian dollar operating expenses due to an increase in activity at certain care and maintenance sites, which was largely offset by the favourable fluctuation in foreign exchange rates applicable on the translation of expenses incurred in Canadian dollars.
General and Administrative
Total general and administrative expenses were $2,466,000 and $5,803,000 during the three and nine months ended September 30, 2015, compared with $1,535,000 and $6,041,000 during the same periods in 2014. These costs are mainly comprised of head office salaries and benefits, office costs in multiple regions, audit and regulatory costs, legal fees, investor relations expenses, project costs and all other costs related to operating a public company with listings in Canada and the United States. The decrease in general and administrative expenses for the nine months ending September 30, 2015, was primarily a result of a decrease in office costs and the favourable fluctuation in foreign exchange rates applicable on the translation of Canadian dollar expenses, partly offset by an increase in project costs associated with the Arrangement of $1,181,000.
Foreign Exchange Income and Expense
During the three and nine months ended September 30, 2015, foreign exchange expense was $16,294,000 and $20,551,000, respectively, compared with foreign exchange income of $1,487,000 and foreign exchange expense of $8,566,000 during the same periods in 2014. The increase in the foreign exchange expense during 2015 is due to unfavourable fluctuations in foreign exchange rates primarily related to the weakening of the Zambian Kwacha against the US dollar, resulting in a foreign exchange expense on the revaluation of US dollar denominated intercompany debt.
- 5 -
Other Income and Expenses
The Company recognized other income of $64,000 and other expenses of $539,000 during the three and nine months ended September 30, 2015, respectively, compared to other expenses of $81,000 and other income of $561,000 during the same periods in 2014. The Company recognized $423,000 in losses on investments carried at fair value during the nine months ended September 30, 2015.
Liquidity & Capital Resources
Cash and cash equivalents were $7,061,000 at September 30, 2015 compared with $18,640,000 at December 31, 2014. The decrease of $11,579,000 was primarily due to net cash used in operations of $15,001,000, net cash used in investing activities of $6,317,000 and a net foreign exchange loss of $1,969,000 on the translation of currency balances at period end, partly offset by net cash provided by financing activities of $11,708,000.
Net cash used in operating activities of $15,001,000 during the nine months ended September 30, 2015 is comprised of a net loss for the period adjusted for non-cash items and changes in working capital items.
Net cash used in investing activities of $6,317,000 consists primarily of cash used to purchase investments of $8,134,000 and property, plant and equipment of $1,871,000, partly offset by cash provided by the maturity of investments in debt instruments totaling $4,033,000. Property, plant and equipment spending includes the additional 1.55% interest earned on the Waterbury Lake property of $835,000.
Net cash provided by financing activities of $11,708,000 largely reflects net proceeds received on the issuance of flow-through common shares. On May 26, 2015, the Company closed a CAD$15 million private placement for the issuance of 12,000,000 flow-through common shares at a price of CAD$1.25 per share. The proceeds will be used to fund the Company’s Canadian exploration programs through to the end of 2016. As at September 30, 2015, the company has spent CAD$373,000 towards its obligation to spend CAD$15 million on eligible Canadian exploration expenses associated with this financing. Other financing activities included proceeds received from the issuance of common shares on the exercise of stock options and warrants for a total of $411,000.
As at September 30, 2015, the Company has fulfilled its obligation to spend CAD$14,997,000 on eligible Canadian exploration expenses under the flow-through share financing completed in August 2014.
The Company holds a large majority of its cash and investments in Canadian dollars. As at September 30, 2015, the Company’s cash and cash equivalents and current investments amount to CAD$19,468,000.
Reclamation Sites
Elliot Lake – Spending on restoration activities at the Elliot Lake sites is funded from monies in the Elliot Lake Reclamation Trust Fund. At September 30, 2015, the amount of restricted cash and investments relating to the Elliot Lake Reclamation Trust fund was $2,212,000.
McClean Lake and Midwest – Under the Mineral Industry Environmental Protection Regulations, 1996, the Company is required to provide its pro-rata share of financial assurances to the Province. The Company has in place irrevocable standby letters of credit from a chartered bank in favour of Saskatchewan’s Ministry of Environment, totaling CAD$9,698,000 which relate to a previously filed reclamation plan. Under the preliminary updated plan submitted in November 2014, the Company expects to increase its pro-rata share of financial assurances to the Province to approximately CAD$22,446,000.
Outstanding Share Data
At November 5, 2015, there were 518,438,669 common shares issued and outstanding, stock options outstanding for 7,057,210 Denison common shares, and nil warrants outstanding for a total of 525,495,879 common shares on a fully-diluted basis.
- 6 -
Outlook for 2015
At the end of the second quarter, the Company’s Previous Outlook was revised to reflect additional spending in Mongolia incurred in connection with the Mongolian Transaction. The Previous Outlook also includes modifications that were made at the end of the first quarter for revisions to the budgeted USD$ to CAD$ foreign exchange rate to 1.24 from 1.12, as a result of the significant devaluation of the Canadian dollar. The Company’s Current Outlook has been further modified at the end of the third quarter, to reflect actual expenditures as at September 30, 2015 and to incorporate updated spending estimates for the remainder of the year.
| (in thousands) | Previous Outlook 2015 (1)(4) |
Current Outlook 2015 (1) |
Actual to September 30, 2015 (3) |
|||||||||
| Canada (2) |
||||||||||||
| Toll Milling Revenue |
$ | 2,080 | $ | 2,540 | $ | 1,887 | ||||||
| Mineral Sales |
1,120 | — | — | |||||||||
| Mineral Property Exploration |
(12,890 | ) | (13,070 | ) | (12,465 | ) | ||||||
| Development & Operations |
(1,620 | ) | (1,250 | ) | (733 | ) | ||||||
|
|
|
|
|
|
|
|||||||
| (11,310 | ) | (11,780 | ) | (11,311 | ) | |||||||
| Africa |
||||||||||||
| Zambia, Mali and Namibia |
(2,340 | ) | (2,240 | ) | (1,586 | ) | ||||||
|
|
|
|
|
|
|
|||||||
| (2,340 | ) | (2,240 | ) | (1,586 | ) | |||||||
| Asia |
||||||||||||
| Mongolia |
(1,200 | ) | (1,300 | ) | (1,117 | ) | ||||||
|
|
|
|
|
|
|
|||||||
| (1,200 | ) | (1,300 | ) | (1,117 | ) | |||||||
| Other Activities (2) |
||||||||||||
| UPC Management |
1,680 | 1,680 | 1,237 | |||||||||
| DES Environmental Services |
150 | 400 | 346 | |||||||||
| Corporate General & Administration |
(4,150 | ) | (5,470 | ) | (4,406 | ) | ||||||
|
|
|
|
|
|
|
|||||||
| (2,320 | ) | (3,390 | ) | (2,823 | ) | |||||||
|
|
|
|
|
|
|
|||||||
| Total |
$ | (17,170 | ) | $ | (18,710 | ) | $ | (16,837 | ) | |||
|
|
|
|
|
|
|
|||||||
| (1) | Only material operations are shown. |
| (2) | Outlook figures have been converted using a US$ to CAD$ exchange rate of 1.24. |
| (3) | The Company budgets on a cash basis. As a result, actual amounts represent a non-GAAP measure and excludes non-cash depreciation and amortization amounts totaling $1,844,000. |
| (4) | Reflects Outlook 2015 figures as disclosed in the Six Months Ended June 30, 2015 MD&A. |
Canada
Toll Milling Revenue, Mineral Sales, Development & Operations
If production continues at current rates, the McClean Lake mill could produce more than 10 million packaged pounds of U3O8 by the end of this year (previously targeted at six to eight million packaged pounds). To reflect the increase in production, toll milling revenue for 2015 is now projected to total $2.5 million. Production will be primarily from Cigar Lake ore.
Mineral sales of approximately 26,000 pounds U3O8 recovered from McClean Lake ore has been deferred until market conditions improve.
Denison’s share of operating and capital expenditures at McClean Lake for 2015 is now forecasted to be $260,000, while total expenditures on SABRE, McClean North and Midwest projects remain unchanged and are planned to be CAD$900,000 on SABRE (Denison’s share, CAD$203,000) and CAD$375,000 on McClean North and Midwest (Denison’s share, CAD$94,000).
Reclamation expenditures at Elliot Lake are now projected to be $550,000.
Mineral Property Exploration
All field activities for 2015 are now complete and the results have been presented. Annual assessment reports are being written and planning is well under way for the 2016 exploration season, which will begin with winter programs starting in January after freeze-up in northern Saskatchewan.
- 7 -
Wheeler River
Given the close proximity of the Gryphon and Phoenix deposits, the Company is currently working on a Preliminary Economic Assessment (“PEA”) to validate the co-development potential of the two deposits as a single uranium development project. The results of the PEA are expected in early fiscal 2016.
Exploration is also expected to continue around the Gryphon deposit, where recent drilling has continued to return encouraging results that suggest the area around Gryphon and the entire K-North trend has the potential to host additional zones of significant basement and unconformity mineralization related to the Gryphon deposit.
In 2016, two other areas beyond the K-North trend called the O Zone and Q Central area are also expected to be explored. The O Zone is characterized by weak uranium mineralization along a strong conductor associated with an 80 metre offset of the unconformity. This large area has been tested by only six historic drill holes, five of which were completed too far into the hangingwall side of the structure and failed to intersect the fault. Drilling at Q Central, in the past, has returned significant uranium intersections, including 1.5% U3O8 over 0.5 metres in drill hole WR-204, associated with faulted graphitic pelites in contact with quartzite and warrants follow up.
Africa
The Company has now forecasted spending to be approximately $2.2 million during 2015 to maintain its projects in good standing, while the Company waits for market conditions that will permit a spin-out or disposal of its African portfolio. On its wholly owned Mutanga project in Zambia, activities to follow up on exploration targets generated through soil and radon sampling are being considered. In Mali, activities continue to focus on following up on the recently completed airborne geophysical surveying.
Asia
In Mongolia, the Company continues to pursue a sale of its 85% interest in the GSJV to UI. The current outlook for Mongolia has increased to $1.3 million for 2015, to reflect additional spending incurred in relation to the Mongolian Transaction activities.
Other Activities
The forecast for management fees generated from Denison’s management services agreement with UPC remain unchanged as are budgeted to be CAD$2.1 million in 2015.
At DES, revenue from operations is now forecasted to be $7.0 million and operating and capital expenses are now projected to be $6.6 million, resulting in an increase DES’ contribution of roughly $250,000.
Corporate general and administration expenses are now forecasted to be $5.5 million in 2015 to reflect additional project costs associated with the Arrangement.
Qualified Person
The disclosure of scientific and technical information regarding Denison’s properties in the MD&A was prepared by or reviewed by Steve Blower, P. Geo., the Company’s Vice President, Exploration, and Terry Wetz, P.E., the Executive Director of the GSJV, who are Qualified Persons in accordance with the requirements of NI 43-101. For a description of the quality assurance program and quality control measures applied by Denison, please see Denison’s Annual Information Form dated March 5, 2015 available at www.sedar.com, and its Form 40-F available at www.sec.gov/edgar.shtml.
Additional Information
Denison’s consolidated financial statements for the nine month period ended March 31, 2015 and related management’s discussion and analysis are available on Denison’s website at www.denisonmines.com or under its profile on SEDAR at www.sedar.com and on EDGAR at www.sec.gov/edgar.shtml.
About Denison
Denison was formed under the laws of Ontario and is a reporting issuer in all Canadian provinces. Denison’s common shares are listed on the Toronto Stock Exchange (the “TSX”) under the symbol “DML” and on the NYSE MKT exchange under the symbol “DNN”.
- 8 -
Denison is a uranium exploration and development company with interests focused in the Athabasca Basin region of northern Saskatchewan. Including its 60% owned Wheeler River project, which hosts the high grade Phoenix and Gryphon uranium deposits, Denison’s exploration portfolio consists of numerous projects covering over 390,000 hectares in the eastern Athabasca Basin. Denison’s interests in Saskatchewan also include a 22.5% ownership interest in the McClean Lake joint venture, which includes several uranium deposits and the McClean Lake uranium mill, which is currently processing ore from the Cigar Lake mine under a toll milling agreement, plus a 25.17% interest in the Midwest deposit and a 61.55% interest in the J Zone deposit on the Waterbury Lake property. Both the Midwest and J Zone deposits are located within 20 kilometres of the McClean Lake mill. Internationally, Denison owns 100% of the conventional heap leach Mutanga project in Zambia, 100% of the uranium/copper/silver Falea project in Mali, a 90% interest in the Dome project in Namibia, and an 85% interest in the in-situ recovery projects held by the Gurvan Saihan joint venture (“GSJV”) in Mongolia.
Denison is engaged in mine decommissioning and environmental services through its Denison Environmental Services (“DES”) division, which manages Denison’s Elliot Lake reclamation projects and provides post-closure mine and maintenance services to a variety of customers.
Denison is also the manager of Uranium Participation Corporation (“UPC”), a publicly traded company listed on the TSX under the symbol “U”, which invests in uranium oxide and uranium hexafluoride.
For more information, please contact
| David Cates President and Chief Executive Officer |
(416) 979-1991 ext 362 |
| Sophia Shane Investor Relations |
(604) 689-7842 |
CAUTIONARY STATEMENT REGARDING FORWARD-LOOKING STATEMENTS
Certain information contained in this press release constitutes “forward-looking information”, within the meaning of the United States Private Securities Litigation Reform Act of 1995 and similar Canadian legislation concerning the business, operations and financial performance and condition of Denison.
Generally, these forward-looking statements can be identified by the use of forward-looking terminology such as “plans”, “expects” or “does not expect”, “is expected”, “budget”, “scheduled”, “estimates”, “forecasts”, “intends”, “anticipates” or “does not anticipate”, or “believes”, or variations of such words and phrases or state that certain actions, events or results “may”, “could”, “would”, “might” or “will be taken”, “occur”, “be achieved” or “has the potential to”.
Forward looking statements are based on the opinions and estimates of management as of the date such statements are made, and they are subject to known and unknown risks, uncertainties and other factors that may cause the actual results, level of activity, performance or achievements of Denison to be materially different from those expressed or implied by such forward-looking statements. Denison believes that the expectations reflected in this forward-looking information are reasonable but no assurance can be given that these expectations will prove to be correct and such forward-looking information included in this press release should not be unduly relied upon. This information speaks only as of the date of this press release. In particular, this press release may contain forward-looking information pertaining to the following: the likelihood of completing and benefits to be derived from corporate transactions; the estimates of Denison’s mineral reserves and mineral resources; expectations regarding the toll milling of Cigar Lake ores; capital expenditure programs, estimated exploration and development expenditures and reclamation costs; expectations of market prices and costs; supply and demand for uranium (“U3O8”); possible impacts of litigation and regulatory actions on Denison; exploration, development and expansion plans and objectives; expectations regarding adding to its mineral reserves and resources through acquisitions and exploration; and receipt of regulatory approvals, permits and licences under governmental regulatory regimes.
There can be no assurance that such statements will prove to be accurate, as Denison’s actual results and future events could differ materially from those anticipated in this forward-looking information as a result of the factors discussed in the “Risk Factors” section in Denison’s Management’s Discussion and Analysis dated August 5, 2015, Annual Information Form dated March 5, 2015 and available at www.sedar.com and in its Form 40-F available at www.sec.gov/edgar.shtml.
Accordingly, readers should not place undue reliance on forward-looking statements. These factors are not, and should not be construed as being, exhaustive. Statements relating to “mineral reserves” or “mineral resources” are deemed to be forward-looking information, as they involve the implied assessment, based on certain estimates and assumptions that the mineral reserves and mineral resources described can be profitably produced in the future. The forward-looking information contained in this press release is expressly qualified by this cautionary statement. Denison does not undertake any obligation to publicly update or revise any forward-looking information after the date of this press release to conform such information to actual results or to changes in Denison’s expectations except as otherwise required by applicable legislation.
Cautionary Note to United States Investors Concerning Estimates of Measured, Indicated and Inferred Mineral Resources: This press release may use the terms “measured”, “indicated” and “inferred” mineral resources. United States investors are advised that while such terms are recognized and required by Canadian regulations, the United States Securities and Exchange Commission does not recognize them. “Inferred mineral resources” have a great amount of uncertainty as to their existence, and as to their economic and legal feasibility. It cannot be assumed that all or any part of an inferred mineral resource will ever be upgraded to a higher category. Under Canadian rules, estimates of inferred mineral resources may not form the basis of feasibility or other economic studies. United States investors are cautioned not to assume that all or any part of measured or indicated mineral resources will ever be converted into mineral reserves. United States investors are also cautioned not to assume that all or any part of an inferred mineral resource exists, or is economically or legally mineable.
- 9 -
Exhibit 99.2

DENISON MINES CORP.
Condensed Interim Consolidated Financial Statements
for the three and nine months ending
September 30, 2015
DENISON MINES CORP.
Condensed Interim Consolidated Statements of Financial Position
(Unaudited—Expressed in thousands of U.S. dollars except for share amounts)
| At September 30 2015 |
At December 31 2014 |
|||||||
| ASSETS |
||||||||
| Current |
||||||||
| Cash and cash equivalents (note 4) |
$ | 7,061 | $ | 18,640 | ||||
| Investments (note 7) |
7,527 | 4,381 | ||||||
| Trade and other receivables (note 5) |
8,140 | 9,411 | ||||||
| Inventories (note 6) |
2,280 | 2,240 | ||||||
| Prepaid expenses and other |
363 | 850 | ||||||
|
|
|
|
|
|||||
| 25,371 | 35,522 | |||||||
| Non-Current |
||||||||
| Inventories-ore in stockpiles (note 6) |
1,572 | 1,760 | ||||||
| Investments (note 7) |
466 | 954 | ||||||
| Restricted cash and investments (note 8) |
2,212 | 2,068 | ||||||
| Property, plant and equipment (note 9) |
227,192 | 270,388 | ||||||
| Intangibles |
222 | 638 | ||||||
|
|
|
|
|
|||||
| Total assets |
$ | 257,035 | $ | 311,330 | ||||
|
|
|
|
|
|||||
| LIABILITIES |
||||||||
| Current |
||||||||
| Accounts payable and accrued liabilities |
$ | 8,905 | $ | 10,050 | ||||
| Current portion of long-term liabilities: |
||||||||
| Post-employment benefits (note 10) |
225 | 259 | ||||||
| Reclamation obligations (note 11) |
614 | 706 | ||||||
| Debt obligations |
14 | 30 | ||||||
| Other liabilities (note 13) |
1,926 | 1,935 | ||||||
|
|
|
|
|
|||||
| 11,684 | 12,980 | |||||||
| Non-Current |
||||||||
| Post-employment benefits (note 10) |
2,270 | 2,662 | ||||||
| Reclamation obligations (note 11) |
15,006 | 16,953 | ||||||
| Debt obligations |
— | 9 | ||||||
| Other liabilities (note 13) |
694 | 841 | ||||||
| Deferred income tax liability |
17,457 | 21,826 | ||||||
|
|
|
|
|
|||||
| Total liabilities |
47,111 | 55,271 | ||||||
|
|
|
|
|
|||||
| EQUITY |
||||||||
| Share capital (note 14) |
1,130,779 | 1,120,758 | ||||||
| Share purchase warrants (note 15) |
— | 376 | ||||||
| Contributed surplus |
53,844 | 53,321 | ||||||
| Deficit |
(927,897 | ) | (892,537 | ) | ||||
| Accumulated other comprehensive income (loss) (note 17) |
(46,802 | ) | (25,859 | ) | ||||
|
|
|
|
|
|||||
| Total equity |
209,924 | 256,059 | ||||||
|
|
|
|
|
|||||
| Total liabilities and equity |
$ | 257,035 | $ | 311,330 | ||||
|
|
|
|
|
|||||
| Issued and outstanding common shares (note 14) |
518,438,669 | 505,868,894 | ||||||
|
|
|
|
|
|||||
| Subsequent events (note 23) |
||||||||
The accompanying notes are integral to the condensed interim consolidated financial statements
- 2 -
DENISON MINES CORP.
Condensed Interim Consolidated Statements of Income (Loss) and Comprehensive Income (Loss)
(Unaudited—Expressed in thousands of U.S. dollars except for share and per share amounts)
| Three Months Ended | Nine Months Ended | |||||||||||||||
| September 30 | September 30 | September 30 | September 30 | |||||||||||||
| 2015 | 2014 | 2015 | 2014 | |||||||||||||
| REVENUES (note 19) |
$ | 3,526 | $ | 2,351 | $ | 8,783 | $ | 6,883 | ||||||||
|
|
|
|
|
|
|
|
|
|||||||||
| EXPENSES |
||||||||||||||||
| Operating expenses (note 18) |
(2,701 | ) | (2,199 | ) | (7,069 | ) | (7,188 | ) | ||||||||
| Mineral property exploration (note 19) |
(3,919 | ) | (3,429 | ) | (13,065 | ) | (13,614 | ) | ||||||||
| General and administrative (note 19) |
(2,466 | ) | (1,535 | ) | (5,803 | ) | (6,041 | ) | ||||||||
| Impairment-mineral properties |
— | — | — | (1,658 | ) | |||||||||||
| Foreign exchange income (expense) |
(16,294 | ) | 1,487 | (20,551 | ) | (8,566 | ) | |||||||||
| Other income (expense) (note 18) |
64 | (81 | ) | (539 | ) | 561 | ||||||||||
|
|
|
|
|
|
|
|
|
|||||||||
| (25,316 | ) | (5,757 | ) | (47,027 | ) | (36,506 | ) | |||||||||
|
|
|
|
|
|
|
|
|
|||||||||
| Income (loss) before finance charges |
(21,790 | ) | (3,406 | ) | (38,244 | ) | (29,623 | ) | ||||||||
| Finance income (expense) (note 18) |
(198 | ) | (128 | ) | (504 | ) | (133 | ) | ||||||||
|
|
|
|
|
|
|
|
|
|||||||||
| Income (loss) before taxes |
(21,988 | ) | (3,534 | ) | (38,748 | ) | (29,756 | ) | ||||||||
| Income tax recovery (expense) (note 21) |
||||||||||||||||
| Current |
— | (5 | ) | — | (5 | ) | ||||||||||
| Deferred |
556 | 719 | 3,388 | 2,710 | ||||||||||||
|
|
|
|
|
|
|
|
|
|||||||||
| Net income (loss) for the period |
$ | (21,432 | ) | $ | (2,820 | ) | $ | (35,360 | ) | $ | (27,051 | ) | ||||
|
|
|
|
|
|
|
|
|
|||||||||
| Items that may be reclassified to income (loss): |
||||||||||||||||
| Unrealized gain (loss) on investments-net of tax |
1 | (1 | ) | 1 | 9 | |||||||||||
| Foreign currency translation change |
(5,131 | ) | (13,864 | ) | (20,944 | ) | (8,770 | ) | ||||||||
|
|
|
|
|
|
|
|
|
|||||||||
| Comprehensive income (loss) for the period |
$ | (26,562 | ) | $ | (16,685 | ) | $ | (56,303 | ) | $ | (35,812 | ) | ||||
|
|
|
|
|
|
|
|
|
|||||||||
| Net income (loss) per share: |
||||||||||||||||
| Basic and diluted |
$ | (0.04 | ) | $ | (0.01 | ) | $ | (0.07 | ) | $ | (0.06 | ) | ||||
|
|
|
|
|
|
|
|
|
|||||||||
| Weighted-average number of shares outstanding (in thousands): |
||||||||||||||||
| Basic and diluted |
518,439 | 500,921 | 511,740 | 490,731 | ||||||||||||
|
|
|
|
|
|
|
|
|
|||||||||
The accompanying notes are integral to the condensed interim consolidated financial statements
- 3 -
DENISON MINES CORP.
Condensed Interim Consolidated Statements of Changes in Equity
(Unaudited—Expressed in thousands of U.S. dollars)
| Nine Months Ended | ||||||||
| September 30 | September 30 | |||||||
| 2015 | 2014 | |||||||
| Share capital |
||||||||
| Balance-beginning of period |
$ | 1,120,758 | $ | 1,092,144 | ||||
| Shares issued-net of issue costs |
11,318 | 12,849 | ||||||
| Flow-through share premium |
(2,028 | ) | (2,030 | ) | ||||
| Shares issued on acquisition of Rockgate Capital Corp |
— | 3,034 | ||||||
| Shares issued on acquisition of International Enexco Limited |
— | 11,979 | ||||||
| Shares issued to settle payable and accrued liability obligations |
— | 610 | ||||||
| Share options exercised-cash |
5 | 946 | ||||||
| Share options exercised-non cash |
4 | 525 | ||||||
| Share purchase warrants exercised-cash |
406 | 304 | ||||||
| Share purchase warrants exercised-non cash |
316 | 225 | ||||||
|
|
|
|
|
|||||
| Balance-end of period |
1,130,779 | 1,120,586 | ||||||
|
|
|
|
|
|||||
| Share purchase warrants |
||||||||
| Balance-beginning of period |
376 | 616 | ||||||
| Warrants issued on acquisition of International Enexco Limited |
— | 61 | ||||||
| Warrants exercised |
(316 | ) | (225 | ) | ||||
| Warrants expired |
(60 | ) | — | |||||
|
|
|
|
|
|||||
| Balance-end of period |
— | 452 | ||||||
|
|
|
|
|
|||||
| Contributed surplus |
||||||||
| Balance-beginning of period |
53,321 | 52,943 | ||||||
| Stock-based compensation expense |
467 | 620 | ||||||
| Share options issued on acquisition of International Enexco Limited |
— | 102 | ||||||
| Share options exercised-non cash |
(4 | ) | (525 | ) | ||||
| Warrants expired |
60 | — | ||||||
|
|
|
|
|
|||||
| Balance-end of period |
53,844 | 53,140 | ||||||
|
|
|
|
|
|||||
| Deficit |
||||||||
| Balance-beginning of period |
(892,537 | ) | (860,834 | ) | ||||
| Net loss |
(35,360 | ) | (27,051 | ) | ||||
|
|
|
|
|
|||||
| Balance-end of period |
(927,897 | ) | (887,885 | ) | ||||
|
|
|
|
|
|||||
| Accumulated other comprehensive income (loss) |
||||||||
| Balance-beginning of period |
(25,859 | ) | (7,729 | ) | ||||
| Unrealized gain (loss) on investments |
1 | 9 | ||||||
| Foreign currency translation realized in net income |
(10 | ) | — | |||||
| Foreign currency translation |
(20,934 | ) | (8,770 | ) | ||||
|
|
|
|
|
|||||
| Balance-end of period |
(46,802 | ) | (16,490 | ) | ||||
|
|
|
|
|
|||||
| Total Equity |
||||||||
| Balance-beginning of period |
$ | 256,059 | $ | 277,140 | ||||
|
|
|
|
|
|||||
| Balance-end of period |
$ | 209,924 | $ | 269,803 | ||||
|
|
|
|
|
|||||
The accompanying notes are integral to the condensed interim consolidated financial statements
- 4 -
DENISON MINES CORP.
Condensed Interim Consolidated Statements of Cash Flow
(Unaudited—Expressed in thousands of U.S. dollars)
| Nine Months Ended | ||||||||
| CASH PROVIDED BY (USED IN): |
September 30 2015 |
September 30 2014 |
||||||
| OPERATING ACTIVITIES |
||||||||
| Net income (loss) for the period |
$ | (35,360 | ) | $ | (27,051 | ) | ||
| Items not affecting cash: |
||||||||
| Depletion, depreciation, amortization and accretion |
2,511 | 1,554 | ||||||
| Impairment-mineral properties |
— | 1,658 | ||||||
| Stock-based compensation |
467 | 620 | ||||||
| Losses (gains) on asset disposals |
(67 | ) | (449 | ) | ||||
| Losses (gains) on investments and restricted investments |
423 | (81 | ) | |||||
| Deferred income tax expense (recovery) |
(3,388 | ) | (2,710 | ) | ||||
| Foreign exchange |
20,551 | 8,566 | ||||||
| Change in non-cash working capital items (note 18) |
(138 | ) | 1,146 | |||||
|
|
|
|
|
|||||
| Net cash provided by (used in) operating activities |
(15,001 | ) | (16,747 | ) | ||||
|
|
|
|
|
|||||
| INVESTING ACTIVITIES |
||||||||
| Acquisition of assets, net of cash and cash equivalents acquired: |
||||||||
| Rockgate Capital Corp |
— | (57 | ) | |||||
| International Enexco Limited |
— | (141 | ) | |||||
| Sale and maturity of investments |
4,033 | 9,529 | ||||||
| Purchase of investments |
(8,134 | ) | (184 | ) | ||||
| Expenditures on property, plant and equipment |
(1,871 | ) | (733 | ) | ||||
| Proceeds on sale of property, plant and equipment |
97 | 265 | ||||||
| Decrease (increase) in restricted cash and investments |
(442 | ) | (27 | ) | ||||
|
|
|
|
|
|||||
| Net cash provided by (used in) investing activities |
(6,317 | ) | 8,652 | |||||
|
|
|
|
|
|||||
| FINANCING ACTIVITIES |
||||||||
| Increase (decrease) in debt obligations |
(21 | ) | (45 | ) | ||||
| Issuance of common shares for: |
||||||||
| New share issues-net of issue costs |
11,318 | 12,849 | ||||||
| Share options exercised |
5 | 946 | ||||||
| Share purchase warrants exercised |
406 | 304 | ||||||
|
|
|
|
|
|||||
| Net cash provided by (used in) financing activities |
11,708 | 14,054 | ||||||
|
|
|
|
|
|||||
| Increase (decrease) in cash and cash equivalents |
(9,610 | ) | 5,959 | |||||
| Foreign exchange effect on cash and cash equivalents |
(1,969 | ) | (1,237 | ) | ||||
| Cash and cash equivalents, beginning of period |
18,640 | 21,786 | ||||||
|
|
|
|
|
|||||
| Cash and cash equivalents, end of period |
$ | 7,061 | $ | 26,508 | ||||
|
|
|
|
|
|||||
The accompanying notes are integral to the condensed interim consolidated financial statements
- 5 -
DENISON MINES CORP.
Notes to the Condensed Interim Consolidated Financial Statements for the nine months ended September 30, 2015
(Unaudited—Expressed in U.S. dollars except for shares and per share amounts)
| 1. | NATURE OF OPERATIONS |
Denison Mines Corp. and its subsidiary companies and joint arrangements (collectively, the “Company”) are engaged in uranium mining and related activities, including acquisition, exploration and development of uranium bearing properties, extraction, processing and selling of uranium.
The Company has a 22.5% interest in the McClean Lake Joint Venture (“MLJV”) (which includes the McClean Lake mill) and a 25.17% interest in the Midwest Joint Venture (“MWJV”), both of which are located in the Athabasca Basin of Saskatchewan, Canada. The McClean Lake mill provides toll milling services to the Cigar Lake Joint Venture (“CLJV”) under the terms of a toll milling agreement between the parties. In addition, the Company has varying ownership interests in a number of development and exploration projects located in Canada, Mali, Namibia, Zambia and Mongolia.
The Company provides mine decommissioning and decommissioned site monitoring services to third parties through its Denison Environmental Services (“DES”) division and is also the manager of Uranium Participation Corporation (“UPC”), a publicly-listed investment holding company formed to invest substantially all of its assets in uranium oxide concentrates (“U3O8”) and uranium hexafluoride (“UF6”). The Company has no ownership interest in UPC but receives fees for management services and commissions from the purchase and sale of U3O8 and UF6 by UPC.
Denison Mines Corp. (“DMC”) is incorporated under the Business Corporations Act (Ontario) and domiciled in Canada. The address of its registered head office is 40 University Avenue, Suite 1100, Toronto, Ontario, Canada, M5J 1T1.
| 2. | BASIS OF PRESENTATION |
These condensed interim consolidated financial statements have been prepared in accordance with International Financial Reporting Standards (“IFRS”) as issued by the International Accounting Standards Board (“IASB”) applicable to the preparation of interim financial statements, including IAS 34, Interim Financial Reporting. The condensed interim consolidated financial statements should be read in conjunction with the audited annual consolidated financial statements for the year ended December 31, 2014.
The Company’s presentation currency is U.S. dollars.
These financial statements were approved by the board of directors for issue on November 5, 2015.
| 3. | SIGNIFICANT ACCOUNTING POLICIES |
The significant accounting policies followed in these condensed interim consolidated financial statements are consistent with those applied in the Company’s audited annual consolidated financial statements for the year ended December 31, 2014.
Accounting Standards Issued But Not Yet Applied
The Company has not yet adopted the following new accounting pronouncements which are effective for fiscal periods of the Company beginning on or after January 1, 2016:
International Financial Reporting Standard 9, Financial Instruments (“IFRS 9”)
In July 2014, the IASB published the final version of IFRS 9 Financial Instruments (“IFRS 9”), which brings together the classification, measurement, impairment and hedge accounting phases of the IASB’s project to replace IAS 39 Financial Instruments: Recognition and Measurement. IFRS 9 replaces the multiple classifications for financial assets in IAS 39 with a single principle based approach for determining the classification of financial assets based on how an entity manages its financial instruments in the context of its business model and the contractual cash flow characteristics of the financial assets. The new standard also requires a single impairment method to be used, replacing the multiple impairment methods in IAS 39. The final version of IFRS 9 is effective for periods beginning on or after January 1, 2018; however, it is available for early adoption.
The Company has not evaluated the impact of adopting this standard.
- 6 -
International Financial Reporting Standard 15, Revenue from Contracts with Customers (“IFRS 15”)
IFRS 15 deals with revenue recognition and establishes principles for reporting useful information to users of financial statements about the nature, amount, timing and uncertainty of revenue and cash flows arising from an entity’s contracts with customers. Revenue is recognized when a customer obtains control of a good or service. The standard replaces IAS 18 “Revenue” and IAS 11“Construction Contracts” and related interpretations. The standard is effective for annual periods beginning on or after January 1, 2018 and earlier application is permitted.
The Company has not evaluated the impact of adopting this standard.
| 4. | CASH AND CASH EQUIVALENTS |
The cash and cash equivalent balance consists of:
| (in thousands) |
At September 30 2015 |
At December 31 2014 |
||||||
| Cash |
$ | 2,855 | $ | 2,265 | ||||
| Cash in MLJV and MWJV |
549 | 885 | ||||||
| Cash equivalents |
3,657 | 15,490 | ||||||
|
|
|
|
|
|||||
| $ | 7,061 | $ | 18,640 | |||||
|
|
|
|
|
|||||
| 5. | TRADE AND OTHER RECEIVABLES |
The trade and other receivables balance consists of:
| (in thousands) |
At September 30 2015 |
At December 31 2014 |
||||||
| Trade receivables-other |
$ | 2,598 | $ | 2,138 | ||||
| Receivables in MLJV and MWJV |
5,117 | 7,127 | ||||||
| Sales tax receivables |
271 | 131 | ||||||
| Sundry receivables |
154 | 15 | ||||||
|
|
|
|
|
|||||
| $ | 8,140 | $ | 9,411 | |||||
|
|
|
|
|
|||||
| 6. | INVENTORIES |
The inventories balance consists of:
| (in thousands) |
At September 30 2015 |
At December 31 2014 |
||||||
| Uranium concentrates and work-in-progress |
$ | 399 | $ | 433 | ||||
| Inventory of ore in stockpiles |
1,572 | 1,834 | ||||||
| Mine and mill supplies in MLJV |
1,881 | 1,733 | ||||||
|
|
|
|
|
|||||
| $ | 3,852 | $ | 4,000 | |||||
|
|
|
|
|
|||||
| Inventories-by duration: |
||||||||
| Current |
$ | 2,280 | $ | 2,240 | ||||
| Long-term-ore in stockpiles |
1,572 | 1,760 | ||||||
|
|
|
|
|
|||||
| $ | 3,852 | $ | 4,000 | |||||
|
|
|
|
|
|||||
- 7 -
| 7. | INVESTMENTS |
The investments balance consists of:
| (in thousands) |
At September 30 2015 |
At December 31 2014 |
||||||
| Investments: |
||||||||
| Equity instruments-fair value through profit and loss |
$ | 449 | $ | 932 | ||||
| Equity instruments-available for sale |
17 | 22 | ||||||
| Debt instruments-fair value through profit and loss |
7,527 | 4,381 | ||||||
|
|
|
|
|
|||||
| $ | 7,993 | $ | 5,335 | |||||
|
|
|
|
|
|||||
| Investments-by duration: |
||||||||
| Current |
$ | 7,527 | $ | 4,381 | ||||
| Long-term |
466 | 954 | ||||||
|
|
|
|
|
|||||
| $ | 7,993 | $ | 5,335 | |||||
|
|
|
|
|
|||||
During the nine months ended September 30, 2015, the Company purchased debt instruments at a cost of $8,134,000. In addition, $4,029,000 of debt instruments matured and the proceeds were transferred to cash and equivalents.
| 8. | RESTRICTED CASH AND INVESTMENTS |
The Company has certain restricted cash and investments deposited to collateralize a portion of its reclamation obligations. The restricted cash and investments balance consists of:
| (in thousands) |
At September 30 2015 |
At December 31 2014 |
||||||
| Cash |
$ | 166 | $ | 42 | ||||
| Cash equivalents |
375 | 104 | ||||||
| Investments |
1,671 | 1,922 | ||||||
|
|
|
|
|
|||||
| $ | 2,212 | $ | 2,068 | |||||
|
|
|
|
|
|||||
| Restricted cash and investments-by item: |
||||||||
| Elliot Lake reclamation trust fund |
$ | 2,212 | $ | 2,068 | ||||
|
|
|
|
|
|||||
| $ | 2,212 | $ | 2,068 | |||||
|
|
|
|
|
|||||
Elliot Lake Reclamation Trust Fund
During the nine months ended September 30, 2015, the Company deposited an additional $832,000 (CAD$1,042,000) into the Elliot Lake Reclamation Trust Fund and withdrew $392,000 (CAD$492,000).
- 8 -
| 9. | PROPERTY, PLANT AND EQUIPMENT |
The property, plant and equipment balance consists of:
| (in thousands) |
At September 30 2015 |
At December 31 2014 |
||||||
| Plant and equipment: |
||||||||
| Cost |
$ | 73,459 | $ | 82,980 | ||||
| Construction-in-progress |
4,775 | 6,960 | ||||||
| Accumulated depreciation |
(11,638 | ) | (12,205 | ) | ||||
|
|
|
|
|
|||||
| Net book value |
$ | 66,596 | $ | 77,735 | ||||
|
|
|
|
|
|||||
| Mineral properties: |
||||||||
| Cost |
$ | 160,768 | $ | 192,851 | ||||
| Accumulated amortization |
(172 | ) | (198 | ) | ||||
|
|
|
|
|
|||||
| Net book value |
$ | 160,596 | $ | 192,653 | ||||
|
|
|
|
|
|||||
| Total net book value |
$ | 227,192 | $ | 270,388 | ||||
|
|
|
|
|
|||||
The property, plant and equipment continuity summary is as follows:
| (in thousands) | Cost | Accumulated Amortization / Depreciation |
Net Book Value |
|||||||||
| Plant and equipment: |
||||||||||||
| Balance-December 31, 2014 |
$ | 89,940 | $ | (12,205 | ) | $ | 77,735 | |||||
| Additions |
542 | — | 542 | |||||||||
| Amortization |
— | (62 | ) | (62 | ) | |||||||
| Depreciation |
— | (1,446 | ) | (1,446 | ) | |||||||
| Disposals |
(255 | ) | 225 | (30 | ) | |||||||
| Foreign exchange |
(11,993 | ) | 1,850 | (10,143 | ) | |||||||
|
|
|
|
|
|
|
|||||||
| Balance-September 30, 2015 |
$ | 78,234 | $ | (11,638 | ) | $ | 66,596 | |||||
|
|
|
|
|
|
|
|||||||
| Mineral properties: |
||||||||||||
| Balance-December 31, 2014 |
$ | 192,851 | $ | (198 | ) | $ | 192,653 | |||||
| Additions |
1,377 | — | 1,377 | |||||||||
| Foreign exchange |
(33,460 | ) | 26 | (33,434 | ) | |||||||
|
|
|
|
|
|
|
|||||||
| Balance-September 30, 2015 |
$ | 160,768 | $ | (172 | ) | $ | 160,596 | |||||
|
|
|
|
|
|
|
|||||||
Plant and Equipment – Mining
The Company has a 22.5% interest in the McClean Lake mill located in the Athabasca Basin of Saskatchewan, Canada. A toll milling agreement has been signed with the participants in the CLJV that provides for the processing of the future output of the Cigar Lake mine at the McClean Lake mill, for which the owners of the McClean Lake mill receive a toll milling fee and other benefits. In determining the amortization rate for the McClean Lake mill, the amount to be amortized has been adjusted to include Denison’s expected share of mill feed related to the CLJV toll milling contract.
Plant and Equipment – Services and Other
The environmental services division of the Company provides mine decommissioning and decommissioned site monitoring services for third parties.
Mineral Properties
The Company has various interests in development and exploration projects located in Canada, Mali, Namibia, Zambia and Mongolia which are held directly or through option or various contractual agreements.
- 9 -
Canada Mining Segment
In February 2015, SeqUr Exploration Inc. terminated its option to earn an interest in the Jasper Lake property.
In July 2015, the Company entered into a definitive arrangement agreement (the “Fission Arrangement”) to acquire all of the outstanding shares, options and warrants of Fission Uranium Corp (“FCU”). FCU’s principal uranium asset is its 100% owned Patterson Lake South project located in Saskatchewan, Canada. Completion of the Fission Arrangement was subject to Denison and FCU shareholder approval and the satisfaction of other customary conditions. In October 2015, Denison and Fission agreed to terminate the Fission Arrangement as the required FCU shareholder approval was not obtained. As at September 30, 2015, Denison has incurred $1,181,000 of transaction costs related to the Fission Arrangement which is included in “general and administrative expenses” in the consolidated statement of income (loss) (see note 23).
In September 2015, the Company increased its interest in the Waterbury Lake property to 61.55% under the terms of the dilution provisions in the agreements governing the project (see note 20).
Asia Mining Segment-Mongolia
In July 2015, the Company concluded its strategic review of alternatives for its interest in the Gurvan Saihan Joint Venture (“GSJV”) and entered into an agreement with Uranium Industry (“UI”), a Czech Republic entity, to dispose of its 85% interest in the GSJV for cash consideration of $20,000,000, payable upon the achievement of specified milestones and subject to various conditions on closing. The sale did not close as expected by September 8, as certain closing conditions were not met. As at September 30, 2015, Denison remained the owner of its 85% interest in the GSJV and continues to pursue the sale of its interest to UI.
| 10. | POST-EMPLOYMENT BENEFITS |
The post-employment benefits balance consists of:
| (in thousands) |
At September 30 2015 |
At December 31 2014 |
||||||
| Accrued benefit obligation |
$ | 2,495 | $ | 2,921 | ||||
|
|
|
|
|
|||||
| $ | 2,495 | $ | 2,921 | |||||
|
|
|
|
|
|||||
| Post-employment benefits liability-by duration: |
||||||||
| Current |
$ | 225 | $ | 259 | ||||
| Non-current |
2,270 | 2,662 | ||||||
|
|
|
|
|
|||||
| $ | 2,495 | $ | 2,921 | |||||
|
|
|
|
|
|||||
The post-employment benefits continuity summary is as follows:
| (in thousands) | ||||
| Balance-December 31, 2014 |
$ | 2,921 | ||
| Benefits paid |
(120 | ) | ||
| Interest cost |
72 | |||
| Foreign exchange |
(378 | ) | ||
|
|
|
|||
| Balance-September 30, 2015 |
$ | 2,495 | ||
|
|
|
|||
- 10 -
| 11. | RECLAMATION OBLIGATIONS |
The reclamation obligations balance consists of:
| (in thousands) | At September 30 2015 |
At December 31 2014 |
||||||
| Reclamation liability-by location: |
||||||||
| Elliot Lake |
$ | 9,817 | $ | 11,234 | ||||
| McClean and Midwest Joint Ventures |
5,787 | 6,406 | ||||||
| Other |
16 | 19 | ||||||
|
|
|
|
|
|||||
| $ | 15,620 | $ | 17,659 | |||||
|
|
|
|
|
|||||
| Reclamation and remediation liability-by duration: |
||||||||
| Current |
614 | 706 | ||||||
| Non-current |
15,006 | 16,953 | ||||||
|
|
|
|
|
|||||
| $ | 15,620 | $ | 17,659 | |||||
|
|
|
|
|
|||||
The reclamation obligations continuity summary is as follows:
| (in thousands) | ||||
| Balance-December 31, 2014 |
$ | 17,659 | ||
| Accretion |
636 | |||
| Expenditures incurred |
(350 | ) | ||
| Foreign exchange |
(2,325 | ) | ||
|
|
|
|||
| Balance-September 30, 2015 |
$ | 15,620 | ||
|
|
|
|||
Site Restoration: Elliot Lake
Spending on restoration activities at the Elliot Lake site is funded from monies in the Elliot Lake Reclamation Trust fund (see note 8).
Site Restoration: McClean Lake Joint Venture and Midwest Joint Venture
Under the Mineral Industry Environmental Protection Regulations (1996), the Company is required to provide its pro-rata share of financial assurances to the province of Saskatchewan relating to future decommissioning and reclamation plans that have been filed and approved by the applicable regulatory authorities. As at September 30, 2015, the Company has provided irrevocable standby letters of credit, from a chartered bank, in favour of Saskatchewan Environment, totalling CAD$9,698,000 relating to an approved reclamation plan dated October 2009. An updated reclamation plan dated November 2014 has been submitted and is currently under review by the applicable regulatory authorities. Once approved, the Company expects to increase its pro-rata share of financial assurances to the province by CAD$12,748,000 to approximately CAD$22,446,000.
| 12. | DEBT FACILITIES |
Line of Credit
The Company’s current credit facility has a maturity date of January 31, 2016 and allows for credit to be extended to the Company for up to CAD$24,000,000. Use of the facility is restricted to non-financial letters of credit in support of reclamation obligations (see note 11).
At September 30, 2015, the Company has no outstanding borrowings under the facility (December 31, 2014—$nil) and is in compliance with its facility covenants. At September 30, 2015, approximately CAD$9,698,000 (December 31, 2014: CAD$9,698,000) of the facility is being utilized as collateral for certain letters of credit. During the nine months ended September 30, 2015, the Company did not incur any interest under the facility but has incurred letter of credit and standby fees of $136,000 and $60,000, respectively.
- 11 -
| 13. | OTHER LIABILITIES |
The other liabilities balance consists of:
| (in thousands) |
At September 30 2015 |
At December 31 2014 |
||||||
| Unamortized fair value of toll milling contracts |
$ | 732 | $ | 861 | ||||
| Flow-through share premium obligation (note 14) |
1,888 | 1,915 | ||||||
|
|
|
|
|
|||||
| $ | 2,620 | $ | 2,776 | |||||
|
|
|
|
|
|||||
| Other long-term liabilities-by duration: |
||||||||
| Current |
$ | 1,926 | $ | 1,935 | ||||
| Non-current |
694 | 841 | ||||||
|
|
|
|
|
|||||
| $ | 2,620 | $ | 2,776 | |||||
|
|
|
|
|
|||||
| 14. | SHARE CAPITAL |
Denison is authorized to issue an unlimited number of common shares without par value. A continuity summary of the issued and outstanding common shares and the associated dollar amounts is presented below:
| (in thousands except share amounts) |
Number of Common Shares |
|||||||
| Balance at December 31, 2014 |
505,868,894 | $ | 1,120,758 | |||||
|
|
|
|
|
|||||
| Issued for cash: |
||||||||
| Share issue proceeds |
12,000,000 | 12,069 | ||||||
| Share issue costs |
— | (751 | ) | |||||
| Share options exercised |
7,100 | 5 | ||||||
| Share purchase warrants exercised |
562,675 | 406 | ||||||
| Share options exercised-fair value adjustment |
— | 4 | ||||||
| Share purchase warrants exercised-fair value adjustment |
— | 316 | ||||||
| Flow-through share premium liability |
— | (2,028 | ) | |||||
|
|
|
|
|
|||||
| 12,569,775 | 10,021 | |||||||
|
|
|
|
|
|||||
| Balance at September 30, 2015 |
518,438,669 | $ | 1,130,779 | |||||
|
|
|
|
|
|||||
New Issues
In May 2015, the Company completed a private placement of 12,000,000 flow-through common shares at a price of CAD$1.25 per share for gross proceeds of $12,069,000 (CAD$15,000,000). The income tax benefits of this issue will be renounced to subscribers with an effective date no later than December 31, 2015. The related flow-through share premium liability is included as a component of other liabilities on the balance sheet at September 30, 2015.
Flow-Through Share Issues
The Company finances a portion of its exploration programs through the use of flow-through share issuances. Canadian income tax deductions relating to these expenditures are claimable by the investors and not by the Company.
As at September 30, 2015, the Company estimates that it has satisfied its obligation to spend CAD$14,997,000 on eligible exploration expenditures as a result of the issuance of flow-through shares in August 2014. The Company renounced the income tax benefits of this issue in February 2015, with an effective date of renunciation to its subscribers of December 31, 2014. In conjunction with the renunciation, the flow-through share premium liability has been reversed and recognized as part of the deferred tax recovery (see notes 13 and 21).
- 12 -
As at September 30, 2015, the Company estimates that it has incurred CAD$373,000 of its obligation to spend CAD$15,000,000 on eligible exploration expenditures as a result of the issuance of flow-through shares in May 2015.
| 15. | WARRANTS |
A continuity summary of the issued and outstanding share purchase warrants in terms of common shares of the Company and associated dollar amount is presented below:
| (in thousands except share amounts) |
Weighted Average Exercise Price Per Share (CAD$) |
Number of Common Shares Issuable |
Fair Value Amount |
|||||||||
| Balance outstanding at December 31, 2014 |
$ | 1.17 | 1,079,802 | $ | 376 | |||||||
| Warrants exercised |
0.84 | (562,675 | ) | (316 | ) | |||||||
| Warrants expired |
1.54 | (517,127 | ) | (60 | ) | |||||||
|
|
|
|
|
|
|
|||||||
| Balance outstanding at September 30, 2015 |
$ | — | — | — | ||||||||
|
|
|
|
|
|
|
|||||||
| 16. | STOCK OPTIONS |
A continuity summary of the stock options granted under the Company’s stock-based compensation plan is presented below:
| Number of Common Shares |
Weighted- Average Exercise Price per Share (CAD$) |
|||||||
| Stock options outstanding—beginning of period |
6,179,574 | $ | 1.80 | |||||
| Granted |
1,645,000 | 1.09 | ||||||
| Exercised (1) |
(7,100 | ) | 0.71 | |||||
| Expiries |
(612,784 | ) | 1.92 | |||||
| Forfeitures |
(147,480 | ) | 1.93 | |||||
|
|
|
|
|
|||||
| Stock options outstanding—end of period |
7,057,210 | $ | 1.62 | |||||
|
|
|
|
|
|||||
| Stock options exercisable—end of period |
4,834,210 | $ | 1.78 | |||||
|
|
|
|
|
|||||
| (1) | The weighted average share price at the date of exercise was CAD$1.07. |
A summary of the Company’s stock options outstanding at September 30, 2015 is presented below:
| Range of Exercise Prices per Share (CAD$) |
Weighted Average Remaining Contractual Life (Years) |
Number of Common Shares |
Weighted- Average Exercise Price per Share (CAD$) |
|||||||||
| Stock options outstanding |
||||||||||||
| $ 0.38 to $ 2.49 |
2.79 | 6,141,424 | $ | 1.32 | ||||||||
| $ 2.50 to $ 4.99 |
0.44 | 670,306 | 3.19 | |||||||||
| $ 5.00 to $ 5.67 |
0.63 | 245,480 | 5.02 | |||||||||
|
|
|
|
|
|
|
|||||||
| Stock options outstanding— end of period |
2.49 | 7,057,210 | $ | 1.62 | ||||||||
|
|
|
|
|
|
|
|||||||
Options outstanding at September 30, 2015 expire between December 2015 and March 2020.
- 13 -
The fair value of each option granted is estimated on the date of grant using the Black-Scholes option pricing model. The following table outlines the range of assumptions used in the model to determine the fair value of options granted:
| Nine Months Ended September 30, 2015 |
||||
| Risk-free interest rate |
0.56% – 0.79% | |||
| Expected stock price volatility |
46.96% – 47.00% | |||
| Expected life |
3.6 years | |||
| Estimated forfeiture rate |
3.40% | |||
| Expected dividend yield |
— | |||
| Fair value per share under options granted |
CAD$0.35 – CAD$0.39 | |||
The fair values of stock options with vesting provisions are amortized on a graded method basis as stock-based compensation expense over the applicable vesting periods. Included in the statement of income (loss) is stock-based compensation of $136,000 and $467,000 for the three and nine months ended September 30, 2015 and $204,000 and $620,000 for the three and nine months ended September 30, 2014. At September 30, 2015, an additional $349,000 in stock-based compensation expense remains to be recognized up until March 2017.
| 17. | ACCUMULATED OTHER COMPREHENSIVE INCOME (LOSS) |
The accumulated other comprehensive income (loss) balance consists of:
| (in thousands) | At September 30 2015 |
At December 31 2014 |
||||||
| Cumulative foreign currency translation |
$ | (46,961 | ) | $ | (26,017 | ) | ||
| Unamortized experience gain-post employment liability |
||||||||
| Gross |
206 | 206 | ||||||
| Tax effect |
(56 | ) | (56 | ) | ||||
| Unrealized gains (losses) on investments |
||||||||
| Gross |
9 | 8 | ||||||
|
|
|
|
|
|||||
| $ | (46,802 | ) | $ | (25,859 | ) | |||
|
|
|
|
|
|||||
- 14 -
| 18. | SUPPLEMENTAL FINANCIAL INFORMATION |
The components of operating expenses are as follows:
| Three Months Ended | Nine Months Ended | |||||||||||||||
| September 30 | September 30 | September 30 | September 30 | |||||||||||||
| (in thousands) | 2015 | 2014 | 2015 | 2014 | ||||||||||||
| Cost of goods and services sold: |
||||||||||||||||
| Operating Overheads: |
||||||||||||||||
| Mining, other development expense |
$ | (253 | ) | $ | (366 | ) | $ | (1,026 | ) | $ | (2,295 | ) | ||||
| Milling, conversion expense |
(509 | ) | (9 | ) | (979 | ) | (32 | ) | ||||||||
| Mill feed cost: |
||||||||||||||||
| -Stockpile depletion |
— | (12 | ) | (24 | ) | (12 | ) | |||||||||
| Less absorption: |
||||||||||||||||
| -Stockpiles, mineral properties |
88 | 111 | 542 | 628 | ||||||||||||
| -Concentrates |
— | 13 | 24 | 13 | ||||||||||||
| Cost of services |
(2,002 | ) | (1,932 | ) | (5,530 | ) | (5,479 | ) | ||||||||
|
|
|
|
|
|
|
|
|
|||||||||
| Cost of goods and services sold |
(2,676 | ) | (2,195 | ) | (6,993 | ) | (7,177 | ) | ||||||||
| Reclamation asset amortization |
(20 | ) | (4 | ) | (62 | ) | (11 | ) | ||||||||
| Selling expenses |
(5 | ) | — | (14 | ) | — | ||||||||||
|
|
|
|
|
|
|
|
|
|||||||||
| Operating expenses |
$ | (2,701 | ) | $ | (2,199 | ) | $ | (7,069 | ) | $ | (7,188 | ) | ||||
|
|
|
|
|
|
|
|
|
|||||||||
The components of other income (expense) are as follows:
| Three Months Ended | Nine Months Ended | |||||||||||||||
| September 30 | September 30 | September 30 | September 30 | |||||||||||||
| (in thousands) | 2015 | 2014 | 2015 | 2014 | ||||||||||||
| Gains (losses) on: |
||||||||||||||||
| Disposal of property, plant and equipment |
— | — | 67 | 449 | ||||||||||||
| Disposal of equity investments |
— | (7 | ) | — | (7 | ) | ||||||||||
| Investment fair value through profit (loss) |
57 | (31 | ) | (423 | ) | 88 | ||||||||||
| Other |
7 | (43 | ) | (183 | ) | 31 | ||||||||||
|
|
|
|
|
|
|
|
|
|||||||||
| Other income (expense) |
$ | 64 | $ | (81 | ) | $ | (539 | ) | $ | 561 | ||||||
|
|
|
|
|
|
|
|
|
|||||||||
The components of finance income (expense) are as follows:
| Three Months Ended | Nine Months Ended | |||||||||||||||
| September 30 | September 30 | September 30 | September 30 | |||||||||||||
| (in thousands) | 2015 | 2014 | 2015 | 2014 | ||||||||||||
| Interest income |
$ | 30 | $ | 84 | $ | 205 | $ | 500 | ||||||||
| Interest expense |
(1 | ) | (1 | ) | (1 | ) | (2 | ) | ||||||||
| Accretion expense-reclamation obligations |
(204 | ) | (183 | ) | (636 | ) | (545 | ) | ||||||||
| Accretion expense-post-employment benefits |
(23 | ) | (28 | ) | (72 | ) | (86 | ) | ||||||||
|
|
|
|
|
|
|
|
|
|||||||||
| Finance income (expense) |
$ | (198 | ) | $ | (128 | ) | $ | (504 | ) | $ | (133 | ) | ||||
|
|
|
|
|
|
|
|
|
|||||||||
- 15 -
A summary of depreciation expense recognized in the statement of income (loss) is as follows:
| Three Months Ended | Nine Months Ended | |||||||||||||||
| September 30 | September 30 | September 30 | September 30 | |||||||||||||
| (in thousands) | 2015 | 2014 | 2015 | 2014 | ||||||||||||
| Operating expenses: |
||||||||||||||||
| Mining, other development expense |
$ | (44 | ) | $ | (74 | ) | $ | (160 | ) | $ | (234 | ) | ||||
| Milling, conversion expense |
(509 | ) | (2 | ) | (979 | ) | (4 | ) | ||||||||
| Cost of services |
(66 | ) | (62 | ) | (193 | ) | (185 | ) | ||||||||
| Mineral property exploration |
(26 | ) | (25 | ) | (78 | ) | (101 | ) | ||||||||
| General and administrative |
(12 | ) | (16 | ) | (36 | ) | (50 | ) | ||||||||
|
|
|
|
|
|
|
|
|
|||||||||
| Depreciation expense-gross |
$ | (657 | ) | $ | (179 | ) | $ | (1,446 | ) | $ | (574 | ) | ||||
|
|
|
|
|
|
|
|
|
|||||||||
A summary of employee benefits expense recognized in the statement of income (loss) is as follows:
| Three Months Ended | Nine Months Ended | |||||||||||||||
| September 30 | September 30 | September 30 | September 30 | |||||||||||||
| (in thousands) | 2015 | 2014 | 2015 | 2014 | ||||||||||||
| Salaries and short-term employee benefits |
$ | (1,724 | ) | $ | (1,895 | ) | $ | (5,578 | ) | $ | (6,530 | ) | ||||
| Share-based compensation |
(136 | ) | (204 | ) | (467 | ) | (620 | ) | ||||||||
| Termination benefits |
(86 | ) | (94 | ) | (217 | ) | (310 | ) | ||||||||
|
|
|
|
|
|
|
|
|
|||||||||
| Employee benefits expense |
$ | (1,946 | ) | $ | (2,193 | ) | $ | (6,262 | ) | $ | (7,460 | ) | ||||
|
|
|
|
|
|
|
|
|
|||||||||
The change in non-cash working capital items in the consolidated statements of cash flows is as follows:
| Nine Months Ended | ||||||||
| September 30 | September 30 | |||||||
| (in thousands) | 2015 | 2014 | ||||||
| Change in non-cash working capital items: |
||||||||
| Trade and other receivables |
$ | 107 | $ | (1,071 | ) | |||
| Inventories |
(388 | ) | 7 | |||||
| Prepaid expenses and other assets |
399 | 243 | ||||||
| Accounts payable and accrued liabilities |
214 | 1,726 | ||||||
| Post-employment benefits |
(120 | ) | (187 | ) | ||||
| Reclamation obligations |
(350 | ) | 428 | |||||
|
|
|
|
|
|||||
| Change in non-cash working capital items |
$ | (138 | ) | $ | 1,146 | |||
|
|
|
|
|
|||||
| 19. | SEGMENTED INFORMATION |
Business Segments
The Company operates in two primary segments – the Mining segment and the Services and Other segment. The Mining segment, which has been further subdivided by major geographic regions, includes activities related to exploration, evaluation and development, mining, milling and the sale of mineral concentrates. The Services and Other segment includes the results of the Company’s environmental services business, management fees and commission income earned from UPC and general corporate expenses not allocated to the other segments.
- 16 -
For the nine months ended September 30, 2015, business segment results were as follows:
| (in thousands) | Canada Mining |
Africa Mining |
Asia Mining |
Services and Other |
Total | |||||||||||||||
| Statement of Operations: |
||||||||||||||||||||
| Revenues |
1,904 | — | — | 6,879 | 8,783 | |||||||||||||||
|
|
|
|
|
|
|
|
|
|
|
|||||||||||
| Expenses: |
||||||||||||||||||||
| Operating expenses |
(1,283 | ) | (241 | ) | (15 | ) | (5,530 | ) | (7,069 | ) | ||||||||||
| Mineral property exploration |
(12,007 | ) | (677 | ) | (381 | ) | — | (13,065 | ) | |||||||||||
| General and administrative |
(17 | ) | (471 | ) | (544 | ) | (4,771 | ) | (5,803 | ) | ||||||||||
|
|
|
|
|
|
|
|
|
|
|
|||||||||||
| (13,307 | ) | (1,389 | ) | (940 | ) | (10,301 | ) | (25,937 | ) | |||||||||||
|
|
|
|
|
|
|
|
|
|
|
|||||||||||
| Segment income (loss) |
(11,403 | ) | (1,389 | ) | (940 | ) | (3,422 | ) | (17,154 | ) | ||||||||||
|
|
|
|
|
|
|
|
|
|
|
|||||||||||
| Revenues – supplemental: |
||||||||||||||||||||
| Environmental services |
— | — | — | 5,527 | 5,527 | |||||||||||||||
| Management fees and commissions |
— | — | — | 1,352 | 1,352 | |||||||||||||||
| Toll milling services |
1,904 | — | — | — | 1,904 | |||||||||||||||
|
|
|
|
|
|
|
|
|
|
|
|||||||||||
| 1,904 | — | — | 6,879 | 8,783 | ||||||||||||||||
|
|
|
|
|
|
|
|
|
|
|
|||||||||||
| Capital additions: |
||||||||||||||||||||
| Property, plant and equipment |
982 | 318 | 186 | 433 | 1,919 | |||||||||||||||
|
|
|
|
|
|
|
|
|
|
|
|||||||||||
| Long-lived assets: |
||||||||||||||||||||
| Plant and equipment |
||||||||||||||||||||
| Cost |
72,784 | 1,590 | 260 | 3,600 | 78,234 | |||||||||||||||
| Accumulated depreciation |
(8,346 | ) | (1,283 | ) | (168 | ) | (1,841 | ) | (11,638 | ) | ||||||||||
| Mineral properties |
126,382 | 28,090 | 6,124 | — | 160,596 | |||||||||||||||
| Intangibles |
— | — | — | 222 | 222 | |||||||||||||||
|
|
|
|
|
|
|
|
|
|
|
|||||||||||
| 190,820 | 28,397 | 6,216 | 1,981 | 227,414 | ||||||||||||||||
|
|
|
|
|
|
|
|
|
|
|
|||||||||||
For the three months ended September 30, 2015, business segment results were as follows:
| (in thousands) | Canada Mining |
Africa Mining |
Asia Mining |
Services and Other |
Total | |||||||||||||||
| Statement of Operations: |
||||||||||||||||||||
| Revenues |
982 | — | — | 2,544 | 3,526 | |||||||||||||||
|
|
|
|
|
|
|
|
|
|
|
|||||||||||
| Expenses: |
||||||||||||||||||||
| Operating expenses |
(617 | ) | (79 | ) | (3 | ) | (2,002 | ) | (2,701 | ) | ||||||||||
| Mineral property exploration |
(3,753 | ) | (153 | ) | (13 | ) | — | (3,919 | ) | |||||||||||
| General and administrative |
(1 | ) | (131 | ) | (246 | ) | (2,088 | ) | (2,466 | ) | ||||||||||
|
|
|
|
|
|
|
|
|
|
|
|||||||||||
| (4,371 | ) | (363 | ) | (262 | ) | (4,090 | ) | (9,086 | ) | |||||||||||
|
|
|
|
|
|
|
|
|
|
|
|||||||||||
| Segment income (loss) |
(3,389 | ) | (363 | ) | (262 | ) | (1,546 | ) | (5,560 | ) | ||||||||||
|
|
|
|
|
|
|
|
|
|
|
|||||||||||
| Revenues – supplemental: |
||||||||||||||||||||
| Environmental services |
— | — | — | 2,113 | 2,113 | |||||||||||||||
| Management fees and commissions |
— | — | — | 431 | 431 | |||||||||||||||
| Toll milling services |
982 | — | — | — | 982 | |||||||||||||||
|
|
|
|
|
|
|
|
|
|
|
|||||||||||
| 982 | — | — | 2,544 | 3,526 | ||||||||||||||||
|
|
|
|
|
|
|
|
|
|
|
|||||||||||
- 17 -
For the nine months ended September 30, 2014, business segment results were as follows:
| (in thousands) | Canada Mining |
Africa Mining |
Asia Mining |
Services and Other |
Total | |||||||||||||||
| Statement of Operations: |
||||||||||||||||||||
| Revenues |
— | — | — | 6,883 | 6,883 | |||||||||||||||
|
|
|
|
|
|
|
|
|
|
|
|||||||||||
| Expenses: |
||||||||||||||||||||
| Operating expenses |
(397 | ) | (1,312 | ) | — | (5,479 | ) | (7,188 | ) | |||||||||||
| Mineral property exploration |
(12,593 | ) | (689 | ) | (332 | ) | — | (13,614 | ) | |||||||||||
| General and administrative |
(11 | ) | (853 | ) | (746 | ) | (4,431 | ) | (6,041 | ) | ||||||||||
| Impairment–mineral properties (note 9) |
(1,658 | ) | — | — | — | (1,658 | ) | |||||||||||||
|
|
|
|
|
|
|
|
|
|
|
|||||||||||
| (14,659 | ) | (2,854 | ) | (1,078 | ) | (9,910 | ) | (28,501 | ) | |||||||||||
|
|
|
|
|
|
|
|
|
|
|
|||||||||||
| Segment income (loss) |
(14,659 | ) | (2,854 | ) | (1,078 | ) | (3,027 | ) | (21,618 | ) | ||||||||||
|
|
|
|
|
|
|
|
|
|
|
|||||||||||
| Revenues – supplemental: |
||||||||||||||||||||
| Environmental services |
— | — | — | 5,263 | 5,263 | |||||||||||||||
| Management fees and commissions |
— | — | — | 1,620 | 1,620 | |||||||||||||||
|
|
|
|
|
|
|
|
|
|
|
|||||||||||
| — | — | — | 6,883 | 6,883 | ||||||||||||||||
|
|
|
|
|
|
|
|
|
|
|
|||||||||||
| Capital additions: |
||||||||||||||||||||
| Property, plant and equipment |
163 | 483 | 90 | 81 | 817 | |||||||||||||||
|
|
|
|
|
|
|
|
|
|
|
|||||||||||
| Long-lived assets: |
||||||||||||||||||||
| Plant and equipment |
||||||||||||||||||||
| Cost |
83,030 | 2,364 | 348 | 3,813 | 89,555 | |||||||||||||||
| Accumulated depreciation |
(8,515 | ) | (1,737 | ) | (233 | ) | (1,912 | ) | (12,397 | ) | ||||||||||
| Mineral properties |
149,568 | 43,063 | 6,449 | — | 199,080 | |||||||||||||||
| Intangibles |
— | — | — | 793 | 793 | |||||||||||||||
|
|
|
|
|
|
|
|
|
|
|
|||||||||||
| 224,083 | 43,690 | 6,564 | 2,694 | 277,031 | ||||||||||||||||
|
|
|
|
|
|
|
|
|
|
|
|||||||||||
For the three months ended September 30, 2014, business segment results were as follows:
| (in thousands) | Canada Mining |
Africa Mining |
Asia Mining |
Services and Other |
Total | |||||||||||||||
| Statement of Operations: |
||||||||||||||||||||
| Revenues |
— | — | — | 2,351 | 2,351 | |||||||||||||||
|
|
|
|
|
|
|
|
|
|
|
|||||||||||
| Expenses: |
||||||||||||||||||||
| Operating expenses |
(140 | ) | (127 | ) | — | (1,932 | ) | (2,199 | ) | |||||||||||
| Mineral property exploration |
(3,099 | ) | (288 | ) | (42 | ) | — | (3,429 | ) | |||||||||||
| General and administrative |
(1 | ) | (246 | ) | (115 | ) | (1,173 | ) | (1,535 | ) | ||||||||||
|
|
|
|
|
|
|
|
|
|
|
|||||||||||
| (3,240 | ) | (661 | ) | (157 | ) | (3,105 | ) | (7,163 | ) | |||||||||||
|
|
|
|
|
|
|
|
|
|
|
|||||||||||
| Segment income (loss) |
(3,240 | ) | (661 | ) | (157 | ) | (754 | ) | (4,812 | ) | ||||||||||
|
|
|
|
|
|
|
|
|
|
|
|||||||||||
| Revenues – supplemental: |
||||||||||||||||||||
| Environmental services |
— | — | — | 1,956 | 1,956 | |||||||||||||||
| Management fees and commissions |
— | — | — | 395 | 395 | |||||||||||||||
|
|
|
|
|
|
|
|
|
|
|
|||||||||||
| — | — | — | 2,351 | 2,351 | ||||||||||||||||
|
|
|
|
|
|
|
|
|
|
|
|||||||||||
- 18 -
Revenue Concentration
The Company’s business is such that, at any given time, it sells its environmental and other services to a relatively small number of customers. During the nine months ended September 30, 2015, two customers from the services and other segment and one customer from the mining segment accounted for approximately 84% of total revenues consisting of 46%, 22% and 16% individually. During the nine months ended September 30, 2014, four customers from the services and other segment accounted for approximately 96% of total revenues consisting of 52%, 23%, 11% and 10% individually.
| 20. | RELATED PARTY TRANSACTIONS |
Uranium Participation Corporation
The following transactions were incurred with UPC for the periods noted:
| Three Months Ended | Nine Months Ended | |||||||||||||||
| September 30 | September 30 | September 30 | September 30 | |||||||||||||
| (in thousands) | 2015 | 2014 | 2015 | 2014 | ||||||||||||
| Revenue: |
||||||||||||||||
| Management fees |
$ | 431 | $ | 395 | $ | 1,330 | $ | 1,175 | ||||||||
| Commission fees |
— | — | 22 | 445 | ||||||||||||
|
|
|
|
|
|
|
|
|
|||||||||
| $ | 431 | $ | 395 | $ | 1,352 | $ | 1,620 | |||||||||
|
|
|
|
|
|
|
|
|
|||||||||
At September 30, 2015, accounts receivable includes $161,000 (December 31, 2014: $123,000) due from UPC with respect to the fees and transactions indicated above.
Korea Electric Power Corporation (“KEPCO”)
As at September 30, 2015, KEPCO holds 58,284,000 shares of Denison representing a share interest of approximately 11.2%. KEPCO is also the majority member of the Korea Waterbury Uranium Limited Partnership (“KWULP”).
In January 2014, Denison agreed to allow its partner in the Waterbury Lake project, KWULP, to defer its funding obligations to Waterbury Lake Uranium Corporation (“WLUC”) and Waterbury Lake Uranium Limited Partnership (“WLULP”) until September 30, 2015 and not be diluted as per the dilution provisions in the relevant agreements in exchange for allowing Denison to authorize spending programs without obtaining the approval of 75% of the voting interest. As at September 30, 2015, KWULP had a deferred funding obligation to WLUC and WLULP of CAD$1,826,000.
KWULP has notified Denison that it has elected to dilute its interest in the Waterbury Lake project and that it will not fund its deferred funding obligation to WLUC and WLULP. As a result, Denison is entitled to an additional 1.55% interest in the Waterbury Lake project and Denison will continue to be able to authorize funding programs without obtaining the approval of 75% of the voting interest up to September 30, 2016. The acquisition of the additional 1.55% in Waterbury Lake has been accounted for using an effective date of September 30, 2015 and has resulted in Denison recording its increased pro-rata share of the net assets of Waterbury Lake, the majority of which relates to an addition to mineral property assets of $835,000.
Other
During the nine months ended September 30, 2015, the Company incurred investor relations, administrative service fees and other expenses of $138,000 (September 30, 2014: $42,000) with Namdo Management Services Ltd, which shares a common director with Denison. These services were incurred in the normal course of operating a public company. At September 30, 2015, an amount of $nil (December 31, 2014: $nil) was due to this company.
During the nine months ended September 30, 2015, the Company incurred legal fees of $445,000 (September 30, 2014: $273,000) with Cassels Brock & Blackwell, LLP, a law firm of which a member of Denison’s Board of Directors is a partner. In the current year, the services and associated costs are mainly related to the transaction with Fission Uranium Corp (see note 9). In the nine months of the prior year, the services and associated costs were mainly related to the acquisition of International Enexco Ltd. and internal re-organization activities done by the Company. At September 30, 2015, an amount of $177,000 (December 31, 2014: $1,000) is due to this legal firm.
- 19 -
Executive services of $33,000 and $61,000 were provided by the Company during the three and nine months ended September 30, 2014 to Lundin Gold Inc. No similar services were provided during 2015. At September 30, 2015, an amount of $nil (December 31, 2014: $44,000) was due to Denison.
Compensation of Key Management Personnel
Key management personnel are those persons having authority and responsibility for planning, directing and controlling the activities of the Company, directly or indirectly. Key management personnel include the Company’s executive officers, vice-presidents and members of its Board of Directors.
The following compensation was awarded to key management personnel:
| Three Months Ended | Nine Months Ended | |||||||||||||||
| September 30 | September 30 | September 30 | September 30 | |||||||||||||
| (in thousands) | 2015 | 2014 | 2015 | 2014 | ||||||||||||
| Salaries and short-term employee benefits |
$ | (307 | ) | $ | (315 | ) | $ | (1,123 | ) | $ | (1,294 | ) | ||||
| Share-based compensation |
(89 | ) | (129 | ) | (296 | ) | (396 | ) | ||||||||
| Termination benefits |
— | — | — | (158 | ) | |||||||||||
|
|
|
|
|
|
|
|
|
|||||||||
| Key management personnel compensation |
$ | (396 | ) | $ | (444 | ) | $ | (1,419 | ) | $ | (1,848 | ) | ||||
|
|
|
|
|
|
|
|
|
|||||||||
| 21. | INCOME TAXES |
For the nine months ended September 30, 2015, Denison has recognized deferred tax recoveries of $3,388,000. The deferred tax recovery includes the recognition of previously unrecognized Canadian tax assets of $3,200,000 relating to the February 2015 renunciation of the tax benefits associated with the Company’s CAD$14,997,000 flow-through share issue in August 2014.
| 22. | FAIR VALUE OF FINANCIAL INSTRUMENTS |
IFRS requires disclosures about the inputs to fair value measurements, including their classification within a hierarchy that prioritizes the inputs to fair value measurement. The three levels of the fair value hierarchy are:
| • | Level 1 – Unadjusted quoted prices in active markets for identical assets or liabilities; |
| • | Level 2 – Inputs other than quoted prices that are observable for the asset or liability either directly or indirectly; and |
| • | Level 3 – Inputs that are not based on observable market data. |
The fair value of financial instruments which trade in active markets (such as equity instruments) is based on quoted market prices at the balance sheet date. The quoted market price used to value financial assets held by the Company is the current closing price.
Except as otherwise disclosed, the fair values of cash and cash equivalents, trade and other receivables, accounts payable and accrued liabilities, restricted cash and cash equivalents and debt obligations approximate their carrying values as a result of the short-term nature of the instruments, or the variable interest rate associated with the instruments, or the fixed interest rate of the instruments being similar to market rates.
- 20 -
The following table illustrates the classification of the Company’s financial assets within the fair value hierarchy as at September 30, 2015 and December 31, 2014:
| (in thousands) | Financial Instrument Category(1) |
Fair Value Hierarchy |
September 30 2015 Fair Value |
December 31, 2014 Fair Value |
||||||||||||
| Financial Assets: |
||||||||||||||||
| Cash and equivalents |
Category D | $ | 7,061 | $ | 18,640 | |||||||||||
| Trade and other receivables |
Category D | 8,140 | 9,411 | |||||||||||||
| Investments |
||||||||||||||||
| Equity instruments |
Category A | Level 1 | 430 | 916 | ||||||||||||
| Equity instruments |
Category A | Level 2 | 17 | 16 | ||||||||||||
| Equity instruments |
Category B | Level 1 | 19 | 22 | ||||||||||||
| Debt instruments |
Category A | Level 1 | 7,527 | 4,381 | ||||||||||||
| Restricted cash and equivalents |
||||||||||||||||
| Elliot Lake reclamation trust fund |
Category C | 2,212 | 2,068 | |||||||||||||
|
|
|
|
|
|||||||||||||
| $ | 25,406 | $ | 35,454 | |||||||||||||
|
|
|
|
|
|||||||||||||
| Financial Liabilities: |
||||||||||||||||
| Account payable and accrued liabilities |
Category E | 8,905 | 10,050 | |||||||||||||
| Debt obligations |
Category E | 14 | 39 | |||||||||||||
|
|
|
|
|
|||||||||||||
| $ | 8,919 | $ | 10,089 | |||||||||||||
|
|
|
|
|
|||||||||||||
| (1) | Financial instrument designations are as follows: Category A=Financial assets and liabilities at fair value through profit and loss; Category B=Available for sale investments; Category C=Held to maturity investments; Category D=Loans and receivables; and Category E=Financial liabilities at amortized cost. |
| 23. | SUBSEQUENT EVENTS |
Termination of Arrangement Agreement with Fission
In October 2015, Denison and Fission terminated the previously announced Fission Arrangement pursuant to which Denison and Fission were to combine their respective businesses by way of a court-approved plan of arrangement. At the deadline for submission of proxies on Friday October 9, 2015, Denison’s shareholders strongly supported the Fission Arrangement. While a majority of the Fission shares voted were in favour of the Fission Arrangement, the required two-thirds approval was not obtained. As a result of the termination of the Fission Arrangement, neither Fission nor Denison held their respective shareholders meetings which were scheduled for October 14, 2015.
- 21 -
Exhibit 99.3
DENISON MINES CORP.
Management’s Discussion and Analysis
For the Nine Months Ended September 30, 2015
(Expressed in U.S. Dollars, unless otherwise noted)
INTRODUCTION
This Management’s Discussion and Analysis (“MD&A”) of Denison Mines Corp. and its subsidiary companies and joint arrangements (collectively, “Denison” or the “Company”) provides a detailed analysis of the Company’s business and compares its financial results with those of the previous year. This MD&A is dated as of November 5, 2015 and should be read in conjunction with the Company’s unaudited condensed interim consolidated financial statements and related notes for the nine months ended September 30, 2015. The unaudited interim consolidated financial statements are prepared in accordance with International Financial Reporting Standards (“IFRS”) as issued by the International Accounting Standards Board (“IASB”). Readers are also encouraged to consult the audited consolidated financial statements and MD&A for the year ended December 31, 2014. All dollar amounts are expressed in U.S. dollars, unless otherwise noted.
Other continuous disclosure documents, including the Company’s press releases, quarterly and annual reports, Annual Information Form and Form 40-F are available through its filings with the securities regulatory authorities in Canada at www.sedar.com and the United States at www.sec.gov/edgar.shtml.
CAUTIONARY STATEMENT REGARDING FORWARD-LOOKING STATEMENTS
Certain information contained in this MD&A constitutes “forward-looking information”, within the meaning of the United States Private Securities Litigation Reform Act of 1995 and similar Canadian legislation concerning the business, operations and financial performance and condition of Denison.
Generally, these forward-looking statements can be identified by the use of forward-looking terminology such as “plans”, “expects”, “is expected”, “budget”, “scheduled”, “estimates”, “forecasts”, “intends”, “anticipates”, or “believes”, or the negatives and/or variations of such words and phrases, or state that certain actions, events or results “may”, “could”, “would”, “might” or “will be taken”, “occur”, “be achieved” or “has the potential to”.
Forward looking statements are based on the opinions and estimates of management as of the date such statements are made, and they are subject to known and unknown risks, uncertainties and other factors that may cause the actual results, level of activity, performance or achievements of Denison to be materially different from those expressed or implied by such forward-looking statements. Denison believes that the expectations reflected in this forward-looking information are reasonable but no assurance can be given that these expectations will prove to be correct and such forward-looking information included in this MD&A should not be unduly relied upon. This information speaks only as of the date of this MD&A. In particular, this MD&A may contain forward-looking information pertaining to the following: the likelihood of completing and benefits to be derived from corporate transactions; the estimates of Denison’s mineral reserves and mineral resources; expectations regarding the toll milling of Cigar Lake ores; capital expenditure programs, estimated exploration and development expenditures and reclamation costs; expectations of market prices and costs; supply and demand for uranium (“U3O8”); possible impacts of litigation and regulatory actions on Denison; exploration, development and expansion plans and objectives; expectations regarding adding to its mineral reserves and resources through acquisitions and exploration; and receipt of regulatory approvals, permits and licences under governmental regulatory regimes.
There can be no assurance that such statements will prove to be accurate, as Denison’s actual results and future events could differ materially from those anticipated in this forward-looking information as a result of the factors discussed under the heading “Risk Factors” in Denison’s Annual Information Form dated March 5, 2015 available at www.sedar.com, and in its Form 40-F available at www.sec.gov/edgar.shtml.
Accordingly, readers should not place undue reliance on forward-looking statements. These factors are not, and should not be construed as being exhaustive. Statements relating to “mineral reserves” or “mineral resources” are deemed to be forward-looking information, as they involve the implied assessment, based on certain estimates and assumptions that the mineral reserves and mineral resources described can be profitably produced in the future. The forward-looking information contained in this MD&A is expressly qualified by this cautionary statement. Denison does not undertake any obligation to publicly update or revise any forward-looking information after the date of this MD&A to conform such information to actual results or to changes in Denison’s expectations except as otherwise required by applicable legislation.
Cautionary Note to United States Investors Concerning Estimates of Measured, Indicated and Inferred Mineral Resources: This MD&A may use the terms “measured”, “indicated” and “inferred” mineral resources. United States investors are advised that while such terms are recognized and required by Canadian regulations, the United States Securities and Exchange Commission does not recognize them. “Inferred mineral resources” have a great amount of uncertainty as to their existence, and as to their economic and legal feasibility. It cannot be assumed that all or any part of an inferred mineral resource will ever be upgraded to a higher category. Under Canadian rules, estimates of inferred mineral resources may not form the basis of feasibility or other economic studies. United States investors are cautioned not to assume that all or any part of measured or indicated mineral resources will ever be converted into mineral reserves. United States investors are also cautioned not to assume that all or any part of an inferred mineral resource exists, or is economically or legally mineable.
- 1 -
DENISON MINES CORP.
Management’s Discussion and Analysis
For the Nine Months Ended September 30, 2015
(Expressed in U.S. Dollars, unless otherwise noted)
2015 HIGHLIGHTS
| • | Gryphon Deposit adds 43 Million Pounds of Uranium Resource at the Wheeler River Property: With the receipt of the final chemical assays from the drilling completed at Gryphon this summer, the Company completed an initial mineral resource estimate for the basement hosted Gryphon uranium deposit, which is located three kilometres to the northwest of the high-grade Phoenix deposit. |
The Gryphon deposit is estimated to contain an inferred mineral resource of 43.0 million U3O8 at an average grade of 2.3% U3O8. When combined with the high-grade Phoenix deposit, Wheeler River now contains an indicated resource of 70.2 million pounds U3O8 at a grade of 19.1% U3O8 and inferred resources totaling 44.1 million pounds U3O8 at a combined grade of 2.4%. The significant increase to the mineral resource estimate at Denison’s 60% owned Wheeler River property establishes the project as one of the largest and highest grade undeveloped uranium projects in the Athabasca Basin region
| • | Continued Exploration Success at the Wheeler River Property: The summer drilling program was completed with a total of 24,468 metres of drilling in 34 drill holes. The best result was drill hole WR-604, which intersected 6.3% U3O8 over 5.5 metres (779.0 to 784.5 metres), followed by 11.6% U3O8 over 1.0 metres (790.0 to 791.0 metres), extending the Gryphon Zone of mineralization approximately 50 metres in the down-dip direction. |
Twenty additional drill holes were completed in the general K North area surrounding the Gryphon Zone, to evaluate a variety of targets and identify additional mineralization. The best result from these targets was in drill hole WR-612, located 200 metres south of the unconformity mineralization identified on the WR-595/597 section during the winter 2015 exploration program. WR-612 intersected 2.4% U3O8 over 2.5 metres, approximately 25 metres below the unconformity.
| • | Positive summer 2015 drilling results at other pipeline exploration properties: |
| • | Murphy Lake: The first drill hole of the summer 2015 program intersected a new zone of uranium mineralization at Denison’s 58.94% owned Murphy Lake project. Drill hole MP-15-03 returned 0.25% U3O8 over 6.0 metres (270.0 to 276.0 metres) at the sub-Athabasca unconformity. |
| • | Waterbury Lake: Work focused on the Oban target area at Denison’s 61.55% owned Waterbury Lake project. Ground geophysical surveys were completed earlier in the year, improving the geological interpretation of the area and highlighting several drill targets that were tested during the summer drilling program. The best result was obtained from drill hole WL-425, which intersected 6.5 metres of elevated uranium (239.5 to 246.0 metres) that included 0.3% U3O8 over 0.5 metres and 0.1% U3O8 over 0.5 metres. |
| • | Crawford Lake: At the Company’s 100% owned Crawford Lake property, a large zone of intense sandstone alteration along the CR-2 and CR-5 conductors was extended by the summer drilling program and has now been confirmed over a strike length of 2.9 kilometres. |
| • | Toll milling revenue on track to exceed initial 2015 guidance: The McClean Lake mill, in which Denison holds a 22.5% interest, packaged approximately 6.7 million pounds U3O8 in the first nine months of 2015 for the Cigar Lake Joint Venture (“CLJV”), generating toll milling revenues for Denison of $1.9 million. If production continues at current rates, the McClean Lake mill could produce more than 10 million packaged pounds of U3O8 by the end of this year (previously targeted at six to eight million packaged pounds). The Company’s share of toll milling revenues for the year is now expected to be approximately $2.5 million. |
| • | Update on sale of Mongolian interests: During the second quarter, Denison entered into a share purchase agreement with Uranium Industry a.s. (“UI”), of the Czech Republic, which provided that UI would acquire all of Denison’s interest in uranium projects and operations located in Mongolia in exchange for cash consideration of $20 million, payable upon the achievement of specified milestones and subject to various conditions on closing (the “Mongolian Transaction”). The sale did not close as expected by September 8, 2015, as certain conditions were not satisfied. Denison remains the owner of its Mongolian interest and continues to pursue the closing of a transaction to sell its Mongolian interests to UI. |
| • | Denison and Fission Uranium Corp. (“Fission”) terminate arrangement agreement: On July 27, 2015, Denison entered into an agreement to combine its business with Fission by way of a court approved plan of arrangement (the “Arrangement”). Denison’s shareholders strongly supported the Arrangement. Although a majority of the Fission shareholders approved the Arrangement by the proxy voting deadline, the required two-thirds approval was not obtained. As a result, on October 13, 2015, the Arrangement was terminated. |
- 2 -
DENISON MINES CORP.
Management’s Discussion and Analysis
For the Nine Months Ended September 30, 2015
(Expressed in U.S. Dollars, unless otherwise noted)
ABOUT DENISON
Denison was formed under the laws of Ontario and is a reporting issuer in all Canadian provinces. Denison’s common shares are listed on the Toronto Stock Exchange (the “TSX”) under the symbol “DML” and on the NYSE MKT exchange under the symbol “DNN”.
Denison is a uranium exploration and development company with interests focused in the Athabasca Basin region of northern Saskatchewan. Including its 60% owned Wheeler River project, which hosts the high grade Phoenix and Gryphon uranium deposits, Denison’s exploration portfolio consists of numerous projects covering over 390,000 hectares in the eastern Athabasca Basin. Denison’s interests in Saskatchewan also include a 22.5% ownership interest in the McClean Lake joint venture, which includes several uranium deposits and the McClean Lake uranium mill, which is currently processing ore from the Cigar Lake mine under a toll milling agreement, plus a 25.17% interest in the Midwest deposit and a 61.55% interest in the J Zone deposit on the Waterbury Lake property. Both the Midwest and J Zone deposits are located within 20 kilometres of the McClean Lake mill. Internationally, Denison owns 100% of the conventional heap leach Mutanga project in Zambia, 100% of the uranium/copper/silver Falea project in Mali, a 90% interest in the Dome project in Namibia, and an 85% interest in the in-situ recovery projects held by the Gurvan Saihan joint venture (“GSJV”) in Mongolia.
Denison is engaged in mine decommissioning and environmental services through its Denison Environmental Services (“DES”) division, which manages Denison’s Elliot Lake reclamation projects and provides post-closure mine and maintenance services to a variety of customers.
Denison is also the manager of Uranium Participation Corporation (“UPC”), a publicly traded company listed on the TSX under the symbol “U”, which invests in uranium oxide and uranium hexafluoride.
SELECTED QUARTERLY FINANCIAL INFORMATION
| (in thousands) | As at September 30, 2015 |
As at December 31, 2014 |
||||||
| Financial Position: |
||||||||
| Cash and cash equivalents |
$ | 7,061 | $ | 18,640 | ||||
| Short term investments |
7,527 | 4,381 | ||||||
| Long term investments |
466 | 954 | ||||||
|
|
|
|
|
|||||
| Cash, cash equivalents and investments |
$ | 15,054 | $ | 23,975 | ||||
| Working capital |
$ | 13,687 | $ | 22,542 | ||||
| Property, plant and equipment |
$ | 227,192 | $ | 270,388 | ||||
| Total assets |
$ | 257,035 | $ | 311,330 | ||||
| Total long-term liabilities |
$ | 35,427 | $ | 42,291 | ||||
|
|
|
|
|
|||||
| Nine Months Ended | ||||||||
| (in thousands, except for per share amounts) | September 30, 2015 |
September 30, 2014 |
||||||
| Results of Operations: |
||||||||
| Total revenues |
$ | 8,783 | $ | 6,883 | ||||
| Net loss |
$ | (35,360 | ) | $ | (27,051 | ) | ||
| Basic and diluted loss per share |
$ | (0.07 | ) | $ | (0.06 | ) | ||
|
|
|
|
|
|||||
- 3 -
DENISON MINES CORP.
Management’s Discussion and Analysis
For the Nine Months Ended September 30, 2015
(Expressed in U.S. Dollars, unless otherwise noted)
| (in thousands, except for per share amounts) | 2015 Q3 |
2015 Q2 |
2015 Q1 |
2014 Q4 |
||||||||||||
| Results of Operations: |
||||||||||||||||
| Total revenues |
$ | 3,526 | $ | 2,929 | $ | 2,328 | $ | 2,736 | ||||||||
| Net loss |
$ | (21,432 | ) | $ | (4,134 | ) | $ | (9,794 | ) | $ | (4,652 | ) | ||||
| Basic and diluted loss per share |
$ | (0.04 | ) | $ | (0.01 | ) | $ | (0.02 | ) | $ | (0.01 | ) | ||||
|
|
|
|
|
|
|
|
|
|||||||||
| (in thousands, except for per share amounts) | 2014 Q3 |
2014 Q2 |
2014 Q1 |
2013 Q4 |
||||||||||||
| Results of Operations: |
||||||||||||||||
| Total revenues |
$ | 2,351 | $ | 2,358 | $ | 2,174 | $ | 2,413 | ||||||||
| Net loss |
$ | (2,820 | ) | $ | (11,564 | ) | $ | (12,667 | ) | $ | (30,459 | ) | ||||
| Basic and diluted loss per share |
$ | (0.01 | ) | $ | (0.02 | ) | $ | (0.03 | ) | $ | (0.06 | ) | ||||
|
|
|
|
|
|
|
|
|
|||||||||
RESULTS OF OPERATIONS
Revenues
Canada – Mining
During 2015, the McClean Lake mill continued to process ore received from the Cigar Lake mine under a toll milling agreement. The mill packaged approximately 6.7 million pounds U3O8 for the CLJV. The Company’s share of toll milling revenue from processing Cigar Lake ore at the McClean Lake mill, during the three and nine months ended September 30, 2015, totaled $982,000 and $1,904,000, respectively. In 2014, toll milling revenue was only recognized in the fourth quarter, as the first drums of CLJV uranium were packaged in October 2014.
Services and Other
Revenue from DES during the three and nine months ended September 30, 2015 was $2,113,000 and $5,527,000, respectively, compared to $1,956,000 and $5,263,000 during the same periods in 2014. In the nine months ended September 20, 2015, DES experienced an increase in Canadian dollar revenues due to an increase in activity at certain care and maintenance sites, which was largely offset by the unfavourable fluctuation in foreign exchange rates applicable on the translation of revenues earned in Canadian dollars.
Revenue from the Company’s management contract with UPC was $431,000 and $1,352,000 during the three and nine months ended September 30, 2015, compared to $395,000 and $1,620,000 for the same periods in 2014. The decrease in revenues during 2015 was due to a reduction in purchase commissions earned from UPC’s purchases of uranium and a decrease in management fees earned based on UPC’s monthly net asset value during the period. Refer to RELATED PARTY TRANSACTIONS below for further details.
Operating Expenses
Canada
McClean Lake is comprised of several uranium deposits and a high-grade uranium mill and is located on the eastern edge of the Athabasca Basin in northern Saskatchewan, approximately 750 kilometres north of Saskatoon. The McClean Lake uranium mill is one of the world’s largest uranium processing facilities. Expansion of the mill from 13 million to 24 million pounds annual U3O8 production capacity is ongoing while the mill processes ore from Cigar Lake under a toll milling agreement. Commissioning of the mill up to 18 million pounds annual U3O8 production capacity has begun and is expected to be completed in late 2015 or early 2016. The expansion remains fully funded by the CLJV.
- 4 -
DENISON MINES CORP.
Management’s Discussion and Analysis
For the Nine Months Ended September 30, 2015
(Expressed in U.S. Dollars, unless otherwise noted)
Operating expenses in Canada were $617,000 and $1,283,000 during the three and nine months ended September 30, 2015, compared to $140,000 and $397,000 in the same periods in 2014. Most of the operating expenses are attributable to activity involving the McClean Lake joint venture. Operating costs were higher during 2015 primarily due to depreciation of mill capital assets, as a result of the processing of Cigar Lake ore at the McClean Lake mill.
Africa
Operating expenses in Africa during the three and nine months ended September 30, 2015 totaled $79,000 and $241,000, respectively. During the same periods in 2014, operating expenses totaled $127,000 and $1,312,000. The majority of operating expenses relate to costs incurred on the Falea project in Mali. The higher operating expenses in 2014 related to engineering studies, metallurgical test work programs and environmental programs that were completed during the first half of 2014, following the acquisition of the Falea project.
Services and Other
Operating expenses during the three and nine months ended September 30, 2015 include costs relating to DES totaling $1,858,000 and $5,062,000, respectively, compared to $1,764,000 and $4,967,000 in the same periods in 2014. During 2015, DES experienced an increase in Canadian dollar operating expenses due to an increase in activity at certain care and maintenance sites, which was largely offset by the favourable fluctuation in foreign exchange rates applicable on the translation of expenses incurred in Canadian dollars.
Mineral Property Exploration
Denison is engaged in uranium exploration and/or evaluation in Canada, Zambia, Mali, Namibia and Mongolia. While the Company has material interests in uranium projects in Asia and Africa, the Company is focused primarily on the eastern Athabasca Basin, in Saskatchewan, Canada, with numerous projects there totaling over 390,000 hectares. Global exploration expenditures were $3,919,000 and $13,065,000 during the three and nine months ended September 30, 2015, with approximately 92% of exploration expenditures being incurred in Canada. Global exploration expenditures totaled $3,429,000 and $13,614,000 during the same periods in 2014. The decrease in global exploration expenditures during 2015 is mainly due to the favourable fluctuation in foreign exchange rates applicable on the translation of expenses denominated in Canadian dollars.
- 5 -
DENISON MINES CORP.
Management’s Discussion and Analysis
For the Nine Months Ended September 30, 2015
(Expressed in U.S. Dollars, unless otherwise noted)
Canada
The Company’s land position in the eastern Athabasca Basin, as of September 30, 2015, is illustrated below:
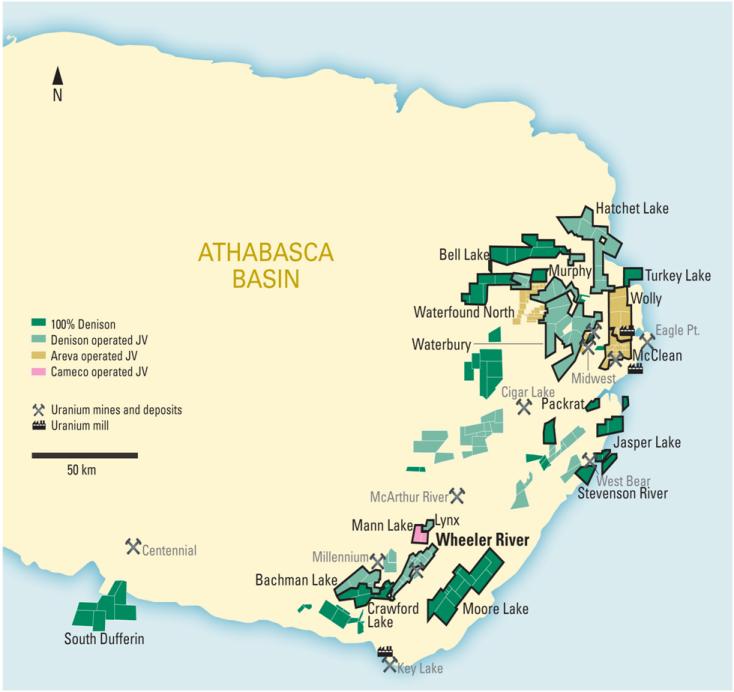
Denison’s share of exploration spending on its Canadian properties was $3,753,000 and $12,007,000 during the three and nine months ended September 30, 2015, as compared to $3,099,000 and $12,593,000 during the same periods in 2014. Exploration spending in Canada is seasonal with spending higher during the winter drilling programs (January to mid-April) and summer drilling programs (June to mid-October) in the Athabasca Basin.
- 6 -
DENISON MINES CORP.
Management’s Discussion and Analysis
For the Nine Months Ended September 30, 2015
(Expressed in U.S. Dollars, unless otherwise noted)
The following table summarizes the exploration activities that have been completed during the nine months ended September 30, 2015.
Canadian Exploration Activities
| Property | Denison’s ownership | Drilling in metres (m) | Other ongoing activities | |||
| Wheeler River | 60% | 42,168 (60 holes) | Geophysical surveys | |||
| Bell Lake | 100% | 2,044 (2 holes) | Geophysical surveys | |||
| Crawford Lake | 100% | 8,066 (13 holes) | Geophysical surveys | |||
| Hatchet Lake | 58.06%(1) | 2,547 (9 holes) | Geophysical surveys | |||
| Jasper Lake | 100% | 1,469 (7 holes) | — | |||
| Lynx Lake | 58.42%(1) | 1,338 (2 holes) | — | |||
| Mann Lake | 30% | 7,775 (14 holes) | — | |||
| Murphy Lake | 58.94%(1) | 1,818 (5 holes) | Geophysical surveys | |||
| Moore Lake | 100% | 2,667 (7 holes) | — | |||
| Turkey Lake | 100% | 702 (5 holes) | — | |||
| Stevenson River | 100% | 777 (3 holes) | — | |||
| Waterbury Lake | 61.55%(2) | 3,203 (8 holes) | Geophysical surveys | |||
| Waterfound North | 58.42%(1) | — | Geophysical surveys | |||
| Wolly | 22.5% | 5,169 (21 holes) | Geophysical surveys | |||
| Total | 79,743 (156 holes) |
| (1) | The Company’s ownership in these projects is as at December 31, 2014. Various partners in these projects have elected not to fund the 2015 programs and dilute their respective ownership interest. As a result, Denison’s interest will increase. |
| (2) | The Company earned an additional 1.55% interest in the Waterbury Lake project effective September 30, 2015. Refer to RELATED PARTY TRANSACTIONS below for further details. |
Wheeler River
The Wheeler River property lies in close proximity to existing mining and milling infrastructure between the McArthur River Mine and the Key Lake mill complex in the Athabasca Basin in northern Saskatchewan – this infrastructure includes the provincial power grid, provincial highways, air transportation and multiple uranium processing facilities, including the 22.5% Denison owned McClean Lake mill. Denison is the operator and holds a 60% interest in the project, while Cameco holds a 30% interest and JCU (Canada) Exploration Company, Limited (“JCU”) holds a 10% interest. Denison’s share of exploration costs at Wheeler River amounted to $1,829,000 and $4,604,000, respectively, during the three and nine months ended September 30, 2015, compared to $1,423,000 and $4,209,000 in the same periods in 2014.
A total of 24,468 metres of drilling was completed in 34 drill holes during the summer program at Wheeler River, all of which were completed by September 30, 2015. The winter 2015 drilling program was completed in April 2015, with a total of 17,700 metres in 26 holes.
- 7 -
DENISON MINES CORP.
Management’s Discussion and Analysis
For the Nine Months Ended September 30, 2015
(Expressed in U.S. Dollars, unless otherwise noted)
Increased Mineral Resource Estimate at Wheeler River
With the receipt of the final chemical assays from the drilling completed at Gryphon this summer, the Company completed an initial mineral resource estimate for the basement hosted Gryphon uranium deposit, which is located three kilometres to the northwest of the high-grade Phoenix deposit. When combined with the Phoenix deposit, Wheeler River now contains an indicated resource of 70.2 million pounds U3O8 at a grade of 19.1% U3O8 and inferred resources totaling 44.1 million pounds U3O8 at a combined grade of 2.4% – establishing Wheeler River as one of the largest and highest grade undeveloped uranium projects in the Athabasca Basin region.
The following table summarizes the mineral resource estimate for Wheeler River by deposit and classification. Mineral resources for the Phoenix deposit were last updated in 2014 to reflect the expansion of the high-grade zone. As no drilling has been completed since 2014, the resource estimate for the Phoenix deposit remains current.
2015 Wheeler River Property Mineral Resource Estimate Summary(1)(4)
| Deposit |
Category | Tonnes | Grade (% U3O8) |
Million Pounds
U3O8 (100% Basis) |
Million Pounds
U3O8 (Denison’s Share) |
|||||||||||||||
| Gryphon(2) |
Inferred | 834,000 | 2.3 | 43.0 | 25.8 | |||||||||||||||
| Phoenix(3) |
Indicated | 166,000 | 19.1 | 70.2 | 42.1 | |||||||||||||||
| Phoenix(3) |
Inferred | 9,000 | 5.8 | 1.1 | 0.7 | |||||||||||||||
| (1) | CIM Definitions were followed for classification of mineral resources. |
| (2) | Mineral resources for the Gryphon deposit are reported above a cut-off grade of 0.2% U3O8. The cut-off grade is based on internal conceptual studies and a price of US$50 per lb U3O8. |
| (3) | Mineral resources for the Phoenix deposit are reported above a cut-off grade of 0.8% U3O8. The cut-off grade is based on internal conceptual studies and a price of US$50 per lb U3O8. |
| (4) | Numbers may not add due to rounding. |
The mineral resource estimate was completed by RPA Inc (“RPA”), in accordance with National Instrument 43-101 (“NI 43-101”). For the Gryphon deposit, RPA used data collected from four surface diamond drilling campaigns completed during the last two years. Uranium grade data is comprised of chemical assays on half split drill core samples. Drill core recovery in the Gryphon deposit area is good, and therefore no down-hole gamma probe data was required for the estimate. The mineral resource estimate for the Gryphon deposit was classified as inferred based on the drill hole spacing and apparent continuity of mineralization.
Gryphon Drilling
The Gryphon deposit, located approximately three kilometres northwest of the high grade Phoenix uranium deposit, was discovered in 2014. The highest grade intersection to date at Gryphon was returned from drill hole WR-573D1, which intersected 22.2% U3O8 over 2.5 metres.
Seven of the 12 drill holes completed during the winter 2015 program, targeting extensions of the Gryphon zone, intersected significant uranium mineralization. As a result, the zone was extended up-plunge, down-plunge, and up-dip on two sections. Following up on the success from the winter program, seven drill holes completed during the summer 2015 program were designed to complete a 50 metre x 50 metre spaced drill pattern at Gryphon and outline the extent of the mineralization in the down-dip and down-plunge directions. The best result was in drill hole WR-604, which intersected 6.3% U3O8 over 5.5 metres (779.0 to 784.5 metres), followed by 11.6% U3O8 over 1.0 metres (790.0 to 791.0 metres)—extending the previously identified zone of mineralization approximately 50 metres in the down-dip direction.
Mineralization at Gryphon occurs 720 metres below surface and is centered approximately 220 metres below the sub-Athabasca unconformity. At its highest point it is within 80 metres of the unconformity and it is 370 metres below the unconformity at its deepest point. The deposit consists of a set of parallel, stacked, elongate lenses that are broadly conformable with the basement geology and associated with a significant fault that separates a thin unit of quartzite from an overlying graphitic pelite. The lenses dip moderately to the southeast and plunge moderately to the northeast. The deposit is approximately 450 metres long in the plunge direction, and 80 metres wide across the plunge. Thickness is variable and is a function of the number of stacked lenses present, generally varying between 2 and 20 metres.
- 8 -
DENISON MINES CORP.
Management’s Discussion and Analysis
For the Nine Months Ended September 30, 2015
(Expressed in U.S. Dollars, unless otherwise noted)
2015 Year to Date Probe and Assay Comparison Highlights from the Gryphon area(1)
| Down-Hole Total Gamma Probe | Assay | |||||||||||||||||||||||||||||||||||
| Hole Number |
Location | Mineralization | From (m) |
To (m) |
Length (m) |
eU3O8 (%)(2) |
From (m) |
To (m) |
Length (m) |
U3O8 (%) |
||||||||||||||||||||||||||
| WR-571D2(3,5) |
Up-Dip |
Basement |
512.6 | 517.9 | 5.3 | 3.2 | 512.0 | 517.5 | 5.5 | 3.9 | ||||||||||||||||||||||||||
| and |
Up-Dip |
Basement |
544.8 | 546.0 | 1.2 | 1.8 | 544.0 | 545.5 | 1.5 | 5.0 | ||||||||||||||||||||||||||
| WR-574D1(3,5) |
Up-Dip |
Basement |
510.4 | 511.4 | 1.0 | 7.5 | 510.0 | 511.0 | 1.0 | 8.1 | ||||||||||||||||||||||||||
| WR-582(4) |
Down-plunge |
Basement |
764.2 | 766.6 | 2.4 | 2.9 | 763.5 | 766.5 | 3.0 | 3.8 | ||||||||||||||||||||||||||
| WR-583(4) |
Down-plunge |
Basement |
786.3 | 788.7 | 2.4 | 2.8 | 786.1 | 788.1 | 2.0 | 3.7 | ||||||||||||||||||||||||||
| WR-583D2(3,5) |
Down-plunge |
Basement |
508.2 | 509.8 | 1.6 | 2.4 | 509.0 | 510.0 | 1.0 | 3.6 | ||||||||||||||||||||||||||
| WR-584B(3) |
Up-plunge |
Basement |
641.6 | 646.2 | 4.6 | 9.0 | 641.6 | 646.1 | 4.5 | 7.9 | ||||||||||||||||||||||||||
| WR-604(3) |
Down-Dip |
Basement |
779.2 | 783.9 | 4.7 | 3.8 | 779.0 | 784.5 | 5.5 | 6.3 | ||||||||||||||||||||||||||
| and |
Down-Dip |
Basement |
790.0 | 791.1 | 1.1 | 8.4 | 790.0 | 791.0 | 1.0 | 11.6 | ||||||||||||||||||||||||||
| WR-606D1(3)(5) |
Down-Dip |
Basement |
533.5 | 535.1 | 1.6 | 1.6 | 534.5 | 536.0 | 1.5 | 2.5 | ||||||||||||||||||||||||||
| WR-624(3) |
Up-Dip |
Basement |
682.3 | 683.3 | 1.0 | 2.8 | 682.5 | 683.5 | 1.0 | 3.8 | ||||||||||||||||||||||||||
| (1) | As the drill holes are angled steeply to the northwest and the basement mineralization is interpreted to dip moderately to the southeast, the true thickness of the basement mineralization is expected to be approximately 75% of the intersection lengths. |
| (2) | eU3O8 is radiometric equivalent uranium from a total gamma down-hole probe. |
| (3) | Composited above a cut-off grade of 1.0% eU3O8. |
| (4) | Composited above a cut-off grade of 0.05% eU3O8. |
| (5) | Distances are measured from a wedge, not from surface. |
Exploration in the K North Area
The K North Area is a new area of highly prospective targets surrounding the Gryphon Zone. This Area together with the K Central Area define a contiguous geological trend that runs along the western side of the Wheeler River property for approximately six kilometers and remains largely untested.
During the winter 2015 exploration program, 14 drill holes were completed to explore for other areas of mineralization along strike to the south of the Gryphon deposit. This resulted in the discovery of a new zone of uranium mineralization, occurring at the unconformity, 800 metres to the south of Gryphon. The discovery was highlighted by the results in drill holes WR-595 and WR-597. Mineralization in this zone straddles the unconformity, replacing the matrix of the basal sandstone or filling fractures in the underlying pelitic strata. The area is characterized by graphitic faults and a prospective alteration zone that extends from the south end of Gryphon.
Following the discovery of the new zone of uranium mineralization occurring at the unconformity, the summer 2015 exploration program followed up with 20 drill holes in the K North Area, to the south, north and west of Gryphon, to evaluate a variety of targets and identify additional mineralization. The best result from these targets was in drill hole WR-612, located 200 metres south of the unconformity mineralization identified on the WR-595/597 section during the winter 2015 exploration program. WR-612 intersected 2.4% U3O8 over 2.5 metres, approximately 25 metres below the unconformity.
- 9 -
DENISON MINES CORP.
Management’s Discussion and Analysis
For the Nine Months Ended September 30, 2015
(Expressed in U.S. Dollars, unless otherwise noted)
2015 Year to Date Probe and Assay Comparison Highlights from the area South of Gryphon(1)
| Down-Hole Total Gamma Probe | Assay | |||||||||||||||||||||||||||||||||||
| Hole Number |
Location | Mineralization | From (m) |
To (m) |
Length (m) |
eU3O8 (%)(2) |
From (m) |
To (m) |
Length (m) |
U3O8 (%) |
||||||||||||||||||||||||||
| WR-595(3) |
South of Gryphon |
Unconformity |
525.0 | 526.2 | 1.2 | 1.0 | 526.2 | 527.7 | 1.5 | 0.5 | ||||||||||||||||||||||||||
| WR-597(4) |
South of Gryphon |
Unconformity |
496.5 | 500.5 | 4.0 | 2.8 | 495.5 | 500.0 | 4.5 | 4.5 | ||||||||||||||||||||||||||
| WR-612(4) |
South of Gryphon |
Basement |
530.8 | 532.3 | 1.5 | 2.7 | 529.5 | 532.0 | 2.5 | 2.4 | ||||||||||||||||||||||||||
| (1) | As the unconformity mineralization is horizontal, the true thickness is expected to be approximately 90% of the intersection lengths. |
| (2) | eU3O8 is radiometric equivalent uranium from a total gamma down-hole probe. |
| (3) | Composited above a cut-off grade of 0.05% eU3O8. |
| (4) | Composited above a cut-off grade of 1.0% eU3O8. |
Exploration is also expected to continue in the K-North Area, where recent drilling has continued to return encouraging results that suggest that the entire K-North trend has the potential to host additional zones of significant basement and unconformity mineralization related to the Gryphon deposit.
- 10 -
DENISON MINES CORP.
Management’s Discussion and Analysis
For the Nine Months Ended September 30, 2015
(Expressed in U.S. Dollars, unless otherwise noted)
Gryphon Deposit – Basement Hosted Uranium Discovery at Wheeler River
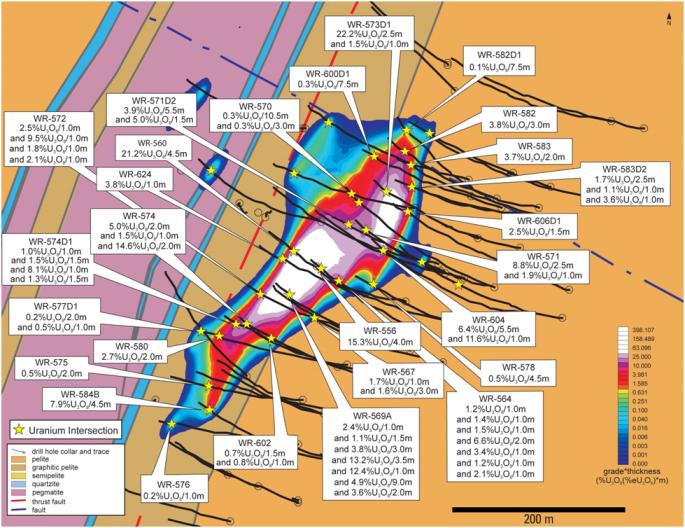
- 11 -
DENISON MINES CORP.
Management’s Discussion and Analysis
For the Nine Months Ended September 30, 2015
(Expressed in U.S. Dollars, unless otherwise noted)
Wheeler River Target Areas
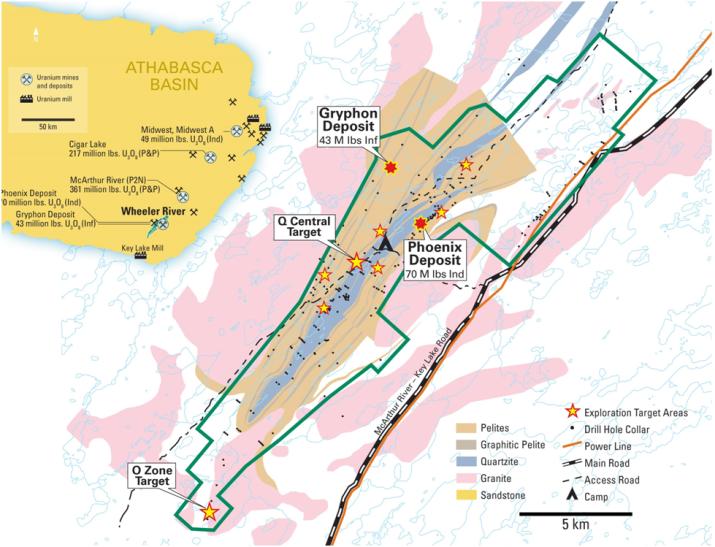
- 12 -
DENISON MINES CORP.
Management’s Discussion and Analysis
For the Nine Months Ended September 30, 2015
(Expressed in U.S. Dollars, unless otherwise noted)
Exploration Pipeline Properties
During the summer 2015 exploration program, Denison carried out exploration or geophysical surveys on nine other properties, within its landholdings on the eastern side of the Athabasca Basin. Work on these pipeline exploration projects continues to deliver encouraging results.
Murphy Lake – The first drill hole of the summer 2015 program intersected a new zone of uranium mineralization. Assays for drill hole MP-15-03 returned 0.25% U3O8 over 6.0 metres (270.0 to 276.0 metres). The mineralization at Murphy Lake is located at the sub-Athabasca unconformity and is associated with a zone of strong sandstone alteration including desilicification and clay over a hematite cap. Basement rocks immediately below the mineralization consist of graphitic pelitic gneisses cut by faults. As the mineralization is interpreted to be horizontal and the drill holes are steeply inclined, the true thickness is expected to be at least 75% of the intersection length. Murphy Lake is located approximately 30 kilometres northwest of the McClean Lake mill and is a joint venture with Eros Resources Inc. (41.06% interest). The 2015 program at Murphy Lake is being fully funded by Denison as a result of Eros’ choice to dilute its interest. Denison’s share of exploration costs amounted to $357,000 and $459,000, respectively, during the three and nine months ended September 30, 2015, compared to $236,000 and $296,000 in the same periods in 2014.
Waterbury Lake – Work was focused on the Oban target area. Ground geophysical surveys completed earlier in the year improved the geological interpretation of the area and highlighted several drill targets that were tested during the summer drilling program. The best result was obtained from drill hole WL-425, which intersected 6.5 metres of elevated uranium from 239.5 to 246.0 metres that included 0.3% U3O8 over 0.5 metres and 0.1% U3O8 over 0.5 metres. Waterbury Lake is a joint venture between Denison (61.55% interest and operator) and the Korea Waterbury Uranium Limited Partnership (38.45% interest). On September 30, 2015, Denison earned an additional 1.55% interest in the Waterbury Lake project. Refer to RELATED PARTY TRANSACTIONS below for further details. Denison’s share of exploration costs amounted to $318,000 and $685,000, respectively, during the three and nine months ended September 30, 2015, compared to $47,000 and $694,000 in the same periods in 2014.
Crawford Lake – A large zone of intense sandstone alteration along the CR-2 and CR-5 conductors was extended by the summer drilling program and has now been confirmed over a strike length of 2.9 kilometres. While no significant uranium mineralization was intersected in 2015, the volume and tenor of the alteration system is encouraging and remains a priority for future exploration activities. Crawford Lake is 100% owned by Denison. Exploration costs amounted to $599,000 and $1,892,000, respectively, during the three and nine months ended September 30, 2015, compared to $879,000 and $1,285,000 in the same periods in 2014.
Africa
Exploration expenses in Africa during the three and nine months ended September 30, 2015 were $153,000 and $677,000, respectively. During the same periods in 2014, exploration expenses were $288,000 and $689,000. Exploration activity planned for 2015 has been designed to maintain the Company’s claims in good standing while advancing the exploration potential of its assets as part of a strategy to pursue a spin-out or disposal transaction when market conditions permit.
Zambia
Exploration expenditures at the Mutanga project during the three and nine months ended September 30, 2015 were $115,000 and $332,000, respectively. An excavator trenching program was completed during the second quarter of 2015 and a program of surficial geochemistry was subsequently completed during the third quarter of 2015. Results of the trenching and geochemistry programs are positive and several drill-ready targets have been identified. During the same periods in 2014, exploration expenses were $203,000 and $411,000, when work included geological mapping, geochemical sampling and excavator trenching programs at the Company’s Mutanga project.
Mali
Exploration expenditures of $36,000 and $338,000 were incurred during the three and nine months ended September 30, 2015, primarily relating to an airborne geophysical survey completed in the first quarter, which was designed to extend the coverage of a previously flown survey. In February 2015, an application was made to renew the Falea exploration permit. The convention for a new permit was signed by the Minister of Mines in July 2015 and the final exploration permit was issued during the third quarter. During the three and nine months ended September 30, 2014, exploration expenditures amounted to $68,000 and $220,000, respectively, with a field program consisting of geological mapping and surficial geochemistry surveys completed during the second quarter.
- 13 -
DENISON MINES CORP.
Management’s Discussion and Analysis
For the Nine Months Ended September 30, 2015
(Expressed in U.S. Dollars, unless otherwise noted)
An independent mineral resource estimate has been completed for the Falea deposit. The resource estimate is summarized in the table below.
2015 Falea Property Mineral Resource Estimate Summary
| Category |
Tonnes (Million tonnes) |
U3O8 (%) |
Cu (%) |
Ag (Grams per Tonne) |
U3O8 (Million Pounds) |
Cu (Million Pounds) |
Ag (Million Ounces) |
|||||||||||||||||||||
| Indicated |
6.88 | 0.115 | 0.161 | 72.8 | 17.4 | 24.4 | 16.11 | |||||||||||||||||||||
| Inferred |
8.78 | 0.069 | 0.200 | 17.3 | 13.4 | 38.7 | 4.90 | |||||||||||||||||||||
Mineralization at Falea occurs in the flat lying Neoproterozoic Kania sandstone, which is underlain and overlain by argillaceous units. The Kania sandstone is located near the bottom of the Taoudeni Basin sequence. The mineralization is interpreted as an unconformity type uranium, silver and copper deposit, since it is associated with the unconformity between the Kania sandstone and the underlying Birimian greenstones. The Falea deposit mineral resource estimate was completed by RPA in accordance with NI 43-101 and will be available on Denison’s website.
Namibia
No significant exploration work was completed on the Dome project during 2015. Similarly, no significant exploration work was carried out during 2014. Exploration licenses on the Company’s Dome project will expire in November 2015. License renewal applications were submitted by the Company in September 2015.
Mongolia
Exploration expenditures on the GSJV properties totaled $13,000 and $381,000 during the three and nine months ended September 30, 2015, compared to $42,000 and $332,000 during the same periods in 2014. Expenditures in both periods were primarily related to annual license payments, required to maintain the GSJV properties in good standing while the Company explored strategic alternatives regarding its ownership interest in the GSJV.
On July 29, 2015, Denison entered into a share purchase agreement with UI, whereby UI would acquire all of Denison’s interest in uranium projects and operations located in Mongolia in exchange for cash consideration of $20 million, payable upon the achievement of specified milestones and subject to various conditions on closing. The consideration, under the agreement, included an initial payment of $250,000 and a deferred payment of $19,750,000 by November 30, 2015. The deferred payment was to be guaranteed in the event that the mining licences for each of the Hairhan, Haraat, Gurvan Saihan, and Ulziit projects (the “Mining Licences”) were granted to the GSJV on or before November 30, 2015. The sale did not close as expected by September 8, 2015, as certain conditions were not satisfied. Denison remains the owner of its 85% interest in the GSJV and continues to pursue the closing of a transaction to sell its Mongolian interests to UI.
General and Administrative
Total general and administrative expenses were $2,466,000 and $5,803,000 during the three and nine months ended September 30, 2015, compared with $1,535,000 and $6,041,000 during the same periods in 2014. These costs are mainly comprised of head office salaries and benefits, office costs in multiple regions, audit and regulatory costs, legal fees, investor relations expenses, project costs and all other costs related to operating a public company with listings in Canada and the United States. The decrease in general and administrative expenses for the nine months ending September 30, 2015 was primarily a result of a decrease in office costs and the favourable fluctuation in foreign exchange rates applicable on the translation of Canadian dollar expenses, partly offset by an increase in project costs associated with the Arrangement. As of September 30, 2015, the Company incurred project costs totaling $1,181,000 relating to the Arrangement.
- 14 -
DENISON MINES CORP.
Management’s Discussion and Analysis
For the Nine Months Ended September 30, 2015
(Expressed in U.S. Dollars, unless otherwise noted)
Impairment – Mineral Properties
There was no impairment recognized during 2015. During the first quarter of 2014, the Company recognized a mineral property impairment charge of $1,658,000 associated with the Company’s release of its Black Lake land holdings in Canada. There was no impairment recognized during the second or third quarter of 2014.
Foreign Exchange Income and Expense
During the three and nine months ended September 30, 2015, foreign exchange expense was $16,294,000 and $20,551,000, respectively, compared with foreign exchange income of $1,487,000 and foreign exchange expense of $8,566,000 during the same periods in 2014. The increase in the foreign exchange expense during 2015 is due to unfavourable fluctuations in foreign exchange rates primarily related to the weakening of the Zambian Kwacha against the US dollar, resulting in a foreign exchange expense on the revaluation of US dollar denominated intercompany debt.
Other Income and Expenses
The Company recognized other income of $64,000 and other expenses of $539,000 during the three and nine months ended September 30, 2015, respectively, compared to other expenses of $81,000 and other income of $561,000 during the same periods in 2014. The Company recognized $423,000 in losses on investments carried at fair value during the nine months ended September 30, 2015, compared to gains of $88,000 on investments during the same period in 2014. During the nine months ended September 30, 2014, the Company recognized a gain of $202,000 on the sale of land holdings related to the Way Lake and Yurchison Lake properties and received a payment of $229,000 in accordance with an option agreement with SeqUr Exploration Inc. (“SeqUr”) to earn up to a 60% interest in Denison’s Jasper Lake property. In February 2015, SeqUr terminated its option to earn an interest in the Jasper Lake property.
LIQUIDITY AND CAPITAL RESOURCES
Cash and cash equivalents were $7,061,000 at September 30, 2015 compared with $18,640,000 at December 31, 2014. The decrease of $11,579,000 was primarily due to net cash used in operations of $15,001,000, net cash used in investing activities of $6,317,000 and a net foreign exchange loss of $1,969,000 on the translation of currency balances at period end, partly offset by net cash provided by financing activities of $11,708,000.
Net cash used in operating activities of $15,001,000 during the nine months ended September 30, 2015 is comprised of a net loss for the period adjusted for non-cash items and changes in working capital items.
Net cash used in investing activities of $6,317,000 consists primarily of cash used to purchase investments of $8,134,000 and property, plant and equipment of $1,871,000, partly offset by cash provided by the maturity of investments in debt instruments and the sale of investments in equity instruments totaling $4,033,000. Property, plant and equipment spending includes the additional 1.55% interest earned on the Waterbury Lake property of $835,000. Refer to TRANSACTIONS WITH RELATED PARTIES for further details.
Net cash provided by financing activities of $11,708,000 largely reflects net proceeds received on the issuance of flow-through common shares. On May 26, 2015, the Company closed a CAD$15 million private placement for the issuance of 12,000,000 flow-through common shares at a price of CAD$1.25 per share. The proceeds will be used to fund the Company’s Canadian exploration programs through to the end of 2016. As at September 30, 2015, the company has spent CAD$373,000 towards its obligation to spend CAD$15 million on eligible Canadian exploration expenses associated with this financing. Other financing activities included proceeds received from the issuance of common shares on the exercise of stock options and warrants for a total of $411,000.
As at September 30, 2015, the Company has fulfilled its obligation to spend CAD$14,997,000 on eligible Canadian exploration expenses under the flow-through share financing completed in August 2014
The Company holds a large majority of its cash and investments in Canadian dollars. As at September 30, 2015, the Company’s cash and cash equivalents and current investments amount to CAD$19,468,000.
- 15 -
DENISON MINES CORP.
Management’s Discussion and Analysis
For the Nine Months Ended September 30, 2015
(Expressed in U.S. Dollars, unless otherwise noted)
Revolving Term Credit Facility
On January 30, 2015, the Company entered into an agreement with the Bank of Nova Scotia to amend the terms of a revolving term credit facility entered into in 2014 and to extend the maturity date to January 31, 2016. Under the amended agreement, the Company has access to credit of up to CAD$24,000,000. Use of the facility remains restricted to non-financial letters of credit in support of reclamation obligations.
The amended agreement contains a covenant to maintain a level of tangible net worth greater than or equal to the sum of $150,000,000 and a covenant to maintain a minimum balance of cash and equivalents of CAD$5,000,000 on deposit with the Bank of Nova Scotia. As security for the amended facility, Denison has provided an unlimited full recourse guarantee and a pledge of all of the shares of Denison Mines Inc. (“DMI”). DMI has provided a first-priority security interest in all present and future personal property and an assignment of its rights and interests under all material agreements relative to the McClean Lake and Midwest projects. The amended facility is also subject to letter of credit and standby fees of 2.40% and 0.75%, respectively.
Reclamation Sites
Elliot Lake – Spending on restoration activities at the Elliot Lake sites is funded from monies in the Elliot Lake Reclamation Trust Fund. At September 30, 2015, the amount of restricted cash and investments relating to the Elliot Lake Reclamation Trust fund was $2,212,000.
McClean Lake and Midwest – Under the Mineral Industry Environmental Protection Regulations, 1996, the Company is required to provide its pro-rata share of financial assurances to the Province. The Company has in place irrevocable standby letters of credit from a chartered bank in favour of Saskatchewan’s Ministry of Environment, totaling CAD$9,698,000 which relate to a previously filed reclamation plan. Under the preliminary updated plan submitted in November 2014, the Company expects to increase its pro-rata share of financial assurances to the Province to approximately CAD$22,446,000.
TRANSACTIONS WITH RELATED PARTIES
Uranium Participation Corporation
The Company is a party to a management services agreement with UPC. Under the terms of the agreement, the Company receives the following fees from UPC: a) a commission of 1.5% of the gross value of any purchases or sales of uranium completed at the request of the Board of Directors of UPC; b) a minimum annual management fee of CAD$400,000 (plus reasonable out-of-pocket expenses) plus an additional fee of 0.3% per annum based upon UPC’s net asset value in excess of CAD$100,000,000; and c) a fee, at the discretion of the Board of Directors of UPC, for on-going monitoring or work associated with a transaction or arrangement (other than a financing, or the purchase or sale of uranium).
The management services agreement was entered into on April 1, 2013 and has a three-year term. The agreement may be terminated by either party upon the provision of 120 days written notice.
The following management fees were received from UPC for the periods noted:
| Three Months Ended | Nine Months Ended | |||||||||||||||
| (in thousands) | September 30, 2015 |
September 30, 2014 |
September 30, 2015 |
September 30, 2014 |
||||||||||||
| Revenue |
||||||||||||||||
| Management fees |
$ | 431 | $ | 395 | $ | 1,330 | $ | 1,175 | ||||||||
| Commission fees |
— | — | 22 | 445 | ||||||||||||
|
|
|
|
|
|
|
|
|
|||||||||
| $ | 431 | $ | 395 | $ | 1,352 | $ | 1,620 | |||||||||
|
|
|
|
|
|
|
|
|
|||||||||
At September 30, 2015, accounts receivable includes $161,000 (December 31, 2014: $123,000) due from UPC with respect to the fees and transactions discussed above.
- 16 -
DENISON MINES CORP.
Management’s Discussion and Analysis
For the Nine Months Ended September 30, 2015
(Expressed in U.S. Dollars, unless otherwise noted)
Korea Electric Power Corporation (“KEPCO”)
In 2009, Denison entered into a strategic relationship agreement with its largest shareholder, KEPCO. Pursuant to the strategic relationship agreement, KEPCO is entitled to subscribe for additional common shares in Denison’s future share offerings. The strategic relationship agreement also provides KEPCO with a right of first opportunity if Denison intends to sell any of its substantial assets, a right to participate in certain purchases of substantial assets which Denison proposes to acquire and a right to nominate one director to Denison’s Board, so long as its share interest in Denison is above 5.0%. In January 2015, Mr. Tae Hwan Kim, KEPCO’s representative on Denison’s Board resigned and was replaced by Mr. Joo Soo Park.
As at September 30, 2015, KEPCO holds 58,284,000 shares of Denison representing a share interest of 11.2%.
Prior to September 30, 2015, Denison also held a 60% interest in Waterbury Lake Uranium Corporation (“WLUC”) and Waterbury Lake Uranium Limited Partnership (“WLULP”) entities whose key asset is the Waterbury Lake property. The other remaining 40% interest in these entities is held by a consortium of investors (“KWULP”) of which KEPCO is the primary holder. When a spending program is approved by the participants, each participant is required to fund these entities based upon its respective ownership interest. Spending program approval requires 75% of the voting interest.
In January 2014, Denison agreed to allow KWULP to defer its funding obligations to WLUC and WLULP until September 30, 2015 and not be diluted as per the dilution provisions in the relevant agreements, in exchange for allowing Denison to authorize spending programs without obtaining the approval of 75% of the voting interest.
On September 30, 2015, KWULP notified Denison that it has elected to dilute its interest in the Waterbury Lake project and that it will not fund its deferred funding obligation to WLUC and WLULP. As a result, Denison is entitled to an additional 1.55% interest in the Waterbury Lake project and Denison will continue to be able to authorize funding programs without obtaining the approval of 75% of the voting interest up to September 30, 2016. The acquisition of the additional 1.55% in Waterbury Lake has been accounted for using an effective date of September 30, 2015 and has resulted in Denison recording its increased pro-rata share of the net assets of Waterbury Lake, the majority of which results in an addition to mineral property assets of $835,000.
Other
During the three and nine months ended September 30, 2015, all services and transactions with the following related parties were made on terms equivalent to those that prevail with arm’s length transactions:
| • | Investor relations, administrative service fees and other expenses of $76,000 and $138,000 were incurred during the three and nine months ended September 30, 2015 (September 30, 2014: $14,000 and $42,000) with Namdo Management Services Ltd, which shares a common director with Denison. These services were incurred in the normal course of operating a public company. At September 30, 2015, an amount of $nil (December 31, 2014: $nil) was due to this company. |
| • | Legal fees of $387,000 and $445,000 were incurred during the three and nine months ended September 30, 2015 (September 30, 2014: $39,000 and $273,000) with Cassels Brock & Blackwell, LLP, a law firm of which a member of Denison’s Board of Directors is a partner. In the current year, the services and associated costs are mainly related to the Arrangement with Fission. In the prior year, the services and associated costs were mainly related to the acquisition of International Enexco Ltd. and the Company’s internal reorganization of its interests to consolidate its African holdings. At September 30, 2015, an amount of $177,000 (December 31, 2014: $1,000) was due to the law firm. |
| • | Executive services of $33,000 and $61,000 were provided by the Company during the three and nine months ended September 30, 2014 to Lundin Gold Inc. No similar services were provided during 2015. At September 30, 2015, an amount of $nil (December 31, 2014: $44,000) was due to Denison. |
Compensation of Key Management Personnel
Key management personnel are those persons having authority and responsibility for planning, directing and controlling the activities of the Company, directly or indirectly. Key management personnel include the Company’s executive officers, vice-presidents and members of its Board of Directors.
- 17 -
DENISON MINES CORP.
Management’s Discussion and Analysis
For the Nine Months Ended September 30, 2015
(Expressed in U.S. Dollars, unless otherwise noted)
The following compensation was awarded to key management personnel:
| Three Months Ended | Nine Months Ended | |||||||||||||||
| (in thousands) | September 30, 2015 |
September 30, 2014 |
September 30, 2015 |
September 30, 2014 |
||||||||||||
| Salaries and short-term employee benefits |
$ | 307 | $ | 315 | $ | 1,123 | $ | 1,294 | ||||||||
| Share-based compensation |
89 | 129 | 296 | 396 | ||||||||||||
| Termination benefits |
— | — | — | 158 | ||||||||||||
|
|
|
|
|
|
|
|
|
|||||||||
| $ | 396 | $ | 444 | $ | 1,419 | $ | 1,848 | |||||||||
|
|
|
|
|
|
|
|
|
|||||||||
SUBSEQUENT EVENTS
Termination of Arrangement with Fission
In October 2015, Denison and Fission terminated the previously announced Arrangement pursuant to which Denison and Fission were to combine their respective businesses by way of a court-approved plan of arrangement. At the deadline for submission of proxies on Friday October 9, 2015, Denison’s shareholders strongly supported the Arrangement. While a majority of the Fission shares voted were in favour of the Arrangement, the required two-thirds approval was not obtained. As a result of the termination of the Arrangement, neither Fission nor Denison held their respective shareholders meetings which were scheduled for October 14, 2015.
OFF-BALANCE SHEET ARRANGEMENTS
The Company does not have any off-balance sheet arrangements.
OUTSTANDING SHARE DATA
At November 5, 2015, there were 518,438,669 common shares issued and outstanding, stock options outstanding for 7,057,210 Denison common shares, and nil warrants outstanding for a total of 525,495,879 common shares on a fully-diluted basis.
OUTLOOK FOR 2015
At the end of the second quarter, the Company’s Previous Outlook was revised to reflect additional spending in Mongolia incurred in connection with the Mongolian Transaction. The Previous Outlook also includes modifications that were made at the end of the first quarter for revisions to the budgeted USD$ to CAD$ foreign exchange rate to 1.24 from 1.12, as a result of the significant devaluation of the Canadian dollar. The Company’s Current Outlook, has been further modified at the end of the third quarter to reflect actual expenditures as at September 30, 2015 and to incorporate updated spending estimates for the remainder of the year.
- 18 -
DENISON MINES CORP.
Management’s Discussion and Analysis
For the Nine Months Ended September 30, 2015
(Expressed in U.S. Dollars, unless otherwise noted)
| (in thousands) | Previous Outlook 2015 (1)(4) |
Current Outlook 2015 (1) |
Actual
to September 30, 2015 (3) |
|||||||||
| Canada (2) |
||||||||||||
| Toll Milling Revenue |
$ | 2,080 | $ | 2,540 | $ | 1,887 | ||||||
| Mineral Sales |
1,120 | — | — | |||||||||
| Mineral Property Exploration |
(12,890 | ) | (13,070 | ) | (12,465 | ) | ||||||
| Development & Operations |
(1,620 | ) | (1,250 | ) | (733 | ) | ||||||
|
|
|
|
|
|
|
|||||||
| (11,310 | ) | (11,780 | ) | (11,311 | ) | |||||||
| Africa |
||||||||||||
| Zambia, Mali and Namibia |
(2,340 | ) | (2,240 | ) | (1,586 | ) | ||||||
|
|
|
|
|
|
|
|||||||
| (2,340 | ) | (2,240 | ) | (1,586 | ) | |||||||
| Asia |
||||||||||||
| Mongolia |
(1,200 | ) | (1,300 | ) | (1,117 | ) | ||||||
|
|
|
|
|
|
|
|||||||
| (1,200 | ) | (1,300 | ) | (1,117 | ) | |||||||
| Other Activities (2) |
||||||||||||
| UPC Management |
1,680 | 1,680 | 1,237 | |||||||||
| DES Environmental Services |
150 | 400 | 346 | |||||||||
| Corporate General & Administration |
(4,150 | ) | (5,470 | ) | (4,406 | ) | ||||||
|
|
|
|
|
|
|
|||||||
| (2,320 | ) | (3,390 | ) | (2,823 | ) | |||||||
|
|
|
|
|
|
|
|||||||
| Total |
$ | (17,170 | ) | $ | (18,710 | ) | $ | (16,837 | ) | |||
|
|
|
|
|
|
|
|||||||
| (1) | Only material operations are shown. |
| (2) | Outlook figures have been converted using a US$ to CAD$ exchange rate of 1.24. |
| (3) | The Company budgets on a cash basis. As a result, actual amounts represent a non-GAAP measure and excludes non-cash depreciation and amortization amounts totaling $1,844,000. |
| (4) | Reflects Outlook 2015 figures as disclosed in the Six Months Ended June 30, 2015 MD&A. |
Canada
Toll Milling Revenue, Mineral Sales, Development & Operations
If production continues at current rates, the McClean Lake mill could produce more than 10 million packaged pounds of U3O8 by the end of this year (previously targeted at six to eight million packaged pounds). To reflect the increase in production, toll milling revenue for 2015 is now projected to total $2.5 million. Production will be primarily from Cigar Lake ore.
Mineral sales of approximately 26,000 pounds U3O8 recovered from McClean Lake ore has been deferred until market conditions improve.
Denison’s share of operating and capital expenditures at McClean Lake for 2015 is now forecasted to be $260,000, while total expenditures on SABRE, McClean North and Midwest projects remain unchanged and are planned to be CAD$900,000 on SABRE (Denison’s share, CAD$203,000) and CAD$375,000 on McClean North and Midwest (Denison’s share, CAD$94,000).
Reclamation expenditures at Elliot Lake are now projected to be $550,000.
Mineral Property Exploration
All field activities for 2015 are now complete and the results have been presented. Annual assessment reports are being written and planning is well under way for the 2016 exploration season, which will begin with winter programs starting in January after freeze-up in northern Saskatchewan.
- 19 -
DENISON MINES CORP.
Management’s Discussion and Analysis
For the Nine Months Ended September 30, 2015
(Expressed in U.S. Dollars, unless otherwise noted)
Wheeler River
Given the close proximity of the Gryphon and Phoenix deposits, the Company is currently working on a Preliminary Economic Assessment (“PEA”) to validate the co-development potential of the two deposits as a single uranium development project. The results of the PEA are expected in early fiscal 2016.
Exploration is also expected to continue around the Gryphon deposit, where recent drilling has continued to return encouraging results that suggest the area around Gryphon and the entire K-North trend has the potential to host additional zones of significant basement and unconformity mineralization related to the Gryphon deposit.
In 2016, two other areas beyond the K-North trend called the O Zone and Q Central area are also expected to be explored. The O Zone is characterized by weak uranium mineralization along a strong conductor associated with an 80 metre offset of the unconformity. This large area has been tested by only six historic drill holes, five of which were completed too far into the hangingwall side of the structure and failed to intersect the fault. Drilling at Q Central, in the past, has returned significant uranium intersections, including 1.5% U3O8 over 0.5 metres in drill hole WR-204, associated with faulted graphitic pelites in contact with quartzite and warrants follow up.
Africa
The Company has now forecasted spending to be approximately $2.2 million during 2015 to maintain its projects in good standing, while the Company waits for market conditions that will permit a spin-out or disposal of its African portfolio. On its wholly owned Mutanga project in Zambia, activities to follow up on exploration targets generated through soil and radon sampling are being considered. In Mali, activities continue to focus on following up on the recently completed airborne geophysical surveying.
Asia
In Mongolia, the Company continues to pursue a sale of its 85% interest in the GSJV to UI. The current outlook for Mongolia has increased to $1.3 million for 2015, to reflect additional spending incurred in relation to the Mongolian Transaction activities.
Other Activities
The forecast for management fees generated from Denison’s management services agreement with UPC remain unchanged as are budgeted to be CAD$2.1 million in 2015.
At DES, revenue from operations is now forecasted to be $7.0 million and operating and capital expenses are now projected to be $6.6 million, resulting in an increase DES’ contribution of roughly $250,000.
Corporate general and administration expenses are now forecasted to be $5.5 million in 2015 to reflect additional project costs associated with the Arrangement. Corporate general and administration expenses include all head office wages and benefits, office costs, audit and regulatory costs, legal fees, investor relations expenses and all other costs related to operating a public company with listings in Canada and the United States.
CONTROLS AND PROCEDURES
The Company’s management is responsible for establishing and maintaining an adequate system of internal control over financial reporting. Any system of internal control over financial reporting, no matter how well designed, has inherent limitations. Therefore, even those systems determined to be effective can provide only reasonable assurance with respect to financial statement preparation and presentation.
There has not been any change in the Company’s internal control over financial reporting that occurred during the nine months ended September 30, 2015 that has materially affected, or is reasonably likely to materially affect, the Company’s internal control over financial reporting.
- 20 -
DENISON MINES CORP.
Management’s Discussion and Analysis
For the Nine Months Ended September 30, 2015
(Expressed in U.S. Dollars, unless otherwise noted)
QUALIFIED PERSON
The disclosure of scientific and technical information regarding Denison’s properties in the MD&A was prepared by or reviewed by Steve Blower, P. Geo., the Company’s Vice President, Exploration, and Terry Wetz, P.E., the Executive Director of the GSJV, who are Qualified Persons in accordance with the requirements of NI 43-101. For a description of the quality assurance program and quality control measures applied by Denison, please see Denison’s Annual Information Form dated March 5, 2015 available at www.sedar.com, and its Form 40-F available at www.sec.gov/edgar.shtml.
- 21 -
Exhibit 99.4
FORM 52-109F2
CERTIFICATION OF INTERIM FILINGS
I, David D. Cates, President and Chief Executive Officer of Denison Mines Corp., certify the following:
| 1. | Review: I have reviewed the interim financial report and interim MD&A (together, the “interim filings”) of Denison Mines Corp. (the “issuer”) for the interim period ended September 30, 2015. |
| 2. | No misrepresentations: Based on my knowledge, having exercised reasonable diligence, the interim filings do not contain any untrue statement of a material fact or omit to state a material fact required to be stated or that is necessary to make a statement not misleading in light of the circumstances under which it was made, with respect to the period covered by the interim filings. |
| 3. | Fair presentation: Based on my knowledge, having exercised reasonable diligence, the interim financial report together with the other financial information included in the interim filings fairly present in all material respects the financial condition, financial performance and cash flows of the issuer, as of the date of and for the periods presented in the interim filings. |
| 4. | Responsibility: The issuer’s other certifying officer(s) and I are responsible for establishing and maintaining disclosure controls and procedures (DC&P) and internal control over financial reporting (ICFR), as those terms are defined in National Instrument 52-109 Certification of Disclosure in Issuers’ Annual and Interim Filings, for the issuer. |
| 5. | Design: Subject to the limitations, if any, described in paragraphs 5.2 and 5.3, the issuer’s other certifying officer(s) and I have, as at the end of the period covered by the interim filings |
| (a) | designed DC&P, or caused it to be designed under our supervision, to provide reasonable assurance that |
| (i) | material information relating to the issuer is made known to us by others, particularly during the period in which the interim filings are being prepared; and |
| (ii) | information required to be disclosed by the issuer in its annual filings, interim filings or other reports filed or submitted by it under securities legislation is recorded, processed, summarized and reported within the time periods specified in securities legislation; and |
| (b) | designed ICFR, or caused it to be designed under our supervision, to provide reasonable assurance regarding the reliability of financial reporting and the preparation of financial statements for external purposes in accordance with the issuer’s GAAP. |
| 5.1 | Control framework: The control framework the issuer’s other certifying officer(s) and I used to design the issuer’s ICFR is Internal Control – Integrated Framework (COSO Framework 2013) published by The Committee of Sponsoring Organizations of the Treadway Commission (COSO). |
| 5.2 | ICFR: Not applicable. |
| 5.3 | Limitation on scope of design: Not applicable. |
| 6. | Reporting changes in ICFR: The issuer has disclosed in its interim MD&A any change in the issuer’s ICFR that occurred during the period beginning on July 1, 2015 and ended on September 30, 2015 that has materially affected, or is reasonably likely to materially affect, the issuer’s ICFR. |
Date: November 5, 2015
| /s/ “David D. Cates” |
| Name: David D. Cates Title: President and Chief Executive Officer |
Exhibit 99.5
FORM 52-109F2
CERTIFICATION OF INTERIM FILINGS
I, Gabriel (Mac) McDonald, Vice President Finance and Chief Financial Officer of Denison Mines Corp., certify the following:
| 1. | Review: I have reviewed the interim financial report and interim MD&A (together, the “interim filings”) of Denison Mines Corp. (the “issuer”) for the interim period ended September 30, 2015. |
| 2. | No misrepresentations: Based on my knowledge, having exercised reasonable diligence, the interim filings do not contain any untrue statement of a material fact or omit to state a material fact required to be stated or that is necessary to make a statement not misleading in light of the circumstances under which it was made, with respect to the period covered by the interim filings. |
| 3. | Fair presentation: Based on my knowledge, having exercised reasonable diligence, the interim financial report together with the other financial information included in the interim filings fairly present in all material respects the financial condition, financial performance and cash flows of the issuer, as of the date of and for the periods presented in the interim filings. |
| 4. | Responsibility: The issuer’s other certifying officer(s) and I are responsible for establishing and maintaining disclosure controls and procedures (DC&P) and internal control over financial reporting (ICFR), as those terms are defined in National Instrument 52-109 Certification of Disclosure in Issuers’ Annual and Interim Filings, for the issuer. |
| 5. | Design: Subject to the limitations, if any, described in paragraphs 5.2 and 5.3, the issuer’s other certifying officer(s) and I have, as at the end of the period covered by the interim filings |
| (a) | designed DC&P, or caused it to be designed under our supervision, to provide reasonable assurance that |
| (i) | material information relating to the issuer is made known to us by others, particularly during the period in which the interim filings are being prepared; and |
| (ii) | information required to be disclosed by the issuer in its annual filings, interim filings or other reports filed or submitted by it under securities legislation is recorded, processed, summarized and reported within the time periods specified in securities legislation; and |
| (b) | designed ICFR, or caused it to be designed under our supervision, to provide reasonable assurance regarding the reliability of financial reporting and the preparation of financial statements for external purposes in accordance with the issuer’s GAAP. |
| 5.1 | Control framework: The control framework the issuer’s other certifying officer(s) and I used to design the issuer’s ICFR is Internal Control – Integrated Framework (COSO Framework 2013) published by The Committee of Sponsoring Organizations of the Treadway Commission (COSO). |
| 5.2 | ICFR: Not applicable. |
| 5.3 | Limitation on scope of design: Not applicable. |
| 6. | Reporting changes in ICFR: The issuer has disclosed in its interim MD&A any change in the issuer’s ICFR that occurred during the period beginning on July 1, 2015 and ended on September 30, 2015 that has materially affected, or is reasonably likely to materially affect, the issuer’s ICFR. |
Date: November 5, 2015
| /s/ “Gabriel (Mac) McDonald” |
| Name: Gabriel (Mac) McDonald Title: Vice President Finance and Chief Financial Officer |
Serious News for Serious Traders! Try StreetInsider.com Premium Free!
You May Also Be Interested In
- 2023 annual results of the Groupama Group
- Form 8.3 - Lok’n Store Group Plc
- Share repurchase programme
Create E-mail Alert Related Categories
SEC FilingsSign up for StreetInsider Free!
Receive full access to all new and archived articles, unlimited portfolio tracking, e-mail alerts, custom newswires and RSS feeds - and more!
