

Form 6-K CaesarStone Sdot-Yam For: Dec 09
 Tweet
Tweet Share
ShareSECURITIES AND EXCHANGE COMMISSION
Washington, D.C. 20549
______________________
FORM 6-K
REPORT OF FOREIGN PRIVATE ISSUER
Pursuant to Rule 13a-16 or 15d-16 of the
Securities Exchange Act of 1934
For the month of December 2015
Commission File Number: 001-35464
Caesarstone Sdot-Yam Ltd.
(Translation of registrant’s name into English)
Kibbutz Sdot Yam
MP Menashe
Israel 3780400
(Address of principal executive offices)
Indicate by check mark whether the registrant files or will file annual reports under cover Form 20-F or Form 40-F.
Form 20-F x Form 40-F o
Indicate by check mark if the registrant is submitting the Form 6-K in paper as permitted by Regulation S-T Rule 101(b)(1): __
Indicate by check mark if the registrant is submitting the Form 6-K in paper as permitted by Regulation S-T Rule 101(b)(7): __
EXPLANATORY NOTE
This Report on Form 6-K contains Caesarstone Sdot-Yam Ltd.’s updated investor presentation, a copy of which is attached hereto as Exhibit 99.1.
The information in this Form 6-K shall not be deemed “filed” for purposes of Section 18 of the Securities Exchange Act of 1934, as amended (the “Exchange Act”) or otherwise subject to the liabilities of that section, nor shall it be deemed incorporated by reference in any filing under the Securities Act of 1933, as amended, or the Exchange Act.
2
SIGNATURE
Pursuant to the requirements of the Securities Exchange Act of 1934, the registrant has duly caused this report to be signed on its behalf by the undersigned, thereunto duly authorized.
|
CAESARSTONE SDOT-YAM LTD.
|
|||
|
Date: December 9, 2015
|
By:
|
/s/ Michal Baumwald Oron
|
|
|
Name: Michal Baumwald Oron
|
|||
|
Title: VP Business Development & General Counsel
|
|||
3
EXHIBIT INDEX
|
Exhibit
|
Description
|
|
99.1
|
Investor Presentation.
|
4
Exhibit 99.1

1
1
Investors presentation
December, 2015

2
2
Disclaimer
Written and oral statements made in and in connection with the following presentation that reflect management’s views about
the Company’s future performance, financial position, business strategy and plans and objectives for future operations
constitute “forward-looking statements” under the Private Securities Litigation Reform Act of 1995.
the Company’s future performance, financial position, business strategy and plans and objectives for future operations
constitute “forward-looking statements” under the Private Securities Litigation Reform Act of 1995.
These statements, which contain words such as "believe,” “expect,” “anticipate,” “intend,” “estimate,” “forecast,” “project,”
“will,” “may,” “should”, “plan”, “seek” and similar expressions or references to future periods, reflect the beliefs and
expectations of the Company and are subject to risks and uncertainties, including those described under “Risk factors” in the
Company’s annual report on Form 20-F for the year ended December 31, 2014 and other documents filed with the U.S.
Securities and Exchange Commission, that may cause actual results to differ materially from the results discussed in our
forward-looking statements. This presentation should be read in conjunction with our annual report on Form 20-F for the
year ended December 31, 2014 and our other documents filed with the SEC. These risks and uncertainties include, among
other factors, the strength of the home renovation and construction sectors; economic conditions within any of our key
existing markets; actions by our competitors; changes in raw material prices; unpredictability of seasonal fluctuations in
revenues; the outcome of silicosis claims; the outcome of the claim by our former quartz processor; fluctuations in currency
exchange rates; delays in manufacturing if our suppliers are unable to supply raw materials; and other factors discussed
under the heading “Risk Factors” in the annual report on Form 20-F and other documents filed with the U.S. Securities and
Exchange Commission. These and other factors could adversely affect the outcome and financial effects of the plans and
events described herein.
These forward-looking statements are made only as of the date hereof, and neither the Company nor any of its respective
agents, employees or advisors intend, undertake or have any duty or obligation to supplement, amend, update or revise any
of the forward-looking statements contained in this presentation, whether as a result of new information, future events or
otherwise.
agents, employees or advisors intend, undertake or have any duty or obligation to supplement, amend, update or revise any
of the forward-looking statements contained in this presentation, whether as a result of new information, future events or
otherwise.
This presentation includes certain non-GAAP measures, which should all be considered in addition to, and not as a substitute
for, comparable GAAP measures. A reconciliation of GAAP net income to adjusted net income is provided below. The
Company provides these non-GAAP financial measures because it believes that they present a better measure of the
Company’s core business and management uses the non-GAAP measures internally to evaluate the Company’s ongoing
performance. Accordingly, the Company believes that they are useful to investors in enhancing an understanding of the
Company’s operating performance. However, these measures should not be considered as substitutes for GAAP measures
and may be inconsistent with similar measures presented by other companies.
3
Company Overview
• 27 years of leadership
• Strong premium brand
• 12% global market share (by volume)
• Distribution network across over 50
countries
countries
• Diversified revenue with approximately
55% of revenue from North America
55% of revenue from North America
Quartz Market Opportunity1
• 2014 market penetration: 10% by sales
• Fastest growing surfaces category (’99 -
’14)
’14)
• Grew at 15.7% CAGR
• From 2% penetration in 1999
• Capturing high % market share in key
markets
markets
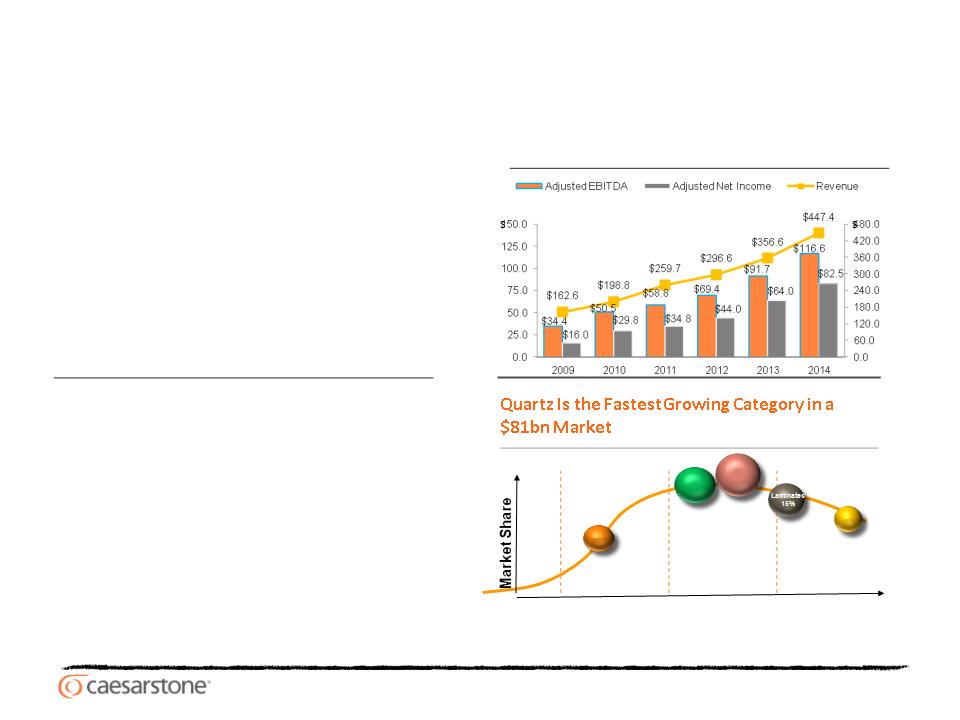
Global Leader in the Attractive Quartz Surface Market
Source: Freedonia February 2015
Quartz is the
fastest
growing
category
fastest
growing
category
Quartz
10%
10%
Growth
Development
Maturity
Dwindling
Solid
Surface
25%
25%
Granite
27%
27%
Marble
2%
Strong Performance Through the Cycle
($mm)
($mm)

4
4
Key Investment Highlights
• Premium brand with superior customer value proposition
• Global market leader in high growth quartz surfaces market
• Strong, diversified global distribution platform
• World-class marketing, R&D and manufacturing capabilities
• Proven track record of growth and product innovation
• Experienced management team
• Attractive financial profile

5
5
Caesarstone’s Superior Value Proposition
• Premium product with unique
combination of high quality & long
lasting beauty
combination of high quality & long
lasting beauty
• Trend-setting innovation with top
design
design
• High service level with
comprehensive sales and marketing
approach
comprehensive sales and marketing
approach
-
Quartz received the highest overall
score among countertop materials
- Consumer Reports Magazine, July 2013
score among countertop materials
- Consumer Reports Magazine, July 2013

6
6
A Globally Recognized Premium Brand
Basic colors
Concetto
Supernatural
• Patterned textures
• Patented
• Customizable
• Hand-incorporated semi-
precious stones
precious stones
Supernatural Ultra
• The beauty of luxurious marble with
Caesarstone quality
Caesarstone quality
• Proprietary technology
• Inspired by nature
• Marble and granite designs
• Over 70 colors
• Represent the majority of sales
7
7
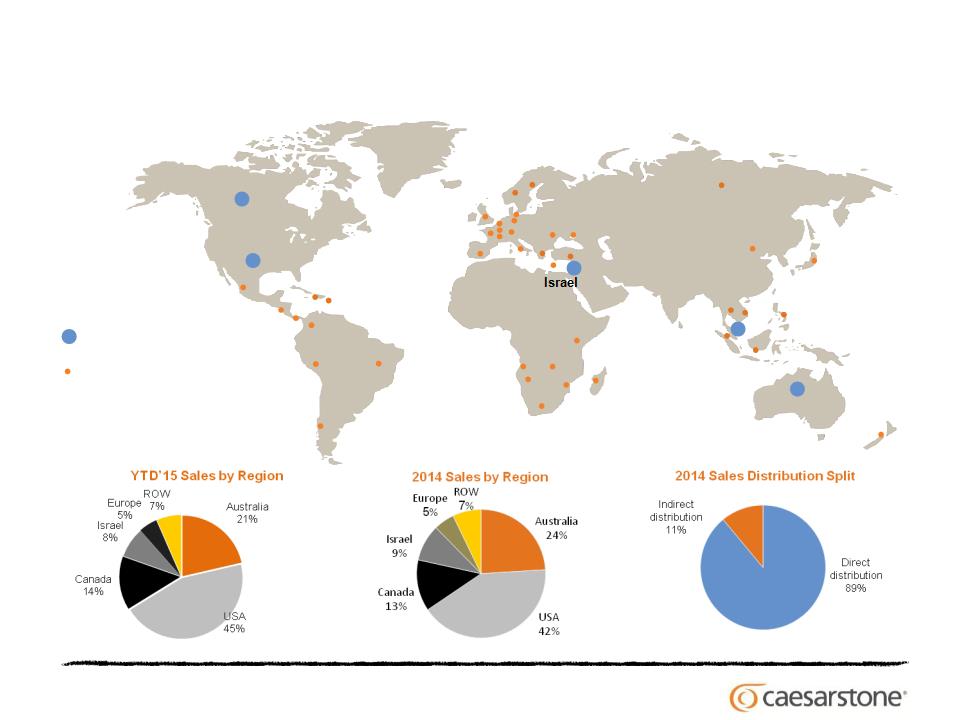
Leading Global Footprint with Diverse Revenue Mix
Singapore
Canada
USA
Australia
Direct distribution
Indirect distribution

8
8
Positioned to Capture Growth from Quartz Penetration
$81B Global Countertop Market Material
Segmentation (2014 sales)
Segmentation (2014 sales)
2014 Quartz Share of Countertop Market
by Region (by volume)
Source: Freedonia February 2015; company estimates
Note: Quartz share based on value

9
9
The U.S. Remains a Significant Opportunity
Caesarstone continues to execute on its go-to-market strategy in the U.S. driven by
increasing quartz penetration
increasing quartz penetration
Source: Freedonia February 2015; Company estimates
1 Calculation applies 1% increase in quartz penetration (by volume) based on 2014 total market volume and 2014 quartz prices as provided by Freedonia February 2015 report
2 HousingEconomics.com - Feb’15
3 Home Improvement Research Institute, March 2015
1,001k
2014
2016E
1,400k
U.S. New Housing Starts2
U.S. Home Improvement Product Sales3
Caesarstone U.S. Revenue Performance ($mm)
U.S. Market Penetration (by volume)
1% increase in
penetration ≈ $350mm1
penetration ≈ $350mm1
21%
9%
42%
50%
YoY organic growth
23%

11
11
THE MOST
IMPORTANT TOOL
IN THE KITCHEN IS
NOT A TOOL AT ALL
IMPORTANT TOOL
IN THE KITCHEN IS
NOT A TOOL AT ALL

12
12
Quartz Market Opportunity2
• Fastest growing surfaces category
(’99 - ’14)
(’99 - ’14)
• Grew at 15.7% CAGR
• From 2% penetration in 1999
Significant Growth Potential
$8bn Quartz Market
(10% penetration)2
(10% penetration)2
Premium
Value For
Money
Money
Price
$81bn¹
Total Market
Premium
Value For
Money
Money
Price
> $81bn
Total Potential Addressable
Market
Market
• Caesarstone is leading the
material conversion with 12%
global market share in 2014 (by
volume)
material conversion with 12%
global market share in 2014 (by
volume)
¹ Freedonia February 2015; Sales to end-consumers in 2014 based on average installed price, which includes installation and other related costs; the Company estimates that 30-
40% of the total sales represents sales by manufacturers
40% of the total sales represents sales by manufacturers
2 2014 by sales

13
13
A Comprehensive Marketing Approach
Distributor
Fabricator
Kitchen/
Bathroom
Store
Bathroom
Store
Contractor/
Commercial
Commercial
End User
Push
Fabricator
§ Technical support
§ Seminars
§ Warranty
§ Loyalty Club
In-Store
§ Display slabs
§ Brochures
§ Sample books
§ Display stands
Architects & Designers
§ Exhibitions & special events
§ Sales promotions
§ Seminars
§ Social media
§ Sample books
End User
§TV, Magazines,
Billboards, PR
Billboards, PR
§Exhibitions
§Online: Website,
Media, Social media,
Google promos,
SEM/SEO
Media, Social media,
Google promos,
SEM/SEO
Architects &
Designers
Pull

14
14
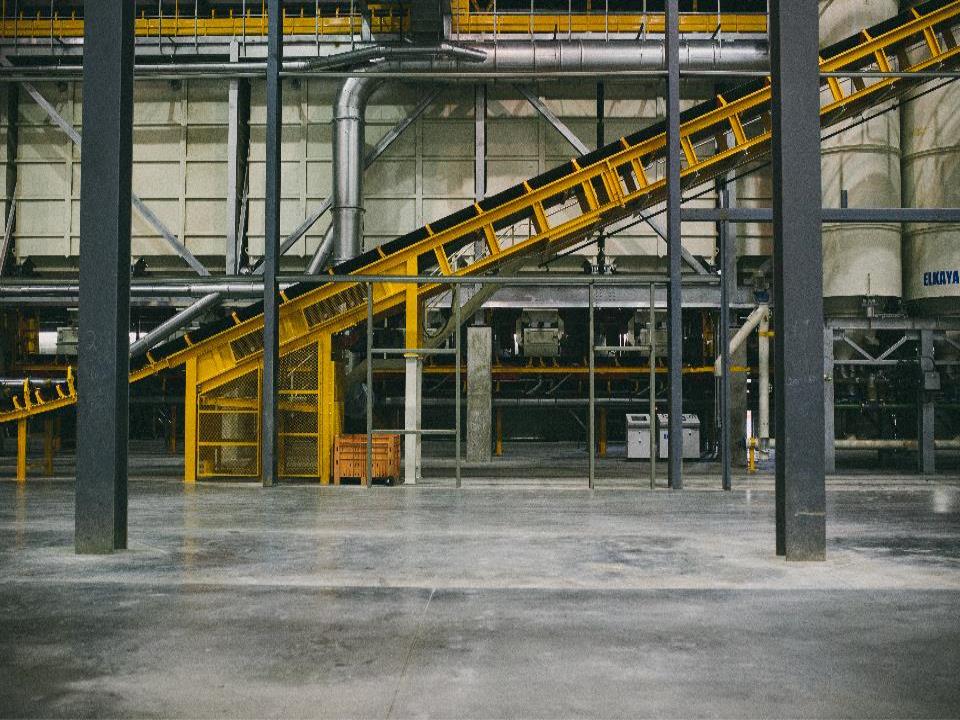
• Unique advanced technological capabilities
• Continued investment in differentiated products
• Product superiority with zero defect policy
World Class Manufacturing and R&D Capabilities
Current Facilities
• High standards (ISO, Leed, NSF SCS, Greenguard)
• High throughput and lean approach
• Binder chemistry and formulation optimization
Future Expansion
• Recent agreement for the acquisition of additional land in Richmod Hill, Georgia,
adjacent to the Company’s U.S. plant, to accommodate additional manufacturing
capacity in the future as needed to satisfy potential demand
adjacent to the Company’s U.S. plant, to accommodate additional manufacturing
capacity in the future as needed to satisfy potential demand

15
15

16

18
18
Differentiated Products Backed by R&D and IP
Our successful collection backed by proprietary technology drives ASP and margins
Calacatta Nuvo
• Luxurious natural marble look
• Launched in 2014
Supernatural - Marble
• Inspired by marble
• Successful 2012 rollout
Shitake
• Sophisticated blend of browns & grays
• Launched in 2011
Supernatural - Granite
• Inspired by granite
• Successful 2013 rollout
Note: Represents select products out of the Caesarstone collection
19
19
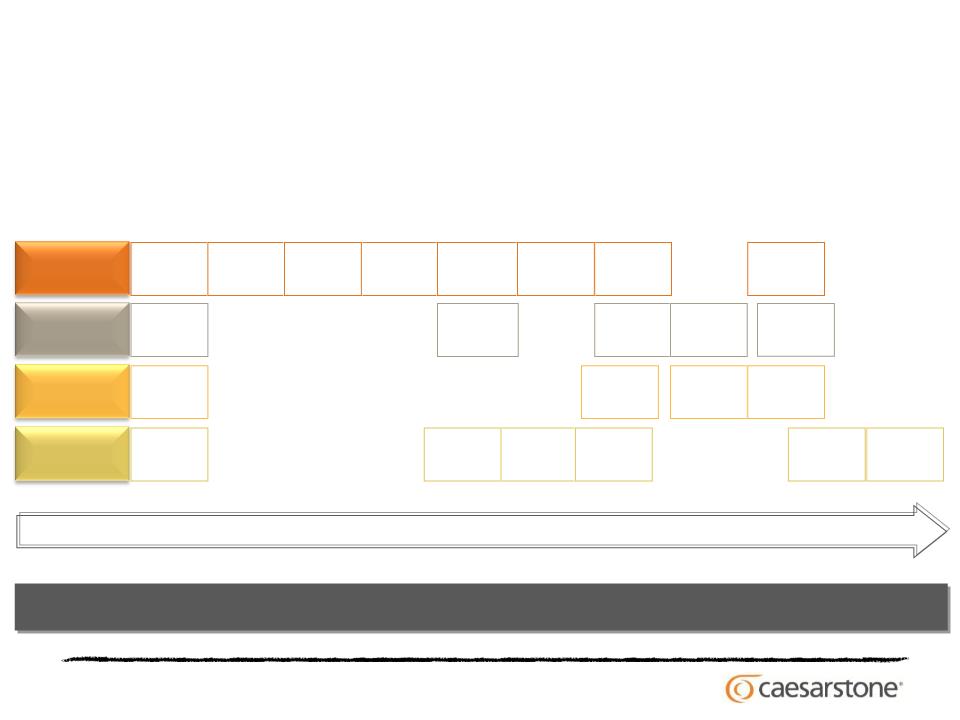
Proven Track Record of Growth and Innovation
• Proven ability to enter and develop key markets
• Continued introduction of innovative new products
1987
1999
2006
2009
2010
1987
Israel
Israel
2009
South
South
East Asia
Market Entry
New
Products
Products
2003
Concetto
Concetto
1998
1987
Classico
Classico
2009
Motivo
Motivo
2010
Supremo
Supremo
1999
U.S.
U.S.
2003
Canada &
South Africa
Canada &
South Africa
2003
1988
Europe
Europe
1998
Australia
Australia
2006
China
China
2008
Australia
Australia
2010
Canada
Canada
2011
U.S. &
Singapore
U.S. &
Singapore
Direct
Distribution
Distribution
1987
Israel
Israel
Manufacturing
1987
1st plant
1st plant
2005
2nd plant
2nd plant
(3rd line)
2007
4th line
4th line
2002
2nd line
2015
History of execution with a clear strategy to capture future growth
2012
Super
Natural
Super
Natural
2012
U.S. plant
6th, 7th lines
2011
Brazil
Brazil
Q3 2014
5th line
5th line

20
20
Strong Growth and Profitability
Revenue ($mm)
Adj. EBITDA and % Margin ($mm)
Adj. Net Income and % Margin 1 ($mm)
Gross Profit and % Margin ($mm)
YoY
Growth:
30.6%
22.2%
20.2%
14.2%
33.2%
45.6%
27.3%
22.2%
YoY
Growth:
YoY
Growth:
16.4%
46.8%
32.1%
18.2%
16.8%
85.9%
45.3%
26.6%
YoY
Growth:
¹ Adjusted net income attributable to controlling interest
25.5%
17.0%
27.1%
29.0%

21
21
Quarterly Financial Performance
• Industry characterized by seasonality with strong Q3 and
weaker Q1 annually
weaker Q1 annually
• Consistent year-over-year revenue growth across quarters
• Robust Adjusted EBITDA growth year-over-year despite
volatility in raw material costs, exchange rates fluctuations
and U.S. manufacturing unabsorbed/start-up costs
volatility in raw material costs, exchange rates fluctuations
and U.S. manufacturing unabsorbed/start-up costs
Revenue ($mm)
Adj. EBITDA ($mm)
13.6%
27.0%
17.4%
4.6%
21.6%
30.7%
11.0%
14.2%
17.9%
30.4%
9.9%
13.9%
36.9%
23.3%
10.4%
YoY Growth
’11-’12 28.5%
‘12-’13 13.5%
‘13-’14 23.5%
‘14-’15 14.2%
18.2%
18.4%
42.4%
0.8%
22.4%
47.1%
16.1%
YoY Growth
’11-’12 18.9%
‘12-’13 28.9%
‘13-’14 25.4%
‘14-’15 15.3%

22
22
Cash Flow Supports Future Growth
• Strong cash flow generation and growth enabling
$20mm dividend distribution in 2013 and 2014
$20mm dividend distribution in 2013 and 2014
• Ability to invest in future growth opportunities, both
organic and via potential acquisitions
organic and via potential acquisitions
Strong and robust free cash flow generation will support investment in future growth
Capital Expenditure ($mm)
Adj. EBITDA Less Capital Expenditure ($mm)
% of
revenue:
revenue:
3.4%
2.8%
19.3%
4.5%
19.3%
22.6%
6.7%
18.9%
% of
revenue:
revenue:
7.7%
18.0%

23
23
YTD’15 Highlights

24
24
Financial Highlights
• Revenue growth of 11.5% YoY, 22.3% on a constant currency basis -
§ U.S. up 22.7% despite slower housing growth, reflecting continued Quartz conversion;
§ Australia up 21.3% on a constant currency basis, driven by our new product successes (new
Calacatta and Statuario) and strong growth in new housing completions
Calacatta and Statuario) and strong growth in new housing completions
§ Canada up 38.2% on a constant currency basis driven by continued strong performance in
general and the positive impact of IKEA Canada
general and the positive impact of IKEA Canada
§ Israel up 3.9% on a constant currency basis
§ Europe up 23.0% and ROW up 20.6% both on a constant currency basis
• Gross margin @40.8%, down 140 basis points
§ Unfavorable exchange rates and start-up costs related to the new US manufacturing facility are
partially offset by positive differentiated product mix and raw material costs (most notably
Polyester but also Quartz)
partially offset by positive differentiated product mix and raw material costs (most notably
Polyester but also Quartz)
• Adjusted EBITDA grew 7.7% to $95.2M
§ Margin of 25.6% vs. 26.5% in 2014, reflecting FX impact and start up cost of U.S. manufacturing
• Adjusted Net Income of $64.0M; 4.1% above last year
§ Margin of 17.2% vs. 18.4% last year
§ Diluted EPS of $1.80 vs. $1.74

25
25
Additional Information

26
26
Additional Information - cnt’d

27
27
Additional Information - cnt’d
• Legal Proceedings*
§ Silicosis claims - Q3’15 included a non-cash expense of $4.7M related to
silicosis claims (other than the claim filed seeking class action status), reflecting
an estimate of the Company’s total uninsured exposure (recorded under
Operating Expenses and adjusted out in non-GAAP measures below). The
recording of this expense was triggered by certain developments in Q3 and
thereafter, including two settlements and an agreement with the State of Israel
related to the silicosis claims.
§ Microgil Agricultural Cooperative Society Ltd. Claim and counterclaim - The
dispute continues to be subject to arbitration. The Company intends to continue
to defend vigorously its position that Microgil’s claim is without merit.
dispute continues to be subject to arbitration. The Company intends to continue
to defend vigorously its position that Microgil’s claim is without merit.
§ Securities class action claim - The company and managers are subject to a
putative securities class action claim in the U.S. District Court for the Southern
District of New York related to losses allegedly suffered as a result of the decline
in the Company's share price following the publication of the Spruce Point report
on August 19, 2015. The plaintiffs allege, based on statements in the Spruce
Point report, that there were material misstatement or omissions in the
Company's securities filings. The Company believes the claim is without merit
and intends to contest it vigorously.
•
*For additional information related to legal proceedings - see the Company’s annual report on Form 20-F
28
28
Caesarstone’s Growth Prospects
• Strengthen the brand through investment in strong R&D and continue developing
innovative new colors, designs, and textures
innovative new colors, designs, and textures
• Increase awareness of our premium brand by continuing to focus on quality,
service and implementation of our proven marketing approach
service and implementation of our proven marketing approach
Premium
Brand
• Execute on the U.S. and Canadian opportunity, as well as grow our footprint in
other markets
other markets
• Continue to expand direct distribution coverage in the U.S.
Market
Penetration
Penetration
• Extend our global presence through entry into new geographies and increase our
reach in recently entered markets
reach in recently entered markets
• Find new markets that meet our criteria of having existing demand for stone
products, strong economic growth rates, and high GDP per capita
products, strong economic growth rates, and high GDP per capita
Global
Footprint
Footprint
Selective
Acquisitions
Acquisitions
• Pursue selective acquisitions of manufacturers in order to build scale, enhance
our marketing/distribution, accelerate global expansion
our marketing/distribution, accelerate global expansion

29
29
Thank You.
30
30
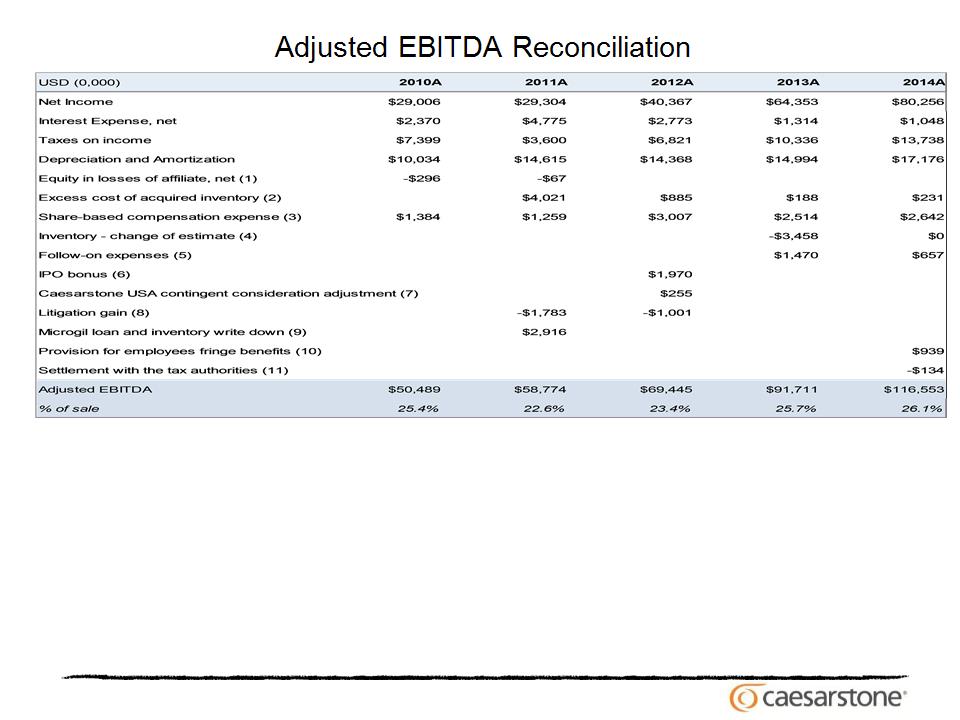
(1) Consists of our portion of the results of operations of Caesarstone USA prior to its acquisition by us in May 2011.
(2) Consists of charges to cost of goods sold for the difference between the higher carrying cost of the inventory of two of the Company's subsidiaries- Caesarstone USA's inventory at the time of its acquisition and
inventory that was purchased from its distributor and Caesarstone Australia Pty Limited's inventory that was purchased from its distributor, and the standard cost of the Company's inventory-which adversely
impacts the Company's gross margins until such inventory is sold. The majority of the inventory acquired from Caesarstone USA was sold in 2011, and the majority of the inventory acquired from the Australian
distributor was sold in 2012.
(3) In 2013, share-based compensation consists of expenses related to the stock options granted to employees of the Company. In 2014, share-based compensation consists primarily of expenses related to the
stock options granted to employees of the Company, as well as expenses related to share-based rights granted during the period.
stock options granted to employees of the Company, as well as expenses related to share-based rights granted during the period.
(4) Relates to a change in estimate for the value of inventory following the implementation of the Company's new ERP system in April 2013.
(5) In 2013, consists of direct expenses related to a follow-on offering that closed in April 2013, including a bonus paid by the Company' former shareholder, Tene, to certain of its employees that under US GAAP
the Company is required to expense against paid-in capital. In 2014, consists of direct expenses related to a follow-on offering that closed in June 2014.
the Company is required to expense against paid-in capital. In 2014, consists of direct expenses related to a follow-on offering that closed in June 2014.
(6) Consists of the payment of $1.72 million to certain employees of the Company and $0.25 million to the Company's Chairman for their contribution to the completion of the Company's initial public offering, or
IPO.
IPO.
(7) Relates to the change in fair value of the contingent consideration that was part of the consideration transferred in connection with the acquisition of Caesarstone USA.
(8) In 2011, litigation gain consists of a mediation award in the Company's favor pursuant to two trademark infringement cases brought by Caesarstone Australia Pty Limited. In 2012, litigation gain resulted from a
settlement agreement with the former chief excecutive officer of Caesarstone Australia Pty Limited related to litigation that had been commenced in 2010. Pursuant to the settlement, he transferred to the
Company the ownership of all his shares in Caesarstone Australia Pty Limited received in connection with his employment. The Company did not make any payments in connection with such transfer or other
payments to the former chief executive officer. As a result of the settlement, the Company reversed the liability provision in connection with the litigation and the adjustment is presented net of the related
litigation expenses incurred in connection with the settlement.
(9) Relates to our writing down to zero the cost of inventory provided to Microgil, our former third-party quartz processor in Israel, in 2011 in the amount of $1.8 million and our writing down to zero our $1.1 million
loan to Microgil, in each case, in connection with a dispute.
loan to Microgil, in each case, in connection with a dispute.
(10) Relates to an adjustment of provision for taxable employee fringe benefits as a result of a settlement with the Israel Tax Authority and with the National Insurance Intitute of Israel.
(11) Relates to a refund of Israeli value added tax (VAT) associated with a bad debt from 2007
31
31
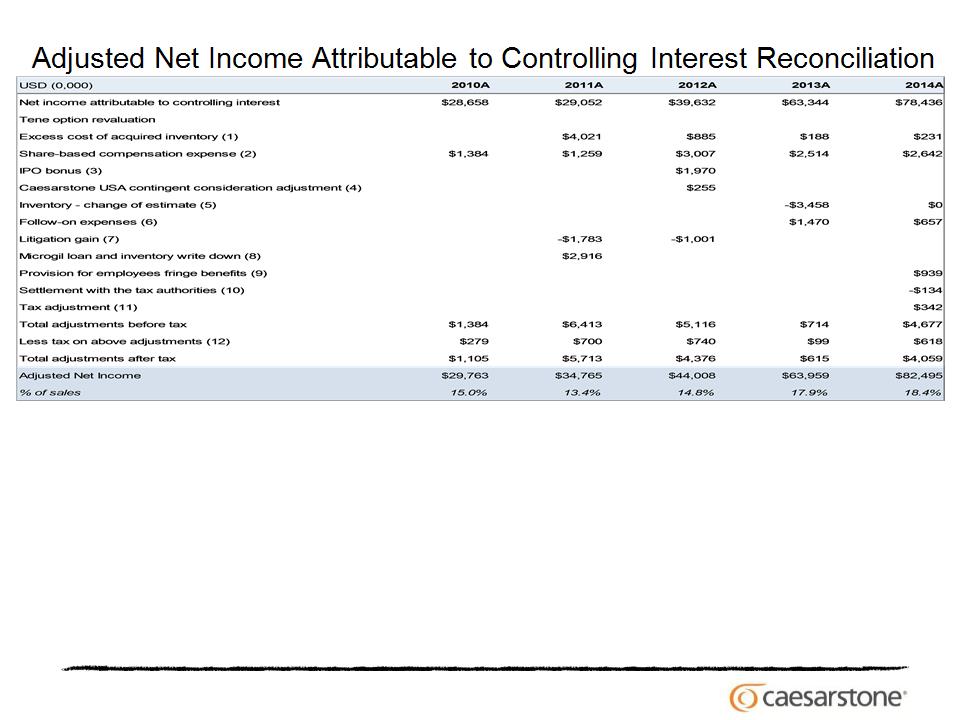
(1) Consists of charges to cost of goods sold for the difference between the higher carrying cost of the inventory of two of the Company's subsidiaries- Caesarstone USA's inventory at the time of its acquisition and
inventory that was purchased from its distributor and Caesarstone Australia Pty Limited's inventory that was purchased from its distributor, and the standard cost of the Company's inventory-which adversely
impacts the Company's gross margins until such inventory is sold. The majority of the inventory acquired from Caesarstone USA was sold in 2011, and the majority of the inventory acquired from the Australian
distributor was sold in 2012.
(2) In 2013, share-based compensation consists of expenses related to the stock options granted to employees of the Company. In 2014, share-based compensation consists primarily of expenses related to the stock
options granted to employees of the Company, as well as expenses related to share-based rights granted during the period.
options granted to employees of the Company, as well as expenses related to share-based rights granted during the period.
(3) Consists of the payment of $1.72 million to certain employees of the Company and $0.25 million to the Company's Chairman for their contribution to the completion of the Company's IPO.
(4) Relates to the change in fair value of the contingent consideration that was part of the consideration transferred in connection with the acquisition of Caesarstone USA.
(5) Relates to a change in estimate for the value of inventory following the implementation of the Company's new ERP system in April 2013.
(6) In 2013, consists of direct expenses related to a follow on-offering that closed in April 2013, including a bonus paid by the Company' former shareholder, Tene, to certain of its employees that under US GAAP the
Company is required to expense against paid-in capital. In 2014, consists of direct expenses related to a follow on offering that closed in June 2014.
Company is required to expense against paid-in capital. In 2014, consists of direct expenses related to a follow on offering that closed in June 2014.
(7) In 2011, litigation gain consists of a mediation award in the Company's favor pursuant to two trademark infringement cases brought by Caesarstone Australia Pty Limited. In 2012, litigation gain resulted from a
settlement agreement with the former chief excecutive officer of Caesarstone Australia Pty Limited related to litigation that had been commenced in 2010. Pursuant to the settlement, he transferred to the Company
the ownership of all his shares in Caesarstone Australia Pty Limited received in connection with his employment. The Company did not make any payments in connection with such transfer or other payments to the
former chief executive officer. As a result of the settlement, the Company reversed the liability provision in connection with the litigation and the adjustment is presented net of the related litigation expenses incurred
in connection with the settlement.
(8) Relates to our writing down to zero the cost of inventory provided to Microgil, our former third-party quartz processor in Israel, in 2011 in the amount of $1.8 million and our writing down to zero our $1.1 million loan
to Microgil, in each case, in connection with a dispute.
to Microgil, in each case, in connection with a dispute.
(9) Relates to an adjustment of provision for taxable employee fringe benefits as a result of a settlement with the Israel Tax Authority and with the National Insurance Intitute of Israel.
(10) Relates to a refund of Israeli value added tax (VAT) associated with a bad debt from 2007
(11) Tax adjustment as a result of tax settlement with the Israeli tax authorities.
(12) The tax adjustments for the three and Twelve months ended December 31, 2014 and 2013 were based on the effective tax rate (excluding adjustments to the tax line item) for these periods, respectively.
Serious News for Serious Traders! Try StreetInsider.com Premium Free!
You May Also Be Interested In
- CARFAX Canada Launches Exciting New Partnership with Copart Canada
- Rising Malaria Threat: International SOS Shares Advice on How to Keep Your Workforce Healthy
- iQor Wins 2024 Bronze Stevie® Award for Sales & Customer Service
Create E-mail Alert Related Categories
SEC FilingsSign up for StreetInsider Free!
Receive full access to all new and archived articles, unlimited portfolio tracking, e-mail alerts, custom newswires and RSS feeds - and more!
