

Form 6-K CREDIT SUISSE GROUP AG For: Dec 08 Filed by: CREDIT SUISSE AG
 Tweet
Tweet Share
Share
UNITED STATES
SECURITIES AND EXCHANGE COMMISSION
SECURITIES AND EXCHANGE COMMISSION
Washington, D.C. 20549
Form 6-K
REPORT OF FOREIGN PRIVATE ISSUER PURSUANT TO RULE 13a-16 OR 15d-16
UNDER THE SECURITIES EXCHANGE ACT OF 1934
UNDER THE SECURITIES EXCHANGE ACT OF 1934
December 8, 2016
Commission File Number 001-15244
CREDIT SUISSE GROUP AG
(Translation of registrant’s name into English)
Paradeplatz 8, CH 8001 Zurich, Switzerland
(Address of principal executive office)
(Address of principal executive office)
Commission File Number 001-33434
CREDIT SUISSE AG
(Translation of registrant’s name into English)
Paradeplatz 8, CH 8001 Zurich, Switzerland
(Address of principal executive office)
(Address of principal executive office)
Indicate by check mark whether the registrant files or will file annual reports under cover of Form 20-F or
Form 40-F.
Form 40-F.
Form 20-F  Form 40-F
Form 40-F
Indicate by check mark if the registrant is submitting the Form 6-K in paper as permitted by Regulation S-T Rule 101(b)(1):
Note: Regulation S-T Rule 101(b)(1) only permits the submission in paper of a Form 6-K if submitted solely to provide an attached annual report to security holders.
Indicate by check mark if the registrant is submitting the Form 6-K in paper as permitted by Regulation S-T Rule 101(b)(7):
Note: Regulation S-T Rule 101(b)(7) only permits the submission in paper of a Form 6-K if submitted to furnish a report or other document that the registrant foreign private issuer must furnish and make public under the laws of the jurisdiction in which the registrant is incorporated, domiciled or legally organized (the registrant’s “home country”), or under the rules of the home country exchange on which the registrant’s securities are traded, as long as the report or other document is not a press release, is not required to be and has not been distributed to the registrant’s security holders, and, if discussing a material event, has already been the subject of a Form 6-K submission or other Commission filing on EDGAR.
This report includes the slides for the presentation to the debt investor community on December 8, 2016.
Credit Suisse Debt Investor PresentationDavid Mathers, Chief Financial Officer December 8, 2016

Disclaimer (1/2) The data presented in this presentation relating to the Swiss Universal Bank refers to the division of Credit Suisse Group as the same is currently managed within Credit Suisse Group. The scope, revenues and expenses of the Swiss Universal Bank vary from the planned scope of Credit Suisse (Schweiz) AG and its subsidiaries, planned to be subject to a partial IPO, market conditions permitting. Any such IPO would involve the sale of a minority stake and would be subject to, among other things, all necessary approvals.It is therefore not possible to make a like-for-like comparison of the Swiss Universal Bank as a division of Credit Suisse Group on the one hand and Credit Suisse (Schweiz) AG as a potential IPO vehicle on the other hand.Cautionary statement regarding forward-looking statements This presentation contains forward-looking statements that involve inherent risks and uncertainties, and we might not be able to achieve the predictions, forecasts, projections and other outcomes we describe or imply in forward-looking statements. A number of important factors could cause results to differ materially from the plans, objectives, expectations, estimates and intentions we express in these forward-looking statements, including those we identify in "Risk Factors” in our Annual Report on Form 20-F for the fiscal year ended December 31, 2015 and in “Cautionary statement regarding forward-looking information" in our media release relating to Investor Day, published on December 7, 2016 and filed with the US Securities and Exchange Commission, and in other public filings and press releases. We do not intend to update these forward-looking statements except as may be required by applicable law. In particular, the terms “Illustrative”, “Ambition”, “Outlook” and “Goal” are not intended to be viewed as targets or projections, nor are they considered to be Key Performance Indicators. All such illustrations, ambitions and goals are subject to a large number of inherent risks, assumptions and uncertainties, many of which are completely outside of our control. Accordingly, this information should not be relied on for any purpose. We do not intend to update these illustrations, ambitions or goals.We may not achieve the benefits of our strategic initiativesWe may not achieve all of the expected benefits of our strategic initiatives. Factors beyond our control, including but not limited to the market and economic conditions, changes in laws, rules or regulations and other challenges discussed in our public filings, could limit our ability to achieve some or all of the expected benefits of these initiatives. Estimates and assumptionsIn preparing this presentation, management has made estimates and assumptions that affect the numbers presented. Actual results may differ. Figures throughout presentation may also be subject to rounding adjustments. Cautionary Statements Relating to Interim Financial InformationThis presentation contains certain unaudited interim financial information as of or for periods after September 30, 2016, the date of our last published quarterly financial statements. This information has been derived from management accounts, is preliminary in nature, does not reflect the complete results of the fourth quarter of 2016 and is subject to change, including as a result of any normal quarterly adjustments in relation to the financial statements for the fourth quarter of 2016. This information has not been subject to any review by our independent registered public accounting firm. There can be no assurance that the final results for these periods will not differ from these preliminary results, and any such differences could be material. Quarterly financial results for the fourth quarter of 2016 will be included in our 4Q16 Earnings Release, and audited consolidated financial statements for full-year 2016 will be included in our Annual Report on Form 20-F for the year ended December 31, 2016, when they are published. These interim results of operations are not necessarily indicative of the results to be achieved for the remainder of the fourth quarter or the full year 2016.

Disclaimer (2/2) Statement regarding non-GAAP financial measures This presentation also contains non-GAAP financial measures, including adjusted results. Information needed to reconcile such non-GAAP financial measures to the most directly comparable measures under US GAAP or a reference thereto can be found in this presentation in the Appendix, which is available on our website at credit-suisse.com.Statement regarding capital, liquidity and leverage As of January 1, 2013, Basel 3 was implemented in Switzerland along with the Swiss “Too Big to Fail” legislation and regulations thereunder (in each case, subject to certain phase-in periods). As of January 1, 2015, the Bank for International Settlements (BIS) leverage ratio framework, as issued by the Basel Committee on Banking Supervision (BCBS), was implemented in Switzerland by FINMA. Our related disclosures are in accordance with our interpretation of such requirements, including relevant assumptions. Changes in the interpretation of these requirements in Switzerland or in any of our assumptions or estimates could result in different numbers from those shown in this presentation. Capital and ratio numbers for periods prior to 2013 are based on estimates, which are calculated as if the Basel 3 framework had been in place in Switzerland during such periods. Unless otherwise noted, leverage exposure is based on the BIS leverage ratio framework and consists of period-end balance sheet assets and prescribed regulatory adjustments. Leverage amounts for 4Q14, which are presented in order to show meaningful comparative information, are based on estimates which are calculated as if the BIS leverage ratio framework had been implemented in Switzerland at such time. Beginning in 2015, the Swiss leverage ratio is calculated as Swiss total capital, divided by period-end leverage exposure. The look-through BIS tier 1 leverage ratio and CET1 leverage ratio are calculated as look-through BIS tier 1 capital and CET1 capital, respectively, divided by end-period leverage exposure. Selling restrictions This document, and the information contained herein, is not an offer to sell or a solicitation of offers to purchase or subscribe for securities of Credit Suisse Group AG or Credit Suisse (Schweiz) AG in Switzerland, the United States or any other jurisdiction. This document is not a prospectus within the meaning of article 652a of the Swiss Code of Obligations, nor is it a listing prospectus as defined in the listing rules of the SIX Swiss Exchange AG or any other exchange or regulated trading facility in Switzerland or a prospectus or offering document under any other applicable laws. Copies of this document may not be sent to jurisdictions, or distributed in or sent from jurisdictions, in which such documents are barred or prohibited by law. A decision to invest in securities of Credit Suisse Group AG or Credit Suisse (Schweiz) AG should be based exclusively on a written agreement with Credit Suisse Group AG or an offering and listing prospectus to be published by Credit Suisse Group AG or Credit Suisse (Schweiz) AG for such purpose. Any offer and sale of securities of Credit Suisse (Schweiz) AG will not be registered under the U.S. Securities Act of 1933, as amended, and may not be offered in the United States of America absent such registration or an exemption from registration. There will be no public offering of such securities in the United States of America.

Delivering against our key objectives Costs CHF 19.6 bn 2016E adjusted operating expensesat constant FX rates* 2016E net savings CHF 1.6 bn CHF 2.9 bn 9M16 Core pre-tax income adjusted Profitability CHF 2.4 bn 9M16 SRU pre-tax loss adjusted Note: Adjusted results are non-GAAP financial measures. A reconciliation to reported results is included in the Appendix* See Appendix1 Relating to Wealth Management in SUB, IWM and APAC 3Q16 CET1 look-through ratio 12.0%+180 bps vs. 3Q15 Capital 3.4% 3Q16 CET1 look-through leverage ratio Assets 9M16 net new assets1 CHF 30.9 bn10% emerging market growth rate3% mature market growth rate

Agenda Progress in capital reallocation and growth 1 Update on cost initiatives 2 Divisional execution towards targets and strategy 3 Funding plan and strategy 4 Regulatory update 5

Capital Cost initiatives Divisional financials Funding plan Regulatory update CET1 ratio increased to 12.0%; RWA reallocated to growth businesses 285 270 10.2% 12.0% 1 Business impact includes business moves and internally driven methodology and policy impact and is expressed as net of FX and major external methodology changes SRU GM IBCM IWM SUB APAC (8) (20) +3 +3 +4 +6 (28) +16 3Q15 3Q16 3Q15 3Q16 3Q16 vs. 3Q15 Basel III RWA business impact1 in CHF bn Basel III RWA in CHF bn CET1 ratio in % Sources Increases

Continued reduction of leverage exposure while re-allocating to growth businesses; Tier 1 leverage ratio up 70 bps YoY 3Q15 3Q16 1,045 949 3.9% 4.6% 1 Business impact excludes impact from FX Sources SRU Corp. Ctr. / HQLA IBCM APAC SUB (24) (76) +9 +14 GM (11) +10 +33 (116) Increases IWM (5) 1.1% 2.8% 1.2% 3.4% 3Q15 3Q16 3Q16 vs. 3Q15 Leverage exposure business impact1 in CHF bn Leverage exposure in CHF bn Leverage ratio in % Tier 1 CET1 Capital Cost initiatives Divisional financials Funding plan Regulatory update

Capital Cost initiatives Divisional financials Funding plan Regulatory update 3Q16 Operating Free Capital Generated Cash component of dividends 2018 CET1 ratio1,2in % Capital released from SRU RWA reduction4 CET1 Leverage ratio >3.5% Illustrative CET1 capital generation and impact on capital ratios Tier1 Leverage ratio ~5.0% 3.4% 4.6% CET1 benefit from Credit Suisse (Schweiz) IPO3 11-12% until end 2016 1 Pre significant litigation 2 Pre reforms to Basel III 3 Any such IPO would involve the sale of a minority stake and would be subject to, among other things, all necessary approvals and would be intended to generate / raise additional capital for Credit Suisse AG or Credit Suisse (Schweiz) AG 4 Includes business growth and methodology impacts (excluding Basel III reform) 12-13% over 2017 and 2018 >13% in 2018+ buffer for Basel III reform CET1 ratio targets1,2 CET1 equivalent of increase in RWA for other divisions4

Agenda Progress in capital reallocation and growth 1 Update on cost initiatives 2 Divisional execution towards targets and strategy 3 Funding plan and strategy 4 Regulatory update 5

Capital Cost initiatives Divisional financials Funding plan Regulatory update On track to reduce expenses to below CHF 19.8 bn target, with CHF 1.6 bn net savings expected by end-2016 2015 21.2 19.8 Adjusted operating expenses at constant FX rates* in CHF bn Net savings in CHF bn 2016Target 1.6 2016estimated (1.6) 2016 estimated 19.6 1.6 net savings Net headcount1 reductions of 6,050 as of December 4, exceeding target net reduction for full year 2016 Note: Adjusted results are non-GAAP financial measures. A reconciliation to reported results is included in the Appendix1 Headcount includes permanent full-time equivalent employees, contractors, consultants and other contingent workers; Achieved as of December 4, 2016 includes departed and notified headcount * See Appendix

Capital Cost initiatives Divisional financials Funding plan Regulatory update Adjusted operatingexpenses at constantFX rates* in CHF bn Note: Adjusted results are non-GAAP financial measures. A reconciliation to reported results is included in the Appendix * See Appendix 2015 Gross savings Investments in growth 2016 estimated 21.2 (2.1) 19.6 Strengthening of controls 0.3 0.2 2016 target of CHF 19.8 bn Expect to achieve CHF 2.1 bn of gross savings in 2016, while reinvesting in growth businesses that aims at achieving attractive returns

Capital Cost initiatives Divisional financials Funding plan Regulatory update Summary of progress Target total of >CHF 4.2 bn of net savings by end-2018 2015 2016estimated Estimated 2016 cost reductions 2015 – 2018 cost reduction program* in CHF bn, year-end targets 2017 & 2018planned savings Prior 2018 Target(Investor Day 2015) On track to beat target cost base of CHF 19.8 bn for 2016;expect to reduce cost base to <CHF 17.0 bn by end-2018 Revised 2018Target Note: Cost reduction program measured in constant FX rates and based on expense run rate excluding major litigation expenses, restructuring costs and goodwill impairment, but including other costs to achieve savings. Adjusted results are non-GAAP financial measures. A reconciliation to reported results is included in the Appendix* See Appendix 21.2 18.5 – 19.0 <17.0 (2.6) 2016 cost target CHF 19.8 bn

Agenda Progress in capital reallocation and growth 1 Update on cost initiatives 2 Divisional execution towards targets and strategy 3 Funding plan and strategy 4 Regulatory update 5

Capital Cost initiatives Divisional financials Funding plan Regulatory update Continued focus on cost discipline at SUB with maintained 2018 pre-tax income target Note: Adjusted results are non-GAAP financial measures. A reconciliation to reported results and a reconciliation of adjustments applied for Swisscard are included in the Appendix. Financial and other information is for Swiss Universal Bank division. Scope of Credit Suisse (Schweiz) AG differs from Swiss Universal Bank division1 Excludes Swisscard impact Adjustedpre-tax income1in CHF bn 2015 Prior 2018 Target(ID 2015) 2018Target 2.3 1.6 2.3

Capital Cost initiatives Divisional financials Funding plan Regulatory update IWM outlook impacted by adverse market environment in near term Note: Adjusted results are non-GAAP financial measures. A reconciliation to reported results is included in the Appendix1 Including additional market related activities Adjustedpre-tax incomein CHF bn Prior 2018 Target(ID 2015) Revised 2018Target (0.4) 2.1 1.8 2015 1.0 Asset Management1 Business transfers 0.1

Capital Cost initiatives Divisional financials Funding plan Regulatory update Adjustedpre-tax incomein CHF bn Prior 2018 Target(ID 2015) Revised 2018Target Marketimpact 2.1 1.6 0.3 0.7 0.7 2015 1.1 Wealth Mgmt.1 Businesstransfers Prior 2018 Targetexcl. business transfers Costinitiatives Note: Adjusted results are non-GAAP financial measures. A reconciliation to reported results is included in the Appendix1 Including contributions from wealth management connected activities 0.7 (0.7) (0.1) 2.0 APAC wealth management target unchanged; reduced overall target reflects adverse impact from market conditions
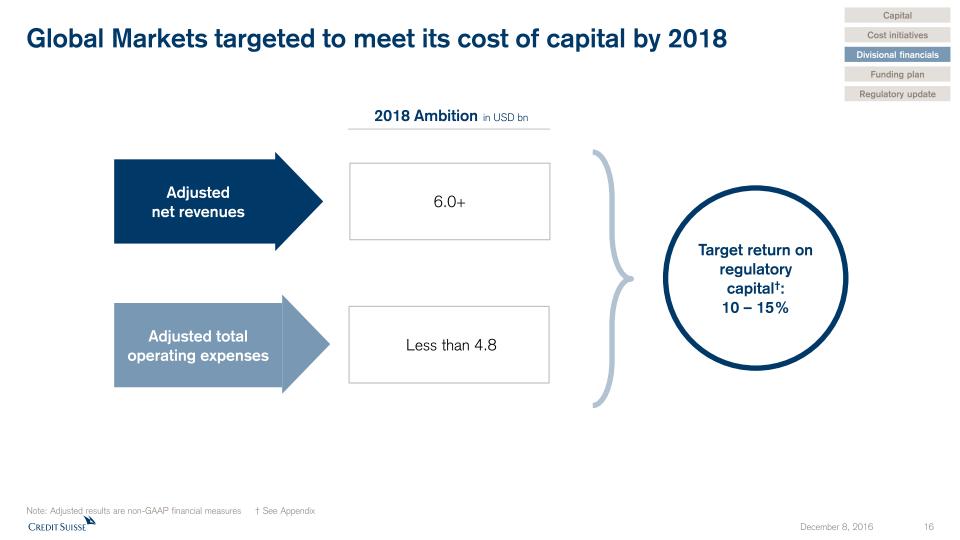
Capital Cost initiatives Divisional financials Funding plan Regulatory update Global Markets targeted to meet its cost of capital by 2018 Note: Adjusted results are non-GAAP financial measures † See Appendix Adjusted net revenues Adjusted total operating expenses 2018 Ambition in USD bn 6.0+ Less than 4.8 Target return on regulatory capital†: 10 – 15%

Capital Cost initiatives Divisional financials Funding plan Regulatory update Revenue growth and operating efficiencies to drive IBCM toward return target Note: Adjusted results are non-GAAP financial measures † See Appendix 2018Target 15-20% Adjusted return on regulatory capital† ~60% revenue growth~40% operating efficiencies 2016 to 2018 PTI Growth

SRU RWA and leverage exposure outlookOn track to reduce RWA and leverage exposure by ~80% by end-2019 1 RWA shown excluded projected inflation from future regulatory uplifts (e.g. fundamental review of trading book). Regulatory (FINMA) approval required for any operational risk reduction (35)% RWA1 in USD bn Leverage exposure in USD bn (30)% (80)% (76)% excl. ops risk Operational risk Credit & market risk Capital Cost initiatives Divisional financials Funding plan Regulatory update

Capital Cost initiatives Divisional financials Funding plan Regulatory update Comparison to previously announced Ambition SRU pre-tax loss outlookPre-tax loss drag projected to reduce to ~USD 800 mn by year-end 2019 Note: Adjusted results are non-GAAP financial measures. A reference to the reconciliation to reported results is included in the Appendix.1 As announced with 4Q15 earnings release to be CHF 850 mn ~ USD 850 mn2 Includes impact from the recalibration of funding cost allocations effective January 1, 20163 2018 target no longer projects the early redemption of legacy funding instruments 2 3 Illustrativeadjustedpre-tax income progression in USD mn ~(1,400) ~(800) 1

Capital Cost initiatives Divisional financials Funding plan Regulatory update Overview of revised financial targets for Group and divisions APAC Pre-tax income o/w Wealth Management 2 IWM Pre-tax income SUB Pre-tax income Global Markets RWA threshold1Leverage exposure threshold1Return on regulatory capital† Note: Adjusted results are non-GAAP financial measures1 As announced on March 23, 2016 (Credit Suisse Strategy Update) 2 Including contributions from wealth management connected activities † See Appendix 2016 USD 60 bnUSD 290 bn > CHF 1.4 bn1< CHF 19.8 bn111-12%1 Group Net cost savingsOperating cost baseCET1 ratio (pre significant litigation)CET1 leverage ratio SRU Pre-tax lossRWALeverage exposure 2019 > 13% pre-Basel III reform uplift; > 11% post-Basel III reform uplift ~ USD 0.8 bnUSD 30 bnUSD 40 bn 2018 CHF 1.6 bnCHF 0.7 bn CHF 1.8 bn CHF 2.3 bn 10-15% > CHF 4.2 bn< CHF 17.0 bn12-13%> 3.5% 15- 20% Adjusted figures IBCM Return on regulatory capital† ~ USD 1.4 bn
Agenda Progress in capital reallocation and growth 1 Update on cost initiatives 2 Divisional execution towards targets and strategy 3 Funding plan and strategy 4 Regulatory update 5

Overall funding volumes and costs to decline through 2019 Capital Cost initiatives Divisional financials Funding plan Regulatory update Reduced funding and capital requirements driven by the continued progress on the wind-down of the SRU portfolio Progress in SRU reduction Over USD 8 bn of expensive capital rolls off through 2019 High cost debt rolling off Capital markets funding volume expected to decline by approximately 28% from 2016 to 2019 due to reduction of term funding demand required by businesses Optimization of resources More expensive bail-in HoldCo debt replacing lower cost maturing OpCo debt Debt replacementdynamics Credit Suisse spreads at elevated level as a result of large issuance volumes in 2014 and 2015 to support IHC and entity liquidity Elevated senior spreads level HoldCo to OpCo spread basis for UK / Swiss peers remains significantly wider than for US peers HoldCo to OpCo spread differential

Funding needs reflect business demand and Group / Entity regulatory requirements 1 Includes shareholders’ equity and noncontrolling interests 2 Includes AT1 High Trigger capital instruments, grandfathered Tier 1 and Tier 2 capital instruments, and legacy capital instruments 3 Bail-in debt instruments 4 Includes senior debt, structured notes, Pfandbrief/covered bonds, due to banks and other short-term liabilities 5 Pre significant litigation expenses 6 Pre reforms to Basel III 7 Does not include the effects of the countercyclical buffers and any rebates for resolvability and for certain tier 2 low-trigger instruments recognized in gone concern capital HoldCo debt3 OpCo & other debt4 Deposits Equity1 Capital instr.2 Liquidity 3Q16 Loss absorbing capital Capital Cost initiatives Divisional financials Funding plan Regulatory update 3Q16 Business Demand Supply RWA“look-through”CHF 270 bn “Look-through” regulatory and management targets CET1 ratio5,6~13% 2018 LCR130-150%NSFR> 100% NSFR> 100% LCR>110% Leverage exposure“look-through”CHF 949 bn TLACratio728.6%(Jan 1, 2020)

Capital Cost initiatives Divisional financials Funding plan Regulatory update Reduced capital instrument costs expected to offset increased HoldCo funding costs Estimated funding costs1 – capital instruments in USD bn 2.8 2.8 2.7 2.2 Estimated funding costs1 – other sources of funding in USD bn Total funding cost1 in USD bn 1.4 1.5 1.5 1.6 1 Cost represents a spread to the 3-month reference rate
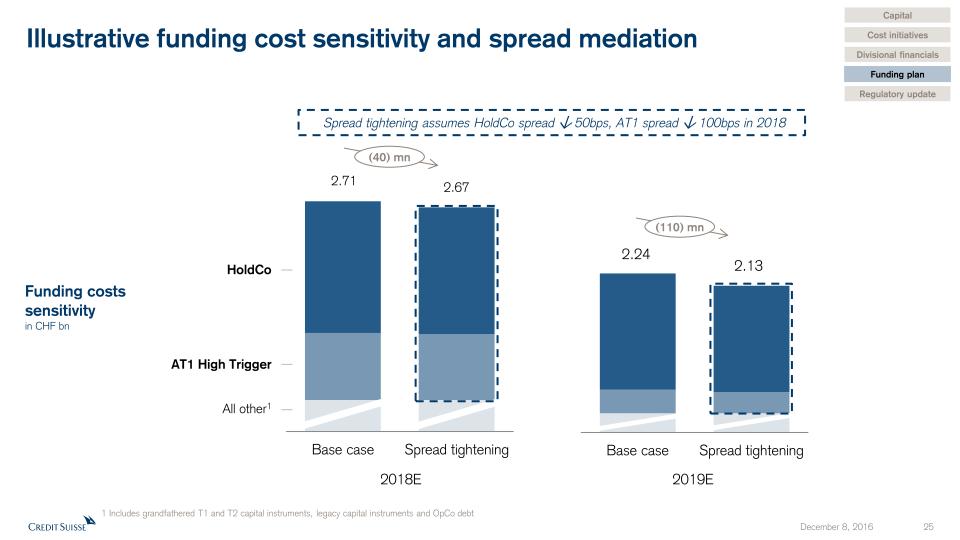
Illustrative funding cost sensitivity and spread mediation Capital Cost initiatives Divisional financials Funding plan Regulatory update Funding costs sensitivity in CHF bn 2019E 2.71 2.67 HoldCo AT1 High Trigger 2018E 2.24 2.13 Spread tightening assumes HoldCo spread 50bps, AT1 spread 100bps in 2018 (40) mn (110) mn All other1 1 Includes grandfathered T1 and T2 capital instruments, legacy capital instruments and OpCo debt

Continued reinforcement of our creditor-friendly themes and strong capacity for capital coupon payments Source: Bloomberg “Distributable Profits” = aggregate of i) net profits carried forward and ii) freely available reserves (other than reserves for own shares), in each case, less any amounts that must be contributed to legal reserves under applicable law, all as appearing in the Relevant Accounts (i.e., the audited unconsolidated financial statements of the issuer for the previous financial year) 1 Shown are Credit Suisse USD - 7.5% - PNC10 - AT1 - XS0989394589; UBS USD - 7% - PNC10 - AT1 - CH0271428333; Deutsche Bank USD - 7.5% - PNC10 - AT1 - US251525AN16 2 As of the end of 2015, the distributable profits of Credit Suisse Group AG, under the terms of our capital instruments, consisted of statutory and discretionary reserves of CHF 10.5 bn, retained earnings brought forward of CHF 5.2 bn and net profit of CHF 0.1 bn Early 2016 market volatility in USD low-trigger AT1 capital instruments1, price in % Deutsche Bank UBS Credit Suisse AT1 instruments include a contractual dividend stopperCredit Suisse will be prohibited from making any AT1 interest payment if: Distributable profits of CHF 15.8 bn (as of end 20152) are less than the aggregate amount of payments on Tier 1 instrumentsMinimum regulatory requirements are not met – transitional capital ratiosFINMA prohibited such interest paymentCredit Suisse historically has called all capital instruments on first call Capital Cost initiatives Divisional financials Funding plan Regulatory update

Large capital buffer to capital instrument triggers CET1 capital3Q16 14.1% 38.6 19.2 CHF 19.5 bnCET1 buffer1 3Q161 CET1 capital ratio Conversion trigger2 CET1 capitalat conversion trigger 7.0% Look-through impact4: Assuming CET1 capital ratio of 12.0%5 (as of end 3Q16) CHF 13.4 bnCET1 buffer 13.7 Write-down trigger3 5.0% CET1 capitalat write-down trigger CHF 25.0 bnCET1 buffer1 7.0% CHF 18.8 bnCET1 buffer 5.0% Assuming a targeted CET1 capital ratio of 13% (end 2018 target, pre-Basel III reform uplift) CHF 18.4 bnCET1 buffer 7.0% CHF 24.5 bnCET1 buffer 5.0% Note: For presentation purposes the CET1 buffer for the 5.125% low-trigger capital instrument is not shown The write-down trigger for certain capital instruments takes into account that other outstanding capital instruments that contain relatively higher capital ratios as part of their trigger feature are expected to convert into equity or be written down prior to the write down of such capital instruments Rounding differences may occur CET1 = Common equity Tier 1 1 Based on end 3Q16 phase-in risk-weighted assets of CHF 274 bn 2 Conversion into equity upon Credit Suisse Group AG’s (the “Group”) reported phase-in CET1 ratio falling below 7%, or a determination by FINMA that conversion is necessary, or that the Group requires public sector capital support, to prevent it from becoming insolvent, bankrupt or unable to pay a material amount of debts, or other similar circumstances 3 The principal amount of the instrument would be written-down to zero and canceled if the following trigger events were to occur: A) the Group’s reported phase-in CET1 ratio falls below 5%; or B) FINMA determines that cancellation of the instrument and other similar contingent capital instruments is necessary, or that the Group requires public sector capital support, in either case to prevent it from becoming insolvent or otherwise failing (“Customary Non-Viability Scenarios”) 4 Assumes the full application of a five-year (20% per annum) phase-in of goodwill, other intangible assets and other capital deductions (e.g., certain deferred tax assets) and the phase-out of an adjustment for the accounting treatment of pension plans and certain capital instruments 5 Based on end 3Q16 look-though risk-weighted assets of CHF 270 bn Phase-in BIS CET1 ratio and capital in CHF bn Capital Cost initiatives Divisional financials Funding plan Regulatory update

Build-up of HoldCo debt layer reduces loss given default and supports credit ratings OpCo HoldCo Capital instruments Estimated funding volumes 12% 19% 30% 40% Resolution (restructuring by FINMA) Loss absorption waterfall Deposits, in so far as not privileged AT1 and tier 2 instruments Equity capital Senior bonds without capital adequacy eligibility (e.g. HoldCo bail-in bonds) Other claims not excluded from conversion/write-down (e.g. OpCo senior unsecured bonds), with the exception of deposits Bail-in hierarchy in Switzerland Capital Cost initiatives Divisional financials Funding plan Regulatory update
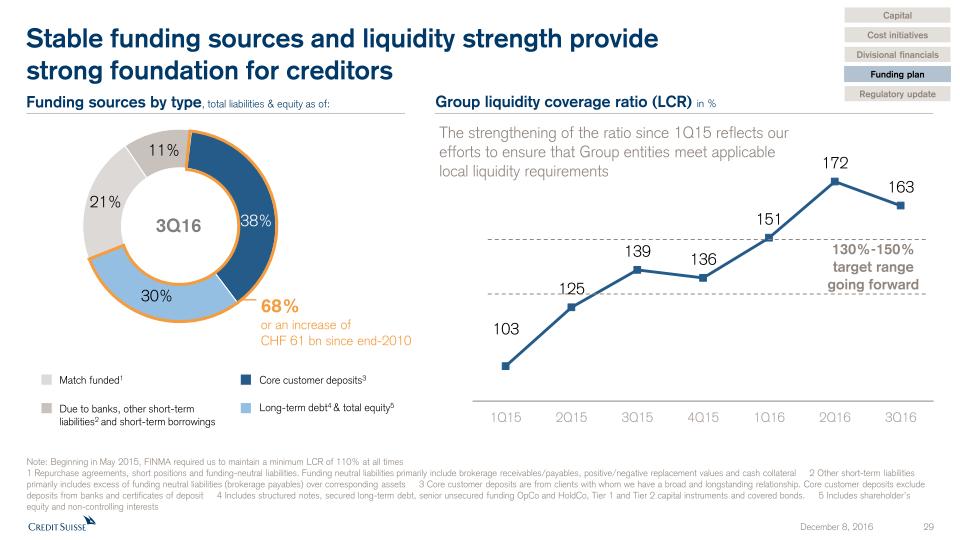
Stable funding sources and liquidity strength providestrong foundation for creditors 130%-150% target range going forward The strengthening of the ratio since 1Q15 reflects our efforts to ensure that Group entities meet applicable local liquidity requirements Group liquidity coverage ratio (LCR) in % Capital Cost initiatives Divisional financials Funding plan Regulatory update Funding sources by type, total liabilities & equity as of: Match funded1 3Q16 Due to banks, other short-term liabilities2 and short-term borrowings Core customer deposits3 Long-term debt4 & total equity5 Note: Beginning in May 2015, FINMA required us to maintain a minimum LCR of 110% at all times 1 Repurchase agreements, short positions and funding-neutral liabilities. Funding neutral liabilities primarily include brokerage receivables/payables, positive/negative replacement values and cash collateral 2 Other short-term liabilities primarily includes excess of funding neutral liabilities (brokerage payables) over corresponding assets 3 Core customer deposits are from clients with whom we have a broad and longstanding relationship. Core customer deposits exclude deposits from banks and certificates of deposit 4 Includes structured notes, secured long-term debt, senior unsecured funding OpCo and HoldCo, Tier 1 and Tier 2 capital instruments and covered bonds. 5 Includes shareholder’s equity and non-controlling interests 68% or an increase of CHF 61 bn since end-2010 21% 38% 30% 11%

Future issuances focused on HoldCo and AT1 1 Includes AT1 High Trigger capital instruments, grandfathered Tier 1 and Tier 2 capital instruments, and legacy capital instruments 2 Including Pfandbrief/Covered Bonds 3 As of September 30, 2016 4 Issuance plans reflect projected business growth, development of the balance sheet, future funding needs and maturity profiles as well as the effects of changing market and regulatory conditions and assumes callable issues redeemed at first call date. Subject to change Long-term debt capital markets issuances in CHF bn Capital instruments1 Senior bonds (OpCo)2 Senior bonds (HoldCo) 37 40 16 YTD3 25 8 7 13 Scheduled maturities3 Estimated 2017 issuance~ 13 to 15o/w 1-3 capital, 10-12 senior instruments (HoldCo)4 21 25 17 2017 2018 2019 Supply normalized compared to prior yearsSenior unsecured HoldCo issuances expected to replace maturing OpCo notes (USD 22 bn HoldCo issued to date)Existing callable capital expected to be replaced with AT1 instruments or otherwise redeemed Capital Cost initiatives Divisional financials Funding plan Regulatory update

Agenda Progress in capital reallocation and growth 1 Update on cost initiatives 2 Divisional execution towards targets and strategy 3 Funding plan and strategy 4 Regulatory update 5

Capital Cost initiatives Divisional financials Funding plan Regulatory update Recalibrated leverage ratio likely to be primary capital constraint until beginning 2020, however… 1 The binding constraint is calculated as the worse of 10% of RWA and 3.5% of leverage exposure due to the TBTF requirement of 10% CET 1 ratio and 3.5% CET 1 leverage ratio requirement2 Does not include the effects of the countercyclical buffers and any rebates for resolvability and for certain tier 2 low-trigger instruments recognized in gone concern capital …RWA uplift resulting from Basel III reforms will drive the binding constraint1 from the start of 2020 … 2018 Standardized Approach to Counterparty Credit Risk, Banking Book Securitizations and Equity Investment in Funds rules effective from January 1, 2018 Impact of revised Market Risk rules expected to be effective by December 31, 2019. Will affect primarily market risk assets in divisions with trading activity 2019 2020 Revised Swiss TBTF rules will be phased-in and become fully effective January 1, 2020 2016 Group of Governors and Heads of Supervision (GHOS) of BCBS is due to meet in January 2017 where final rules for revisions to standard rules for floors, credit risk and operational risk are expected. Significant recalibration to draft rules expected Revised Swiss TBTF rules require going concern leverage ratio of 5% (of which 3.5% CET1), 5%2 gone concern leverage ratio, going concern RWA ratio of 14.3% (of which 10% CET1) and 14.3%2 gone concern RWA ratio to become fully effective by January 1, 2020 (phase-in) Major regulatory capital changes anticipated over 2016-2020 Recent BCBS conference comments on November 30, 2016 indicate a longer implementation and phase-in period than previously expected. Use of internal models was confirmed
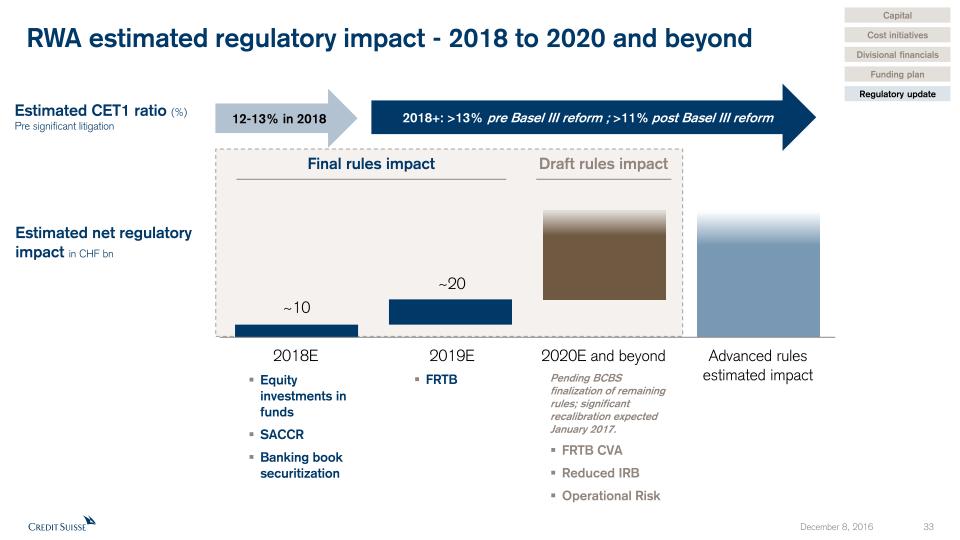
Capital Cost initiatives Divisional financials Funding plan Regulatory update RWA estimated regulatory impact - 2018 to 2020 and beyond Estimated net regulatory impact in CHF bn 2018E 2019E 2020E and beyond Advanced rules estimated impact Equity investments in fundsSACCRBanking book securitization 2018+: >13% pre Basel III reform ; >11% post Basel III reform Final rules impact Draft rules impact FRTB Pending BCBS finalization of remaining rules; significant recalibration expected January 2017.FRTB CVAReduced IRBOperational Risk 12-13% in 2018 Estimated CET1 ratio (%)Pre significant litigation

HoldCo Swiss bail-in regime similar to US and UK approach Structural Switzerland UK United States 1 Under the new draft amendment to BRRD Article 108, the European Commission has proposed to change national insolvency hierarchies in the EU member states in order to provide for a preferred and a non-preferred senior unsecured class FSB subordination forms: Statutory Germany Italy Existing bonds subordinated New class created by statute France Evolving Contractual New class created within subordinated class On a case-by-case basis United States Other EU countries1 Capital Cost initiatives Divisional financials Funding plan Regulatory update
Appendix

Credit rating peer comparison – Bank Holding Companies Aa3AA- A1A+ A2A A3A- Baa1BBB+ Moody’s rating scale Fitch and S&P rating scale Baa2BBB HSBC Morgan Stanley Citigroup Bank of America Barclays JPMorgan Chase Credit Suisse Group AG Goldman Sachs RBS F M* S* M F S M S F F M* S* M F S F F F S S M M F S M• Legend M Moody’s F Fitch S S&P Baa3BBB- UBS S F• Ba1BB+ M1 S M Source: Bloomberg. Ratings shown are current senior unsecured long-term debt ratings and are subject to change without notice. Latest rating action on July 7, 2016 * Long-term rating on negative outlook • Long-term rating on positive outlook Ratings apply to holdings companies: HSBC Holdings plc, JPMorgan Chase & Co., Goldman Sachs Group Inc., Morgan Stanley, Bank of America Corp., Citigroup Inc., Credit Suisse Group AG, UBS Group AG, Barclays plc, and Royal Bank of Scotland Group plc 1 On September 21, 2015, Moody's assigned a rating to the guaranteed US dollar senior notes issued by UBS Group Funding (Jersey) Limited. This rating was initiated by Moody's and was not requested by the rated entity Note: Ratings not shown for BNP Paribas SA, Deutsche Bank AG and Société Générale SA, given there is no holding company structure or holding company rating

Credit rating peer comparison – Bank Operating Companies Aa2AA Aa3AA- A1A+ A2A A3A- Moody’s rating scale Fitch and S&P rating scale Baa1BBB+ Legend M Moody’s F Fitch S S&P Baa2BBB Source: Bloomberg. Ratings shown are current senior unsecured long-term ratings and short-term ratings (below each symbol) and are subject to change without notice Latest rating action on July 19, 2016 * Long-term rating on negative outlook •• On review for upgrade Note: Ratings shown are for HSBC Bank plc, JPMorgan Chase Bank NA, UBS AG, Bank of America NA, Citibank NA, Goldman Sachs Bank USA, Morgan Stanley Bank NA., BNP Paribas SA, Credit Suisse AG, Société Générale SA, Barclays Bank plc and Deutsche Bank AG JPMorgan Chase UBS Deutsche Bank Goldman Sachs Morgan Stanley Citigroup BNP Paribas Bank of America Société Générale Credit Suisse AG (Bank) Barclays HSBC (F1+) F (P-1) M* (A-1+) S* (P-1) M (F1+) F (A-1) S (P-1) M (F1) F (A-1) S (P-1) M (F1) F (P-1) M (F1) F (P-1) M (F1) F (P-1) M (F1) F (P-1) M (F1) F (A-1) S•• (A-1) S•• (A-1) S•• (A-1) S•• (A-1) S (F1) F (P-1) M (A-1) S (F1) F (P-1) M (A-1) S (P-1) M* (A-2) S* (F1) F (F1) F (A-2) S* (P-2) M

New TBTF capital requirements for internationally operating SIBs in Switzerland – grandfathering rules Grandfathering rules USD 6.5% 2023 08/2023 Going / Gone concern Currency Coupon Maturity First call Recognized as First call or end 2019 (whichever is first) Qualifies as Going concern until Low-trigger Tier 2 AT1 EUR 5.75% 2025 09/2020 CHF 6.0% perpetual 09/2018 Going /Gone concern First call (even if beyond 2019) USD 7.5% perpetual 12/2023 USD 6.25% perpetual 12/2024 First call or end 2019 (whichever is first) High-trigger Tier 2 AT1 CHF 7.125% 2022 03/2017 CHF 9.0% perpetual 10/2018 Going concern USD 9.5% perpetual 10/2018 USD 9.5% perpetual 10/2018 Going /Gone concern Write-down Conversion CHF floating perpetual n.a. Going concern Write-down Contingent Capital Awards Total CHF 15.8 bn 2,500 Notional(in million) 1,250 290 2,250 2,500 750 2,500 1,720 1,725 3901 1 Represents the amount recognized in regulatory capital Note: In May 2016 the Swiss Federal Council amended the Capital Adequacy Ordinance (CAO) which recalibrates and expands the existing “Too Big to Fail” regime in Switzerland. The amended CAO came into effect on July 1, 2016, subject to phase-in and grandfathering provisions for certain outstanding instruments, and has to be fully applied by January 1, 2020. After January 1, 2020, the low-trigger Tier 2 instruments receive gone concern treatment and the Group’s gone concern requirement is reduced by a factor of 0.5 for the outstanding amount of these instruments in relation to risk-weighted assets and leverage exposure. In effect, the low-trigger Tier 2 instruments receive 1.5x value in the gone concern ratio Outstanding regulatory capital instruments as of end-3Q16 New TBTF

Early capital compliance on a phase-in basis CET1 Additional tier 15(incl. high-trigger Tier 1 and Tier 2 and low-trigger Tier 1) Bail-in debt instruments6 4.0% 5.5% 8.5% 10.0% 7.0% 14.25% 18.2% 25.18% 28.6% 21.76% Going concern Gone concern Going concern Gone concern 7.5% Credit Suisse look-through 26.1% Leverage ratio1 Capital ratio2 7 4 3 1 In percentage of leverage exposure 2 In percentage of risk-weighted assets 3 Based on end 3Q16 look-through leverage exposure of CHF 949 bn 4 Based on end 3Q16 look-through Swiss RWA of CHF 271 bn 5 Includes CHF 5.8 bn of additional Tier 1 high-trigger capital instruments, CHF 5.1 bn of additional Tier 1 low-trigger capital instruments and CHF 0.7 bn of Tier 2 high-trigger capital instruments 6 Includes CHF 22.7 bn of bail-in debt instruments and CHF 4.2 bn of Tier 2 low-trigger capital instruments 7 Effective July 1, 2016 8 Effective as of January 1 for the applicable year Note: In May 2016 the Swiss Federal Council amended the Capital Adequacy Ordinance (CAO) which recalibrates and expands the existing “Too Big to Fail” regime in Switzerland. The amended CAO came into effect on July 1,2016, subject to phase-in and grandfathering provisions for certain outstanding instruments, and has to be fully applied by January 1, 2020. Figures do not include the effects of the countercyclical buffers and any rebates forresolvability and for certain Tier 2 low-trigger instruments recognized in gone concern capital. After January 1, 2020, the low-trigger Tier 2 instruments receive gone concern treatment and the Group’s gone concernrequirement is reduced by a factor of 0.5 for the outstanding amount of these instruments in relation to RWA and Leverage Exposure. In effect, the low-trigger Tier 2 instruments receive 1.5x value in the gone concern ratio Leverage ratio requirements8 Capital ratio requirements8
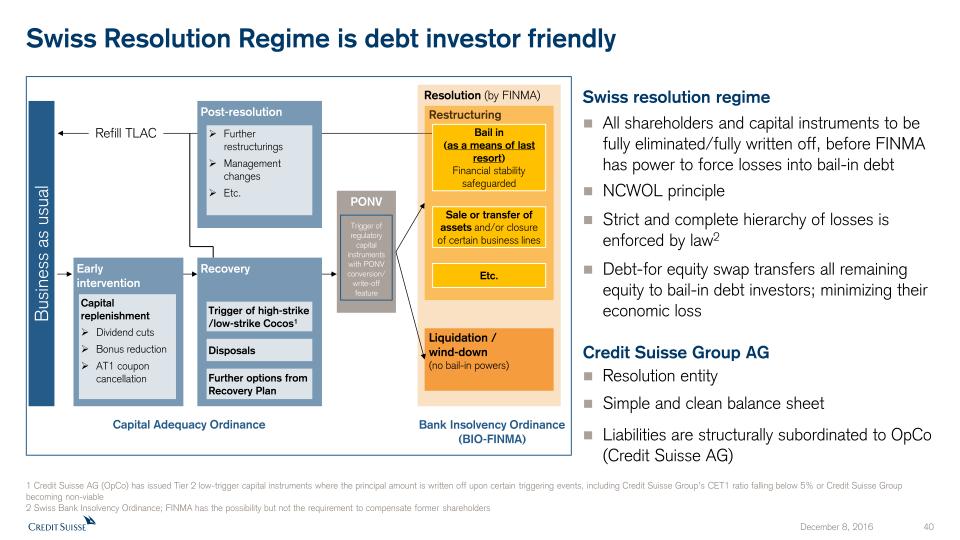
Swiss Resolution Regime is debt investor friendly Restructuring Resolution (by FINMA) PONV Recovery Post-resolution Bail in(as a means of last resort)Financial stability safeguarded Sale or transfer of assets and/or closure of certain business lines Trigger of high-strike /low-strike Cocos1 Disposals Further options from Recovery Plan Refill TLAC Earlyintervention Capital replenishmentDividend cutsBonus reductionAT1 coupon cancellation Capital Adequacy Ordinance Bank Insolvency Ordinance (BIO-FINMA) Trigger of regulatory capital instruments with PONV conversion/ write-off feature Liquidation /wind-down(no bail-in powers) Etc. Business as usual 1 Credit Suisse AG (OpCo) has issued Tier 2 low-trigger capital instruments where the principal amount is written off upon certain triggering events, including Credit Suisse Group’s CET1 ratio falling below 5% or Credit Suisse Group becoming non-viable 2 Swiss Bank Insolvency Ordinance; FINMA has the possibility but not the requirement to compensate former shareholders Further restructuringsManagement changesEtc. Swiss resolution regime All shareholders and capital instruments to be fully eliminated/fully written off, before FINMA has power to force losses into bail-in debt NCWOL principleStrict and complete hierarchy of losses is enforced by law2Debt-for equity swap transfers all remaining equity to bail-in debt investors; minimizing their economic loss Credit Suisse Group AG Resolution entitySimple and clean balance sheetLiabilities are structurally subordinated to OpCo (Credit Suisse AG)
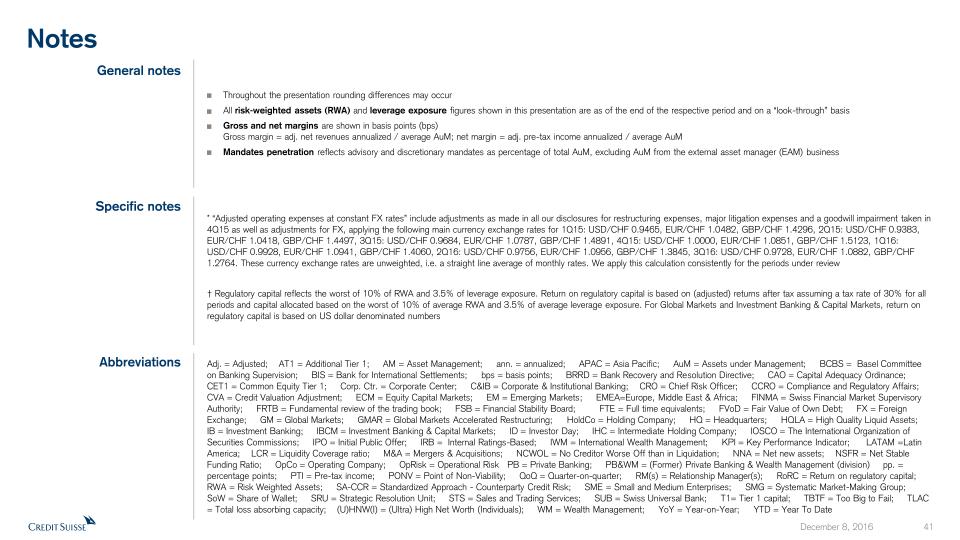
Notes Throughout the presentation rounding differences may occurAll risk-weighted assets (RWA) and leverage exposure figures shown in this presentation are as of the end of the respective period and on a “look-through” basisGross and net margins are shown in basis points (bps) Gross margin = adj. net revenues annualized / average AuM; net margin = adj. pre-tax income annualized / average AuMMandates penetration reflects advisory and discretionary mandates as percentage of total AuM, excluding AuM from the external asset manager (EAM) business General notes * “Adjusted operating expenses at constant FX rates” include adjustments as made in all our disclosures for restructuring expenses, major litigation expenses and a goodwill impairment taken in 4Q15 as well as adjustments for FX, applying the following main currency exchange rates for 1Q15: USD/CHF 0.9465, EUR/CHF 1.0482, GBP/CHF 1.4296, 2Q15: USD/CHF 0.9383, EUR/CHF 1.0418, GBP/CHF 1.4497, 3Q15: USD/CHF 0.9684, EUR/CHF 1.0787, GBP/CHF 1.4891, 4Q15: USD/CHF 1.0000, EUR/CHF 1.0851, GBP/CHF 1.5123, 1Q16: USD/CHF 0.9928, EUR/CHF 1.0941, GBP/CHF 1.4060, 2Q16: USD/CHF 0.9756, EUR/CHF 1.0956, GBP/CHF 1.3845, 3Q16: USD/CHF 0.9728, EUR/CHF 1.0882, GBP/CHF 1.2764. These currency exchange rates are unweighted, i.e. a straight line average of monthly rates. We apply this calculation consistently for the periods under review† Regulatory capital reflects the worst of 10% of RWA and 3.5% of leverage exposure. Return on regulatory capital is based on (adjusted) returns after tax assuming a tax rate of 30% for all periods and capital allocated based on the worst of 10% of average RWA and 3.5% of average leverage exposure. For Global Markets and Investment Banking & Capital Markets, return on regulatory capital is based on US dollar denominated numbers Specific notes Abbreviations Adj. = Adjusted; AT1 = Additional Tier 1; AM = Asset Management; ann. = annualized; APAC = Asia Pacific; AuM = Assets under Management; BCBS = Basel Committee on Banking Supervision; BIS = Bank for International Settlements; bps = basis points; BRRD = Bank Recovery and Resolution Directive; CAO = Capital Adequacy Ordinance; CET1 = Common Equity Tier 1; Corp. Ctr. = Corporate Center; C&IB = Corporate & Institutional Banking; CRO = Chief Risk Officer; CCRO = Compliance and Regulatory Affairs; CVA = Credit Valuation Adjustment; ECM = Equity Capital Markets; EM = Emerging Markets; EMEA=Europe, Middle East & Africa; FINMA = Swiss Financial Market Supervisory Authority; FRTB = Fundamental review of the trading book; FSB = Financial Stability Board; FTE = Full time equivalents; FVoD = Fair Value of Own Debt; FX = Foreign Exchange; GM = Global Markets; GMAR = Global Markets Accelerated Restructuring; HoldCo = Holding Company; HQ = Headquarters; HQLA = High Quality Liquid Assets; IB = Investment Banking; IBCM = Investment Banking & Capital Markets; ID = Investor Day; IHC = Intermediate Holding Company; IOSCO = The International Organization of Securities Commissions; IPO = Initial Public Offer; IRB = Internal Ratings-Based; IWM = International Wealth Management; KPI = Key Performance Indicator; LATAM =Latin America; LCR = Liquidity Coverage ratio; M&A = Mergers & Acquisitions; NCWOL = No Creditor Worse Off than in Liquidation; NNA = Net new assets; NSFR = Net Stable Funding Ratio; OpCo = Operating Company; OpRisk = Operational Risk PB = Private Banking; PB&WM = (Former) Private Banking & Wealth Management (division) pp. = percentage points; PTI = Pre-tax income; PONV = Point of Non-Viability; QoQ = Quarter-on-quarter; RM(s) = Relationship Manager(s); RoRC = Return on regulatory capital; RWA = Risk Weighted Assets; SA-CCR = Standardized Approach - Counterparty Credit Risk; SME = Small and Medium Enterprises; SMG = Systematic Market-Making Group; SoW = Share of Wallet; SRU = Strategic Resolution Unit; STS = Sales and Trading Services; SUB = Swiss Universal Bank; T1= Tier 1 capital; TBTF = Too Big to Fail; TLAC = Total loss absorbing capacity; (U)HNW(I) = (Ultra) High Net Worth (Individuals); WM = Wealth Management; YoY = Year-on-Year; YTD = Year To Date

Reconciliation of adjustment items (1/2) CS Group in CHF mn SRU in USD mn Corp. Ctr. in CHF mn 3Q16 2Q16 1Q16 4Q15 3Q15 2Q15 1Q15 3Q16 2Q16 1Q16 4Q15 3Q15 2Q15 1Q15 3Q16 2Q16 1Q16 4Q15 3Q15 2Q15 1Q15 Net revenues reported 5,396 5,108 4,638 4,210 5,985 6,955 6,647 (170) (371) (545) (126) (90) 437 335 72 (95) 110 (748) 752 384 173 Fair value on own debt - - - 697 (623) (228) (144) - - - - - - - - - - 697 (623) (228) (144) Real estate gains - - - (72) - (23) - - - - - - - - - - - - - - - (Gains)/losses on business sales (346) - 56 (34) - - - - - 4 - - - - - - 52 - - - - Net revenues adjusted 5,050 5,108 4,694 4,801 5,362 6,704 6,503 (170) (371) (541) (126) (90) 437 335 72 (95) 162 (51) 129 156 29 Provision for credit losses 55 (28) 150 133 110 51 30 6 (38) 119 99 21 13 5 - (2) 1 (2) 1 - - Total operating expenses reported 5,119 4,937 4,972 10,518 5,023 5,248 5,106 698 445 601 1,103 688 690 651 279 142 76 307 211 121 223 Goodwill impairment - - - (3,797) - - - - - - - - - - - - - - - - - Restructuring expenses (145) (91) (255) (355) - - - (23) (21) (80) (158) - - - - - - - - - - Major litigation provisions (306) - - (564) (203) (63) 10 (324) - - (257) (27) (9) - - - - - - - - Total operating expenses adjusted 4,668 4,846 4,717 5,802 4,820 5,185 5,116 351 424 521 688 661 680 651 279 142 76 307 211 121 223 Pre-tax income/(loss) reported 222 199 (484) (6,441) 852 1,656 1,511 (874) (778) (1,266) (1,328) (799) (266) (320) (207) (235) 33 (1,053) 540 263 (50) Total adjustments 105 91 311 5,307 (420) (188) (154) 347 21 84 415 27 9 - - - 52 697 (623) (228) (144) Pre-tax income/(loss) adjusted 327 290 (173) (1,134) 432 1,468 1,357 (527) (757) (1,181) (913) (772) (256) (320) (207) (235) 85 (356) (83) 35 (194) IWM AM in CHF mn GM in USD mn IBCM in USD mn 3Q16 2Q16 1Q16 4Q15 3Q15 2Q15 1Q15 3Q16 2Q16 1Q16 4Q15 3Q15 2Q15 1Q15 3Q16 2Q16 1Q16 4Q15 3Q15 2Q15 1Q15 Net revenues reported 292 334 320 365 308 335 320 1,396 1,671 1,252 1,168 1,632 2,052 2,272 479 558 395 418 414 605 420 Fair value on own debt - - - - - - - - - - - - - - - - - - - - - Real estate gains - - - - - - - - - - - - - - - - - - - - - (Gains)/losses on business sales - - - - - - - - - - - - - - - - - - - - - Net revenues adjusted 292 334 320 365 308 335 320 1,396 1,671 1,252 1,168 1,632 2,052 2,272 479 558 395 418 414 605 420 Provision for credit losses - - - - - - - (6) (17) 22 (5) 15 (4) 4 (9) - 30 - - - - Total operating expenses reported 243 273 253 330 267 275 274 1,310 1,532 1,430 4,517 1,346 1,641 1,498 450 417 425 902 346 451 471 Goodwill impairment - - - - - - - - - - (2,690) - - - - - - (384) - - - Restructuring expenses (2) (2) 2 (4) - - - (52) (52) (102) (97) - - - (16) 9 (28) (22) - - - Major litigation provisions - - - - - - - (7) - - (51) (132) (57) - - - - - - - - Total operating expenses adjusted 241 271 255 326 267 275 274 1,251 1,480 1,328 1,679 1,214 1,584 1,498 434 426 397 496 346 451 471 Pre-tax income/(loss) reported 49 61 67 35 41 60 46 92 156 (200) (3,345) 271 415 770 39 141 (60) (484) 68 154 (51) Total adjustments 2 2 (2) 4 - - - 59 52 102 2,838 132 57 - 16 (9) 28 406 - - - Pre-tax income/(loss) adjusted 51 63 65 39 41 60 46 150 208 (98) (507) 403 473 770 55 132 (32) (78) 68 154 (51) Adjusted results are non-GAAP financial measures that exclude goodwill impairment and certain other revenues and expenses included in our reported results. Management believes that adjusted results provide a useful presentation of our operating results for purposes of assessing our Group and divisional performance consistently over time, on a basis that excludes items that management does not consider representative of our underlying performance. Provided below is a reconciliation of our adjusted results to the most directly comparable US GAAP measures.
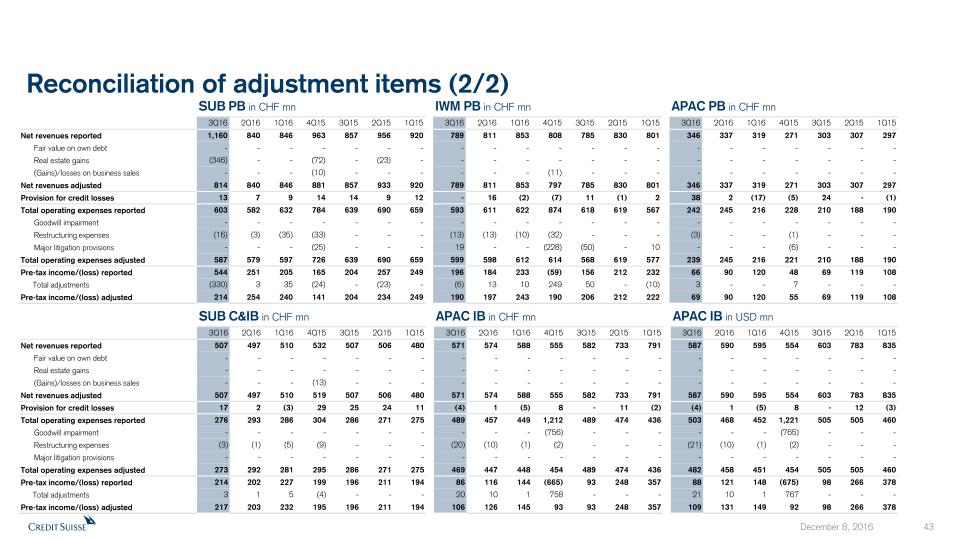
SUB PB in CHF mn IWM PB in CHF mn APAC PB in CHF mn 3Q16 2Q16 1Q16 4Q15 3Q15 2Q15 1Q15 3Q16 2Q16 1Q16 4Q15 3Q15 2Q15 1Q15 3Q16 2Q16 1Q16 4Q15 3Q15 2Q15 1Q15 Net revenues reported 1,160 840 846 963 857 956 920 789 811 853 808 785 830 801 346 337 319 271 303 307 297 Fair value on own debt - - - - - - - - - - - - - - - - - - - - - Real estate gains (346) - - (72) - (23) - - - - - - - - - - - - - - - (Gains)/losses on business sales - - - (10) - - - - - - (11) - - - - - - - - - - Net revenues adjusted 814 840 846 881 857 933 920 789 811 853 797 785 830 801 346 337 319 271 303 307 297 Provision for credit losses 13 7 9 14 14 9 12 - 16 (2) (7) 11 (1) 2 38 2 (17) (5) 24 - (1) Total operating expenses reported 603 582 632 784 639 690 659 593 611 622 874 618 619 567 242 245 216 228 210 188 190 Goodwill impairment - - - - - - - - - - - - - - - - - - - - - Restructuring expenses (16) (3) (35) (33) - - - (13) (13) (10) (32) - - - (3) - - (1) - - - Major litigation provisions - - - (25) - - - 19 - - (228) (50) - 10 - - - (6) - - - Total operating expenses adjusted 587 579 597 726 639 690 659 599 598 612 614 568 619 577 239 245 216 221 210 188 190 Pre-tax income/(loss) reported 544 251 205 165 204 257 249 196 184 233 (59) 156 212 232 66 90 120 48 69 119 108 Total adjustments (330) 3 35 (24) - (23) - (6) 13 10 249 50 - (10) 3 - - 7 - - - Pre-tax income/(loss) adjusted 214 254 240 141 204 234 249 190 197 243 190 206 212 222 69 90 120 55 69 119 108 SUB C&IB in CHF mn APAC IB in CHF mn APAC IB in USD mn 3Q16 2Q16 1Q16 4Q15 3Q15 2Q15 1Q15 3Q16 2Q16 1Q16 4Q15 3Q15 2Q15 1Q15 3Q16 2Q16 1Q16 4Q15 3Q15 2Q15 1Q15 Net revenues reported 507 497 510 532 507 506 480 571 574 588 555 582 733 791 587 590 595 554 603 783 835 Fair value on own debt - - - - - - - - - - - - - - - - - - - - - Real estate gains - - - - - - - - - - - - - - - - - - - - - (Gains)/losses on business sales - - - (13) - - - - - - - - - - - - - - - - - Net revenues adjusted 507 497 510 519 507 506 480 571 574 588 555 582 733 791 587 590 595 554 603 783 835 Provision for credit losses 17 2 (3) 29 25 24 11 (4) 1 (5) 8 - 11 (2) (4) 1 (5) 8 - 12 (3) Total operating expenses reported 276 293 286 304 286 271 275 489 457 449 1,212 489 474 436 503 468 452 1,221 505 505 460 Goodwill impairment - - - - - - - - - - (756) - - - - - - (765) - - - Restructuring expenses (3) (1) (5) (9) - - - (20) (10) (1) (2) - - - (21) (10) (1) (2) - - - Major litigation provisions - - - - - - - - - - - - - - - - - - - - - Total operating expenses adjusted 273 292 281 295 286 271 275 469 447 448 454 489 474 436 482 458 451 454 505 505 460 Pre-tax income/(loss) reported 214 202 227 199 196 211 194 86 116 144 (665) 93 248 357 88 121 148 (675) 98 266 378 Total adjustments 3 1 5 (4) - - - 20 10 1 758 - - - 21 10 1 767 - - - Pre-tax income/(loss) adjusted 217 203 232 195 196 211 194 106 126 145 93 93 248 357 109 131 149 92 98 266 378 Reconciliation of adjustment items (2/2)
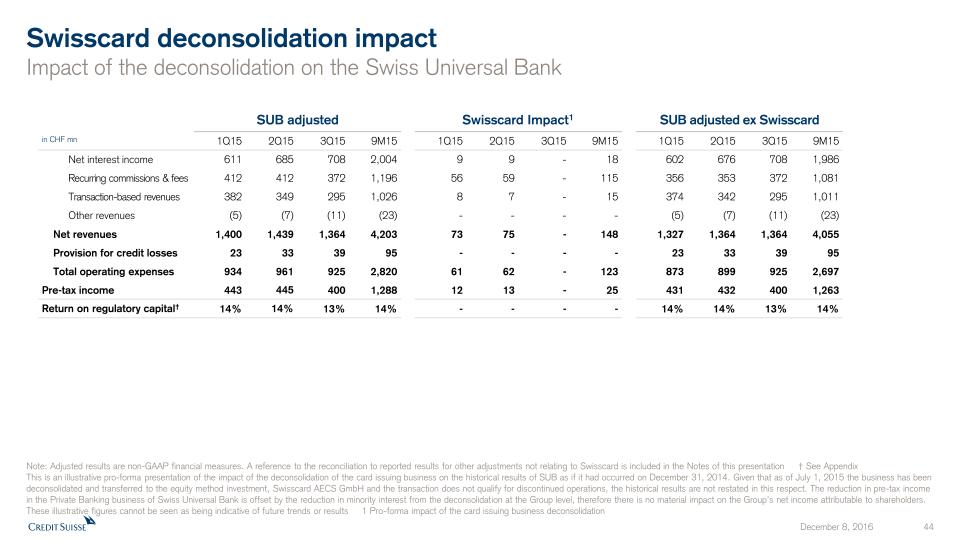
Swisscard deconsolidation impactImpact of the deconsolidation on the Swiss Universal Bank Note: Adjusted results are non-GAAP financial measures. A reference to the reconciliation to reported results for other adjustments not relating to Swisscard is included in the Notes of this presentation † See AppendixThis is an illustrative pro-forma presentation of the impact of the deconsolidation of the card issuing business on the historical results of SUB as if it had occurred on December 31, 2014. Given that as of July 1, 2015 the business has been deconsolidated and transferred to the equity method investment, Swisscard AECS GmbH and the transaction does not qualify for discontinued operations, the historical results are not restated in this respect. The reduction in pre-tax income in the Private Banking business of Swiss Universal Bank is offset by the reduction in minority interest from the deconsolidation at the Group level, therefore there is no material impact on the Group’s net income attributable to shareholders. These illustrative figures cannot be seen as being indicative of future trends or results 1 Pro-forma impact of the card issuing business deconsolidation in CHF mn 1Q15 2Q15 3Q15 9M15 1Q15 2Q15 3Q15 9M15 1Q15 2Q15 3Q15 9M15 Net interest income 611 685 708 2,004 9 9 - 18 602 676 708 1,986 Recurring commissions & fees 412 412 372 1,196 56 59 - 115 356 353 372 1,081 Transaction-based revenues 382 349 295 1,026 8 7 - 15 374 342 295 1,011 Other revenues (5) (7) (11) (23) - - - - (5) (7) (11) (23) Net revenues 1,400 1,439 1,364 4,203 73 75 - 148 1,327 1,364 1,364 4,055 Provision for credit losses 23 33 39 95 - - - - 23 33 39 95 Total operating expenses 934 961 925 2,820 61 62 - 123 873 899 925 2,697 Pre-tax income 443 445 400 1,288 12 13 - 25 431 432 400 1,263 Return on regulatory capital† 14% 14% 13% 14% - - - - 14% 14% 13% 14% SUB adjusted Swisscard Impact1 SUB adjusted ex Swisscard

Pursuant to the requirements of the Securities Exchange Act of 1934, the registrant has duly caused this report to be signed on its behalf by the undersigned, thereunto duly authorized.
CREDIT SUISSE GROUP AG and CREDIT SUISSE AG
(Registrants)
Date: December 8, 2016
By:
/s/ Christian Schmid
Christian Schmid
Managing Director
By:
/s/ Stephan Flückiger
Stephan Flückiger
Director
Serious News for Serious Traders! Try StreetInsider.com Premium Free!
You May Also Be Interested In
- Digital Realty Trust (DLR) Appoints Susan Swanezy to its Board
- MSCI Inc. (MSCI) PT Lowered to $425 at BofA Securities
- Citi Downgrades UBS AG (UBSG:SW) (UBS) to Neutral
Create E-mail Alert Related Categories
SEC FilingsRelated Entities
Credit SuisseSign up for StreetInsider Free!
Receive full access to all new and archived articles, unlimited portfolio tracking, e-mail alerts, custom newswires and RSS feeds - and more!
