

Form 6-K CREDIT SUISSE GROUP AG For: Dec 07 Filed by: CREDIT SUISSE AG
 Tweet
Tweet Share
Share
UNITED STATES
SECURITIES AND EXCHANGE COMMISSION
SECURITIES AND EXCHANGE COMMISSION
Washington, D.C. 20549
Form 6-K
REPORT OF FOREIGN PRIVATE ISSUER PURSUANT TO RULE 13a-16 OR 15d-16
UNDER THE SECURITIES EXCHANGE ACT OF 1934
UNDER THE SECURITIES EXCHANGE ACT OF 1934
December 7, 2016
Commission File Number 001-15244
CREDIT SUISSE GROUP AG
(Translation of registrant’s name into English)
Paradeplatz 8, CH 8001 Zurich, Switzerland
(Address of principal executive office)
(Address of principal executive office)
Commission File Number 001-33434
CREDIT SUISSE AG
(Translation of registrant’s name into English)
Paradeplatz 8, CH 8001 Zurich, Switzerland
(Address of principal executive office)
(Address of principal executive office)
Indicate by check mark whether the registrant files or will file annual reports under cover of Form 20-F or
Form 40-F.
Form 40-F.
Form 20-F  Form 40-F
Form 40-F
Indicate by check mark if the registrant is submitting the Form 6-K in paper as permitted by Regulation S-T Rule 101(b)(1):
Note: Regulation S-T Rule 101(b)(1) only permits the submission in paper of a Form 6-K if submitted solely to provide an attached annual report to security holders.
Indicate by check mark if the registrant is submitting the Form 6-K in paper as permitted by Regulation S-T Rule 101(b)(7):
Note: Regulation S-T Rule 101(b)(7) only permits the submission in paper of a Form 6-K if submitted to furnish a report or other document that the registrant foreign private issuer must furnish and make public under the laws of the jurisdiction in which the registrant is incorporated, domiciled or legally organized (the registrant’s “home country”), or under the rules of the home country exchange on which the registrant’s securities are traded, as long as the report or other document is not a press release, is not required to be and has not been distributed to the registrant’s security holders, and, if discussing a material event, has already been the subject of a Form 6-K submission or other Commission filing on EDGAR.
This report includes the slides for the presentation to investors in connection with Investor Day 2016 on December 7, 2016.

Credit Suisse Investor Day 2016Tidjane Thiam, CEO Credit Suisse December 7, 2016

Disclaimer (1/2) The data presented in this presentation relating to the Swiss Universal Bank refers to the division of Credit Suisse Group as the same is currently managed within Credit Suisse Group. The scope, revenues and expenses of the Swiss Universal Bank vary from the planned scope of Credit Suisse (Schweiz) AG and its subsidiaries, planned to be subject to a partial IPO, market conditions permitting. Any such IPO would involve the sale of a minority stake and would be subject to, among other things, all necessary approvals.It is therefore not possible to make a like-for-like comparison of the Swiss Universal Bank as a division of Credit Suisse Group on the one hand and Credit Suisse (Schweiz) AG as a potential IPO vehicle on the other hand.Cautionary statement regarding forward-looking statements This presentation contains forward-looking statements that involve inherent risks and uncertainties, and we might not be able to achieve the predictions, forecasts, projections and other outcomes we describe or imply in forward-looking statements. A number of important factors could cause results to differ materially from the plans, objectives, expectations, estimates and intentions we express in these forward-looking statements, including those we identify in "Risk Factors” in our Annual Report on Form 20-F for the fiscal year ended December 31, 2015 and in “Cautionary statement regarding forward-looking information" in our media release relating to Investor Day, published on December 7, 2016 and filed with the US Securities and Exchange Commission, and in other public filings and press releases. We do not intend to update these forward-looking statements except as may be required by applicable law. In particular, the terms “Illustrative”, “Ambition”, “Outlook” and “Goal” are not intended to be viewed as targets or projections, nor are they considered to be Key Performance Indicators. All such illustrations, ambitions and goals are subject to a large number of inherent risks, assumptions and uncertainties, many of which are completely outside of our control. Accordingly, this information should not be relied on for any purpose. We do not intend to update these illustrations, ambitions or goals.We may not achieve the benefits of our strategic initiativesWe may not achieve all of the expected benefits of our strategic initiatives. Factors beyond our control, including but not limited to the market and economic conditions, changes in laws, rules or regulations and other challenges discussed in our public filings, could limit our ability to achieve some or all of the expected benefits of these initiatives. Estimates and assumptionsIn preparing this presentation, management has made estimates and assumptions that affect the numbers presented. Actual results may differ. Figures throughout presentation may also be subject to rounding adjustments. Cautionary Statements Relating to Interim Financial InformationThis presentation contains certain unaudited interim financial information as of or for periods after September 30, 2016, the date of our last published quarterly financial statements. This information has been derived from management accounts, is preliminary in nature, does not reflect the complete results of the fourth quarter of 2016 and is subject to change, including as a result of any normal quarterly adjustments in relation to the financial statements for the fourth quarter of 2016. This information has not been subject to any review by our independent registered public accounting firm. There can be no assurance that the final results for these periods will not differ from these preliminary results, and any such differences could be material. Quarterly financial results for the fourth quarter of 2016 will be included in our 4Q16 Earnings Release, and audited consolidated financial statements for full-year 2016 will be included in our Annual Report on Form 20-F for the year ended December 31, 2016, when they are published. These interim results of operations are not necessarily indicative of the results to be achieved for the remainder of the fourth quarter or the full year 2016.

Disclaimer (2/2) Statement regarding non-GAAP financial measures This presentation also contains non-GAAP financial measures, including adjusted results. Information needed to reconcile such non-GAAP financial measures to the most directly comparable measures under US GAAP or a reference thereto can be found in this presentation in the Appendix, which is available on our website at credit-suisse.com.Statement regarding capital, liquidity and leverage As of January 1, 2013, Basel 3 was implemented in Switzerland along with the Swiss “Too Big to Fail” legislation and regulations thereunder (in each case, subject to certain phase-in periods). As of January 1, 2015, the Bank for International Settlements (BIS) leverage ratio framework, as issued by the Basel Committee on Banking Supervision (BCBS), was implemented in Switzerland by FINMA. Our related disclosures are in accordance with our interpretation of such requirements, including relevant assumptions. Changes in the interpretation of these requirements in Switzerland or in any of our assumptions or estimates could result in different numbers from those shown in this presentation. Capital and ratio numbers for periods prior to 2013 are based on estimates, which are calculated as if the Basel 3 framework had been in place in Switzerland during such periods. Unless otherwise noted, leverage exposure is based on the BIS leverage ratio framework and consists of period-end balance sheet assets and prescribed regulatory adjustments. Leverage amounts for 4Q14, which are presented in order to show meaningful comparative information, are based on estimates which are calculated as if the BIS leverage ratio framework had been implemented in Switzerland at such time. Beginning in 2015, the Swiss leverage ratio is calculated as Swiss total capital, divided by period-end leverage exposure. The look-through BIS tier 1 leverage ratio and CET1 leverage ratio are calculated as look-through BIS tier 1 capital and CET1 capital, respectively, divided by end-period leverage exposure. Selling restrictions This document, and the information contained herein, is not an offer to sell or a solicitation of offers to purchase or subscribe for securities of Credit Suisse Group AG or Credit Suisse (Schweiz) AG in Switzerland, the United States or any other jurisdiction. This document is not a prospectus within the meaning of article 652a of the Swiss Code of Obligations, nor is it a listing prospectus as defined in the listing rules of the SIX Swiss Exchange AG or any other exchange or regulated trading facility in Switzerland or a prospectus or offering document under any other applicable laws. Copies of this document may not be sent to jurisdictions, or distributed in or sent from jurisdictions, in which such documents are barred or prohibited by law. A decision to invest in securities of Credit Suisse Group AG or Credit Suisse (Schweiz) AG should be based exclusively on a written agreement with Credit Suisse Group AG or an offering and listing prospectus to be published by Credit Suisse Group AG or Credit Suisse (Schweiz) AG for such purpose. Any offer and sale of securities of Credit Suisse (Schweiz) AG will not be registered under the U.S. Securities Act of 1933, as amended, and may not be offered in the United States of America absent such registration or an exemption from registration. There will be no public offering of such securities in the United States of America.
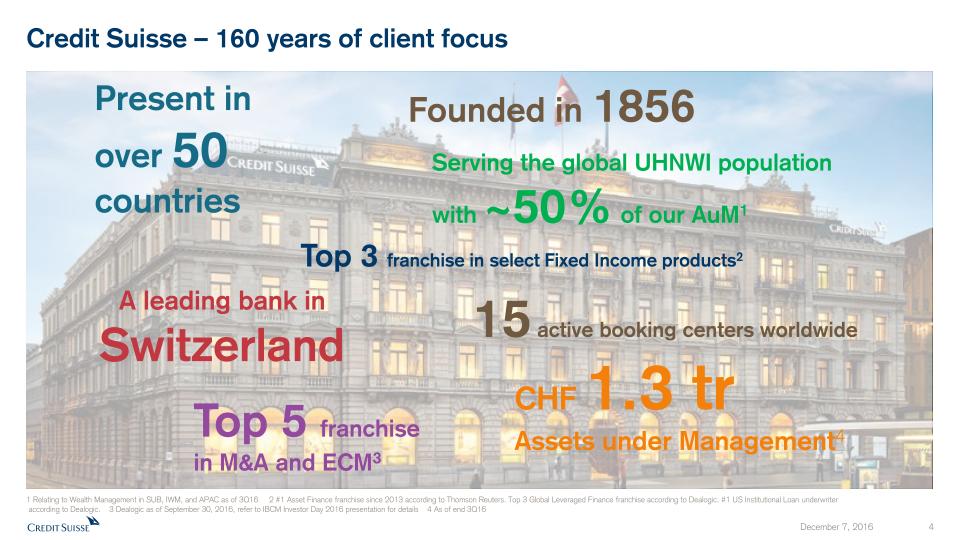
Credit Suisse – 160 years of client focus Founded in 1856 Top 5 franchise in M&A and ECM3 15 active booking centers worldwide CHF 1.3 tr Assets under Management4 Present in over 50 countries Serving the global UHNWI population with ~50% of our AuM1 A leading bank in Switzerland Top 3 franchise in select Fixed Income products2 1 Relating to Wealth Management in SUB, IWM, and APAC as of 3Q16 2 #1 Asset Finance franchise since 2013 according to Thomson Reuters. Top 3 Global Leveraged Finance franchise according to Dealogic. #1 US Institutional Loan underwriter according to Dealogic. 3 Dealogic as of September 30, 2016, refer to IBCM Investor Day 2016 presentation for details 4 As of end 3Q16

Delivering against our key objectives Costs CHF 19.6 bn 2016E adjusted operating expensesat constant FX rates* 2016E net savings CHF 1.6 bn CHF 2.9 bn 9M16 Core pre-tax income adjusted Profitability CHF 2.4 bn 9M16 SRU pre-tax loss adjusted Note: Adjusted results are non-GAAP financial measures. A reconciliation to reported results is included in the Appendix * See Appendix1 Relating to Wealth Management in SUB, IWM and APAC 3Q16 CET1 look-through ratio 12.0%+180 bps vs. 3Q15 Capital 3.4% 3Q16 CET1 look-through leverage ratio Assets 9M16 net new assets1 CHF 30.9 bn10% emerging market growth rate3% mature market growth rate

By end 2016, we will have achieved CHF 1.6 bn of net cost savings and are further raising our ambition to increase operating leverage 2015-18cost reduction program*in CHF bn, year-end Target total net cost savings have increased from CHF 2.0 bn to CHF >4.2 bn by 2018 Note: Cost reduction program measured in constant FX rates and based on expense run rate excluding major litigation expenses, restructuring costs and a goodwill impairment taken in 4Q15, but including other costs to achieve savings. Adjusted results are non-GAAP financial measures. A reconciliation to reported results is included in the Appendix.* See Appendix 1.6 >4.2 2015 2016E Prior 2018 Target (ID 2015) 2018 Target (new)

Exceeding our 2016 net headcount reduction target Net reduction to global headcount in 2016 Note: Headcount includes permanent full-time equivalent employees, contractors, consultants and other contingent workers 1 Includes departed and notified headcount 2016 Target Global Markets Accelerated Restructuring(March 2016) Prior 2016 Target(Investor Day 2015) 6,000 2,000 4,000 6,050 December 4,20161

While reducing costs, we have continued to invest in our client franchise and absorbed regulatory needs Note: Adjusted results are non-GAAP financial measures. A reconciliation to reported results is included in the Appendix. Annualized numbers do not take account of variations in operating results, seasonality and other factors and may not be indicative of actual, full-year results.* See Appendix Adjusted operatingexpenses at constantFX rates*in CHF bn Strengthening of controls Net cost savings 2016E 1.6 Investment in growth Gross cost savings 2016E 2.1

Restructuring costs progressionin CHF bn Restructuring costs expected to decrease in 2018 0.6 0.6 0.3 0.4 Severance Real Estate Other Estimated restructuring costs: CHF 1.9 bn

Our strategy… Be a leading Private Bankand Wealth Manager… …with strong Investment Banking capabilities
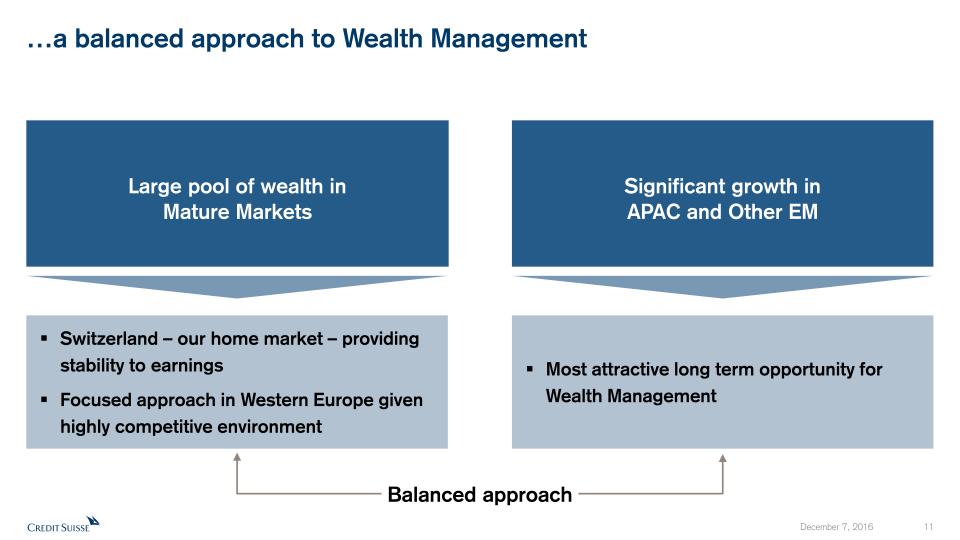
…a balanced approach to Wealth Management Significant growth in APAC and Other EM Most attractive long term opportunity for Wealth Management Large pool of wealth in Mature Markets Switzerland – our home market – providing stability to earningsFocused approach in Western Europe given highly competitive environment Balanced approach

GM maintains strong client franchises across equities and fixed income #1 Asset Finance franchise since 20134 #3 Issuerof US Structured Notes3 #2 Client rankingin Global Cashsince 20071 Top 3 Global Prime Brokerage since 20122 Bank of the year: Structured Products Most InnovativeBank for Securitisation GM SUB IWM APAC SRU IBCM 1 Third Party Competitive Analysis2 Hedge Fund Intelligence / Absolute Return / EuroHedge3 Bloomberg Brief Ranking, November 23, 20164 Thomson Reuters, 2013 to 3Q16
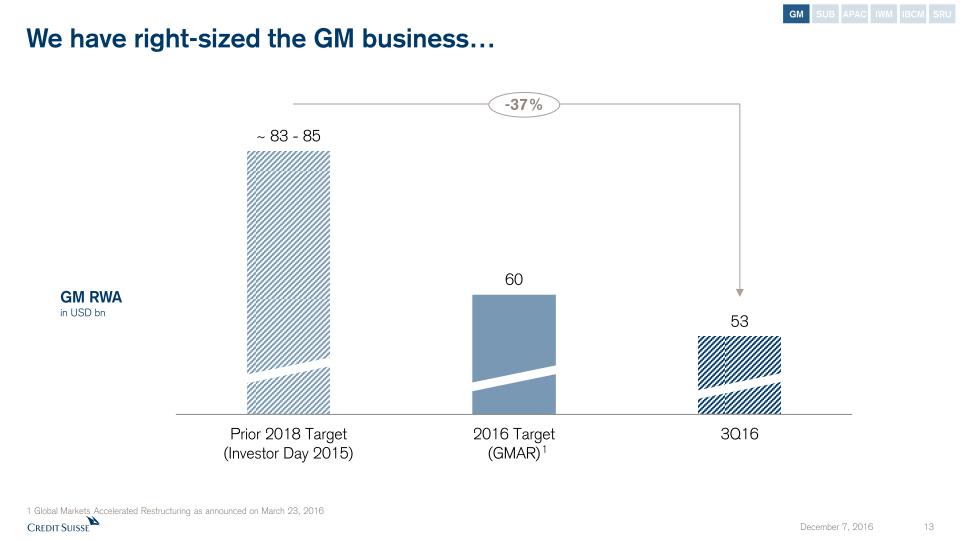
We have right-sized the GM business… -37% 1 Global Markets Accelerated Restructuring as announced on March 23, 2016 1 GM RWAin USD bn GM SUB APAC IWM SRU IBCM

GM Credit products net revenues in USD mn …while maintaining strong positions in our core franchises… GM Cash Equities net revenues1 in USD mn 1 Relating to Americas and EMEA GM SUB APAC IWM SRU IBCM

…and increasing positive operating leverage 9M16 Annualized2 2018Ambition 6.0 5.4 < 4.8 2015 Note: Adjusted results are non-GAAP financial measures. A reconciliation to reported results is included in the Appendix1 Expenses post Global Markets Accelerated Restructuring 2 Annualized numbers do not take account of variations in operating results, seasonality and other factors and may not be indicative of actual, full-year results Total adjusted operating expenses1in USD bn GM SUB APAC IWM SRU IBCM

GM – Key takeaways Strong client franchiseRight-sizing and derisking nearing completionOperating leverage materially increasedUpside from working more closely across divisionsProspects are positive, targeting Return on Regulatory Capital† between 10-15% by end-2018 † See Appendix GM SUB APAC IWM SRU IBCM

Market-leading positions in Switzerland #1 External Asset Managers #2 Mid / large SMEs #1 Institutionals #2 UHNWI #1 Investment Banking #2 Retail, Affluent & HNWI #2 Large Corporates GM SUB APAC IWM SRU IBCM 1 Source: Private Clients, Mid / Large SME, Large Corporates, Institutional Clients: The Boston Consulting Group; based on revenues 2 Source: Equity Capital Markets (ECM): Dealogic; Debt Capital Markets (DCM): IFR; M&A: Thomson Securities, SDC Platinum, Credit Suisse; based on deal volumes January 1 – December 23, 2015 3 Incl. Affiliates (BANK-now, Swisscard, Neue Aargauer Bank) 4 Small and Medium Enterprises 5 Excl. CS Asset Management Switzerland 6 Swiss-based External Asset Managers only 1 1 2 1,6 1,5 1,3 1,3

Switzerland has the highest average wealth per adult making it an attractive wealth management market China World Europe Germany Sweden France United Kingdom United States Switzerland Wealth per adult among major economies in mid-2016in USD thousands Source: Credit Suisse Global Wealth Databook, 2016 GM SUB APAC IWM SRU IBCM
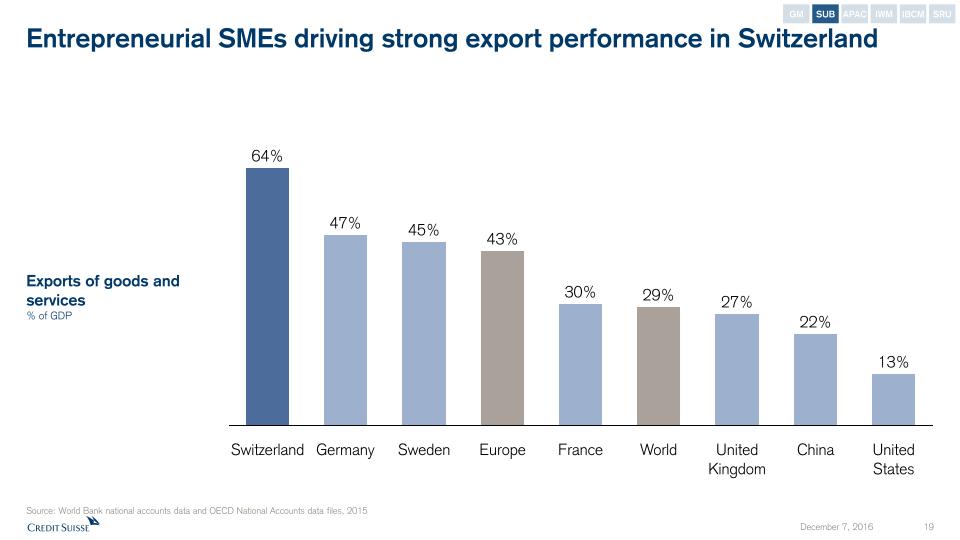
Entrepreneurial SMEs driving strong export performance in Switzerland 22% United Kingdom 27% 30% Sweden Europe 43% World 29% China United States 13% Switzerland 64% Germany 45% France 47% Exports of goods and services% of GDP Source: World Bank national accounts data and OECD National Accounts data files, 2015 GM SUB APAC IWM SRU IBCM

SUB is focused on capturing the wealth opportunity in Switzerland… 3Q15 500 237 263 +6% 3Q16 Private Banking Corporate &Institutional Banking 529 Assets under Managementin CHF bn + 8% + 3% GM SUB APAC IWM SRU IBCM Note: Financial and other information is for Swiss Universal Bank division. Scope of Credit Suisse (Schweiz) AG differs from Swiss Universal Bank division

…and is executing with discipline… Adjusted operatingexpenses1in CHF mn 9M16 2,609 Savings Regulatory, compliance & digitalization 9M15 2,697 Note: Adjusted results are non-GAAP financial measures. A reference to the reconciliation to reported results and a reconciliation of adjustments applied for Swisscard are included in the Appendix. Financial and other information is for Swiss Universal Bank division. Scope of Credit Suisse (Schweiz) AG differs from Swiss Universal Bank division1 Excludes Swisscard impact GM SUB APAC IWM SRU IBCM -3%

…leading to increased profitability +8% +6% +10% 3Q 431 400 2Q 457 432 1Q 472 431 2016 2015 SUB adjusted pre-tax income1in CHF mn Note: Adjusted results are non-GAAP financial measures. A reference to the reconciliation to reported results and a reconciliation of adjustments applied for Swisscard are included in the Appendix. Financial and other information is for Swiss Universal Bank division. Scope of Credit Suisse (Schweiz) AG differs from Swiss Universal Bank division1 Excludes Swisscard impact GM SUB APAC IWM SRU IBCM

2018Target 2015 SUB adjusted pre-tax income1in CHF bn Note: Adjusted results are non-GAAP financial measures. A reference to the reconciliation to reported results and a reconciliation of adjustments applied for Swisscard are included in the Appendix. Financial and other information is for Swiss Universal Bank division. Scope of Credit Suisse (Schweiz) AG differs from Swiss Universal Bank division1 Excludes Swisscard impact Confirming our 2018 PTI target GM SUB APAC IWM SRU IBCM

Roadmap to planned IPO June 30, 2017 December 31, 2017 Credit Suisse (Schweiz) AGgo live First published statutory financial statements of Credit Suisse (Schweiz) AG IPO of 20-30%1Market conditions permitting Final calibration of RWA requirements by FINMA Nov 20, 2016 March 24, 2017 March 31, 2017 Further guidance on Credit Suisse (Schweiz) AG financials, key metrics and parameter Intercompany model finalized / Service Company set-up 1 Any such IPO would involve the sale of a minority stake and would be subject to, among other things, all necessary approvals and would be intended to generate / raise additional capital for Credit Suisse AG or Credit Suisse (Schweiz) AG estimated timeline GM SUB APAC IWM SRU IBCM
SUB – Key takeaways Selective revenue growth and effective cost discipline15% adjusted Return on Regulatory Capital† in 9M16On track for planned partial IPO of Credit Suisse (Schweiz) AG in 2H171Increasing profitability and confirmed 2018 PTI target of CHF 2.3 bn2 Note: Adjusted results are non-GAAP financial measures. A reference to the reconciliation to reported results and a reconciliation of adjustments applied for Swisscard are included in the Appendix. Financial and other information is for Swiss Universal Bank division. The scope of revenues and expenses of the Swiss Universal Bank division varies from the planned scope of Credit Suisse (Schweiz) AG and its subsidiaries which is planned to be subject to the IPO. It is therefore not possible to make a like-for-like comparison of the Swiss Universal Bank division and Credit Suisse (Schweiz) AG as a potential IPO vehicle† See Appendix1 Market conditions permitting. Any IPO would be subject to, among other things, all necessary approvals and would be intended to generate / raise additional capital for Credit Suisse AG or Credit Suisse (Schweiz) AG2 On an adjusted basis GM SUB APAC IWM SRU IBCM

Strong and diversified franchise in APAC 1 Awards for distinction from Asian Private Banker for 2015 2 AsiaRisk magazine October 2016 edition 3 According to cash equities trading information from respective exchanges for period ending September 30, 20164 Source: Dealogic (APAC ex Japan) as of September 30, 2016. Ranking amongst international banks for the first 9 months of 2016 5 As of 3Q16 GM SUB APAC IWM SRU IBCM Wealth Management Investment Banking 2016 House of the Year for Asia ex-Japan2 #1 ranked international Equities broker3 in key markets #1 rank in APAC (ex Japan) in Underwriting & Advisory4 13 locations 7 countries 650 RMs5 Named Best Private Bank in Asia1

Growing billionaire and UHNWI population, with a broad set of financial services needs 2005 x 2.7 2015 APAC1 billionaires (USD 1 bn+) 1 Includes Asia and AustralasiaSource: Knight Frank World Wealth Report, 2016 APAC1 UHNWIs (USD 30 mn+) x 2.4 19,000 45,000 2005 2015 GM SUB APAC IWM SRU IBCM

Our clients value our integrated approach Net new assets in CHF bn AuM in CHF bn Net revenues in CHF mn Underwriting &Advisory WM APAC Underwriting & Advisory rank1 #7 #1 1 Source: Dealogic (APAC ex Japan) as of September 30, 2016. Ranking amongst international banks for the first 9 months of 2015 and 2016 +14% +98% 361 461 Total + GM SUB APAC IWM SRU IBCM

2018 PTI target as communicated at the 2015 Investor Day Adjustedpre-tax income in CHF bn Wealth Management Note: Adjusted results are non-GAAP financial measures. A reconciliation to reported results is included in the Appendix1 Including contributions from wealth management connected activities Of which: CHF 0.7 bn Wealth Management1 GM SUB APAC IWM SRU IBCM
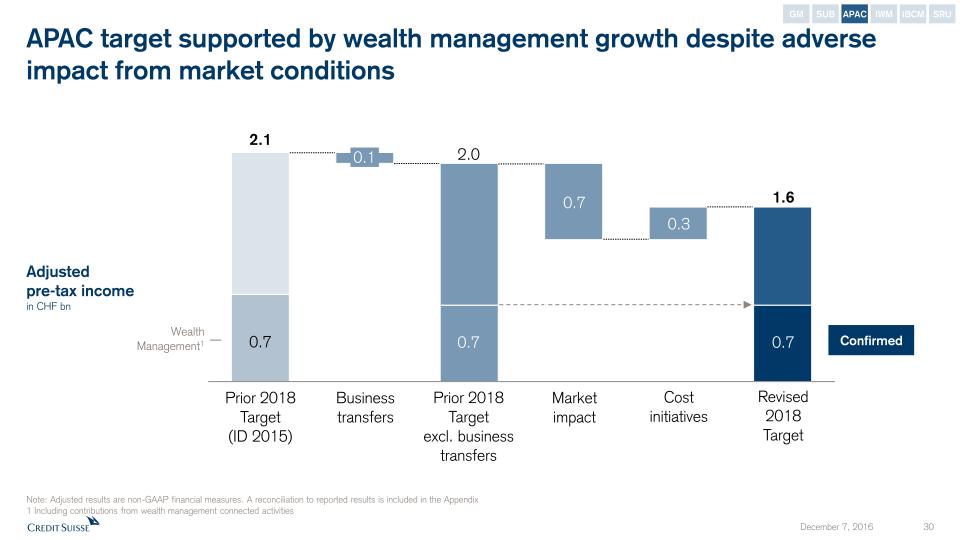
APAC target supported by wealth management growth despite adverse impact from market conditions Note: Adjusted results are non-GAAP financial measures. A reconciliation to reported results is included in the Appendix1 Including contributions from wealth management connected activities Adjustedpre-tax incomein CHF bn Prior 2018 Target excl. business transfers Market impact Revised 2018Target Cost initiatives 2.0 1.6 0.3 0.7 0.7 0.7 Wealth Management1 Business transfers Prior 2018 Target(ID 2015) 2.1 Adjusted Confirmed 0.7 0.1 GM SUB APAC IWM SRU IBCM

APAC – Key takeaways Continued growth in Wealth Management with CHF 17 bn of NNA over past four quarters and record AuM of CHF 169 bn as of end 3Q16Cost savings ambition of CHF 300 mn from efficiencies to operating model expected to be delivered by 20182018 PTI target of CHF 1.6 bn1 reduced for market dependent activities Note: Adjusted results are non-GAAP financial measures. A reconciliation to reported results is included in the Appendix.1 On an adjusted basis GM SUB APAC IWM SRU IBCM
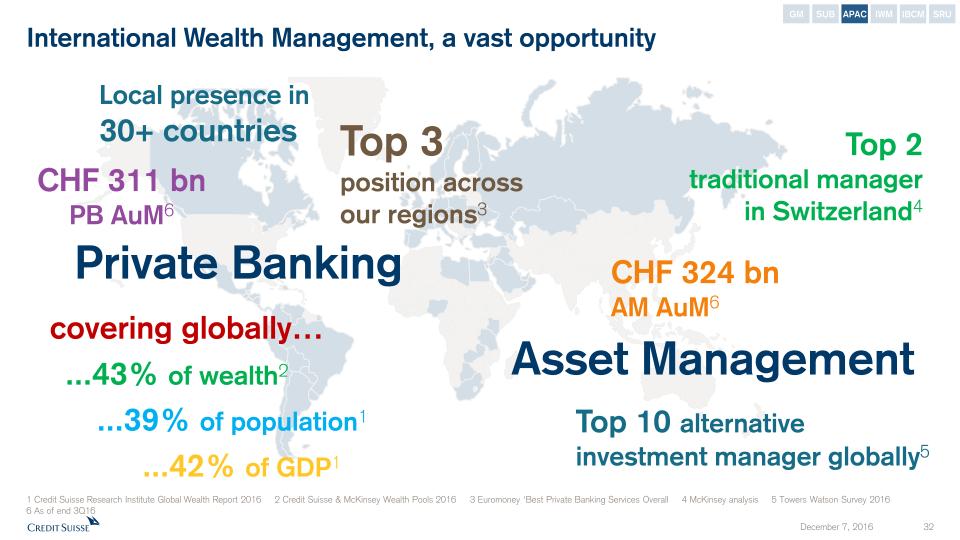
International Wealth Management, a vast opportunity GM SUB APAC IWM SRU IBCM Private Banking Asset Management CHF 324 bn AM AuM6 Top 2traditional managerin Switzerland4 Top 10 alternative investment manager globally5 1 Credit Suisse Research Institute Global Wealth Report 2016 2 Credit Suisse & McKinsey Wealth Pools 2016 3 Euromoney ‘Best Private Banking Services Overall 4 McKinsey analysis 5 Towers Watson Survey 2016 6 As of end 3Q16 CHF 311 bnPB AuM6 covering globally… ...43% of wealth2 ...39% of population1 ...42% of GDP1 Local presence in 30+ countries Top 3position across our regions3
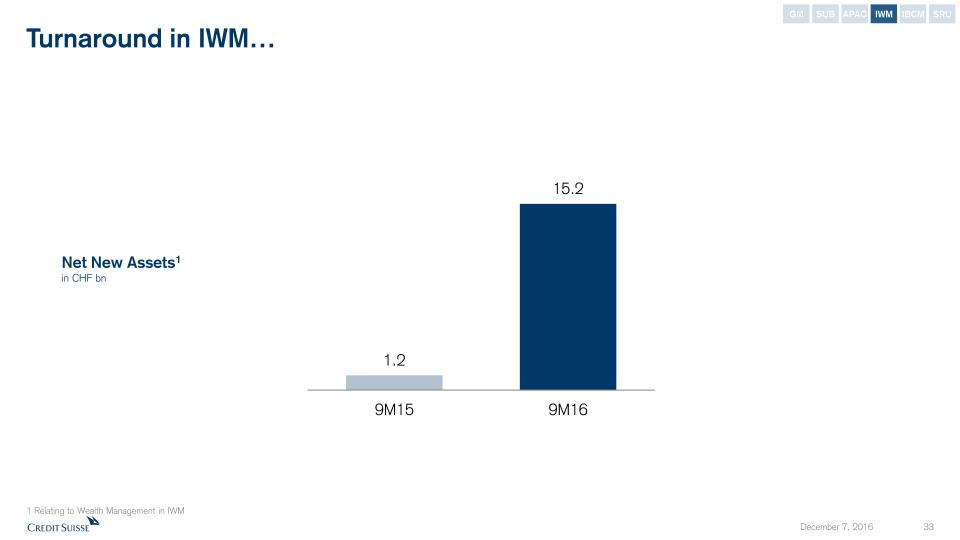
Turnaround in IWM… Net New Assets1in CHF bn 1 Relating to Wealth Management in IWM GM SUB APAC IWM SRU IBCM

…driven by focus on strategic clients, which has led to significant inflows of net new assets… 1 Relating to Wealth Management in IWM2 Strategic clients = targeted strategic UHNWI/entrepreneur clients of IWM Other clients Strategic clients2 NNA Total Net New Assets1 in 9M16 in CHF bn GM SUB APAC IWM SRU IBCM
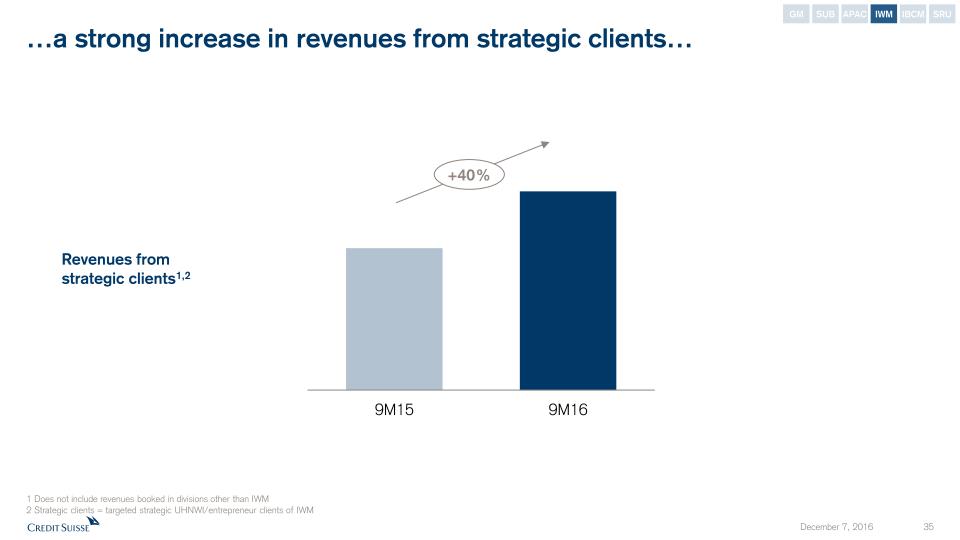
…a strong increase in revenues from strategic clients… +40% Revenues from strategic clients1,2 1 Does not include revenues booked in divisions other than IWM2 Strategic clients = targeted strategic UHNWI/entrepreneur clients of IWM GM SUB APAC IWM SRU IBCM
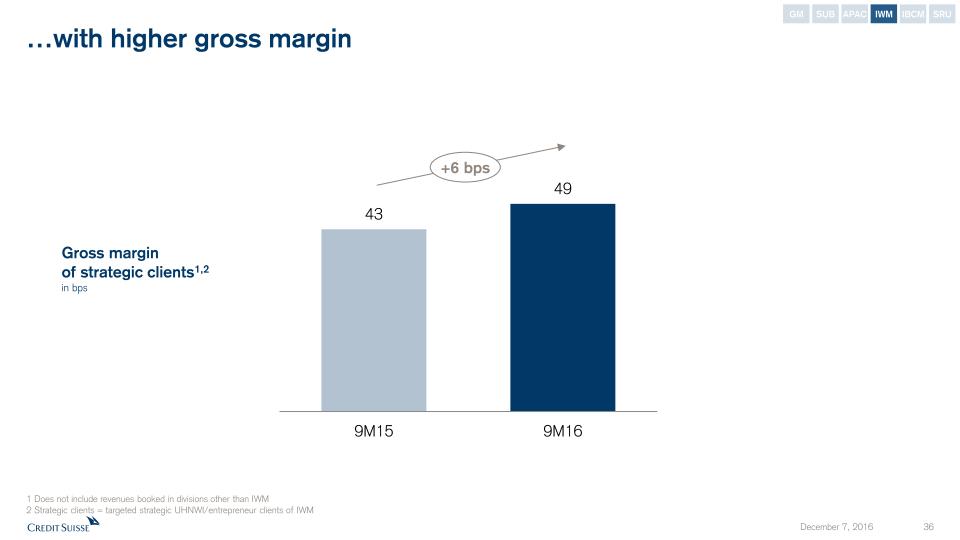
…with higher gross margin 1 Does not include revenues booked in divisions other than IWM2 Strategic clients = targeted strategic UHNWI/entrepreneur clients of IWM +6 bps Gross margin of strategic clients1,2in bps GM SUB APAC IWM SRU IBCM

IWM is lending with discipline 1 Before deducting valuation allowances and deferred fees and costs 2 Includes ship, aviation and export finance 3 9M16, client rate net of reference rate over avg. loan volume Credit volume1 in CHF bn 44 40 Lombard lending Specialty finance2 Mortgages Gross loanrevenue margin3 ~110 bps ~210 bps ~170 bps +11% GM SUB APAC IWM SRU IBCM

IWM is executing with discipline Note: Adjusted results are non-GAAP financial measures. A reconciliation to reported results is included in the Appendix 2.6 2.6 9M15 Costsavings Growth investments 9M16 Stable expenses IWM adjustedoperating expensesin CHF bn GM SUB APAC IWM SRU IBCM

IWM outlook impacted by adverse market environment in near term Note: Adjusted results are non-GAAP financial measures. A reconciliation to reported results is included in the Appendix1 Including additional market related activities Adjustedpre-tax incomein CHF bn Prior 2018 Target(ID 2015) Revised 2018Target 0.4 2.1 1.8 2015 1.0 Asset Management1 0.1 Business transfers GM SUB APAC IWM SRU IBCM
IWM – Key takeaways Integrated approach for strategic clients Strong turnaround in net new assetsDisciplined approach to lending 2018 PTI target of CHF 1.8 bn1, recalibrated for lower performance fees and transaction volumes Note: Adjusted results are non-GAAP financial measures. 1 On an adjusted basis GM SUB APAC IWM SRU IBCM
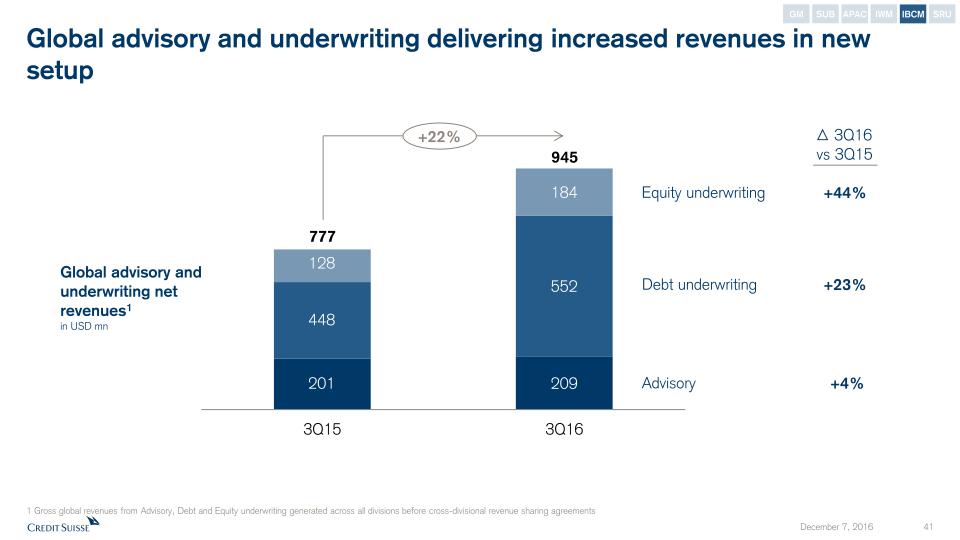
Global advisory and underwriting delivering increased revenues in new setup 1 Gross global revenues from Advisory, Debt and Equity underwriting generated across all divisions before cross-divisional revenue sharing agreements Global advisory and underwriting net revenues1in USD mn Advisory Equity underwriting Debt underwriting 3Q16 vs 3Q15 +4% +44% +23% 448 128 201 +22% GM SUB APAC IWM SRU IBCM
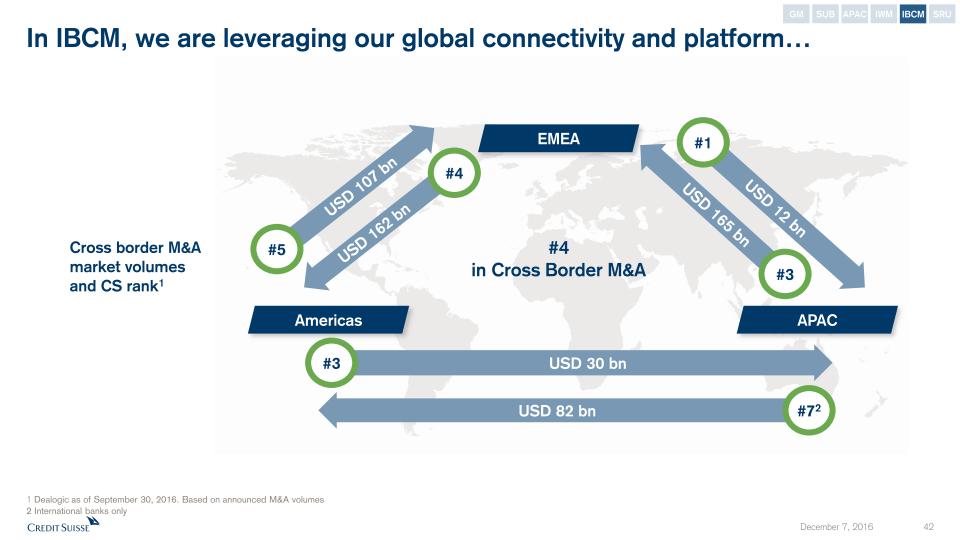
In IBCM, we are leveraging our global connectivity and platform… 1 Dealogic as of September 30, 2016. Based on announced M&A volumes2 International banks only Americas EMEA APAC USD 107 bn USD 162 bn #5 #4 USD 12 bn USD 165 bn #1 #3 USD 30 bn USD 82 bn #3 #72 #4 in Cross Border M&A Cross border M&A market volumes and CS rank1 GM SUB APAC IWM SRU IBCM

CS global M&A announced volume rank Source: Dealogic as of September 30, 2016 Selected recent global transactions Deal value Monsanto USD 66 bn Role: joint lead financial advisor to Bayer, financing Syngenta USD 48 bn Role: financial advisor to ChemChina Spectra Energy USD 47 bn Role: lead financial advisor to Enbridge First Gulf Bank USD 15 bn Role: exclusive financial advisor to National Bank of Abu Dhabi Deals > USD 10 bn EnergyFuture USD 18 bn Role: financial advisor to NextEra …with strong momentum in M&A GM SUB APAC IWM SRU IBCM

IBCM – Key takeaways Key hires across industry and product groups and successes in announced M&A in 2016Global connectivity for our clients15-20% Return on Regulatory Capital† target by end-2018 † See Appendix GM SUB APAC IWM SRU IBCM
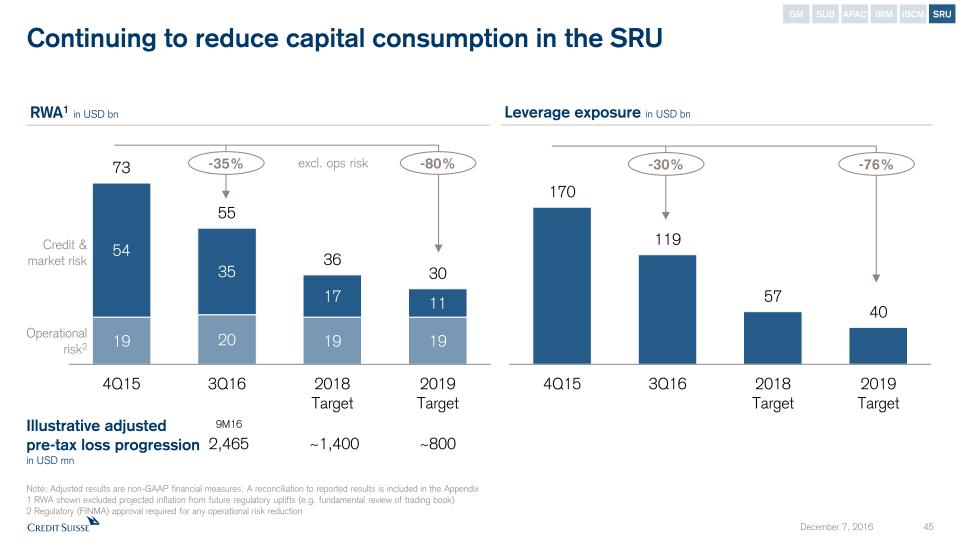
Continuing to reduce capital consumption in the SRU Note: Adjusted results are non-GAAP financial measures. A reconciliation to reported results is included in the Appendix1 RWA shown excluded projected inflation from future regulatory uplifts (e.g. fundamental review of trading book)2 Regulatory (FINMA) approval required for any operational risk reduction -35% RWA1 in USD bn Leverage exposure in USD bn -30% -80% -76% Illustrative adjustedpre-tax loss progression in USD mn 9M16 2,465 ~1,400 ~800 excl. ops risk Operational risk2 Credit & market risk GM SUB APAC IWM SRU IBCM

SRU – Key takeaways Significant reduction of RWA and leverage exposure to dateTargeting reduction of capital consumption by approximately 80% by end 2019Ambition to reduce PTI drag to USD 800 mn1 by end-2019 Note: Adjusted results are non-GAAP financial measures. A reconciliation to reported results is included in the Appendix1 On an adjusted basis GM SUB APAC IWM SRU IBCM

Overview of revised financial targets for Group and divisions APAC Pre-tax income o/w Wealth Management2 IWM Pre-tax income SUB Pre-tax income Global Markets RWA threshold1Leverage exposure threshold1Return on regulatory capital† Note: Adjusted results are non-GAAP financial measures † See Appendix1 As announced on March 23, 2016 (Credit Suisse Strategy Update) 2 Including contributions from wealth management connected activities 2016 USD 60 bnUSD 290 bn > CHF 1.4 bn1< CHF 19.8 bn111-12%1 Group Net cost savingsOperating cost baseCET1 ratio (pre significant litigation expenses)CET1 leverage ratio SRU Pre-tax lossRWALeverage exposure 2019 ~ USD 0.8 bnUSD 30 bnUSD 40 bn 2018 CHF 1.6 bnCHF 0.7 bn CHF 1.8 bn CHF 2.3 bn 10-15% > CHF 4.2 bn< CHF 17.0 bn12-13%> 3.5% 15- 20% Adjusted figures IBCM Return on regulatory capital† ~ USD 1.4 bn > 13% pre-Basel III reform uplift> 11% post-Basel III reform uplift

We have significantly strengthened our capital ratios Basel III “look-through”CET1 capital ratio +180bps
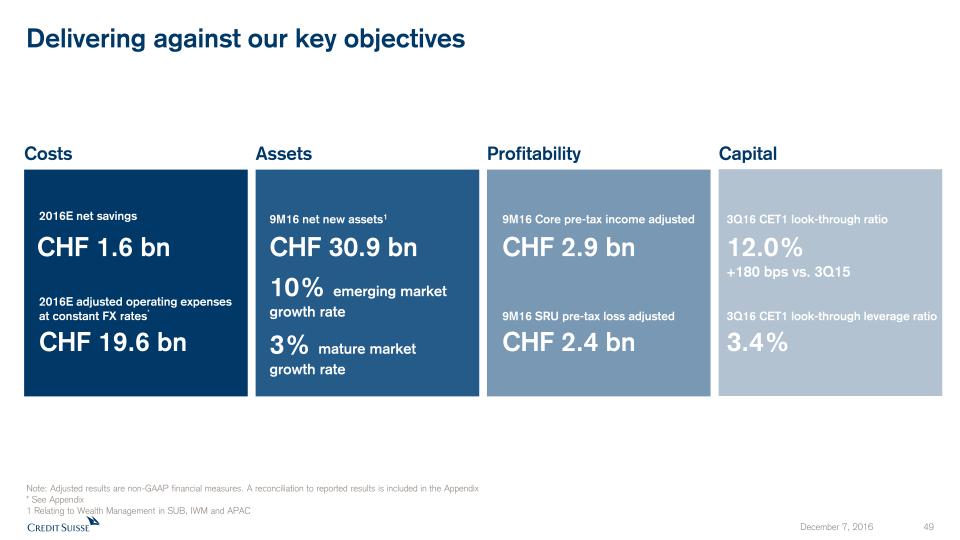
Delivering against our key objectives Costs CHF 19.6 bn 2016E adjusted operating expensesat constant FX rates* 2016E net savings CHF 1.6 bn CHF 2.9 bn 9M16 Core pre-tax income adjusted Profitability CHF 2.4 bn 9M16 SRU pre-tax loss adjusted Note: Adjusted results are non-GAAP financial measures. A reconciliation to reported results is included in the Appendix* See Appendix1 Relating to Wealth Management in SUB, IWM and APAC 3Q16 CET1 look-through ratio 12.0%+180 bps vs. 3Q15 Capital 3.4% 3Q16 CET1 look-through leverage ratio Assets 9M16 net new assets1 CHF 30.9 bn10% emerging market growth rate3% mature market growth rate

Focused on execution Delivered cost savings in excess of our 2016 target, creating additional operating leverageAchieved strong growth in AuM, with NNA of CHF 30.9 bn at 9M16Strengthened our capital position with look-through CET1 ratio of 12.0% as of end 3Q16Given unsupportive market conditions, focusing priorities on cost reduction measures and adjusting our 2018 targets to the more challenging revenue environmentProtecting returns during volatile markets and providing significant upside when conditions improve
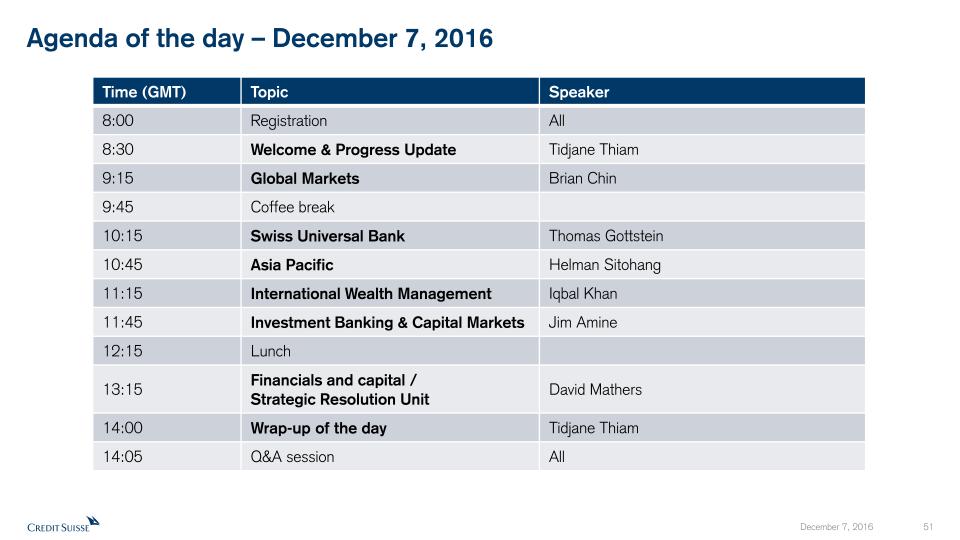
Agenda of the day – December 7, 2016 Time (GMT) Topic Speaker 8:00 Registration All 8:30 Welcome & Progress Update Tidjane Thiam 9:15 Global Markets Brian Chin 9:45 Coffee break 10:15 Swiss Universal Bank Thomas Gottstein 10:45 Asia Pacific Helman Sitohang 11:15 International Wealth Management Iqbal Khan 11:45 Investment Banking & Capital Markets Jim Amine 12:15 Lunch 13:15 Financials and capital / Strategic Resolution Unit David Mathers 14:00 Wrap-up of the day Tidjane Thiam 14:05 Q&A session All
Appendix

Notes Throughout the presentation rounding differences may occur.All risk-weighted assets (RWA) and leverage exposure figures shown in this presentation are as of the end of the respective period and on a “look-through” basis.Gross and net margins are shown in basis points (bps). Gross margin = adj. net revenues annualized / average AuM; net margin = adj. pre-tax income annualized / average AuM.Mandates penetration reflects advisory and discretionary mandates as percentage of total AuM, excluding AuM from the external asset manager (EAM) business. General notes * “Adjusted operating expenses at constant FX rates” include adjustments as made in all our disclosures for restructuring expenses, major litigation expenses and a goodwill impairment taken in 4Q15 as well as adjustments for FX, applying the following main currency exchange rates for 1Q15: USD/CHF 0.9465, EUR/CHF 1.0482, GBP/CHF 1.4296, 2Q15: USD/CHF 0.9383, EUR/CHF 1.0418, GBP/CHF 1.4497, 3Q15: USD/CHF 0.9684, EUR/CHF 1.0787, GBP/CHF 1.4891, 4Q15: USD/CHF 1.0000, EUR/CHF 1.0851, GBP/CHF 1.5123, 1Q16: USD/CHF 0.9928, EUR/CHF 1.0941, GBP/CHF 1.4060, 2Q16: USD/CHF 0.9756, EUR/CHF 1.0956, GBP/CHF 1.3845, 3Q16: USD/CHF 0.9728, EUR/CHF 1.0882, GBP/CHF 1.2764. These currency exchange rates are unweighted, i.e. a straight line average of monthly rates. We apply this calculation consistently for the periods under review.† Regulatory capital reflects the worst of 10% of RWA and 3.5% of leverage exposure. Return on regulatory capital is based on (adjusted) returns after tax assuming a tax rate of 30% for all periods and capital allocated based on the worst of 10% of average RWA and 3.5% of average leverage exposure. For Global Markets and Investment Banking & Capital Markets, return on regulatory capital is based on US dollar denominated numbers. Specific notes Abbreviations Adj. = Adjusted; AT1 = Additional Tier 1; AM = Asset Management; ann. = annualized; APAC = Asia Pacific; AuM = Assets under Management; BCBS = Basel Committee on Banking Supervision; BIS = Bank for International Settlements; bps = basis points; BRRD = Bank Recovery and Resolution Directive; CAO = Capital Adequacy Ordinance; CET1 = Common Equity Tier 1; Corp. Ctr. = Corporate Center; C&IB = Corporate & Institutional Banking; CRO = Chief Risk Officer; CCRO = Compliance and Regulatory Affairs; CVA = Credit Valuation Adjustment; ECM = Equity Capital Markets; EM = Emerging Markets; EMEA=Europe, Middle East & Africa; FINMA = Swiss Financial Market Supervisory Authority; FRTB = Fundamental review of the trading book; FSB = Financial Stability Board; FTE = Full time equivalents; FVoD = Fair Value of Own Debt; FX = Foreign Exchange; GM = Global Markets; GMAR = Global Markets Accelerated Restructuring; HoldCo = Holding Company; HQ = Headquarters; HQLA = High Quality Liquid Assets; IB = Investment Banking; IBCM = Investment Banking & Capital Markets; ID = Investor Day; IHC = Intermediate Holding Company; IOSCO = The International Organization of Securities Commissions; IPO = Initial Public Offer; IRB = Internal Ratings-Based; IWM = International Wealth Management; KPI = Key Performance Indicator; LATAM =Latin America; LCR = Liquidity Coverage ratio; M&A = Mergers & Acquisitions; NCWOL = No Creditor Worse Off than in Liquidation; NNA = Net new assets; NSFR = Net Stable Funding Ratio; OpCo = Operating Company; OpRisk = Operational Risk PB = Private Banking; PB&WM = (Former) Private Banking & Wealth Management (division) pp. = percentage points; PTI = Pre-tax income; PONV = Point of Non-Viability; QoQ = Quarter-on-quarter; RM(s) = Relationship Manager(s); RoRC = Return on regulatory capital; RWA = Risk Weighted Assets; SA-CCR = Standardized Approach - Counterparty Credit Risk; SME = Small and Medium Enterprises; SMG = Systematic Market-Making Group; SoW = Share of Wallet; SRU = Strategic Resolution Unit; STS = Sales and Trading Services; SUB = Swiss Universal Bank; T1= Tier 1 capital; TBTF = Too Big to Fail; TLAC = Total loss absorbing capacity; (U)HNW(I) = (Ultra) High Net Worth (Individuals); WM = Wealth Management; YoY = Year-on-Year; YTD = Year To Date

Reconciliation of adjustment items (1/2) CS Group in CHF mn SRU in USD mn Corp. Ctr. in CHF mn 3Q16 2Q16 1Q16 4Q15 3Q15 2Q15 1Q15 3Q16 2Q16 1Q16 4Q15 3Q15 2Q15 1Q15 3Q16 2Q16 1Q16 4Q15 3Q15 2Q15 1Q15 Net revenues reported 5,396 5,108 4,638 4,210 5,985 6,955 6,647 (170) (371) (545) (126) (90) 437 335 72 (95) 110 (748) 752 384 173 Fair value on own debt - - - 697 (623) (228) (144) - - - - - - - - - - 697 (623) (228) (144) Real estate gains - - - (72) - (23) - - - - - - - - - - - - - - - (Gains)/losses on business sales (346) - 56 (34) - - - - - 4 - - - - - - 52 - - - - Net revenues adjusted 5,050 5,108 4,694 4,801 5,362 6,704 6,503 (170) (371) (541) (126) (90) 437 335 72 (95) 162 (51) 129 156 29 Provision for credit losses 55 (28) 150 133 110 51 30 6 (38) 119 99 21 13 5 - (2) 1 (2) 1 - - Total operating expenses reported 5,119 4,937 4,972 10,518 5,023 5,248 5,106 698 445 601 1,103 688 690 651 279 142 76 307 211 121 223 Goodwill impairment - - - (3,797) - - - - - - - - - - - - - - - - - Restructuring expenses (145) (91) (255) (355) - - - (23) (21) (80) (158) - - - - - - - - - - Major litigation provisions (306) - - (564) (203) (63) 10 (324) - - (257) (27) (9) - - - - - - - - Total operating expenses adjusted 4,668 4,846 4,717 5,802 4,820 5,185 5,116 351 424 521 688 661 680 651 279 142 76 307 211 121 223 Pre-tax income/(loss) reported 222 199 (484) (6,441) 852 1,656 1,511 (874) (778) (1,266) (1,328) (799) (266) (320) (207) (235) 33 (1,053) 540 263 (50) Total adjustments 105 91 311 5,307 (420) (188) (154) 347 21 84 415 27 9 - - - 52 697 (623) (228) (144) Pre-tax income/(loss) adjusted 327 290 (173) (1,134) 432 1,468 1,357 (527) (757) (1,181) (913) (772) (256) (320) (207) (235) 85 (356) (83) 35 (194) IWM AM in CHF mn GM in USD mn IBCM in USD mn 3Q16 2Q16 1Q16 4Q15 3Q15 2Q15 1Q15 3Q16 2Q16 1Q16 4Q15 3Q15 2Q15 1Q15 3Q16 2Q16 1Q16 4Q15 3Q15 2Q15 1Q15 Net revenues reported 292 334 320 365 308 335 320 1,396 1,671 1,252 1,168 1,632 2,052 2,272 479 558 395 418 414 605 420 Fair value on own debt - - - - - - - - - - - - - - - - - - - - - Real estate gains - - - - - - - - - - - - - - - - - - - - - (Gains)/losses on business sales - - - - - - - - - - - - - - - - - - - - - Net revenues adjusted 292 334 320 365 308 335 320 1,396 1,671 1,252 1,168 1,632 2,052 2,272 479 558 395 418 414 605 420 Provision for credit losses - - - - - - - (6) (17) 22 (5) 15 (4) 4 (9) - 30 - - - - Total operating expenses reported 243 273 253 330 267 275 274 1,310 1,532 1,430 4,517 1,346 1,641 1,498 450 417 425 902 346 451 471 Goodwill impairment - - - - - - - - - - (2,690) - - - - - - (384) - - - Restructuring expenses (2) (2) 2 (4) - - - (52) (52) (102) (97) - - - (16) 9 (28) (22) - - - Major litigation provisions - - - - - - - (7) - - (51) (132) (57) - - - - - - - - Total operating expenses adjusted 241 271 255 326 267 275 274 1,251 1,480 1,328 1,679 1,214 1,584 1,498 434 426 397 496 346 451 471 Pre-tax income/(loss) reported 49 61 67 35 41 60 46 92 156 (200) (3,345) 271 415 770 39 141 (60) (484) 68 154 (51) Total adjustments 2 2 (2) 4 - - - 59 52 102 2,838 132 57 - 16 (9) 28 406 - - - Pre-tax income/(loss) adjusted 51 63 65 39 41 60 46 150 208 (98) (507) 403 473 770 55 132 (32) (78) 68 154 (51) Adjusted results are non-GAAP financial measures that exclude goodwill impairment and certain other revenues and expenses included in our reported results. Management believes that adjusted results provide a useful presentation of our operating results for purposes of assessing our Group and divisional performance consistently over time, on a basis that excludes items that management does not consider representative of our underlying performance. Provided below is a reconciliation of our adjusted results to the most directly comparable US GAAP measures.

SUB PB in CHF mn IWM PB in CHF mn APAC PB in CHF mn 3Q16 2Q16 1Q16 4Q15 3Q15 2Q15 1Q15 3Q16 2Q16 1Q16 4Q15 3Q15 2Q15 1Q15 3Q16 2Q16 1Q16 4Q15 3Q15 2Q15 1Q15 Net revenues reported 1,160 840 846 963 857 956 920 789 811 853 808 785 830 801 346 337 319 271 303 307 297 Fair value on own debt - - - - - - - - - - - - - - - - - - - - - Real estate gains (346) - - (72) - (23) - - - - - - - - - - - - - - - (Gains)/losses on business sales - - - (10) - - - - - - (11) - - - - - - - - - - Net revenues adjusted 814 840 846 881 857 933 920 789 811 853 797 785 830 801 346 337 319 271 303 307 297 Provision for credit losses 13 7 9 14 14 9 12 - 16 (2) (7) 11 (1) 2 38 2 (17) (5) 24 - (1) Total operating expenses reported 603 582 632 784 639 690 659 593 611 622 874 618 619 567 242 245 216 228 210 188 190 Goodwill impairment - - - - - - - - - - - - - - - - - - - - - Restructuring expenses (16) (3) (35) (33) - - - (13) (13) (10) (32) - - - (3) - - (1) - - - Major litigation provisions - - - (25) - - - 19 - - (228) (50) - 10 - - - (6) - - - Total operating expenses adjusted 587 579 597 726 639 690 659 599 598 612 614 568 619 577 239 245 216 221 210 188 190 Pre-tax income/(loss) reported 544 251 205 165 204 257 249 196 184 233 (59) 156 212 232 66 90 120 48 69 119 108 Total adjustments (330) 3 35 (24) - (23) - (6) 13 10 249 50 - (10) 3 - - 7 - - - Pre-tax income/(loss) adjusted 214 254 240 141 204 234 249 190 197 243 190 206 212 222 69 90 120 55 69 119 108 SUB C&IB in CHF mn APAC IB in CHF mn APAC IB in USD mn 3Q16 2Q16 1Q16 4Q15 3Q15 2Q15 1Q15 3Q16 2Q16 1Q16 4Q15 3Q15 2Q15 1Q15 3Q16 2Q16 1Q16 4Q15 3Q15 2Q15 1Q15 Net revenues reported 507 497 510 532 507 506 480 571 574 588 555 582 733 791 587 590 595 554 603 783 835 Fair value on own debt - - - - - - - - - - - - - - - - - - - - - Real estate gains - - - - - - - - - - - - - - - - - - - - - (Gains)/losses on business sales - - - (13) - - - - - - - - - - - - - - - - - Net revenues adjusted 507 497 510 519 507 506 480 571 574 588 555 582 733 791 587 590 595 554 603 783 835 Provision for credit losses 17 2 (3) 29 25 24 11 (4) 1 (5) 8 - 11 (2) (4) 1 (5) 8 - 12 (3) Total operating expenses reported 276 293 286 304 286 271 275 489 457 449 1,212 489 474 436 503 468 452 1,221 505 505 460 Goodwill impairment - - - - - - - - - - (756) - - - - - - (765) - - - Restructuring expenses (3) (1) (5) (9) - - - (20) (10) (1) (2) - - - (21) (10) (1) (2) - - - Major litigation provisions - - - - - - - - - - - - - - - - - - - - - Total operating expenses adjusted 273 292 281 295 286 271 275 469 447 448 454 489 474 436 482 458 451 454 505 505 460 Pre-tax income/(loss) reported 214 202 227 199 196 211 194 86 116 144 (665) 93 248 357 88 121 148 (675) 98 266 378 Total adjustments 3 1 5 (4) - - - 20 10 1 758 - - - 21 10 1 767 - - - Pre-tax income/(loss) adjusted 217 203 232 195 196 211 194 106 126 145 93 93 248 357 109 131 149 92 98 266 378 Reconciliation of adjustment items (2/2)

Swisscard deconsolidation impactImpact of the deconsolidation on the Swiss Universal Bank Note: Adjusted results are non-GAAP financial measures. A reference to the reconciliation to reported results for other adjustments not relating to Swisscard is included in the Notes of this presentation † See AppendixThis is an illustrative pro-forma presentation of the impact of the deconsolidation of the card issuing business on the historical results of SUB as if it had occurred on December 31, 2014. Given that as of July 1, 2015 the business has been deconsolidated and transferred to the equity method investment, Swisscard AECS GmbH and the transaction does not qualify for discontinued operations, the historical results are not restated in this respect. The reduction in pre-tax income in the Private Banking business of Swiss Universal Bank is offset by the reduction in minority interest from the deconsolidation at the Group level, therefore there is no material impact on the Group’s net income attributable to shareholders. These illustrative figures cannot be seen as being indicative of future trends or results 1 Pro-forma impact of the card issuing business deconsolidation in CHF mn 1Q15 2Q15 3Q15 9M15 1Q15 2Q15 3Q15 9M15 1Q15 2Q15 3Q15 9M15 Net interest income 611 685 708 2,004 9 9 - 18 602 676 708 1,986 Recurring commissions & fees 412 412 372 1,196 56 59 - 115 356 353 372 1,081 Transaction-based revenues 382 349 295 1,026 8 7 - 15 374 342 295 1,011 Other revenues (5) (7) (11) (23) - - - - (5) (7) (11) (23) Net revenues 1,400 1,439 1,364 4,203 73 75 - 148 1,327 1,364 1,364 4,055 Provision for credit losses 23 33 39 95 - - - - 23 33 39 95 Total operating expenses 934 961 925 2,820 61 62 - 123 873 899 925 2,697 Pre-tax income 443 445 400 1,288 12 13 - 25 431 432 400 1,263 Return on regulatory capital† 14% 14% 13% 14% - - - - 14% 14% 13% 14% SUB adjusted Swisscard Impact1 SUB adjusted ex Swisscard

Credit Suisse Investor Day 2016Overview of Financials and CapitalDavid Mathers December 7, 2016

Disclaimer (1/2) The data presented in this presentation relating to the Swiss Universal Bank refers to the division of Credit Suisse Group as the same is currently managed within Credit Suisse Group. The scope, revenues and expenses of the Swiss Universal Bank vary from the planned scope of Credit Suisse (Schweiz) AG and its subsidiaries, planned to be subject to a partial IPO, market conditions permitting. Any such IPO would involve the sale of a minority stake and would be subject to, among other things, all necessary approvals.It is therefore not possible to make a like-for-like comparison of the Swiss Universal Bank as a division of Credit Suisse Group on the one hand and Credit Suisse (Schweiz) AG as a potential IPO vehicle on the other hand.Cautionary statement regarding forward-looking statements This presentation contains forward-looking statements that involve inherent risks and uncertainties, and we might not be able to achieve the predictions, forecasts, projections and other outcomes we describe or imply in forward-looking statements. A number of important factors could cause results to differ materially from the plans, objectives, expectations, estimates and intentions we express in these forward-looking statements, including those we identify in "Risk Factors” in our Annual Report on Form 20-F for the fiscal year ended December 31, 2015 and in “Cautionary statement regarding forward-looking information" in our media release relating to Investor Day, published on December 7, 2016 and filed with the US Securities and Exchange Commission, and in other public filings and press releases. We do not intend to update these forward-looking statements except as may be required by applicable law. In particular, the terms “Illustrative”, “Ambition”, “Outlook” and “Goal” are not intended to be viewed as targets or projections, nor are they considered to be Key Performance Indicators. All such illustrations, ambitions and goals are subject to a large number of inherent risks, assumptions and uncertainties, many of which are completely outside of our control. Accordingly, this information should not be relied on for any purpose. We do not intend to update these illustrations, ambitions or goals.We may not achieve the benefits of our strategic initiativesWe may not achieve all of the expected benefits of our strategic initiatives. Factors beyond our control, including but not limited to the market and economic conditions, changes in laws, rules or regulations and other challenges discussed in our public filings, could limit our ability to achieve some or all of the expected benefits of these initiatives. Estimates and assumptionsIn preparing this presentation, management has made estimates and assumptions that affect the numbers presented. Actual results may differ. Figures throughout presentation may also be subject to rounding adjustments. Cautionary Statements Relating to Interim Financial InformationThis presentation contains certain unaudited interim financial information as of or for periods after September 30, 2016, the date of our last published quarterly financial statements. This information has been derived from management accounts, is preliminary in nature, does not reflect the complete results of the fourth quarter of 2016 and is subject to change, including as a result of any normal quarterly adjustments in relation to the financial statements for the fourth quarter of 2016. This information has not been subject to any review by our independent registered public accounting firm. There can be no assurance that the final results for these periods will not differ from these preliminary results, and any such differences could be material. Quarterly financial results for the fourth quarter of 2016 will be included in our 4Q16 Earnings Release, and audited consolidated financial statements for full-year 2016 will be included in our Annual Report on Form 20-F for the year ended December 31, 2016, when they are published. These interim results of operations are not necessarily indicative of the results to be achieved for the remainder of the fourth quarter or the full year 2016.

Disclaimer (2/2) Statement regarding non-GAAP financial measures This presentation also contains non-GAAP financial measures, including adjusted results. Information needed to reconcile such non-GAAP financial measures to the most directly comparable measures under US GAAP or a reference thereto can be found in this presentation in the Appendix, which is available on our website at credit-suisse.com.Statement regarding capital, liquidity and leverage As of January 1, 2013, Basel 3 was implemented in Switzerland along with the Swiss “Too Big to Fail” legislation and regulations thereunder (in each case, subject to certain phase-in periods). As of January 1, 2015, the Bank for International Settlements (BIS) leverage ratio framework, as issued by the Basel Committee on Banking Supervision (BCBS), was implemented in Switzerland by FINMA. Our related disclosures are in accordance with our interpretation of such requirements, including relevant assumptions. Changes in the interpretation of these requirements in Switzerland or in any of our assumptions or estimates could result in different numbers from those shown in this presentation. Capital and ratio numbers for periods prior to 2013 are based on estimates, which are calculated as if the Basel 3 framework had been in place in Switzerland during such periods. Unless otherwise noted, leverage exposure is based on the BIS leverage ratio framework and consists of period-end balance sheet assets and prescribed regulatory adjustments. Leverage amounts for 4Q14, which are presented in order to show meaningful comparative information, are based on estimates which are calculated as if the BIS leverage ratio framework had been implemented in Switzerland at such time. Beginning in 2015, the Swiss leverage ratio is calculated as Swiss total capital, divided by period-end leverage exposure. The look-through BIS tier 1 leverage ratio and CET1 leverage ratio are calculated as look-through BIS tier 1 capital and CET1 capital, respectively, divided by end-period leverage exposure. Selling restrictions This document, and the information contained herein, is not an offer to sell or a solicitation of offers to purchase or subscribe for securities of Credit Suisse Group AG or Credit Suisse (Schweiz) AG in Switzerland, the United States or any other jurisdiction. This document is not a prospectus within the meaning of article 652a of the Swiss Code of Obligations, nor is it a listing prospectus as defined in the listing rules of the SIX Swiss Exchange AG or any other exchange or regulated trading facility in Switzerland or a prospectus or offering document under any other applicable laws. Copies of this document may not be sent to jurisdictions, or distributed in or sent from jurisdictions, in which such documents are barred or prohibited by law. A decision to invest in securities of Credit Suisse Group AG or Credit Suisse (Schweiz) AG should be based exclusively on a written agreement with Credit Suisse Group AG or an offering and listing prospectus to be published by Credit Suisse Group AG or Credit Suisse (Schweiz) AG for such purpose. Any offer and sale of securities of Credit Suisse (Schweiz) AG will not be registered under the U.S. Securities Act of 1933, as amended, and may not be offered in the United States of America absent such registration or an exemption from registration. There will be no public offering of such securities in the United States of America.
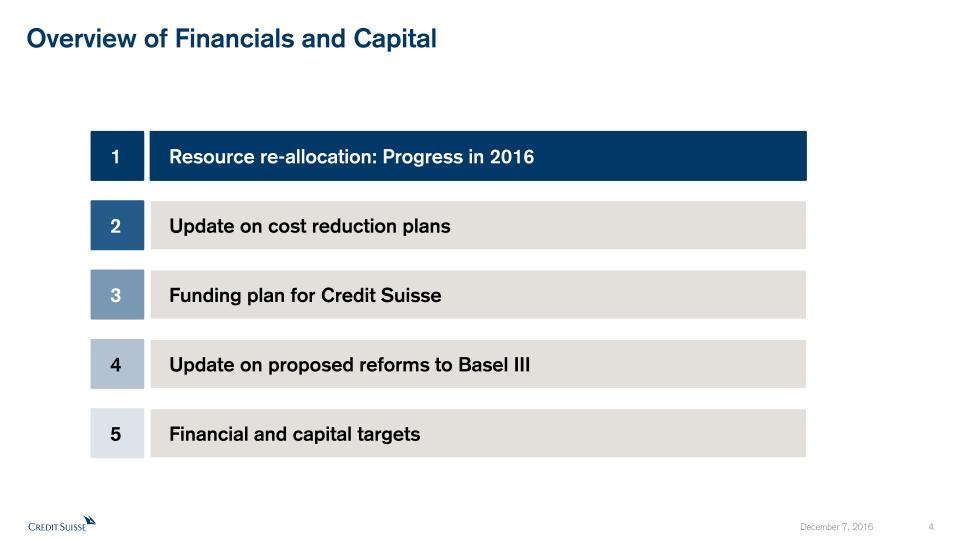
Overview of Financials and Capital Resource re-allocation: Progress in 2016 1 Update on cost reduction plans 2 Funding plan for Credit Suisse 3 Update on proposed reforms to Basel III 4 Financial and capital targets 5

On track to reduce expenses to below CHF 19.8 bn target, with CHF 1.6 bn net savings expected by end-2016 Summary of progress Cost reduction Funding Basel III reforms Targets 2015 21.2 19.8 Adjusted operating expenses at constant FX rates* in CHF bn Net savings in CHF bn 2016Target Note: Adjusted results are non-GAAP financial measures. A reconciliation to reported results is included in the Appendix1 Headcount includes permanent full-time equivalent employees, contractors, consultants and other contingent workers; Achieved as of December 4, 2016 includes departed and notified headcount * See Appendix 1.6 2016estimated (1.6) 2016 estimated 19.6 1.6 net savings Net headcount1 reductions of 6,050 as of December 4, exceeding target net reduction for full year 2016

Adjusted operatingexpenses at constantFX rates* in CHF bn Note: Adjusted results are non-GAAP financial measures. A reconciliation to reported results is included in the Appendix * See Appendix Summary of progress Cost reduction Funding Targets 2015 Gross savings Investments in growth 2016 estimated 21.2 (2.1) 19.6 Strengthening of controls 0.3 0.2 2016 target of CHF 19.8 bn Basel III reforms Expect to achieve CHF 2.1 bn of gross savings in 2016, while reinvesting in growth businesses that aims at achieving attractive returns
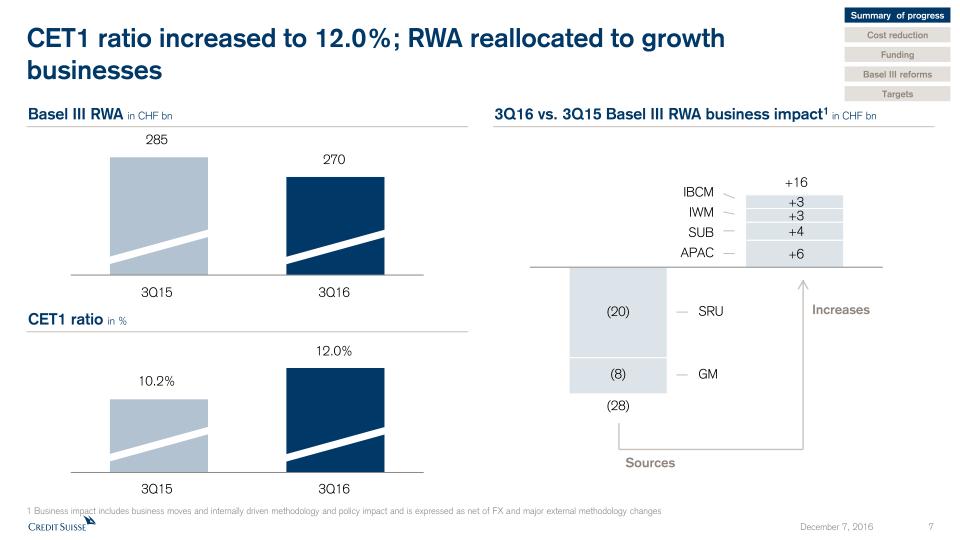
CET1 ratio increased to 12.0%; RWA reallocated to growth businesses 285 270 10.2% 12.0% 1 Business impact includes business moves and internally driven methodology and policy impact and is expressed as net of FX and major external methodology changes SRU GM IBCM IWM SUB APAC (8) (20) +3 +3 +4 +6 (28) +16 3Q15 3Q16 3Q15 3Q16 3Q16 vs. 3Q15 Basel III RWA business impact1 in CHF bn Basel III RWA in CHF bn CET1 ratio in % Summary of progress Cost reduction Funding Targets Sources Increases Basel III reforms
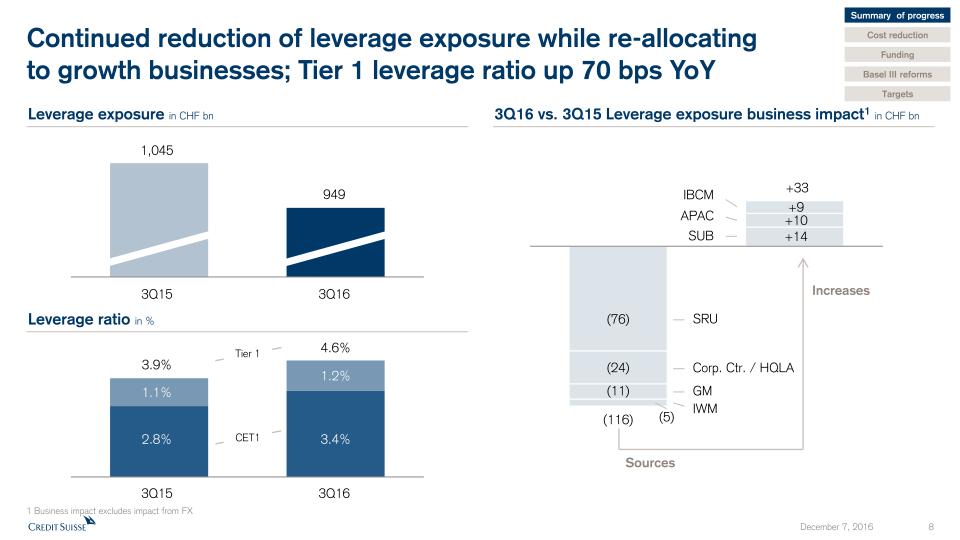
Continued reduction of leverage exposure while re-allocating to growth businesses; Tier 1 leverage ratio up 70 bps YoY 3Q15 3Q16 1,045 949 3.9% 4.6% 1 Business impact excludes impact from FX Sources SRU Corp. Ctr. / HQLA IBCM APAC SUB (24) (76) +9 +14 GM (11) +10 +33 (116) Increases IWM (5) 1.1% 2.8% 1.2% 3.4% 3Q15 3Q16 3Q16 vs. 3Q15 Leverage exposure business impact1 in CHF bn Leverage exposure in CHF bn Leverage ratio in % Summary of progress Cost reduction Funding Targets Tier 1 CET1 Basel III reforms

Overview of Financials and Capital Resource re-allocation: Progress in 2016 1 Update on cost reduction plans 2 Funding plan for Credit Suisse 3 Update on proposed reforms to Basel III 4 Financial and capital targets 5 Summary of progress Cost reduction Funding Targets Basel III reforms
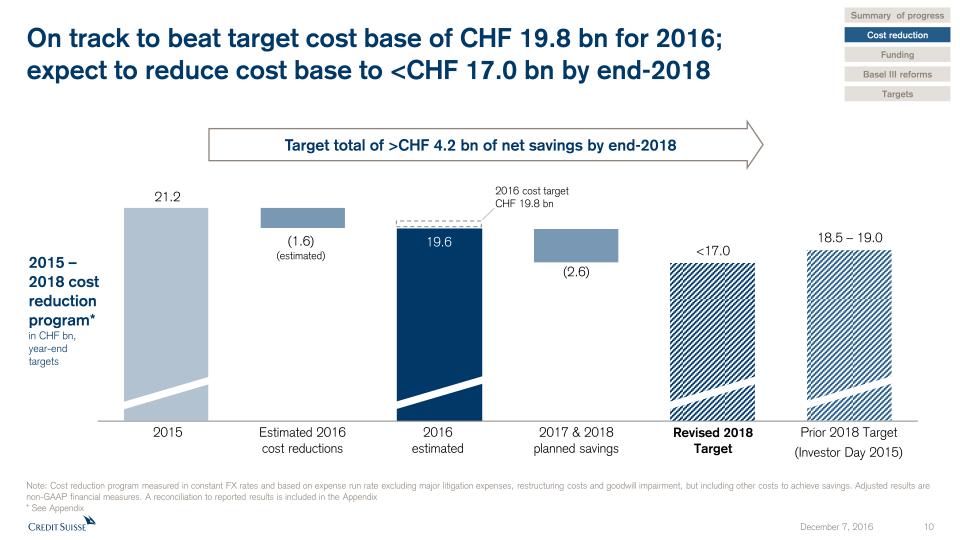
Summary of progress Cost reduction Funding Targets Basel III reforms Target total of >CHF 4.2 bn of net savings by end-2018 2015 2016estimated Estimated 2016 cost reductions 2015 – 2018 cost reduction program* in CHF bn, year-end targets 2017 & 2018planned savings Prior 2018 Target(Investor Day 2015) On track to beat target cost base of CHF 19.8 bn for 2016;expect to reduce cost base to <CHF 17.0 bn by end-2018 Revised 2018Target Note: Cost reduction program measured in constant FX rates and based on expense run rate excluding major litigation expenses, restructuring costs and goodwill impairment, but including other costs to achieve savings. Adjusted results are non-GAAP financial measures. A reconciliation to reported results is included in the Appendix* See Appendix 21.2 18.5 – 19.0 <17.0 (2.6) 2016 cost target CHF 19.8 bn

Restructuring costs progression in CHF bn Update on restructuring charges Summary of progress Cost reduction Funding Targets 0.6 0.6 0.3 2016E 2017E 2018E 2015 0.4 Severance Real Estate Other Restructuring Costs Estimated costs through 2018: CHF 1.9 bn Basel III reforms

Overview of Financials and Capital Resource re-allocation: Progress in 2016 1 Update on cost reduction plans 2 Funding plan for Credit Suisse 3 Update on proposed reforms to Basel III 4 Financial and capital targets 5

Summary of progress Cost reduction Funding Targets Basel III reforms Reduced capital instrument costs expected to offset increased HoldCo funding costs Estimated funding costs1 – capital instruments in USD bn 2.8 2.8 2.7 2.2 Estimated funding costs1 – other sources of funding in USD bn Total funding cost1 in USD bn 1.4 1.5 1.5 1.6 1 Cost represents a spread to the 3-month reference rate
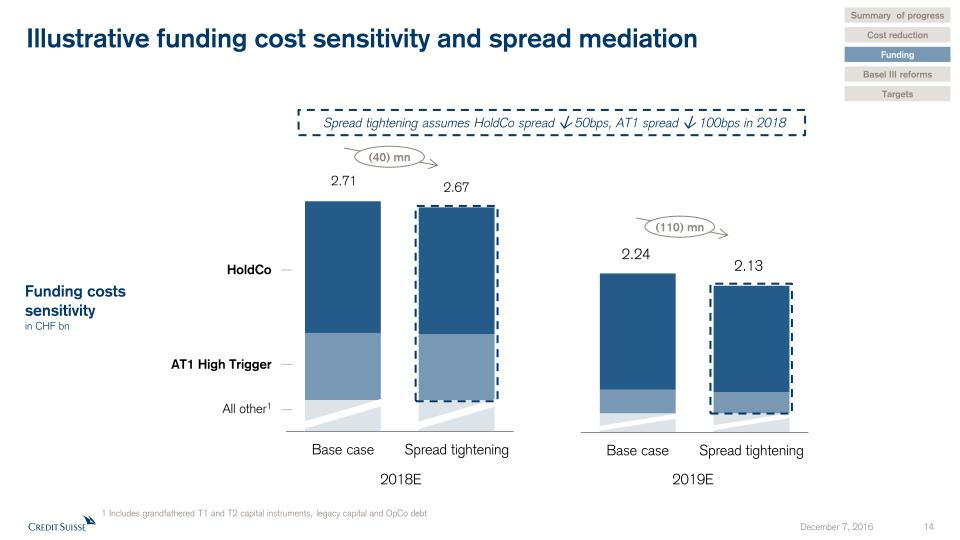
Illustrative funding cost sensitivity and spread mediation Summary of progress Cost reduction Funding Targets Basel III reforms Funding costs sensitivity in CHF bn 2019E 2.71 2.67 HoldCo All other1 2018E 2.24 2.13 Spread tightening assumes HoldCo spread 50bps, AT1 spread 100bps in 2018 (40) mn (110) mn AT1 High Trigger 1 Includes grandfathered T1 and T2 capital instruments, legacy capital and OpCo debt

Overview of Financials and Capital Resource re-allocation: Progress in 2016 1 Update on cost reduction plans 2 Funding plan for Credit Suisse 3 Update on proposed reforms to Basel III 4 Financial and capital targets 5

Recalibrated leverage ratio likely to be primary capital constraint until beginning 2020, however… 1 The binding constraint is calculated as the worse of 10% of RWA and 3.5% of leverage exposure due to the TBTF requirement of 10% CET 1 ratio and 3.5% CET 1 leverage ratio requirement2 Does not include the effects of the countercyclical buffers and any rebates for resolvability and for certain tier 2 low-trigger instruments recognized in gone concern capital …RWA uplift resulting from Basel III reforms will drive the binding constraint1 from the start of 2020 … 2018 Standardized Approach to Counterparty Credit Risk, Banking Book Securitizations and Equity Investment in Funds rules effective from January 1, 2018 Impact of revised Market Risk rules expected to be effective by December 31, 2019. Will affect primarily market risk assets in divisions with trading activity 2019 2020 Revised Swiss TBTF rules will be phased-in and become fully effective January 1, 2020 2016 Group of Governors and Heads of Supervision (GHOS) of BCBS is due to meet in January 2017 where final rules for revisions to standard rules for floors, credit risk and operational risk are expected. Significant recalibration to draft rules expected Revised Swiss TBTF rules require going concern leverage ratio of 5% (of which 3.5% CET1), 5%2 gone concern leverage ratio, going concern RWA ratio of 14.3% (of which 10% CET1) and 14.3%2 gone concern RWA ratio to become fully effective by January 1, 2020 (phase-in) Major regulatory capital changes anticipated over 2016-2020 Summary of progress Cost reduction Funding Basel III reforms Targets Recent BCBS conference comments on November 30, 2016 indicate a longer implementation and phase-in period than previously expected. Use of internal models was confirmed

Summary of progress Cost reduction Funding Basel III reforms Targets RWA estimated regulatory impact - 2018 to 2020 and beyond Estimated net regulatory impact in CHF bn 2018E 2019E 2020E and beyond Advanced rules estimated impact Equity investments in fundsSACCRBanking book securitization 2018+: >13% pre Basel III reform ; >11% post Basel III reform Final rules impact Draft rules impact FRTB Pending BCBS finalization of remaining rules; significant recalibration expected January 2017.FRTB CVAReduced IRBOperational Risk 12-13% in 2018 Estimated CET1 ratio (%)Pre significant litigation

3Q16 Operating Free Capital Generated Cash component of dividends 2018 CET1 ratio1,2in % Capital released from SRU RWA reduction4 CET1 Leverage ratio >3.5% Illustrative CET1 capital generation and impact on capital ratios Tier1 Leverage ratio ~5.0% 3.4% 4.6% CET1 benefit from Credit Suisse (Schweiz) IPO3 11-12% until end 2016 1 Pre significant litigation 2 Pre reforms to Basel III 3 Any such IPO would involve the sale of a minority stake and would be subject to, among other things, all necessary approvals and would be intended to generate / raise additional capital for Credit Suisse AG or Credit Suisse (Schweiz) AG 4 Includes business growth and methodology impacts (excluding Basel III reform) 12-13% over 2017 and 2018 >13% in 2018+ buffer for Basel III reform CET1 ratio targets1,2 CET1 equivalent of increase in RWA for other divisions4 Summary of progress Cost reduction Funding Basel III reforms Targets

Overview of Financials and Capital Resource re-allocation: Progress in 2016 1 Update on cost reduction plans 2 Funding plan for Credit Suisse 3 Update on proposed reforms to Basel III 4 Financial and capital targets 5

Overview of revised financial targets for Group and divisions APAC Pre-tax income o/w Wealth Management 2 IWM Pre-tax income SUB Pre-tax income Global Markets RWA threshold1Leverage exposure threshold1Return on regulatory capital† Note: Adjusted results are non-GAAP financial measures1 As announced on March 23, 2016 (Credit Suisse Strategy Update) 2 Including contributions from wealth management connected activities † See Appendix 2016 USD 60 bnUSD 290 bn > CHF 1.4 bn1< CHF 19.8 bn111-12%1 Group Net cost savingsOperating cost baseCET1 ratio (pre significant litigation)CET1 leverage ratio SRU Pre-tax lossRWALeverage exposure 2019 > 13% pre-Basel III reform uplift; > 11% post-Basel III reform uplift ~ USD 0.8 bnUSD 30 bnUSD 40 bn 2018 CHF 1.6 bnCHF 0.7 bn CHF 1.8 bn CHF 2.3 bn 10-15% > CHF 4.2 bn< CHF 17.0 bn12-13%> 3.5% 15- 20% Summary of progress Cost reduction Funding Targets Adjusted figures Basel III reforms IBCM Return on regulatory capital† ~ USD 1.4 bn

Summary of progress Cost reduction Funding Targets Basel III reforms Continued focus on cost discipline at SUB with maintained 2018 pre-tax income target Note: Adjusted results are non-GAAP financial measures. A reconciliation to reported results and a reconciliation of adjustments applied for Swisscard are included in the Appendix. Financial and other information is for Swiss Universal Bank division. Scope of Credit Suisse (Schweiz) AG differs from Swiss Universal Bank division1 Excludes Swisscard impact Adjustedpre-tax income1in CHF bn 2015 Prior 2018 Target(ID 2015) 2018Target 2.3 1.6 2.3

IWM outlook impacted by adverse market environment in near term Summary of progress Cost reduction Funding Targets Basel III reforms Note: Adjusted results are non-GAAP financial measures. A reconciliation to reported results is included in the Appendix1 Including additional market related activities Adjustedpre-tax incomein CHF bn Prior 2018 Target(ID 2015) Revised 2018Target (0.4) 2.1 1.8 2015 1.0 Asset Management1 Business transfers 0.1

APAC wealth management target unchanged; reduced overall target reflects adverse impact from market conditions Summary of progress Cost reduction Funding Targets Basel III reforms Adjustedpre-tax incomein CHF bn Prior 2018 Target(ID 2015) Revised 2018Target Marketimpact 2.1 1.6 0.3 0.7 0.7 2015 1.1 Wealth Mgmt.1 Businesstransfers Prior 2018 Targetexcl. business transfers Costinitiatives Note: Adjusted results are non-GAAP financial measures. A reconciliation to reported results is included in the Appendix1 Including contributions from wealth management connected activities 0.7 (0.7) (0.1) 2.0

Summary of progress Cost reduction Funding Targets Basel III reforms Global Markets targeted to meet its cost of capital by 2018 Note: Adjusted results are non-GAAP financial measures † See Appendix Adjusted net revenues Adjusted total operating expenses 2018 Ambition in USD bn 6.0+ Less than 4.8 Target return on regulatory capital†: 10 – 15%

Revenue growth and operating efficiencies to drive IBCM toward return target Summary of progress Cost reduction Funding Targets Basel III reforms Note: Adjusted results are non-GAAP financial measures † See Appendix 2018Target 15-20% Adjusted return on regulatory capital† ~60% revenue growth~40% operating efficiencies 2016 to 2018 PTI Growth

Appendix

Notes Throughout the presentation rounding differences may occurAll risk-weighted assets (RWA) and leverage exposure figures shown in this presentation are as of the end of the respective period and on a “look-through” basisGross and net margins are shown in basis points (bps) Gross margin = adj. net revenues annualized / average AuM; net margin = adj. pre-tax income annualized / average AuMMandates penetration reflects advisory and discretionary mandates as percentage of total AuM, excluding AuM from the external asset manager (EAM) business General notes * “Adjusted operating expenses at constant FX rates” include adjustments as made in all our disclosures for restructuring expenses, major litigation expenses and a goodwill impairment taken in 4Q15 as well as adjustments for FX, applying the following main currency exchange rates for 1Q15: USD/CHF 0.9465, EUR/CHF 1.0482, GBP/CHF 1.4296, 2Q15: USD/CHF 0.9383, EUR/CHF 1.0418, GBP/CHF 1.4497, 3Q15: USD/CHF 0.9684, EUR/CHF 1.0787, GBP/CHF 1.4891, 4Q15: USD/CHF 1.0000, EUR/CHF 1.0851, GBP/CHF 1.5123, 1Q16: USD/CHF 0.9928, EUR/CHF 1.0941, GBP/CHF 1.4060, 2Q16: USD/CHF 0.9756, EUR/CHF 1.0956, GBP/CHF 1.3845, 3Q16: USD/CHF 0.9728, EUR/CHF 1.0882, GBP/CHF 1.2764. These currency exchange rates are unweighted, i.e. a straight line average of monthly rates. We apply this calculation consistently for the periods under review† Regulatory capital reflects the worst of 10% of RWA and 3.5% of leverage exposure. Return on regulatory capital is based on (adjusted) returns after tax assuming a tax rate of 30% for all periods and capital allocated based on the worst of 10% of average RWA and 3.5% of average leverage exposure. For Global Markets and Investment Banking & Capital Markets, return on regulatory capital is based on US dollar denominated numbers Specific notes Abbreviations Adj. = Adjusted; AT1 = Additional Tier 1; AM = Asset Management; ann. = annualized; APAC = Asia Pacific; AuM = Assets under Management; BCBS = Basel Committee on Banking Supervision; BIS = Bank for International Settlements; bps = basis points; BRRD = Bank Recovery and Resolution Directive; CAO = Capital Adequacy Ordinance; CET1 = Common Equity Tier 1; Corp. Ctr. = Corporate Center; C&IB = Corporate & Institutional Banking; CRO = Chief Risk Officer; CCRO = Compliance and Regulatory Affairs; CVA = Credit Valuation Adjustment; ECM = Equity Capital Markets; EM = Emerging Markets; EMEA=Europe, Middle East & Africa; FINMA = Swiss Financial Market Supervisory Authority; FRTB = Fundamental review of the trading book; FSB = Financial Stability Board; FTE = Full time equivalents; FVoD = Fair Value of Own Debt; FX = Foreign Exchange; GM = Global Markets; GMAR = Global Markets Accelerated Restructuring; HoldCo = Holding Company; HQ = Headquarters; HQLA = High Quality Liquid Assets; IB = Investment Banking; IBCM = Investment Banking & Capital Markets; ID = Investor Day; IHC = Intermediate Holding Company; IOSCO = The International Organization of Securities Commissions; IPO = Initial Public Offer; IRB = Internal Ratings-Based; IWM = International Wealth Management; KPI = Key Performance Indicator; LATAM =Latin America; LCR = Liquidity Coverage ratio; M&A = Mergers & Acquisitions; NCWOL = No Creditor Worse Off than in Liquidation; NNA = Net new assets; NSFR = Net Stable Funding Ratio; OpCo = Operating Company; OpRisk = Operational Risk PB = Private Banking; PB&WM = (Former) Private Banking & Wealth Management (division) pp. = percentage points; PTI = Pre-tax income; PONV = Point of Non-Viability; QoQ = Quarter-on-quarter; RM(s) = Relationship Manager(s); RoRC = Return on regulatory capital; RWA = Risk Weighted Assets; SA-CCR = Standardized Approach - Counterparty Credit Risk; SME = Small and Medium Enterprises; SMG = Systematic Market-Making Group; SoW = Share of Wallet; SRU = Strategic Resolution Unit; STS = Sales and Trading Services; SUB = Swiss Universal Bank; T1= Tier 1 capital; TBTF = Too Big to Fail; TLAC = Total loss absorbing capacity; (U)HNW(I) = (Ultra) High Net Worth (Individuals); WM = Wealth Management; YoY = Year-on-Year; YTD = Year To Date

Reconciliation of adjustment items (1/2) CS Group in CHF mn SRU in USD mn Corp. Ctr. in CHF mn 3Q16 2Q16 1Q16 4Q15 3Q15 2Q15 1Q15 3Q16 2Q16 1Q16 4Q15 3Q15 2Q15 1Q15 3Q16 2Q16 1Q16 4Q15 3Q15 2Q15 1Q15 Net revenues reported 5,396 5,108 4,638 4,210 5,985 6,955 6,647 (170) (371) (545) (126) (90) 437 335 72 (95) 110 (748) 752 384 173 Fair value on own debt - - - 697 (623) (228) (144) - - - - - - - - - - 697 (623) (228) (144) Real estate gains - - - (72) - (23) - - - - - - - - - - - - - - - (Gains)/losses on business sales (346) - 56 (34) - - - - - 4 - - - - - - 52 - - - - Net revenues adjusted 5,050 5,108 4,694 4,801 5,362 6,704 6,503 (170) (371) (541) (126) (90) 437 335 72 (95) 162 (51) 129 156 29 Provision for credit losses 55 (28) 150 133 110 51 30 6 (38) 119 99 21 13 5 - (2) 1 (2) 1 - - Total operating expenses reported 5,119 4,937 4,972 10,518 5,023 5,248 5,106 698 445 601 1,103 688 690 651 279 142 76 307 211 121 223 Goodwill impairment - - - (3,797) - - - - - - - - - - - - - - - - - Restructuring expenses (145) (91) (255) (355) - - - (23) (21) (80) (158) - - - - - - - - - - Major litigation provisions (306) - - (564) (203) (63) 10 (324) - - (257) (27) (9) - - - - - - - - Total operating expenses adjusted 4,668 4,846 4,717 5,802 4,820 5,185 5,116 351 424 521 688 661 680 651 279 142 76 307 211 121 223 Pre-tax income/(loss) reported 222 199 (484) (6,441) 852 1,656 1,511 (874) (778) (1,266) (1,328) (799) (266) (320) (207) (235) 33 (1,053) 540 263 (50) Total adjustments 105 91 311 5,307 (420) (188) (154) 347 21 84 415 27 9 - - - 52 697 (623) (228) (144) Pre-tax income/(loss) adjusted 327 290 (173) (1,134) 432 1,468 1,357 (527) (757) (1,181) (913) (772) (256) (320) (207) (235) 85 (356) (83) 35 (194) IWM AM in CHF mn GM in USD mn IBCM in USD mn 3Q16 2Q16 1Q16 4Q15 3Q15 2Q15 1Q15 3Q16 2Q16 1Q16 4Q15 3Q15 2Q15 1Q15 3Q16 2Q16 1Q16 4Q15 3Q15 2Q15 1Q15 Net revenues reported 292 334 320 365 308 335 320 1,396 1,671 1,252 1,168 1,632 2,052 2,272 479 558 395 418 414 605 420 Fair value on own debt - - - - - - - - - - - - - - - - - - - - - Real estate gains - - - - - - - - - - - - - - - - - - - - - (Gains)/losses on business sales - - - - - - - - - - - - - - - - - - - - - Net revenues adjusted 292 334 320 365 308 335 320 1,396 1,671 1,252 1,168 1,632 2,052 2,272 479 558 395 418 414 605 420 Provision for credit losses - - - - - - - (6) (17) 22 (5) 15 (4) 4 (9) - 30 - - - - Total operating expenses reported 243 273 253 330 267 275 274 1,310 1,532 1,430 4,517 1,346 1,641 1,498 450 417 425 902 346 451 471 Goodwill impairment - - - - - - - - - - (2,690) - - - - - - (384) - - - Restructuring expenses (2) (2) 2 (4) - - - (52) (52) (102) (97) - - - (16) 9 (28) (22) - - - Major litigation provisions - - - - - - - (7) - - (51) (132) (57) - - - - - - - - Total operating expenses adjusted 241 271 255 326 267 275 274 1,251 1,480 1,328 1,679 1,214 1,584 1,498 434 426 397 496 346 451 471 Pre-tax income/(loss) reported 49 61 67 35 41 60 46 92 156 (200) (3,345) 271 415 770 39 141 (60) (484) 68 154 (51) Total adjustments 2 2 (2) 4 - - - 59 52 102 2,838 132 57 - 16 (9) 28 406 - - - Pre-tax income/(loss) adjusted 51 63 65 39 41 60 46 150 208 (98) (507) 403 473 770 55 132 (32) (78) 68 154 (51) Adjusted results are non-GAAP financial measures that exclude goodwill impairment and certain other revenues and expenses included in our reported results. Management believes that adjusted results provide a useful presentation of our operating results for purposes of assessing our Group and divisional performance consistently over time, on a basis that excludes items that management does not consider representative of our underlying performance. Provided below is a reconciliation of our adjusted results to the most directly comparable US GAAP measures.

SUB PB in CHF mn IWM PB in CHF mn APAC PB in CHF mn 3Q16 2Q16 1Q16 4Q15 3Q15 2Q15 1Q15 3Q16 2Q16 1Q16 4Q15 3Q15 2Q15 1Q15 3Q16 2Q16 1Q16 4Q15 3Q15 2Q15 1Q15 Net revenues reported 1,160 840 846 963 857 956 920 789 811 853 808 785 830 801 346 337 319 271 303 307 297 Fair value on own debt - - - - - - - - - - - - - - - - - - - - - Real estate gains (346) - - (72) - (23) - - - - - - - - - - - - - - - (Gains)/losses on business sales - - - (10) - - - - - - (11) - - - - - - - - - - Net revenues adjusted 814 840 846 881 857 933 920 789 811 853 797 785 830 801 346 337 319 271 303 307 297 Provision for credit losses 13 7 9 14 14 9 12 - 16 (2) (7) 11 (1) 2 38 2 (17) (5) 24 - (1) Total operating expenses reported 603 582 632 784 639 690 659 593 611 622 874 618 619 567 242 245 216 228 210 188 190 Goodwill impairment - - - - - - - - - - - - - - - - - - - - - Restructuring expenses (16) (3) (35) (33) - - - (13) (13) (10) (32) - - - (3) - - (1) - - - Major litigation provisions - - - (25) - - - 19 - - (228) (50) - 10 - - - (6) - - - Total operating expenses adjusted 587 579 597 726 639 690 659 599 598 612 614 568 619 577 239 245 216 221 210 188 190 Pre-tax income/(loss) reported 544 251 205 165 204 257 249 196 184 233 (59) 156 212 232 66 90 120 48 69 119 108 Total adjustments (330) 3 35 (24) - (23) - (6) 13 10 249 50 - (10) 3 - - 7 - - - Pre-tax income/(loss) adjusted 214 254 240 141 204 234 249 190 197 243 190 206 212 222 69 90 120 55 69 119 108 SUB C&IB in CHF mn APAC IB in CHF mn APAC IB in USD mn 3Q16 2Q16 1Q16 4Q15 3Q15 2Q15 1Q15 3Q16 2Q16 1Q16 4Q15 3Q15 2Q15 1Q15 3Q16 2Q16 1Q16 4Q15 3Q15 2Q15 1Q15 Net revenues reported 507 497 510 532 507 506 480 571 574 588 555 582 733 791 587 590 595 554 603 783 835 Fair value on own debt - - - - - - - - - - - - - - - - - - - - - Real estate gains - - - - - - - - - - - - - - - - - - - - - (Gains)/losses on business sales - - - (13) - - - - - - - - - - - - - - - - - Net revenues adjusted 507 497 510 519 507 506 480 571 574 588 555 582 733 791 587 590 595 554 603 783 835 Provision for credit losses 17 2 (3) 29 25 24 11 (4) 1 (5) 8 - 11 (2) (4) 1 (5) 8 - 12 (3) Total operating expenses reported 276 293 286 304 286 271 275 489 457 449 1,212 489 474 436 503 468 452 1,221 505 505 460 Goodwill impairment - - - - - - - - - - (756) - - - - - - (765) - - - Restructuring expenses (3) (1) (5) (9) - - - (20) (10) (1) (2) - - - (21) (10) (1) (2) - - - Major litigation provisions - - - - - - - - - - - - - - - - - - - - - Total operating expenses adjusted 273 292 281 295 286 271 275 469 447 448 454 489 474 436 482 458 451 454 505 505 460 Pre-tax income/(loss) reported 214 202 227 199 196 211 194 86 116 144 (665) 93 248 357 88 121 148 (675) 98 266 378 Total adjustments 3 1 5 (4) - - - 20 10 1 758 - - - 21 10 1 767 - - - Pre-tax income/(loss) adjusted 217 203 232 195 196 211 194 106 126 145 93 93 248 357 109 131 149 92 98 266 378 Reconciliation of adjustment items (2/2)

Swisscard deconsolidation impactImpact of the deconsolidation on the Swiss Universal Bank Note: Adjusted results are non-GAAP financial measures. A reference to the reconciliation to reported results for other adjustments not relating to Swisscard is included in the Notes of this presentation † See AppendixThis is an illustrative pro-forma presentation of the impact of the deconsolidation of the card issuing business on the historical results of SUB as if it had occurred on December 31, 2014. Given that as of July 1, 2015 the business has been deconsolidated and transferred to the equity method investment, Swisscard AECS GmbH and the transaction does not qualify for discontinued operations, the historical results are not restated in this respect. The reduction in pre-tax income in the Private Banking business of Swiss Universal Bank is offset by the reduction in minority interest from the deconsolidation at the Group level, therefore there is no material impact on the Group’s net income attributable to shareholders. These illustrative figures cannot be seen as being indicative of future trends or results 1 Pro-forma impact of the card issuing business deconsolidation in CHF mn 1Q15 2Q15 3Q15 9M15 1Q15 2Q15 3Q15 9M15 1Q15 2Q15 3Q15 9M15 Net interest income 611 685 708 2,004 9 9 - 18 602 676 708 1,986 Recurring commissions & fees 412 412 372 1,196 56 59 - 115 356 353 372 1,081 Transaction-based revenues 382 349 295 1,026 8 7 - 15 374 342 295 1,011 Other revenues (5) (7) (11) (23) - - - - (5) (7) (11) (23) Net revenues 1,400 1,439 1,364 4,203 73 75 - 148 1,327 1,364 1,364 4,055 Provision for credit losses 23 33 39 95 - - - - 23 33 39 95 Total operating expenses 934 961 925 2,820 61 62 - 123 873 899 925 2,697 Pre-tax income 443 445 400 1,288 12 13 - 25 431 432 400 1,263 Return on regulatory capital† 14% 14% 13% 14% - - - - 14% 14% 13% 14% SUB adjusted Swisscard Impact1 SUB adjusted ex Swisscard


Credit Suisse Investor Day 2016Global MarketsBrian Chin December 7, 2016

Disclaimer (1/2) The data presented in this presentation relating to the Swiss Universal Bank refers to the division of Credit Suisse Group as the same is currently managed within Credit Suisse Group. The scope, revenues and expenses of the Swiss Universal Bank vary from the planned scope of Credit Suisse (Schweiz) AG and its subsidiaries, planned to be subject to a partial IPO, market conditions permitting. Any such IPO would involve the sale of a minority stake and would be subject to, among other things, all necessary approvals.It is therefore not possible to make a like-for-like comparison of the Swiss Universal Bank as a division of Credit Suisse Group on the one hand and Credit Suisse (Schweiz) AG as a potential IPO vehicle on the other hand.Cautionary statement regarding forward-looking statements This presentation contains forward-looking statements that involve inherent risks and uncertainties, and we might not be able to achieve the predictions, forecasts, projections and other outcomes we describe or imply in forward-looking statements. A number of important factors could cause results to differ materially from the plans, objectives, expectations, estimates and intentions we express in these forward-looking statements, including those we identify in "Risk Factors” in our Annual Report on Form 20-F for the fiscal year ended December 31, 2015 and in “Cautionary statement regarding forward-looking information" in our media release relating to Investor Day, published on December 7, 2016 and filed with the US Securities and Exchange Commission, and in other public filings and press releases. We do not intend to update these forward-looking statements except as may be required by applicable law. In particular, the terms “Illustrative”, “Ambition”, “Outlook” and “Goal” are not intended to be viewed as targets or projections, nor are they considered to be Key Performance Indicators. All such illustrations, ambitions and goals are subject to a large number of inherent risks, assumptions and uncertainties, many of which are completely outside of our control. Accordingly, this information should not be relied on for any purpose. We do not intend to update these illustrations, ambitions or goals.We may not achieve the benefits of our strategic initiativesWe may not achieve all of the expected benefits of our strategic initiatives. Factors beyond our control, including but not limited to the market and economic conditions, changes in laws, rules or regulations and other challenges discussed in our public filings, could limit our ability to achieve some or all of the expected benefits of these initiatives. Estimates and assumptionsIn preparing this presentation, management has made estimates and assumptions that affect the numbers presented. Actual results may differ. Figures throughout presentation may also be subject to rounding adjustments. Cautionary Statements Relating to Interim Financial InformationThis presentation contains certain unaudited interim financial information as of or for periods after September 30, 2016, the date of our last published quarterly financial statements. This information has been derived from management accounts, is preliminary in nature, does not reflect the complete results of the fourth quarter of 2016 and is subject to change, including as a result of any normal quarterly adjustments in relation to the financial statements for the fourth quarter of 2016. This information has not been subject to any review by our independent registered public accounting firm. There can be no assurance that the final results for these periods will not differ from these preliminary results, and any such differences could be material. Quarterly financial results for the fourth quarter of 2016 will be included in our 4Q16 Earnings Release, and audited consolidated financial statements for full-year 2016 will be included in our Annual Report on Form 20-F for the year ended December 31, 2016, when they are published. These interim results of operations are not necessarily indicative of the results to be achieved for the remainder of the fourth quarter or the full year 2016.

Disclaimer (2/2) Statement regarding non-GAAP financial measures This presentation also contains non-GAAP financial measures, including adjusted results. Information needed to reconcile such non-GAAP financial measures to the most directly comparable measures under US GAAP or a reference thereto can be found in this presentation in the Appendix, which is available on our website at credit-suisse.com.Statement regarding capital, liquidity and leverage As of January 1, 2013, Basel 3 was implemented in Switzerland along with the Swiss “Too Big to Fail” legislation and regulations thereunder (in each case, subject to certain phase-in periods). As of January 1, 2015, the Bank for International Settlements (BIS) leverage ratio framework, as issued by the Basel Committee on Banking Supervision (BCBS), was implemented in Switzerland by FINMA. Our related disclosures are in accordance with our interpretation of such requirements, including relevant assumptions. Changes in the interpretation of these requirements in Switzerland or in any of our assumptions or estimates could result in different numbers from those shown in this presentation. Capital and ratio numbers for periods prior to 2013 are based on estimates, which are calculated as if the Basel 3 framework had been in place in Switzerland during such periods. Unless otherwise noted, leverage exposure is based on the BIS leverage ratio framework and consists of period-end balance sheet assets and prescribed regulatory adjustments. Leverage amounts for 4Q14, which are presented in order to show meaningful comparative information, are based on estimates which are calculated as if the BIS leverage ratio framework had been implemented in Switzerland at such time. Beginning in 2015, the Swiss leverage ratio is calculated as Swiss total capital, divided by period-end leverage exposure. The look-through BIS tier 1 leverage ratio and CET1 leverage ratio are calculated as look-through BIS tier 1 capital and CET1 capital, respectively, divided by end-period leverage exposure. Selling restrictions This document, and the information contained herein, is not an offer to sell or a solicitation of offers to purchase or subscribe for securities of Credit Suisse Group AG or Credit Suisse (Schweiz) AG in Switzerland, the United States or any other jurisdiction. This document is not a prospectus within the meaning of article 652a of the Swiss Code of Obligations, nor is it a listing prospectus as defined in the listing rules of the SIX Swiss Exchange AG or any other exchange or regulated trading facility in Switzerland or a prospectus or offering document under any other applicable laws. Copies of this document may not be sent to jurisdictions, or distributed in or sent from jurisdictions, in which such documents are barred or prohibited by law. A decision to invest in securities of Credit Suisse Group AG or Credit Suisse (Schweiz) AG should be based exclusively on a written agreement with Credit Suisse Group AG or an offering and listing prospectus to be published by Credit Suisse Group AG or Credit Suisse (Schweiz) AG for such purpose. Any offer and sale of securities of Credit Suisse (Schweiz) AG will not be registered under the U.S. Securities Act of 1933, as amended, and may not be offered in the United States of America absent such registration or an exemption from registration. There will be no public offering of such securities in the United States of America.

Key messages Strong client franchise across fixed income and equities productsEssential partner and product engine for IWM, SUB, APAC and IBCM divisionsRight-sized capital footprint with pre-tax income upside Global Markets Maintain client franchise strength and capitalize on collaboration across Credit SuisseContinue to drive increased operating leverage2018 Ambition: Revenues: USD 6 bn+Expenses: Less than USD 4.8 bn Return on regulatory capital†: 10 - 15% Way forward Reduced risk-weighed assets and leverage exposureAccelerated expense reduction programReturned division to profitability Progress since last Investor Day † See Appendix

GM maintains a strong client franchise across asset classes… “[CS] has been at the vanguard of US securitization…the business has not lost any steam” Most Innovative Bank for Securitisation 2016: Most Innovative Bank Leveraged Finance “…The bank has navigated markets over the past 12 months like no other, and had a leading role in the year’s benchmark and unprecedented transactions” Recent awards Equities products Client ranking in Global Cash since 20073 Global Prime Brokerage since 20124 Issuer of US Structured Notes5 #2 Top 3 #3 Fixed Income products Asset Finance franchise since 20131 Global Institutional Loans and High Yield franchise since 20122 US Institutional Loan underwriter2 #1 Top 3 #1 Bank of the Year: Structured Products “[CS] was named as the winner following an in-depth assessment … which brought together the Emerging Markets, Credit Solutions, Equity Derivatives and Global Macro business lines” 2016 Derivative Awards EMEA: CLO Arranger of the Year Large Cap Leveraged Loan of the YearBest Transatlantic Leveraged Loan High Yield Deal of the Year by a corporate issuer 1 Thomson Reuters 2 Dealogic as of September 30, 2016; includes AMER and EMEA 3 Third Party Competitive Analysis 4 Hedge Fund Intelligence / Absolute Return / EuroHedge; based on level of Hedge Fund AuM (Assets under Management) with Prime Broker 5 Bloomberg Brief Ranking, November 23, 2016 Franchise strength Progress to date Revenue potential Collaboration Products Efficiency

…with continued market share strength Institutional Loans and High Yield Share of Wallet/Rank2 #2 #1 2013-2015 Average 9M16 1 Thomson Reuters league tables 2 Dealogic league tables as of September 30, 2016; Note: All share of wallet and rank data is based on addressable market; includes Americas and EMEA only; excluding pro rata deals 3 ECM excludes converts Franchise strength Progress to date Revenue potential Collaboration Products Efficiency Brand is strong ECM Share of Wallet/Rank2,3 #7 #5 2013-2015 Average 9M16 US Securitizations Wallet/Rank1 2013-2015 Average 9M16 #1 #1

Execution of Global Markets restructuring nearing completion… Reduced RWA and leverage exposureImproved risk profile in line with risk appetite Restructured expense baseMaintained and defended key franchise Returned division to profitability Progress since Investor Day 2015 Risk- weighted assets Leverage exposure Total operating expenses in USD bn Progress to Date Target1 60 290 5.4 2 On track On track On track 1 As announced on March 23, 2016 (Credit Suisse Strategy Update) 2 2018 Ambition Franchise strength Progress to date Revenue potential Collaboration Products Efficiency

Revenues expected to normalize post-restructuring…. 2015 1 2014, 2015 and last 12 months RWA reflect 5 quarter average RWA 2 Reflects restructuring year; last 12 months ended September 30, 2016 3 Average of Oct 1, 2015 – Sept 30, 2016 Trailing 12 months2 (as of Sept 30, 2016) Restructuring year Net revenues / RWA (%) 11.3% 9.4% +10.0% Average RWA progression1in USD bn Net Revenuesin USD bn Ambition Average High Yield Credit Spreads 591 6923 Market Conditions Franchise strength Progress to date Revenue potential Collaboration Products Efficiency Go forward revenues balanced across reduced risk profile and lower earnings volatility 2014 12.5% 2013 – 2015 Average = 12.1% 450

… and reflect historic seasonality Global Market Net Revenues in USD bn 1 Reflects restructuring year; last 12 months ended September 30, 2016; 1H includes 1Q16 and 2Q16, 2H includes 4Q15 and 3Q16 Franchise strength Progress to date Revenue potential Collaboration Products Efficiency 8.1 7.1 5.5 1H 2H 2014 2015 Trailing 12 months1 (as of Sept 30, 2016) (54%) (46%) (61%) (39%) (53%) (47%) Restructuring year 3 year Average 57% 43% 6.0+ 57 - 61% 39 - 43% Ambition (39%)

2017 Market Outlook Equities Market Performance1 US Fed rate hike expectation2 # of Fed Hikes2 US High Yield and Inv. Grade spreads Source: Credit Suisse Research1 Based on daily S&P 500 and Euro Stoxx 50 Index. Percentages refer to % change as of Dec 02, 2016 close vs. 2017 Projection per CS Research 2 Assessed on # of 25 bps Fed hikes bps Franchise strength Progress to date Revenue potential Collaboration Products Efficiency 17CS Projection +5% +9%

Fixed Income business rationalization complete… Product Credit Products Emerging Markets Securitized Products Macro Competitive ambition Top 3 Top 3 Top 3 Focused offering for top institutional and IWM clients Progress against plan Franchise strength Progress to date Revenue potential Collaboration Products Efficiency

…resulting in resilient, productive client business Top-tier provider for Loan, HY&IG2 Acquisition Financings Leading provider of asset and portfolio advisory services Differentiated global offering with deep understanding of local markets Punching above our weight with less capital Deep multi-asset capabilities in EM Top tier provider in US interest rate options Strength of the franchise Credit business RWA productivity (per Coalition)1 #4 #2 2015 1H16 1 Source: Coalition. Analysis is based on Credit Suisse’s Coalition Product Taxonomy. All Results are based on Coalition’s Analysis and are based on 9 Banks out of the Coalition Index (Top 12 Global Investment Banks). RWA is calculated under Basel 3; RWA productivity is calculated as Revenues / RWA 2 HY = High Yield, IG = Investment Grade Franchise strength Progress to date Revenue potential Collaboration Products Efficiency

Systematic Market-Making Group ("SMG") Offer professional investors access to SMG’s alternative investment strategiesRound out CS Asset Management client offering with high turnover, high Sharpe Ratio strategiesProvide CS with additional capital efficient revenue streams Evolving operating model SMG core expertise High turnover strategies (restricted capacity) Low turnover strategies (high capacity) SMG QubeFund SMG QT Fund CTA Risk Premia Alt. Beta Sharpe Position Holding Period Sharpe Ratio SMG is a global quantitative and systematic trading group within Global Markets and APACFocuses on market making and high-turnover strategies SMG Products GM APAC From To SMG Funds 3rd party investors APAC GM Capital providers via IWM Franchise strength Progress to date Revenue potential Collaboration Products Efficiency

Equities performance reflects market conditions AMER EMEA GM Equities products net revenue excluding SMG1 in USD bn 1 Includes Global Markets Equities and Equities Derivatives (part of Solutions); excludes SMG; numbers may not add due to rounding 2 Reflects restructuring year; last 12 months ended September 30, 2016 Trailing 12 months2 (as of Sept 30, 2016) 2015 2014 Franchise strength Progress to date Revenue potential Collaboration Products Efficiency

Equities is critical to CS strategy … with interconnected offering Best in class distribution of new issue and blocks Access product across developed and emerging markets for our clients Provider of differentiated content (e.g., HOLT) Equities Global, cross divisional footprint1 in USD mn… IBCM7% APAC33% Global Markets57% Includes complete divisional view of Equites product revenue 1 9M16 net revenues include Equity Underwriting and Equity Trading revenues across GM Equities and Solutions, APAC , IBCM divisions and Sales and Trading Services (“STS”); includes SMG IWM/ SUB: 3% Franchise strength Progress to date Revenue potential Collaboration Products Efficiency

Significant collaboration opportunities Equities Fixed Income Wealth Management Core Institutional Corporate & Sponsors Cash Equities Equity Derivatives Prime Services Securitized Products Credit Products Emerging Markets Macro Continuing to support client needs across APAC, IWM, IBCM and SUB Franchise strength Progress to date Revenue potential Collaboration Products Efficiency

GM is the product engine delivering into developed Europe and EM Partner with IWM in EMEA… Targeted client advisory Pricing Strategy Equity distribution … and on EM Financing and Investor Products Execution GM EM Financing GM Institutional Clients IWM & SUB Clients GM & IWM Syndication Sovereign Wealth Funds, Insurance, Pensions, Asset Managers, Institutional Investors Repackages for UHNWI Investor Products Origination Trading Structuring Risk Mgmt/ Controls Tech Platform Syndication GM products & services IWM Client USD 1.5bn sell-down of ABB Franchise strength Progress to date Revenue potential Collaboration Products Efficiency

Achieved strategic cost reduction in 2016, focused on revised2018 ambition Cost reduction levers 2016 cost reduction actions ~3,500 net headcount reduction328% reduction in professional services fees4 +82% 2012 2013 2014 2015 9M16 Annualized2 Regulatory / Control Investment (incl. Corp. Center)1,5 in USD bn 9M16 Annualized2 2018Ambition Total operating expenses1 in USD mn 6.0 4Q16E Annualized2 5.4 (3)% <4.8 5.2 2015 (11)% Corporate Functions GM Direct Expenses Note: Adjusted results are non-GAAP financial measures. A reference to the reconciliation to reported results is included in the Appendix 1 Expenses post Global Markets Accelerated Restructuring 2 Annualized numbers do not take account of variations in operating results, seasonality and other factors and may not be indicative of actual, full-year results 3 Based on net headcount reduction; includes permanent full-time equivalent employees, contractors, consultants and other contingent workers 4 Professional services fees includes consulting, contractor services, audit services and outsourced services; based YoY comparison as of ended September 30, 2016 5 Includes Risk and Controls related Corporate functions (e.g., CCRO, CRO and Product Control), IHC / CCAR, Controls, EMEA FinReg, Change/Chief Data Officer, Bank Levy, Risk and Control Tech spend and associated Corporate Center change In-flight efficiency programs Platform rationalizationDuplication reduction, front-to-backWorkforce deployment strategy Franchise strength Progress to date Revenue potential Collaboration Products Efficiency
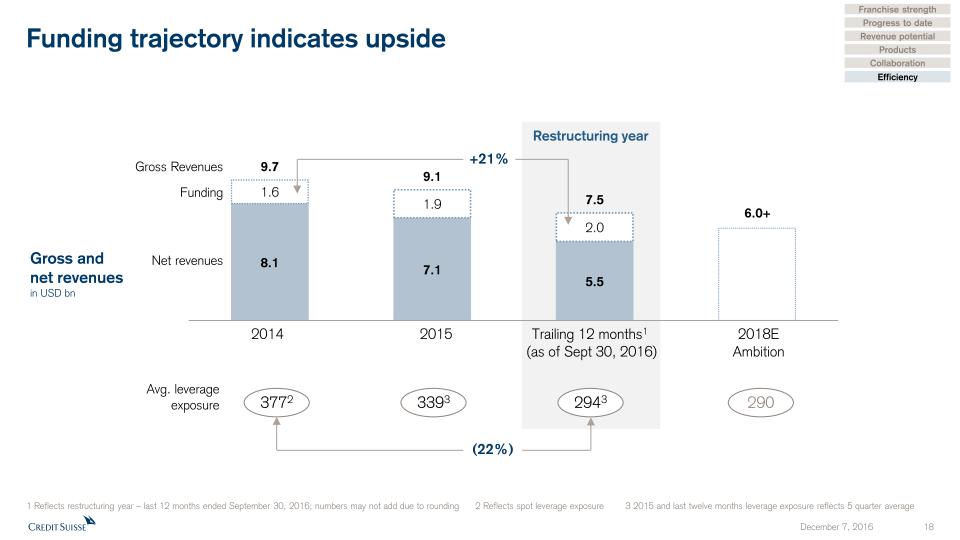
Funding trajectory indicates upside 1 Reflects restructuring year – last 12 months ended September 30, 2016; numbers may not add due to rounding 2 Reflects spot leverage exposure 3 2015 and last twelve months leverage exposure reflects 5 quarter average Gross and net revenuesin USD bn Net revenues Gross Revenues Funding Avg. leverage exposure 3772 3393 2943 290 Restructuring year Trailing 12 months1 (as of Sept 30, 2016) 2018EAmbition 2015 2014 (22%) +21% Franchise strength Progress to date Revenue potential Collaboration Products Efficiency

Global Markets Ambition Adjusted net revenues Adjusted total operating expenses 2018 Ambition in USD bn 6.0+ Less than 4.8 Target Return on regulatory capital†: 10 – 15% Note: Adjusted results are non-GAAP financial measures † See Appendix

Summary The bulk of the restructuring is done and we have executed wellOur Franchise and Brand are strong and are poised to capture upsideExpect normalization of revenues now that restructuring is done and markets are beginning to stabilizeExpect additional efficiencies on cost base and funding mostly from efforts initiated in 2016 Drive the CS strategy: A global wealth manager with strong Investment Banking capabilities

Appendix December 7, 2016

Notes For reconciliation of adjusted to reported results, refer to the appendix of either the CEO or CFO Investor Day 2016 presentation. All reconciliations are available in the respective appendixThroughout the presentation rounding differences may occurAll risk-weighted assets (RWA) and leverage exposure figures shown in this presentation are as of the end of the respective period and on a “look-through” basisGross and net margins are shown in basis points (bps) Gross margin = adj. net revenues annualized / average AuM; net margin = adj. pre-tax income annualized / average AuMMandates penetration reflects advisory and discretionary mandates as percentage of total AuM, excluding AuM from the external asset manager (EAM) business General notes * “Adjusted operating expenses at constant FX rates” include adjustments as made in all our disclosures for restructuring expenses, major litigation expenses and a goodwill impairment taken in 4Q15 as well as adjustments for FX, applying the following main currency exchange rates for 1Q15: USD/CHF 0.9465, EUR/CHF 1.0482, GBP/CHF 1.4296, 2Q15: USD/CHF 0.9383, EUR/CHF 1.0418, GBP/CHF 1.4497, 3Q15: USD/CHF 0.9684, EUR/CHF 1.0787, GBP/CHF 1.4891, 4Q15: USD/CHF 1.0000, EUR/CHF 1.0851, GBP/CHF 1.5123, 1Q16: USD/CHF 0.9928, EUR/CHF 1.0941, GBP/CHF 1.4060, 2Q16: USD/CHF 0.9756, EUR/CHF 1.0956, GBP/CHF 1.3845, 3Q16: USD/CHF 0.9728, EUR/CHF 1.0882, GBP/CHF 1.2764. These currency exchange rates are unweighted, i.e. a straight line average of monthly rates. We apply this calculation consistently for the periods under review† Regulatory capital reflects the worst of 10% of RWA and 3.5% of leverage exposure. Return on regulatory capital is based on (adjusted) returns after tax assuming a tax rate of 30% for all periods and capital allocated based on the worst of 10% of average RWA and 3.5% of average leverage exposure. For Global Markets and Investment Banking & Capital Markets, return on regulatory capital is based on US dollar denominated numbers Specific notes Abbreviations Adj. = Adjusted; AT1 = Additional Tier 1; AM = Asset Management; ann. = annualized; APAC = Asia Pacific; AuM = Assets under Management; BCBS = Basel Committee on Banking Supervision; BIS = Bank for International Settlements; bps = basis points; BRRD = Bank Recovery and Resolution Directive; CAO = Capital Adequacy Ordinance; CET1 = Common Equity Tier 1; Corp. Ctr. = Corporate Center; C&IB = Corporate & Institutional Banking; CRO = Chief Risk Officer; CCRO = Compliance and Regulatory Affairs; CVA = Credit Valuation Adjustment; ECM = Equity Capital Markets; EM = Emerging Markets; EMEA=Europe, Middle East & Africa; FINMA = Swiss Financial Market Supervisory Authority; FRTB = Fundamental review of the trading book; FSB = Financial Stability Board; FTE = Full time equivalents; FVoD = Fair Value of Own Debt; FX = Foreign Exchange; GM = Global Markets; GMAR = Global Markets Accelerated Restructuring; HoldCo = Holding Company; HQ = Headquarters; HQLA = High Quality Liquid Assets; IB = Investment Banking; IBCM = Investment Banking & Capital Markets; ID = Investor Day; IHC = Intermediate Holding Company; IOSCO = The International Organization of Securities Commissions; IPO = Initial Public Offer; IRB = Internal Ratings-Based; IWM = International Wealth Management; KPI = Key Performance Indicator; LATAM =Latin America; LCR = Liquidity Coverage ratio; M&A = Mergers & Acquisitions; NCWOL = No Creditor Worse Off than in Liquidation; NNA = Net new assets; NSFR = Net Stable Funding Ratio; OpCo = Operating Company; OpRisk = Operational Risk PB = Private Banking; PB&WM = (Former) Private Banking & Wealth Management (division) pp. = percentage points; PTI = Pre-tax income; PONV = Point of Non-Viability; QoQ = Quarter-on-quarter; RM(s) = Relationship Manager(s); RoRC = Return on regulatory capital; RWA = Risk Weighted Assets; SA-CCR = Standardized Approach - Counterparty Credit Risk; SME = Small and Medium Enterprises; SMG = Systematic Market-Making Group; SoW = Share of Wallet; SRU = Strategic Resolution Unit; STS = Sales and Trading Services; SUB = Swiss Universal Bank; T1= Tier 1 capital; TBTF = Too Big to Fail; TLAC = Total loss absorbing capacity; (U)HNW(I) = (Ultra) High Net Worth (Individuals); WM = Wealth Management; YoY = Year-on-Year; YTD = Year To Date


Credit Suisse Investor Day 2016Swiss Universal Bank divisionThomas Gottstein December 7, 2016
Disclaimer (1/2) The data presented in this presentation relating to the Swiss Universal Bank refers to the division of Credit Suisse Group as the same is currently managed within Credit Suisse Group. The scope, revenues and expenses of the Swiss Universal Bank vary from the planned scope of Credit Suisse (Schweiz) AG and its subsidiaries, planned to be subject to a partial IPO, market conditions permitting. Any such IPO would involve the sale of a minority stake and would be subject to, among other things, all necessary approvals.It is therefore not possible to make a like-for-like comparison of the Swiss Universal Bank as a division of Credit Suisse Group on the one hand and Credit Suisse (Schweiz) AG as a potential IPO vehicle on the other hand.Cautionary statement regarding forward-looking statements This presentation contains forward-looking statements that involve inherent risks and uncertainties, and we might not be able to achieve the predictions, forecasts, projections and other outcomes we describe or imply in forward-looking statements. A number of important factors could cause results to differ materially from the plans, objectives, expectations, estimates and intentions we express in these forward-looking statements, including those we identify in "Risk Factors” in our Annual Report on Form 20-F for the fiscal year ended December 31, 2015 and in “Cautionary statement regarding forward-looking information" in our media release relating to Investor Day, published on December 7, 2016 and filed with the US Securities and Exchange Commission, and in other public filings and press releases. We do not intend to update these forward-looking statements except as may be required by applicable law. In particular, the terms “Illustrative”, “Ambition”, “Outlook” and “Goal” are not intended to be viewed as targets or projections, nor are they considered to be Key Performance Indicators. All such illustrations, ambitions and goals are subject to a large number of inherent risks, assumptions and uncertainties, many of which are completely outside of our control. Accordingly, this information should not be relied on for any purpose. We do not intend to update these illustrations, ambitions or goals.We may not achieve the benefits of our strategic initiativesWe may not achieve all of the expected benefits of our strategic initiatives. Factors beyond our control, including but not limited to the market and economic conditions, changes in laws, rules or regulations and other challenges discussed in our public filings, could limit our ability to achieve some or all of the expected benefits of these initiatives. Estimates and assumptionsIn preparing this presentation, management has made estimates and assumptions that affect the numbers presented. Actual results may differ. Figures throughout presentation may also be subject to rounding adjustments. Cautionary Statements Relating to Interim Financial InformationThis presentation contains certain unaudited interim financial information as of or for periods after September 30, 2016, the date of our last published quarterly financial statements. This information has been derived from management accounts, is preliminary in nature, does not reflect the complete results of the fourth quarter of 2016 and is subject to change, including as a result of any normal quarterly adjustments in relation to the financial statements for the fourth quarter of 2016. This information has not been subject to any review by our independent registered public accounting firm. There can be no assurance that the final results for these periods will not differ from these preliminary results, and any such differences could be material. Quarterly financial results for the fourth quarter of 2016 will be included in our 4Q16 Earnings Release, and audited consolidated financial statements for full-year 2016 will be included in our Annual Report on Form 20-F for the year ended December 31, 2016, when they are published. These interim results of operations are not necessarily indicative of the results to be achieved for the remainder of the fourth quarter or the full year 2016.

Disclaimer (2/2) Statement regarding non-GAAP financial measures This presentation also contains non-GAAP financial measures, including adjusted results. Information needed to reconcile such non-GAAP financial measures to the most directly comparable measures under US GAAP or a reference thereto can be found in this presentation in the Appendix, which is available on our website at credit-suisse.com.Statement regarding capital, liquidity and leverage As of January 1, 2013, Basel 3 was implemented in Switzerland along with the Swiss “Too Big to Fail” legislation and regulations thereunder (in each case, subject to certain phase-in periods). As of January 1, 2015, the Bank for International Settlements (BIS) leverage ratio framework, as issued by the Basel Committee on Banking Supervision (BCBS), was implemented in Switzerland by FINMA. Our related disclosures are in accordance with our interpretation of such requirements, including relevant assumptions. Changes in the interpretation of these requirements in Switzerland or in any of our assumptions or estimates could result in different numbers from those shown in this presentation. Capital and ratio numbers for periods prior to 2013 are based on estimates, which are calculated as if the Basel 3 framework had been in place in Switzerland during such periods. Unless otherwise noted, leverage exposure is based on the BIS leverage ratio framework and consists of period-end balance sheet assets and prescribed regulatory adjustments. Leverage amounts for 4Q14, which are presented in order to show meaningful comparative information, are based on estimates which are calculated as if the BIS leverage ratio framework had been implemented in Switzerland at such time. Beginning in 2015, the Swiss leverage ratio is calculated as Swiss total capital, divided by period-end leverage exposure. The look-through BIS tier 1 leverage ratio and CET1 leverage ratio are calculated as look-through BIS tier 1 capital and CET1 capital, respectively, divided by end-period leverage exposure. Selling restrictions This document, and the information contained herein, is not an offer to sell or a solicitation of offers to purchase or subscribe for securities of Credit Suisse Group AG or Credit Suisse (Schweiz) AG in Switzerland, the United States or any other jurisdiction. This document is not a prospectus within the meaning of article 652a of the Swiss Code of Obligations, nor is it a listing prospectus as defined in the listing rules of the SIX Swiss Exchange AG or any other exchange or regulated trading facility in Switzerland or a prospectus or offering document under any other applicable laws. Copies of this document may not be sent to jurisdictions, or distributed in or sent from jurisdictions, in which such documents are barred or prohibited by law. A decision to invest in securities of Credit Suisse Group AG or Credit Suisse (Schweiz) AG should be based exclusively on a written agreement with Credit Suisse Group AG or an offering and listing prospectus to be published by Credit Suisse Group AG or Credit Suisse (Schweiz) AG for such purpose. Any offer and sale of securities of Credit Suisse (Schweiz) AG will not be registered under the U.S. Securities Act of 1933, as amended, and may not be offered in the United States of America absent such registration or an exemption from registration. There will be no public offering of such securities in the United States of America.

Key messages A leading and well-positioned universal banking franchise with top-2 positions1 in all client segments of focusSwitzerland: #1 country in global wealth report2, traditionally resilient economy, low unemployment, political stabilityStrong financial profile, capital generation capacity and historically low volatility Swiss Universal Bank Significant further progress expected towards achievement of ambitious targetsClearly identified revenue and cost initiatives as well as digitalization roadmapIPO preparations for Credit Suisse (Schweiz) AG on track for a partial IPO by the end of 2017, market conditions permitting3 Way forward Improved profitability driven by cost discipline and solid volume growth Successful go-live of Credit Suisse (Schweiz) AG on November 20, 2016Announced new organization, aligned to client segments and needs, effective as per January 1, 2017 Progress since last Investor Day Note: Financial and other information is for Swiss Universal Bank division. Scope of Credit Suisse (Schweiz) AG differs from Swiss Universal Bank division1 Private Clients, Mid / Large SME, Large Corporates, Institutional Clients: The Boston Consulting Group; based on revenues 2 Credit Suisse Research Institute 3 Any such IPO would involve the sale of a minority stake and would be subject to, among other things, all necessary approvals and would be intended to generate / raise additional capital for Credit Suisse AG or Credit Suisse (Schweiz) AG

Agenda Swiss Universal Bank 1 Progress since last Investor Day 2 Way forward 3

Track record of rising adjusted PTI generation underpinned by resilient risk profile Historical adjusted PTI showing low volatility and significant YoY growth since beginning of 2016Switzerland offers an attractive and comparatively low-risk market environment where Swiss Universal Bank manages a high quality credit portfolio Adjusted pre-tax income1 in CHF mn 1Q 2Q 3Q 431 472 432 457 431 400 +10% +6% +8% 1Q 2Q 3Q Risk profile metrics 23 6 33 9 30 39 6 1 8 2 10 7 Ann. credit losses / net loans2in bps Provisions for credit lossesin CHF mn 2015 2016 2015 2016 Note: Adjusted results are non-GAAP financial measures. A reference to the reconciliation to reported results and a reconciliation of adjustments applied for Swisscard are included in the Appendix. Financial and other information is for Swiss Universal Bank division. Scope of Credit Suisse (Schweiz) AG differs from Swiss Universal Bank division 1 Excludes Swisscard impact 2 Annualized numbers do not take account of variations in operating results, seasonality and other factors and may not be indicative of actual, full-year results Swiss Universal Bank Progress Way forward

~12%1 ~14%1 ~30%2 ~17%2 ~44%2 Strong franchise with #1 or #2 market positions in Switzerlandacross client segments Note: Financial and other information is for Swiss Universal Bank division. Scope of Credit Suisse (Schweiz) AG differs from Swiss Universal Bank division 1 Private Clients, Mid / Large SME, Large Corporates, Institutional Clients: The Boston Consulting Group; based on revenues in 2015 2 Equity Capital Markets (ECM): Dealogic; Debt Capital Markets (DCM): IFR; M&A: Thomson Securities, SDC Platinum, CS; based on deal volumes Jan – Dec 23 2015 3 Incl. Affiliates (BANK-now, Swisscard, Neue Aargauer Bank) 4 Small and Medium Enterprises 5 Excl. CS Asset Management Switzerland 6 Swiss-based External Asset Managers only Private Clients Corporate Clients Mid / large SMEs4 ECM DCM M&A IB CH CS market share1 Position1 CS market share Position Large Corporates #2 1 #2 1 #1 2 ~12% Institutional Clients Institutionals5 External Asset Managers6 CS market share1 Position1 #1 #1 ~19% Retail, Affluent & HNWI3 ~11% #2 UHNWI #2 ~29% Best Discretionary & Advisory Service Offering | 2016 Succession Planning Advice and Trusts SRI / Social Impact Investing | 2016 Best Family Office Offering | 2016, 2014 89% satisfaction rate of our Private and Wealth Management Clients Switzerland | 2016 Best Trade Finance Bank in Switzerland2016 Best Investment Bank in Switzerland2015, 2014, 2013, 2012, 2007, 2006, 2005, 2004, 2003, 2002, 2001, 2000 Swiss Franc Bond House of the Year2015, 2014, 2012, 2011, 2010, 2008, 2007, 2006, 2004, 2002, 2001, 2000 Best Foreign Exchange Provider in Switzerland | 2016, 2015, 2013, 2012, 2011, 2010, 2009 Best Swiss Global Custodian | 2015 Swiss Universal Bank Progress Way forward

Agenda Swiss Universal Bank 1 Progress since last Investor Day 2 Way forward 3

Significant progress since last Investor Day 9M16 adjusted PTI of CHF 1.36 bn – up 8%1 year-on-year, despite challenging marketBoth sub-divisions – PB and C&IB – contributed equally to this improvementImproved adjusted cost income ratio and return on regulatory capital 9M16 adjusted operating expenses reduced by 3%1 year-on-yearRigorous management of FTE and consultants / contractors; reduced discretionary and corporate function spendCombination of solid loan growth, low credit losses and enhanced capital velocity Credit Suisse (Schweiz) AG went live on November 20, 2016~1.4 mn clients, ~6,500 employees, ~CHF 220 bn total balance sheet2, ~CHF 525 bn AuM2 transferred successfullyLarge project with ~1,500 employees working for 3 years and ~560 IT system changes Improved Profitability Cost and Capital Discipline Credit Suisse (Schweiz) AG Improving Share of Wallet Increased business volumes across AuM, other client assets and loans in all segmentsImproved mandates penetration at 29% in PB as of end of 3Q16, driven by “Credit Suisse Invest”Gaining further market share in corporate and investment banking and with entrepreneurs Note: Adjusted results are non-GAAP financial measures. A reference to the reconciliation to reported results and a reconciliation of adjustments applied for Swisscard are included in the Appendix. Financial and other information is for Swiss Universal Bank division. Scope of Credit Suisse (Schweiz) AG differs from Swiss Universal Bank division 1 Excludes Swisscard impact 2 As of August 1, 2016 Swiss Universal Bank Progress Way forward

+8% Despite challenging markets… Improved profitability despite challenging markets Negative interest rates, negatively impacting deposit businessMarket disruptions and increased volatility (i.e., Brexit, political uncertainties)Slow economic growth across Europe, including in SwitzerlandSubdued client activity across private, corporate and institutional bankingIncreased lending competition by non-banksNeed to continuously invest in regulatory and digitalization projects Adjusted pre-tax income1in CHF mn 9M16 9M15 Adj. return on regulatory capital†,1 …consistent profitability improvements Note: Adjusted results are non-GAAP financial measures. A reference to the reconciliation to reported results and a reconciliation of adjustments applied for Swisscard are included in the Appendix. Financial and other information is for Swiss Universal Bank division. Scope of Credit Suisse (Schweiz) AG differs from Swiss Universal Bank division 1 Excludes Swisscard impact † See Appendix 14% 15% Swiss Universal Bank Progress Way forward +7% +8% +1 pp. Corporate & Institutional Banking Private Banking 1,263 1,360 9M16 9M15

Rigorous management of FTEs / contractors / consultantsReduced non-personnel expenses:8% reduction of number of branchesLower IT / Ops and other corporate functions spend Continue to focus on cost and capital discipline Note: Adjusted results are non-GAAP financial measures. A reference to the reconciliation to reported results and a reconciliation of adjustments applied for Swisscard are included in the Appendix. Financial and other information is for Swiss Universal Bank division. Scope of Credit Suisse (Schweiz) AG differs from Swiss Universal Bank division 1 TBTF = Too-big-to-fail, FIDLEG = Finanzdienstleistungsgesetz (Financial Services Act), MiFID = Markets in Financial Instruments Directive, MRP = Margin Rule Program, AEI - Automatic Exchange of Information 2 Excludes Swisscard impact Adjusted operating expenses2in CHF mn Capital Discipline 9M15 2,609 Regulatory, compliance & digitalization 2,697 (122) Savings 34 9M16 Adjusted cost/incomeratio Swiss Universal Bank Progress Way forward 65% Cost Discipline Delivered 3% reduction of adjusted operating expensesInvested in compliance, risk and tax / regulatory programs in relation to e.g. TBTF, FIDLEG / MiFID, MRP, AEI1 Continued further development of platform management and digitalization 67% (3)% Continuing to implement measures to further manage balance sheet and RWA:Successfully placed two synthetic securitizations of loan portfolios resulting in CHF 3 bn RWA reduction in 1H16Mortgage Fund Project under way planned to be launched in 4Q16 with further up-scaling in 2017

Focus on selectively growing revenues across PB and C&IB client franchise… Net loans in CHF bn Assets under Management in CHF bn PB Mandates penetration in % Tailor-made wealth management offering through “Credit Suisse Invest”, launched in 2Q15Positive reception by clients with >70,000 “Credit Suisse Invest” contracts signed as of 3Q16Attractive price model designed to promote potential for recurring revenues Solid AuM growth in PB & Institutional clientsNet New Assets 9M16 of CHF 1.8 bn in Private Banking and CHF 1.8 bn in Corporate & Institutional BankingContinued selective External Asset Managers exits Lending is a key revenue driver supported by a high quality credit portfolioInterest income driven by loan volume growth, higher margins from repricing measures on maturing loans and selective IPRE1 optimization 4Q15 26 2Q16 3Q15 24 28 1Q16 3Q16 29 27 500 9M15 9M16 529 PB Note: Financial and other information is for Swiss Universal Bank division. Scope of Credit Suisse (Schweiz) AG differs from Swiss Universal Bank division 1 Income Producing Real Estate C&IB Swiss Universal Bank Progress Way forward +2% +6% +5 pp. 9M15 9M16

3Q16 2015 …and making progress on delivering the full franchise to our core clients “Bank for Entrepreneurs” Ramping up to facilitate ambitious growth targetsSuccessful increase of 30 E&E (Entrepreneurs & Executives) Relationship Managers (combination of hires and upgrades)Swiss market covered by 21 desks including 18 joint locations with SME1 businessAligned incentive models to foster collaborationProduct review completed and several offering projects launched E&E RMs 3Q16 2015 Desks Large Swiss corporate partnership with IBCM Successfully demonstrating our global full range capabilities:Cross-border transactions involving M&A advisory and integrated financing solutionsStrong cross-divisional collaboration between geographies and product groups across Credit Suisse Credit Suisse is acting as Financial Advisor & Offer Manager Pending USD42.7bnPublic tender offer for Credit Suisse is acting as Exclusive Financial Advisor to gategroup Pending CHF1.4bn Public tender offer from Credit Suisse acted as Lead Left Bookrunner September 2016 Initial Public Offering on NasdaqUSD609m market capitalisation Credit Suisse acted as Exclusive Financial Advisor to Galenica July 2016 USD1.53bn acquisition of Credit Suisse acted as Joint Global Coordinator and Joint Bookrunner April 2016 CHF621m Initial Public Offering on SIX Swiss Exchange Note: Financial and other information is for Swiss Universal Bank division. Scope of Credit Suisse (Schweiz) AG differs from Swiss Universal Bank division 1 Small- and medium-sized enterprises Swiss Universal Bank Progress Way forward +64% +91%

Credit Suisse (Schweiz) AG, our fully licensed Swiss legal entity, has successfully gone live Go-live successfully completed on time after three years of hard workA Leading universal bank in Switzerland with a strong business profile Credit Suisse (Schweiz) AG set up as strong, purely domestic entity Nov 20, 2016Credit Suisse (Schweiz) AG go live completedEntity fully operational, with ~1.4mn clients, ~6,500 employees, ~CHF 220 bn balance sheet volume1 and ~CHF 525 bn AuM1 transferred successfully 1H17Finalization of intragroup relationships 4Q18STS4 1Q17Setup of AM JV3 Nov 2013Announcement of Swiss legal entity program 1Q17Subsidiaries transfer2 Close cooperation with Credit Suisse AG in regard to Asset Management and STS Fully licensed pure-play Swiss bank with differentiated product franchise that benefits from synergies and global reach of CS Group Experienced management team to promote clear accountability for Credit Suisse (Schweiz) AG Strong balance sheet intended to be well capitalized Swiss Universal Bank Progress Way forward targeted timeline Note: Financial and other information is for Swiss Universal Bank division. Scope of Credit Suisse (Schweiz) AG differs from Swiss Universal Bank division 1 As of August 1, 2016 2 Neue Aargauer Bank, BANK-now and Swisscard (50% equity interest) 3 Timing subject to FINMA approval / license 4 Retransfer to CS AG intended to be finalized at the latest by 4Q18
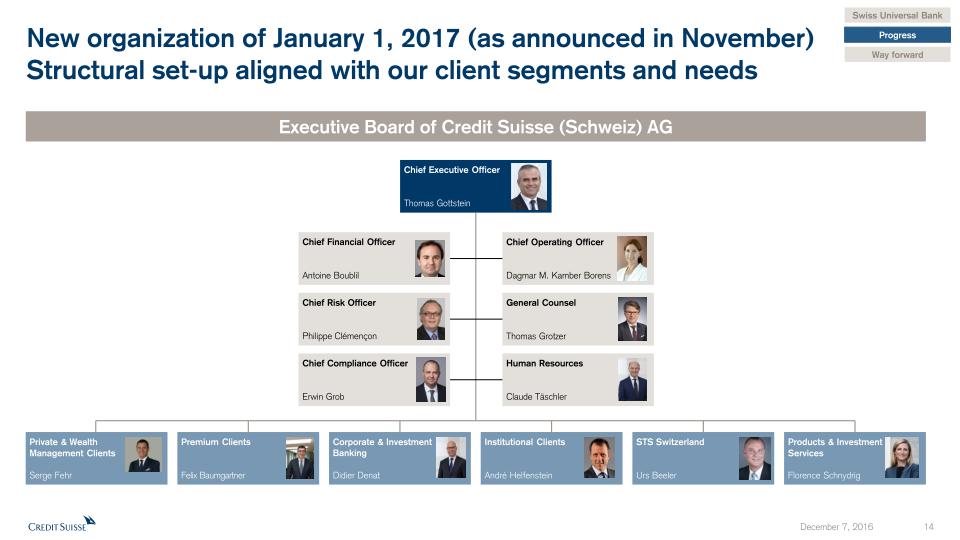
Executive Board of Credit Suisse (Schweiz) AG Chief Executive Officer Thomas Gottstein Institutional ClientsAndré Helfenstein Premium ClientsFelix Baumgartner Private & Wealth Management ClientsSerge Fehr STS SwitzerlandUrs Beeler Corporate & Investment BankingDidier Denat Products & Investment ServicesFlorence Schnydrig New organization of January 1, 2017 (as announced in November)Structural set-up aligned with our client segments and needs Swiss Universal Bank Progress Way forward Human ResourcesClaude Täschler Chief Compliance OfficerErwin Grob Chief Risk OfficerPhilippe Clémençon General CounselThomas Grotzer Chief Financial OfficerAntoine Boublil Chief Operating OfficerDagmar M. Kamber Borens

Agenda Swiss Universal Bank 1 Progress since last Investor Day 2 Way forward 3

Our Ambitions Consistently delivering the best value proposition for our three client segments: Private Clients, Corporate Clients, Institutional ClientsCombining simple, low-risk business model (focusing on Swiss-domiciled clients) with access to international, best-in-class IB and AM services to help enable strong business growthDriving efficiency agenda: Further optimizing our organization and processes along client needs and segments, eliminate duplication, centralize products and support functions, strive for flatter hierarchy and further automationStrengthening our brand: Be recognized as THE Bank for Entrepreneurs in SwitzerlandProducing strong and consistent Return on Equity, in excess of our cost of capital Swiss Universal Bank Progress Way forward Note: Financial and other information is for Swiss Universal Bank division. Scope of Credit Suisse (Schweiz) AG differs from Swiss Universal Bank division
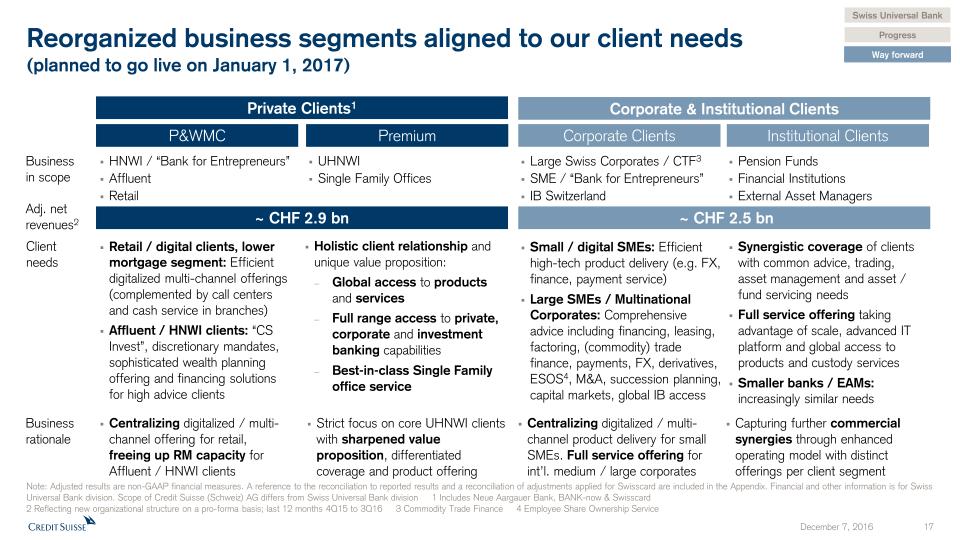
Reorganized business segments aligned to our client needs (planned to go live on January 1, 2017) Private Clients1 Corporate Clients Institutional Clients Businessin scope HNWI / “Bank for Entrepreneurs”AffluentRetail UHNWISingle Family Offices Pension Funds Financial InstitutionsExternal Asset Managers Client needs Retail / digital clients, lower mortgage segment: Efficient digitalized multi-channel offerings (complemented by call centers and cash service in branches)Affluent / HNWI clients: “CS Invest”, discretionary mandates, sophisticated wealth planning offering and financing solutions for high advice clients Holistic client relationship and unique value proposition:Global access to products and servicesFull range access to private, corporate and investment banking capabilitiesBest-in-class Single Family office service Synergistic coverage of clients with common advice, trading, asset management and asset / fund servicing needsFull service offering taking advantage of scale, advanced IT platform and global access to products and custody servicesSmaller banks / EAMs: increasingly similar needs P&WMC Premium Business rationale Centralizing digitalized / multi-channel offering for retail, freeing up RM capacity for Affluent / HNWI clients Strict focus on core UHNWI clients with sharpened value proposition, differentiated coverage and product offering Capturing further commercial synergies through enhanced operating model with distinct offerings per client segment ~ CHF 2.9 bn Adj. net revenues2 Large Swiss Corporates / CTF3SME / “Bank for Entrepreneurs”IB Switzerland Small / digital SMEs: Efficient high-tech product delivery (e.g. FX, finance, payment service)Large SMEs / Multinational Corporates: Comprehensive advice including financing, leasing, factoring, (commodity) trade finance, payments, FX, derivatives, ESOS4, M&A, succession planning, capital markets, global IB access Centralizing digitalized / multi-channel product delivery for small SMEs. Full service offering for int’l. medium / large corporates ~ CHF 2.5 bn Note: Adjusted results are non-GAAP financial measures. A reference to the reconciliation to reported results and a reconciliation of adjustments applied for Swisscard are included in the Appendix. Financial and other information is for Swiss Universal Bank division. Scope of Credit Suisse (Schweiz) AG differs from Swiss Universal Bank division 1 Includes Neue Aargauer Bank, BANK-now & Swisscard 2 Reflecting new organizational structure on a pro-forma basis; last 12 months 4Q15 to 3Q16 3 Commodity Trade Finance 4 Employee Share Ownership Service Corporate & Institutional Clients Swiss Universal Bank Progress Way forward

Revenue initiatives targeted to deliver >CHF 200 mn by 2018 Privateclients Corporate clients Institutional clients Offer best-in-class banking services for digital/retail clients, leveraging digital capabilities and upgrade call centersFurther define client focus in our Affluent and HNWI segments by reducing RM load (number of clients) by over 30% to increase advice intensity and quality as well as to further strengthen sales cultureContinue to invest in hiring E&E Relationship Managers for “Bank for Entrepreneurs” initiative and U/HNWI RMsIncrease UHNWI market shares with a unique offering leveraging our private, corporate & IB capabilities Intensify asset management coverage and further expand product offering, institutional advice, trading, asset servicing and platform services, thereby leveraging our leading Pension Funds and Asset Manager offering in a consolidating market looking for full service providersTake advantage of our Financial Institutions scale offering, end-to-end service and global bank network, be a key service partner for Swiss EAMs / Multi Family Offices building on leading platform and exploit revenue synergies between the two segments Strictly segment SME universe in small SMEs with standardized client needs, served centrally and in high-advice SMEs where we continue to expand our coverage in our branches, including our “Bank for Entrepreneurs” initiative Build on our leading franchise for large Swiss corporates with our strong and established Investment Banking capabilitiesProvide extended range of innovative financing capabilities (e.g. mid market lending, synthetic securitization, mortgage funds) Swiss Universal Bank Progress Way forward Note: Financial and other information is for Swiss Universal Bank division. Scope of Credit Suisse (Schweiz) AG differs from Swiss Universal Bank division

Cost measures initiated with incremental >CHF 200 mn net savings target by 2018 in addition to the ~CHF 100 mn net savings expected in 20161 Regional structure Reduce management layers to run business at local market levels resulting in significantly increased spans of control, driving faster decisionsEnhance our location footprint by ramping up our Swiss Service Center in Gümlingen, Berne Centralize product delivery according to best-owner principle and eliminate duplicationsSimplify, standardize and centralize support functionsContinue to realize reduction of corporate functions spend Digitalization Organization Follow through and deliver front-to-back digitalization of operations & new payment platformRamp up digital on-boarding, RM client coverage tool and corporate client portal Client coverage Increase proportion of retail and affluent clients served digitally or through high-quality call centers, organized in one sub-segment to reduce number of RMs serving Affluent segmentsRedesign SME operating model for flow business to benefit from centralization and automation Swiss Universal Bank Progress Way forward Note: Adjusted results are non-GAAP financial measures. A reference to the reconciliation to reported results and a reconciliation of adjustments applied for Swisscard are included in the Appendix. Financial and other information is for Swiss Universal Bank division. Scope of Credit Suisse (Schweiz) AG differs from Swiss Universal Bank division 1 Indicatively based on 2016 vs. 2015 annualized 9M numbers 2 Savings targets, adjusted costs which are non-GAAP financial measures excluding restructuring costs

Digitalization Roadmap Self Onboarding At home or on the go, features digital product selection, contract / signature, independent from branch location and opening hoursGoal to reduce manual and paper based efforts in our branches RMproductivitytools Combining over 30 previously separate functions into one seamless workplaceGoal to reduce manual efforts, free up time for client facing activities and focus on individual client needs Digital Corporate Portal Delivering differentiating digital offerings to our corporate and institutional clientsFocus on digital credit processes, liquidity management and self service tools, offering clients more transparency and efficiency Achieved In Launch eamXchange 2.0 Corporate Cash Manager Mobile & Tablet Banking App Savings Plus Online Mortgage Renewal Portfolio Review App Mortgage Calculator CS Invest Explorer App Relationship Manager Corporate and Institutional Clients Private Clients ProWealth One Swiss Universal Bank Progress Way forward

Financial target for Swiss Universal Bank division Confirming clear ambition to execute on cost agenda Targeted revenue growth driven by new organization but also market dependent Note: Adjusted results are non-GAAP financial measures. A reference to the reconciliation to reported results and a reconciliation of adjustments applied for Swisscard are included in the Appendix. Financial and other information is for Swiss Universal Bank division. Scope of Credit Suisse (Schweiz) AG differs from Swiss Universal Bank division 1 Refers to Swiss Universal Bank division. The scope of revenues and expenses of the Swiss Universal Bank divisions varies from the planned scope of Credit Suisse (Schweiz) AG and its subsidiaries which is planned to be subject to the IPO. It is therefore not possible to make a like-for-like comparison of the Swiss Universal Bank division and Credit Suisse (Schweiz) AG as an IPO vehicle 2 Excludes Swisscard impact Swiss Universal Bank Progress Way forward Adjusted pre-tax income development in CHF bn 2.31 20152 1.6 1.3(9M15) 2018 Target 2016 Outlook 1.4(9M16) 4Q16 20142 (1)% revenues 9M16Driven by lower client activity(3)% cost 9M16Driven by strict cost management +1-3% revenues p.a.Driven by clearly identified revenue initiatives, but market dependent(3)% cost p.a. Driven by clearly identified cost measures +8%

Swiss Universal Bank vs. Credit Suisse (Schweiz) AG Scope & financials Completion of the Swiss Asset Management JV incorporation and grant of FINMA licenseFinalization of RWA methodology calibration (standard model with floor versus advanced model approach) with FINMAFinalization of going concern / gone concern capital calibration as well as intra-group funding plansFinal agreement with FINMA relating to scope of Global Services Company, incl. Swiss IT, operations and other corporate functionsFinalization of all other intra-group revenues sharing agreements and service level agreements The business perimeter and client universe of Credit Suisse (Schweiz) AG and its future subsidiaries1 will be largely identical to the Swiss Universal Bank divisionCredit Suisse (Schweiz) AG’s financials will differ from Swiss Universal Bank division driven by, but not limited to, the following items and will be available post 1Q17: Note: Financial and other information is for Swiss Universal Bank division. Scope of Credit Suisse (Schweiz) AG differs from Swiss Universal Bank1 Neue Aargauer Bank, BANK-now and Swisscard (50% equity interest) More details on Credit Suisse (Schweiz) AG financials, key metrics and parameter will be provided in 2Q17 Swiss Universal Bank Progress Way forward

Roadmap to planned IPO June 30, 2017 December 31, 2017 Credit Suisse (Schweiz) AGgo live First published statutory financial statements of Credit Suisse (Schweiz) AG IPO of 20-30%1Market conditions permitting Final calibration of RWA requirements by FINMA Nov 20, 2016 March 24, 2017 March 31, 2017 Further guidance on Credit Suisse (Schweiz) AG financials, key metrics and parameter Intercompany model finalized / Service Company set-up Swiss Universal Bank Progress Way forward 1 Any such IPO would involve the sale of a minority stake and would be subject to, among other things, all necessary approvals and would be intended to generate / raise additional capital for Credit Suisse AG or Credit Suisse (Schweiz) AG estimated timeline

Key take-aways We made significant progress towards achievement of our strategic ambitions, with 9M16 adjusted PTI up by 8%1 year-on-year in a challenging market environment New business organization, effective on January 1, 2017, will generate additional momentum Credit Suisse (Schweiz) AG has successfully gone live on November 20, 2016 Progress since last Investor Day Way forward IPO scope Legal entity program Consolidation scope of Credit Suisse (Schweiz) AG is expected to be finalized in the course of 1Q17 IPO timeline IPO preparations for Credit Suisse (Schweiz) AG are on track for a partial initial public offering in 2H17, market conditions permitting2 Note: Adjusted results are non-GAAP financial measures. A reference to the reconciliation to reported results and a reconciliation of adjustments applied for Swisscard are included in the Appendix. Financial and other information is for Swiss Universal Bank division. Scope of Credit Suisse (Schweiz) AG differs from Swiss Universal Bank division 1 Excludes Swisscard impact 2 Any such IPO would involve the sale of a minority stake and would be subject to, among other things, all necessary approvals and would be intended to generate / raise additional capital for Credit Suisse AG or Credit Suisse (Schweiz) AG Swiss Universal Bank Progress Way forward

Appendix

Swisscard deconsolidation impactImpact of the deconsolidation on the Swiss Universal Bank Note: Adjusted results are non-GAAP financial measures. A reference to the reconciliation to reported results for other adjustments not relating to Swisscard is included in the Notes of this presentation † See AppendixThis is an illustrative pro-forma presentation of the impact of the deconsolidation of the card issuing business on the historical results of SUB as if it had occurred on December 31, 2014. Given that as of July 1, 2015 the business has been deconsolidated and transferred to the equity method investment, Swisscard AECS GmbH and the transaction does not qualify for discontinued operations, the historical results are not restated in this respect. The reduction in pre-tax income in the Private Banking business of Swiss Universal Bank is offset by the reduction in minority interest from the deconsolidation at the Group level, therefore there is no material impact on the Group’s net income attributable to shareholders. These illustrative figures cannot be seen as being indicative of future trends or results 1 Pro-forma impact of the card issuing business deconsolidation in CHF mn 1Q15 2Q15 3Q15 9M15 1Q15 2Q15 3Q15 9M15 1Q15 2Q15 3Q15 9M15 Net interest income 611 685 708 2,004 9 9 - 18 602 676 708 1,986 Recurring commissions & fees 412 412 372 1,196 56 59 - 115 356 353 372 1,081 Transaction-based revenues 382 349 295 1,026 8 7 - 15 374 342 295 1,011 Other revenues (5) (7) (11) (23) - - - - (5) (7) (11) (23) Net revenues 1,400 1,439 1,364 4,203 73 75 - 148 1,327 1,364 1,364 4,055 Provision for credit losses 23 33 39 95 - - - - 23 33 39 95 Total operating expenses 934 961 925 2,820 61 62 - 123 873 899 925 2,697 Pre-tax income 443 445 400 1,288 12 13 - 25 431 432 400 1,263 Return on regulatory capital† 14% 14% 13% 14% - - - - 14% 14% 13% 14% SUB adjusted Swisscard Impact1 SUB adjusted ex Swisscard Adjusted results are non-GAAP financial measures that exclude goodwill impairment and certain other revenues and expenses included in our reported results. Management believes that adjusted results provide a useful presentation of our operating results for purposes of assessing our Group and divisional performance consistently over time, on a basis that excludes items that management does not consider representative of our underlying performance. Provided below is a reconciliation of our adjusted results to the most directly comparable US GAAP measures.

Notes For reconciliation of adjusted to reported results, refer to the appendix of either the CEO or CFO Investor Day 2016 presentation. All reconciliations are available in the respective appendix.Throughout the presentation rounding differences may occur.All risk-weighted assets (RWA) and leverage exposure figures shown in this presentation are as of the end of the respective period and on a “look-through” basis.Gross and net margins are shown in basis points (bps). Gross margin = adj. net revenues annualized / average AuM; net margin = adj. pre-tax income annualized / average AuM.Mandates penetration reflects advisory and discretionary mandates as percentage of total AuM, excluding AuM from the external asset manager (EAM) business. General notes * “Adjusted operating expenses at constant FX rates” include adjustments as made in all our disclosures for restructuring expenses, major litigation expenses and a goodwill impairment taken in 4Q15 as well as adjustments for FX, applying the following main currency exchange rates for 1Q15: USD/CHF 0.9465, EUR/CHF 1.0482, GBP/CHF 1.4296, 2Q15: USD/CHF 0.9383, EUR/CHF 1.0418, GBP/CHF 1.4497, 3Q15: USD/CHF 0.9684, EUR/CHF 1.0787, GBP/CHF 1.4891, 4Q15: USD/CHF 1.0000, EUR/CHF 1.0851, GBP/CHF 1.5123, 1Q16: USD/CHF 0.9928, EUR/CHF 1.0941, GBP/CHF 1.4060, 2Q16: USD/CHF 0.9756, EUR/CHF 1.0956, GBP/CHF 1.3845, 3Q16: USD/CHF 0.9728, EUR/CHF 1.0882, GBP/CHF 1.2764. These currency exchange rates are unweighted, i.e. a straight line average of monthly rates. We apply this calculation consistently for the periods under review.† Regulatory capital reflects the worst of 10% of RWA and 3.5% of leverage exposure. Return on regulatory capital is based on (adjusted) returns after tax assuming a tax rate of 30% for all periods and capital allocated based on the worst of 10% of average RWA and 3.5% of average leverage exposure. For Global Markets and Investment Banking & Capital Markets, return on regulatory capital is based on US dollar denominated numbers. Specific notes Abbreviations Adj. = Adjusted; AT1 = Additional Tier 1; AM = Asset Management; ann. = annualized; APAC = Asia Pacific; AuM = Assets under Management; BCBS = Basel Committee on Banking Supervision; BIS = Bank for International Settlements; bps = basis points; BRRD = Bank Recovery and Resolution Directive; CAO = Capital Adequacy Ordinance; CET1 = Common Equity Tier 1; Corp. Ctr. = Corporate Center; C&IB = Corporate & Institutional Banking; CRO = Chief Risk Officer; CCRO = Compliance and Regulatory Affairs; CVA = Credit Valuation Adjustment; ECM = Equity Capital Markets; EM = Emerging Markets; EMEA=Europe, Middle East & Africa; FINMA = Swiss Financial Market Supervisory Authority; FRTB = Fundamental review of the trading book; FSB = Financial Stability Board; FTE = Full time equivalents; FVoD = Fair Value of Own Debt; FX = Foreign Exchange; GM = Global Markets; GMAR = Global Markets Accelerated Restructuring; HoldCo = Holding Company; HQ = Headquarters; HQLA = High Quality Liquid Assets; IB = Investment Banking; IBCM = Investment Banking & Capital Markets; ID = Investor Day; IHC = Intermediate Holding Company; IOSCO = The International Organization of Securities Commissions; IPO = Initial Public Offer; IRB = Internal Ratings-Based; IWM = International Wealth Management; KPI = Key Performance Indicator; LATAM =Latin America; LCR = Liquidity Coverage ratio; M&A = Mergers & Acquisitions; NCWOL = No Creditor Worse Off than in Liquidation; NNA = Net new assets; NSFR = Net Stable Funding Ratio; OpCo = Operating Company; OpRisk = Operational Risk PB = Private Banking; PB&WM = (Former) Private Banking & Wealth Management (division) pp. = percentage points; PTI = Pre-tax income; PONV = Point of Non-Viability; QoQ = Quarter-on-quarter; RM(s) = Relationship Manager(s); RoRC = Return on regulatory capital; RWA = Risk Weighted Assets; SA-CCR = Standardized Approach - Counterparty Credit Risk; SME = Small and Medium Enterprises; SMG = Systematic Market-Making Group; SoW = Share of Wallet; SRU = Strategic Resolution Unit; STS = Sales and Trading Services; SUB = Swiss Universal Bank; T1= Tier 1 capital; TBTF = Too Big to Fail; TLAC = Total loss absorbing capacity; (U)HNW(I) = (Ultra) High Net Worth (Individuals); WM = Wealth Management; YoY = Year-on-Year; YTD = Year To Date

Credit Suisse Investor Day 2016Asia PacificHelman Sitohang December 7, 2016

Disclaimer (1/2) The data presented in this presentation relating to the Swiss Universal Bank refers to the division of Credit Suisse Group as the same is currently managed within Credit Suisse Group. The scope, revenues and expenses of the Swiss Universal Bank vary from the planned scope of Credit Suisse (Schweiz) AG and its subsidiaries, planned to be subject to a partial IPO, market conditions permitting. Any such IPO would involve the sale of a minority stake and would be subject to, among other things, all necessary approvals.It is therefore not possible to make a like-for-like comparison of the Swiss Universal Bank as a division of Credit Suisse Group on the one hand and Credit Suisse (Schweiz) AG as a potential IPO vehicle on the other hand.Cautionary statement regarding forward-looking statements This presentation contains forward-looking statements that involve inherent risks and uncertainties, and we might not be able to achieve the predictions, forecasts, projections and other outcomes we describe or imply in forward-looking statements. A number of important factors could cause results to differ materially from the plans, objectives, expectations, estimates and intentions we express in these forward-looking statements, including those we identify in "Risk Factors” in our Annual Report on Form 20-F for the fiscal year ended December 31, 2015 and in “Cautionary statement regarding forward-looking information" in our media release relating to Investor Day, published on December 7, 2016 and filed with the US Securities and Exchange Commission, and in other public filings and press releases. We do not intend to update these forward-looking statements except as may be required by applicable law. In particular, the terms “Illustrative”, “Ambition”, “Outlook” and “Goal” are not intended to be viewed as targets or projections, nor are they considered to be Key Performance Indicators. All such illustrations, ambitions and goals are subject to a large number of inherent risks, assumptions and uncertainties, many of which are completely outside of our control. Accordingly, this information should not be relied on for any purpose. We do not intend to update these illustrations, ambitions or goals.We may not achieve the benefits of our strategic initiativesWe may not achieve all of the expected benefits of our strategic initiatives. Factors beyond our control, including but not limited to the market and economic conditions, changes in laws, rules or regulations and other challenges discussed in our public filings, could limit our ability to achieve some or all of the expected benefits of these initiatives. Estimates and assumptionsIn preparing this presentation, management has made estimates and assumptions that affect the numbers presented. Actual results may differ. Figures throughout presentation may also be subject to rounding adjustments. Cautionary Statements Relating to Interim Financial InformationThis presentation contains certain unaudited interim financial information as of or for periods after September 30, 2016, the date of our last published quarterly financial statements. This information has been derived from management accounts, is preliminary in nature, does not reflect the complete results of the fourth quarter of 2016 and is subject to change, including as a result of any normal quarterly adjustments in relation to the financial statements for the fourth quarter of 2016. This information has not been subject to any review by our independent registered public accounting firm. There can be no assurance that the final results for these periods will not differ from these preliminary results, and any such differences could be material. Quarterly financial results for the fourth quarter of 2016 will be included in our 4Q16 Earnings Release, and audited consolidated financial statements for full-year 2016 will be included in our Annual Report on Form 20-F for the year ended December 31, 2016, when they are published. These interim results of operations are not necessarily indicative of the results to be achieved for the remainder of the fourth quarter or the full year 2016.
Disclaimer (2/2) Statement regarding non-GAAP financial measures This presentation also contains non-GAAP financial measures, including adjusted results. Information needed to reconcile such non-GAAP financial measures to the most directly comparable measures under US GAAP or a reference thereto can be found in this presentation in the Appendix, which is available on our website at credit-suisse.com.Statement regarding capital, liquidity and leverage As of January 1, 2013, Basel 3 was implemented in Switzerland along with the Swiss “Too Big to Fail” legislation and regulations thereunder (in each case, subject to certain phase-in periods). As of January 1, 2015, the Bank for International Settlements (BIS) leverage ratio framework, as issued by the Basel Committee on Banking Supervision (BCBS), was implemented in Switzerland by FINMA. Our related disclosures are in accordance with our interpretation of such requirements, including relevant assumptions. Changes in the interpretation of these requirements in Switzerland or in any of our assumptions or estimates could result in different numbers from those shown in this presentation. Capital and ratio numbers for periods prior to 2013 are based on estimates, which are calculated as if the Basel 3 framework had been in place in Switzerland during such periods. Unless otherwise noted, leverage exposure is based on the BIS leverage ratio framework and consists of period-end balance sheet assets and prescribed regulatory adjustments. Leverage amounts for 4Q14, which are presented in order to show meaningful comparative information, are based on estimates which are calculated as if the BIS leverage ratio framework had been implemented in Switzerland at such time. Beginning in 2015, the Swiss leverage ratio is calculated as Swiss total capital, divided by period-end leverage exposure. The look-through BIS tier 1 leverage ratio and CET1 leverage ratio are calculated as look-through BIS tier 1 capital and CET1 capital, respectively, divided by end-period leverage exposure. Selling restrictions This document, and the information contained herein, is not an offer to sell or a solicitation of offers to purchase or subscribe for securities of Credit Suisse Group AG or Credit Suisse (Schweiz) AG in Switzerland, the United States or any other jurisdiction. This document is not a prospectus within the meaning of article 652a of the Swiss Code of Obligations, nor is it a listing prospectus as defined in the listing rules of the SIX Swiss Exchange AG or any other exchange or regulated trading facility in Switzerland or a prospectus or offering document under any other applicable laws. Copies of this document may not be sent to jurisdictions, or distributed in or sent from jurisdictions, in which such documents are barred or prohibited by law. A decision to invest in securities of Credit Suisse Group AG or Credit Suisse (Schweiz) AG should be based exclusively on a written agreement with Credit Suisse Group AG or an offering and listing prospectus to be published by Credit Suisse Group AG or Credit Suisse (Schweiz) AG for such purpose. Any offer and sale of securities of Credit Suisse (Schweiz) AG will not be registered under the U.S. Securities Act of 1933, as amended, and may not be offered in the United States of America absent such registration or an exemption from registration. There will be no public offering of such securities in the United States of America.
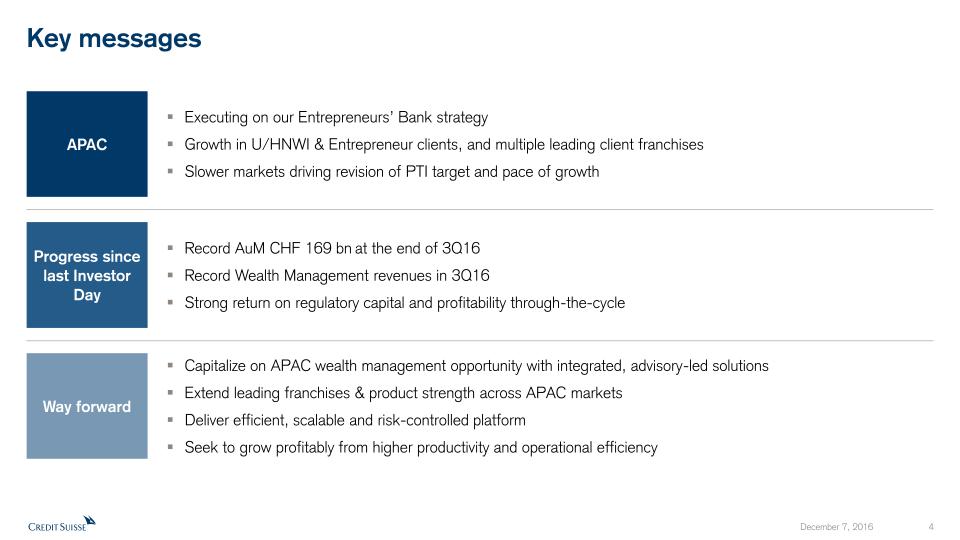
Key messages Executing on our Entrepreneurs’ Bank strategyGrowth in U/HNWI & Entrepreneur clients, and multiple leading client franchisesSlower markets driving revision of PTI target and pace of growth APAC Capitalize on APAC wealth management opportunity with integrated, advisory-led solutionsExtend leading franchises & product strength across APAC marketsDeliver efficient, scalable and risk-controlled platformSeek to grow profitably from higher productivity and operational efficiency Way forward Record AuM CHF 169 bn at the end of 3Q16Record Wealth Management revenues in 3Q16Strong return on regulatory capital and profitability through-the-cycle Progress since last Investor Day

Recap: APAC Target Note: Adjusted results are non-GAAP financial measures. A reference to the reconciliation to reported results is included in the Appendix 1 Including contributions from wealth management connected activities Adjustedpre-tax incomein CHF bn Prior 2018 Target excl. business transfers Market impact Revised 2018Target Cost initiatives 2.0 1.6 0.3 0.7 0.7 0.7 Wealth Management1 Business transfers Prior 2018 Target(ID 2015) 2.1 Adjusted Confirmed 0.7 0.1

Target supported by Wealth Management growth 1.6 Adj. pre-tax income in CHF bn Note: Adjusted results are non-GAAP financial measures
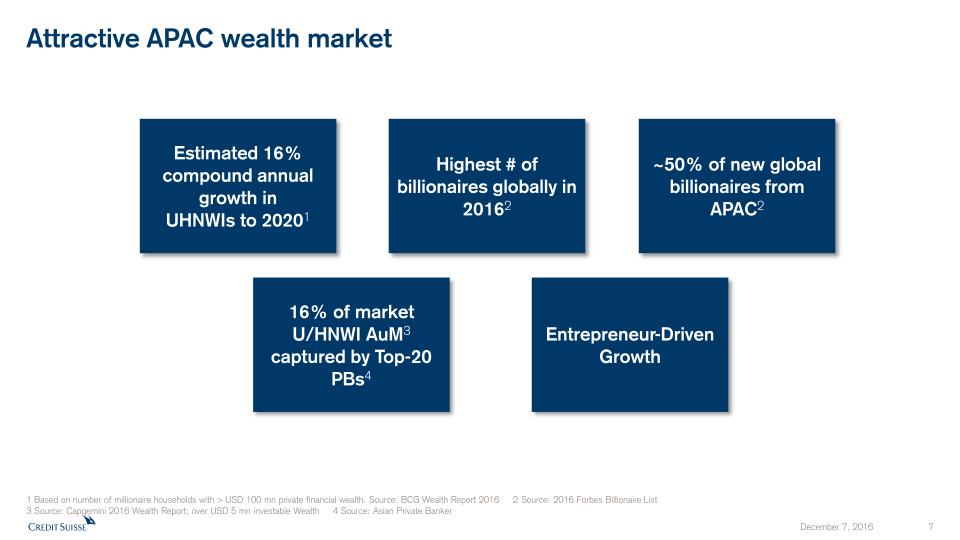
Attractive APAC wealth market Estimated 16% compound annual growth in UHNWIs to 20201 Highest # of billionaires globally in 20162 ~50% of new global billionaires from APAC2 1 Based on number of millionaire households with > USD 100 mn private financial wealth. Source: BCG Wealth Report 2016 2 Source: 2016 Forbes Billionaire List 3 Source: Capgemini 2016 Wealth Report; over USD 5 mn investable Wealth 4 Source: Asian Private Banker 16% of market U/HNWI AuM3 captured by Top-20 PBs4 Entrepreneur-Driven Growth

CS growth momentum in wealth management 1 Includes Wealth Management, Underwriting & Advisory and Financing 2 India AuM growth includes India onshore and NRIs booked in Singapore and Hong Kong CS APAC U/HNWI & Entrepreneur-related performance1 IND2 JPN SEA KOR AUS GC Rev AuM n/a Positive Negative 9M15 – 9M16 Growth Net revenues 12% +17% CAGR

Growth in U/HNW client base 10%+ NNA growth in 9 of 12 last quarters CHF 61 bn of NNA since 20131 AuM / RM in CHF mn 253 260 RMs Gross Margin 81 bps 85 bps Net RMs +100 Solid asset growth & margins Higher RM Productivity AuM in CHF bn +22% Reported NNA 1 1Q13 through 9M16 Drivers of upside

Broader client activity from advisory-led model 1 Source: Dealogic as at December 2, 2016 YTD 2 Includes APAC excl. Japan SoW rank amongst international banks1 #1 #2 #1 #3 #8 M&A #2 ECM #5 DCM #5 Lev Loans #2 IND SEA KOR AUS GC By country/region By product CS APAC U/HNWI & Entrepreneur / Corporates total fees2 Drive multi-product and global solutions Extend and maintain strong market positions Deepen client relationships #1 APAC excl. Japan 9M16 Drivers of upside

Capital solutions for clients’ wealth/business needs Measured increase in credit portfolio Effective risk management Creating balance sheet capacity CHF 4 bn / 12% increase in net loans 72% of originated structured credit volume distributed (9M16) U/HNW & Entrepreneur client focus 0.09% avg. provision for credit losses / net loans 3Q15 to 3Q16 ~80% of notional credit exposure with U/HNW & Entrepreneur clients (3Q16) 0.10% Drivers of upside

Connectivity between markets and WM franchise 1 Average daily cash volumes as of YTD December 2, 2016 vs. 2015 2 HKEx average monthly trading velocity as of end-Oct’16 3 Source: Dealogic, 2016 YTD vs. 2015 YTD as of December 2, 2016. Excludes China A-shares 2016 market headwinds CS APAC Equities and Fixed Income performance excluding SMG – Net revenues, CHF bn Going forward Build U/HNWI solutionse.g. Prime Services for Private Banking and structured funds Enhance product suite e.g. investor strategies, structured credit Broader client accesse.g. family offices, External Asset Managers, Sovereign Wealth Funds, Institutional Investors Greater China Equity Derivatives House of the Year 2016 (21)% Other APAC regions APAC equity trading volumes1 (47)% HKEx Trading Velocity at 20-year low2 Equity Capital Markets fee pools3 (26)% Drivers of upside
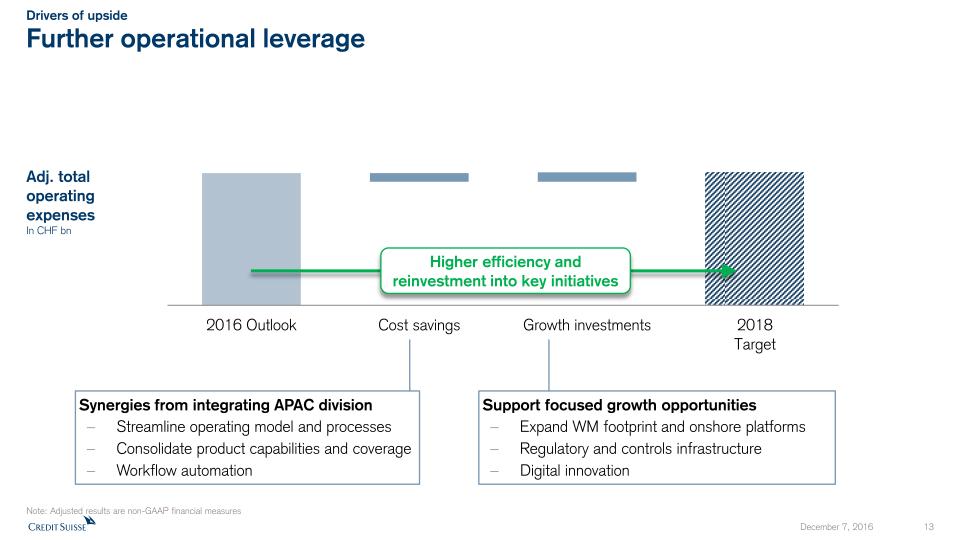
Further operational leverage Synergies from integrating APAC divisionStreamline operating model and processesConsolidate product capabilities and coverageWorkflow automation Support focused growth opportunitiesExpand WM footprint and onshore platformsRegulatory and controls infrastructureDigital innovation Adj. total operating expensesIn CHF bn Higher efficiency and reinvestment into key initiatives Note: Adjusted results are non-GAAP financial measures Drivers of upside
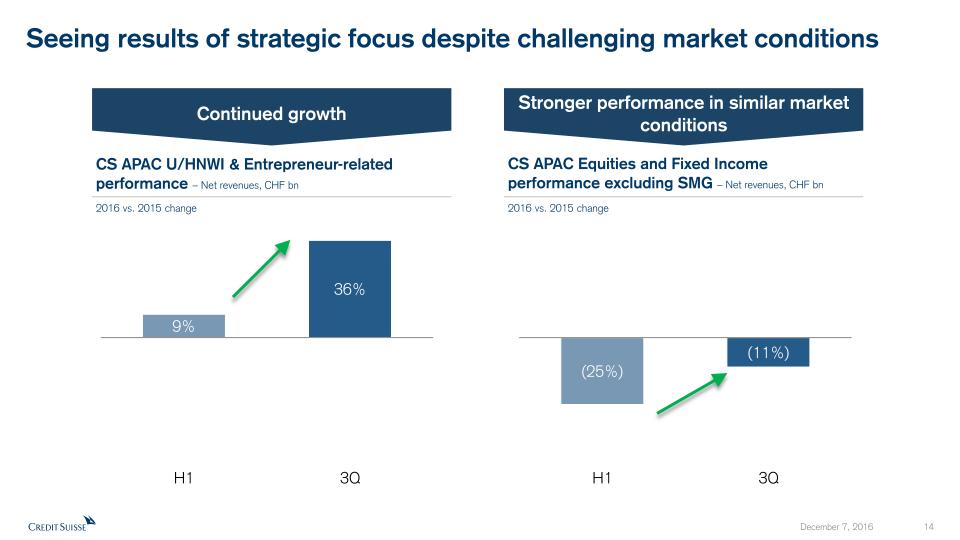
Seeing results of strategic focus despite challenging market conditions CS APAC U/HNWI & Entrepreneur-related performance – Net revenues, CHF bn 2016 vs. 2015 change Continued growth 2016 vs. 2015 change CS APAC Equities and Fixed Income performance excluding SMG – Net revenues, CHF bn Stronger performance in similar market conditions

Summary of initiatives The Entrepreneurs’ Bank of Asia Pacific Continue growth in U/HNWI & Entrepreneur client businessesDrive firm-wide interconnectivity to differentiate client experienceDeliver our multiple leading business franchises via an integrated model Build on our momentum Capture synergies across APAC divisionAccelerate productivity of new hires and resourcesDeliver balanced franchise with strong returns Stay focused
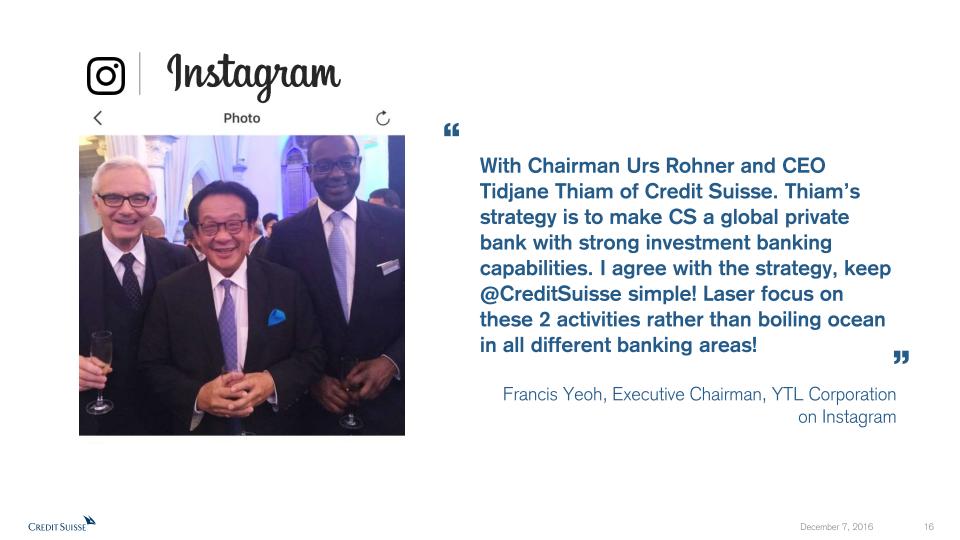
With Chairman Urs Rohner and CEO Tidjane Thiam of Credit Suisse. Thiam’s strategy is to make CS a global private bank with strong investment banking capabilities. I agree with the strategy, keep @CreditSuisse simple! Laser focus on these 2 activities rather than boiling ocean in all different banking areas!Francis Yeoh, Executive Chairman, YTL Corporation on Instagram “ ”

Appendix

Notes For reconciliation of adjusted to reported results, refer to the appendix of either the CEO or CFO Investor Day 2016 presentation. All reconciliations are available in the respective appendix.Throughout the presentation rounding differences may occur.All risk-weighted assets (RWA) and leverage exposure figures shown in this presentation are as of the end of the respective period and on a “look-through” basis.Gross and net margins are shown in basis points (bps). Gross margin = adj. net revenues annualized / average AuM; net margin = adj. pre-tax income annualized / average AuM.Mandates penetration reflects advisory and discretionary mandates as percentage of total AuM, excluding AuM from the external asset manager (EAM) business. General notes * “Adjusted operating expenses at constant FX rates” include adjustments as made in all our disclosures for restructuring expenses, major litigation expenses and a goodwill impairment taken in 4Q15 as well as adjustments for FX, applying the following main currency exchange rates for 1Q15: USD/CHF 0.9465, EUR/CHF 1.0482, GBP/CHF 1.4296, 2Q15: USD/CHF 0.9383, EUR/CHF 1.0418, GBP/CHF 1.4497, 3Q15: USD/CHF 0.9684, EUR/CHF 1.0787, GBP/CHF 1.4891, 4Q15: USD/CHF 1.0000, EUR/CHF 1.0851, GBP/CHF 1.5123, 1Q16: USD/CHF 0.9928, EUR/CHF 1.0941, GBP/CHF 1.4060, 2Q16: USD/CHF 0.9756, EUR/CHF 1.0956, GBP/CHF 1.3845, 3Q16: USD/CHF 0.9728, EUR/CHF 1.0882, GBP/CHF 1.2764. These currency exchange rates are unweighted, i.e. a straight line average of monthly rates. We apply this calculation consistently for the periods under review.† Regulatory capital reflects the worst of 10% of RWA and 3.5% of leverage exposure. Return on regulatory capital is based on (adjusted) returns after tax assuming a tax rate of 30% for all periods and capital allocated based on the worst of 10% of average RWA and 3.5% of average leverage exposure. For Global Markets and Investment Banking & Capital Markets, return on regulatory capital is based on US dollar denominated numbers. Specific notes Abbreviations Adj. = Adjusted; AT1 = Additional Tier 1; AM = Asset Management; ann. = annualized; APAC = Asia Pacific; AuM = Assets under Management; BCBS = Basel Committee on Banking Supervision; BIS = Bank for International Settlements; bps = basis points; BRRD = Bank Recovery and Resolution Directive; CAO = Capital Adequacy Ordinance; CET1 = Common Equity Tier 1; Corp. Ctr. = Corporate Center; C&IB = Corporate & Institutional Banking; CRO = Chief Risk Officer; CCRO = Compliance and Regulatory Affairs; CVA = Credit Valuation Adjustment; ECM = Equity Capital Markets; EM = Emerging Markets; EMEA=Europe, Middle East & Africa; FINMA = Swiss Financial Market Supervisory Authority; FRTB = Fundamental review of the trading book; FSB = Financial Stability Board; FTE = Full time equivalents; FVoD = Fair Value of Own Debt; FX = Foreign Exchange; GM = Global Markets; GMAR = Global Markets Accelerated Restructuring; HoldCo = Holding Company; HQ = Headquarters; HQLA = High Quality Liquid Assets; IB = Investment Banking; IBCM = Investment Banking & Capital Markets; ID = Investor Day; IHC = Intermediate Holding Company; IOSCO = The International Organization of Securities Commissions; IPO = Initial Public Offer; IRB = Internal Ratings-Based; IWM = International Wealth Management; KPI = Key Performance Indicator; LATAM =Latin America; LCR = Liquidity Coverage ratio; M&A = Mergers & Acquisitions; NCWOL = No Creditor Worse Off than in Liquidation; NNA = Net new assets; NSFR = Net Stable Funding Ratio; OpCo = Operating Company; OpRisk = Operational Risk PB = Private Banking; PB&WM = (Former) Private Banking & Wealth Management (division) pp. = percentage points; PTI = Pre-tax income; PONV = Point of Non-Viability; QoQ = Quarter-on-quarter; RM(s) = Relationship Manager(s); RoRC = Return on regulatory capital; RWA = Risk Weighted Assets; SA-CCR = Standardized Approach - Counterparty Credit Risk; SME = Small and Medium Enterprises; SMG = Systematic Market-Making Group; SoW = Share of Wallet; SRU = Strategic Resolution Unit; STS = Sales and Trading Services; SUB = Swiss Universal Bank; T1= Tier 1 capital; TBTF = Too Big to Fail; TLAC = Total loss absorbing capacity; (U)HNW(I) = (Ultra) High Net Worth (Individuals); WM = Wealth Management; YoY = Year-on-Year; YTD = Year To Date


Credit Suisse Investor Day 2016International Wealth ManagementIqbal Khan December 7, 2016
The data presented in this presentation relating to the Swiss Universal Bank refers to the division of Credit Suisse Group as the same is currently managed within Credit Suisse Group. The scope, revenues and expenses of the Swiss Universal Bank vary from the planned scope of Credit Suisse (Schweiz) AG and its subsidiaries, planned to be subject to a partial IPO, market conditions permitting. Any such IPO would involve the sale of a minority stake and would be subject to, among other things, all necessary approvals.It is therefore not possible to make a like-for-like comparison of the Swiss Universal Bank as a division of Credit Suisse Group on the one hand and Credit Suisse (Schweiz) AG as a potential IPO vehicle on the other hand.Cautionary statement regarding forward-looking statements This presentation contains forward-looking statements that involve inherent risks and uncertainties, and we might not be able to achieve the predictions, forecasts, projections and other outcomes we describe or imply in forward-looking statements. A number of important factors could cause results to differ materially from the plans, objectives, expectations, estimates and intentions we express in these forward-looking statements, including those we identify in "Risk Factors” in our Annual Report on Form 20-F for the fiscal year ended December 31, 2015 and in “Cautionary statement regarding forward-looking information" in our media release relating to Investor Day, published on December 7, 2016 and filed with the US Securities and Exchange Commission, and in other public filings and press releases. We do not intend to update these forward-looking statements except as may be required by applicable law. In particular, the terms “Illustrative”, “Ambition”, “Outlook” and “Goal” are not intended to be viewed as targets or projections, nor are they considered to be Key Performance Indicators. All such illustrations, ambitions and goals are subject to a large number of inherent risks, assumptions and uncertainties, many of which are completely outside of our control. Accordingly, this information should not be relied on for any purpose. We do not intend to update these illustrations, ambitions or goals.We may not achieve the benefits of our strategic initiativesWe may not achieve all of the expected benefits of our strategic initiatives. Factors beyond our control, including but not limited to the market and economic conditions, changes in laws, rules or regulations and other challenges discussed in our public filings, could limit our ability to achieve some or all of the expected benefits of these initiatives. Estimates and assumptionsIn preparing this presentation, management has made estimates and assumptions that affect the numbers presented. Actual results may differ. Figures throughout presentation may also be subject to rounding adjustments. Cautionary Statements Relating to Interim Financial InformationThis presentation contains certain unaudited interim financial information as of or for periods after September 30, 2016, the date of our last published quarterly financial statements. This information has been derived from management accounts, is preliminary in nature, does not reflect the complete results of the fourth quarter of 2016 and is subject to change, including as a result of any normal quarterly adjustments in relation to the financial statements for the fourth quarter of 2016. This information has not been subject to any review by our independent registered public accounting firm. There can be no assurance that the final results for these periods will not differ from these preliminary results, and any such differences could be material. Quarterly financial results for the fourth quarter of 2016 will be included in our 4Q16 Earnings Release, and audited consolidated financial statements for full-year 2016 will be included in our Annual Report on Form 20-F for the year ended December 31, 2016, when they are published. These interim results of operations are not necessarily indicative of the results to be achieved for the remainder of the fourth quarter or the full year 2016. Disclaimer (1/2)

Statement regarding non-GAAP financial measures This presentation also contains non-GAAP financial measures, including adjusted results. Information needed to reconcile such non-GAAP financial measures to the most directly comparable measures under US GAAP or a reference thereto can be found in this presentation in the Appendix, which is available on our website at credit-suisse.com.Statement regarding capital, liquidity and leverage As of January 1, 2013, Basel 3 was implemented in Switzerland along with the Swiss “Too Big to Fail” legislation and regulations thereunder (in each case, subject to certain phase-in periods). As of January 1, 2015, the Bank for International Settlements (BIS) leverage ratio framework, as issued by the Basel Committee on Banking Supervision (BCBS), was implemented in Switzerland by FINMA. Our related disclosures are in accordance with our interpretation of such requirements, including relevant assumptions. Changes in the interpretation of these requirements in Switzerland or in any of our assumptions or estimates could result in different numbers from those shown in this presentation. Capital and ratio numbers for periods prior to 2013 are based on estimates, which are calculated as if the Basel 3 framework had been in place in Switzerland during such periods. Unless otherwise noted, leverage exposure is based on the BIS leverage ratio framework and consists of period-end balance sheet assets and prescribed regulatory adjustments. Leverage amounts for 4Q14, which are presented in order to show meaningful comparative information, are based on estimates which are calculated as if the BIS leverage ratio framework had been implemented in Switzerland at such time. Beginning in 2015, the Swiss leverage ratio is calculated as Swiss total capital, divided by period-end leverage exposure. The look-through BIS tier 1 leverage ratio and CET1 leverage ratio are calculated as look-through BIS tier 1 capital and CET1 capital, respectively, divided by end-period leverage exposure. Selling restrictions This document, and the information contained herein, is not an offer to sell or a solicitation of offers to purchase or subscribe for securities of Credit Suisse Group AG or Credit Suisse (Schweiz) AG in Switzerland, the United States or any other jurisdiction. This document is not a prospectus within the meaning of article 652a of the Swiss Code of Obligations, nor is it a listing prospectus as defined in the listing rules of the SIX Swiss Exchange AG or any other exchange or regulated trading facility in Switzerland or a prospectus or offering document under any other applicable laws. Copies of this document may not be sent to jurisdictions, or distributed in or sent from jurisdictions, in which such documents are barred or prohibited by law. A decision to invest in securities of Credit Suisse Group AG or Credit Suisse (Schweiz) AG should be based exclusively on a written agreement with Credit Suisse Group AG or an offering and listing prospectus to be published by Credit Suisse Group AG or Credit Suisse (Schweiz) AG for such purpose. Any offer and sale of securities of Credit Suisse (Schweiz) AG will not be registered under the U.S. Securities Act of 1933, as amended, and may not be offered in the United States of America absent such registration or an exemption from registration. There will be no public offering of such securities in the United States of America. Disclaimer (2/2)

Key messages A leading Private Banking position across emerging markets and EuropeStrong Asset Management capabilities across our traditional & alternative product lines globallyFocus on superior and profitable growth while actively managing risk International Wealth Management Deliver successful AM products and a better investment advice experienceContinue to successfully grow our leading emerging markets franchises & build on scale leverage in EuropeRemain agile by balancing growth investments with efficiency gains Way forward Robust revenue trajectory and strong NNA generation in challenging marketsAM with improved profit contribution driven by asset growth and cost disciplineSelf-funded growth investments through accelerated cost savings Progress since last Investor Day

Agenda What we achieved in 2016 1 Our ambition 2018 2 Conclusion 3

IWM with strong franchises across targeted growth regions Key financials 9M16 in CHF bn Private Banking in emerging markets and Europe Asset Management capabilities with global distribution Net revenues 312 324 Pre-tax income Assets under management 3.4 Private Banking Asset Management 0.8 22% 78% 72% 28% 1 Not adjusted for assets managed by Asset Management for Private Banking within International Wealth Management 2 ‘Best Private Banking Services Overall’ 3 'Net-worth-specific services' for Central & Eastern Europe4 Highly commended award by PWM/The Banker 2016 5 Highly commended award by Private Banker International 2015 6 McKinsey analysis 7 Towers Watson Survey 2016 A leading positionacross our regions2Europe Emerging EuropeMiddle East & AfricaLatin America Strong capabilities across our product linesTop 2 traditional manager in Switzerland6PB mandates, index solutions, fixed income, equities…Top 10 alternative investment manager globally7Real Estate, credit, hedge funds, commodities… 6361 #1 in Middle East2#1 in CEE for UHNW & HNW clients3#1 in Russia, UAE, Bahrain and Qatar2 Best Private Bank in Middle East4 Outstanding Bank in Middle East5

Strong PB NNA of CHF 15.2 bn at annualized growth rate of 7% Net new lending of CHF 3.1 bn1 at attractive revenue margin Strategic clients revenues up ~40% at higher gross margin Hired 170 RMs2 (up 30%) with focus on quality AM adjusted PTI up 22% with CHF 10.0 bn NNA Invested in Risk & Compliance and aligned regionally Growth investments funded by expense savings Executing our strategy in 2016 Note: If not noted otherwise, all data for 9M16 and compared to 9M15. Adjusted results are non-GAAP financial measures. A reference to the reconciliation to reported results is included in the Appendix.1 4Q15 through end 3Q16 2 120 RM of 170 RM joined in 9M16 Strategic clients = targeted strategic UHNW/Entrepreneur clients of IWM Serving clients' financing needs Growing strategic client base Targeted RM hiring Improved contribution from AM Building operating leverage Strengthened IWM oversight Turnaround in PB asset inflows
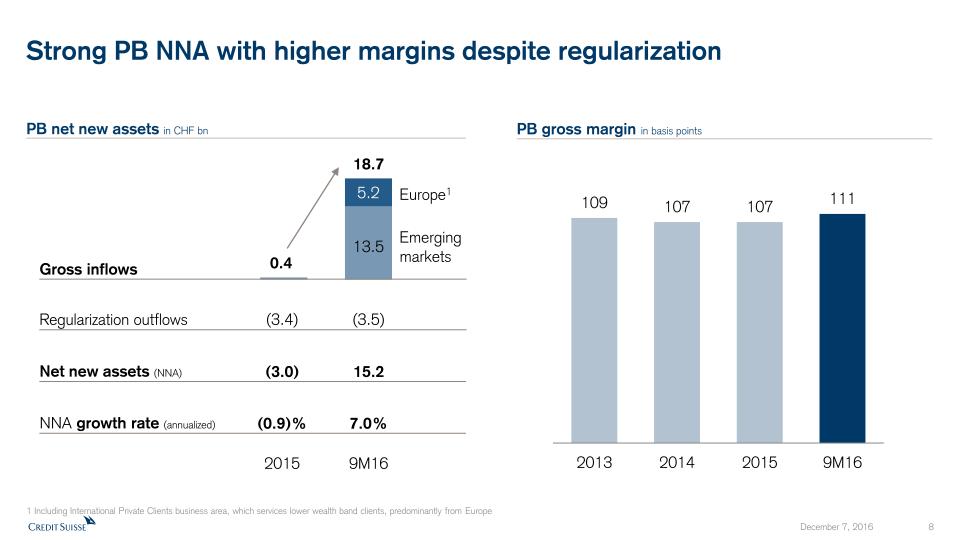
Strong PB NNA with higher margins despite regularization 1 Including International Private Clients business area, which services lower wealth band clients, predominantly from Europe PB gross margin in basis points PB net new assets in CHF bn 9M16 2015 NNA growth rate (annualized) 7.0% (0.9)% Net new assets (NNA) 15.2 (3.0) Regularization outflows (3.5) (3.4) Gross inflows 18.7 Emerging markets Europe1

Net new lending of CHF 3.1 bn, addressing sophisticated client needs 1 Before deducting valuation allowances and deferred fees & costs 2 From 2003 through 2014 for mortgages, from 2006 through 2015 for aviation finance, from 2001 through 2015 for export finance and from 2002 through 2015 for ship finance and lombard lending 3 Transaction rating as per the internal rating system 4 Includes ship, aviation and export finance 5 9M16, client rate net of reference rate over avg. loan volume Credit volume1 in CHF bn 44 40 Lombard lending Specialty finance4 Mortgages Quality loan portfolio ~10 bps avg. annual loss rate through the cycle294% investment gradecredit exposure3 Avg. annualloss rate2 ~3 bps ~17 bps Gross loanrevenue margin5 ~110 bps ~210 bps ~2 bps ~170 bps +11%
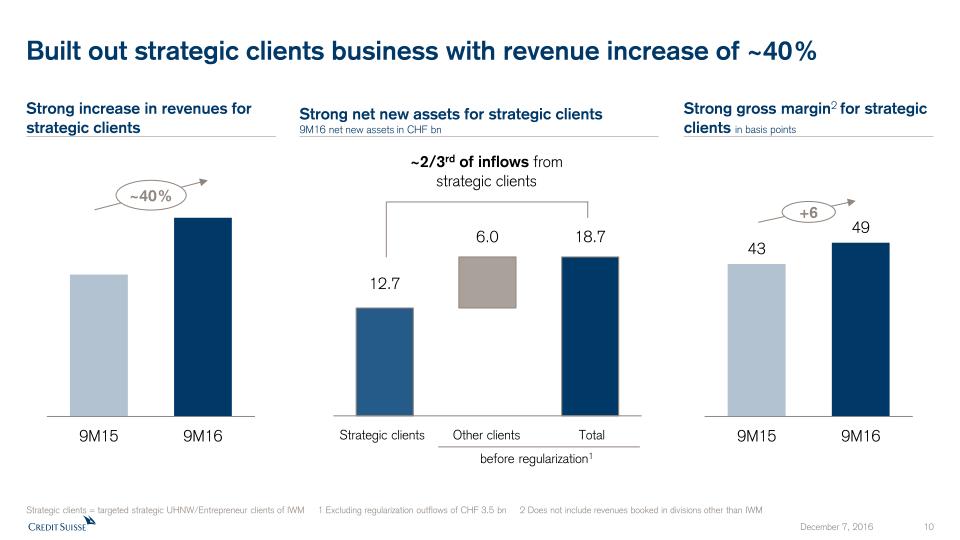
Built out strategic clients business with revenue increase of ~40% Strong increase in revenues for strategic clients ~40% Strategic clients = targeted strategic UHNW/Entrepreneur clients of IWM 1 Excluding regularization outflows of CHF 3.5 bn 2 Does not include revenues booked in divisions other than IWM Strong gross margin2 for strategic clients in basis points Strong net new assets for strategic clients 9M16 net new assets in CHF bn Total Other clients Strategic clients ~2/3rd of inflows from strategic clients before regularization1 +6

Increased quality hiring in targeted markets with improved productivity Increased hiring gross number of RM1 Note: Adjusted results are non-GAAP financial measures. A reference to the reconciliation to reported results is included in the Appendix.1 120 RM of 170 RM joined in 9M16 2 Including International Private Clients business area, which services lower wealth band clients, predominantly from Europe3 Including RMs not allocated to regional business area 4 Annualized Rebalancing resources number of RM Europe2 Emerging markets3 550 500 630 660 2015 9M16 2015 9M16 Enhanced RM productivity in CHF mn AuM / RM Adjusted net revenues / RM 245 268 2.72 2.82 2015 9M16 2015 9M164 ~30% +9% +4% (50) +30
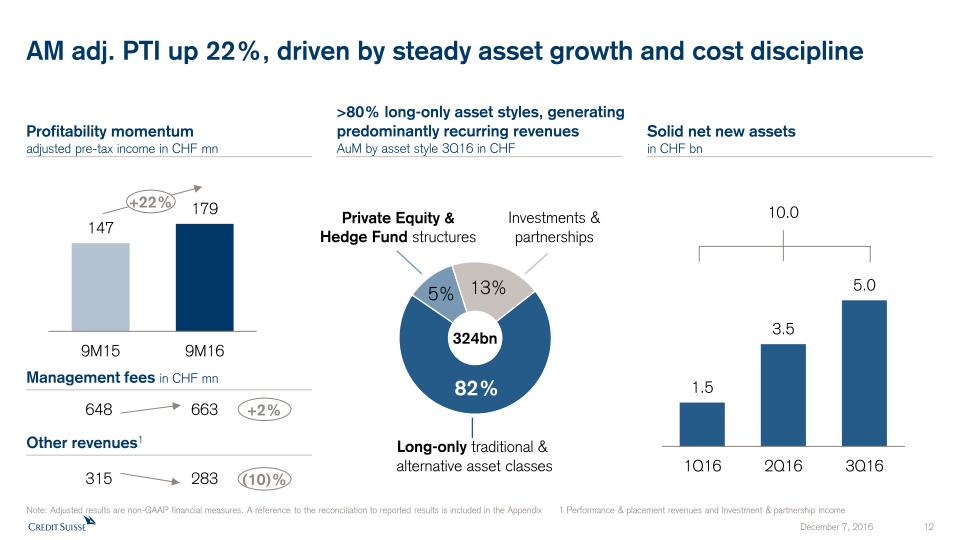
AM adj. PTI up 22%, driven by steady asset growth and cost discipline Note: Adjusted results are non-GAAP financial measures. A reference to the reconciliation to reported results is included in the Appendix 1 Performance & placement revenues and Investment & partnership income Profitability momentumadjusted pre-tax income in CHF mn +22% Solid net new assetsin CHF bn >80% long-only asset styles, generating predominantly recurring revenuesAuM by asset style 3Q16 in CHF 324bn 82% 5% 13% Management fees in CHF mn 648 663 +2% 10.0 Long-only traditional & alternative asset classes Private Equity & Hedge Fund structures Investments & partnerships Other revenues1 315 283 (10)%

Self-funded growth investments with accelerated expense savings IWM adjusted operating expenses in CHF bn 2.6 2.6 9M15 Costsavings Growth investments 9M16 Invested in key platforms Developed onshore proximityEnhanced risk & compliance capabilitiesDelivered on regulatory initiatives Stable expenses Costsavings Growthinvestments Self-funded growth Delayering, process simplificationImproved service model for lower wealth band clientsExited non-strategic client segments & regions Note: Adjusted results are non-GAAP financial measures. A reference to the reconciliation to reported results is included in the Appendix 0.1 (0.1) (1)%

Agenda What we achieved in 2016 1 Our ambition 2018 2 Conclusion 3
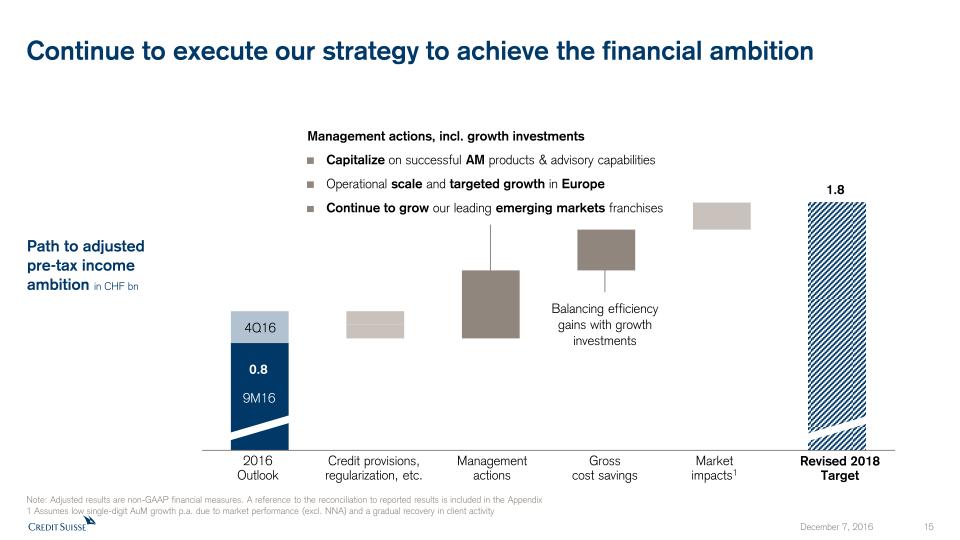
Continue to execute our strategy to achieve the financial ambition Path to adjusted pre-tax income ambition in CHF bn Note: Adjusted results are non-GAAP financial measures. A reference to the reconciliation to reported results is included in the Appendix1 Assumes low single-digit AuM growth p.a. due to market performance (excl. NNA) and a gradual recovery in client activity 0.8 2016Outlook 9M16 4Q16 Credit provisions, regularization, etc. Management actions, incl. growth investmentsCapitalize on successful AM products & advisory capabilitiesOperational scale and targeted growth in EuropeContinue to grow our leading emerging markets franchises Grosscost savings Market impacts1 1.8 Revised 2018Target Management actions Balancing efficiency gains with growth investments

Expected to grow Asset Management PTI by over CHF 200 mn in 2018Strategy execution under new leadership 2016Outlook Illustrative path to adjusted pre-tax income ambition Scale-up existing businesses Enhance distribution Develop new offerings Empower regions Up by overCHF 0.2 bn 2018Ambition 2015 173 Efficiencies KPIs 9M161 CHF 324 bnAuM >80%of AuM in long-only asset styles 2%Management fees growth CHF 10 bnNNA 22%PTI growth Asset Management Note: Adjusted results are non-GAAP financial measures. A reference to the reconciliation to reported results is included in the Appendix 1 Revenues: 9M16 vs. 9M15, NNA annualized growth in 9M16 9M16 4Q16
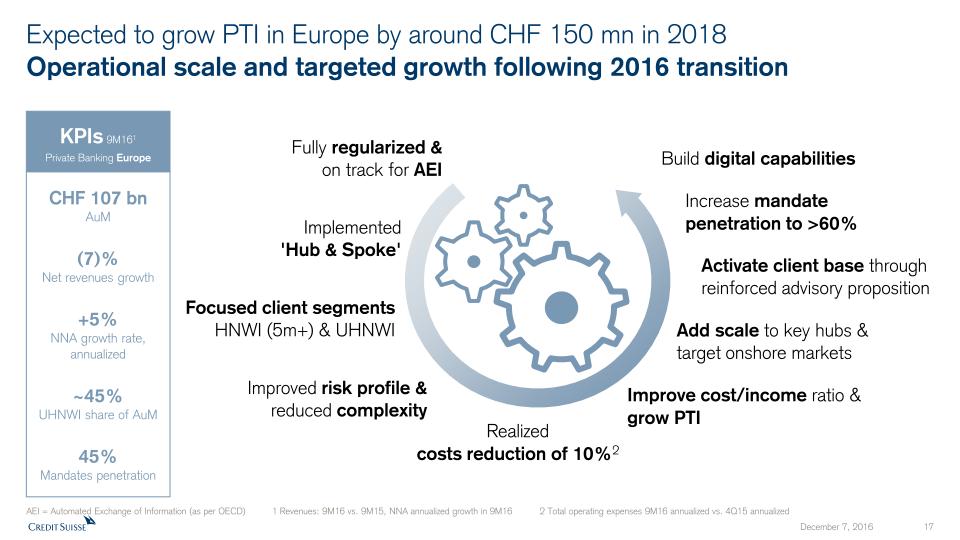
Expected to grow PTI in Europe by around CHF 150 mn in 2018Operational scale and targeted growth following 2016 transition AEI = Automated Exchange of Information (as per OECD) 1 Revenues: 9M16 vs. 9M15, NNA annualized growth in 9M16 2 Total operating expenses 9M16 annualized vs. 4Q15 annualized KPIs 9M161 CHF 107 bnAuM (7)%Net revenues growth +5%NNA growth rate, annualized 45%Mandates penetration ~45%UHNWI share of AuM Focused client segments HNWI (5m+) & UHNWI Improve cost/income ratio & grow PTI Increase mandate penetration to >60% Build digital capabilities Fully regularized & on track for AEI Implemented'Hub & Spoke' Activate client base through reinforced advisory proposition Improved risk profile & reduced complexity Realizedcosts reduction of 10%2 Add scale to key hubs & target onshore markets Private Banking Europe

Latin AmericaBalancing transition with growth ambition KPIs 9M161 CHF 68 bnAuM +1%Net revenues growth (3)%NNA growth rate, annualized 35%Mandates penetration ~60%UHNWI share of AuM …to reinforcing our strong position From transitioning & regularization… Simplified platform & service delivery, e.g. Panama and Uruguay exitsOngoing regularization and stringent risk review of legacy businessesMaintained revenues with solid contribution from recurring income2Increased mandates penetration, incl. launch of advisory services3 in 14 client domiciles Leverage continued entrepreneurial wealth generationFurther build client proximity instrong onshore franchises#2 market position in Brazil4New advisory office and teamexpansion in MexicoInvest in key capabilities(e.g. local lombard lending, trading capabilities, yacht & aviation finance) 1 Revenues: 9M16 vs. 9M15, NNA annualized growth in 9M16 2 81% of net revenues from recurring commissions & fees (48%) and net interest income (33%) in 9M16 3 Credit Suisse Invest 4 McKinsey market study Private Banking Latin America
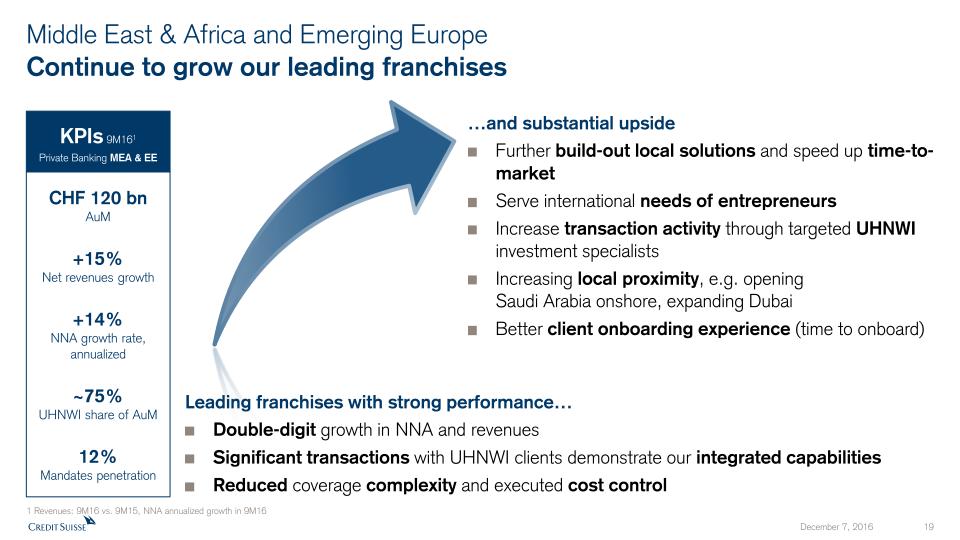
Middle East & Africa and Emerging EuropeContinue to grow our leading franchises 1 Revenues: 9M16 vs. 9M15, NNA annualized growth in 9M16 KPIs 9M161 CHF 120 bnAuM +15%Net revenues growth +14%NNA growth rate, annualized 12%Mandates penetration ~75%UHNWI share of AuM Leading franchises with strong performance… Double-digit growth in NNA and revenuesSignificant transactions with UHNWI clients demonstrate our integrated capabilitiesReduced coverage complexity and executed cost control …and substantial upsideFurther build-out local solutions and speed up time-to-marketServe international needs of entrepreneursIncrease transaction activity through targeted UHNWI investment specialistsIncreasing local proximity, e.g. openingSaudi Arabia onshore, expanding DubaiBetter client onboarding experience (time to onboard) Private Banking MEA & EE

Agenda What we achieved in 2016 1 Our ambition 2018 2 Conclusion 3

Summary Achievements Robust revenue trajectory and strong NNA generation in challenging marketsAM with improved profit contribution driven by asset growth and cost disciplineSelf-funded growth investments through accelerated cost savings Focus Deliver successful AM products and a better investment advice experienceContinue to successfully grow our leading emerging markets franchises & build on scale leverage in EuropeRemain agile by balancing growth investments with efficiency gains Deliver superior and profitable growth while actively managing risk

Appendix

Investment EngineImproving client experience and service delivery Changes in client behavior Regulatory impact Digitalization 2015 2016 2017 2018 Advisory services launchedSeamlessly delivery of 'House view'Portfolio monitoringMobile device supported client meetings Enhance client experienceSmart content:right client, channel & time Intuitive reporting, e.g. Portfolio Quality ScoreSimplified formalities Additional digital featuresAutomated customized trade recommendations Robo Advisor Credit Suisse Investment Engine enhancements Ambition:Increase mandates penetration in applicable markets, e.g. in Europefrom current ~45% to >60%
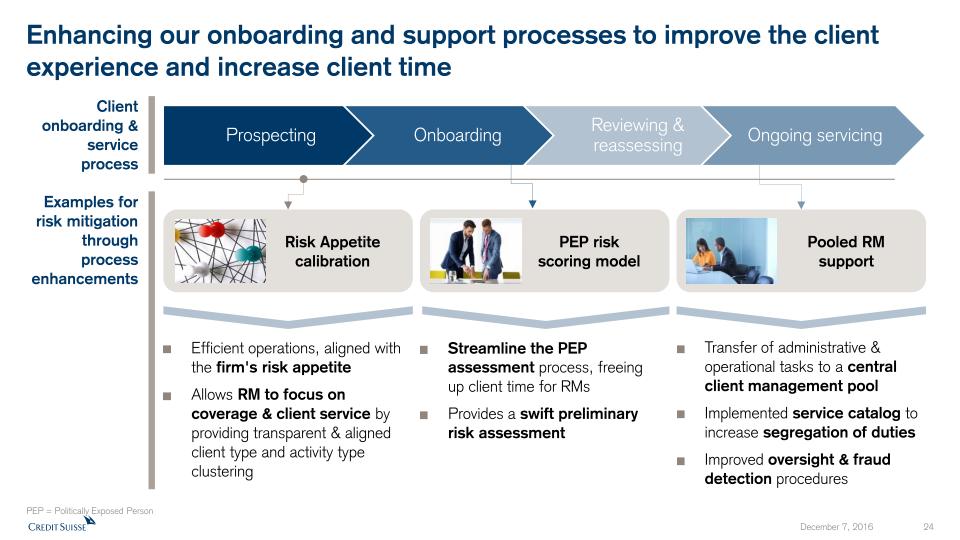
Enhancing our onboarding and support processes to improve the client experience and increase client time PEP = Politically Exposed Person Client onboarding & service process Efficient operations, aligned with the firm's risk appetiteAllows RM to focus on coverage & client service by providing transparent & aligned client type and activity type clustering Risk Appetite calibration Pooled RM support Transfer of administrative & operational tasks to a central client management poolImplemented service catalog to increase segregation of dutiesImproved oversight & fraud detection procedures Examples for risk mitigation through process enhancements Streamline the PEP assessment process, freeing up client time for RMsProvides a swift preliminary risk assessment PEP riskscoring model

International Private Clients KPIs 9M161 CHF 15 bnAuM 3%Net revenues growth (4)%NNA growth rate, annualized 47%Mandates penetration Implemented dedicated operating model focused on Entry HNWI international clients serviced out of Switzerland (<5mn) Implement a digitally-enabled servicing model, leveraging and enhancing the Group’s vast IT and platform capabilities Developed regional coverage starting with Europe & Emerging Europe, further extension to MEA and Latam in early 2017 Enhanced dedicated value proposition centered arounds mandates solutions Significantly increasedRM focus and client time(AuM load per RM up 20% andaccount load per RM down 65%)2 Private Banking IPC Digitally enabled model focused on lower wealth band clients 1 Revenues: 9M16 vs. 9M15, NNA annualized growth in 9M16 2 Achieved through transfers from coverage regions, review of the client base and stringent segmentation

Notes For reconciliation of adjusted to reported results, refer to the appendix of either the CEO or CFO Investor Day 2016 presentation. All reconciliations are available in the respective appendix.Throughout the presentation rounding differences may occur.All risk-weighted assets (RWA) and leverage exposure figures shown in this presentation are as of the end of the respective period and on a “look-through” basis.Gross and net margins are shown in basis points (bps). Gross margin = adj. net revenues annualized / average AuM; net margin = adj. pre-tax income annualized / average AuM.Mandates penetration reflects advisory and discretionary mandates as percentage of total AuM, excluding AuM from the external asset manager (EAM) business. General notes * “Adjusted operating expenses at constant FX rates” include adjustments as made in all our disclosures for restructuring expenses, major litigation expenses and a goodwill impairment taken in 4Q15 as well as adjustments for FX, applying the following main currency exchange rates for 1Q15: USD/CHF 0.9465, EUR/CHF 1.0482, GBP/CHF 1.4296, 2Q15: USD/CHF 0.9383, EUR/CHF 1.0418, GBP/CHF 1.4497, 3Q15: USD/CHF 0.9684, EUR/CHF 1.0787, GBP/CHF 1.4891, 4Q15: USD/CHF 1.0000, EUR/CHF 1.0851, GBP/CHF 1.5123, 1Q16: USD/CHF 0.9928, EUR/CHF 1.0941, GBP/CHF 1.4060, 2Q16: USD/CHF 0.9756, EUR/CHF 1.0956, GBP/CHF 1.3845, 3Q16: USD/CHF 0.9728, EUR/CHF 1.0882, GBP/CHF 1.2764. These currency exchange rates are unweighted, i.e. a straight line average of monthly rates. We apply this calculation consistently for the periods under review.† Regulatory capital reflects the worst of 10% of RWA and 3.5% of leverage exposure. Return on regulatory capital is based on (adjusted) returns after tax assuming a tax rate of 30% for all periods and capital allocated based on the worst of 10% of average RWA and 3.5% of average leverage exposure. For Global Markets and Investment Banking & Capital Markets, return on regulatory capital is based on US dollar denominated numbers. Specific notes Abbreviations Adj. = Adjusted; AT1 = Additional Tier 1; AM = Asset Management; ann. = annualized; APAC = Asia Pacific; AuM = Assets under Management; BCBS = Basel Committee on Banking Supervision; BIS = Bank for International Settlements; bps = basis points; BRRD = Bank Recovery and Resolution Directive; CAO = Capital Adequacy Ordinance; CET1 = Common Equity Tier 1; Corp. Ctr. = Corporate Center; C&IB = Corporate & Institutional Banking; CRO = Chief Risk Officer; CCRO = Compliance and Regulatory Affairs; CVA = Credit Valuation Adjustment; ECM = Equity Capital Markets; EM = Emerging Markets; EMEA=Europe, Middle East & Africa; FINMA = Swiss Financial Market Supervisory Authority; FRTB = Fundamental review of the trading book; FSB = Financial Stability Board; FTE = Full time equivalents; FVoD = Fair Value of Own Debt; FX = Foreign Exchange; GM = Global Markets; GMAR = Global Markets Accelerated Restructuring; HoldCo = Holding Company; HQ = Headquarters; HQLA = High Quality Liquid Assets; IB = Investment Banking; IBCM = Investment Banking & Capital Markets; ID = Investor Day; IHC = Intermediate Holding Company; IOSCO = The International Organization of Securities Commissions; IPO = Initial Public Offer; IRB = Internal Ratings-Based; IWM = International Wealth Management; KPI = Key Performance Indicator; LATAM =Latin America; LCR = Liquidity Coverage ratio; M&A = Mergers & Acquisitions; NCWOL = No Creditor Worse Off than in Liquidation; NNA = Net new assets; NSFR = Net Stable Funding Ratio; OpCo = Operating Company; OpRisk = Operational Risk PB = Private Banking; PB&WM = (Former) Private Banking & Wealth Management (division) pp. = percentage points; PTI = Pre-tax income; PONV = Point of Non-Viability; QoQ = Quarter-on-quarter; RM(s) = Relationship Manager(s); RoRC = Return on regulatory capital; RWA = Risk Weighted Assets; SA-CCR = Standardized Approach - Counterparty Credit Risk; SME = Small and Medium Enterprises; SMG = Systematic Market-Making Group; SoW = Share of Wallet; SRU = Strategic Resolution Unit; STS = Sales and Trading Services; SUB = Swiss Universal Bank; T1= Tier 1 capital; TBTF = Too Big to Fail; TLAC = Total loss absorbing capacity; (U)HNW(I) = (Ultra) High Net Worth (Individuals); WM = Wealth Management; YoY = Year-on-Year; YTD = Year To Date


Credit Suisse Investor Day 2016Investment Banking and Capital Markets James L. Amine December 7, 2016

Disclaimer (1/2) The data presented in this presentation relating to the Swiss Universal Bank refers to the division of Credit Suisse Group as the same is currently managed within Credit Suisse Group. The scope, revenues and expenses of the Swiss Universal Bank vary from the planned scope of Credit Suisse (Schweiz) AG and its subsidiaries, planned to be subject to a partial IPO, market conditions permitting. Any such IPO would involve the sale of a minority stake and would be subject to, among other things, all necessary approvals.It is therefore not possible to make a like-for-like comparison of the Swiss Universal Bank as a division of Credit Suisse Group on the one hand and Credit Suisse (Schweiz) AG as a potential IPO vehicle on the other hand.Cautionary statement regarding forward-looking statements This presentation contains forward-looking statements that involve inherent risks and uncertainties, and we might not be able to achieve the predictions, forecasts, projections and other outcomes we describe or imply in forward-looking statements. A number of important factors could cause results to differ materially from the plans, objectives, expectations, estimates and intentions we express in these forward-looking statements, including those we identify in "Risk Factors” in our Annual Report on Form 20-F for the fiscal year ended December 31, 2015 and in “Cautionary statement regarding forward-looking information" in our media release relating to Investor Day, published on December 7, 2016 and filed with the US Securities and Exchange Commission, and in other public filings and press releases. We do not intend to update these forward-looking statements except as may be required by applicable law. In particular, the terms “Illustrative”, “Ambition”, “Outlook” and “Goal” are not intended to be viewed as targets or projections, nor are they considered to be Key Performance Indicators. All such illustrations, ambitions and goals are subject to a large number of inherent risks, assumptions and uncertainties, many of which are completely outside of our control. Accordingly, this information should not be relied on for any purpose. We do not intend to update these illustrations, ambitions or goals.We may not achieve the benefits of our strategic initiativesWe may not achieve all of the expected benefits of our strategic initiatives. Factors beyond our control, including but not limited to the market and economic conditions, changes in laws, rules or regulations and other challenges discussed in our public filings, could limit our ability to achieve some or all of the expected benefits of these initiatives. Estimates and assumptionsIn preparing this presentation, management has made estimates and assumptions that affect the numbers presented. Actual results may differ. Figures throughout presentation may also be subject to rounding adjustments. Cautionary Statements Relating to Interim Financial InformationThis presentation contains certain unaudited interim financial information as of or for periods after September 30, 2016, the date of our last published quarterly financial statements. This information has been derived from management accounts, is preliminary in nature, does not reflect the complete results of the fourth quarter of 2016 and is subject to change, including as a result of any normal quarterly adjustments in relation to the financial statements for the fourth quarter of 2016. This information has not been subject to any review by our independent registered public accounting firm. There can be no assurance that the final results for these periods will not differ from these preliminary results, and any such differences could be material. Quarterly financial results for the fourth quarter of 2016 will be included in our 4Q16 Earnings Release, and audited consolidated financial statements for full-year 2016 will be included in our Annual Report on Form 20-F for the year ended December 31, 2016, when they are published. These interim results of operations are not necessarily indicative of the results to be achieved for the remainder of the fourth quarter or the full year 2016.

Disclaimer (2/2) Statement regarding non-GAAP financial measures This presentation also contains non-GAAP financial measures, including adjusted results. Information needed to reconcile such non-GAAP financial measures to the most directly comparable measures under US GAAP or a reference thereto can be found in this presentation in the Appendix, which is available on our website at credit-suisse.com.Statement regarding capital, liquidity and leverage As of January 1, 2013, Basel 3 was implemented in Switzerland along with the Swiss “Too Big to Fail” legislation and regulations thereunder (in each case, subject to certain phase-in periods). As of January 1, 2015, the Bank for International Settlements (BIS) leverage ratio framework, as issued by the Basel Committee on Banking Supervision (BCBS), was implemented in Switzerland by FINMA. Our related disclosures are in accordance with our interpretation of such requirements, including relevant assumptions. Changes in the interpretation of these requirements in Switzerland or in any of our assumptions or estimates could result in different numbers from those shown in this presentation. Capital and ratio numbers for periods prior to 2013 are based on estimates, which are calculated as if the Basel 3 framework had been in place in Switzerland during such periods. Unless otherwise noted, leverage exposure is based on the BIS leverage ratio framework and consists of period-end balance sheet assets and prescribed regulatory adjustments. Leverage amounts for 4Q14, which are presented in order to show meaningful comparative information, are based on estimates which are calculated as if the BIS leverage ratio framework had been implemented in Switzerland at such time. Beginning in 2015, the Swiss leverage ratio is calculated as Swiss total capital, divided by period-end leverage exposure. The look-through BIS tier 1 leverage ratio and CET1 leverage ratio are calculated as look-through BIS tier 1 capital and CET1 capital, respectively, divided by end-period leverage exposure. Selling restrictions This document, and the information contained herein, is not an offer to sell or a solicitation of offers to purchase or subscribe for securities of Credit Suisse Group AG or Credit Suisse (Schweiz) AG in Switzerland, the United States or any other jurisdiction. This document is not a prospectus within the meaning of article 652a of the Swiss Code of Obligations, nor is it a listing prospectus as defined in the listing rules of the SIX Swiss Exchange AG or any other exchange or regulated trading facility in Switzerland or a prospectus or offering document under any other applicable laws. Copies of this document may not be sent to jurisdictions, or distributed in or sent from jurisdictions, in which such documents are barred or prohibited by law. A decision to invest in securities of Credit Suisse Group AG or Credit Suisse (Schweiz) AG should be based exclusively on a written agreement with Credit Suisse Group AG or an offering and listing prospectus to be published by Credit Suisse Group AG or Credit Suisse (Schweiz) AG for such purpose. Any offer and sale of securities of Credit Suisse (Schweiz) AG will not be registered under the U.S. Securities Act of 1933, as amended, and may not be offered in the United States of America absent such registration or an exemption from registration. There will be no public offering of such securities in the United States of America.
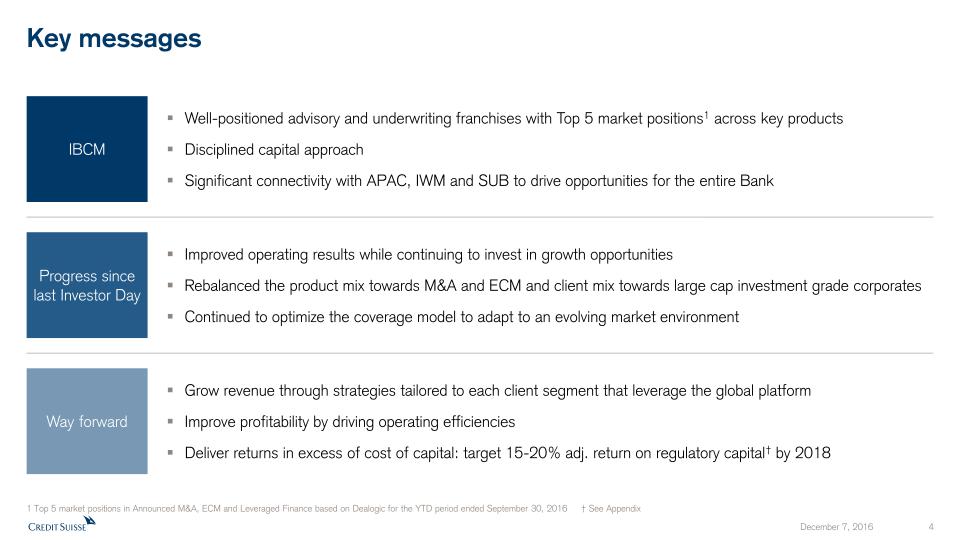
Key messages Well-positioned advisory and underwriting franchises with Top 5 market positions1 across key productsDisciplined capital approachSignificant connectivity with APAC, IWM and SUB to drive opportunities for the entire Bank IBCM Grow revenue through strategies tailored to each client segment that leverage the global platformImprove profitability by driving operating efficienciesDeliver returns in excess of cost of capital: target 15-20% adj. return on regulatory capital† by 2018 Way forward Improved operating results while continuing to invest in growth opportunitiesRebalanced the product mix towards M&A and ECM and client mix towards large cap investment grade corporatesContinued to optimize the coverage model to adapt to an evolving market environment Progress since last Investor Day 1 Top 5 market positions in Announced M&A, ECM and Leveraged Finance based on Dealogic for the YTD period ended September 30, 2016 † See Appendix

Rebalanced product mix towards M&A and ECM 1 Based on revenues before JV transfers to other divisions, Corporate Bank and funding costs. Excludes structured products, UHNWI and other IBCM revenues Revenue mix1 43% 49% DCM Lev Fin ECM M&A

Strengthened market positions as a result of strategic pivot towards M&A and ECM Made senior hires to fill key coverage and M&A gaps Launched Sell Side and Sponsors M&A initiativesImproved targeting of largest transactionsAdvised on three of the five largest announced M&A transactions in 2016 to date Key achievements #5 #5 #3 #9 #7 #4 Announced M&A market share/rank ECM share of wallet/rank1 Lev Fin share of wallet/rank Made senior hires to fill key coverage and ECM gapsEarlier targeting of IPO candidatesInitiated new product initiatives (Pre-IPOs, SPACs)Ranked #4 in the Americas with a 6.5% share of wallet Deployed capital to increase footprint against BB-rated issuersIncreased coverage of Non-IG corporates Top 5 market positions Source: Dealogic as of September 30, 2016 Note: All share of wallet and rank data is based on IBCM addressable market; includes Americas and EMEA only; excludes self-advised deals and non-core DCM products (investment grade loans, asset-backed and mortgage-backed securities, and government debt). SPAC = Special Purpose Acquisition Company; Non-IG = Non-Investment Grade1 ECM excludes converts

Invested in talent across coverage and product areas Financial Institutions Industrials Healthcare Retail & Consumer Real Estate Oil & Gas Tech UHNWI Sponsors Country Coverage Product Specialist AMERICAS ü ü ü ü ü ü ü ü ü EMEA ü ü ü ü ü Completed 25 senior Managing Director hires across Americas and EMEA

Investment in coverage and capital is driving results with corporate clients Covered1 share of wallet with IG Corporates Covered1 share of wallet with Non-IG Corporates +140 bps +120 bps Increased share of wallet with covered, priority clients (representing 40% of fee pool)Selectively deployed capital to targeted clientsLaunched acquisition financing initiative to strategically deliver our balance sheet to clients when they need it mostIdentified opportunities to expand covered footprint in 2017 and 2018 Key achievements Source: Dealogic as of September 30, 2016 Note: All share of wallet and rank data is based on IBCM addressable market; includes Americas and EMEA only; excludes self-advised deals and non-core DCM products (investment grade loans, asset-backed and mortgage-backed securities, and government debt). IG = Investment Grade; Non-IG = Non-Investment Grade1 Covered clients are defined as priority clients actively covered by IBCM
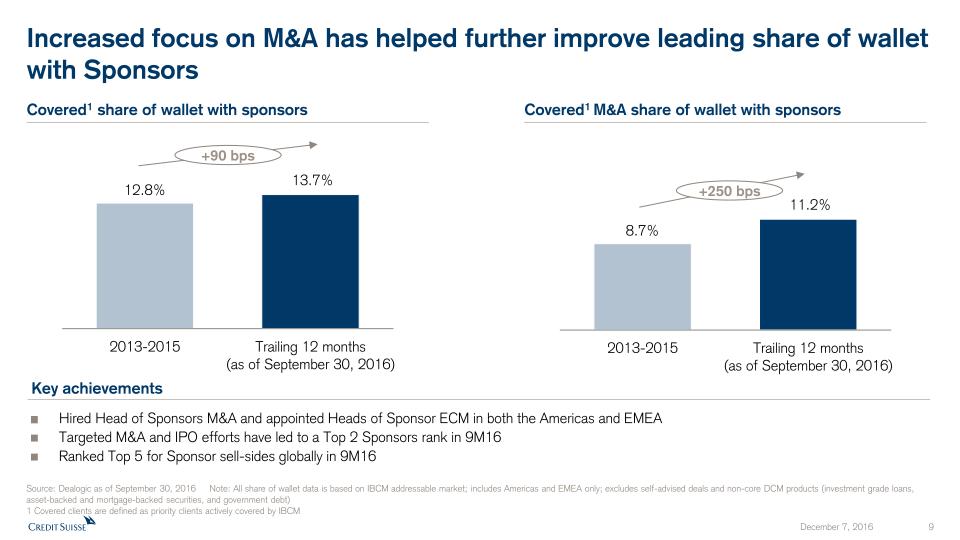
Increased focus on M&A has helped further improve leading share of wallet with Sponsors Covered1 share of wallet with sponsors Covered1 M&A share of wallet with sponsors +90 bps +250 bps Hired Head of Sponsors M&A and appointed Heads of Sponsor ECM in both the Americas and EMEATargeted M&A and IPO efforts have led to a Top 2 Sponsors rank in 9M16Ranked Top 5 for Sponsor sell-sides globally in 9M16 Key achievements Source: Dealogic as of September 30, 2016 Note: All share of wallet data is based on IBCM addressable market; includes Americas and EMEA only; excludes self-advised deals and non-core DCM products (investment grade loans, asset-backed and mortgage-backed securities, and government debt)1 Covered clients are defined as priority clients actively covered by IBCM

Global client coverage, with diverse regional strategies Americas outbound M&A growth EMEA outbound M&A growth APAC outbound M&A growth 9M16 vs. 9M15 9M16 vs. 9M15 9M16 vs. 9M15 AMERICAS EMEA APAC #4 #5 #3 #1 #71 #3 #4 in Cross Border M&A Source: Dealogic as of September 30, 2016 Note: Outbound M&A growth based on announced M&A volumes1 International banks only

Credit Suisse is well-positioned in emerging markets Launched globally-coordinated EM coverage effortDeveloped new proprietary database for investment opportunitiesEstablished dedicated initiatives around sovereign wealth funds, privatizations and family officesLeading positions across EM franchise for 9M16:#1 Lev Fin, #4 M&A, #5 DCM Key Achievements Cross-Border emerging market announced M&A volume growth Emerging market M&A fee growth 9M16 vs. 9M15 9M16 vs. 9M15 Source: Dealogic as of September 30, 2016 Note: Emerging markets includes emerging market regions covered by IBCM and APAC

Outlook for 2017 Fee pool by region in USD bn Extended M&A cycle, driven by strong corporate balance sheets, limited revenue growth opportunities and potential US fiscal reformStrong backlog in ECM, particularly in the USStable Leveraged Finance markets, notwithstanding recent increase in Treasury yields EMEA Americas (7)% (10)% Source: Dealogic as of September 30, 2016 Note: Fee pool data is based on IBCM addressable market; includes Americas and EMEA only; excludes self-advised deals and non-core DCM products (investment grade loans, asset-backed and mortgage-backed securities, and government debt)

Growth investment is being self-funded Adjusted operating expenses in USD bn Headcount reductionStreamlined support functionsWorkflow re-engineering Expanded client footprintSenior hiresAdditional capitalInvestment in technology Note: Adjusted results are non-GAAP financial measures. A reference to the reconciliation to reported results is included in the Appendix1 Since January 1, 2016 1 1

Revenue growth and operating efficiencies to drive returns Note: Adjusted results are non-GAAP financial measures † See Appendix 2018Target 15-20% Adjusted return on regulatory capital† ~60% revenue growth~40% operating efficiencies 2016 to 2018 PTI Growth

Key priorities and areas of focus Improve profitability with a mix of revenue growth, increased operating efficiencies and disciplined capital managementMaintain balanced product mix, particularly in M&A and ECMContinue to increase alignment with other divisionsDeliver returns in excess of cost of capital

Appendix

Notes For reconciliation of adjusted to reported results, refer to the appendix of either the CEO or CFO Investor Day 2016 presentation. All reconciliations are available in the respective appendixThroughout the presentation rounding differences may occurAll risk-weighted assets (RWA) and leverage exposure figures shown in this presentation are as of the end of the respective period and on a “look-through” basisGross and net margins are shown in basis points (bps) Gross margin = adj. net revenues annualized / average AuM; net margin = adj. pre-tax income annualized / average AuMMandates penetration reflects advisory and discretionary mandates as percentage of total AuM, excluding AuM from the external asset manager (EAM) business General notes * “Adjusted operating expenses at constant FX rates” include adjustments as made in all our disclosures for restructuring expenses, major litigation expenses and a goodwill impairment taken in 4Q15 as well as adjustments for FX, applying the following main currency exchange rates for 1Q15: USD/CHF 0.9465, EUR/CHF 1.0482, GBP/CHF 1.4296, 2Q15: USD/CHF 0.9383, EUR/CHF 1.0418, GBP/CHF 1.4497, 3Q15: USD/CHF 0.9684, EUR/CHF 1.0787, GBP/CHF 1.4891, 4Q15: USD/CHF 1.0000, EUR/CHF 1.0851, GBP/CHF 1.5123, 1Q16: USD/CHF 0.9928, EUR/CHF 1.0941, GBP/CHF 1.4060, 2Q16: USD/CHF 0.9756, EUR/CHF 1.0956, GBP/CHF 1.3845, 3Q16: USD/CHF 0.9728, EUR/CHF 1.0882, GBP/CHF 1.2764. These currency exchange rates are unweighted, i.e. a straight line average of monthly rates. We apply this calculation consistently for the periods under review† Regulatory capital reflects the worst of 10% of RWA and 3.5% of leverage exposure. Return on regulatory capital is based on (adjusted) returns after tax assuming a tax rate of 30% for all periods and capital allocated based on the worst of 10% of average RWA and 3.5% of average leverage exposure. For Global Markets and Investment Banking & Capital Markets, return on regulatory capital is based on US dollar denominated numbers Specific notes Abbreviations Adj. = Adjusted; AT1 = Additional Tier 1; AM = Asset Management; ann. = annualized; APAC = Asia Pacific; AuM = Assets under Management; BCBS = Basel Committee on Banking Supervision; BIS = Bank for International Settlements; bps = basis points; BRRD = Bank Recovery and Resolution Directive; CAO = Capital Adequacy Ordinance; CET1 = Common Equity Tier 1; Corp. Ctr. = Corporate Center; C&IB = Corporate & Institutional Banking; CRO = Chief Risk Officer; CCRO = Compliance and Regulatory Affairs; CVA = Credit Valuation Adjustment; ECM = Equity Capital Markets; EM = Emerging Markets; EMEA=Europe, Middle East & Africa; FINMA = Swiss Financial Market Supervisory Authority; FRTB = Fundamental review of the trading book; FSB = Financial Stability Board; FTE = Full time equivalents; FVoD = Fair Value of Own Debt; FX = Foreign Exchange; GM = Global Markets; GMAR = Global Markets Accelerated Restructuring; HoldCo = Holding Company; HQ = Headquarters; HQLA = High Quality Liquid Assets; IB = Investment Banking; IBCM = Investment Banking & Capital Markets; ID = Investor Day; IHC = Intermediate Holding Company; IOSCO = The International Organization of Securities Commissions; IPO = Initial Public Offer; IRB = Internal Ratings-Based; IWM = International Wealth Management; KPI = Key Performance Indicator; LATAM =Latin America; LCR = Liquidity Coverage ratio; M&A = Mergers & Acquisitions; NCWOL = No Creditor Worse Off than in Liquidation; NNA = Net new assets; NSFR = Net Stable Funding Ratio; OpCo = Operating Company; OpRisk = Operational Risk PB = Private Banking; PB&WM = (Former) Private Banking & Wealth Management (division) pp. = percentage points; PTI = Pre-tax income; PONV = Point of Non-Viability; QoQ = Quarter-on-quarter; RM(s) = Relationship Manager(s); RoRC = Return on regulatory capital; RWA = Risk Weighted Assets; SA-CCR = Standardized Approach - Counterparty Credit Risk; SME = Small and Medium Enterprises; SMG = Systematic Market-Making Group; SoW = Share of Wallet; SRU = Strategic Resolution Unit; STS = Sales and Trading Services; SUB = Swiss Universal Bank; T1= Tier 1 capital; TBTF = Too Big to Fail; TLAC = Total loss absorbing capacity; (U)HNW(I) = (Ultra) High Net Worth (Individuals); WM = Wealth Management; YoY = Year-on-Year; YTD = Year To Date


Credit Suisse Investor Day 2016Strategic Resolution UnitDavid Mathers December 7, 2016

Disclaimer (1/2) The data presented in this presentation relating to the Swiss Universal Bank refers to the division of Credit Suisse Group as the same is currently managed within Credit Suisse Group. The scope, revenues and expenses of the Swiss Universal Bank vary from the planned scope of Credit Suisse (Schweiz) AG and its subsidiaries, planned to be subject to a partial IPO, market conditions permitting. Any such IPO would involve the sale of a minority stake and would be subject to, among other things, all necessary approvals.It is therefore not possible to make a like-for-like comparison of the Swiss Universal Bank as a division of Credit Suisse Group on the one hand and Credit Suisse (Schweiz) AG as a potential IPO vehicle on the other hand.Cautionary statement regarding forward-looking statements This presentation contains forward-looking statements that involve inherent risks and uncertainties, and we might not be able to achieve the predictions, forecasts, projections and other outcomes we describe or imply in forward-looking statements. A number of important factors could cause results to differ materially from the plans, objectives, expectations, estimates and intentions we express in these forward-looking statements, including those we identify in "Risk Factors” in our Annual Report on Form 20-F for the fiscal year ended December 31, 2015 and in “Cautionary statement regarding forward-looking information" in our media release relating to Investor Day, published on December 7, 2016 and filed with the US Securities and Exchange Commission, and in other public filings and press releases. We do not intend to update these forward-looking statements except as may be required by applicable law. In particular, the terms “Illustrative”, “Ambition”, “Outlook” and “Goal” are not intended to be viewed as targets or projections, nor are they considered to be Key Performance Indicators. All such illustrations, ambitions and goals are subject to a large number of inherent risks, assumptions and uncertainties, many of which are completely outside of our control. Accordingly, this information should not be relied on for any purpose. We do not intend to update these illustrations, ambitions or goals.We may not achieve the benefits of our strategic initiativesWe may not achieve all of the expected benefits of our strategic initiatives. Factors beyond our control, including but not limited to the market and economic conditions, changes in laws, rules or regulations and other challenges discussed in our public filings, could limit our ability to achieve some or all of the expected benefits of these initiatives. Estimates and assumptionsIn preparing this presentation, management has made estimates and assumptions that affect the numbers presented. Actual results may differ. Figures throughout presentation may also be subject to rounding adjustments. Cautionary Statements Relating to Interim Financial InformationThis presentation contains certain unaudited interim financial information as of or for periods after September 30, 2016, the date of our last published quarterly financial statements. This information has been derived from management accounts, is preliminary in nature, does not reflect the complete results of the fourth quarter of 2016 and is subject to change, including as a result of any normal quarterly adjustments in relation to the financial statements for the fourth quarter of 2016. This information has not been subject to any review by our independent registered public accounting firm. There can be no assurance that the final results for these periods will not differ from these preliminary results, and any such differences could be material. Quarterly financial results for the fourth quarter of 2016 will be included in our 4Q16 Earnings Release, and audited consolidated financial statements for full-year 2016 will be included in our Annual Report on Form 20-F for the year ended December 31, 2016, when they are published. These interim results of operations are not necessarily indicative of the results to be achieved for the remainder of the fourth quarter or the full year 2016.

Disclaimer (2/2) Statement regarding non-GAAP financial measures This presentation also contains non-GAAP financial measures, including adjusted results. Information needed to reconcile such non-GAAP financial measures to the most directly comparable measures under US GAAP or a reference thereto can be found in this presentation in the Appendix, which is available on our website at credit-suisse.com.Statement regarding capital, liquidity and leverage As of January 1, 2013, Basel 3 was implemented in Switzerland along with the Swiss “Too Big to Fail” legislation and regulations thereunder (in each case, subject to certain phase-in periods). As of January 1, 2015, the Bank for International Settlements (BIS) leverage ratio framework, as issued by the Basel Committee on Banking Supervision (BCBS), was implemented in Switzerland by FINMA. Our related disclosures are in accordance with our interpretation of such requirements, including relevant assumptions. Changes in the interpretation of these requirements in Switzerland or in any of our assumptions or estimates could result in different numbers from those shown in this presentation. Capital and ratio numbers for periods prior to 2013 are based on estimates, which are calculated as if the Basel 3 framework had been in place in Switzerland during such periods. Unless otherwise noted, leverage exposure is based on the BIS leverage ratio framework and consists of period-end balance sheet assets and prescribed regulatory adjustments. Leverage amounts for 4Q14, which are presented in order to show meaningful comparative information, are based on estimates which are calculated as if the BIS leverage ratio framework had been implemented in Switzerland at such time. Beginning in 2015, the Swiss leverage ratio is calculated as Swiss total capital, divided by period-end leverage exposure. The look-through BIS tier 1 leverage ratio and CET1 leverage ratio are calculated as look-through BIS tier 1 capital and CET1 capital, respectively, divided by end-period leverage exposure. Selling restrictions This document, and the information contained herein, is not an offer to sell or a solicitation of offers to purchase or subscribe for securities of Credit Suisse Group AG or Credit Suisse (Schweiz) AG in Switzerland, the United States or any other jurisdiction. This document is not a prospectus within the meaning of article 652a of the Swiss Code of Obligations, nor is it a listing prospectus as defined in the listing rules of the SIX Swiss Exchange AG or any other exchange or regulated trading facility in Switzerland or a prospectus or offering document under any other applicable laws. Copies of this document may not be sent to jurisdictions, or distributed in or sent from jurisdictions, in which such documents are barred or prohibited by law. A decision to invest in securities of Credit Suisse Group AG or Credit Suisse (Schweiz) AG should be based exclusively on a written agreement with Credit Suisse Group AG or an offering and listing prospectus to be published by Credit Suisse Group AG or Credit Suisse (Schweiz) AG for such purpose. Any offer and sale of securities of Credit Suisse (Schweiz) AG will not be registered under the U.S. Securities Act of 1933, as amended, and may not be offered in the United States of America absent such registration or an exemption from registration. There will be no public offering of such securities in the United States of America.

SRU RWA and leverage exposure progressRWA and leverage exposure reduced by USD 19 bn and USD 51 bn vs. end-2015, respectively RWA and leverage exposure reduced by USD 19 bn excl. operational risk andUSD 51 bn, respectively vs. end-4Q15; achieved across a wide range of transactions:Executed purchase and sale agreement of the entire credit derivatives portfolioSold or restructured ~40% of loans and financing facilitiesExternal derivative trade count reduced by 160,000, or 50% vs. end-4Q15Sale of Credit Suisse (Gibraltar) to J. Safra Sarasin completedSale of CS Park View BDC, Inc. completed RWA in USD bn Leverage exposure in USD bn (35)% Operational risk Credit & market risk excl. op. risk (30)%

Continued reduction of operating expenses and portfolio valuation riskAdjusted pre-tax loss improved by USD 385 mn vs. 4Q15, primarily due to reduction in expense Reduced revenue losses in 3Q16 compared to prior quarters, driven by a recovery from adverse credit markets, partially offset by losses on life insurance and a credit provision on ship finance portfolios. Fee based revenues continue to decline following the exit of legacy private banking businesses3Q16 adjusted operating expenses improved by USD 336 mn compared to 4Q15, or 49%:US private banking business exit substantially completed by end-2Q16Additional reductions from the reduced legacy Investment Banking portfolio footprint4Q15 and 1Q16 restructuring expenses predominantly related to US platform Note: Adjusted results are non-GAAP financial measures. A reference to the reconciliation to reported results is included in the Appendix. (1,328) (1,266) (778) (874) - 4 - - (158) (80) (21) (23) Reported PTI Losses on bus. sales Restructuring exp. Major litigation prov. (257) - - (324) Adjusted revenues & provisions for credit losses Adjusted operating expenses Pre-tax income progression in USD mn Adjusted pre-tax loss (225) (660) (333) (176) 687 521 424 351 (527) (757) (1,181) (912)

SRU portfolio overviewProgress has been made reducing RWA and leverage exposure across the SRU portfolio Note: Numbers represent market risk RWA allocation for total SRU portfolio; capital breakout based on internal categorization; for illustrative purposes only RWA in USD bn Leverage exposure in USD bn Derivatives Loans & financing facilities Other assets Former PB&WM Market risk Life finance Operational risk Loans & financing facilities Other assets Former PB&WM Life finance (35)% excl. op. risk (30)% Derivatives 25 11 6 2 2 7 19 73 20 55 4 2 3 5 7 15 3 5 9 15 34 107 8 24 77 6 170 119

Overview of revenues and operating expensesPre-tax income drag from operating expenses, funding costs and valuation adjustments Note: Adjusted results are non-GAAP financial measures. A reference to the reconciliation to reported results is included in the Appendix.1 Gross revenue breakout based on internal categorization Fee based revenue from US platform, credit financing and other PB&WM businesses 9M16 exit costs of have averaged ~1% of RWA; lower than the long term guidance of 2-5% of RWALegacy funding costs relating to non-Basel III compliant debt instruments‘All other funding’ relate to the balance of the SRU position funding requirements across our legal entities 9M16 Revenues in USD mn 9M16 Operating expenses in USD mn Gross revenues1 Net revenues

SRU RWA and leverage exposure outlookOn track to reduce RWA and leverage exposure by ~80% by end-2019 1 RWA shown excludes projected inflation from future regulatory uplifts (e.g., fundamental review of trading book). Regulatory (FINMA) approval required for any operational risk reduction (35)% RWA1 in USD bn Leverage exposure in USD bn (30)% (80)% (76)% excl. op. risk Operational risk Credit & market risk

Revenue progressionContinued de-risking and legacy funding expected to drive improved revenue loss in 2019 Illustrative adjusted revenue progression in USD mn Note: Adjusted results are non-GAAP financial measures. A reference to the reconciliation to reported results is included in the Appendix.1 Includes provision for credit losses Trading, hedging & valuation adj.1 Fee based revenues Legacy funding All other funding Exit cost (170)

Continued reduction of operating expensesOn track to reduce quarterly expenses to ~USD 110 mn by 4Q19 Note: Adjusted results are non-GAAP financial measures. A reference to the reconciliation to reported results is included in the Appendix. Illustrative adjusted operating expenses progression in USD mn
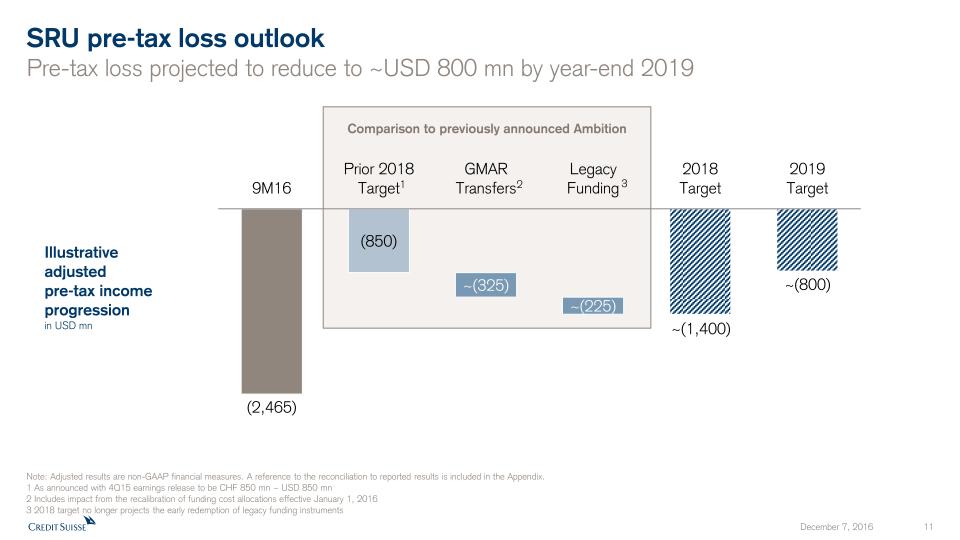
Comparison to previously announced Ambition SRU pre-tax loss outlookPre-tax loss projected to reduce to ~USD 800 mn by year-end 2019 Note: Adjusted results are non-GAAP financial measures. A reference to the reconciliation to reported results is included in the Appendix.1 As announced with 4Q15 earnings release to be CHF 850 mn ~ USD 850 mn2 Includes impact from the recalibration of funding cost allocations effective January 1, 20163 2018 target no longer projects the early redemption of legacy funding instruments 2 3 Illustrativeadjustedpre-tax income progression in USD mn ~(1,400) ~(800) 1
Key SRU takeawaysOn track towards 2019 target, medium term pressure on PTI from exits and portfolio risk Good progress to date, on track to reach end-2019 target Diverse legacy portfolio with idiosyncratic risks Exit costs long term guidance of 2-5% of RWA Progress ahead of plan, with 3Q16 RWA and leverage exposure down USD 19 bn or 35% excl. operational risk and USD 51 bn or 30% vs. end-4Q15; direct expenses down 49% YoYKey targets for 2019:RWA end-2019 target of USD 30 bn (incl. operational risk)Leverage exposure end-2019 target of USD 40 bnAdj. pre-tax loss target of ~USD 800 mn by 2019 YTD exits achieved at approximately 1% of RWA; this compares to our long term guidance of 2-5% of RWA Significant focus on de-risking the portfolio has enabled SRU to navigate through challenging market conditionsHowever, adverse market or credit specific conditions have potential to cause significant revenue volatilityPotential headwinds to capital mitigation from future regulatory changes 1 2 3

Notes For reconciliation of adjusted to reported results, refer to the appendix of either the CEO or CFO Investor Day 2016 presentation. All reconciliations are available in the respective appendixThroughout the presentation rounding differences may occurAll risk-weighted assets (RWA) and leverage exposure figures shown in this presentation are as of the end of the respective period and on a “look-through” basisGross and net margins are shown in basis points (bps) Gross margin = adj. net revenues annualized / average AuM; net margin = adj. pre-tax income annualized / average AuMMandates penetration reflects advisory and discretionary mandates as percentage of total AuM, excluding AuM from the external asset manager (EAM) business General notes * “Adjusted operating expenses at constant FX rates” include adjustments as made in all our disclosures for restructuring expenses, major litigation expenses and a goodwill impairment taken in 4Q15 as well as adjustments for FX, applying the following main currency exchange rates for 1Q15: USD/CHF 0.9465, EUR/CHF 1.0482, GBP/CHF 1.4296, 2Q15: USD/CHF 0.9383, EUR/CHF 1.0418, GBP/CHF 1.4497, 3Q15: USD/CHF 0.9684, EUR/CHF 1.0787, GBP/CHF 1.4891, 4Q15: USD/CHF 1.0000, EUR/CHF 1.0851, GBP/CHF 1.5123, 1Q16: USD/CHF 0.9928, EUR/CHF 1.0941, GBP/CHF 1.4060, 2Q16: USD/CHF 0.9756, EUR/CHF 1.0956, GBP/CHF 1.3845, 3Q16: USD/CHF 0.9728, EUR/CHF 1.0882, GBP/CHF 1.2764. These currency exchange rates are unweighted, i.e. a straight line average of monthly rates. We apply this calculation consistently for the periods under review† Regulatory capital reflects the worst of 10% of RWA and 3.5% of leverage exposure. Return on regulatory capital is based on (adjusted) returns after tax assuming a tax rate of 30% for all periods and capital allocated based on the worst of 10% of average RWA and 3.5% of average leverage exposure. For Global Markets and Investment Banking & Capital Markets, return on regulatory capital is based on US dollar denominated numbers Specific notes Abbreviations Adj. = Adjusted; AT1 = Additional Tier 1; AM = Asset Management; ann. = annualized; APAC = Asia Pacific; AuM = Assets under Management; BCBS = Basel Committee on Banking Supervision; BIS = Bank for International Settlements; bps = basis points; BRRD = Bank Recovery and Resolution Directive; CAO = Capital Adequacy Ordinance; CET1 = Common Equity Tier 1; Corp. Ctr. = Corporate Center; C&IB = Corporate & Institutional Banking; CRO = Chief Risk Officer; CCRO = Compliance and Regulatory Affairs; CVA = Credit Valuation Adjustment; ECM = Equity Capital Markets; EM = Emerging Markets; EMEA=Europe, Middle East & Africa; FINMA = Swiss Financial Market Supervisory Authority; FRTB = Fundamental review of the trading book; FSB = Financial Stability Board; FTE = Full time equivalents; FVoD = Fair Value of Own Debt; FX = Foreign Exchange; GM = Global Markets; GMAR = Global Markets Accelerated Restructuring; HoldCo = Holding Company; HQ = Headquarters; HQLA = High Quality Liquid Assets; IB = Investment Banking; IBCM = Investment Banking & Capital Markets; ID = Investor Day; IHC = Intermediate Holding Company; IOSCO = The International Organization of Securities Commissions; IPO = Initial Public Offer; IRB = Internal Ratings-Based; IWM = International Wealth Management; KPI = Key Performance Indicator; LATAM =Latin America; LCR = Liquidity Coverage ratio; M&A = Mergers & Acquisitions; NCWOL = No Creditor Worse Off than in Liquidation; NNA = Net new assets; NSFR = Net Stable Funding Ratio; OpCo = Operating Company; OpRisk = Operational Risk PB = Private Banking; PB&WM = (Former) Private Banking & Wealth Management (division) pp. = percentage points; PTI = Pre-tax income; PONV = Point of Non-Viability; QoQ = Quarter-on-quarter; RM(s) = Relationship Manager(s); RoRC = Return on regulatory capital; RWA = Risk Weighted Assets; SA-CCR = Standardized Approach - Counterparty Credit Risk; SME = Small and Medium Enterprises; SMG = Systematic Market-Making Group; SoW = Share of Wallet; SRU = Strategic Resolution Unit; STS = Sales and Trading Services; SUB = Swiss Universal Bank; T1= Tier 1 capital; TBTF = Too Big to Fail; TLAC = Total loss absorbing capacity; (U)HNW(I) = (Ultra) High Net Worth (Individuals); WM = Wealth Management; YoY = Year-on-Year; YTD = Year To Date

Pursuant to the requirements of the Securities Exchange Act of 1934, the registrant has duly caused this report to be signed on its behalf by the undersigned, thereunto duly authorized.
CREDIT SUISSE GROUP AG and CREDIT SUISSE AG
(Registrants)
Date: December 7, 2016
By:
/s/ Christian Schmid
Christian Schmid
Managing Director
By:
/s/ Stephan Flückiger
Stephan Flückiger
Director
Serious News for Serious Traders! Try StreetInsider.com Premium Free!
You May Also Be Interested In
- Digital Realty Trust (DLR) Appoints Susan Swanezy to its Board
- UBS (UBS) Said To Plan More Than 100 Job Cuts In Investment Bank - Bloomberg
- Citi Downgrades UBS AG (UBSG:SW) (UBS) to Neutral
Create E-mail Alert Related Categories
SEC FilingsRelated Entities
Credit SuisseSign up for StreetInsider Free!
Receive full access to all new and archived articles, unlimited portfolio tracking, e-mail alerts, custom newswires and RSS feeds - and more!
