

Form 6-K CREDICORP LTD For: Nov 07
 Tweet
Tweet Share
Share�
SECURITIES AND EXCHANGE COMMISSION
Washington, D.C. 20549
�
FORM 6-K
�
Report of Foreign Private Issuer
Pursuant to Rule 13a-16 or 15d-16 under the
Securities Exchange Act of 1934
�
For the month of November 2014
�
Commission File Number: 001-14014
�
CREDICORP LTD.
(Translation of registrant’s name into English)
�
Clarendon House
Church Street
Hamilton HM 11 Bermuda
(Address of principal executive office)
�
Indicate by check mark whether the registrant files or will file annual reports under cover of Form 20-F or Form 40-F.
�
Form 20-F x Form 40-F �
�
Indicate by check mark if the registrant is submitting the Form 6-K in paper as permitted by Regulation S-T Rule 101(b)(1): ____
�
Indicate by check mark if the registrant is submitting the Form 6-K in paper as permitted by Regulation S-T Rule 101(b)(7): ____
�
| � |
| � |
�
SIGNATURE
�
Pursuant to the requirements of the Securities Exchange Act of 1934, the registrant has duly caused this report to be signed on its behalf by the undersigned, thereunto duly authorized.
�
Date: November 6, 2014
�
| � |
CREDICORP LTD. (Registrant) |
� | |
| � | � | � | |
| � | � | � | � |
| � | By: | /s/ Mario Ferrari | � |
| � | � | Mario Ferrari | � |
| � | � | Authorized Representative | � |
�
| � |
�
�
Exhibit 99.1
�
 |
CREDICORP Ltd. � Third Quarter 2014 Results � Lima, Per�, November 06th, 2014 - Credicorp (NYSE: BAP) announced today its unaudited results for the third quarter of 2014. These results are reported on a consolidated basis in accordance with IFRS in nominal Peruvian Nuevos Soles (PEN). � HIGHLIGHTS � � Credicorp reported this 3Q14 net income of PEN 645.4 million, leading to a ROAE of 19.7%. Excluding Mibanco, which is still in its stabilization phase, net earnings for Credicorp reached PEN 666.2 million, which represents a ROAE of 21.7%. � Despite the economic slowdown in the 1H14, total loans continued expanding and were up 3% QoQ, a strong number given the contraction in Mibanco’s portfolio, and reached an even higher 4.1% growth, measured in average daily balances. However, this expansion was concentrated in the wholesale banking segment, which has lower margins and responds to an investment activity in anticipation of upcoming larger investments in infrastructure, energy and mining; as well as, year-end campaigns. � NII improved 4.7% QoQ due to interest income expansion of 4.7% QoQ, which in turn was in line with loan growth; and despite interest expenses which grew also 4.7% QoQ. The use of alternative funding sources allowed funding costs to remain stable QoQ. � The above, coupled with the 4.3% growth of interest earning assets, resulted in Credicop’s NIM expanding 8bps, to reach 5.75% this Q. NIM of BCP showed a larger increase of 12bps as a result of the excellent performance of loans, better pricing, and good management of funding costs. � Provisions for loan losses showed a significant drop of 9.9%, reaching 2.29% of total loans vs. 2.62% reported in 2Q, as the portfolio’s deterioration eased and measures to recover delinquent clients were successfully implemented. Furthermore, excluding the provisions related to Mibanco, total provisions for the Q dropped almost 20% QoQ, representing 1.85% of total loans, which is the result of significant efforts to control and reduce the delinquent portfolio. � The improvement in portfolio quality is also reflected in the PDL ratio that, for the first time in almost two years, shows an inflexion, and reported a drop of 5 bps from 2.64% in 2Q14 to 2.59% in 3Q14. This improvement is also reflected in the coverage ratio which increased to reach 161.5% this 3Q. � Fee income expanded 1.4% at BCP, but at Credicorp level, it increased 0.4% QoQ. The aforementioned is explained by the elimination in the consolidation process of fees related to bancassurance among Credicorp’s subsidiaries; and the drop of fee income from Credicorp Capital’s corporate finance business, in line with the economic slowdown and reduced capital markets activities. � Though fee income remained fairly flat QoQ, other non-interest income showed healthy expansion, with gains on FX transactions and on sales of securities generating good earnings levels. However, in the absence of substantial extraordinary income as reported in 2Q, total non-financial income showed growth of only 0.9% QoQ. � The insurance business continued its improving trend, and reported 1.9% higher net earned premiums and 6.2% lower expenses QoQ, which led to a 12.9% higher technical result. Moreover, medical services’ gross margin also improved 14%, contributing to the overall recovery of our insurance business, and ultimately contributed to an improved Credicorp’s bottom line. � Consequently, operating income for Credicorp grew 15.8% this 3Q, or 19.8% excluding Mibanco, which still incorporates relevant acquisition and merger costs. � In line with this general business recovery, expense controls remained in place as it was reflected in the contraction of -1.8% (with Mibanco) of operating expenses that are considered in the efficiency ratio; and -2% excluding Mibanco. The reduction of expenses combined with the expansion of income generation resulted in a significant improvement in the efficiency ratio of Credicorp that decreased from 43.9% (42.7% excl. Mibanco) to 41.9% (40.4% excl. Mibanco) in the 3Q. � However, some extraordinary costs affected Credicorp’s bottom line, as some non-profitable businesses were shut down, and an adjustment in Credicorp Capital’s derivatives were recorded. � A small open US Dollar position held in the balance sheet generated a PEN 2.6 million translation gain. On the other hand, taxes reflected an improved income generation, and were up 34% this quarter, with an effective tax rate reaching levels of 29.6%. � These results, allowed Credicorp to deliver a ROAE in line with the management’s guidance and expectations, as reflected by the 21.7% ROAE and a 2.2% ROAA reported for Credicorp’s business excluding the recent acquisition of Mibanco. As we expected, the consolidation of Mibanco had a negative impact on returns bringing the corporation’s ROAE down to a still solid 19.7% for 3Q. � Year-to-date results are also in line with expectations even if the recent acquisition and all its related costs are included, as it is reflected in Credicorp’s main indicators: ROAE of 19.9% and ROAA of 2%; an efficiency ratio of 42.1% (100 bps of reduction YoY); and excellent margin evolution showed in a NIM that grew 55 bps reaching a level of 5.61%. Furthermore, the PDL ratio for over 90-day for BPC (excluding Mibanco) was 1.7%; and its coverage ratio increased to 161.5%. |
�
| � |
 |
�
I. Credicorp Ltd.
�
Overview
�
Credicorp reported this 3Q14 net income of PEN 645.4 million, leading to a ROAE of 19.7% and a ROAA of 2%. The recent acquisition of Mibanco, which is still in its clean-up and stabilization phase, and therefore, requires the absorption of some losses; has a negative effect in the aforementioned ratios hindering the excellent performance of Credicorp’s businesses. Excluding Mibanco’s impact, Credicorp’s net income reaches PEN 666.2 million, which represents a ROAE of 21.7% and a ROAA of 2.2%.
�
Despite the economic slowdown reported this year, total loans continued expanding, and grew 3% QoQ, even after including Mibanco’s contraction. This growth in explained mainly due to an increase in loan demand from the wholesale banking, and responds to activity related to the anticipation of upcoming larger investments in infrastructure, energy and mining, as well as to the year-end campaigns. On a YoY basis, BCP loans measured in average daily balances reveal a 14.6% expansion, and are boosted to a 21.4% YoY growth through the acquisition of Mibanco.
�
Retail loans, which were strongly affected by the economic slowdown and the high delinquencies, also showed signs of recovery, reporting 3.5% QoQ growth in average daily balances, higher rate than those reported in previous quarters (0.5% in 1Q and 1.4% in 2Q). The best performers in the retail segment were SME-Business Loans which were up 12.6% QoQ, followed by mortgages (+3%) and consumer lending (+3.3%). More subdued growth was reported by Credit Card and SME-Pyme, whereby this last sector shows a turning point from having been contracting its portfolio in the previous Qs (-1.5% in 1Q and -0.9% in 2Q) to growing 1.4% this 3Q. On the other hand, our Micro lending business (Edyficar), continues performing above average with a portfolio growth of 6.3% QoQ. On a YoY basis, the strongest performers were the wholesale banking with a solid 18% expansion, and Micro lending at Edyficar with a very strong 33% expansion.
�
| � | � | Excluding MiBanco | � | � | Including MiBanco | � | ||||||||||||||||||||||||||
| Credicorp Ltd. | � | Quarter | � | � | % Change | � | � | Quarter | � | � | % Change | � | ||||||||||||||||||||
| PEN (000) | � | 2Q14 | � | � | 3Q14 | � | � | QoQ | � | � | 3Q13 | � | � | 2Q14 | � | � | 3Q14 | � | � | QoQ | � | � | YoY | � | ||||||||
| Net Interest income | � | � | 1,434,829 | � | � | � | 1,513,111 | � | � | � | 5.5 | % | � | � | 1,281,567 | � | � | � | 1,610,499 | � | � | � | 1,686,184 | � | � | � | 4.7 | % | � | � | 31.6 | % |
| Net provisions for loan losses | � | � | (411,624 | ) | � | � | (330,398 | ) | � | � | -19.7 | % | � | � | (331,280 | ) | � | � | (480,731 | ) | � | � | (433,219 | ) | � | � | -9.9 | % | � | � | 30.8 | % |
| Net interest income after net provisions for loan losses | � | � | 1,023,205 | � | � | � | 1,156,021 | � | � | � | 13.0 | % | � | � | 950,287 | � | � | � | 1,129,768 | � | � | � | 1,226,274 | � | � | � | 8.5 | % | � | � | 29.0 | % |
| Non financial income | � | � | 860,015 | � | � | � | 869,150 | � | � | � | 1.1 | % | � | � | 755,474 | � | � | � | 873,631 | � | � | � | 881,287 | � | � | � | 0.9 | % | � | � | 16.7 | % |
| Insurance services technical result | � | � | 104,165 | � | � | � | 117,638 | � | � | � | 12.9 | % | � | � | 106,303 | � | � | � | 104,165 | � | � | � | 117,638 | � | � | � | 12.9 | % | � | � | 10.7 | % |
| Medical Services Technical Result | � | � | 25,242 | � | � | � | 28,813 | � | � | � | 14.1 | % | � | � | 19,343 | � | � | � | 25,242 | � | � | � | 28,813 | � | � | � | 14.1 | % | � | � | 49.0 | % |
| Operating expenses | � | � | (1,209,198 | ) | � | � | (1,235,614 | ) | � | � | 2.2 | % | � | � | (1,100,645 | ) | � | � | (1,328,766 | ) | � | � | (1,349,566 | ) | � | � | 1.6 | % | � | � | 22.6 | % |
| Operating income | � | � | 803,429 | � | � | � | 962,699 | � | � | � | 19.8 | % | � | � | 730,762 | � | � | � | 804,041 | � | � | � | 931,137 | � | � | � | 15.8 | % | � | � | 27.4 | % |
| Core operating income | � | � | 754,973 | � | � | � | 962,699 | � | � | � | 27.5 | % | � | � | 730,762 | � | � | � | 755,584 | � | � | � | 931,137 | � | � | � | 23.2 | % | � | � | 27.4 | % |
| Non core operating income (1) | � | � | 48,457 | � | � | � | - | � | � | � | - | � | � | � | - | � | � | � | 48,457 | � | � | � | - | � | � | � | - | � | � | � | - | � |
| Translation results | � | � | 711 | � | � | � | 2,478 | � | � | � | 248.5 | % | � | � | (9,375 | ) | � | � | 581 | � | � | � | 2,603 | � | � | � | 348.2 | % | � | � | -127.8 | % |
| Income taxes | � | � | (206,327 | ) | � | � | (286,006 | ) | � | � | 38.6 | % | � | � | (208,887 | ) | � | � | (204,934 | ) | � | � | (275,364 | ) | � | � | 34.4 | % | � | � | 31.8 | % |
| Net income | � | � | 597,814 | � | � | � | 679,171 | � | � | � | 13.6 | % | � | � | 512,500 | � | � | � | 599,687 | � | � | � | 658,376 | � | � | � | 9.8 | % | � | � | 28.5 | % |
| Minority Interest | � | � | 15,002 | � | � | � | 12,941 | � | � | � | -13.7 | % | � | � | 11,451 | � | � | � | 15,002 | � | � | � | 12,941 | � | � | � | -13.7 | % | � | � | 13.0 | % |
| Net income attributed to Credicorp | � | � | 582,812 | � | � | � | 666,230 | � | � | � | 14.3 | % | � | � | 501,049 | � | � | � | 584,685 | � | � | � | 645,435 | � | � | � | 10.4 | % | � | � | 28.8 | % |
| Net income / share (S/.) | � | � | 7.31 | � | � | � | 8.35 | � | � | � | 14.3 | % | � | � | 6.28 | � | � | � | 7.33 | � | � | � | 8.09 | � | � | � | 10.4 | % | � | � | 28.8 | % |
| Total loans | � | � | 69,154,209 | � | � | � | 71,448,819 | � | � | � | 3.3 | % | � | � | 62,358,185 | � | � | � | 73,464,928 | � | � | � | 75,680,558 | � | � | � | 3.0 | % | � | � | 21.4 | % |
| Deposits and obligations | � | � | 71,639,332 | � | � | � | 71,232,928 | � | � | � | -0.6 | % | � | � | 66,845,892 | � | � | � | 75,611,060 | � | � | � | 74,863,615 | � | � | � | -1.0 | % | � | � | 12.0 | % |
| Net shareholders' equity | � | � | 11,972,388 | � | � | � | 12,599,399 | � | � | � | 5.2 | % | � | � | 11,378,145 | � | � | � | 12,807,368 | � | � | � | 13,414,052 | � | � | � | 4.7 | % | � | � | 17.9 | % |
| Net interest margin | � | � | 5.33 | % | � | � | 5.41 | % | � | � | � | � | � | � | 5.12 | % | � | � | 5.67 | % | � | � | 5.75 | % | � | � | � | � | � | � | � | � |
| Efficiency ratio | � | � | 42.7 | % | � | � | 40.4 | % | � | � | � | � | � | � | 42.0 | % | � | � | 43.9 | % | � | � | 41.5 | % | � | � | � | � | � | � | � | � |
| Return on average shareholders' equity | � | � | 20.2 | % | � | � | 21.7 | % | � | � | � | � | � | � | 18.1 | % | � | � | 18.9 | % | � | � | 19.7 | % | � | � | � | � | � | � | � | � |
| Return on average total assets | � | � | 2.0 | % | � | � | 2.2 | % | � | � | � | � | � | � | 1.8 | % | � | � | 1.9 | % | � | � | 2.0 | % | � | � | � | � | � | � | � | � |
| PDL ratio | � | � | 2.39 | % | � | � | 2.33 | % | � | � | � | � | � | � | 2.18 | % | � | � | 2.64 | % | � | � | 2.59 | % | � | � | � | � | � | � | � | � |
| PDL over 90 days (2) | � | � | 1.67 | % | � | � | 1.70 | % | � | � | � | � | � | � | 1.52 | % | � | � | 1.67 | % | � | � | 1.70 | % | � | � | � | � | � | � | � | � |
| NPL ratio (3) | � | � | 2.96 | % | � | � | 2.93 | % | � | � | � | � | � | � | 2.76 | % | � | � | 3.30 | % | � | � | 3.26 | % | � | � | � | � | � | � | � | � |
| Annualized net provisions / Total loans | � | � | 2.38 | % | � | � | 1.85 | % | � | � | � | � | � | � | 2.13 | % | � | � | 2.62 | % | � | � | 2.29 | % | � | � | � | � | � | � | � | � |
| Coverage of PDLs | � | � | 152.32 | % | � | � | 156.09 | % | � | � | � | � | � | � | 162.6 | % | � | � | 158.4 | % | � | � | 161.48 | % | � | � | � | � | � | � | � | � |
| Coverage of NPLs | � | � | 122.75 | % | � | � | 123.27 | % | � | � | � | � | � | � | 128.7 | % | � | � | 126.6 | % | � | � | 128.32 | % | � | � | � | � | � | � | � | � |
| Employees | � | � | 28,473 | � | � | � | 28,443 | � | � | � | � | � | � | � | 27,457 | � | � | � | 31,971 | � | � | � | 32,162 | � | � | � | � | � | � | � | � | � |
(1) At 2T14, PEN 40.8 million correspond to ASB for a compensation received from reinsurers for incurred losses in 2008 and PEN 7.6 million to Prima for a real estate sale and a reversal of tax provisions. At 1T14, PEN 62.7 million and PEN 14.4 million correspond to a gain from a sale of stocks and bonds, respectively.
(2) PDL for BCP without subsidiaries, does not include Mibanco.
(3) NPLs: Non-performing loans = Past due loans + Refinanced and restructued loans. NPL Ratio = NPLs / Total loans.
�
| 2 |
|
�
NII improved 4.7% QoQ due to interest income expansion of 4.7% QoQ, which in turn was in line with loan growth. On the other hand, interest expenses increased also 4.7%, as a result of using less expensive funding sources, such as central bank instruments, which allowed maintaining stable funding costs.
�
The above, coupled with the growth of 4.3% in interest earning assets, resulted in Credicop’s NIM expanding 8bps, to reach 5.75% this Q. NIM of BCP showed a larger increase of 12bps as a result of the excellent performance of loans, better pricing, and good management of funding costs.
�
The following table shows the Net Interest Margin’s breakdown and explains the individual contributions to the margin by Credicorp’s subsidiaries:
�
| NIM Breakdown | � | 3Q14 | � | |||||||||||||||||
| PEN (000) | � | BCP Cons. | � | � | ASB | � | � | Pac�fico | � | � | Others (1) | � | � | Credicorp | � | |||||
| Average IEA | � | � | 105,482,495 | � | � | � | 5,460,759 | � | � | � | 5,540,922 | � | � | � | 870,961 | � | � | � | 117,355,138 | � |
| % Total IEA Credicorp | � | � | 90 | % | � | � | 5 | % | � | � | 5 | % | � | � | 0 | % | � | � | 100 | % |
| � | � | � | � | � | � | � | � | � | � | � | � | � | � | � | � | � | � | � | � | � |
| NII for 3Q14 (Annualized) | � | � | 6,351,833 | � | � | � | 113,149 | � | � | � | 270,585 | � | � | � | 9,171 | � | � | � | 6,744,737 | � |
| % Total NII Credicorp | � | � | 94 | % | � | � | 2 | % | � | � | 4 | % | � | � | 0 | % | � | � | 100 | % |
| � | � | � | � | � | � | � | � | � | � | � | � | � | � | � | � | � | � | � | � | � |
| NIM for 3Q14 | � | � | 6.02 | % | � | � | 2.07 | % | � | � | 4.88 | % | � | � | 1.05 | % | � | � | 5.75 | % |
NIM: Annualized Net interest income / Average period end and period beginning interest earning assets.
(1) Others include Credicorp Capital, Prima, Grupo Credito and Eliminations for consolidation.
�
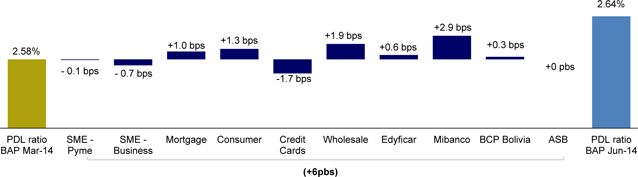
Portfolio quality also shows an important improvement, as the deterioration of the portfolio eased, and measures to recover delinquent clients were successfully implemented. Consequently, the PDL ratio showed a turning point for the first time in two years, and reported a drop of 5 bps moving from 2.64 in 2Q14 to 2.59 in 3Q14. This improvement is also reflected in the coverage ratio which increased to reach 161.5%. Furthermore, and more importantly, provisions for loan losses showed a significant decline of 9.9%, reaching levels of 2.29% of total loans in 3Q14 vs. 2.64% reported in 2Q13. If we exclude the provisions related to Mibanco, total provisions for the quarter dropped almost 20% QoQ, and represented 1.85% of total loans, reflecting the significant effort to control and reduce the delinquent portfolio.
�
The following tables show the decomposition of the PDL ratio:
�
Mar 14 - Jun14
�
�
| 3 |
|
�
Jun 14 - Sep 14
�

�
On a QoQ comparison, fee income at BCP revealed a 1.4% expansion, but at Credicorp it grew only 0.4%. This difference was mainly due to: i) the elimination in the consolidation process of fees related to bancassurance among Credicorp’s subsidiaries; and ii) the drop of fee income from Credicorp Capital’s corporate finance business, in line with the economic slowdown and reduced capital markets activities. Though fee income remained fairly flat QoQ, other non-interest income, such as gains on FX transactions and gain on sales of securities, generated good earnings levels. Nevertheless, in the absence of substantial extraordinary income as the one reported in 2Q, total non-financial income grew only 0.9% QoQ.
�
The insurance business continued its improving trend, with an increase of 1.9% in net earned premiums and a decrease of 6.2% in expenses that led to a 12.9% higher technical result. Furthermore, medical services gross margin improved 14%, contributing to the overall recovery in the insurance business and, ultimately, a better contribution to Credicorp’s bottom line.
�
Consequently, operating income for Credicorp was up 15.8% this 3Q, 19.8% when excluding Mibanco, which still incorporates relevant acquisition and merger costs.
�
To focus on modifying our business culture and structure to become a more efficient operation continues being an important mandate at all levels in the organization. Hence, we are focused on achieving aggressive efficiency targets. In line with these objectives, expense controls remained in place, achieving a small contraction in general operating expenses; which helped increase the gap between the income and the expense growth rate. However, additional charges related to the shutting down of non-profitable businesses, and to an adjustment in derivative contracts related to Credicorp Capital, increased the expense line to show a small 1.6% expansion for the quarter. Nevertheless, the contraction in operating expenses mentioned before showed a significant 2% improvement in the efficiency ratio of Credicorp that moved from 43.9% (42.7% excl.Mibanco) in 2Q, to 41.5% (40.8% excl. Mibanco) in 3Q.
�
| � | � | � | � | BCP Cons | � | � | Prima | � | � | ASB | � | � | PGA | � | � | Credicorp Capital | � | � | Others (1) | � | � | Credicorp | � | |||||||
| 2Q14 | � | % of Income | � | � | 72.3 | % | � | � | 3.1 | % | � | � | 1.2 | % | � | � | 22.1 | % | � | � | 2.9 | % | � | � | -1.6 | % | � | � | 100.0 | % |
| � | � | % of Opex | � | � | 79.7 | % | � | � | 3.1 | % | � | � | 0.6 | % | � | � | 9.6 | % | � | � | 7.4 | % | � | � | -0.5 | % | � | � | 100.0 | % |
| � | � | � | � | � | � | � | � | � | � | � | � | � | � | � | � | � | � | � | � | � | � | � | � | � | � | � | � | � | � | � |
| � | � | Efficiency ratio | � | � | 48.4 | % | � | � | 43.1 | % | � | � | 23.0 | % | � | � | 19.1 | % | � | � | 110.6 | % | � | � | 12.4 | % | � | � | 43.9 | % |
| � | � | � | � | � | � | � | � | � | � | � | � | � | � | � | � | � | � | � | � | � | � | � | � | � | � | � | � | � | � | � |
| 3Q14 | � | % of Income | � | � | 73.1 | % | � | � | 3.2 | % | � | � | 1.1 | % | � | � | 21.9 | % | � | � | 2.8 | % | � | � | -2.1 | % | � | � | 100.0 | % |
| � | � | % of Opex | � | � | 79.2 | % | � | � | 3.2 | % | � | � | 0.7 | % | � | � | 10.7 | % | � | � | 7.2 | % | � | � | -1.0 | % | � | � | 100.0 | % |
| � | � | � | � | � | � | � | � | � | � | � | � | � | � | � | � | � | � | � | � | � | � | � | � | � | � | � | � | � | � | � |
| � | � | Efficiency ratio | � | � | 44.9 | % | � | � | 41.7 | % | � | � | 24.3 | % | � | � | 20.2 | % | � | � | 107.9 | % | � | � | 18.6 | % | � | � | 41.5 | % |
| � | � | � | � | � | � | � | � | � | � | � | � | � | � | � | � | � | � | � | � | � | � | � | � | � | � | � | � | � | � | � |
| � | � | Var. 3Q14 / 2Q14 | � | � | -350 bps | � | � | � | -140 bps | � | � | � | + 130 bps | � | � | � | +110 bps | � | � | � | -270 bps | � | � | � | - | � | � | � | - 240 bps | � |
(1) Others include Grupo Credito and Eliminations for consolidations.
�
After the change in the functional currency at the start of the year, only a small open US dollar position is held in the balance sheet, which generated a PEN 2.6 million translation gain following the slight strengthening of the US dollar. On the other hand, taxes reflected an improved income generation, and increased 34% QoQ, with an effective tax rate reaching a level of 29.6%.
�
| 4 |
|
�
These results, allowed Credicorp to deliver a return in line with the management’s guidance and expectations, as reflected by the 21.7% ROAE and 2.2% ROAA reported for Credicorp’s businesses, excluding the acquisition of Mibanco, which, as expected, had a negative impact on returns, given its current situation.
�
Nevertheless, even including the new still underperforming institution of Mibanco, year to date results are in line with our expectations with total net income of PEN 1.94 billion; ROAE of 19.9% and ROAA of 2%; a PDL ratio of 2.59% for all delinquencies and 1.7% for delinquencies over 90 days; a coverage ratio of 161.5%; and an efficiency ratio of 41.5%.
�
Credicorp – The Sum of Its Parts
�
This 3Q, BCP posted a significant recovery in all of its indicators, which is proof of its management capacity and strong position in the market. These factors have allowed the bank to recover its profitability levels despite a context of low economic growth.
�
BCP reported excellent results in 3Q14, and achieved net income of PEN 585.8 million. This represents a 35.3% increase with regard to 2Q14’s, which led to a ROAE of 25.4% and a ROAA of 2.1%.
�
Total loans expanded 4.1% QoQ in terms of average daily balances, which reflects excellent dynamism despite a complicated environment. The global NIM increased 12 bps to reach 6.02% in 3Q14. This was primarily due to more dynamism in the retail sector, a correction in rates and excellent control of funding costs.
�
The PDL ratio fell 6bps to 2.66%, which reflects a deceleration in delinquency and a recovery in the retail loan portfolio. This portfolio posted a noteworthy change in the trend of the SME segment, which had contracted in previous quarters, but posted growth of 1.7% QoQ in 3Q. In line with the aforementioned, provisions for loan losses at BCP fell 19.8%. Even if we include provisions for Mibanco, the reduction remains high at 9.9% for the quarter.
�
Finally, at the end of 3Q14, a 1.3% QoQ decrease in operating expenses, along with income growth, resulted in the improvement of the efficiency ratio that went down from 48.5% in 2Q14 to 44.9% in 3Q.
�
| Earnings contribution to Credicorp | � | Quarter | � | � | % Change | � | � | Year to date | � | � | % Change | � | ||||||||||||||||||||
| PEN (000) | � | 3Q13 | � | � | 2Q14 | � | � | 3Q14 | � | � | QoQ | � | � | YoY | � | � | Sep 13 | � | � | Sep 14 | � | � | Sep 14 / Sep 13 | � | ||||||||
| Banco de Cr�dito BCP (1) | � | � | 408,523 | � | � | � | 422,951 | � | � | � | 572,056 | � | � | � | 35 | % | � | � | 40 | % | � | � | 853,867 | � | � | � | 1,461,935 | � | � | � | 71 | % |
| BCB (2) | � | � | 11,353 | � | � | � | 19,016 | � | � | � | 17,418 | � | � | � | -8 | % | � | � | 53 | % | � | � | 34,101 | � | � | � | 51,915 | � | � | � | 52 | % |
| Edyficar (3) | � | � | 31,734 | � | � | � | 31,925 | � | � | � | 19,643 | � | � | � | -38 | % | � | � | -38 | % | � | � | 66,182 | � | � | � | 79,249 | � | � | � | 20 | % |
| Pacifico Grupo Asegurador | � | � | 51,710 | � | � | � | 46,432 | � | � | � | 60,031 | � | � | � | 29 | % | � | � | 16 | % | � | � | 95,294 | � | � | � | 144,380 | � | � | � | 52 | % |
| Atlantic Security Bank | � | � | 28,268 | � | � | � | 80,071 | � | � | � | 28,112 | � | � | � | -65 | % | � | � | -1 | % | � | � | 103,684 | � | � | � | 137,825 | � | � | � | 33 | % |
| Prima | � | � | 36,144 | � | � | � | 40,786 | � | � | � | 37,363 | � | � | � | -8 | % | � | � | 3 | % | � | � | 103,896 | � | � | � | 116,277 | � | � | � | 12 | % |
| Credicorp Capital (4) | � | � | 2,718 | � | � | � | 12,105 | � | � | � | 11,308 | � | � | � | -7 | % | � | � | 316 | % | � | � | 23,321 | � | � | � | 39,736 | � | � | � | 70 | % |
| Credicorp Ltd. (5) | � | � | (17,796 | ) | � | � | (8,705 | ) | � | � | (48,106 | ) | � | � | 453 | % | � | � | 170 | % | � | � | (45,991 | ) | � | � | 27,062 | � | � | � | -159 | % |
| Others (6) | � | � | (8,518 | ) | � | � | (8,956 | ) | � | � | (15,330 | ) | � | � | 71 | % | � | � | 80 | % | � | � | (17,737 | ) | � | � | (34,970 | ) | � | � | 97 | % |
| Net income attributable to Credicorp | � | � | 501,048 | � | � | � | 584,686 | � | � | � | 645,435 | � | � | � | 10 | % | � | � | 29 | % | � | � | 1,116,334 | � | � | � | 1,892,245 | � | � | � | 70 | % |
(1) Includes Banco de Cr�dito de Bolivia, Edyficar and Mibanco.
(2)The figure is lower than the net income of BCB because Credicorp owns 97.7% of BCB (directly and inderectly).
(3) Includes investment in Mibanco.
(4) Includes Credicorp Inv, which includes IM Trust, Credicorp Capital Individual, Credicorp Capital Colombia and CSI; and Credicorp Capital Peru which includes Credicorp Capital Bolsa, Credicorp Capital Fondos and Credicorp Capital Titulizadora.
(5) Includes taxes on BCP's and PPS's dividends, and other expenses at the holding company level. Also, at 3T14, includes other expenses related to the valuation of derivatives in Credicorp Capital associated to the acdquisition of Correval and IMTrust.
(6) Includes Grupo Cr�dito excluding Prima (Servicorp and Emisiones BCP Latam), others of Atlantic Security Holding Corporation and others of Credicorp Ltd.
�
Atlantic Security Bank (ASB) reported net income of US$9.7 million which reflected an ROAE of 18% in 3T14. This fell below the figure registered in 2Q14 (US$28.9 million) since the latter included extraordinary income received from reinsurers for US$14.6 million following the payment of a claim for losses incurred during the financial crisis in 2008; and 3Q registered lower net gains on the investment portfolio; and losses on foreign exchange transactions.
�
Interest earning assets fell US$37 million QoQ, where loans dropped US$21 million due to pre-payment and cancelations at maturity in 3Q14, and investments decreased US$11 million due to mark-to-market adjustments.
�
| 5 |
|
�
Finally, deposits reflect growth of US$10 million QoQ (US$1,550 million in 3Q14 vs US$1,540 million in 2Q14) as new client deposits were captured.
�
Net income at BCP Bolivia fell 8.4% QoQ, which was due primarily to lower gains on foreign exchange transactions and growth in expenses for police security (price increase set by the government), that was only partially offset by higher interest income on loans. Nevertheless, YoY, income increased 58.9% due to a drop in net provisions for loan losses and growth in interest income on loans, which offset the growth in personnel expenses after a statutory wage increase and holiday related salary increases.
�
Loan expansion was 6.0% QoQ and 19.3% YoY, which was due primarily to growth in Retail Banking in the Mortgage and SME segments. The bank’s prudential approach to lending led to a PDL ratio of 1.45% and a coverage ratio of 262.2%. Deposits increased 5.6% QoQ due to growth in time deposits (+3.8% QoQ).
�
Edyficar continues to perform in line with our forecasts, despite the downturn in the local economy and in the SME sector in particular. It is important to note that the organization’s loan growth is higher than that of its competitors, and its portfolio quality ratios are the only ones in the system that have remained stable(4.02%).
�
In this context, total loans at the end of 3Q14 were situated at PEN 3,209 million, which led to growth (+5.7% QoQ) in net interest income. These results (without including the effect of Mibanco) led to net income of PEN 38.1 million and a ROAE of 27.7%. Nevertheless, if we incorporate the effects of Mibanco, we obtain net income of PEN 20.2 million and a ROAE of 7.1%. The latter figure was affected by the capital contributions (PEN 506 million and PEN 146 million) made to finance the acquisition of Mibanco, and to cover other expenses associated with the acquisition process. In line with this growth, the number of branches increased from 199 in 2Q14 to 203 in 3Q14.
�
Pacifico Insurance Group reported net income of PEN 55.9 million in 3Q14, which represents a 33.6% increase with regard to the PEN 41.8 million obtained in 2Q14. In this context, ROAE was situated at 13.9%, which reflects a significant improvement from 2Q14. This increase in income was due to a better underwriting result (+22.4 million) and higher financial income (+9.6 million), which was accompanied by an effective expenses control.
�
The increase reported in the underwriting result is reflected in all three business lines. In PPS, an improvement was due to i) an increase in net earned premiums in all businesses, ii) a reduction in claims, particularly in the car segment and iii) a decrease in underwriting expenses due to a reversal of provisions. In EPS, the improvement reflects an increase in Complementary Insurance for High Risk Occupations (SCRR) premiums; while at the medical subsidiaries, a better result is due to an increase in volumes in line with the business expansion.
�
In the third quarter, Prima AFP’s results were favorable. Income grew 6.4% with regard to 2Q14, which coupled with strict spending control, led to operating income of PEN 56.9 million and net income of PEN 37.4 million. The net result represented an 8.4% drop with regard to 2Q14’s figure which includes an extraordinary gain from an asset sale registered last quarter. As such, this decline generated no negative effect on the business’s operating income in 3Q14. ROAE was situated at 29% for the quarter.
�
Prima AFP’s funds under management (FuMs) totaled PEN 35,606 million, which represented 32.1% of total FuMs in the private pension system. The nominal profitability of investments over the last 12 months was 7.9%, 10.5% and 9.5% for Funds 1, 2 and 3, respectively. These results situate Prima AFP first in the market for funds 2 and 3 and second for fund 1 system-wide.
�
| 6 |
|
�
Credicorp Capital did not achieve a stable level of income generation and reported a decline of 7% in 3Q14. This led to a net consolidated result of PEN11.3 million, which represented an ROAE of 6.4%. The decrease in quarterly income is due to a lag in economic activity, which had a negative effect on income generation. This caused a 5% decline in net non-financial income, which was situated at PEN 111.3 million in 3Q14. Lower income in the third quarter affected i) the Corporate Finance business, due to less structuring of primary issuances, and fewer advisory services for mergers and acquisitions; ii) the Treasury due to lower commissions; and iii) the Capital Markets activities, due to lower income for currencies and derivatives. Although income generation remains weak, expenses also fell given that lower levels of provisions were reported for short term incentives linked to earnings generated in Peru and Chile. This represented a 35.3% reduction with regard to the second quarter.
�
The Credicorp Ltd. line primarily includes provisions for income tax on dividends from BCP and PPS, and other expenses at the holding level. Nevertheless, a strong decrease in income was registered in 3Q14 due to a loss of PEN 48.1 million that was mainly associated with adjustments in the valuation of calls and puts related to the acquisition of IM Trust and Correval.
�
The Others account includes primarily the results of the Grupo Credito, which is responsible for initiatives such as Tarjeta Naranja (which still accounts for the majority of the losses reported as a result of the shutdown of operations), and the fiduciary business. In 3Q14, the results were negative and reflected losses for PEN 15.3 million.
�
| Regulatory Capital and Capital Adequacy Ratios | � | Balance as of | � | � | % Change | � | ||||||||||||||
| PEN (000) | � | Sep 13 | � | � | Jun 14 | � | � | Sep 14 | � | � | Sep 14 / Jun 14 | � | � | Sep 14 / Sep 13 | � | |||||
| Capital Stock | � | � | 1,379,986 | � | � | � | 1,385,849 | � | � | � | 1,410,614 | � | � | � | 1.8 | % | � | � | 2.2 | % |
| Legal and Other capital reserves (1) | � | � | 8,064,441 | � | � | � | 9,288,799 | � | � | � | 9,303,397 | � | � | � | 0.2 | % | � | � | 15.4 | % |
| Minority interest (2) | � | � | 285,054 | � | � | � | 538,564 | � | � | � | 427,182 | � | � | � | -20.7 | % | � | � | 49.9 | % |
| Loan loss reserves��(3) | � | � | 862,653 | � | � | � | 1,036,969 | � | � | � | 1,102,385 | � | � | � | 6.3 | % | � | � | 27.8 | % |
| Perpetual subordinated debt | � | � | 632,905 | � | � | � | 699,000 | � | � | � | 722,500 | � | � | � | 3.4 | % | � | � | 14.2 | % |
| Subordinated Debt | � | � | 3,567,314 | � | � | � | 4,268,816 | � | � | � | 4,476,785 | � | � | � | 4.9 | % | � | � | 25.5 | % |
| Investments in equity and subordinated debt of financial and insurance companies | � | � | (465,684 | ) | � | � | (482,109 | ) | � | � | (509,210 | ) | � | � | 5.6 | % | � | � | 9.3 | % |
| Goodwill | � | � | (1,006,441 | ) | � | � | (1,254,236 | ) | � | � | (1,242,768 | ) | � | � | -0.9 | % | � | � | 23.5 | % |
| Deduction for subordinated debt limit (50% of Tier I excluding deductions) (4) | � | � | - | � | � | � | - | � | � | � | - | � | � | � | - | � | � | � | - | � |
| Deduction for Tier I Limit (50% of Regulatory capital) (4) | � | � | - | � | � | � | - | � | � | � | - | � | � | � | - | � | � | � | - | � |
| Total Regulatory Capital (A) | � | � | 13,320,228 | � | � | � | 15,481,651 | � | � | � | 15,690,887 | � | � | � | 1.4 | % | � | � | 17.8 | % |
| � | � | � | � | � | � | � | � | � | � | � | � | � | � | � | � | � | � | � | � | � |
| Tier I (5) | � | � | 7,894,642 | � | � | � | 9,197,001 | � | � | � | 9,131,803 | � | � | � | -0.7 | % | � | � | 15.7 | % |
| Tier II (6) + Tier III (7) | � | � | 5,425,585 | � | � | � | 6,284,650 | � | � | � | 6,559,083 | � | � | � | 4.4 | % | � | � | 20.9 | % |
| � | � | � | � | � | � | � | � | � | � | � | � | � | � | � | � | � | � | � | � | � |
| Financial Consolidated Group (FCG) Regulatory Capital Requirements | � | � | 10,421,601 | � | � | � | 11,844,509 | � | � | � | 13,117,587 | � | � | � | 10.7 | % | � | � | 25.9 | % |
| Insurance Consolidated Group (ICG) Capital Requirements | � | � | 884,360 | � | � | � | 879,268 | � | � | � | 902,190 | � | � | � | 2.6 | % | � | � | 2.0 | % |
| FCG Capital Requirements related to operations with ICG (8) | � | � | (149,892 | ) | � | � | (140,607 | ) | � | � | (163,420 | ) | � | � | 16.2 | % | � | � | 9.0 | % |
| ICG Capital Requirements related to operations with FCG (9) | � | � | - | � | � | � | - | � | � | � | - | � | � | � | - | � | � | � | - | � |
| Total Regulatory Capital Requirements (B) | � | � | 11,156,069 | � | � | � | 12,583,170 | � | � | � | 13,856,358 | � | � | � | 10.1 | % | � | � | 24.2 | % |
| Regulatory Capital Ratio (A) / (B) | � | � | 1.19 | � | � | � | 1.23 | � | � | � | 1.13 | � | � | � | � | � | � | � | � | � |
| Required Regulatory Capital Ratio (10) | � | � | 1.00 | � | � | � | 1.00 | � | � | � | 1.00 | � | � | � | � | � | � | � | � | � |
(1) Legal and other capital reserves include restricted capital reserves (PEN 8,071 million) and optional capital reserves (PEN 1,217 million).
(2) Minority interest includes Tier I (PEN 536.5 million) and Tier II (PEN 2.1 million) minority interests.
(3) Up to 1.25% of total risk-weighted assets of Banco de Cr�dito del Per�, Soluci�n Empresa Administradora Hipotecaria, Financiera Edyficar and Atlantic Security Bank.
(4) Tier II + Tier III can not be more than 50% of total regulatory capital.
(5) Tier I = capital + restricted capital reserves + Tier I minority interest - goodwill - (0.5 x investment in equity and subordinated debt of financial and insurance companies) + perpetual subordinated debt.
(6) Tier II = subordinated debt + TierII minority interest tier + loan loss reserves - (0.5 x investment in equity and subordinated debt of financial and insurance companies).
(7) Tier III = Subordinated debt covering market risk only.
(8) Includes regulatory capital requirements of the financial consolidated group.
(9) Includes regulatory capital requirements of the insurance consolidated group.
(10) Regulatory Capital / Total Regulatory Capital Requirements (legal minimum = 1.00).
�
As the table indicates, in general terms Credicorp, as a holding, has maintained a comfortable capitalization level that is equivalent to 1.13 times the capital required by the Peruvian regulator. This ratio falls below the figure reported at the end of 2Q14, mainly because regulatory capital requirements grew at a higher rate (+10.1% QoQ) than regulatory capital (+1.4% QoQ).The increase in regulatory capital requirements came from the financial consolidated group’s regulatory capital and is mainly explained by an increase in credit risk weighted assets and additional capital requirements at BCP.
�
The aforementioned also explains the year over year variation; in which Credicorp decreased its capitalization level from 1.19 in 2Q14 to 1.13 in 3Q14.
�
Additionally, it is also important to note that the Tier 1 represents 58.2% of Credicorp’s total regulatory capital (similar to 59.4% in 2Q14).
�
The table shows that the majority of the capital requirement (94.1%) is associated with its financial business, and in particular more than 70% of the group’s total regulatory capital requirement is concentrated in BCP.
�
| 7 |
|
�
Also, Credicorp’s income generation, coupled with the corporation’s policies on retained earnings, dividend payments, capitalization of earnings and reserve building, has allowed Credicorp to build a comfortable capital reserve to support its business expansion.
�
Finally, Credicorp holds approximately PEN 1,358 million in liquid investments that can be used at any time to strengthen its regulatory capital, which involves a capital buffer of 10% and would turn the regulatory capital ratio to 1.23.
�
| 8 |
|
�
II. Banco de Cr�dito del Peru Consolidated
�
| Banco de Credito and Subsidiaries | � | Quarter | � | � | % Change | � | � | Year to date | � | � | % Change | � | ||||||||||||||||||||
| PEN (000) | � | 3Q13 | � | � | 2Q14 | � | � | 3Q14 | � | � | QoQ | � | � | YoY | � | � | Sep 13 | � | � | Sep 14 | � | � | Sep 14 / Sep 13 | � | ||||||||
| Net interest income | � | � | 1,188,024 | � | � | � | 1,507,462 | � | � | � | 1,587,958 | � | � | � | 5.3 | % | � | � | 33.7 | % | � | � | 3,355,396 | � | � | � | 4,386,417 | � | � | � | 30.7 | % |
| Total provisions for loan loasses | � | � | (332,505 | ) | � | � | (481,036 | ) | � | � | (433,343 | ) | � | � | -9.9 | % | � | � | 30.3 | % | � | � | (890,671 | ) | � | � | (1,279,399 | ) | � | � | 43.6 | % |
| Net interest income after net provisions for loan losses | � | � | 855,519 | � | � | � | 1,026,426 | � | � | � | 1,154,615 | � | � | � | 12.5 | % | � | � | 35.0 | % | � | � | 2,464,725 | � | � | � | 3,107,018 | � | � | � | 26.1 | % |
| Non financial income | � | � | 591,130 | � | � | � | 642,331 | � | � | � | 688,818 | � | � | � | 7.2 | % | � | � | 16.5 | % | � | � | 1,657,175 | � | � | � | 1,942,057 | � | � | � | 17.2 | % |
| Operating expenses | � | � | (847,610 | ) | � | � | (1,062,699 | ) | � | � | (1,049,175 | ) | � | � | -1.3 | % | � | � | 23.8 | % | � | � | (2,541,043 | ) | � | � | (2,981,137 | ) | � | � | 17.3 | % |
| Operating income | � | � | 599,039 | � | � | � | 606,058 | � | � | � | 794,258 | � | � | � | 31.1 | % | � | � | 32.6 | % | � | � | 1,580,857 | � | � | � | 2,067,938 | � | � | � | 30.8 | % |
| Core operating income | � | � | 599,039 | � | � | � | 606,058 | � | � | � | 794,258 | � | � | � | 31.1 | % | � | � | 32.6 | % | � | � | 1,580,857 | � | � | � | 2,067,938 | � | � | � | 30.8 | % |
| Non core operating income | � | � | - | � | � | � | - | � | � | � | - | � | � | � | - | � | � | � | - | � | � | � | - | � | � | � | - | � | � | � | - | � |
| Translation results | � | � | (8,144 | ) | � | � | (1,198 | ) | � | � | 13,066 | � | � | � | 1190.7 | % | � | � | -260.4 | % | � | � | (220,998 | ) | � | � | 9,921 | � | � | � | 104.5 | % |
| Income taxes | � | � | (169,166 | ) | � | � | (170,049 | ) | � | � | (224,940 | ) | � | � | 32.3 | % | � | � | 33.0 | % | � | � | (500,324 | ) | � | � | (581,802 | ) | � | � | 16.3 | % |
| Net income | � | � | 421,201 | � | � | � | 433,079 | � | � | � | 585,764 | � | � | � | 35.3 | % | � | � | 39.1 | % | � | � | 858,025 | � | � | � | 1,496,961 | � | � | � | 74.5 | % |
| Net income / share (PEN) | � | � | 0.09 | � | � | � | 0.09 | � | � | � | 0.12 | � | � | � | 35.2 | % | � | � | 39.0 | % | � | � | 0.18 | � | � | � | 0.32 | � | � | � | 74.5 | % |
| Total loans | � | � | 60,412,012 | � | � | � | 71,396,079 | � | � | � | 73,636,007 | � | � | � | 3.1 | % | � | � | 21.9 | % | � | � | 60,412,012 | � | � | � | 73,636,007 | � | � | � | 21.9 | % |
| Deposits and obligations | � | � | 63,385,310 | � | � | � | 72,094,492 | � | � | � | 70,820,124 | � | � | � | -1.8 | % | � | � | 11.7 | % | � | � | 63,385,310 | � | � | � | 70,820,124 | � | � | � | 11.7 | % |
| Net shareholders' equity | � | � | 7,910,039 | � | � | � | 8,937,830 | � | � | � | 9,513,534 | � | � | � | 6.4 | % | � | � | 20.3 | % | � | � | 7,910,039 | � | � | � | 9,513,534 | � | � | � | 20.3 | % |
| Net financial margin | � | � | 5.33 | % | � | � | 5.90 | % | � | � | 6.02 | % | � | � | � | � | � | � | � | � | � | � | 5.21 | % | � | � | 5.84 | % | � | � | � | � |
| Efficiency ratio | � | � | 46.1 | % | � | � | 48.5 | % | � | � | 44.9 | % | � | � | � | � | � | � | � | � | � | � | 48.0 | % | � | � | 46.1 | % | � | � | � | � |
| Return on average equity | � | � | 22.0 | % | � | � | 19.9 | % | � | � | 25.4 | % | � | � | � | � | � | � | � | � | � | � | 15.3 | % | � | � | 22.4 | % | � | � | � | � |
| Return on average total assets | � | � | 1.8 | % | � | � | 1.6 | % | � | � | 2.1 | % | � | � | � | � | � | � | � | � | � | � | 1.2 | % | � | � | 1.9 | % | � | � | � | � |
| PDL ratio | � | � | 2.25 | % | � | � | 2.72 | % | � | � | 2.66 | % | � | � | � | � | � | � | � | � | � | � | 2.25 | % | � | � | 2.66 | % | � | � | � | � |
| NPL ratio (1) | � | � | 2.84 | % | � | � | 3.40 | % | � | � | 3.35 | % | � | � | � | � | � | � | � | � | � | � | 2.84 | % | � | � | 2.66 | % | � | � | � | � |
| Coverage ratio of PDLs | � | � | 162.7 | % | � | � | 158.4 | % | � | � | 161.5 | % | � | � | � | � | � | � | � | � | � | � | 162.7 | % | � | � | 161.5 | % | � | � | � | � |
| Coverage ratio of NPLs | � | � | 128.7 | % | � | � | 126.6 | % | � | � | 128.3 | % | � | � | � | � | � | � | � | � | � | � | 128.7 | % | � | � | 128.3 | % | � | � | � | � |
| BIS ratio | � | � | 14.12 | % | � | � | 14.58 | % | � | � | 14.78 | % | � | � | � | � | � | � | � | � | � | � | 14.12 | % | � | � | 14.78 | % | � | � | � | � |
| Branches (2) | � | � | 619 | � | � | � | 781 | � | � | � | 784.00 | � | � | � | � | � | � | � | � | � | � | � | 619 | � | � | � | 784 | � | � | � | � | � |
| Agentes BCP (3) | � | � | 5,426 | � | � | � | 7,894 | � | � | � | 7,954 | � | � | � | � | � | � | � | � | � | � | � | 5,426 | � | � | � | 7,954 | � | � | � | � | � |
| ATMs (3) | � | � | 2,282 | � | � | � | 2,507 | � | � | � | 2,504 | � | � | � | � | � | � | � | � | � | � | � | 2,282 | � | � | � | 2,504 | � | � | � | � | � |
| Employees | � | � | 22,403 | � | � | � | 27,241 | � | � | � | 27,555 | � | � | � | � | � | � | � | � | � | � | � | 22,403 | � | � | � | 27,555 | � | � | � | � | � |
(1) NPLs: Non-performing lons = Past due loans + Refinanced and restructured loans. NPL Ratio = NPLs / Total loans.
(2) Includes: BCP, Edyficar, Mibanco and BCP Bolivia.
(3) Includes: BCP Mibanco and BCP Bolivia.
�
BCP consolidated reported net income of PEN 585.8 million in 3Q14, which represented an historic record for quarterly earnings in the banking business. This result, which does not reflect the business’s full potential, nonetheless clearly shows a turning point after a strong economic slowdown in the first half of the year. This was further accentuated by challenges in the SME - Pyme business, which had a negative effect on business that was mainly evident in a significant increase in the cost of risk.
�
The aforementioned, led to an excellent ROAE of 25.4% and an ROAA of 2.1%. This was accompanied by a considerable improvement in operating efficiency, which dropped -306 bps to situate at 44.9%. NIM posted an improvement at both the global and loan levels with 6.02% and 9.01% respectively, which tops the 5.90% and 8.91% posted in 2Q14.
�
The bank’s portfolio quality ratios reflected a recovery that is evident in: i) a decrease in the PDL ratio, which was situated at 2.66% (vs 2.72% in 2Q14), and a drop in the NPL ratio, which weighed in at 3.35% (vs 3.40% in 2Q14); ii) higher coverage of past due and non-performing loans, with levels of 161.5% and 128.3%, respectively; and iii) a lower provisions ratio with regard to loans and the NII, which were situated at 2.4% and 27.3% respectively vs 2.7% and 31.9% respectively of last quarter.
�
The excellent result in 3Q14 is due primarily to:
�
| i) | The expansion of +5.3% QoQ and +33.7% YoY posted in NII, attributable to higher interest on loans, which was attributable to +4.1% growth QoQ and +21.4% YoY on average daily loan balances; as well as lower growth (+3.1% QoQ and +2.0% YoY) in interest expenses, due to lower funding costs thus far this year. |
�
| ii) | The -9.9% QoQ reduction in provisions for loan losses was attributable to an improvement in delinquency, which was in line with expectations after the changes implemented primarily in the SME - Pyme, Credit Cards and Consumer businesses. This helped offset higher expenditure for provisions for loan losses at Mibanco, which were in turn associated with maturities in the past due portfolio. |
�
| iii) | The increase of +7.2% QoQ and +16.5% YoY in non-financial income, which was due to higher gains on sales of securities, gains on foreign exchange transactions and fee income. |
�
| 9 |
|
�
| iv) | The -1.3% QoQ decrease in operating expenses, which was due primarily to lower expenses at almost all of the group’s subsidiaries. This Q, there was a noteworthy decrease in expenses incurred for employee�s salaries and benefits (-4.9% QoQ), which is in line with a reduction in the organization’s organic structure; and lower administrative and general expenses this quarter compared to last quarter, which posted non-recurring expenses for marketing (125 years of BCP) and consultancy services. |
�
| v) | Translation gains for PEN 13.1 million, as a result of a 3.4% appreciation in the US Dollar with regard to the Nuevo Sol in 3Q14, due to a long position in US Dollars and given the fact that the functional currency is now the Nuevo Sol. |
�
As is shown above, the excellent result obtained this quarter is attributable to the good performance in all business segments.
�
In 3Q14, BCP’s interest earning assets expanded +3.9% QoQ. This was due primarily to growth in total loans (+3.1% QoQ); and the Bank’s most profitable assets, which reflected dynamism in Wholesale Banking and the fact that Retail Banking has begun to recover. Additionally, a +43.3% increase was posted QoQ in trading securities due to more investments in CDs from BCRP.
�
The evolution of average daily loan balances clearly reflected more dynamism. In this scenario, Wholesale Banking maintained the trend posted in the first semester of 2014, with growth of +5.4% QoQ, which was the highest rate registered thus far this year. Within this portfolio, loans in LC, which are associated with better margins, were more dynamic this quarter. Retail Banking bounced back and registered growth of +3.5% QoQ in loans, which represents a higher growth rate than that seen in previous quarters (+0.5% in 1Q1 and + 1.4% in 2Q). Within Retail Banking, the star performer was the SME - Business, followed by Mortgage and Consumer. Nevertheless, it is important to note that this dynamic is not reflecting yet the business’s potential.
�
The aforementioned, coupled with a stable funding cost (2.05% in 3Q14 vs 2.04% in 2Q14), facilitated a 12 bps and 10 bps improvement in the global NIM and loan NIM respectively.
�
In terms of the quality of the loan portfolio, the PDL ratio fell 6 bps to situate at 2.66%, due to on-going deceleration in delinquency levels and more dynamism of loans. The improvement posted in the PDL ratio was due to lower levels of delinquency in the SME - Pyme, SME - Business and Credit Cards segments. On the other hand, the PDL ratio at 90 days increased 3 bps due to the impact of installment loans (i.e. mortgage and consumer), which during the first 90 days only reflect past due installments but after day 91, reflect the total loan balance due. The NPL ratio was situated at 3.35% at the end of 2Q14, which represented a slight reduction of 5 bps QoQ.
�
Finally, the BIS capital adequacy ratio (for BCP Stand-alone), based on results in Local Peru GAAP), increased slightly, going from 14.58% to 14.78%. This was attributable to the agreements to capitalize retained earnings, which also helped improve the TIER 1 and TIER 1 Common Equity ratios, which increased from 9.72% to 10.19% and from 7.18% to 7.20% respectively.
�
II.1 Interest-Earning Assets
�
Interest earning assets grew +3.9% QoQ and +19.1% YoY due to growth in total loans (+3.1% QoQ), which are the Bank’s most profitable assets. This expansion reflects the dynamism of Wholesale Banking, and the fact that Retail Banking has begun to recover. An increase of +43.3% QoQ was also posted in trading securities, due to more investment in CDs from BCRP.
�
| 10 |
|
�
| Interest earning assets | � | Quarter | � | � | % Change | � | ||||||||||||||
| PEN (000) | � | 3Q13 | � | � | 2Q14 | � | � | 3Q14 | � | � | QoQ | � | � | YoY | � | |||||
| BCRP and other banks | � | � | 18,137,053 | � | � | � | 18,891,599 | � | � | � | 19,529,988 | � | � | � | 3.4 | % | � | � | 7.7 | % |
| Interbank funds | � | � | 282,544 | � | � | � | 297,004 | � | � | � | 435,939 | � | � | � | 46.8 | % | � | � | 54.3 | % |
| Trading securities | � | � | 300,817 | � | � | � | 1,717,501 | � | � | � | 2,460,868 | � | � | � | 43.3 | % | � | � | 718.1 | % |
| Investments securities available for sale | � | � | 10,447,902 | � | � | � | 9,380,457 | � | � | � | 9,336,182 | � | � | � | -0.5 | % | � | � | -10.6 | % |
| Investments held to maturity | � | � | 675,039 | � | � | � | 1,760,575 | � | � | � | 2,122,790 | � | � | � | 20.6 | % | � | � | 214.5 | % |
| Total loans | � | � | 60,412,012 | � | � | � | 71,396,079 | � | � | � | 73,636,007 | � | � | � | 3.1 | % | � | � | 21.9 | % |
| Total interest earning assets | � | � | 90,255,367 | � | � | � | 103,443,215 | � | � | � | 107,521,774 | � | � | � | 3.9 | % | � | � | 19.1 | % |
�
If we analyze the QoQ evolution of BCP’s interest earning assets, we can see the impact of the good dynamic of total loans. The evolution of Wholesale Banking, which expanded +5.4% QoQ (measured in average daily balances), was particularly noteworthy. The dynamism of this portfolio was evident in both Corporate Banking (+4.7% QoQ, measured in average daily balances) and in Middle Market Banking (+6.5% QoQ). On the other hand, Retail Banking reported growth of +3.5% QoQ, which is significantly higher than the rate registered in previous quarters (+0.5% in 1Q14 and + 1.4% in 2Q14). This was due not only to a slight recovery in the economy, but also to the campaigns conducted in the second half of the year.
�
Trading securities increased +43.3% QoQ. This growth was associated with more investments in Certificates of Deposits from BCRP, which registered better performance and fluctuation in 3Q14. This was in line with BCP’s asset and liability management strategy to improve short term margins.
�
It is important to note that deposits in BCRP and in other banks reported growth of +3.4% QoQ, due to REPO transactions with BCRP in 3Q14 (which will be discussed later in the report), and an increase in deposits in banks locally and abroad this past quarter.
�
The increase in the held-to-maturity portfolio (+20.6 QoQ) was due to a larger position in Peruvian Government bonds, which clearly reflects our assets and liabilities management strategy.
�
If we analyze the YoY evolution, a +19.1% increase is evident in total interest earning assets. This was primarily due to the inclusion of Mibanco at the end of 1Q14, and an expansion in total loans (+21.9% YoY).
�
Loan Portfolio
�
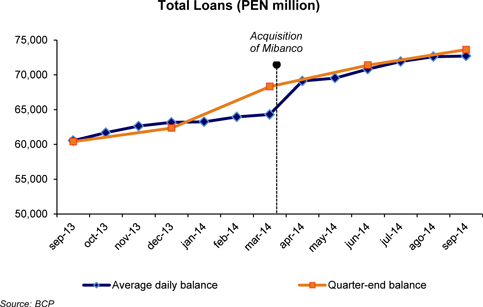
The following figure depicts the evolution of average daily balances over the last 12 months of loans at the end of each month, and accounting balances at quarter-end:
�
�
| 11 |
|
�
The favorable evolution of the loan portfolio, measured in average daily balances, led to an increase of +4.1% QoQ. Growth in Corporate Banking and Middle Market Banking were particularly noteworthy this quarter. On the other hand, at the end of 3Q14, total loans, expressed in accounting balances, were situated at PEN 73,636 million. This represents growth of +3.1% QoQ and +21.9% YoY.
�
QoQ growth in average daily loan balances is attributable to the fact that the year-end campaign has begun, and is in line with the increase in dynamism that characterizes the second half of every year.
�
It is important to note, that the lower growth in accounting balances with regard to average daily balances was due to loan balance cancelations in Corporate Banking�s FC portfolio at the end of 3Q14. This did not have a material effect on average daily balances this quarter, in a scenario marked by an appreciation in the US Dollar, and a decrease in BCRP’s reserve requirements for LC (in June, the rate was 11.5% and at the end of September, it was 10.5%), which improved conditions for loans in LC and reflects the effect of migrating from FC to LC by the end of 3Q14.
�
The YoY analysis indicates that average daily balances, including Mibanco, appreciated +21.4% YoY. Nevertheless, if we exclude Mibanco, growth was situated at +14.4% YoY.
�
Average Daily Balances
�
| � | � | TOTAL LOANS (1) | � | |||||||||||||||||
| � | � | (Expressed in million PEN)* | � | |||||||||||||||||
| � | � | 3Q13 | � | � | 2Q14 | � | � | 3Q14 | � | � | QoQ | � | � | YoY | � | |||||
| Wholesale Banking | � | � | 27,649 | � | � | � | 31,035 | � | � | � | 32,704 | � | � | � | 5.4 | % | � | � | 18.3 | % |
| Corporate | � | � | 17,700 | � | � | � | 19,790 | � | � | � | 20,729 | � | � | � | 4.7 | % | � | � | 17.1 | % |
| Middle-Market | � | � | 9,948 | � | � | � | 11,245 | � | � | � | 11,975 | � | � | � | 6.5 | % | � | � | 20.4 | % |
| Retail Banking | � | � | 26,912 | � | � | � | 28,200 | � | � | � | 29,177 | � | � | � | 3.5 | % | � | � | 8.4 | % |
| SME- Pyme | � | � | 6,973 | � | � | � | 6,921 | � | � | � | 7,042 | � | � | � | 1.7 | % | � | � | 1.0 | % |
| SME- Business | � | � | 2,528 | � | � | � | 2,517 | � | � | � | 2,835 | � | � | � | 12.6 | % | � | � | 12.2 | % |
| Mortgage | � | � | 9,414 | � | � | � | 10,247 | � | � | � | 10,555 | � | � | � | 3.0 | % | � | � | 12.1 | % |
| Consumer | � | � | 5,378 | � | � | � | 5,555 | � | � | � | 5,737 | � | � | � | 3.3 | % | � | � | 6.7 | % |
| Credit Card | � | � | 2,620 | � | � | � | 2,959 | � | � | � | 3,009 | � | � | � | 1.7 | % | � | � | 14.8 | % |
| Edyficar | � | � | 2,299 | � | � | � | 2,878 | � | � | � | 3,058 | � | � | � | 6.3 | % | � | � | 33.0 | % |
| Bolivia | � | � | 2,693 | � | � | � | 3,021 | � | � | � | 3,168 | � | � | � | 4.9 | % | � | � | 17.6 | % |
| Mibanco | � | � | - | � | � | � | 4,259 | � | � | � | 4,167 | � | � | � | -2.1 | % | � | � | - | � |
| Others (2) | � | � | 373 | � | � | � | 444 | � | � | � | 447 | � | � | � | 0.7 | % | � | � | 20.0 | % |
| � | � | � | � | � | � | � | � | � | � | � | � | � | � | � | � | � | � | � | � | � |
| Consolidated total loans | � | � | 59,925 | � | � | � | 69,836 | � | � | � | 72,721 | � | � | � | 4.1 | % | � | � | 21.4 | % |
(1) Average daily balance.
(2) Includes Work Out Unit, and other banking.
* For consolidation purposes, loans generated in FC are converted to LC.
Source: BCP
�
As discussed above, loan evolution (measured in average daily balances) in 3Q14 is due to a +5.4% QoQ increase in Wholesale Banking, which reflected the excellent dynamism in Corporate Banking (+4.7% QoQ) and Middle Market Banking (+6.5% QoQ). The expansion posted in both portfolios, was due primarily to more medium and long term working capital financing, and foreign trade financing in FC (+5.3% QoQ and +4.5% QoQ respectively).
�
The Retail Banking portfolio registered +3.5% growth QoQ, that was due primarily to an increase in LC loans (+3.0% QoQ), which was in line with expansion in the SME - Business, Mortgage and Consumer segments. It is important to note the recovery posted in this portfolio’s growth, although it is still not normalized, given that in 1Q, expansion was situated at +0.5% QoQ and in 2Q, the figure was +1.4% QoQ. As such, there is a clear upward trend in Retail Banking. The variations seen within this portfolio were due to:
�
| i) | The SME - Business segment grew +12.6% QoQ, primarily due to an expansion in the FC portfolio that grew +11.2% QoQ, because of better rates. On the other hand, the LC portfolio grew +10.9% QoQ. The aforementioned factors are in line with the effect of year-end financing campaigns. |
�
| 12 |
|
�
| ii) | The Mortgage Segment increased +3.0% QoQ, due to growth in the LC portfolio (3.7% QoQ). This rate falls below that posted in the first two quarters of the year (1Q14: +6.5% QoQ; 2Q14: +5.5% QoQ) due to the economic slowdown. The FC portfolio continued to fall due to amortizations (-0.2% QoQ). |
�
| iii) | The Consumer segment posted an increase of +3.3% QoQ. This segment also reflected a better pace with regard to the figures posted in the first half of the year (+1.8% in 1Q and +1.6% in 2Q). If we analyze the evolution by currency, an increase of +2.7% QoQ is evident in the LC portfolio, while the FC portfolio posted growth of +3.5% QoQ. It is important to note that the LC portfolio represents approximately 80% of all loans in this segment, while the FC portfolio is associated with credit lines issued to high-income clients. |
�
| iv) | The Credit Card segment grew +1.7% QoQ. This quarter, more growth was seen in this segment’s LC portfolio (+1.5% QoQ) due to recurrent credit card campaigns (Lanpass Program) in 3Q14. Unlike other businesses, the dynamic of the Credit Card segment shows growth rates that are slightly below those registered in previous quarters +2% in 1Q and + 2.2% in 2Q. |
�
| v) | The SME - Pyme segment posted growth of +1.7% QoQ, which was primarily attributable to the end-of-year campaign. This result contrasts with that seen in the first half of the year, with a -1.5% drop in 1Q and a -0.9% decline in 2Q, due to the changes implemented in the business and risk models. In this line, the LC portfolio, which represents 90% of SME loans, expanded +2.1% QoQ, while the FC segment dropped -3.2% QoQ. |
�
Edyficar’s portfolio, measured in average daily balances, posted a significant increase (+6.3% QoQ), going from PEN 2,878 million in 2Q14 to PEN 3,058 million in 3Q14. The aforementioned, is in line with growth in the labor force, which helped fuel an increase in Edyficar’s share of the loan market, which rose from 8.9% in 2Q to 9.2% in 3Q. On the other hand, BCP Bolivia’s loans grew +4.9% QoQ due to expansion in its Retail Banking portfolio, which will be covered in detail later in this report.
�
In the YoY evolution, average daily loan balances grew +21.4%, which was due primarily to:
�
| i) | Growth in the Wholesale Banking portfolio (+18.3% YoY), which posted noteworthy growth in the LC portfolio (+61.6% YoY). This component accounts for approximately 40% of the YoY growth. |
�
| ii) | The impact of the Mibanco acquisition, which is responsible for approximately 33% of the YoY growth in average daily balances. |
�
| iii) | The +8.4% YoY growth in Retail Banking loans, which are responsible for approximately 18% of the total increase; in this division, the evolution of the Mortgage, Consumer and Credit Card portfolios is particularly noteworthy. |
�
| iv) | Growth of +33.0% YoY in Edyficar’s portfolio; this excellent performance was accompanied by good portfolio quality, which is in turn reflected in its stable delinquency ratio. The aforementioned is even more outstanding, if we consider that the scenario in the SME - Pyme and Micro segments is currently challenging. |
�
| v) | Finally, BCP Bolivia achieved growth of +17.6% YoY in loans. This was due primarily to on-going growth in its Retail Banking portfolio. |
�
| 13 |
|
�
Average Daily Balances
�
| � | � | DOMESTIC CURRENCY LOANS (1) | � | � | FOREIGN CURRENCY LOANS (1) | � | ||||||||||||||||||||||||||||||||||
| � | � | (Expressed in million PEN) | � | � | (Expressed in million USD) | � | ||||||||||||||||||||||||||||||||||
| � | � | 3Q13 | � | � | 2Q14 | � | � | 3Q14 | � | � | QoQ | � | � | YoY | � | � | 3Q13 | � | � | 2Q14 | � | � | 3Q14 | � | � | QoQ | � | � | YoY | � | ||||||||||
| Wholesale Banking | � | � | 6,379 | � | � | � | 10,104 | � | � | � | 10,307 | � | � | � | 2.0 | % | � | � | 61.6 | % | � | � | 7,613 | � | � | � | 7,502 | � | � | � | 7,878 | � | � | � | 5.0 | % | � | � | 3.5 | % |
| Corporate | � | � | 4,215 | � | � | � | 6,763 | � | � | � | 6,750 | � | � | � | -0.2 | % | � | � | 60.1 | % | � | � | 4,827 | � | � | � | 4,669 | � | � | � | 4,918 | � | � | � | 5.3 | % | � | � | 1.9 | % |
| Middle-Market | � | � | 2,164 | � | � | � | 3,342 | � | � | � | 3,558 | � | � | � | 6.5 | % | � | � | 64.4 | % | � | � | 2,786 | � | � | � | 2,833 | � | � | � | 2,960 | � | � | � | 4.5 | % | � | � | 6.3 | % |
| Retail Banking | � | � | 18,751 | � | � | � | 20,549 | � | � | � | 21,165 | � | � | � | 3.0 | % | � | � | 12.9 | % | � | � | 2,906 | � | � | � | 2,742 | � | � | � | 2,817 | � | � | � | 2.7 | % | � | � | -3.0 | % |
| SME- Pyme | � | � | 6,132 | � | � | � | 6,200 | � | � | � | 6,330 | � | � | � | 2.1 | % | � | � | 3.2 | % | � | � | 285 | � | � | � | 259 | � | � | � | 250 | � | � | � | -3.2 | % | � | � | -12.2 | % |
| SME- Business | � | � | 641 | � | � | � | 782 | � | � | � | 868 | � | � | � | 10.9 | % | � | � | 35.5 | % | � | � | 675 | � | � | � | 622 | � | � | � | 691 | � | � | � | 11.2 | % | � | � | 2.4 | % |
| Mortgage | � | � | 5,388 | � | � | � | 6,536 | � | � | � | 6,779 | � | � | � | 3.7 | % | � | � | 25.8 | % | � | � | 1,441 | � | � | � | 1,330 | � | � | � | 1,328 | � | � | � | -0.2 | % | � | � | -7.9 | % |
| Consumer | � | � | 4,287 | � | � | � | 4,402 | � | � | � | 4,521 | � | � | � | 2.7 | % | � | � | 5.5 | % | � | � | 391 | � | � | � | 413 | � | � | � | 427 | � | � | � | 3.5 | % | � | � | 9.4 | % |
| Credit Card | � | � | 2,304 | � | � | � | 2,629 | � | � | � | 2,667 | � | � | � | 1.5 | % | � | � | 15.8 | % | � | � | 113 | � | � | � | 119 | � | � | � | 120 | � | � | � | 1.2 | % | � | � | 6.1 | % |
| Edyficar | � | � | 2,270 | � | � | � | 2,853 | � | � | � | 3,033 | � | � | � | 6.3 | % | � | � | 33.6 | % | � | � | 10 | � | � | � | 9 | � | � | � | 9 | � | � | � | -1.5 | % | � | � | -14.2 | % |
| Bolivia | � | � | - | � | � | � | - | � | � | � | - | � | � | � | - | � | � | � | - | � | � | � | 964 | � | � | � | 1,083 | � | � | � | 1,114 | � | � | � | 2.9 | % | � | � | 15.6 | % |
| Mibanco | � | � | - | � | � | � | 3,686 | � | � | � | 3,622 | � | � | � | -1.7 | % | � | � | - | � | � | � | - | � | � | � | 206 | � | � | � | 192 | � | � | � | -6.8 | % | � | � | - | � |
| Others (2) | � | � | 115 | � | � | � | 163 | � | � | � | 142 | � | � | � | -12.7 | % | � | � | 23.6 | % | � | � | 108 | � | � | � | 101 | � | � | � | 107 | � | � | � | 6.3 | % | � | � | -0.8 | % |
| � | � | � | � | � | � | � | � | � | � | � | � | � | � | � | � | � | � | � | � | � | � | � | � | � | � | � | � | � | � | � | � | � | � | � | � | � | � | � | � | � |
| Consolidated total loans | � | � | 27,515 | � | � | � | 37,354 | � | � | � | 38,270 | � | � | � | 2.5 | % | � | � | 39.1 | % | � | � | 11,601 | � | � | � | 11,643 | � | � | � | 12,117 | � | � | � | 4.1 | % | � | � | 4.4 | % |
(1) Average daily balance.
(2) Includes Work Out Unit, other banking and BCP Bolivia.
Fuente: BCP
�
Market Share in loans
�

�
At the end of August 2014, BCP consolidated continued to lead the market with a share of 31.0%, which situates it 11% above its closest competitor.
�
During the same period, Retail Banking continued to lead the market in the majority of its segments, with the exception of Credit Cards, where it is situated in second place. It is important to note that BCP’s market share of the SME segment, without Mibanco, increased slightly (+0.4%) from June to August 2014; and, if we include Mibanco’s share, the portfolio’s total market share is situated at 35.9%.
�
Wholesale Banking continued to consolidate its market leadership by increasing its share of both Corporate Banking and Middle Market Banking, going from 44.4% and 33.1% in June 2014, respectively to 44.7% and 33.3% at the end of September 2014, respectively.
�
Dollarization
�
If we analyze the evolution of dollarization in the loan portfolio using accounting balances at quarter-end, we see that FC-denominated loans continued to fall QoQ and YoY, going from 53.1% in 3Q13 and 47.6% in 2Q14, to 47.0% in 3Q14. The aforementioned is due to the dedollarization process that is underway, which is driven by better conditions for LC loans and the devaluation of the Nuevo Sol in 2013, which has continued in 2014. In this sense, the quarterly decrease is due primarily to expansion in the LC portfolio, which was led by the Retail Banking portfolio.
�
| 14 |
|
�

�
II. 2 Funding
�
BCP’s funding cost remained stable QoQ, despite a recomposition in funding sources, which was due primarily to an increase in Due to Banks and Correspondents (+30.7 QoQ) that offset the decrease in time deposits (-7.9% QoQ) and CTS deposits (-10.6% QoQ). The loan/deposit ratio increased to 104.0% at the end of 3Q14, which is +500 bps higher than the 99.0% posted in 2Q14, due to a drop in deposits (-1.8% QoQ), while total loans grew +3.1% QoQ. The aforementioned shows the trade-off between the increase of the ratio and the protection of funding costs that BCP decided.
�
| Funding | � | Quarter | � | � | % Change | � | ||||||||||||||
| PEN (000) | � | 3Q13 | � | � | 2Q14 | � | � | 3Q14 | � | � | QoQ | � | � | YoY | � | |||||
| Non-interest bearing deposits | � | � | 16,140,468 | � | � | � | 18,393,882 | � | � | � | 18,154,246 | � | � | � | -1.3 | % | � | � | 12.5 | % |
| Demand deposits | � | � | 3,758,975 | � | � | � | 3,996,195 | � | � | � | 4,612,503 | � | � | � | 15.4 | % | � | � | 22.7 | % |
| Saving deposits | � | � | 16,888,339 | � | � | � | 19,036,056 | � | � | � | 19,965,805 | � | � | � | 4.9 | % | � | � | 18.2 | % |
| Time deposits | � | � | 20,468,453 | � | � | � | 23,314,183 | � | � | � | 21,466,868 | � | � | � | -7.9 | % | � | � | 4.9 | % |
| Severance indemnity deposits (CTS) | � | � | 5,926,255 | � | � | � | 7,148,162 | � | � | � | 6,390,609 | � | � | � | -10.6 | % | � | � | 7.8 | % |
| Interest payable | � | � | 202,821 | � | � | � | 206,014 | � | � | � | 230,093 | � | � | � | 11.7 | % | � | � | 13.4 | % |
| Total customer deposits | � | � | 63,385,310 | � | � | � | 72,094,492 | � | � | � | 70,820,124 | � | � | � | -1.8 | % | � | � | 11.7 | % |
| � | � | � | � | � | � | � | � | � | � | � | � | � | � | � | � | � | � | � | � | � |
| Due to banks and correspondents | � | � | 10,662,697 | � | � | � | 13,674,528 | � | � | � | 17,871,327 | � | � | � | 30.7 | % | � | � | 67.6 | % |
| Bonds and subordinated debt | � | � | 11,537,940 | � | � | � | 12,263,511 | � | � | � | 12,644,297 | � | � | � | 3.1 | % | � | � | 9.6 | % |
| Other liabilities | � | � | 2,013,193 | � | � | � | 2,085,196 | � | � | � | 2,781,552 | � | � | � | 33.4 | % | � | � | 38.2 | % |
| � | � | � | � | � | � | � | � | � | � | � | � | � | � | � | � | � | � | � | � | � |
| Total funding | � | � | 87,599,140 | � | � | � | 100,117,727 | � | � | � | 104,117,300 | � | � | � | 4.0 | % | � | � | 18.9 | % |
| � | � | � | � | � | � | � | � | � | � | � | � | � | � | � | � | � | � | � | � | � |
| Funding cost | � | � | 2.34 | % | � | � | 2.04 | % | � | � | 2.05 | % | � | � | � | � | � | � | � | � |
�
Funding Cost
�
BCPs’ funding cost1 remained stable QoQ, and situated at 2.05% in 3Q14 vs. 2.04% in 2Q14. Although total funding increased +4.0% QoQ, and a recomposition was evident, which will be explained later on, interest expenses expanded moderately (+3.1% QoQ).
�
1 El costo de fondeo es calculado usando la siguiente f�rmula:
�

�
* Uses the average of the initial balance and the closing balance of total liabilities (without including other liabilities) for the period.
�
| 15 |
|
�
In terms of the funding structure, although the share of total deposits fell from 72% in 2Q14 to 68% in 3Q14 and the share of Due to Banks and Correspondents increased from 13.7% in 2Q14 to 17.4% in 3Q14; the funding cost remained stable due to the fact that the aforementioned was attributable to an increase in the use of alternative sources of funding, which are less expensive than some kinds of deposits, such as time deposits. The increase in Repo and Currency repo with BCRP was noteworthy, and was in line with the increase in the availability of this source of funds in 3Q14. The purpose of BCRP’s instruments for funding is to inject more LC liquidity into the market and to reduce exchange rate volatility.
�
It is important to remember that alternative sources of funding, such as REPO transactions, are exempt from the implicit cost of legal reserve requirements, which reduces costs particularly in comparison to other sources of funding such as time deposits.
�
The drop in deposits was evident primarily in higher-cost options such as company time deposits. Nevertheless, it is important to note that the main QoQ decline in time deposits was evident in the FC portfolio, which offers lower interest rates (approximately -300 bps) than LC time deposits.
�
In 3Q14, CTS deposits also posted a decline. This was attributable to a decrease in legal requirements (the minimum level to calculate the surplus that an employee can access was reduced from 6 monthly salaries to 4). It is important to remember that these deposits have low funding costs, even lower than those associated with BCRP’s funding instruments.
�
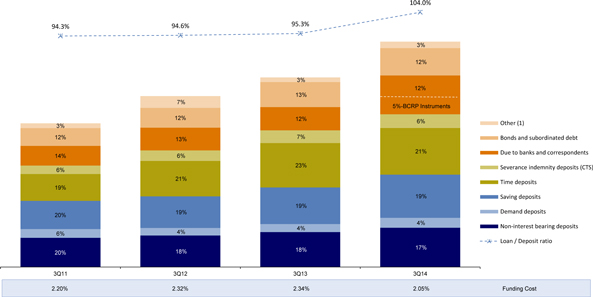
Funding – Structure and Cost (excluding Mibanco)
�
�
If we analyze the evolution of the funding structure, we see that the deposits’ share of total funding remained relatively stable in 2011-2013, representing between 73% and 75% of total funding. Nevertheless, the share of total deposits in total funding fell in 3Q14 and situated at 68%2. The aforementioned, was due to a decrease in time deposits (-7.9% QoQ), followed by a drop in CTS deposits (-10.6% QoQ), which we explained before.
�
The loan/deposit (L/D) ratio was situated at 104.0% at the end of 3Q14, which represents a +500 bps increase with regard to the figure registered in 2Q14 (99.0%). This was due primarily to the -1.8% QoQ drop in total deposits vs. growth of +3.1% QoQ in total loans.
�
It is important to highlight that BCP’s asset and liability management in 3Q prioritized the defense of funding cost (to avoid its increase) against that of the L/D ratio. In line with this, BCP preferred to take BCRP instruments as a source of funds instead of attracting LC time deposits by increasing the interest rate.
�
2 These figures consider share vs. total funding. The figure “Evolution of the structure and funding cost” does not include Other Liabilities.
�
| 16 |
|
�
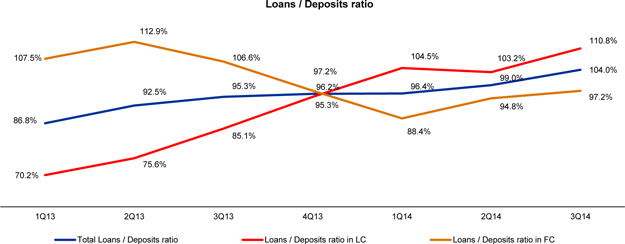
An analysis of the L/D ratio per currency indicates that LC’s ratio rose to 110.8%, which represents a +760 bps increase with regard to the 103.2% registered in 2Q14. During this same period, FC’s ratio increased to 97.2%, which represents a +240 bps increase with regard to the 94.8% reported in 2Q14. The evolution of the ratio per currency reflects a larger increase in the LC portfolio in terms of accounting balances. It is important to note that the L/D ratio in LC and FC have remained at reasonable levels and within the parameters set by the bank’s asset and liability management policy, and are among the lowest in the Peruvian banking system.
�
Finally, although the loan/deposit ratio has experienced an upward trend over the past few years, which was due to higher growth in loans than in deposits, this is not a reason for concern given that the pace of loan expansion, which has been accompanied by alternative funding, has not been deterred by lower growth in deposits.
�
The figure below shows the evolution of the loan/deposit ratio by currency:
�
�
Deposits
�
If we analyze the evolution of deposits in 3Q14, we see that they continue to be the main source of funding; nevertheless, their share in total funding drops QoQ (68% at the end of 3Q14 vs. 72% at the end of 2Q14). The aforementioned is a result of a decrease of -1.8% QoQ in total deposits, mainly in CTS deposits (-10.6% QoQ) and time deposits (-7.9% QoQ).
�
CTS deposits declined -10.6% QoQ due to a decrease in the legal minimum, which changed the withdrawal limit of surplus funds from six to four monthly salaries. It is also important to note that CTS is paid in May, which means that 2Q14 includes a seasonal expansion that leads to a subsequent contraction in 3Q every year.
�
Time deposits fell -7.9% QoQ in accounting balances, led by the drop in LC deposits. Additionally, it is important to note that deposits at Mibanco drop (83% in LC), which is in line with Mibanco’s asset and liability strategy.
�
It is important to note that the evolution of time deposits in terms of average daily balances shows that during the first two months of 3Q14, there was a larger decline in FC time deposits by corporate clients. The aforementioned is explained due to these clients decided to enter into forward agreements to take the arbitrage opportunity of the forward market in previous months to the 3Q. Therefore, at the beginning of 3Q, they withdrew FC deposits and changed them to LC deposits (in other banks) in order to fulfill their obligations in the forward market.
�
At the end of 3Q, there was a decrease in LC time deposits mainly by corporate clients, in line with their expectations of higher spreads in the forward market.
�
| 17 |
|
�
The aforementioned, was offset by the increase in saving deposits (+4.9% QoQ) and demand deposits (+15.4% QoQ) in both LC and FC. In this context, core deposits (demand, savings and CTS) increased only +1.1% QoQ.
�
In annual terms, deposits grew +11.7%, mainly due to the +18.2% increase in savings deposit, +12.5% growth in non-interest bearing deposits and +4.9% in time deposits. The aforementioned was primarily associated with the inclusion of Mibanco’s deposits. If we exclude Mibanco from the analysis, growth in deposits would be +6.0% YoY due to a drop in time deposits.
�
Other sources of funding
�
The increase in other sources of funding (+18.8% QoQ) was due mainly to high due to banks and correspondents (+30.7% QoQ), which was mainly due to Repo and currency Repo transactions with BCRP equivalent to PEN 3,588 million. The quarterly increase in due to banks was attributable to financing taken with Credit Suisse, JP Morgan Chase and HSBC Bank.
�
The +33.4% QoQ increase in other liabilities corresponds to higher accounts receivables corresponding to the purchase of sovereign papers, certificates of deposit, and forward contracts and swaps.
�
The bonds and subordinated debt line increased +3.1% QoQ. This was due primarily to an increase in the value of subordinated bonds in dollars, which was in line with the 3.4% QoQ devaluation of the Nuevo Sol against the US Dollar.
�
In annual terms, the evolution of the due to banks and correspondents (+67.6%), was due primarily to the use of BCRP instruments, and to due to banks with The Bank of Tokyo – Mitsubishi, Credit Suisse, and HSBC Bank. There was also an increase in Bonds and Subordinated Debt this quarter for +9.6%, which was associated primarily with a decision to re-open Subordinated Note 2027 for PEN 559.2 million.
�
Market share in deposits
�
At the end of August 2014, BCP continued to lead the deposits market with a market share of 34.0%3. It also maintained the lead in different types of deposits in both LC and FC.
�
Market share by type of deposit and currency
�
| � | � | Demand deposits | � | � | Saving deposits | � | � | Time deposits | � | � | Severance indemnity | � | ||||
| LC | � | � | 38.6 | % | � | � | 40.1 | % | � | � | 25.9 | % | � | � | 38.9 | % |
| FC | � | � | 35.9 | % | � | � | 39.6 | % | � | � | 31.7 | % | � | � | 50.2 | % |
LC: Local Currency
FC: Foreign Currency
�
Deposit Dollarization
�
The LC’s share of deposits in total deposits fell from 50.3% at the end of 2Q14 to 49.7% at the end of 3T14, due to a drop in time and CTS deposits. The YoY evolution reveals a de-dollarization process is in play, with a -280 bps reduction in the share of FC deposits.
�
3 Includes Mibanco’s market share.
�
| 18 |
|
�

�
Mutual Funds
�
Mutual funds in Credicorp Capital Fondos Peru grew +11.1% QoQ. This was due primarily to an increase in the number of clients, which totaled 99,633 at the end of 3Q14 (+10.4% QoQ), that helped fuel an increase in the volume of funds under management. Better margins were recorded this quarter, in line with the new account strategy that offers easier access (low minimum amounts) for the most profitable products. The aforementioned allowed Credifondo to continue leading the market and to increase its share to 42.4% of total funds under management.
�
Credifondo Bolivia reported a -4.2% QoQ decrease in the fund volume, in line with a demand for liquidity from corporate clients to cover profit sharing and tax payment due in 3Q14. It is important to mention that Credifondo Bolivia has the highest yield rates in the system, which makes it an attractive investment alternative.
�
| Mutual funds | � | Quarter | � | � | Change % | � | ||||||||||||||
| PEN (000) | � | 3Q13 | � | � | 2Q14 | � | � | 3Q14 | � | � | QoQ | � | � | YoY | � | |||||
| Mutual funds in Peru | � | � | 6,712,476 | � | � | � | 6,785,892 | � | � | � | 7,540,063 | � | � | � | 11.1 | % | � | � | 12.3 | % |
| Mutual funds in Bolivia | � | � | 179,564 | � | � | � | 194,897 | � | � | � | 186,658 | � | � | � | -4.2 | % | � | � | 4.0 | % |
| Total mutual funds | � | � | 6,892,041 | � | � | � | 6,980,789 | � | � | � | 7,726,721 | � | � | � | 10.7 | % | � | � | 12.1 | % |
�
II.3 Net Interest Income (NII)
�
NII grew +5.3% QoQ and +33.7% YoY due to higher interest income from loans, which was associated with loan growth. Higher growth in NII with regard to the increase in average interest earning assets (+3.2% QoQ) led to an improvement in NIM, which went from 5.90% at the end of 2Q14 to 6.02% in 3Q14.
�
| 19 |
|
�
| Net interest income | � | Quarter | � | � | % Change | � | � | Year to date | � | � | % Change | � | ||||||||||||||||||||
| PEN (000) | � | 3Q13 | � | � | 2Q14 | � | � | 3Q14 | � | � | QoQ | � | � | YoY | � | � | Sep 13 | � | � | Sep 14 | � | � | Sep 14 / Sep 13 | � | ||||||||
| Interest income | � | � | 1,700,362 | � | � | � | 2,014,370 | � | � | � | 2,110,370 | � | � | � | 4.8 | % | � | � | 24.1 | % | � | � | 4,871,729 | � | � | � | 5,881,967 | � | � | � | 20.7 | % |
| Interest on loans | � | � | 1,573,458 | � | � | � | 1,902,293 | � | � | � | 1,992,142 | � | � | � | 4.7 | % | � | � | 26.6 | % | � | � | 4,453,710 | � | � | � | 5,514,907 | � | � | � | 23.8 | % |
| Interest and dividends on investments | � | � | (110 | ) | � | � | - | � | � | � | - | � | � | � | 0.0 | % | � | � | -100.0 | % | � | � | 18,124 | � | � | � | 25,576 | � | � | � | 41.1 | % |
| Interest on deposits with banks | � | � | 22,281 | � | � | � | 13,958 | � | � | � | 13,181 | � | � | � | -5.6 | % | � | � | -40.8 | % | � | � | 71,758 | � | � | � | 38,591 | � | � | � | -46.2 | % |
| Interest on trading securities | � | � | 103,177 | � | � | � | 95,293 | � | � | � | 101,026 | � | � | � | 6.0 | % | � | � | -2.1 | % | � | � | 322,994 | � | � | � | 293,190 | � | � | � | -9.2 | % |
| Other interest income | � | � | 1,556 | � | � | � | 2,826 | � | � | � | 4,021 | � | � | � | 42.3 | % | � | � | 158.4 | % | � | � | 5,143 | � | � | � | 9,703 | � | � | � | 88.7 | % |
| Interest expense | � | � | 512,338 | � | � | � | 506,908 | � | � | � | 522,412 | � | � | � | 3.1 | % | � | � | 2.0 | % | � | � | 1,516,333 | � | � | � | 1,495,550 | � | � | � | -1.4 | % |
| Interest on deposits | � | � | 179,513 | � | � | � | 187,493 | � | � | � | 200,523 | � | � | � | 6.9 | % | � | � | 11.7 | % | � | � | 569,636 | � | � | � | 529,479 | � | � | � | -7.0 | % |
| Interest on borrowed funds | � | � | 99,797 | � | � | � | 120,933 | � | � | � | 135,408 | � | � | � | 12.0 | % | � | � | 35.7 | % | � | � | 288,595 | � | � | � | 365,401 | � | � | � | 26.6 | % |
| Interest on bonds and subordinated note | � | � | 179,998 | � | � | � | 161,487 | � | � | � | 161,380 | � | � | � | -0.1 | % | � | � | -10.3 | % | � | � | 508,603 | � | � | � | 480,895 | � | � | � | -5.4 | % |
| Other interest expense | � | � | 53,030 | � | � | � | 36,995 | � | � | � | 25,101 | � | � | � | -32.2 | % | � | � | -52.7 | % | � | � | 149,499 | � | � | � | 119,775 | � | � | � | -19.9 | % |
| Net interest income | � | � | 1,188,024 | � | � | � | 1,507,462 | � | � | � | 1,587,958 | � | � | � | 5.3 | % | � | � | 33.7 | % | � | � | 3,355,396 | � | � | � | 4,386,417 | � | � | � | 30.7 | % |
| � | � | � | � | � | � | � | � | � | � | � | � | � | � | � | � | � | � | � | � | � | � | � | � | � | � | � | � | � | � | � | � | � |
| Average interest earning assets | � | � | 89,136,657 | � | � | � | 102,190,303 | � | � | � | 105,482,495 | � | � | � | 3.2 | % | � | � | 18.3 | % | � | � | 88,285,035 | � | � | � | 103,967,460 | � | � | � | 17.8 | % |
| Net interest margin * | � | � | 5.33 | % | � | � | 5.90 | % | � | � | 6.02 | % | � | � | � | � | � | � | � | � | � | � | 5.07 | % | � | � | 5.63 | % | � | � | � | � |
*Annualized.
�
Interest income
�
Interest income grew +4.8% QoQ. This was due primarily to an increase in interest on loans, which was in line with a +4.1% QoQ in average daily balances.
�
The QoQ evolution in interest income on loans was due primarily to dynamism in Wholesale Banking loans and, to a lesser extent, to the good evolution of Retail loans. It is important to note that the +5.4% QoQ growth in the Wholesale Banking portfolio (in terms of average daily balances) represents the highest quarterly increase thus far in 2014. Dynamism was observed in both Corporate Banking and Middle Market Banking. Another important factor that explains the good evolution of interest income on loans is the improvement in the dynamism of Retail Banking and mainly in the SME-Business segment, which coincides with the end-of-year campaign.
�
In 3Q14, income from interest on trading securities increased (+6% QoQ), which was due to higher gains on investments in Certificates of Deposit with BCRP and in Bonds from the Peruvian government.
�
Other interest income increased +42.3% QoQ, which was due primarily to a revaluation of forward instruments and swaps at Edyficar.
�
In annual terms, BCP’s interest income grew +24.1%. This was due primarily to high interest income on loans (+26.6% QoQ), which was attributable to portfolio growth in different businesses, including the acquisition of Mibanco, as explained earlier in this report.
�
Interest expenses
�
Interest expenses increased +3.1% QoQ. This was due primarily to an increase in interest on loans (+12% QoQ), and, to a lesser extent, to higher expenses for interest on deposits (+6.9% QoQ). The aforementioned was offset by a decrease of -32.2% QoQ in other interest expenses, which was attributable to lower expenses for derivative yields due to swap contracts assumed in previous quarters that convert fixed rates to variable rates.
�
Higher interest expenses on loans were due to an increase in REPO transactions with BCRP with certificates of deposit and foreign currency. It is important to remember that this type of alternative funding is exempt from the implicit cost of legal reserve requirements, which makes it less costly than traditional funding with time deposits.
�
Although the volume of time deposits- which imply the highest funding cost- fell QoQ, this is not reflected in interest expenses for deposits, which increased QoQ given that in 3Q14, the reduction in time deposits was seen primarily in FC and not in LC (as was explained in the Funding section), and the rates that are paid on FC are lower.
�
In annual terms, BCP’s interest expenses increased 2%. This was due primarily to the inclusion of interest expenses from Mibanco as of 2Q14. It is important to note that if we exclude Mibanco from interest expenses, this line shows a decrease of -8.3% YoY that was attributable to a drop in interest expenses on bonds and subordinated notes, other interest expenses and interest expenses on deposits.
�
| 20 |
|
�
NIM4
�

�
The global NIM registered an increase of +12 bps QoQ, going from 5.90% in 2Q14 to 6.02% in 3Q14. The aforementioned is due to higher growth in net interest income (+5.3% QoQ) than in average interest earning assets (+3.2% QoQ). This, in turn, is a reflection of the excellent performance of the Wholesale Banking portfolio, mainly in LC, where there are higher margins, and more dynamism in Retail Banking in 3Q. The aforementioned also explain the +10 bp increase QoQ in NIM on loans, which rose from 8.91% in 2Q14 to 9.01% at the end of 3Q14.
�
Next, we provide details on the interest margins for each of BCP’s main subsidiaries:
�
| NIM Breakdown | � | 3Q14 | � | |||||||||||||||||||||
| PEN (000) | � | BCP Stand-alone | � | � | Edyficar | � | � | Mibanco | � | � | BCP Bolivia | � | � | Others (1) | � | � | BCP Cons. | � | ||||||
| IEA (Average) | � | � | 92,865,447 | � | � | � | 4,722,314 | � | � | � | 5,673,344 | � | � | � | 4,626,073 | � | � | � | -2,404,683 | � | � | � | 105,482,495 | � |
| % Total IEA BCP Cons | � | � | 88 | % | � | � | 4 | % | � | � | 5 | % | � | � | 4 | % | � | � | -2 | % | � | � | 100 | % |
| � | � | � | � | � | � | � | � | � | � | � | � | � | � | � | � | � | � | � | � | � | � | � | � | � |
| NII for 3Q14 Annualized) | � | � | 4,693,445 | � | � | � | 727,996 | � | � | � | 692,294 | � | � | � | 218,701 | � | � | � | 19,397 | � | � | � | 6,351,833 | � |
| % Total NII BCP Cons | � | � | 74 | % | � | � | 11 | % | � | � | 11 | % | � | � | 3 | % | � | � | 0 | % | � | � | 100 | % |
| � | � | � | � | � | � | � | � | � | � | � | � | � | � | � | � | � | � | � | � | � | � | � | � | � |
| NIM for 3Q14 | � | � | 5.05 | % | � | � | 15.42 | % | � | � | 12.20 | % | � | � | 4.73 | % | � | � | -0.81 | % | � | � | 6.02 | % |
NIM: Annualized Net interest income / Average period end and period beginning interest earning assets.
(1) Others include Financiera Solucion and Eliminations for consolidation.
�
In 3Q14, Edyficar and Mibanco posted the best NIM levels (15.42% and 12.20% at the end of 3Q14 respectively). This was in line with the fact that these businesses offer more profitability; nevertheless, their share of total income and average interest earning asset is lower than BCP stand-alone.
�
4 NIM of loans is calculated as following:
�

�
The share of loans within total earning assets is calculated by dividing the average of the beginning and closing balances of total loans for the reporting period, by the average of the beginning and closing balances of the interest earnings assets for the reporting period.
�
| 21 |
|
�
�
II.4 Past-Due-Loan and Net Provisions on Loan Losses
�
The PDL ratio fell 6 bps and situated at 2.66%, which reflects the on-going deceleration in delinquency and more dynamism in the loan portfolio, primarily in the SME-Pyme segment. In line with the aforementioned, net provisions for loan losses fell -9.9% QoQ due to an improvement in the portfolio’s delinquency level. If we were to exclude Mibanco’s results, net provisions for loan losses would fall -19.8%.
�
| Provision for loan losses | � | Quarter | � | � | % Change | � | ||||||||||||||
| PEN (000) | � | 3Q13 | � | � | 2Q14 | � | � | 3Q14 | � | � | ����QoQ����� | � | � | ������YoY������ | � | |||||
| Provisions | � | � | (347,369 | ) | � | � | (527,198 | ) | � | � | (486,522 | ) | � | � | -7.7 | % | � | � | 40.1 | % |
| Loan loss recoveries | � | � | 33,905 | � | � | � | 46,162 | � | � | � | 53,179 | � | � | � | 15.2 | % | � | � | 56.8 | % |
| Net provisions, for loan losses | � | � | (313,464 | ) | � | � | (481,036 | ) | � | � | (433,343 | ) | � | � | -9.9 | % | � | � | 38.2 | % |
| Annualized net provisions / Total loans | � | � | 2.1 | % | � | � | 2.7 | % | � | � | 2.4 | % | � | � | - | � | � | � | - | � |
| Net Provisions / Net Interest Income | � | � | 26.4 | % | � | � | 31.9 | % | � | � | 27.3 | % | � | � | - | � | � | � | - | � |
| Total loans | � | � | 60,412,012 | � | � | � | 71,396,079 | � | � | � | 73,636,007 | � | � | � | 3.1 | % | � | � | 21.9 | % |
| Reserve for loan losses (RLL) | � | � | 2,208,998 | � | � | � | 3,071,051 | � | � | � | 3,167,014 | � | � | � | 3.1 | % | � | � | 43.4 | % |
| Charge-Off amount * | � | � | 252,600 | � | � | � | 376,712 | � | � | � | 420,715 | � | � | � | 11.7 | % | � | � | 66.6 | % |
| Past due loans (PDL) | � | � | 1,357,950 | � | � | � | 1,938,717 | � | � | � | 1,960,466 | � | � | � | 1.1 | % | � | � | 44.4 | % |
| Non-performing loans (NPLs) | � | � | 1,716,433 | � | � | � | 2,425,341 | � | � | � | 2,467,540 | � | � | � | 1.7 | % | � | � | 43.8 | % |
| PDL ratio at 90 days ** | � | � | 1.52 | % | � | � | 1.67 | % | � | � | 1.70 | % | � | � | � | � | � | � | � | � |
| PDL ratio | � | � | 2.25 | % | � | � | 2.72 | % | � | � | 2.66 | % | � | � | � | � | � | � | � | � |
| NPL ratio | � | � | 2.84 | % | � | � | 3.40 | % | � | � | 3.35 | % | � | � | � | � | � | � | � | � |
| Coverage of PDLs | � | � | 162.7 | % | � | � | 158.4 | % | � | � | 161.5 | % | � | � | � | � | � | � | � | � |
| Coverage of NPLs | � | � | 128.7 | % | � | � | 126.6 | % | � | � | 128.3 | % | � | � | � | � | � | � | � | � |
* BCP without subsidiaries.
** Excluding Mibanco.
�
Provisions
�
Net provisions for loan losses fell -9.9% QoQ to situate at PEN433 million in 3Q14. This was due to an improvement in the delinquency level, which was in line with expectations after the changes implemented, in the SME segment in particular, as well as an improvement in delinquency in the Credit Card and Consumer segments, which were affected by a regulatory change in the calculation of the minimum payment on credit cards as of October 2013. The aforementioned decline was, nevertheless, attenuated by higher net provisions for loan losses at Mibanco in line with the maturity cycle in the past due loan portfolio.
�
Nevertheless, it is important to note that expenses for net provisions for loan losses represent 27.3% of NII, which represents a lower level than that recorded in 2Q14 (31.9%) and is equivalent to 2.4% of total loans, which also falls below 2Q14’s level of 2.7%.
�
The provisions stock increased +3.1% QoQ (vs. 4.3% QoQ in 2Q13) due to a decrease in net provisions for loan losses and the +11.7% QoQ increase in charge-offs. In this context, the coverage ratio for the past due loan portfolio improved QoQ, going from 158.4% in 2Q14 to 161.5% in 3Q14, due to growth in the stock of provisions versus the increase in the past due loan portfolio (+1.1% QoQ). The same relation was evident in the analysis of the coverage ratio for the non-performing loan portfolio, which rose from 126.6% in 2T14 to 128.3% at the end of 3Q14.
�
| 22 |
|
��

�
Portfolio Quality
�
The PDL ratio posted a 6 bps improvement QoQ and was situated at 2.66% in 3Q14. The aforementioned reflects an improvement with regard to the figure observed in 2Q14 and is due to a decrease in the pace of new entries to the past due loan portfolio (+1.1% in 3Q14 vs. +6.4% in 2Q14) while loan growth weighed in at +3.1% QoQ.
�
The PDL ratio at 90 days (without including Mibanco) was 1.70%. This is slightly higher than the figure reported at the end of 2Q14, which was situated at 1.67% primarily because it included the balance of past due loans that are paid in installments (i.e. mortgages, consumer loans) given that in the first 90 days, only past due installments are considered whereas after day 91, the figure includes the balance due.
�
The non-performing loan portfolio (including refinancing loans) grew only +1.7% QoQ (vs. 5.4% in 2Q14). In this context, the NPL ratio fell to 3.02% (vs. 3.05% at the end of 2Q14). It is important to note that BCP’s NPL ratio continues to fall below the average NPL ratio in the Peruvian banking system, which was situated at 3.36% at the end of August 2014 (SBS data).
�
| 23 |
|
�
The figure below shows the evolution of the PDL ratio by banking segment and product:
�
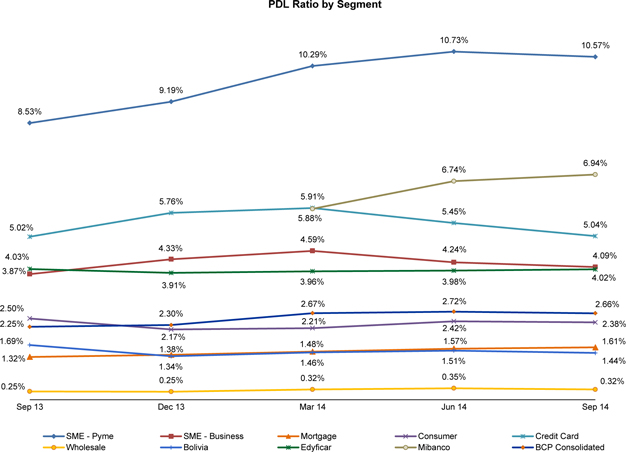
�
An analysis of the evolution of the PDL ratio by banking segment and product indicates that:
�
| i) | The SME-Pyme segment reported an improvement in its PDL ratio, which was situated at 10.73% in 3Q14 compared to 10.57% in 2Q14. This drop was due primarily to: i) deceleration in the growth of the past due loan portfolio following the adjustments that were implemented and ii) growth in this segment’s total loans, which was in line with the end-of-year campaign that began in 3Q14. This expansion contrasted with the situation in previous semesters, when the portfolio contracted. |
�
| ii) | The SME-Business segment’s portfolio once again reported a decline, although slightly lower than that registered last quarter. The PDL ratio fell from 4.24% in June to 4.09% at the end of 3Q14 due to an improvement in portfolio quality that was reflected in a larger QoQ drop in the past due loan portfolio and growth in the segment’s portfolio as expressed in average daily balances (+12.6% QoQ). |
�
| iii) | The Credit Card segment’s PDL ratio at the end of 3Q14 was situated at 5.04%, which reflects a reduction of -41 bps that was attributable to a deceleration in the growth of the past due loan portfolio as well as to the impact of refinancing packages, which were offered to clients beginning in August. Additionally, individual clients have more spending capacity in July (bonus and CTS surplus), which some chose to use to reduce their debt, particularly in cases of past due obligations. |
�
| iv) | The PDL ratio in the Consumer segment also improved, going from 2.42% to 2.38% due to the aforementioned campaigns for refinancing and debt reduction. |
�
| v) | The mortgage loan portfolio posted a slight increase in its PDL ratio, which was situated at 1.61% in 3Q14 in comparison to 1.57% in 2Q14, which was in line with maturities (2 to 3 years) in Mivivienda loans. |
�
| 24 |
|
�
| vi) | Wholesale Banking’s PDL ratio fell +4bps after some isolated cases that entered the past due loan portfolio last quarter were regularized. |
�
| vii) | Mibanco’s portfolio shows, in line with expectations, an increase in its PDL ratio, which was situated at 6.94% at the end of 3Q14. In this business segment, the effect of growth in the past due loan portfolio on the PDL ratio is accentuated due to the slight drop in total loans, which was due primarily to efforts to reorganize this portfolio. |
�
| viii) | Finally, Edyficar (without including Mibanco) posted a PDL ratio of 4.07% at the end of 3Q14, which topped the 3.98% registered in 2Q14. This ratio is still below the historical levels recorded for this business (approximately 4.1% on average), which is in line with the excellent performance of the business model, whose risk-adjusted profitability continues to be very satisfactory. It is important to remember that the ratio has remained stable YoY, going from 4.03% in September 2013 to 4.07% in September 2014. |
�
II.5 Non-financial income
�
Non-financial income reported an increase of +7.2% QoQ due to higher gains on sales of securities (152.2% QoQ) and gains on foreign exchange transactions (+14.7% QoQ). The YoY analysis indicates that non-financial income increased 16.5% YoY, mainly due to the acquisition of Mibanco.
�
| Non financial income | � | Quarter | � | � | % Change | � | � | Year to date | � | � | % Change | � | ||||||||||||||||||||
| PEN (000) | � | 3Q13 | � | � | 2Q14 | � | � | 3Q14 | � | � | QoQ | � | � | YoY | � | � | Sep 13 | � | � | Sep 14 | � | � | Sep 14 / Sep 13 | � | ||||||||
| Fee income, net | � | � | 454,557 | � | � | � | 478,007 | � | � | � | 484,541 | � | � | � | 1.4 | % | � | � | 6.6 | % | � | � | 1,289,802 | � | � | � | 1,434,534 | � | � | � | 11.2 | % |
| Gain on foreign exchange transactions, net | � | � | 132,653 | � | � | � | 136,567 | � | � | � | 156,641 | � | � | � | 14.7 | % | � | � | 18.1 | % | � | � | 394,960 | � | � | � | 419,175 | � | � | � | 6.1 | % |
| Gain on sales of securities, net | � | � | (2,209 | ) | � | � | 13,897 | � | � | � | 35,055 | � | � | � | 152.2 | % | � | � | 1686.9 | % | � | � | (75,200 | ) | � | � | 51,125 | � | � | � | 168.0 | % |
| Other income | � | � | 6,129 | � | � | � | 13,860 | � | � | � | 12,581 | � | � | � | -9.2 | % | � | � | 105.3 | % | � | � | 47,613 | � | � | � | 37,223 | � | � | � | -21.8 | % |
| Total non financial income | � | � | 591,130 | � | � | � | 642,331 | � | � | � | 688,818 | � | � | � | 7.2 | % | � | � | 16.5 | % | � | � | 1,657,175 | � | � | � | 1,942,057 | � | � | � | 17.2 | % |
�
Fee income, which is core income for the business, registered slight growth of +1.4%. This was attributable to an increase in the Miscellaneous Accounts’ line (+4.9% QoQ), which was due to higher transactions volumes and more accounts in the Retail Banking business (savings and debit cards) as well as more collections and payments (+3.4% QoQ). The aforementioned was attenuated by lower commissions for banking services for commercial loans (-24.9% QoQ). In the YoY analysis, fee income increased +6.6% YoY, which was due primarily to the acquisition of Mibanco.
�
The net gain on foreign exchange transactions registered significant growth this quarter due to more activity, which was attributable, in large part, to the volatility generated by the exchange rate. In the YoY analysis, this item increased +18.1%, which was also attributable to more volatility in 3Q14 with regard to the same period last year as well as to the inclusion of gains from Mibanco.
�
The net gain on sales of securities increased 152.2%, primarily due to more gains on the sale of sovereign bonds and covered bonds. The YoY analysis reveals a significant increase. This was due primarily to the aforementioned bond sales, and was accentuated by the fact that in 3Q13, a loss was reported on BCP’s sovereign bond position (Peru, Colombia y Brasil).
�
| 25 |
|
�
The following table provides details on the main items of non-financial income: commissions for banking services:
�
| Fee Income | � | Quarter | � | � | % Change | � | ||||||||||||||
| PEN (000) | � | 3Q13 | � | � | 2Q14 | � | � | 3Q14 | � | � | QoQ | � | � | YoY | � | |||||
| Miscellaneous Accounts (1) | � | � | 131,561 | � | � | � | 134,690 | � | � | � | 141,313 | � | � | � | 4.9 | % | � | � | 7.4 | % |
| Off-balance sheet | � | � | 31,330 | � | � | � | 32,737 | � | � | � | 35,433 | � | � | � | 8.2 | % | � | � | 13.1 | % |
| Payments and Collections | � | � | 69,105 | � | � | � | 75,718 | � | � | � | 78,315 | � | � | � | 3.4 | % | � | � | 13.3 | % |
| Drafts and Transfers | � | � | 25,925 | � | � | � | 26,806 | � | � | � | 28,573 | � | � | � | 6.6 | % | � | � | 10.2 | % |
| Credit Cards | � | � | 67,610 | � | � | � | 63,168 | � | � | � | 62,917 | � | � | � | -0.4 | % | � | � | -6.9 | % |
| Others fees | � | � | 129,026 | � | � | � | 144,889 | � | � | � | 137,989 | � | � | � | -4.8 | % | � | � | 6.9 | % |
| Personal loans (2) | � | � | 18,412 | � | � | � | 18,802 | � | � | � | 17,576 | � | � | � | -6.5 | % | � | � | -4.5 | % |
| SME loans (2) | � | � | 17,721 | � | � | � | 18,108 | � | � | � | 17,638 | � | � | � | -2.6 | % | � | � | -0.5 | % |
| Insurance (2) | � | � | 12,808 | � | � | � | 15,299 | � | � | � | 15,841 | � | � | � | 3.5 | % | � | � | 23.7 | % |
| Mortgage loans (2) | � | � | 11,085 | � | � | � | 10,325 | � | � | � | 9,383 | � | � | � | -9.1 | % | � | � | -15.4 | % |
| Commercial loans (3) | � | � | 11,869 | � | � | � | 13,610 | � | � | � | 10,223 | � | � | � | -24.9 | % | � | � | -13.9 | % |
| Foreign trade (3) | � | � | 12,671 | � | � | � | 9,612 | � | � | � | 10,032 | � | � | � | 4.4 | % | � | � | -20.8 | % |
| Credicorp Capital | � | � | 15,402 | � | � | � | 19,946 | � | � | � | 19,583 | � | � | � | -1.8 | % | � | � | 27.1 | % |
| Others (4) | � | � | 29,059 | � | � | � | 39,187 | � | � | � | 37,259 | � | � | � | -4.9 | % | � | � | 28.2 | % |
| Total fee income | � | � | 454,557 | � | � | � | 478,007 | � | � | � | 484,541 | � | � | � | 1.4 | % | � | � | 6.6 | % |
�(1) Saving accounts, current accounts and debit card.
(2) Mainly Retail fees.
(3) Mainly Wholesale fees.
(4) Includes fees from BCP Bolivia, Edyficar, network usage and other services to third parties, among others.
Source: BCP
�
Distribution channels
�
BCP Consolidated’s points of contact totaled 11,242 at the end of 3Q14; it is important to note that this includes points of contact at Edyficar, Mibanco and BCP Bolivia.
�
BCP posted a total of 7,663 points of contact at the end of 3Q14, which represented a reduction of -4.1% QoQ. This drop in distribution channels was due to a decline in Agentes BCP (-6.0% QoQ) and ATMs (-0.1% QoQ). The main reduction is evident in Agentes BCP and is associated with an on-going evaluation to remove points of contact that do not meet guidelines for efficiency and profitability. Nevertheless, thus far this year the number of Agentes BCP that we have in the provinces has remained stable (48%), which is in line with our strategy to increase banking penetration.
�
Edyficar increased its number of branches, going from 199 in 2Q 14 to 203 in 3Q14. This coincides with growth in its market share with regard to the previous quarter (+9.2% 3Q14 vs 8.9% 2Q14) and is aligned with its strategy for financial inclusion. Mibanco’s points of contact have fallen at the branch level (-0.9% QoQ) and with regard to ATMs (-1.1% QoQ). Nevertheless, the decline in the latter was offset by growth in Agentes Mibanco (+15.6% QoQ).
�
BCP Bolivia posted a slight increase in its points of contact of +0.3% QoQ, primarily due to growth in ATMs (+0.4% QoQ).
�
The YoY analysis of BCP indicates that ATMs increased +6.5% YoY while offices grew +8.5 YoY. Edyficar registered growth of +9.1% YoY and BCP Bolivia posted slight expansion of +3.6% YoY. These increases are in line with our strategy to increase banking penetration and with our expansion plans at the national level.
�
| 26 |
|
�
| � | � | Balance as of | � | � | Change % | � | ||||||||||||||
| � | � | 3Q13 | � | � | 2Q14 | � | � | 3Q14 | � | � | QoQ | � | � | YoY | � | |||||
| Branches | � | � | 387 | � | � | � | 420 | � | � | � | 420 | � | � | � | 0.0 | % | � | � | 8.5 | % |
| ATMs | � | � | 2039 | � | � | � | 2175 | � | � | � | 2,172 | � | � | � | -0.1 | % | � | � | 6.5 | % |
| Agentes BCP | � | � | 5385 | � | � | � | 5394 | � | � | � | 5,071 | � | � | � | -6.0 | % | � | � | -5.8 | % |
| Total BCP's Network | � | � | 7,811 | � | � | � | 7,989 | � | � | � | 7,663 | � | � | � | -4.1 | % | � | � | -1.9 | % |
| Total Edyficar's Network (1) | � | � | 186 | � | � | � | 199 | � | � | � | 203 | � | � | � | 2.0 | % | � | � | 9.1 | % |
| Branches | � | � | - | � | � | � | 116 | � | � | � | 115 | � | � | � | -0.9 | % | � | � | - | � |
| ATMs | � | � | - | � | � | � | 87 | � | � | � | 86 | � | � | � | -1.1 | % | � | � | - | � |
| Agentes Mibanco | � | � | - | � | � | � | 2450 | � | � | � | 2,833 | � | � | � | 15.6 | % | � | � | - | � |
| Total Mibanco's Network | � | � | - | � | � | � | 2,653 | � | � | � | 3,034 | � | � | � | 14.4 | % | � | � | - | � |
| Total Peru's Network | � | � | 7,997 | � | � | � | 10,841 | � | � | � | 10,900 | � | � | � | 0.5 | % | � | � | - | � |
| Branches | � | � | 46 | � | � | � | 46 | � | � | � | 46 | � | � | � | 0.0 | % | � | � | 0.0 | % |
| ATMs | � | � | 243 | � | � | � | 245 | � | � | � | 246 | � | � | � | 0.4 | % | � | � | 1.2 | % |
| Agentes BCP Bolivia | � | � | 41 | � | � | � | 50 | � | � | � | 50 | � | � | � | 0.0 | % | � | � | 22.0 | % |
| Total Bolivia's Network | � | � | 330 | � | � | � | 341 | � | � | � | 342 | � | � | � | 0.3 | % | � | � | 3.6 | % |
| Total BCP Consolidated's Network | � | � | 8,327 | � | � | � | 11,182 | � | � | � | 11,242 | � | � | � | 0.5 | % | � | � | 35.0 | % |
(1) Edyficar only have branches.
Source: BCP
�
Transactions by channels
�
| � | � | Monthly average in each quarter | � | � | % Change | � | ||||||||||||||||||||||||||
| N� of Transactions per channel | � | 3Q13 | � | � | % | � | � | 2Q14 | � | � | % | � | � | 3Q14 | � | � | % | � | � | QoQ | � | � | YoY | � | ||||||||
| Teller | � | � | 10,075,605 | � | � | � | 11.2 | % | � | � | 9,278,615 | � | � | � | 11.2 | % | � | � | 9,557,126 | � | � | � | 11.0 | % | � | � | 3.0 | % | � | � | -5.1 | % |
| ATMs | � | � | 14,931,056 | � | � | � | 18.7 | % | � | � | 15,437,837 | � | � | � | 18.7 | % | � | � | 16,774,054 | � | � | � | 19.3 | % | � | � | 8.7 | % | � | � | 12.3 | % |
| Balance Inquiries | � | � | 5,474,766 | � | � | � | 4.7 | % | � | � | 3,877,297 | � | � | � | 4.7 | % | � | � | 3,477,692 | � | � | � | 4.0 | % | � | � | -10.3 | % | � | � | -36.5 | % |
| Telephone Banking | � | � | 2,749,498 | � | � | � | 1.6 | % | � | � | 1,335,568 | � | � | � | 1.6 | % | � | � | 1,282,950 | � | � | � | 1.5 | % | � | � | -3.9 | % | � | � | -53.3 | % |
| Internet Banking Via BCP | � | � | 18,991,719 | � | � | � | 22.5 | % | � | � | 18,576,046 | � | � | � | 22.5 | % | � | � | 19,869,512 | � | � | � | 22.8 | % | � | � | 7.0 | % | � | � | 4.6 | % |
| Agente BCP | � | � | 14,876,251 | � | � | � | 18.3 | % | � | � | 15,096,261 | � | � | � | 18.3 | % | � | � | 15,584,243 | � | � | � | 17.9 | % | � | � | 3.2 | % | � | � | 4.8 | % |
| Telecr�dito | � | � | 7,330,772 | � | � | � | 9.1 | % | � | � | 7,505,336 | � | � | � | 9.1 | % | � | � | 7,978,804 | � | � | � | 9.2 | % | � | � | 6.3 | % | � | � | 8.8 | % |
| Mobile banking | � | � | 1,495,892 | � | � | � | 3.4 | % | � | � | 2,832,566 | � | � | � | 3.4 | % | � | � | 3,544,108 | � | � | � | 4.1 | % | � | � | 25.1 | % | � | � | 136.9 | % |
| Direct Debit | � | � | 713,759 | � | � | � | 0.9 | % | � | � | 770,361 | � | � | � | 0.9 | % | � | � | 765,978 | � | � | � | 0.9 | % | � | � | -0.6 | % | � | � | 7.3 | % |
| Points of Sale P.O.S. | � | � | 7,588,016 | � | � | � | 9.2 | % | � | � | 7,634,793 | � | � | � | 9.2 | % | � | � | 8,004,773 | � | � | � | 9.2 | % | � | � | 4.8 | % | � | � | 5.5 | % |
| Other ATMs network | � | � | 317,179 | � | � | � | 0.3 | % | � | � | 238,506 | � | � | � | 0.3 | % | � | � | 246,830 | � | � | � | 0.3 | % | � | � | 3.5 | % | � | � | -22.2 | % |
| Total transactions | � | � | 84,544,513 | � | � | � | 100.0 | % | � | � | 81,133,538 | � | � | � | 100.0 | % | � | � | 87,086,072 | � | � | � | 100.0 | % | � | � | 5.5 | % | � | � | 3.0 | % |
Source: BCP
�
The monthly average of transactions increased +5.5% QoQ, which reflects the QoQ increase in transactions registered through cost-efficient channels such as: ATMs (+8.7% QoQ), Internet Banking (+7.0% QoQ), which increased its transactions due to an upgrade of ViaBCP’s web page, and Mobile Banking (+25.1% QoQ), which continued to increase its share of transactions given that the market has been highly receptive to the mobile applications offered. Additionally, growth is evident in transactions at Agentes BCP (+3.2% QoQ) despite the QoQ decline in points of contact in this channel.
�
In the YoY analysis, the monthly average of transactions increased 3.0% YoY, which was due primarily to the increase in transactions volumes registered in: Mobile Banking (+136.9% YoY), ATMs (12.3% YoY), Internet Banking (4.6%) and Agente BCP (4.8%) while transactions at Balance Consultation Modules (-36.5% YoY), Telephone Banking (-53.3% YoY) and Tellers (-5.1% YoY), which reflect the bank’s efforts to migrate to more cost-efficient channels.
�
II.6 Operating Expenses and Efficiency
�
At the end of 3Q14, operating expenses fell -1.3% QoQ, mainly due to lower expenses at almost all subsidiaries. This, accompanied by an increase in earnings, led to an improvement in the efficiency ratio, which was situated at 44.9% versus 48.5% in 2Q14.
�
| 27 |
|
�
| Operating expenses | � | Quarter | � | � | % Change | � | � | Year to date | � | � | % Change | � | ||||||||||||||||||||
| PEN (000) | � | 3Q13 | � | � | 2Q14 | � | � | 3Q14 | � | � | QoQ | � | � | YoY | � | � | Sep 13 | � | � | Sep 14 | � | � | Sep 14 / Sep 13 | � | ||||||||
| Salaries and employees benefits | � | � | 417,818 | � | � | � | 560,131 | � | � | � | 532,961 | � | � | � | -4.9 | % | � | � | 27.6 | % | � | � | 1,271,149 | � | � | � | 1,565,616 | � | � | � | 23.2 | % |
| Administrative, general and tax expenses | � | � | 331,203 | � | � | � | 387,550 | � | � | � | 386,242 | � | � | � | -0.3 | % | � | � | 16.6 | % | � | � | 949,769 | � | � | � | 1,072,070 | � | � | � | 12.9 | % |
| Depreciation and amortizacion | � | � | 69,910 | � | � | � | 81,439 | � | � | � | 82,570 | � | � | � | 1.4 | % | � | � | 18.1 | % | � | � | 197,910 | � | � | � | 236,945 | � | � | � | 19.7 | % |
| Other expenses | � | � | 28,679 | � | � | � | 33,579 | � | � | � | 47,402 | � | � | � | 41.2 | % | � | � | 65.3 | % | � | � | 122,215 | � | � | � | 106,507 | � | � | � | -12.9 | % |
| Total operating expenses | � | � | 847,610 | � | � | � | 1,062,699 | � | � | � | 1,049,175 | � | � | � | -1.3 | % | � | � | 23.8 | % | � | � | 2,541,043 | � | � | � | 2,981,138 | � | � | � | 17.3 | % |
| Efficiency ratio | � | � | 46.1 | % | � | � | 48.5 | % | � | � | 44.9 | % | � | � | � | � | � | � | � | � | � | � | 48.0 | % | � | � | 46.1 | % | � | � | � | � |
�
This improvement in the efficiency ratio was due primarily to lower expenses for employee salaries and benefits (-4.9% QoQ), which was in line with reductions in the organization’s organic structure and a decrease in provisions for vacation time in 3Q14.
�
A reduction was evident (-0.3% QoQ) in administrative and general expenses, which is in line with the efforts made throughout the year in the efficiency project. The following table provides details on these expenses:
�
| Administrative and General Expenses | � | Quarter | � | � | Change % | � | ||||||||||||||||||||||||||
| PEN (000) | � | 3Q13 | � | � | % | � | � | 2Q14 | � | � | % | � | � | 3Q14 | � | � | % | � | � | QoQ | � | � | YoY | � | ||||||||
| Marketing | � | � | 40,882 | � | � | � | 12.3 | % | � | � | 46,439 | � | � | � | 13.1 | % | � | � | 43,284 | � | � | � | 11.2 | % | � | � | -6.8 | % | � | � | -5.5 | % |
| Systems | � | � | 30,898 | � | � | � | 9.3 | % | � | � | 31,642 | � | � | � | 8.9 | % | � | � | 30,879 | � | � | � | 8.0 | % | � | � | -2.4 | % | � | � | 0.1 | % |
| Sustems Outsourcing | � | � | 28,061 | � | � | � | 8.5 | % | � | � | 30,524 | � | � | � | 8.6 | % | � | � | 33,399 | � | � | � | 8.6 | % | � | � | 9.4 | % | � | � | -16.0 | % |
| Transport | � | � | 26,140 | � | � | � | 7.9 | % | � | � | 22,548 | � | � | � | 6.4 | % | � | � | 22,356 | � | � | � | 5.8 | % | � | � | -0.9 | % | � | � | 16.9 | % |
| Maintenance | � | � | 11,815 | � | � | � | 3.6 | % | � | � | 10,585 | � | � | � | 3.0 | % | � | � | 14,010 | � | � | � | 3.6 | % | � | � | 32.4 | % | � | � | -15.7 | % |
| Communications | � | � | 16,073 | � | � | � | 4.9 | % | � | � | 19,282 | � | � | � | 5.4 | % | � | � | 20,360 | � | � | � | 5.3 | % | � | � | 5.6 | % | � | � | -21.1 | % |
| Consulting | � | � | 17,725 | � | � | � | 5.4 | % | � | � | 17,173 | � | � | � | 4.8 | % | � | � | 14,612 | � | � | � | 3.8 | % | � | � | -14.9 | % | � | � | 21.3 | % |
| Others | � | � | 96,100 | � | � | � | 29.0 | % | � | � | 104,121 | � | � | � | 29.3 | % | � | � | 102,977 | � | � | � | 26.7 | % | � | � | -1.1 | % | � | � | -6.7 | % |
| Taxes and contributions | � | � | 92,439 | � | � | � | 27.9 | % | � | � | 174,093 | � | � | � | 9.9 | % | � | � | 170,893 | � | � | � | 44.2 | % | � | � | -1.8 | % | � | � | -45.9 | % |
| Other subsidiaries and eliminations, net | � | � | 28,931 | � | � | � | 8.7 | % | � | � | 68,856 | � | � | � | 10.5 | % | � | � | 66,528 | � | � | � | 17.2 | % | � | � | -3.4 | % | � | � | -56.5 | % |
| Total Administrative and General Expenses | � | � | 331,203 | � | � | � | 100.0 | % | � | � | 387,550 | � | � | � | 100.0 | % | � | � | 386,242 | � | � | � | 100.0 | % | � | � | -0.3 | % | � | � | -14.2 | % |
Source: BCP
�
The decrease in administrative and general expenses was particularly evident in the following:
�
| i) | Marketing (-6.8% QoQ), this decrease was due better resource management. It is also important to note that in 2Q14, expenses were higher due to the process to launch BCP’s new brand and advertising for the bank’s 125th anniversary. |
�
| ii) | Consultants (-14.9% QoQ), due primarily to lower expenses for different projects (Efficiency project, Brand valuation project, Somos BCP project, among others) that the bank is currently developing. Last quarter, there was a considerable increase in this item due to the bank’s efforts to continuously improve operating efficiency. |
�
| iii) | Other minor expenses (-1.1% QoQ), which was due primarily to a decrease in commissions paid to third parties and lower commissions for Agentes BCP. |
�
These decreases helped offset an increase in the following expenses:
�
| iv) | Maintenance (32.4% QoQ), this increase was generated by higher maintenance costs for buildings, agencies and office equipment. |
�
| v) | Systems outsourcing (9.4% QoQ), which was due primarily to more support and supply efforts for ATMs and to maintain servers. |
�
Finally, Other Expenses, which are not included in efficiency ratio calculations, reported a variation of +41.2% QoQ. This change was due primarily to provisions that were set aside for eventualities involving expenses incurred for collections in Retail Banking and fraud at ATM machines.
�
| 28 |
|
�
II.7 Regulatory Capital –BCP Stand-alone based on Peru GAAP
�
At the end of 3Q14 regulatory capital increased +9.2% QoQ, which tops the growth of +7.6% QoQ in risk-weighted assets. This was primarily due to a Capitalization Agreement for PEN 1,000 million. The aforementioned led to an increase in the BIS ratio, which rose from 14.58% in 2Q14 to 14.78% in 3Q14. It is important to note the Tier 1 and Tier 1 Common Equity ratios were situated at 10.19% and 7.20% respectively.
�
| Regulatory Capital and Capital Adequacy Ratios | � | Balance as of | � | � | % Change | � | ||||||||||||||
| PEN (000) | � | 3Q13 | � | � | 2Q14 | � | � | 3Q14 | � | � | 3Q14 / 2Q14 | � | � | 3Q14 / 3Q13 | � | |||||
| Capital Stock | � | � | 3,752,617 | � | � | � | 4,722,752 | � | � | � | 4,722,752 | � | � | � | 0.0 | % | � | � | 25.9 | % |
| Legal and Other capital reserves | � | � | 2,422,230 | � | � | � | 2,761,777 | � | � | � | 2,761,777 | � | � | � | 0.0 | % | � | � | 14.0 | % |
| Accumulated earnings with capitalization agreement | � | � | - | � | � | � | - | � | � | � | 1,000,000 | � | � | � | - | � | � | � | - | � |
| Loan loss reserves (1) | � | � | 799,689 | � | � | � | 907,049 | � | � | � | 969,036 | � | � | � | 6.8 | % | � | � | 21.2 | % |
| Perpetual subordinated debt | � | � | 695,500 | � | � | � | 699,000 | � | � | � | 722,500 | � | � | � | 3.4 | % | � | � | 3.9 | % |
| Subordinated Debt | � | � | 3,404,382 | � | � | � | 3,914,557 | � | � | � | 4,029,410 | � | � | � | 2.9 | % | � | � | 18.4 | % |
| Unrealized profit (loss) | � | � | - | � | � | � | - | � | � | � | - | � | � | � | - | � | � | � | - | � |
| Investment in subsidiaries and others, net of unrealized profit and net income | � | � | (738,879 | ) | � | � | (1,410,894 | ) | � | � | (1,559,612 | ) | � | � | 10.5 | % | � | � | 111.1 | % |
| Investment in subsidiaries and others | � | � | 1,386,551 | � | � | � | 1,994,593 | � | � | � | 2,211,726 | � | � | � | 10.9 | % | � | � | 59.5 | % |
| Unrealized profit and net income in subsidiaries | � | � | 647,672 | � | � | � | 583,699 | � | � | � | 652,114 | � | � | � | 11.7 | % | � | � | 0.7 | % |
| Goodwill | � | � | (122,083 | ) | � | � | (122,083 | ) | � | � | (122,083 | ) | � | � | 0.0 | % | � | � | 0.0 | % |
| Total Regulatory Capital | � | � | 10,213,456 | � | � | � | 11,472,158 | � | � | � | 12,523,781 | � | � | � | 9.2 | % | � | � | 22.6 | % |
| � | � | � | � | � | � | � | � | � | � | � | � | � | � | � | � | � | � | � | � | � |
| Tier 1 (2) | � | � | 6,702,660 | � | � | � | 7,647,849 | � | � | � | 8,631,197 | � | � | � | 12.9 | % | � | � | 28.8 | % |
| Tier 2 (3)��+ Tier 3 (4) | � | � | 3,510,796 | � | � | � | 3,824,310 | � | � | � | 3,892,584 | � | � | � | 1.8 | % | � | � | 10.9 | % |
| � | � | � | � | � | � | � | � | � | � | � | � | � | � | � | � | � | � | � | � | � |
| Total risk-weighted assets | � | � | 72,317,018 | � | � | � | 78,708,390 | � | � | � | 84,717,945 | � | � | � | 7.6 | % | � | � | 17.1 | % |
| Market risk-weighted assets (5) | � | � | 3,790,142 | � | � | � | 928,060 | � | � | � | 1,270,266 | � | � | � | 36.9 | % | � | � | -66.5 | % |
| Credit risk-weighted assets | � | � | 63,836,444 | � | � | � | 72,563,938 | � | � | � | 77,522,908 | � | � | � | 6.8 | % | � | � | 21.4 | % |
| Operational risk-weighted assets | � | � | 4,690,432 | � | � | � | 5,216,391 | � | � | � | 5,924,771 | � | � | � | 13.6 | % | � | � | 26.3 | % |
| � | � | � | � | � | � | � | � | � | � | � | � | � | � | � | � | � | � | � | � | � |
| Market risk capital requirement��(5) | � | � | 371,434 | � | � | � | 92,806 | � | � | � | 127,027 | � | � | � | 36.9 | % | � | � | -65.8 | % |
| Credit risk capital requirement | � | � | 6,255,971 | � | � | � | 7,256,394 | � | � | � | 7,752,291 | � | � | � | 6.8 | % | � | � | 23.9 | % |
| Operational risk capital requirement | � | � | 459,662 | � | � | � | 521,639 | � | � | � | 592,477 | � | � | � | 13.6 | % | � | � | 28.9 | % |
| Additional capital requierments | � | � | 1,259,069 | � | � | � | 1,309,628 | � | � | � | 1,732,554 | � | � | � | 32.3 | % | � | � | 37.6 | % |
| � | � | � | � | � | � | � | � | � | � | � | � | � | � | � | � | � | � | � | � | � |
| Capital ratios | � | � | � | � | � | � | � | � | � | � | � | � | � | � | � | � | � | � | � | � |
| Tier 1 ratio (6) | � | � | 9.27 | % | � | � | 9.72 | % | � | � | 10.19 | % | � | � | � | � | � | � | � | � |
| Common Equity Tier 1 ratio (7) | � | � | 7.26 | % | � | � | 7.18 | % | � | � | 7.20 | % | � | � | � | � | � | � | � | � |
| BIS ratio (8) | � | � | 14.12 | % | � | � | 14.58 | % | � | � | 14.78 | % | � | � | � | � | � | � | � | � |
| Risk-weighted assets / Regulatory Capital (9) | � | � | 7.08 | � | � | � | 6.86 | � | � | � | 6.76 | � | � | � | � | � | � | � | � | � |
(1) Up to 1.25% of total risk-weighted assets.
(2) Tier 1 = Capital + Legal and other capital reserves + Accumulated earnings with capitalization agreement + Unrealized profit and net income in subsidiaries - Goodwill - (0.5 x Investment in subsidiaries) + Perpetual subordinated debt (maximum amount that can be included is 17.65% of Capital + Reserves + Accumulated earnings with capitalization agreement + Unrealized profit and net income in subsidiaries - Goodwill).
(3) Tier 2 = Subordinated debt + Loan loss reserves - (0.5 x Investment in subsidiaries).
(4) Tier 3 = Subordinated debt covering market risk only. Tier 3 exists since 1Q10.
(5) It includes capital requirement to cover price and rate risk.
(6) Tier 1 / Risk-weighted assets.
(7) Common Equity Tier I = Capital + Reserves – 100% of applicable deductions (investment in subsidiaries, goodwill, intangibles and deferred tax assets that rely on future profitability) + retained earnings + unrealized gains.
(8) Regulatory Capital / Risk-weighted assets (legal minimum = 10% since July 2011).
(9) Since July 2012, Risk-weighted assets = Credit risk-weighted assets * 1.00 + Capital requirement to cover market risk * 10 + Capital requirement to cover operational risk * 10 * 0.8 (since July 2013).
�
At the end of 3Q14, the BIS capital adequacy ratio (for BCP stand-alone based on Peru GAAP) was situated at 14.78%, which was +20 bps higher than the figure reported at the end of 2Q14 (14.58%). This was due primarily to higher growth in regulatory capital (+9.2% QoQ) in comparison to the evolution of risk-weighted assets (APPR, +7.6% QoQ).
�
The increase in regulatory capital is attributable to the capitalization agreement for PEN 1,000 million, which was approved by the board at its meeting in September 2014. Risk-weighted assets increased +7.6% QoQ, which was due primarily to growth in assets weighted for credit risk (+6.8% QoQ). This expansion was in line with an increase in assets, which was in turn mainly attributable to more investment and expansion in BCP stand-alone’s loans (+12.0% QoQ and 2.9% QoQ respectively, measured in accounting balances and based on Peru GAAP).
�
| 29 |
|
�
The TIER 1 ratio increased, going from 9.72% in 2Q14 to 10.19% in 3Q14 due to the evolution of TIER 1 in comparison to RWAs. The Common Equity Tier 1 ratio, which is considered a more rigorous measurement of capitalization levels, reported a slight improvement QoQ and situated at 7.18% versus 7.20% in 3Q14 given that the QoQ variation in Common Equity Tier 1 was very similar to that posted by RWAs.
�
Finally, BCP holds investments for approximately PEN 692 that can be liquidated to strengthen regulatory capital.
�
| 30 |
|
�
III. Banco de Cr�dito de Bolivia
�
| Banco de Cr�dito de Bolivia | � | � | � | � | Quarter | � | � | � | � | � | % Change | � | � | Year to date | � | � | % Change | � | ||||||||||||||
| PEN million | � | 3Q13 | � | � | 2Q14 | � | � | 3Q14 | � | � | QoQ | � | � | YoY | � | � | Sep 13 | � | � | Sep 14 | � | � | Sep 14 / Sep 13 | � | ||||||||
| Net interest income | � | � | 48.4 | � | � | � | 52.6 | � | � | � | 54.7 | � | � | � | 3.9 | % | � | � | 12.9 | % | � | � | 132.8 | � | � | � | 158.0 | � | � | � | 19.0 | % |
| Net provisions for loan losses | � | � | -12.0 | � | � | � | -5.4 | � | � | � | -4.6 | � | � | � | -14.3 | % | � | � | -61.6 | % | � | � | -20.0 | � | � | � | -13.2 | � | � | � | -34.2 | % |
| Non financial income | � | � | 24.1 | � | � | � | 26.8 | � | � | � | 24.1 | � | � | � | -10.2 | % | � | � | 0.2 | % | � | � | 68.2 | � | � | � | 74.4 | � | � | � | 9.0 | % |
| Operating expenses | � | � | -44.2 | � | � | � | -47.4 | � | � | � | -48.8 | � | � | � | 3.0 | % | � | � | 10.4 | % | � | � | -128.5 | � | � | � | -142.5 | � | � | � | 10.9 | % |
| Operating Income | � | � | 16.2 | � | � | � | 26.6 | � | � | � | 25.3 | � | � | � | -5.0 | % | � | � | 55.9 | % | � | � | 52.5 | � | � | � | 76.7 | � | � | � | 46.1 | % |
| Translation result | � | � | 0.0 | � | � | � | 0.0 | � | � | � | -0.3 | � | � | � | - | � | � | � | - | � | � | � | -1.7 | � | � | � | -0.2 | � | � | � | -88.9 | % |
| Income tax | � | � | -5.0 | � | � | � | -7.2 | � | � | � | -7.2 | � | � | � | 0.1 | % | � | � | 43.0 | % | � | � | -15.9 | � | � | � | -23.4 | � | � | � | 46.9 | % |
| Net Income | � | � | 11.2 | � | � | � | 19.5 | � | � | � | 17.8 | � | � | � | -8.4 | % | � | � | 58.9 | % | � | � | 34.9 | � | � | � | 53.1 | � | � | � | 52.4 | % |
| Total loans | � | � | 2,822.6 | � | � | � | 3,151.5 | � | � | � | 3,339.8 | � | � | � | 6.0 | % | � | � | 18.3 | % | � | � | � | � | � | � | � | � | � | � | � | � |
| Past due loans | � | � | 47.3 | � | � | � | 47.4 | � | � | � | 48.2 | � | � | � | 1.5 | % | � | � | 1.8 | % | � | � | � | � | � | � | � | � | � | � | � | � |
| Provisiones netas | � | � | -99.0 | � | � | � | -115.1 | � | � | � | -120.8 | � | � | � | 4.9 | % | � | � | 22.0 | % | � | � | � | � | � | � | � | � | � | � | � | � |
| Total investments | � | � | 939.6 | � | � | � | 898.6 | � | � | � | 829.0 | � | � | � | -7.7 | % | � | � | -11.8 | % | � | � | � | � | � | � | � | � | � | � | � | � |
| Total activos | � | � | 4,385.3 | � | � | � | 4,736.3 | � | � | � | 5,034.6 | � | � | � | 6.3 | % | � | � | 14.8 | % | � | � | � | � | � | � | � | � | � | � | � | � |
| Total deposits | � | � | 3,873.8 | � | � | � | 4,135.7 | � | � | � | 4,369.0 | � | � | � | 5.6 | % | � | � | 12.8 | % | � | � | � | � | � | � | � | � | � | � | � | � |
| Net shareholders' equity | � | � | 400.6 | � | � | � | 427.6 | � | � | � | 459.1 | � | � | � | 7.4 | % | � | � | 14.6 | % | � | � | � | � | � | � | � | � | � | � | � | � |
| PDL ratio | � | � | 1.69 | % | � | � | 1.51 | % | � | � | 1.45 | % | � | � | � | � | � | � | � | � | � | � | � | � | � | � | � | � | � | � | � | � |
| Coverage of PDLs | � | � | 224.6 | % | � | � | 255.8 | % | � | � | 262.2 | % | � | � | � | � | � | � | � | � | � | � | � | � | � | � | � | � | � | � | � | � |
| ROAE* | � | � | 12.4 | % | � | � | 18.6 | % | � | � | 16.1 | % | � | � | � | � | � | � | � | � | � | � | � | � | � | � | � | � | � | � | � | � |
| Branches | � | � | 46 | � | � | � | 46 | � | � | � | 46 | � | � | � | � | � | � | � | � | � | � | � | � | � | � | � | � | � | � | � | � | � |
| Agentes | � | � | 41 | � | � | � | 50 | � | � | � | 50 | � | � | � | � | � | � | � | � | � | � | � | � | � | � | � | � | � | � | � | � | � |
| ATMs | � | � | 243 | � | � | � | 245 | � | � | � | 246 | � | � | � | � | � | � | � | � | � | � | � | � | � | � | � | � | � | � | � | � | � |
| Employees BCP Bolivia | � | � | 1678 | � | � | � | 1654 | � | � | � | 1643 | � | � | � | � | � | � | � | � | � | � | � | � | � | � | � | � | � | � | � | � | � |
| Employees Inversiones Credicorp Bolivia (Holding) | � | � | 16 | � | � | � | 18 | � | � | � | 17 | � | � | � | � | � | � | � | � | � | � | � | � | � | � | � | � | � | � | � | � | � |
* Accumulated ROAE for September 2014: 16.5%, September 2013: 12.4%.
�
BCP Bolivia’s net income in 3Q14 totaled PEN 17.8 million, which represented an 8.4% decline QoQ. This was mainly due to: i) a 10.2% drop in non-financial income due to lower gains on FX transactions after clients migrated to the FX platform, which offers better services and transaction management; ii) 3.0% QoQ growth in operating expenses, which was associated with BCP Bolivia’s efforts to comply with Government requirements to increase police security at banking locations. The aforementioned was offset by: i) a 14.3% QoQ contraction in net provisions for loan losses, which was due primarily to an improvement in portfolio quality, and ii) growth in net interest income (+3.9% QoQ) due to loan expansion.
�
In annual terms, BCP Bolivia’s net income posted a positive variation (58.9% QoQ), which was primarily attributable to: i) a 61.6% YoY decline in net provisions for loan losses, which was mainly due to an improvement in the portfolio’s quality; and ii) growth in net interest income (12.9% YoY), which was primarily associated with loan growth. Nevertheless, this was offset by: i) an increase in operating expenses (10.4% YoY), which was due primarily to a statutory salary increase and provisions that were set aside to pay the second statutory bonus, which was decreed by the Plurinational State of Bolivia in November 2013 and (ii) growth in income tax (43.0% YoY) due to higher income.
�
BCP’s prudential approach to loan risk management allowed it to post a PDL ratio of 1.45% in 3Q14 (1.51% in 2Q14 and 1.69% in 3Q13) and a coverage ratio of 262.2% (255.8% in 2Q14 and 224.6% in 3Q13). This is proof that BCP Bolivia continues to position itself as one of the most reliable and stable entities in the Bolivian banking system, which reported a PDL ratio of 1.65% and a coverage ratio of 261.1% at the end of 3Q14. BCP Bolivia’s ROAE at the end of 3Q14 was situated at 16.1%.
�
Assets and Liabilities
�
BCP Bolivia’s loan balance at the end of September 2014 was PEN 3,339.8 million. This represents a 6.0% increase with regard to the PEN 3,151.5 million reported at the end of June 2014. The aforementioned growth was primarily due to a significant contribution from Retail Banking (which currently represents 60.7% of BCP Bolivia’s portfolio), which expanded 2.0% QoQ and 17.4% YoY. Within this portfolio, the star performers in terms of growth were: i) SME (+1.4% QoQ and +30.6% YoY ii) Mortgage Loans (+2.3% QoQ and +18.3% YoY) and iii) Personal Loans (+3.6% QoQ and +3.8% YoY). The wholesale banking portfolio, which represents 36.8% of BCP Bolivia’s portfolio, posted growth of +3.2% QoQ and +8.3% YoY.
�
| 31 |
|
�
BCP Bolivia’s investment balance at the end of September 2014 totaled PEN 829.0 million, which represents a decline of 7.7% QoQ and 11.8% YoY. The QoQ trend is attributable to the maturity of investments in guarantees from the Central Bank of Bolivia.
�
In terms of liabilities, BCP Bolivia reported 5.6% QoQ growth in deposits. This expansion was due primarily growth in term deposits (3.8%) and demand deposits (0.4%). The YoY analysis reveals 12.8% growth, which was driven by an expansion in term deposits (31.7%).
�
Net shareholders’ equity posted growth of 7.4% QoQ and 14.6% YoY. The YoY variation was attributable to the Bank’s decision to reinvest 55% of the income generated in 2013.
�
Finally, BCP Bolivia has a solid and stable market share of 10.5% in current loans (fourth place in the banking system) and 10.6% in total deposits (fifth place in the banking system).
�
| 32 |
|
�
IV. Financiera Edyficar
�
| Edyficar excluding Mibanco | � | Quarter | � | � | % Change | � | � | Year to date | � | � | % Change | � | ||||||||||||||||||||
| PEN (000) | � | 3Q13 | � | � | 2Q14(1) | � | � | 3Q14 | � | � | QoQ | � | � | ���YoY�� | � | � | Sep 13 | � | � | Sep 14 | � | � | Sep 14 / Sep 13 | � | ||||||||
| Net financial income | � | � | 141,707 | � | � | � | 166,301 | � | � | � | 181,999 | � | � | � | 9.4 | % | � | � | 28.4 | % | � | � | 433,334 | � | � | � | 503,460 | � | � | � | 16.2 | % |
| Total provisions for loan loasses | � | � | (22,540 | ) | � | � | (31,641 | ) | � | � | (28,843 | ) | � | � | -8.8 | % | � | � | 28.0 | % | � | � | (68,787 | ) | � | � | (88,770 | ) | � | � | 29.1 | % |
| Non financial income | � | � | 1,327 | � | � | � | 1,204 | � | � | � | 691 | � | � | � | -42.6 | % | � | � | -47.9 | % | � | � | 3,254 | � | � | � | 3,619 | � | � | � | 11.2 | % |
| Operating expenses | � | � | (75,760 | ) | � | � | (90,389 | ) | � | � | (96,632 | ) | � | � | 6.9 | % | � | � | 27.6 | % | � | � | (225,328 | ) | � | � | (275,700 | ) | � | � | 22.4 | % |
| Operating Income | � | � | 44,735 | � | � | � | 45,475 | � | � | � | 57,215 | � | � | � | 25.8 | % | � | � | 27.9 | % | � | � | 142,473 | � | � | � | 142,608 | � | � | � | 0.1 | % |
| Translation results | � | � | (578 | ) | � | � | 20 | � | � | � | (4,397 | ) | � | � | - | � | � | � | - | � | � | � | (40,006 | ) | � | � | (4,733 | ) | � | � | -88.2 | % |
| Income taxes | � | � | (11,800 | ) | � | � | (11,948 | ) | � | � | (14,591 | ) | � | � | 22.1 | % | � | � | 23.6 | % | � | � | (32,375 | ) | � | � | (37,685 | ) | � | � | 16.4 | % |
| Net income | � | � | 32,356 | � | � | � | 33,547 | � | � | � | 38,228 | � | � | � | 14.0 | % | � | � | 18.1 | % | � | � | 70,092 | � | � | � | 100,191 | � | � | � | 42.9 | % |
| Contribution to BCP | � | � | 32,288 | � | � | � | 33,477 | � | � | � | 38,147 | � | � | � | 14.0 | % | � | � | 18.1 | % | � | � | 69,945 | � | � | � | 99,980 | � | � | � | 42.9 | % |
| Total loans | � | � | 2,432,032 | � | � | � | 3,035,921 | � | � | � | 3,208,745 | � | � | � | 5.7 | % | � | � | 31.9 | % | � | � | 2,432,032 | � | � | � | 3,208,745 | � | � | � | 31.9 | % |
| Past due loans | � | � | 97,961 | � | � | � | 119,232 | � | � | � | 128,977 | � | � | � | 8.2 | % | � | � | 31.7 | % | � | � | 97,961 | � | � | � | 128,977 | � | � | � | 31.7 | % |
| Net provisions for possible loan losses | � | � | (167,943 | ) | � | � | (209,694 | ) | � | � | (221,716 | ) | � | � | 5.7 | % | � | � | 32.0 | % | � | � | (167,943 | ) | � | � | (221,716 | ) | � | � | 32.0 | % |
| Total assets | � | � | 3,317,329 | � | � | � | 4,380,396 | � | � | � | 4,460,332 | � | � | � | 1.8 | % | � | � | 34.5 | % | � | � | 3,317,329 | � | � | � | 4,460,332 | � | � | � | 34.5 | % |
| Deposits and obligations | � | � | 1,313,827 | � | � | � | 1,773,480 | � | � | � | 1,652,448 | � | � | � | -6.8 | % | � | � | 25.8 | % | � | � | 1,313,827 | � | � | � | 1,652,448 | � | � | � | 25.8 | % |
| Net shareholders� equity | � | � | 327,432 | � | � | � | 394,486 | � | � | � | 415,888 | � | � | � | 5.4 | % | � | � | 27.0 | % | � | � | 327,432 | � | � | � | 415,888 | � | � | � | 27.0 | % |
| PDL/Total loans | � | � | 4.03 | % | � | � | 3.93 | % | � | � | 4.02 | % | � | � | � | � | � | � | � | � | � | � | 4.03 | % | � | � | 4.02 | % | � | � | � | � |
| Coverage ratio of PDLs | � | � | 171.4 | % | � | � | 175.9 | % | � | � | 171.9 | % | � | � | � | � | � | � | � | � | � | � | 171.4 | % | � | � | 171.9 | % | � | � | � | � |
| Efficiency Ratio | � | � | 52.9 | % | � | � | 53.8 | % | � | � | 53.7 | % | � | � | � | � | � | � | � | � | � | � | 56.4 | % | � | � | 54.4 | % | � | � | � | � |
| Return on average equity* | � | � | 28.7 | % | � | � | 25.8 | % | � | � | 27.7 | % | � | � | � | � | � | � | � | � | � | � | 21.2 | % | � | � | 24.9 | % | � | � | � | � |
| Branches | � | � | 186 | � | � | � | 199 | � | � | � | 203 | � | � | � | � | � | � | � | � | � | � | � | � | � | � | � | � | � | � | � | � | � |
| Employees | � | � | 4,187 | � | � | � | 5,024 | � | � | � | 5,301 | � | � | � | � | � | � | � | � | � | � | � | � | � | � | � | � | � | � | � | � | � |
| � | � | � | � | � | � | � | � | � | � | � | � | � | � | � | � | � | � | � | � | � | � | � | � | � | � | � | � | � | � | � | � | � |
| Edyficar including Mibanco | � | 2Q14 | � | 3Q14 | � | QoQ | � | � | YoY | � | � | � | � | � | � | � | � | � | � | � | � | � | � | � | � | � | ||||||
| Net income | � | � | 32,772 | � | � | � | 20,164 | � | � | � | -38.5 | % | � | � | -37.7 | % | � | � | � | � | � | � | � | � | � | � | � | � | � | � | � | � |
| Contribution to BCP | � | � | 32,703 | � | � | � | 20,122 | � | � | � | -38.5 | % | � | � | -37.7 | % | � | � | � | � | � | � | � | � | � | � | � | � | � | � | � | � |
| Net shareholders� equity | � | � | 900,718 | � | � | � | 1,067,673 | � | � | � | 118.5 | % | � | � | 226.1 | % | � | � | � | � | � | � | � | � | � | � | � | � | � | � | � | � |
| Efficiency Ratio | � | � | 55.1 | % | � | � | 60.5 | % | � | � | � | � | � | � | � | � | � | � | � | � | � | � | � | � | � | � | � | � | � | � | � | � |
| Return on average equity* | � | � | 12.8 | % | � | � | 7.1 | % | � | � | � | � | � | � | � | � | � | � | � | � | � | � | � | � | � | � | � | � | � | � | � | � |
* Net shareholders' equity includes US $ 50.7 million from goowill.
(1) 2Q14 figures excluding Mibanco differs from those previously reported, due to a reallocation of expenses as a result of the acquisition of Mibanco.
�
In 3Q14, Edyficar, without including Mibanco, posted net income of PEN 38.3 million (+14.0% QoQ). This increase was due primarily to expansion in net interest income (+9.4% QoQ) and to a decrease in net provisions for loan losses of -8.8% QoQ. The aforementioned helped offset the increase in operating expenses (+6.9% QoQ), due to higher expenditure on employee salaries and benefits, which was associated with a QoQ increase in personnel. Nevertheless, if we incorporate the effect of Mibanco, net income fell -38.5% QoQ and was situated at PEN 20.2 million.
�
In terms of portfolio volume and quality, total loans grew +5.7% QoQ to reach PEN 3,209 million. This represented an expansion of 32.0% YoY and contributed to increase Edyficar’s market share in the sector. The positive evolution posted this Q was due to tangible and intangible factors, including:
i) increase in the work force to reach more clients, ii) and on-going improvement in training to further professionalize the work of our analysts.
�
The past due portfolio grew +8.2% QoQ and +31.7% YoY; in this context, the PDL ratio was 4.02% in 3Q14. This figure represents a slight increase of +9pbs with regard to 2Q14’s figure (3.93%). The coverage ratio for non-performing loans was situated at 171.9% at the end of 3Q14, which was 397pbs below the figure registered at the end of 2Q14 (175.9%). Nevertheless, these results are within the internal limit (150%).
�
Total assets grew 1.8% QoQ and 34.5% YoY. This was due mainly to loan growth followed by an expansion in fixed assets, which was in turn attributable to on-going growth in the number of branches, which increased from 186 in 3Q13 to 199 in 2Q14 and rose once again in 3Q14 to 203.
�
Net shareholders’ equity, without including Mibanco, totaled PEN 416 million. This represents a +5.4% increase QoQ that was associated with higher earnings this Q. The ROAE, without Mibanco, was 27.7% in 3Q14, which tops the 25.8% recorded in 2Q14. If we include Mibanco, ROAE is situated at 7.1% in 3Q14, which is in line with expectations and is attributable to the capital increase taken at the end of 1Q14 to purchase shares of Mibanco. In this context, net shareholders’ equity (including Mibanco) in 3Q14 totaled PEN 1,068 million.
�
The results obtained by Financiera Edyficar are proof that it continues to contribute to BCP’s objectives in terms of loan growth and earnings generation.
�
| 33 |
|
�
V. Credicorp Capital
�
Credicorp Capital’s contribution to Credicorp fell 6.6% QoQ to situate at PEN11.4 million. The operation in Peru contributed earnings of PEN2.4 million while Credicorp Capital Colombia posted earnings PEN3.3 million, and IM Trust, PEN1.5 million. Credicorp Capital Securities posted a loss of PEN0.7 million this Q.
�
| Earnings contribution * | � | Quarter | � | � | % Change | � | � | Year to date | � | |||||||
| PEN (000) | � | 2Q14 | � | 3Q14 | � | QoQ | � | � | Sep 14 | � | ||||||
| Credicorp Capital Per� | � | � | 5,862 | � | � | � | 2,478 | � | � | � | -57.7 | % | � | � | 15,915 | � |
| Credicorp Capital Ltd. | � | � | 6,381 | � | � | � | 8,887 | � | � | � | 39.3 | % | � | � | 24,193 | � |
| ����Credicorp Capital Ltd. (Holding) | � | � | 2,239 | � | � | � | 4,663 | � | � | � | 108.3 | % | � | � | 8,739 | � |
| ����Credicorp Capital Colombia (1) | � | � | 2,042 | � | � | � | 3,339 | � | � | � | 63.5 | % | � | � | 9,977 | � |
| ����IM Trust | � | � | 1,904 | � | � | � | 1,557 | � | � | � | -18.2 | % | � | � | 5,852 | � |
| ����Credicorp Capital Securities | � | � | 195 | � | � | � | -671 | � | � | � | -443.6 | % | � | � | -375 | � |
| Credicorp Capital | � | � | 12,243 | � | � | � | 11,366 | � | � | � | -7.2 | % | � | � | 40,109 | � |
| Contribution to Credicorp (2) | � | � | 12,105 | � | � | � | 11,308 | � | � | � | -6.6 | % | � | � | 39,736 | � |
�
* Unaudited results.
(1) Credicorp Capital Peru earnings are part of the Consolidated since the end of 2T13.
(2) Credicorp Capital Peru contributes with 97.66%; Credicorp investments with 100% of their results.
�
The decrease in earnings this quarter is due to a lag in economic activity, which led to a drop in earnings generation. In this context, non-financial income fell 5% with regard to 2Q and situated at PEN.111.1 million. Non-financial income in 3Q14 was generated primarily by business in the following areas: Capital Markets (32%); Asset Management (15%); and Corporate Finance (17%). The remaining 36% was attributable to business from commissions in Confidence, Trusts, Commercial and Treasury.
�
Credicorp Capital’s results in 3Q14 with regard to 2Q14 were lower due to the fact that last quarter was extraordinarily auspicious in terms of income compared with the rest of the year thus far. The drop in income in 3Q was mainly attributable to business from: Corporate Finance, due to less structuring of primary issuances and advisory services for mergers and acquisitions; Treasury, due to lower commissions; and Capital Markets, due to lower income relative to currencies and derivatives. These three businesses fell 20.6%, 34.9% and 8.3% respectively with regard to 2Q14.
�
Despite this decline, at the end of 3Q14, Credicorp Capital Peru, Credicorp Capital Colombia and IM Trust continued to lead their local secondary fixed income markets with shares of 41%, 11% and 23%, respectively. Credicorp Capital Peru was also at the forefront of the equity market with a 44% share.
�
Thus far in 2014, Credicorp Capital, with the help of its corporate finance team, has completed a significant number of transactions. In Peru, two mid-term financing structures and a bond issuance for approximately PEN325 million were particularly noteworthy. In Chile, 80% of the net income generated in 3Q corresponded to Merger and Acquisitions business.
�
At the end of 3Q14, Credicorp Capital’s AuM level was 23,506 million, of which 57% correspond to Credicorp Capital Peru; 24% to Credicorp Capital Colombia; and 19% to IM Trust. This asset level represents growth of 8% with regard to Credicorp Capital’s assets under management level in 2Q14. It is important to note that Credicorp Capital Peru continues to lead the Mutual Funds market with a 42.3% share of total AuMs at the end of 3Q14.
�
Operating expenses fell to PEN89.9 million in 3Q14. The main expenditures this Q were for employee salaries and benefits; administrative expenses; and support expenses. The area that posted the largest decrease in expenditure was relative to short term incentives for earnings generation. This led to a decrease in the provision level for Peru and Chile, which dropped 35.3% with regard to 3Q. Administrative expenses increased 11% this Q, due to the Capital Markets event that Peru organizes every year. Consequently, Credicorp’s efficiency ratio fell from 78.7% in 2Q14 to 74.7% in 3Q14.
�
| 34 |
|
�
| Credicorp Capital * | � | Quarter | � | � | % Change | � | � | Year to date | � | |||||||
| PEN (000) | � | 2Q14 | � | 3Q14 | � | QoQ | � | � | Sep 14 | � | ||||||
| Financial income | � | � | 4,978 | � | � | � | 10,769 | � | � | � | 116 | % | � | � | 21,847 | � |
| Non-financial income | � | � | 115,536 | � | � | � | 109,655 | � | � | � | -5 | % | � | � | 342,841 | � |
| Financial expense | � | � | -2,000 | � | � | � | -10,883 | � | � | � | 444 | % | � | � | -17,468 | � |
| Operating expense (1) | � | � | -94,824 | � | � | � | -89,904 | � | � | � | -5 | % | � | � | -273,150 | � |
| Net income before taxes | � | � | 23,690 | � | � | � | 19,637 | � | � | � | -17 | % | � | � | 74,069 | � |
| Income taxes | � | � | -7,495 | � | � | � | -6,359 | � | � | � | -15 | % | � | � | -21,899 | � |
| Translation results | � | � | 148 | � | � | � | 2,293 | � | � | � | 1449 | % | � | � | 2,634 | � |
| Minority interest (2) | � | � | -4,100 | � | � | � | -4,205 | � | � | � | 3 | % | � | � | -14,696 | � |
| Net income before taxes | � | � | 12,243 | � | � | � | 11,366 | � | � | � | -7 | % | � | � | 40,109 | � |
| Contribution to Credicorp | � | � | 12,105 | � | � | � | 11,308 | � | � | � | -7 | % | � | � | 39,736 | � |
| Net shareholders' equity | � | � | 696,305 | � | � | � | 726,209 | � | � | � | 4 | % | � | � | 726,209 | � |
| Assets under Management | � | � | 21,779,915 | � | � | � | 23,505,597 | � | � | � | 8 | % | � | � | 23,505,597 | � |
| Efficiency ratio | � | � | 78.7 | % | � | � | 74.7 | % | � | � | -5 | % | � | � | 74.9 | % |
| ROAE (3) | � | � | 7.1 | % | � | � | 6.4 | % | � | � | -10 | % | � | � | 11.0 | % |
�
* Unaudited results.
(1) Includes: Salaries and employees benefits + Administrative expenses + Assigned expenses + Depreciation and amortization + Tax and contributions + Other expenses.
(2) Percentage of Correval and IM Trust that is not owned by BCP Colombia and BCP Chile (49% and 39.4% respectively).
(2) ROAE = Annualized net income / average net shareholder's equity.
�
| 35 |
|
�
VI. Atlantic Security Bank
�
Atlantic Security Bank (ASB) reported net income of US$ 9.7 million in 3Q14, which represents an annualized return on equity of 18%. Nevertheless, it is important to note that earnings dropped 66.5% QoQ due to the extraordinary income (other income) that was posted in 2Q14 (US$ 14.6 million) for a payment on a claim for losses incurred during the financial crisis of 2008. If we exclude extraordinary income from 2Q, earnings fell 32.2% QoQ. This decline was attributable to a drop in net gains on the investment portfolio this quarter due to volatility in the fixed income and equity securities markets. �
�
Core income fell -6.1% QoQ due to a decrease in dividends from the equity portfolio and losses on FX transactions with regard to 2Q14. The YoY comparison also reveals lower dividend income, which was accompanied by higher FX losses. In this context, core income fell -2.9% YoY.
�
| ASB | � | Quarter | � | � | % Change | � | � | Year to date | � | � | % Change | � | ||||||||||||||||||||
| US$ million | � | 3Q13 | � | � | 2Q14 | � | � | 3Q14 | � | � | QoQ | � | � | YoY | � | � | Sep 13��Sep 14 | � | � | Sep 14 / Sep 13 | � | |||||||||||
| Net interest income | � | � | 9.4 | � | � | � | 9.9 | � | � | � | 9.9 | � | � | � | 0.1 | % | � | � | 4.8 | % | � | � | 29.6 | � | � | � | 29.3 | � | � | � | -0.9 | % |
| Dividend income | � | � | 0.3 | � | � | � | 0.5 | � | � | � | 0.1 | � | � | � | -89.0 | % | � | � | -79.9 | % | � | � | 0.9 | � | � | � | 0.8 | � | � | � | -10.9 | % |
| Fees and commissions from services | � | � | 2.2 | � | � | � | 1.9 | � | � | � | 2.0 | � | � | � | 6.0 | % | � | � | -7.9 | % | � | � | 6.4 | � | � | � | 5.7 | � | � | � | -10.7 | % |
| Net gains on foreign exchange transactions | � | � | -0.1 | � | � | � | 0.0 | � | � | � | -0.5 | � | � | � | -986.2 | % | � | � | -728.9 | % | � | � | -1.2 | � | � | � | -0.5 | � | � | � | -57.5 | % |
| Total earnings | � | � | 11.8 | � | � | � | 12.2 | � | � | � | 11.5 | � | � | � | -6.1 | % | � | � | -2.9 | % | � | � | 35.7 | � | � | � | 35.3 | � | � | � | -1.0 | % |
| Net Provisions | � | � | 0.0 | � | � | � | 0.0 | � | � | � | 0.0 | � | � | � | 100.0 | % | � | � | 100.0 | % | � | � | -0.3 | � | � | � | 0.0 | � | � | � | -95.6 | % |
| Net gains on sale of securities | � | � | 0.2 | � | � | � | 4.9 | � | � | � | 1.1 | � | � | � | -77.5 | % | � | � | 345.2 | % | � | � | 10.1 | � | � | � | 7.4 | � | � | � | -27.0 | % |
| Other income | � | � | 0.1 | � | � | � | 14.6 | � | � | � | 0.0 | � | � | � | -100.1 | % | � | � | -113.3 | % | � | � | 0.2 | � | � | � | 14.6 | � | � | � | 7475.4 | % |
| Operating expenses | � | � | -2.4 | � | � | � | -2.8 | � | � | � | -2.9 | � | � | � | -2.8 | % | � | � | -21.9 | % | � | � | -7.0 | � | � | � | -8.2 | � | � | � | 16.8 | % |
| Net income | � | � | 9.8 | � | � | � | 28.9 | � | � | � | 9.7 | � | � | � | -66.5 | % | � | � | -1.0 | % | � | � | 38.7 | � | � | � | 49.1 | � | � | � | 27.0 | % |
| Net income / share | � | � | 0.14 | � | � | � | 0.41 | � | � | � | 0.14 | � | � | � | -66.5 | % | � | � | -1.0 | % | � | � | 0.55 | � | � | � | 0.70 | � | � | � | 27.0 | % |
| Contribution to Credicorp | � | � | 9.8 | � | � | � | 28.9 | � | � | � | 9.7 | � | � | � | -66.5 | % | � | � | -1.0 | % | � | � | 38.7 | � | � | � | 49.1 | � | � | � | 27.0 | % |
| Total loans | � | � | 778.1 | � | � | � | 816.1 | � | � | � | 795.2 | � | � | � | -2.6 | % | � | � | 2.2 | % | � | � | 778.1 | � | � | � | 795.2 | � | � | � | � | � |
| Total investments | � | � | 825.7 | � | � | � | 893.5 | � | � | � | 890.6 | � | � | � | -0.3 | % | � | � | 7.9 | % | � | � | 825.7 | � | � | � | 890.6 | � | � | � | � | � |
| Total assets | � | � | 1,703.1 | � | � | � | 1,881.1 | � | � | � | 1,861.6 | � | � | � | -1.0 | % | � | � | 9.3 | % | � | � | 1,703.1 | � | � | � | 1,861.6 | � | � | � | � | � |
| Total deposits | � | � | 1,349.1 | � | � | � | 1,539.5 | � | � | � | 1,549.9 | � | � | � | 0.7 | % | � | � | 14.9 | % | � | � | 1,349.1 | � | � | � | 1,549.9 | � | � | � | � | � |
| Net shareholder's equity | � | � | 182.5 | � | � | � | 216.1 | � | � | � | 213.8 | � | � | � | -1.0 | % | � | � | 17.2 | % | � | � | 182.5 | � | � | � | 213.8 | � | � | � | � | � |
| Net interest margin | � | � | 2.3 | % | � | � | 2.4 | % | � | � | 2.4 | % | � | � | � | � | � | � | � | � | � | � | 3.8 | % | � | � | 7.0 | % | � | � | � | � |
| Efficiency ratio | � | � | 19.5 | % | � | � | 8.8 | % | � | � | 22.9 | % | � | � | � | � | � | � | � | � | � | � | 15.2 | % | � | � | 14.2 | % | � | � | 0.0345 | � |
| Return on average equity | � | � | 22.1 | % | � | � | 58.3 | % | � | � | 18.0 | % | � | � | � | � | � | � | � | � | � | � | 25.7 | % | � | � | 31.6 | % | � | � | � | � |
| PDL / Total loans | � | � | 0.00 | � | � | � | 0.00 | � | � | � | 0.00 | � | � | � | � | � | � | � | � | � | � | � | 0.00 | � | � | � | 0.00 | � | � | � | � | � |
| Coverage ratio | � | � | 0.1 | % | � | � | 0.1 | % | � | � | 0.1 | % | � | � | � | � | � | � | � | � | � | � | 0.1 | % | � | � | 0.1 | % | � | � | � | � |
| BIS Ratio (*) | � | � | 15.37 | % | � | � | 14.75 | % | � | � | 15.00 | % | � | � | � | � | � | � | � | � | � | � | 15.37 | % | � | � | 15.00 | % | � | � | � | � |
(*) BIS Ratio = (Eligible Capital - Deductions) / (RWA CR + Charge OR + Charge MR).
�
In terms of operating efficiency, ASB reported an efficiency ratio of 22.9% in 3Q14, which is higher than the figure reported last quarter (8.8%).The increase in this indicator was due to lower net income this quarter, which is explained in the previous paragraph, and to higher operating costs QoQ (+U$75 thousand) and YoY (+U$519 thousand). In the YoY comparison, the efficiency ratio is 340 bps higher.
�
Assets and Liabilities
�
Interest earning assets totaled US$ 1,717 million, as is evident in the table below. If we compare this result to 2Q14’s, a 2.1% reduction is evident. A YoY analysis, however, shows 8.1% growth in this indicator.
�
At the individual level, larger variations were seen in Cash and Banks, which was down -3.5% QoQ and up +104.2% YoY. The QoQ result was attributable to a decrease in available balances at quarter-end while the YoY variation was attributable to an increase in the position of client deposits.
�
In absolute terms, the decrease in interest earning assets, which totaled US$ 37 million, was due to loan and investment transaction flows and to fund flows to repay financing this quarter.
�
| 36 |
|
��
Thus far this year, assets and liabilities posted a positive result of US$ 129 million (US$ 68 million in Cash and Banks, US$ 17 million in loans and US$ 44 million in investments) due to i) loan disbursements, ii) growth in the equity and fixed income investment portfolio and iii) higher available balances in cash and banks due to new captures at the end of the third quarter of 2014. It is important to note that ASB continues to maintain a good risk profile, which is reflected in the portfolio’s high compliance level.
�
| Interest earning assets * | � | Quarter | � | � | % Change | � | ||||||||||||||
| US$ million | � | 3Q13 | � | � | 2Q14 | � | � | 3Q14 | � | � | QoQ | � | � | YoY | � | |||||
| Due from banks | � | � | 65 | � | � | � | 137 | � | � | � | 133 | � | � | � | -3.5 | % | � | � | 104.2 | % |
| Loans | � | � | 778 | � | � | � | 816 | � | � | � | 795 | � | � | � | -2.6 | % | � | � | 2.2 | % |
| Investments | � | � | 745 | � | � | � | 800 | � | � | � | 789 | � | � | � | -1.4 | % | � | � | 5.9 | % |
| Total interest-earning assets | � | � | 1,588 | � | � | � | 1,754 | � | � | � | 1,717 | � | � | � | -2.1 | % | � | � | 8.1 | % |
* Excludes investments in equities and mutual funds.
�
With regard to the investment portfolio, it is worth noting that ASB’s investment policy prioritizes instruments with good risk profiles. Accordingly, 56% of the bank’s instruments have an investment grade, which is proof of ASB’s sustained and conservative strategy to concentrate on investments in high-quality instruments.
�
 |
 |
�
ASB exercises strict control and follow-up on diversification strategies and the limits set for investment types. This helps maintain a healthy balance in its proprietary portfolio, ensure the quality of its investments and guarantee return levels that contribute to the financial margin- which has a subsequently positive impact on shareholders’ returns.
�
In terms of liabilities, client deposits posted a marginal increase of 0.7% QoQ and an increase of 14.9% YoY. The QoQ increase in deposits is associated with captures of new client deposits (+US$ 10 million) while the YoY comparison shows that deposits increased US$ 201 million due to the Treasury Division’s moves to retain and capture new deposits through fidelity programs aimed at individual and institutional clients. Other liabilities, which are mainly composed of financing (US$ 65.8 million) and accrued liabilities (US$ 32.0 million, which includes accrued interest for US$ 10.2 million), posted a drop of 21.8% QoQ and 42.9% YoY due to liquidity levels at the end of 3Q14.
�
| Liabilities | � | Quarter | � | � | % Change | � | ||||||||||||||
| US$ million | � | 3Q13 | � | � | 2Q14 | � | � | 3Q14 | � | � | QoQ | � | � | YoY | � | |||||
| Deposits | � | � | 1,349 | � | � | � | 1,540 | � | � | � | 1,550 | � | � | � | 0.7 | % | � | � | 14.9 | % |
| Other liabilities | � | � | 171 | � | � | � | 125 | � | � | � | 98 | � | � | � | -21.8 | % | � | � | -42.9 | % |
| Total Liabilities | � | � | 1,521 | � | � | � | 1,665 | � | � | � | 1,648 | � | � | � | -1.0 | % | � | � | 8.4 | % |
�
Net shareholder’s equity fell slightly by 1% QoQ. This was due primarily to a drop in unrealized gains on securities available for sale, which was in turn attributable to: i) volatility in the international markets given that there is uncertainty regarding rate increases; ii) the fact that the economic data from the Euro Zone and the United States is weak; and iii) concerns about the downturn in China. These factors led to a negative variation of 36.5% QoQ (-US$12.1 million).
�
| 37 |
|
�
�
The BIS Ratio at the end of 3Q14 was situated at 15.0%, which represents a 25 bps increase with regard to the figure posted in 2T14 (14.75%). The increase in the BIS ratio is mainly attributable to a decrease in the value of risk-weighted assets on the balance sheet (primarily in loans and investments). It is important to note the Bank’s minimum ratio has held steady at 12%.
�
Assets under Management and Deposits
�
Assets under management, which include client deposits, investments in funds and custody of financial instruments, totaled US$5,986 million at market value in 2Q14. This represents a 3.0% increase with regard to 2Q14 and 175% YoY. The QoQ result was due primarily to market volatility, which led to an increase of only US$ 175 million. Nevertheless, the purchase and sales flows this quarter increased US$165 million while deposits rose US$ 10 million. Over the last year, the increase in funds under management for third parties totaled US$ 891 million; the investment stock reached US$ 391 million; and deposits increased US$ 201 million (+14.9%).
�
 �
�
�
| 38 |
|
�
VII. Pacifico Grupo Asegurador (PGA)
�
| PGA | � | Quarter | � | � | % Change | � | � | Year to date | � | � | % Change | � | ||||||||||||||||||||
| PEN (000) | � | 3Q13 | � | � | 2Q14 | � | � | 3Q14 | � | � | QoQ | � | � | Yoy | � | � | Sep 13 | � | � | Sep 14 | � | � | Sep 14 / Sep 13 | � | ||||||||
| Net earned premiums | � | � | 584,880 | � | � | � | 553,864 | � | � | � | 573,853 | � | � | � | 3.6 | % | � | � | -1.9 | % | � | � | 1,656,909 | � | � | � | 1,662,728 | � | � | � | 0.4 | % |
| Net claims | � | � | 386,646 | � | � | � | 356,355 | � | � | � | 358,492 | � | � | � | 0.6 | % | � | � | -7.3 | % | � | � | 1,103,791 | � | � | � | 1,051,677 | � | � | � | -4.7 | % |
| Net commissions | � | � | 107,495 | � | � | � | 99,233 | � | � | � | 105,668 | � | � | � | 6.5 | % | � | � | -1.7 | % | � | � | 286,699 | � | � | � | 311,420 | � | � | � | 8.6 | % |
| Net underwriting expenses | � | � | 15,771 | � | � | � | 23,648 | � | � | � | 12,710 | � | � | � | -46.3 | % | � | � | -19.4 | % | � | � | 70,386 | � | � | � | 55,318 | � | � | � | -21.4 | % |
| Underwriting result | � | � | 74,968 | � | � | � | 74,629 | � | � | � | 96,982 | � | � | � | 30.0 | % | � | � | 29.4 | % | � | � | 196,033 | � | � | � | 244,312 | � | � | � | 24.6 | % |
| Medical Services gross margin (1) | � | � | 19,343 | � | � | � | 25,242 | � | � | � | 28,813 | � | � | � | 14.1 | % | � | � | 49.0 | % | � | � | 51,157 | � | � | � | 74,765 | � | � | � | 46.1 | % |
| Total Underwriting result (1) | � | � | 94,311 | � | � | � | 99,871 | � | � | � | 125,795 | � | � | � | 26.0 | % | � | � | 33.4 | % | � | � | 247,190 | � | � | � | 319,077 | � | � | � | 29.1 | % |
| Financial income, net | � | � | 93,750 | � | � | � | 77,457 | � | � | � | 87,035 | � | � | � | 12.4 | % | � | � | -7.2 | % | � | � | 257,819 | � | � | � | 244,814 | � | � | � | -5.0 | % |
| Operating expenses | � | � | 134,043 | � | � | � | 131,759 | � | � | � | 138,085 | � | � | � | 4.8 | % | � | � | 3.0 | % | � | � | 389,864 | � | � | � | 396,254 | � | � | � | 1.6 | % |
| Other income | � | � | 3,868 | � | � | � | 5,635 | � | � | � | 1,853 | � | � | � | -67.1 | % | � | � | -52.1 | % | � | � | 5,018 | � | � | � | 10,679 | � | � | � | 112.8 | % |
| Translations results | � | � | 640 | � | � | � | 1,235 | � | � | � | 740 | � | � | � | -40.1 | % | � | � | 15.6 | % | � | � | -21,819 | � | � | � | 2,465 | � | � | � | -111.3 | % |
| Income tax | � | � | 7,774 | � | � | � | 4,697 | � | � | � | 15,075 | � | � | � | 221.0 | % | � | � | 93.9 | % | � | � | 3,325 | � | � | � | 31,618 | � | � | � | 850.9 | % |
| Income before minority interest | � | � | 50,752 | � | � | � | 47,742 | � | � | � | 62,264 | � | � | � | 30.4 | % | � | � | 22.7 | % | � | � | 95,019 | � | � | � | 149,162 | � | � | � | 57.0 | % |
| Net income | � | � | 45,266 | � | � | � | 41,833 | � | � | � | 55,874 | � | � | � | 33.6 | % | � | � | 23.4 | % | � | � | 80,031 | � | � | � | 131,939 | � | � | � | 64.9 | % |
| Contribution to Credicorp | � | � | 51,710 | � | � | � | 46,432 | � | � | � | 60,031 | � | � | � | 29.3 | % | � | � | 16.1 | % | � | � | 95,294 | � | � | � | 144,380 | � | � | � | 51.5 | % |
| Total assets | � | � | 7,561,700 | � | � | � | 8,119,771 | � | � | � | 8,521,038 | � | � | � | 4.9 | % | � | � | 12.7 | % | � | � | 7,561,700 | � | � | � | 8,521,038 | � | � | � | 12.7 | % |
| Invesment on securities | � | � | 4,636,852 | � | � | � | 5,112,710 | � | � | � | 5,229,270 | � | � | � | 2.3 | % | � | � | 12.8 | % | � | � | 4,636,852 | � | � | � | 5,229,270 | � | � | � | 12.8 | % |
| Technical reserves | � | � | 4,840,325 | � | � | � | 5,143,041 | � | � | � | 5,322,961 | � | � | � | 3.5 | % | � | � | 10.0 | % | � | � | 4,840,325 | � | � | � | 5,322,961 | � | � | � | 10.0 | % |
| Net equity | � | � | 1,396,035 | � | � | � | 1,593,792 | � | � | � | 1,611,494 | � | � | � | 1.1 | % | � | � | 15.4 | % | � | � | 1,396,035 | � | � | � | 1,611,494 | � | � | � | 15.4 | % |
| Loss ratio | � | � | 66.1 | % | � | � | 64.3 | % | � | � | 62.5 | % | � | � | � | � | � | � | � | � | � | � | 66.6 | % | � | � | 63.3 | % | � | � | � | � |
| Return on equity (2)(3)(4) | � | � | 13.7 | % | � | � | 11.0 | % | � | � | 13.9 | % | � | � | � | � | � | � | � | � | � | � | 10.6 | % | � | � | 17.6 | % | � | � | � | � |
| Combined ratio of��PPS + PS (4) | � | � | 101.9 | % | � | � | 99.6 | % | � | � | 94.6 | % | � | � | � | � | � | � | � | � | � | � | 105.5 | % | � | � | 97.9 | % | � | � | � | � |
(1) With consolidated adjustments between insurance companies and medical services.
(2) Annualized.
(3) Average are determinated as the average of period - beginning and period ending.
(4) ROAE without unrealized gains 3Q13: 13.5%, 2Q14: 11.1% and 3Q14: 13.6%. Sep 13: 7.9% and Sep 14: 14.2%.
(5) With consolidated adjustments.
�
Pacifico Grupo Asegurador (PGA) reported net income before minority interest of PEN 62.3 million in 3Q14, which represents a 30.4% increase with regard to the PEN 47.7 million registered in 2Q14 and is 22.7% higher than the PEN 50.8 million posted in 3Q13. The QoQ evolution was due primarily to:
�
| i) | An improvement in Pacifico Seguros Generales’s (PPS) underwriting result due to higher net earned premiums (NEP), particularly in the Private Medical and Wholesale Lines; lower claims in the Vehicle business; and lower underwriting expenses due to a release of uncollectible reinsurance, which will be covered later in this report; and |
�
| ii) | Higher net financial income in Credit Life due to an increase in gain of sales of securities following profit sharing distribution relative to Fondo de Inversi�n ENFOCA’s sale of Maestro. |
�
The aforementioned mitigated the increase in operating expenses (+4.8% QoQ), which was due primarily to expenses for reorganization and consultancy fees at PPS; a decrease in translation results (-40.1% QoQ) and higher income tax (+PEN 10.4 million QoQ).
�
In this context, PGA’s total underwriting result was +26.0% higher QoQ, due to increases in the underwriting result at PPS (+PEN 29.0 million), the medical subsidiaries (+PEN 3.6 million) and EPS (+PEN 2.9 million), which offset the decrease in Pacifico Vida’s (PV) underwriting result. In the case of PPS, the QoQ evolution is due to a higher level of net earned premiums in all business, followed by a lower overall loss ratio due to a significant reduction in the loss ratio of the Vehicle business and a decrease in acquisition costs, which was associated with a release of provisions for uncollectible reinsurance (reinsurance charge for a claim filed by a client in 2008). In the case of EPS, the improvement was primarily due to a 4.9% QoQ increase in premiums that was associated with an increase in affiliates’ contributions. The decrease in PV’s result was attributable to: i) a higher reserves ratio, which was in line with more premium turnover in Annuities, ii) a higher claims, particularly in Group Life iii) a higher commission due to more premium turnover in all businesses and iv) an increase in the underwriting expenses due to more surrender in Individual Life.
�
Financial income grew 12.4% QoQ due to higher gains on sales of securities (+PEN 13.2 million) due to: i) profit sharing distribution at the Fondo de Inversi�n ENFOCA as a result of the sale of its stake in Maestro (home improvement store), ii) higher gains on the sale of bonds and iii) the redemption of a structured note from the Bank of America. It is important to note that the aforementioned helped attenuate the decrease in financial income at PV due to a decrease in dividends received (-PEN 3.7 million) and a smaller inflation adjustment (-PEN 3.7 million) on the portfolio’s VAC assets.
�
| 39 |
|
�
The increase in operating expenses was due primarily to higher expenses at PPS and PV. PPS registered a one-off charge for reorganization (+PEN 6.2 million) and for consultancy fees (+PEN 2.0 million) in the Vehicle business. At PV, the increase in expenses was associated with a contingency provision for Essalud 2009 (+PEN 0.8 million) and expenses for system services.
�
In terms of the YoY results, net income before minority interest at PGA shows growth of 22.7% due to a significant increase in the underwriting results of PPS (+PEN 32.6 million) and the medical subsidiaries (+PEN 2.9 million). This attenuated an increase in operating expenses (+PEN 4.0 million), a decrease in financial income (-PEN 6.7 million) and lower miscellaneous income (-PEN 2.0 million).
�
The underwriting result, which includes the subsidiaries, reported an increase of 33.4% YoY (+PEN 31.5 million). At PPS, the improvement in the underwriting result was generated by i) an increase in the net earned premium at all businesses, ii) the extraordinary effect reported in 3Q14 due to the release uncollectible reinsurance and iii) a lower claims due to better pricing in the Vehicle business. The increase in the underwriting result of the medical subsidiaries was generated by an increase in the gross margin (24.5% in 3Q13 versus 29.3% in 3Q14) due to higher sales at clinics, which was associated with an increase in the number of services provided.
�
| PGA | � | Net income * | � | � | % Change | � | ||||||||||||||
| PEN (000) | � | 3Q13 | � | � | 2Q14 | � | � | 3Q14 | � | � | QoQ | � | � | YoY | � | |||||
| PGA ** | � | � | 50,752 | � | � | � | 47,742 | � | � | � | 62,264 | � | � | � | 30.4 | % | � | � | 22.7 | % |
| PV | � | � | 38,643 | � | � | � | 39,097 | � | � | � | 39,345 | � | � | � | 0.6 | % | � | � | 1.8 | % |
| EPS *** | � | � | 1,773 | � | � | � | 1,665 | � | � | � | 3,823 | � | � | � | 129.7 | % | � | � | 115.6 | % |
| Consolidation adjustments | � | � | 958 | � | � | � | -1,310 | � | � | � | -2,233 | � | � | � | 70.5 | % | � | � | -333.0 | % |
| Contribution to Credicorp | � | � | 51,710 | � | � | � | 46,432 | � | � | � | 60,031 | � | � | � | 29.3 | % | � | � | 16.1 | % |
* Before minoritary interest.
** Legal name: El Pac�fico Peruano Suiza Compa��a de Seguros y Reaseguros S.A. y Subsidiarias.
*** Includes medical subsidiaries results.
�
Pacifico Seguros Generales (PPS)
�
PPS reported earnings of PEN 18.0 million in 3Q14, which represents a 168.8% increase with regard to the PEN 6.7 million obtained in 2Q14. This improvement was due to an increase in the underwriting result as well as higher financial and miscellaneous income. This offset the increase in general expenses (+PEN 10.3 QoQ), the unfavorable translation result in 3Q14 (-PEN 4.7 million), and higher income tax this quarter (+PEN 9.8 million).
�
The underwriting result reported an increase of 53.3% QoQ that was due primarily to: i) an increase in the net earned premiums (+PEN 14.5 million), ii) lower acquisition costs (-PEN 10.4 million) and iii) a decrease in claims (-PEN 4.0 million QoQ). The first effect was due to an increase in the net earned premium at all businesses, primarily in Private Medical (+PEN 6.0 million) due to higher premiums, and in the Wholesale Lines (+PEN 5.8 million), which was mainly associated with an adjustment in the reinsurance contract 2013/2014 as well as improvements in contract conditions. It is important to note that both businesses posted growth in their net earned premium of 8.2% and 11.7% respectively.
�
The decrease in acquisition costs this quarter was due to the net effect of a drop in the net underwriting expenses (-PEN 12.6 million) and higher commissions (+PEN 2.2 million). The decrease in the net underwriting expenses (-19.2% QoQ) was due to the extraordinary effect in 3Q14 of a release of uncollectible reinsurance in the Wholesale Lines for PEN 11.7 million due to the recovery on a claim made by a client in 2008. Commissions increased primarily in the Vehicle business (+PEN 2.4 million), while the Wholesale Lines posted a decrease (-PEN 1.2 million) along with Private Medical (-PEN 0.9 million). It is important to mention that, if we exclude the extraordinary effect reported in underwriting expenses in 3Q14, the acquisition cost ratio would be 15.1% this quarter versus 15.6% in 2Q14.
�
Finally, the decrease in claims was associated primarily with the Vehicle business and was due to increases in rates and deductibles beginning in mid-2013 and to an adjustment in the public and interprovincial bus portfolio, which tends to post high loss ratios. Additionally, it is important to note that a QoQ improvement was reported in the NEP to loss ratio in all businesses. Company-wide, this ratio fell from 58.8% in 2Q14 to 53.3% in 3Q14.
�
| 40 |
|
�
In summary, the increase in the underwriting result this quarter, which went from PEN 54.4 million in 2Q14 to PEN 84.3 million in 3Q14, was due primarily to an improvement in the underwriting result of Wholesale Lines (+PEN 19.5 million) followed by Vehicle lines (+PEN 3.4).
�
Net financial income reported an increase of +PEN 4.1 million QoQ due to higher gains on sales of securities, particularly equity instruments. The latter was due to profit sharing distribution at Fondo de Inversi�n ENFOCA, after the sale of Maestro.
�
The increase in operating expenses (+PEN 10.3 million) was due primarily to one-off expenses for reorganization in 3Q14 and to provisions that were realized for consultancy fees. These effects generated an increase in the expenses/net earned premium ratio with regard to last quarter (28.3% versus 25.4%).
�
The translation result this quarter was -PEN 4.4 million, which falls below the gain of PEN 0.3 million obtained in 2Q14. Income tax totaled PEN 11.3 million in 3Q14, which tops the PEN 1.5 million posted in 2Q14,
�
The table below contains details on the insurance lines in the Property and Casualty business:
�
Underwriting Result by Business Unit
�
| � | � | 3Q13 | � | � | 2Q14 | � | � | 3Q14 | � | |||||||||||||||||||||||||||||||||||||||
| Underwriting Result by Business
Unit PEN (million) | � | Vehicle Insurance | � | � | Private Health Insurance | � | � | P&C | � | � | TOTAL PPS | � | � | Vehicle Insurance | � | � | Private Health Insurance | � | � | P&C | � | � | TOTAL PPS | � | � | Vehicle Insurance | � | � | Private Health Insurance | � | � | P&C | � | � | TOTAL PPS | � | ||||||||||||
| Net earned premiums | � | � | 88.8 | � | � | � | 71.7 | � | � | � | 52.8 | � | � | � | 213.3 | � | � | � | 89.9 | � | � | � | 73.1 | � | � | � | 49.6 | � | � | � | 212.5 | � | � | � | 92.6 | � | � | � | 79.0 | � | � | � | 55.4 | � | � | � | 227.0 | � |
| Underwriting results | � | � | 8.2 | � | � | � | 12.6 | � | � | � | 30.0 | � | � | � | 50.7 | � | � | � | 20.7 | � | � | � | 10.0 | � | � | � | 23.7 | � | � | � | 54.4 | � | � | � | 24.1 | � | � | � | 16.0 | � | � | � | 43.3 | � | � | � | 83.4 | � |
| Loss ratio | � | � | 64.5 | % | � | � | 73.1 | % | � | � | 32.1 | % | � | � | 59.4 | % | � | � | 55.2 | % | � | � | 77.0 | % | � | � | 38.6 | % | � | � | 58.8 | % | � | � | 49.3 | % | � | � | 70.5 | % | � | � | 35.5 | % | � | � | 53.3 | % |
| Underwriting results / net earned premiums | � | � | 9.2 | % | � | � | 17.6 | % | � | � | 56.7 | % | � | � | 23.8 | % | � | � | 23.0 | % | � | � | 13.7 | % | � | � | 47.9 | % | � | � | 25.6 | % | � | � | 26.0 | % | � | � | 20.3 | % | � | � | 78.2 | % | � | � | 36.7 | % |
�
| i) | The Vehicle line reported an underwriting result of PEN 24.1 million in 3Q14, which represents a 16.4% increase QoQ and 194.4% YoY. This improvement was due primarily to a decrease in claims following an increase in rates and deductibles and a change in the claims’ process, both of which took place in mid-2013. Additionally, the exposure of the public and interprovincial bus portfolio was reduced. These improvements led the loss ratio as a percentage of NEP to fall (49.3% in 3Q13 versus 55.2% in 2Q14). In YoY terms, the improvement in the underwriting result was due primarily to: i) growth in the net earned premium (5.7% YoY), particularly in the Alliances and Bancassurance channels, (ii) a reduction in the loss ratio (from 64.5% in 3Q13 to 49.3% in 3Q14) due to the improvements that were implemented, and (iii) lower commissions. |
�
| ii) | The Private Medical business posted an underwriting result of PEN 16.0 million in 3Q14, which represents a 60.5% increase QoQ and 27.2% YoY. This result was due primarily to an increase in net earned premiums (+PEN 6.0 million), which was associated with higher premium. The average cost of medical services drops QoQ due to an increase in out-patient services, which imply lower costs. This contributed to a decline in the loss ratio, which dropped from 77.0% in 2Q14 to 70.5% in 3Q14. In YoY terms, the increase in the underwriting results was due primarily to a higher premium turnover level on products for individuals and companies. The loss ratio posted an improvement (73.1% in 3Q13 versus 70.5% in 3Q14) due to a decrease in claims frequency in 3Q14. |
�
| iii) | The Property and Casualty business (P&C) posted an underwriting result of PEN 43.3 million in 3Q14, which represents an 82.4% increase QoQ (+PEN 19.6 million) and 44.4% YoY (+PEN 13.3 million).This result was due primarily to a decrease in the acquisition cost due to lower net underwriting expenses QoQ (-PEN13.1 million). The latter was due to extraordinary income in 3Q14 following the release of uncollectible reinsurance as previously mentioned. It is important to note that this business reported QoQ growth in the net premium level of 11.7% (+PEN 5.8 million). This was primarily attributable to an increase in the Fire line and a 15.2% saving in commissions (-PEN 1.2 million), which helped generate a favorable underwriting result. |
�
| 41 |
|
�
With these results, PPS obtained a combined ratio of 91.6% in 3Q14, which can be disaggregated into 53.3 points for net claims, 9.9 points on business acquisition costs, and 28.3 points for operating expenses. This result represents an improvement of 820 basis points with regard to 2Q14, which posted a combined ratio of 99.8%. This quarter’s result can be disaggregated into 58.8 points in net claims, 15.6 points for business acquisition costs, and 25.4 points for general expenses.
�
In the YoY analysis, net income fell 14.9% (-PEN 3.1 million). Nevertheless, this result was primarily associated with a larger loss this quarter due to translation results (–PEN 4.4 million in 3Q14 vs.-PEN 0.4 million in 3Q13) and higher income tax (+PEN 1.3 million). If we compare the results before taxes and exchange rate differences, earnings in 3Q14 totaled PEN 33.7 million, which represents a 6.7% increase with regard to the PEN 31.5 million obtained in 3Q13.
�
The increase in earnings before taxes and translation was due to an improvement in the underwriting result (+PEN 32.6 million YoY). This was in line with the increase in net earned premiums, which was driven by the Private Medical and Vehicle lines, lower acquisition costs, and a decrease in the loss ratio. This mitigated a decrease in financial income (-PEN 29.2 million YoY) due to extraordinary income in 3Q13, which was associated with the sale of real estate assets.
�
Pacifico Vida (PV)
�
Pacifico Vida reported earnings of PEN 39.3 million in 3Q14, which represented a slight increase with regard to the PEN 39.1 million obtained in 2Q14. Nevertheless, the QoQ evolution is primarily due to the translation effect, which generated higher gains QoQ (PEN 6.3 million in 3Q14 vs. PEN 0.8 million in 2Q14). If we exclude translation results, income fell 14% QoQ (PEN 33.0 million in 3Q14 vs. PEN 38.3 in 2Q14). This decrease in earnings, which was due to a drop in the underwriting result and higher operating expenses, was offset by an increase in financial and miscellaneous income.
�
The underwriting result posted a decline of -PEN 10.0 million QoQ due to a decrease in the net earned premium (-PEN 4.3 million), higher acquisition costs (+PEN 4.9 million) and a high loss ratio (+PEN 0.9 million). The first effect was attributable to an increase in the reserves ratio (from 37.8% in 2Q14 to 46.1% in 3Q14), which was due primarily to: i) an increase in the reserves set aside for the Annuities business (+PEN 30.1 million), which was associated with higher premiums, ii) growth in reserves in Individual Life due to higher stock exchange yields, which benefit clients, and iii) an increase in the reserves set aside for Group Life due to higher reserves for Vida Ley (+PEN 3.8 million). Nevertheless, the aforementioned was mitigated by an increase in premium turnover, primarily in Annuities (+PEN 28.3 million), due to an increase in market share and an improvement in sales rate offered.
�
Higher acquisition cost, which is due to higher commissions (+PEN 2.9 million) and an increase in the net underwriting expense (+PEN 2.0 million). Growth in commissions was associated with higher premium turnover in all business lines but particularly in Annuities, Individual Life and Credit Life. It is important to note that the commission to direct premium ratio fell from 24.2% in 2Q14 to 22.7% in 3Q14. The increase in the net underwriting expense was due to a drop in the underwriting income (-PEN 1.2 million) and higher underwriting expenses (+PEN 0.7 million). The decrease in the underwriting income this quarter was due to re-billing in 2Q14 for sales of complementary workers compensation insurance (SCTR by its Spanish initials) products while the increase in underwriting expenses was attributable to higher surrender in Individual Life despite a drop in the bonuses paid to the sales force.
�
Finally, this quarter’s increase in claims (+PEN 0.9 million) was due primarily to higher claims in Credit Life (+PEN 3.7 million) after an adjustment was made in 3Q14 for claims that have been reported out of phase. Nevertheless, this effect was offset by lower claims in the Group Life explained by lower cases received in SCTR and Individual Life.
�
Operating expenses increased 4.1% QoQ (+PEN 1.2 million), which was primarily due an extraordinary provision of PEN 0.8 million that was set aside for a contingency related to Essalud 2009 as well as to higher expenses for system services (+PEN 0.4 million). Nevertheless, the expense ratio fell from 11.0% in 2Q14 to 10.1% in 3Q14 due to higher premium turnover this quarter.
�
Financial income totaled PEN 75.8 million in 3Q14, which represents a 6.1% increase with regard to the PEN 71.4 million posted in 2Q14. This was primarily attributable to higher gains on sales of securities (+PEN 7.5 million) due to a bond sales and the redemption of a deposit in the Bank of America Merrill Lynch. Nevertheless, this effect was offset by lower interest income PEN 1.6 million QoQ) due to a decrease in the inflation rate of PEN 3.7 million for VAC assets and lower dividend income (-PEN 1.7 million).
�
| 42 |
|
��
Pac�fico Vida
�
| Products | � | Total Premiums | � | � | % Change | � | ||||||||||||||
| PEN (million) | � | 3Q13 | � | � | 2Q14 | � | � | 3Q14 | � | � | QoQ | � | � | YoY | � | |||||
| Individual annuity | � | � | 81.1 | � | � | � | 81.4 | � | � | � | 109.7 | � | � | � | 34.8 | % | � | � | 35.2 | % |
| Credit Life | � | � | 57.8 | � | � | � | 64.1 | � | � | � | 66.2 | � | � | � | 3.3 | % | � | � | 14.6 | % |
| Individual life | � | � | 59.2 | � | � | � | 62.0 | � | � | � | 64.3 | � | � | � | 3.7 | % | � | � | 8.6 | % |
| Group life | � | � | 41.6 | � | � | � | 42.4 | � | � | � | 42.7 | � | � | � | 0.7 | % | � | � | 2.6 | % |
| Personal accidents | � | � | 14.1 | � | � | � | 14.5 | � | � | � | 14.8 | � | � | � | 1.9 | % | � | � | 4.8 | % |
| Disability & survivor (Pension) | � | � | 66.3 | � | � | � | 0.6 | � | � | � | 0.5 | � | � | � | -12.5 | % | � | � | -99.2 | % |
| Total | � | � | 320.2 | � | � | � | 265.0 | � | � | � | 298.2 | � | � | � | 12.5 | % | � | � | -6.8 | % |
�
In YoY terms, Pacifico Vida reported earnings of PEN 39.3 million in 3Q14, which was slightly higher than the PEN 38.6 million posted in 3Q13. Nevertheless, the YoY result was attributable to higher translation results (PEN 6.3 million in 3Q14 vs PEN 0.6 million in 3Q13). If we compare results before translation, earnings in 3Q14 were 13.2% lower YoY (PEN 33.0 million in 3Q14 vs. PEN 38.0 in 3Q13). The drop in earnings this quarter was due to i) a lower underwriting result (-PEN 11.4 million), which was attributable to lower net earned premiums as well as higher commissions and underwriting expenses and ii) higher general expenses (+PEN 2.1 million). The aforementioned attenuated the effect of an increase in financial and miscellaneous income.
�
A decrease in net earned premiums was due primarily to lower premium turnover after the contract with Prima AFP expired (-PEN 65.8 million). This occurred despite higher premium turnover in other businesses and in Annuities and Credit Life in particular. More reserves were set aside this quarter to cover an increase in premium turnover in Annuities. The Credit Life and Annuities lines generate the highest commissions.
�
Pacifico Salud EPS
�
EPS reported earnings of PEN 2.7 million in 3Q14, which represents an 82.7% increase with regard to the PEN 1.5 million obtained in 2Q14. This increase in earnings was due primarily to an improvement in the underwriting result (+PEN 2.9 million), which was in turn mainly associated with the complementary workers compensation insurance (SCTR by its Spanish initials) business. Nevertheless this effect was attenuated by an increase in operating expenses (+PEN 0.2 million), which was attributable to a decrease in income from transfer costs and lower net financial income (-PEN 0.2 million).
�
A higher underwriting result was primarily due to a 4.9% QoQ increase in premium turnover (+PEN 9.1 million), where the SCTR line reported significant growth (+22.7%) with regard to 2Q14 due to additional contributions for July gratuities. This effect mitigated an increase in claims (+PEN 4.7 million, which was registered primarily in Regular lines (+PEN 4.5 million) given an increase in the average cost of medical cases. Nevertheless, and despite higher claims, the loss ratio fell from 85.2% in 2Q14 to 83.6% in 3Q14 due to higher premium turnover.
�
The translation result was -PEN 0.4 million versus a loss of PEN 0.07 million in 2Q14 while income tax totaled PEN 1.6 million, which represents a 157.0% increase with regard to the PEN 0.6 million reported in 2Q14 (due primarily to higher earnings).
�
In YoY terms, net earnings dropped 24.6% (-PEN 0.9 million) due to a decrease in the underwriting result (-PEN 1.3 million), higher general expenses (+PEN 1.1 million), and a lower translation result (-PEN 0.7 million). Nevertheless, the aforementioned was mitigated by higher financial income (+PEN 0.3 million) and lower income tax this quarter (-PEN 1.8 million), which was primarily due to lower earnings and provisions.
�
The drop in the underwriting result was due to an increase in claims (+PEN 25.4 million), which was due primarily to an increase in the average cost of medical cases. This effect was mitigated, in large part, by higher premium turnover (+PEN 24.7 million) in both the Regular and Obligatory lines such as SCTR, which posted growth of 14.8% and 13.0% respectively.
�
| 43 |
|
�
Medical Subsidiaries
�
The medical subsidiaries reported earnings before minority interest of PEN 1.1 million in 3Q14, which represents a 475% increase with regard to the PEN 0.2 million posted in 2Q14. This improvement was due primarily to an increase in the underwriting result, which was in turn attributable to a higher gross margin (27.4% in 2Q14 versus 29.3% in 3Q14) and a 19.9% QoQ decrease in financing charges due to debt capitalization for PEN 21.0 million. Nevertheless, this effect was attenuated by an increase in general expenses (+PEN 0.9 million), which was mainly associated with recognition of extraordinary expenses stemming from litigation (PEN.0.4 million) and auditing adjustments (PEN 0.3 million).
�
| � | � | Quarter | � | � | % Change | � | ||||||||||||||
| PEN (000) | � | 3Q13 | � | � | 2Q14 | � | � | 3Q14 | � | � | QoQ | � | � | YoY | � | |||||
| Underwritting result | � | � | 25,111 | � | � | � | 32,976 | � | � | � | 35,997 | � | � | � | 9 | % | � | � | 43 | % |
| Financial income * | � | � | 326 | � | � | � | 1,048 | � | � | � | -382 | � | � | � | -136 | % | � | � | -217 | % |
| Operating expense | � | � | 28,296 | � | � | � | 31,362 | � | � | � | 32,293 | � | � | � | 3 | % | � | � | 14 | % |
| Income before minority interest | � | � | -1,967 | � | � | � | 221 | � | � | � | 1,327 | � | � | � | 501 | % | � | � | -167 | % |
| Net income | � | � | -1,784 | � | � | � | 199 | � | � | � | 1,143 | � | � | � | 475 | % | � | � | -164 | % |
�* Considers Other income.
�
| 44 |
|
�
�
VIII. Prima AFP
�
| Main financial indicators | � | Quarter | � | � | % Change | � | � | Year to date | � | � | % Change | � | ||||||||||||||||||||
| PEN (000) (1) | � | 3T13 | � | � | 2Q13 | � | � | 3Q14 | � | � | QoQ | � | � | YoY | � | � | Sep 13 | � | � | Sep 14 | � | � | Sep 14 / Sep 13 | � | ||||||||
| Fee income | � | � | 95,797 | � | � | � | 92,370 | � | � | � | 98,312 | � | � | � | 6.4 | % | � | � | 2.6 | % | � | � | 274,681 | � | � | � | 287,930 | � | � | � | 4.8 | % |
| Administrative and sale expenses | � | � | (36,284 | ) | � | � | (34,475 | ) | � | � | (36,391 | ) | � | � | 5.6 | % | � | � | 0.3 | % | � | � | (112,213 | ) | � | � | (106,322 | ) | � | � | -5.2 | % |
| Depreciation and amortization | � | � | (4,902 | ) | � | � | (5,050 | ) | � | � | (5,043 | ) | � | � | -0.1 | % | � | � | 2.9 | % | � | � | (14,240 | ) | � | � | (15,108 | ) | � | � | 6.1 | % |
| Net operating income | � | � | 54,611 | � | � | � | 52,846 | � | � | � | 56,878 | � | � | � | 7.6 | % | � | � | 4.2 | % | � | � | 148,228 | � | � | � | 166,500 | � | � | � | 12.3 | % |
| Other income and expenses, net | � | � | (1,612 | ) | � | � | 4,459 | � | � | � | (763 | ) | � | � | -117.1 | % | � | � | -52.7 | % | � | � | (2,401 | ) | � | � | 3,069 | � | � | � | -227.8 | % |
| Income tax | � | � | (17,777 | ) | � | � | (16,613 | ) | � | � | (18,961 | ) | � | � | 14.1 | % | � | � | 6.7 | % | � | � | (44,492 | ) | � | � | (53,605 | ) | � | � | 20.5 | % |
| Net income before translation results | � | � | 35,221 | � | � | � | 40,692 | � | � | � | 37,154 | � | � | � | -8.7 | % | � | � | 5.5 | % | � | � | 101,335 | � | � | � | 115,963 | � | � | � | 14.4 | % |
| Translations results | � | � | (186 | ) | � | � | 96 | � | � | � | 209 | � | � | � | 118.1 | % | � | � | -212.4 | % | � | � | 2,800 | � | � | � | 314 | � | � | � | -88.8 | % |
| Net income | � | � | 35,035 | � | � | � | 40,787 | � | � | � | 37,363 | � | � | � | -8.4 | % | � | � | 6.6 | % | � | � | 104,135 | � | � | � | 116,277 | � | � | � | 11.7 | % |
| ROAE (2) | � | � | 31.7 | % | � | � | 34.8 | % | � | � | 29.0 | % | � | � | - | � | � | � | - | � | � | � | 32.6 | % | � | � | 31.4 | % | � | � | - | � |
| Total assets | � | � | 761,142 | � | � | � | 781,871 | � | � | � | 844,349 | � | � | � | 8.0 | % | � | � | 10.9 | % | � | � | � | � | � | � | � | � | � | � | � | � |
| Total liabilities | � | � | 303,136 | � | � | � | 286,870 | � | � | � | 308,820 | � | � | � | 7.7 | % | � | � | 1.9 | % | � | � | � | � | � | � | � | � | � | � | � | � |
| Net shareholders' equity | � | � | 458,006 | � | � | � | 495,001 | � | � | � | 535,529 | � | � | � | 8.2 | % | � | � | 16.9 | % | � | � | � | � | � | � | � | � | � | � | � | � |
(1) IFRS.
(2) Net shareholder's equity include unrealized gains from Prima's investment portfolio.
�
In the third quarter of 2014, Prima AFP’s net income was PEN 37.4 million, which represents an excellent return on equity of 29%. Nevertheless, it is important to note that earnings were down 8.4% with regard to 2Q14 (PEN 40.8 million), which incorporated the effect of gains on the sale of real estate property for PEN 5.6 million (other income) and a reversal of PEN 2.0 million on income tax provisions for 2013. If we exclude extraordinary income from 2Q, earnings increase 7.5% QoQ due to a 6.4% increase in fee income QoQ that was attenuated by higher expenditure for personnel cuts in the sales force (dismissals) and more provisions for employee profit sharing.
�
The table below contains information on the main indicators for Prima AFP and the SPP:
�
| � | � | PRIMA | � | � | System | � | � | % Share | � | � | PRIMA | � | � | System | � | � | % Share | � | ||||||
| Quarterly main indicators and market share | � | 2Q14 | � | � | 2Q14 | � | � | 2Q14 | � | � | 3Q14 | � | � | 3Q14 | � | � | 3Q14 | � | ||||||
| Affiliates | � | � | 1,465,058 | � | � | � | 5,593,435 | � | � | � | 26.2 | % | � | � | 1,462,728 | � | � | � | 5,681,955 | � | � | � | 25.7 | % |
| New affiliations (1) | � | � | 277 | � | � | � | 66,275 | � | � | � | 0.4 | % | � | � | 189 | � | � | � | 101,335 | � | � | � | 0.2 | % |
| Funds under management (PEN million) | � | � | 34,670 | � | � | � | 108,499 | � | � | � | 32.0 | % | � | � | 35,606 | � | � | � | 110,947 | � | � | � | 32.1 | % |
| Collections (PEN million) (1) | � | � | 695 | � | � | � | 2,013 | � | � | � | 34.5 | % | � | � | 684 | � | � | � | 2,041 | � | � | � | 33.5 | % |
| Voluntary contributions (PEN million) | � | � | 249 | � | � | � | 570 | � | � | � | 43.6 | % | � | � | 249 | � | � | � | 575 | � | � | � | 43.3 | % |
| RAM (PEN million) (2) | � | � | 2,049 | � | � | � | 6,003 | � | � | � | 34.1 | % | � | � | 2,036 | � | � | � | 6,111 | � | � | � | 33.3 | % |
Source: Superintendencia de Banca, Seguros y AFP.
(1) Accumulated to the Quarter. Prima AFP's new affiliations correspond to fishing workers
(2) PRIMA AFP estimates: average of aggregated income during the last 4 months excluding special collections and voluntary contribution fees.
Source: Compiled by authors
�
Commercial Results
�
At the end of 3Q14, there were 5.7 million affiliates in the SPP. At the end of the third quarter of 2014 new affiliations to the System totaled 101,335, which represents growth of 52.9% with regard to 2Q14’s capture level. This increase was due to the Law N� 29903 / Law N� 30082 (came into effect as of August 1st), which stipulates that independent workers (approximately 38,000 new affiliates) must make obligatory contributions to the pension system. It is important to note that on September 18, 2014, this law was repealed by the government (Law N�30237).Additionally, SBS Resolution N� 6568-2014, which was published in October, outlined the mechanisms to be used if an independent affiliate should request reimbursement of the contributions made.
�
At the end of September 2014, Prima AFP’s funds under management totaled PEN 35, 606 million, which represents 32.1% of the System’s total. In comparison with the second quarter (PEN 34, 670 million), the company’s portfolio under management reflected growth of 2.3%.
�
Collections of new contributions to Prima AFP’s funds under management totaled PEN 684 million in the third quarter of the year, which represents 33.5% of the SPP’s total collections. According to the company’s estimates, this 1% decrease in market share with regard to 2Q14 was due primarily to an increase in the competition’s collections in different segments of the obligatory contributions’ market such as Recognition Bonds, additional capital – insurance, among others, which should be considered ad hoc events. It is important to note that the concepts listed above are not linked to monthly insurable remuneration, which is AFPs’ source of commissions. As such, this minimal drop in market share did not affect the company’s results.
�
| 45 |
|
�
In terms of the RAM indicator (monthly insurance remuneration, the AFPs’ income base), the company reported a level of PEN2, 036 million at the end of September 2014 with a market share of 33.3%. In comparison to last quarter, market share fell 0.8%. This decline was due to an increase in the market share held by the AFP that won the tender process that gave it exclusive rights to all new affiliates.
�
Investments
�
In terms of the international ambit, in the third quarter of this year, relevant differences were observed in the evolution of the world’s main regions. The Federal Reserve of the United States continued to make progressive cuts in its monetary stimulus package in a context of lower growth rates in 2014. On the other hand the European Central Bank (ECB) continued to implement expansive monetary policy measures in a scenario marred by lower-than-expected economic indicators. Finally, China’s economy showed slight signs of recovery. Nevertheless, the uncertainty surrounding its future evolution remains.
�
On the local scene, the indicators for economic activity continued a downward trend. This is evident in economic figures, which have fallen below estimates.
�
Low levels of growth are expected to continue over the remainder of the year. Nevertheless, in 2015, an improvement is expected due to: the execution of projects in the mining and infrastructure sector; the increase in exports; higher expenditure and investment at the government level; among others. The Central Reserve Bank of Peru (BCRP) reduced its reference rate on two occasions for a total of 0.50% to reach a level of 3.50%. The entity’s announcement indicated that this decision was not meant to indicate the beginning of a sequence of reductions but that BCRP had not ruled out the possibility of continuing with this expansive measure if necessary.
�
During the third quarter of 2014, the local market’s evolution was negative. The General Index of the Lima Stock Exchange (IGBVL) drew back 2.6% due to a drop in the prices for commodities and for the shares of the most important global mining companies. Uncertainty regarding growth in the Chinese economy had a negative effect on different assets associated with emerging markets. In this context, Prima AFP continues to make efforts to diversify and optimize its investment portfolios to obtain better levels of risk-adjusted profitability.
�
The aforementioned factors had an effect on the profitability of our funds under management. Over the last 12 months (September 2014/September 2013) obtained nominal profitabilities of 7.9%, 10.5% and 9.5% for Funds 1, 2 and 3 respectively. In this context, Prima AFP ranks second in Fund 1 and first in Funds 2 and 3 within the system’s profitability ranking.
�
If we analyze a longer time frame, which includes the period ranging from SPP’s creation to the date on which this report was compiled (2014 / 1994), the nominal annualized profitability of the funds managed by the AFP for Fund 25 was12.0% in nominal terms and 7.4% in real terms.
�
The following table shows the structure of the portfolio managed by Prima AFP at the end of the third quarter of 2014:
�
| Funds under management as of September 2014 | � | Jun 14 | � | � | % Share | � | � | Sep 14 | � | � | % Part | � | ||||
| Fund 1 | � | � | 4,076 | � | � | � | 11.8 | % | � | � | 4,212 | � | � | � | 11.8 | % |
| Fund 2 | � | � | 22,801 | � | � | � | 65.8 | % | � | � | 23,447 | � | � | � | 65.9 | % |
| Fund 3 | � | � | 7,793 | � | � | � | 22.5 | % | � | � | 7,947 | � | � | � | 22.3 | % |
| Total PEN million | � | � | 34,670 | � | � | � | 100.0 | % | � | � | 35,606 | � | � | � | 100 | % |
Source: Superintendencia de Banca, Seguros y AFP.
�
5Oldest information available www.sbs.gob.pe
�
| 46 |
|
�
Financial Results
�
Income
�
Prima AFP’s fee income in the third quarter totaled PEN 98.3million, which represents an increase of 6.4% QoQ and 2.6% YoY. This increase in income was due primarily to income deferral, which totaled PEN 5.4million in 2Q14 and PEN 0.8 million in 3Q14. If we exclude this effect, income growth in 3Q14 versus 2Q14 would be 1.5%. Provisions for income deferral have been set aside to cover a future scenario in which some affiliates may stop paying commissions to the AFP but will, nonetheless, continue to receive administration services for their pension funds (this is the case of non-contributors and pensioners). The amount of this deferral is calculated by applying a discount (present value) to the figure forecasted for expenses relative to the administration services provided to the aforementioned individuals. Prima updates its forecasts every quarter and any difference in the result, whether positive of negative, is reported on the Income Statement on the income line.
�
To analyze the company’s income it is necessary to consider the current commission schemes available to affiliates (one of the two options below must be chosen):
�
| i) | Commission for flow: 1.60% applied to the affiliates’ monthly remuneration. |
�
| ii) | Mixed Commission: Mixed commission: composed of a flow commission of 1.51%, which is applied to affiliates’ monthly remuneration, plus a commission of 1.25% a year, which is applied to the new balance (generated as of February 2013 for new affiliates to the system and beginning in June 2013 for old affiliates who have chosen this commission scheme). |
�
Expenses
�
Administration and sales expenses in 3Q14 totaled PEN 36.4million, which represented a 5.6% increase with regard to last quarter that was primarily attributable to higher expenditures for administration and sales staff (dismissals, employee profit sharing).
�
Expenses for depreciation and amortization held steady at PEN 5.0 million, mirroring last quarter’s result. These expenses include charges of amortization of intangible assets (obtained during the merger with Union Vida) as well as depreciation and amortization for real estate, equipment and systems.
�
In the third quarter of 2014, operating income totaled PEN 56.9 million. This 7.6% increase QoQ was associated with higher earnings this quarter. The YoY operating results reveal growth of 4.2%.
�
In terms of other income and expenses, the decrease in income QoQ was due to real estate sold in 2Q14that generated a profit of PEN 5.6 million. No such sales were recorded in 3Q14. After incorporating this effect and the effect of income tax, net income totaled PEN 37.4 million, which represents an 8.4% decline QoQ and 6.6% growth YoY.
�
In 3Q14, average return on equity (ROAE)6 was situated at 29.0% whereas in January-September 2014, Prima AFP’s ROAE reached 31.4%.
If we isolate the extraordinary effects that have occurred thus far this year (adjustments for income deferral, reversal for income tax and income from real estate sales), Prima AFP’s ROAE would be 31.0% and 32.2% for 3q14 and 2Q14 respectively.
�
At the end of September 2014, Prima reported an asset level of PEN 844.3 million, net shareholders’ equity of PEN535.5 million and liabilities for PEN 308.8 million.
�
Other relevant aspects
�
According to Law N� 29903 / Law N� 30082, as of August 01, 2014, independent workers born after August 1973 are required to make obligatory contributions to one of the two pension systems currently in place (AFP or ONP). Due to this legislation, the volume of new affiliates to the SPP this quarter was higher than in previous periods. Nevertheless, on September 18, 2014, Law N� 30237 went into effect and repealed the aforementioned law. This new legislation stipulates that independent workers can voluntarily, rather than obligatorily, choose to affiliate to the SPP or ONP.
�
2 Calculation of ROAE over total equity (including unrealized gains on reserves).
�
| 47 |
|
�
The obligatory contributions that were collected to comply with the norms that were eventually repealed must be returned or included in the pension calculation recognition scheme chosen by the independent worker.
�
SBS Resolution N� 6568-2014 stipulates the mechanism that will be applied to return these contributions.
�
Notification N�032-2014-BCRP, from the Board of BCRP, has approved a move to increase the investment limit that pensions funds managed by AFPs can invest in instruments issued by governments, financial entities and non-financial entities that conduct the majority of their economic activities abroad. This increase in the foreign investment limit, from 40% to 42%, will take place gradually beginning on October 01, 2014 and ending on January 01, 2015 (increase of 0.5% each month). This provision went into effect on September 18th of this year.
�
| 48 |
|
�
IX. Economic Outlook
�
(This report presents information gathered at the end of 2Q14 given that 3Q14’s information is published by BCRP after November 15th).
�
In 2Q14, the economy reported growth of 1.7% YoY, which represents a decline with regard to the figure posted in 1Q14 (5.1%) and constitutes the lowest expansion posted since 3Q09 (-0.2%). Internal demand grew only 2.2% (1Q14: 4.0%), which is the lowest rate registered in the last five years (4Q09: -1.0%).
�
The main driver of deceleration in 2Q14 was the external factor given that exports dropped 5.1% YoY (which caused the figure for GDP growth to fall 1.2 pp.). This situation was attributable to a decrease in exports of traditional products, particularly from the mining sector. Private investment continued to decelerate and fell to 3.9% in 2Q14 (1Q14: 0.9%), which led to a 0.9 pp. drop in growth. Public expenditure fell 4.5% (1Q14: 7.9%) during the same period, which led to a 0.2 pp. drop QoQ. The latter was due to the low level of execution of public works at the regional government level (-23.9%). In a context marked by a decrease in the dynamism of investment and exports, lower growth was posted in private consumption, which went from expanding 5.1% in 1Q14 to growing 4.2% in 2Q14.
�
In July and August, economic activity grew 1.2% on average YoY, while the non-primary sectors posted 1.8% growth YoY. The economy registered accumulated growth of 2.8% in the first eight months of the year and 4.1% in the last twelve months. In September, the economy accelerated and more than likely expanded more than 2% YoY due to: i) electricity production grew 5.4% (above the 4.8% registered in August), ii) internal cement consumption increased 4.5% after two consecutive months of decline, iii) new vehicle sales fell 4.2%, which represents the smallest decline posted thus far this year, iv) the real average for floating capital grew 7.4%, which is the year’s highest figure, v) public investment grew 13.2% in real terms, bouncing back from the 7.3% decline posted in August 2014, and vi) the indicator for production expectations reached its highest level in the past seven months in September 2014.
�
Nevertheless, and despite the fact that better results are expected in September, growth in 3Q14 will be similar to that posted in 2Q14 (1.7% YoY), while expansion may be close to 3.0% in 4Q14, if recovery is posted in public investment, mining production and expectations. In this context, growth at year-end in 2014 may situate close to 3.0%.
�
In 2015, the economy is expected to grow 5% due to the following factors: i) production normalization or start-up at new copper mines (Toromocho, Constancia, Antamina), ii) higher investment in infrastructure for projects that have already been awarded (Line 2 of the Metro, the Southern Peruvian Gas Pipeline, and the Talara Refinery), iii) higher growth in the economies of Peru’s main trading partners (particularly the United States), and iv) an increase in the impact generated by expansive monetary and fiscal policies in 2015 (the Central Reserve Bank reduced its reference rate on two occasions this year to 3.5% and the Ministry of Economy and Finance has implemented a contra-cyclical package for 1% of GDP). We have not ruled out the possibility that the Government may take additional measures this year to stimulate the economy in 2015.
�
GDP Growth
(% change YoY)
�
�
�
| 49 |
|
�
External Sector
�
The deficit in the current account in 2Q14 totaled USD 3,469 MM (6.8% of GDP). This was due, in large part, to the trade deficit (USD -1,424 MM), which was in turn mainly attributable to lower prices for exports (copper and gold) and a decrease in the number of exports of traditional products.
�
In 2Q14, exports fell 10.6% (-5.8% in terms of prices and -5.1% in volume). The transitory factors that affected the economy in 2Q14 (production delays at mines and climate problems) had a negative effect on the volume of exports of traditional products (metals:-16.0%, agriculture:
-5.1%), which led the deficit to situate at close to 3.0 pp as a percentage of GDP. Part of the current account’s deficit was financed by the financial account (4.7% of GDP).
�
In August the trade deficit totaled USD 311 MM, which is lower than the figure posted in July (USD -395 MM). Exports fell 21.1% in August due to a decrease in volumes (-19.7%).This represents the most significant decline registered this year. The drop in export volumes was attributable to a decrease in shipments of gold (-40.6%), copper (-8.8%) and zinc (-20.0%). Imports fell 9.4% due to a drop in volumes (-8.4%). This result was attributable to a decrease in imports of capital goods (-13.2%) and durable consumer goods (-11.1%). In the first eight months of the year the trade balance registered a deficit of USD 2,655 MM, which is considerably higher than the deficit posted for the same period last year (USD -677 MM).
�
Going forward, we expect the current account deficit to drop given that new mining projects are slated to begin. In this scenario, and according to the Central Bank’s estimates, the current account deficit will gradually fall from approximately 5.0% in 2014 to 4.0% in 2016.
�
| Exports and Imports | Current Account Balance |
| (3 month moving average var. annual %.) | (% of GDP, four quarter average) |
| � | � |
 � � |
� |
| � | � |
| Source: BCRP | Source: BCRP |
�
Prices and the Exchange Rate
�
The Consumer Price Index (IPC) in Metropolitan Lima increased 0.16% MoM in September. The accumulated IPC for the first eight months of the year was situated at 2.75% while annual inflation weighed in with 2.74% at the end of September. This figure fell within BCRP’s target range (2.0% +/- 1pp.).
�
In coming months, annual inflation will remain in the upper limit of the Central Bank’s target range. In this scenario, inflation will situate at around 3.0% at year-end. In 2015, we expect inflation to converge with at the mid-point of the target range due to the negative product gap, lower import prices, and depreciatory pressures, which will be contained by BCRP’s interventions.
�
| 50 |
|
�
Given that the upward pressures on inflation moderated, and that the economy showed no signs of robust recovery, the BCRP reduced the reference rate again in September (from 3.75% to 3.50%) and maintain this rate in October. According to the entity’s announcement, the current rate is consistent with an inflation rate within the target range at the end of 2014 and which will converge at 2.0% in 2015. This decision was based on the fact that: i) advanced and current indicators of economic activity show that it is still growing below its potential, ii) the expectations of inflation remain within the target range, iii) there are mixed signals of recovery in the global economy and more volatility in the financial markets; and iv) the price shocks that increased inflation have since moderated. In a context marked by a negative product gap and an inflation rate that converges with the target, we do not rule out the possibility that the BCRP will cut the reference rate again before year-end to offset the weak fiscal stimulus provided by public investment.
�
After behaving in a relatively stable manner for twelve months, the exchange rate began to show an upward trend in mid-August. In this context, local currency depreciated 3.73% in the period from August 15- October 15. By period-end, the exchange rate was situated at USD-PEN 2.905, which represents the highest level recorded since November 2009. The main reason behind this variation is the fact that the US dollar is strengthening worldwide. As such, the depreciation seen in Peru’s exchange market was not an isolated event given that the majority of the currencies in the region experienced a similar evolution. In this scenario, the Central Bank (BCRP) intervened in the market on an ad hoc basis. Initially, it purchased dollars to maintain the exchange rate above USD-PEN 2.79 then shortly after intervened to head off a rapid depreciation.
�
In a context marked by expectations that the Fed will raise its rates in 2015; the on-going strengthening of the dollar worldwide; and a deficit in the current account of the balance of payments, it is likely that the PEN will be allowed to continue depreciating against the US Dollar. Nevertheless, the Central Reserve Bank will moderate the speed of depreciation to prevent negative impacts on the balance sheet of the economy, which is still highly dollarized in some segments. With these actions, the Nuevo Sol will remain one of region’s least volatile currencies.
�
| Consumer Price Index | Exchange Rate end of Period |
| (Variations in annual percentages) | (PEN for US$) |
| � | � |
 � � |
 |
| � | � |
| Source: BCRP | Source: BCRP |
�
Fiscal Sector
�
In September, the non-financial public sector registered a surplus of PEN 125 MM, which falls by PEN 744 MM below the figure reported for the same period last year. This result was attributable to an increase in non-financial expenditures at the general government level (9.8% in real terms)and to a slight increase in the general government’s current revenues, which increased 0.8%.
�
The general government’s current revenues totaled PEN 10,105 MM in September due to an increase in tax collections (1.0%) and non-tax collections (0.4%). The general government’s expenditures totaled PEN 9,619 MM following an increase in current expenditures (9.9%) and capital expenditures (9.4%). During this period, increases were registered at all three government levels (national government: 10.6%, regional government: 7.3%, local government: 9.8%).
�
| 51 |
|
�
In January-September 2014, the accumulated fiscal surplus was PEN 10,259 MM, which falls below the level observed for the same period last year (PEN 13,390 MM).
�
At year end, we expect a slight fiscal surplus of around 0.2% of GDP and a deficit of around 0.3% of GDP in 2015. Public debt should be approximately 19.2% of GDP this year and 18.6% the next.
�
| Economic Result | Public Debt |
| (% of GDP, four quarter average) | (% of GDP) |
| � | � |
 � � |
�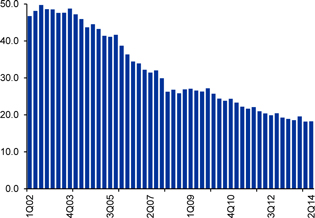 |
| � | � |
| Source: BCRP | Source: BCRP |
�
Financial Sector
�
Thus far this year, the private lending sector has posted moderate growth. In this context, total loans went from expanding 14.0% in January, to growing 12.7% in August (the lowest rate since July 2013). Loans continue to post differentiated evolutions in Nuevos Soles and US Dollars, which registered growth of 19.2% and 3.9% respectively. This behavior has been induced by the measures that BCRP has taken with regard to legal reserve requirements in local currency, which fell from 20.0% in June 2013 to 10.5% in October 2014. BCRP has released slightly more than PEN 10,000 MM in liquidity since June 2013, which has dynamized the loan market in Nuevos Soles while achieving the dedollarization sought by the monetary authority.
�
By borrower, type loans to businesses expanded 12.9%. This is 2.0 pp lower than the result registered in July 2014 (15.0%). Consumer and home loans continued to poste moderate growth and reported rates of 11.8% YoY and 13.2%YoY respectively.
�
| 52 |
|
�
Private Sector Lending
(% Var. YoY)
�
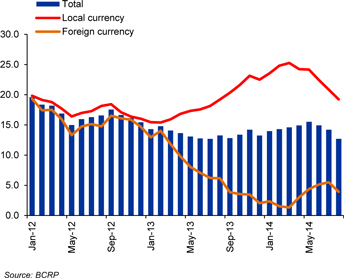 �
�
�
Main Economic Indicators
�
| � | � | 2012 | � | � | 2013 | � | � | 2014 | � | |||||||||||||||||||||||
| � | � | Year | � | � | IQ | � | � | IIQ | � | � | IIIQ | � | � | IVQ | � | � | Year | � | � | IQ | � | � | IIQ | � | ||||||||
| GDP (US$ MM) | � | � | 192,933 | � | � | � | 48,092 | � | � | � | 50,906 | � | � | � | 49,569 | � | � | � | 53,752 | � | � | � | 202,319 | � | � | � | 47,986 | � | � | � | 51,191 | � |
| Real GDP (var. %) | � | � | 6.0 | � | � | � | 4.3 | � | � | � | 6.2 | � | � | � | 5.2 | � | � | � | 7.2 | � | � | � | 5.8 | � | � | � | 5.1 | � | � | � | 1.7 | � |
| GDP per-capita (US$) | � | � | 6,387 | � | � | � | 6,334 | � | � | � | 6,690 | � | � | � | 6,500 | � | � | � | 7,032 | � | � | � | 6,639 | � | � | � | 6,264 | � | � | � | 6,668 | � |
| Domestic demand (var. %) | � | � | 8.0 | � | � | � | 10.0 | � | � | � | 7.1 | � | � | � | 5.0 | � | � | � | 6.3 | � | � | � | 7.0 | � | � | � | 4.0 | � | � | � | 2.2 | � |
| Consumption (var. %) | � | � | 6.1 | � | � | � | 5.0 | � | � | � | 5.3 | � | � | � | 5.1 | � | � | � | 5.9 | � | � | � | 5.3 | � | � | � | 5.1 | � | � | � | 4.2 | � |
| Private Investment (var. %) | � | � | 16.3 | � | � | � | 11.4 | � | � | � | 12.8 | � | � | � | 6.7 | � | � | � | 1.4 | � | � | � | 7.5 | � | � | � | 1.8 | � | � | � | -4.0 | � |
| CPI (annual change, %) | � | � | 2.6 | � | � | � | 2.59 | � | � | � | 2.77 | � | � | � | 2.83 | � | � | � | 2.86 | � | � | � | 2.9 | � | � | � | 3.38 | � | � | � | 3.45 | � |
| Exchange rate, eop (S/. per US$) | � | � | 2.55 | � | � | � | 2.59 | � | � | � | 2.78 | � | � | � | 2.78 | � | � | � | 2.80 | � | � | � | 2.80 | � | � | � | 2.81 | � | � | � | 2.80 | � |
| Devaluation (annual change, %) | � | � | -5.4 | � | � | � | -2.97 | � | � | � | 4.19 | � | � | � | 7.07 | � | � | � | 9.63 | � | � | � | 9.63 | � | � | � | 8.50 | � | � | � | 0.47 | � |
| Exchange rate, average (S/. per US$) | � | � | 2.63 | � | � | � | 2.59 | � | � | � | 2.75 | � | � | � | 2.78 | � | � | � | 2.79 | � | � | � | 2.73 | � | � | � | 2.81 | � | � | � | 2.80 | � |
| Non-Financial Public Sector (% of GDP) | � | � | 2.3 | � | � | � | 6.5 | � | � | � | 4.1 | � | � | � | -0.1 | � | � | � | -5.7 | � | � | � | 0.9 | � | � | � | 6.1 | � | � | � | 3.2 | � |
| Central government current revenues (% of GDP) | � | � | 19.1 | � | � | � | 20.4 | � | � | � | 19.6 | � | � | � | 17.9 | � | � | � | 17.8 | � | � | � | 18.9 | � | � | � | 20.8 | � | � | � | 19.6 | � |
| Tax Income (% of GDP) | � | � | 16.5 | � | � | � | 17.5 | � | � | � | 16.6 | � | � | � | 15.7 | � | � | � | 15.7 | � | � | � | 16.3 | � | � | � | 19.6 | � | � | � | 17.8 | � |
| Non Tax Income (% of GDP) | � | � | 2.6 | � | � | � | 2.9 | � | � | � | 3.0 | � | � | � | 2.2 | � | � | � | 2.1 | � | � | � | 2.5 | � | � | � | 3.1 | � | � | � | 2.8 | � |
| Current expenditures (% of GDP) | � | � | 12.4 | � | � | � | 11.0 | � | � | � | 11.5 | � | � | � | 13.6 | � | � | � | 14.9 | � | � | � | 12.8 | � | � | � | 12.4 | � | � | � | 14.0 | � |
| Capital expenditures (% of GDP) | � | � | 4.4 | � | � | � | 3.2 | � | � | � | 3.9 | � | � | � | 5.6 | � | � | � | 5.8 | � | � | � | 4.7 | � | � | � | 4.1 | � | � | � | 4.0 | � |
| Trade Balance (US$ MM) | � | � | 5,232 | � | � | � | 48 | � | � | � | -525 | � | � | � | 16 | � | � | � | 422 | � | � | � | -40 | � | � | � | -608 | � | � | � | -1,424 | � |
| Exports (US$ MM) | � | � | 46,367 | � | � | � | 10,278 | � | � | � | 10,004 | � | � | � | 11,143 | � | � | � | 10,752 | � | � | � | 42,177 | � | � | � | 9,349 | � | � | � | 8,945 | � |
| Imports (US$ MM) | � | � | 41,135 | � | � | � | 10,230 | � | � | � | 10,529 | � | � | � | 11,128 | � | � | � | 10,331 | � | � | � | 42,217 | � | � | � | 9,957 | � | � | � | 10,369 | � |
| Current Account Balance (US$ MM) | � | � | -6,281 | � | � | � | -2,696 | � | � | � | -2,593 | � | � | � | -2,742 | � | � | � | -1,095 | � | � | � | -9,126 | � | � | � | -2,717 | � | � | � | -3,469 | � |
| Current Account Balance (% of GDP) | � | � | -3.3 | � | � | � | -5.6 | � | � | � | -5.1 | � | � | � | -5.5 | � | � | � | -2.0 | � | � | � | -4.5 | � | � | � | -5.7 | � | � | � | -6.8 | � |
Source: BCRP. Data subject to revision.
�
| 53 |
|
�
Company Description:
�
Credicorp Ltd. (NYSE: BAP) is the leading financial services holding company in Peru. It primarily operates via its four principal Subsidiaries: Banco de Cr�dito del Peru (BCP), Atlantic Security Holding Corporation (ASHC), El Pac�fico-Peruano Suiza Compa��a de Seguros y Reaseguros (PPS) and Grupo Credito. Credicorp is engaged principally in commercial banking (including trade finance, corporate finance and leasing services), insurance (including commercial property, transportation and marine hull, automobile, life, health and pension fund underwriting insurance) and investment banking (including brokerage services, asset management, trust, custody and securitization services, trading and investment). BCP is the Company's primary subsidiary.
�
Safe Harbor for Forward-Looking Statements
�
This material includes “forward-looking statements” within the meaning of Section 21E of the Securities Exchange Act of 1934. All statements other than statements of historical information provided herein are forward-looking and may contain information about financial results, economic conditions, trends and known uncertainties.
�
The Company cautions readers that actual results could differ materially from those expected by the Company, depending on the outcome of certain factors, including, without limitation: (1) adverse changes in the Peruvian economy with respect to the rates of inflation, economic growth, currency devaluation, and other factors, (2) adverse changes in the Peruvian political situation, including, without limitation, the reversal of market-oriented reforms and economic recovery measures, or the failure of such measures and reforms to achieve their goals, and (3) adverse changes in the markets in which the Company operates, including increased competition, decreased demand for financial services, and other factors. Readers are cautioned not to place undue reliance on these forward-looking statements, which speak only as of the date hereof.
�
The Company undertakes no obligation to release publicly the result of any revisions to these forward-looking statements which may be made to reflect events or circumstances after the date hereof, including, without limitation, changes in the Company’s business strategy or planned capital expenditures, or to reflect the occurrence of unanticipated events.
�
| 54 |
|
�
CREDICORP LTD. AND SUBSIDIARIES
CONSOLIDATED BALANCE SHEETS
(In PEN thousands, IFRS)
�
| � | As of | � | % Change | � | ||||||||||||||||
| � | Sep 13 | � | Jun 14 | � | Sep 14 | � | QoQ | � | YoY | � | ||||||||||
| ASSETS | � | � | � | � | � | � | � | � | � | � | � | � | � | |||||||
| Cash and due from banks | � | � | � | � | � | � | � | � | � | � | � | � | � | � | � | � | � | � | � | � |
| Non-interest bearing | � | � | 2,625,501 | � | � | � | 3,481,347 | � | � | � | 3,563,714 | � | � | � | 2.4 | % | � | � | 35.7 | % |
| Interest bearing | � | � | 18,877,453 | � | � | � | 19,627,203 | � | � | � | 20,739,067 | � | � | � | 5.7 | % | � | � | 9.9 | % |
| Total cash and due from banks | � | � | 21,502,954 | � | � | � | 23,108,550 | � | � | � | 24,302,780 | � | � | � | 5.2 | % | � | � | 13.0 | % |
| � | � | � | � | � | � | � | � | � | � | � | � | � | � | � | � | � | � | � | � | � |
| Trading securities | � | � | 791,017 | � | � | � | 2,249,019 | � | � | � | 3,259,704 | � | � | � | 44.9 | % | � | � | 312.1 | % |
| � | � | � | � | � | � | � | � | � | � | � | � | � | � | � | � | � | � | � | � | � |
| Loans | � | � | 62,358,185 | � | � | � | 73,464,928 | � | � | � | 75,680,558 | � | � | � | 3.0 | % | � | � | 21.4 | % |
| Current | � | � | 60,998,683 | � | � | � | 71,524,773 | � | � | � | 73,718,663 | � | � | � | 3.1 | % | � | � | 20.9 | % |
| Past due | � | � | 1,359,501 | � | � | � | 1,940,155 | � | � | � | 1,961,895 | � | � | � | 1.1 | % | � | � | 44.3 | % |
| Less - net provisions for possible loan losses | � | � | (2,210,745 | ) | � | � | (3,072,244 | ) | � | � | (3,168,154 | ) | � | � | 3.1 | % | � | � | 43.3 | % |
| Loans, net | � | � | 60,147,439 | � | � | � | 70,392,684 | � | � | � | 72,512,404 | � | � | � | 3.0 | % | � | � | 20.6 | % |
| � | � | � | � | � | � | � | � | � | � | � | � | � | � | � | � | � | � | � | � | � |
| Investments securities available for sale | � | � | 18,612,207 | � | � | � | 17,782,454 | � | � | � | 18,023,977 | � | � | � | 1.4 | % | � | � | -3.2 | % |
| Investments held to maturity | � | � | 242,646 | � | � | � | 1,760,576 | � | � | � | 2,122,790 | � | � | � | 20.6 | % | � | � | 774.9 | % |
| Reinsurance assets | � | � | 538,696 | � | � | � | 491,821 | � | � | � | 477,182 | � | � | � | -3.0 | % | � | � | -11.4 | % |
| Premiums and other policyholder receivables | � | � | 579,780 | � | � | � | 584,692 | � | � | � | 609,194 | � | � | � | 4.2 | % | � | � | 5.1 | % |
| Property, plant and equipment, net | � | � | 1,792,604 | � | � | � | 2,163,838 | � | � | � | 2,199,091 | � | � | � | 1.6 | % | � | � | 22.7 | % |
| Due from customers on acceptances | � | � | 179,730 | � | � | � | 152,901 | � | � | � | 175,687 | � | � | � | 14.9 | % | � | � | -2.2 | % |
| Other assets | � | � | 7,431,426 | � | � | � | 8,454,883 | � | � | � | 8,971,223 | � | � | � | 6.1 | % | � | � | 20.7 | % |
| � | � | � | � | � | � | � | � | � | � | � | � | � | � | � | � | � | � | � | � | � |
| Total assets | � | � | 111,818,498 | � | � | � | 127,141,418 | � | � | � | 132,654,031 | � | � | � | 4.3 | % | � | � | 18.6 | % |
| � | � | � | � | � | � | � | � | � | � | � | � | � | � | � | � | � | � | � | � | � |
| LIABILITIES AND NET SHAREHOLDERS' EQUITY | � | � | � | � | � | � | � | � | � | � | � | � | � | � | � | � | � | � | � | � |
| � | � | � | � | � | � | � | � | � | � | � | � | � | � | � | � | � | � | � | � | � |
| Deposits and Obligations | � | � | � | � | � | � | � | � | � | � | � | � | � | � | � | � | � | � | � | � |
| Non-interest bearing | � | � | 17,077,691 | � | � | � | 19,669,034 | � | � | � | 19,182,921 | � | � | � | -2.5 | % | � | � | 12.3 | % |
| Interest bearing | � | � | 49,768,202 | � | � | � | 55,942,026 | � | � | � | 55,680,694 | � | � | � | -0.5 | % | � | � | 11.9 | % |
| Total deposits and Obligations | � | � | 66,845,892 | � | � | � | 75,611,060 | � | � | � | 74,863,615 | � | � | � | -1.0 | % | � | � | 12.0 | % |
| � | � | � | � | � | � | � | � | � | � | � | � | � | � | � | � | � | � | � | � | � |
| Due to banks and correspondents | � | � | 8,449,042 | � | � | � | 11,659,253 | � | � | � | 16,107,331 | � | � | � | 38.2 | % | � | � | 90.6 | % |
| Acceptances outstanding | � | � | 179,730 | � | � | � | 152,901 | � | � | � | 175,687 | � | � | � | 14.9 | % | � | � | -2.2 | % |
| Reserves for property and casualty claims | � | � | 4,168,037 | � | � | � | 918,490 | � | � | � | 912,306 | � | � | � | -0.7 | % | � | � | -78.1 | % |
| Reserve for unearned premiums | � | � | 670,630 | � | � | � | 4,220,503 | � | � | � | 4,409,593 | � | � | � | 4.5 | % | � | � | 557.5 | % |
| Reinsurance payable | � | � | 199,238 | � | � | � | 229,201 | � | � | � | 221,007 | � | � | � | -3.6 | % | � | � | 10.9 | % |
| Bonds and subordinated debt | � | � | 14,364,704 | � | � | � | 14,910,646 | � | � | � | 15,229,395 | � | � | � | 2.1 | % | � | � | 6.0 | % |
| Other liabilities | � | � | 5,045,438 | � | � | � | 5,805,852 | � | � | � | 6,655,236 | � | � | � | 14.6 | % | � | � | 31.9 | % |
| Total liabilities | � | � | 99,922,711 | � | � | � | 113,507,906 | � | � | � | 118,574,168 | � | � | � | 4.5 | % | � | � | 18.7 | % |
| � | � | � | � | � | � | � | � | � | � | � | � | � | � | � | � | � | � | � | � | � |
| Capital stock | � | � | 1,312,858 | � | � | � | 1,318,993 | � | � | � | 1,318,993 | � | � | � | 0.0 | % | � | � | 0.5 | % |
| Treasury stock | � | � | (207,159 | ) | � | � | (208,176 | ) | � | � | (208,305 | ) | � | � | 0.1 | % | � | � | 0.6 | % |
| Capital surplus | � | � | 274,287 | � | � | � | 275,032 | � | � | � | 299,927 | � | � | � | 9.1 | % | � | � | 9.3 | % |
| Reserves | � | � | 8,064,441 | � | � | � | 9,288,799 | � | � | � | 9,303,397 | � | � | � | 0.2 | % | � | � | 15.4 | % |
| Unrealized gains | � | � | 699,490 | � | � | � | 811,774 | � | � | � | 734,502 | � | � | � | -9.5 | % | � | � | 5.0 | % |
| Retained earnings | � | � | 1,234,228 | � | � | � | 1,320,946 | � | � | � | 1,965,538 | � | � | � | 48.8 | % | � | � | 59.3 | % |
| � | � | � | � | � | � | � | � | � | � | � | � | � | � | � | � | � | � | � | � | � |
| Minority interest | � | � | 517,642 | � | � | � | 826,144 | � | � | � | 665,812 | � | � | � | -19.4 | % | � | � | 28.6 | % |
| � | � | � | � | � | � | � | � | � | � | � | � | � | � | � | � | � | � | � | � | � |
| Total liabilities and net shareholders' equity | � | � | 111,818,498 | � | � | � | 127,141,418 | � | � | � | 132,654,031 | � | � | � | 4.3 | % | � | � | 18.6 | % |
| � | � | � | � | � | � | � | � | � | � | � | � | � | � | � | � | � | � | � | � | � |
| Off balance sheet | � | � | 40,041,817 | � | � | � | 46,931,610 | � | � | � | 53,438,835 | � | � | � | 13.9 | % | � | � | 33.5 | % |
�
�
| 55 |
|
��
CREDICORP LTD. AND SUBSIDIARIES
QUARTERLY INCOME STATEMENT
(In PEN thousands, IFRS)
�
| � | � | Quarter | � | � | % Change | � | � | Year to date | � | � | % Change | � | ||||||||||||||||||||
| � | � | 3Q13 | � | � | 2Q14 | � | � | 3Q14 | � | � | QoQ | � | � | YoY | � | � | Sep 13 | � | � | Sep 14 | � | � | Sep 14 / Sep 13 | � | ||||||||
| Interest income and expense | � | � | � | � | � | � | � | � | � | � | � | � | � | � | � | � | � | � | � | � | � | � | � | � | � | � | � | � | � | � | � | � |
| Interest and dividend income | � | � | 1,824,879 | � | � | � | 2,147,801 | � | � | � | 2,248,936 | � | � | � | 4.7 | % | � | � | 23.2 | % | � | � | 5,266,248 | � | � | � | 6,296,014 | � | � | � | 19.6 | % |
| Interest expense | � | � | (543,312 | ) | � | � | (537,302 | ) | � | � | (562,752 | ) | � | � | 4.7 | % | � | � | 3.6 | % | � | � | (1,621,120 | ) | � | � | (1,597,606 | ) | � | � | -1.45 | % |
| Net interest income | � | � | 1,281,567 | � | � | � | 1,610,499 | � | � | � | 1,686,184 | � | � | � | 4.7 | % | � | � | 31.6 | % | � | � | 3,645,129 | � | � | � | 4,698,407 | � | � | � | 28.9 | % |
| � | � | � | � | � | � | � | � | � | � | � | � | � | � | � | � | � | � | � | � | � | � | � | � | � | � | � | � | � | � | � | � | � |
| Net provisions for loan losses | � | � | (331,280 | ) | � | � | (480,731 | ) | � | � | (433,219 | ) | � | � | -9.9 | % | � | � | 30.8 | % | � | � | (889,297 | ) | � | � | (1,278,551 | ) | � | � | 43.8 | % |
| � | � | � | � | � | � | � | � | � | � | � | � | � | � | � | � | � | � | � | � | � | � | � | � | � | � | � | � | � | � | � | � | � |
| Non financial income | � | � | � | � | � | � | � | � | � | � | � | � | � | � | � | � | � | � | � | � | � | � | � | � | � | � | � | � | � | � | � | � |
| Fee income | � | � | 577,029 | � | � | � | 612,585 | � | � | � | 614,777 | � | � | � | 0.4 | % | � | � | 6.5 | % | � | � | 1,663,993 | � | � | � | 1,836,467 | � | � | � | 10.4 | % |
| Net gain on foreign exchange transactions | � | � | 135,965 | � | � | � | 140,839 | � | � | � | 164,097 | � | � | � | 16.5 | % | � | � | 20.7 | % | � | � | 406,796 | � | � | � | 437,125 | � | � | � | 7.5 | % |
| Net gain on sales of securities | � | � | 28,240 | � | � | � | 56,103 | � | � | � | 75,592 | � | � | � | 34.7 | % | � | � | 167.7 | % | � | � | 53,556 | � | � | � | 251,214 | � | � | � | 369.1 | % |
| Other | � | � | 14,241 | � | � | � | 64,104 | � | � | � | 26,821 | � | � | � | -58.2 | % | � | � | 88.3 | % | � | � | 61,462 | � | � | � | 114,485 | � | � | � | 86.3 | % |
| Total non financial income, net | � | � | 755,474 | � | � | � | 873,631 | � | � | � | 881,287 | � | � | � | 0.9 | % | � | � | 16.7 | % | � | � | 2,185,806 | � | � | � | 2,639,290 | � | � | � | 20.7 | % |
| � | � | � | � | � | � | � | � | � | � | � | � | � | � | � | � | � | � | � | � | � | � | � | � | � | � | � | � | � | � | � | � | � |
| Insurance premiums and claims | � | � | � | � | � | � | � | � | � | � | � | � | � | � | � | � | � | � | � | � | � | � | � | � | � | � | � | � | � | � | � | � |
| Net premiums earned | � | � | 569,576 | � | � | � | 544,731 | � | � | � | 555,160 | � | � | � | 1.9 | % | � | � | -2.5 | % | � | � | 1,611,617 | � | � | � | 1,618,388 | � | � | � | 0.4 | % |
| Net claims incurred | � | � | (386,646 | ) | � | � | (356,355 | ) | � | � | (358,492 | ) | � | � | 0.6 | % | � | � | -7.3 | % | � | � | (1,103,791 | ) | � | � | (1,051,677 | ) | � | � | -4.7 | % |
| Net technical commissions and expenses | � | � | (76,626 | ) | � | � | (84,211 | ) | � | � | (79,030 | ) | � | � | -6.2 | % | � | � | 3.1 | % | � | � | (226,762 | ) | � | � | (247,806 | ) | � | � | 9.3 | % |
| Total Insurance services technical result | � | � | 106,303 | � | � | � | 104,165 | � | � | � | 117,638 | � | � | � | 12.9 | % | � | � | 10.7 | % | � | � | 281,065 | � | � | � | 318,905 | � | � | � | 13.5 | % |
| � | � | � | � | � | � | � | � | � | � | � | � | � | � | � | � | � | � | � | � | � | � | � | � | � | � | � | � | � | � | � | � | � |
| Medical services gross margin | � | � | 19,343 | � | � | � | 25,242 | � | � | � | 28,813 | � | � | � | 14.1 | % | � | � | 49.0 | % | � | � | 51,157 | � | � | � | 74,765 | � | � | � | 46.1 | % |
| � | � | � | � | � | � | � | � | � | � | � | � | � | � | � | � | � | � | � | � | � | � | � | � | � | � | � | � | � | � | � | � | � |
| Operating expenses | � | � | � | � | � | � | � | � | � | � | � | � | � | � | � | � | � | � | � | � | � | � | � | � | � | � | � | � | � | � | � | � |
| Salaries and employees benefits | � | � | (567,904 | ) | � | � | (699,013 | ) | � | � | (672,540 | ) | � | � | -3.8 | % | � | � | 18.4 | % | � | � | (1,688,211 | ) | � | � | (1,978,785 | ) | � | � | 17.2 | % |
| Administrative and general expenses | � | � | (429,177 | ) | � | � | (485,342 | ) | � | � | (487,216 | ) | � | � | 0.4 | % | � | � | 13.5 | % | � | � | (1,237,699 | ) | � | � | (1,364,020 | ) | � | � | 10.2 | % |
| Depreciation and amortization | � | � | (88,376 | ) | � | � | (103,939 | ) | � | � | (105,443 | ) | � | � | 1.4 | % | � | � | 19.3 | % | � | � | (254,258 | ) | � | � | (304,171 | ) | � | � | 19.6 | % |
| Other | � | � | (15,188 | ) | � | � | (40,472 | ) | � | � | (84,368 | ) | � | � | 108.5 | % | � | � | 455.5 | % | � | � | (95,298 | ) | � | � | (159,569 | ) | � | � | 67.4 | % |
| Total operating expenses | � | � | (1,100,645 | ) | � | � | (1,328,766 | ) | � | � | (1,349,566 | ) | � | � | 1.6 | % | � | � | 22.6 | % | � | � | (3,275,466 | ) | � | � | (3,806,544 | ) | � | � | 16.2 | % |
| � | � | � | � | � | � | � | � | � | � | � | � | � | � | � | � | � | � | � | � | � | � | � | � | � | � | � | � | � | � | � | � | � |
| Operating income | � | � | 730,762 | � | � | � | 804,041 | � | � | � | 931,137 | � | � | � | 15.8 | % | � | � | 27.4 | % | � | � | 1,998,393 | � | � | � | 2,646,273 | � | � | � | 32.4 | % |
| Translation result | � | � | (9,375 | ) | � | � | 581 | � | � | � | 2,603 | � | � | � | 348.2 | % | � | � | -127.8 | % | � | � | (270,508 | ) | � | � | 2,182 | � | � | � | -100.8 | % |
| Income taxes | � | � | (208,887 | ) | � | � | (204,934 | ) | � | � | (275,364 | ) | � | � | 34.4 | % | � | � | 31.8 | % | � | � | (589,183 | ) | � | � | (711,113 | ) | � | � | 20.7 | % |
| � | � | � | � | � | � | � | � | � | � | � | � | � | � | � | � | � | � | � | � | � | � | � | � | � | � | � | � | � | � | � | � | � |
| Net income | � | � | 512,500 | � | � | � | 599,687 | � | � | � | 658,376 | � | � | � | 9.8 | % | � | � | 28.5 | % | � | � | 1,138,702 | � | � | � | 1,937,342 | � | � | � | 70.1 | % |
| Minority interest | � | � | 11,451 | � | � | � | 15,002 | � | � | � | 12,941 | � | � | � | -13.7 | % | � | � | 13.0 | % | � | � | 22,368 | � | � | � | 45,097 | � | � | � | 101.6 | % |
| Net income attributed to Credicorp | � | � | 501,049 | � | � | � | 584,685 | � | � | � | 645,435 | � | � | � | 10.4 | % | � | � | 28.8 | % | � | � | 1,116,335 | � | � | � | 1,892,245 | � | � | � | 69.5 | % |
�
| 56 |
|
��
CREDICORP LTD. AND SUBSIDIARIES
SELECTED FINANCIAL INDICATORS
�
| � | � | Quarter | � | � | Year to date | � | ||||||||||||||
| � | � | 3Q13 | � | � | 2Q14 | � | � | 3Q14 | � | � | Sep 13 | � | � | Sep 14 | � | |||||
| Profitability | � | � | � | � | � | � | � | � | � | � | � | � | � | � | � | � | � | � | � | � |
| Net income per common share (PEN per share) (1) | � | � | 6.28 | � | � | � | 7.33 | � | � | � | 8.09 | � | � | � | 14.00 | � | � | � | 23.72 | � |
| Net interest margin on interest earning assets (2) | � | � | 5.12 | % | � | � | 5.67 | % | � | � | 5.75 | % | � | � | 5.05 | % | � | � | 5.61 | % |
| Return on average total assets (2)(3) | � | � | 1.8 | % | � | � | 1.9 | % | � | � | 2.0 | % | � | � | 1.3 | % | � | � | 2.0 | % |
| Return on average shareholders' equity (2)(3) | � | � | 18.1 | % | � | � | 18.9 | % | � | � | 19.7 | % | � | � | 13.5 | % | � | � | 19.9 | % |
| No. of outstanding shares (millions) (4) | � | � | 79.76 | � | � | � | 79.76 | � | � | � | 79.76 | � | � | � | 79.76 | � | � | � | 79.76 | � |
| � | � | � | � | � | � | � | � | � | � | � | � | � | � | � | � | � | � | � | � | � |
| Quality of loan portfolio | � | � | � | � | � | � | � | � | � | � | � | � | � | � | � | � | � | � | � | � |
| PDL ratio | � | � | 2.18 | % | � | � | 2.64 | % | � | � | 2.59 | % | � | � | 2.18 | % | � | � | 2.59 | % |
| NPL ratio | � | � | 2.76 | % | � | � | 3.30 | % | � | � | 3.26 | % | � | � | 2.76 | % | � | � | 3.26 | % |
| Coverage of PDLs | � | � | 162.61 | % | � | � | 158.35 | % | � | � | 161.48 | % | � | � | 162.61 | % | � | � | 161.48 | % |
| Coverage of NPLs | � | � | 128.68 | % | � | � | 126.60 | % | � | � | 128.32 | % | � | � | 128.68 | % | � | � | 128.32 | % |
| Reserves for loan losses / Total loans | � | � | 3.55 | % | � | � | 4.18 | % | � | � | 4.19 | % | � | � | 3.55 | % | � | � | 4.19 | % |
| � | � | � | � | � | � | � | � | � | � | � | � | � | � | � | � | � | � | � | � | � |
| Operating efficiency | � | � | � | � | � | � | � | � | � | � | � | � | � | � | � | � | � | � | � | � |
| Oper. expenses as a percent. of total income (5) | � | � | 42.0 | % | � | � | 43.9 | % | � | � | 41.5 | % | � | � | 43.1 | % | � | � | 42.1 | % |
| Oper. expenses as a percent. of av. tot. assets (2)(3) (5) | � | � | 3.9 | % | � | � | 4.1 | % | � | � | 3.9 | % | � | � | 3.8 | % | � | � | 3.8 | % |
| � | � | � | � | � | � | � | � | � | � | � | � | � | � | � | � | � | � | � | � | � |
| Average balances (millions of PEN) (3) | � | � | � | � | � | � | � | � | � | � | � | � | � | � | � | � | � | � | � | � |
| Interest earning assets | � | � | 100,196.72 | � | � | � | 113,550.76 | � | � | � | 117,355.14 | � | � | � | 96,213.61 | � | � | � | 111,688.19 | � |
| Total assets | � | � | 111,339.47 | � | � | � | 125,577.30 | � | � | � | 129,897.73 | � | � | � | 110,944.19 | � | � | � | 128,333.60 | � |
| Net shareholder's equity | � | � | 11,093.28 | � | � | � | 12,382.64 | � | � | � | 13,110.71 | � | � | � | 11,022.65 | � | � | � | 12,685.98 | � |
(1) Based on Net Income attributed to BAP. Number of shares outstanding of 79.8 million in all periods.
(2) Ratios are annualized.
(3) Averages are determined as the average of period-beginning and period-ending balances.
(4) Net of treasury shares. The total number of shares was of 94.38 million.
(5) Total income includes net interest income, fee income, net gain on foreign exchange transactions and net premiums earned. Operating expenses exclude Other expenses.
�
| 57 |
|
��
BANCO DE CREDITO DEL PERU AND SUBSIDIARIES
CONSOLIDATED BALANCE SHEET
(In PEN thousands, IFRS)
�
| � | � | � | � | � | As of | � | � | � | � | � | % Change | � | ||||||||
| � | � | Sep 13 | � | � | Jun 14 | � | � | Sep 14 | � | � | QoQ | � | � | YoY | � | |||||
| ASSETS | � | � | � | � | � | � | � | � | � | � | � | � | � | � | � | � | � | � | � | � |
| Cash and due from banks | � | � | 21,030,253 | � | � | � | 22,661,390 | � | � | � | 23,523,820 | � | � | � | 3.8 | % | � | � | 11.9 | % |
| Cash and BCRP | � | � | 18,344,750 | � | � | � | 19,268,178 | � | � | � | 18,797,146 | � | � | � | -2.4 | % | � | � | 2.5 | % |
| Deposits in other Banks | � | � | 2,390,435 | � | � | � | 3,090,242 | � | � | � | 4,286,929 | � | � | � | 38.7 | % | � | � | 79.3 | % |
| Interbanks | � | � | 282,544 | � | � | � | 297,004 | � | � | � | 435,939 | � | � | � | 46.8 | % | � | � | 54.3 | % |
| Accrued interest on cash and due from banks | � | � | 12,524 | � | � | � | 5,966 | � | � | � | 3,806 | � | � | � | -36.2 | % | � | � | -69.6 | % |
| � | � | � | � | � | � | � | � | � | � | � | � | � | � | � | � | � | � | � | � | � |
| Trading securities | � | � | 300,817 | � | � | � | 1,717,501 | � | � | � | 2,460,868 | � | � | � | 43.3 | % | � | � | 718.1 | % |
| � | � | � | � | � | � | � | � | � | � | � | � | � | � | � | � | � | � | � | � | � |
| Loans | � | � | 60,412,012 | � | � | � | 71,396,079 | � | � | � | 73,636,007 | � | � | � | 3.1 | % | � | � | 21.9 | % |
| Current | � | � | 59,054,062 | � | � | � | 69,457,362 | � | � | � | 71,675,541 | � | � | � | 3.2 | % | � | � | 21.4 | % |
| Past Due | � | � | 1,357,950 | � | � | � | 1,938,717 | � | � | � | 1,960,466 | � | � | � | 1.1 | % | � | � | 44.4 | % |
| Less - net provisions for possible loan losses | � | � | (2,208,998 | ) | � | � | (3,071,051 | ) | � | � | (3,167,014 | ) | � | � | 3.1 | % | � | � | 43.4 | % |
| Loans, net | � | � | 58,203,014 | � | � | � | 68,325,028 | � | � | � | 70,468,993 | � | � | � | 3.1 | % | � | � | 21.1 | % |
| � | � | � | � | � | � | � | � | � | � | � | � | � | � | � | � | � | � | � | � | � |
| Investment securities available for sale | � | � | 10,447,902 | � | � | � | 9,380,457 | � | � | � | 9,336,182 | � | � | � | -0.5 | % | � | � | -10.6 | % |
| Investment held to maturity | � | � | 675,039 | � | � | � | 1,760,575 | � | � | � | 2,122,790 | � | � | � | 20.6 | % | � | � | 214.5 | % |
| Property, plant and equipment, net | � | � | 1,243,043 | � | � | � | 1,513,366 | � | � | � | 1,547,011 | � | � | � | 2.2 | % | � | � | 24.5 | % |
| Due from customers acceptances | � | � | 179,730 | � | � | � | 152,901 | � | � | � | 175,687 | � | � | � | 14.9 | % | � | � | -2.2 | % |
| Other assets | � | � | 3,446,484 | � | � | � | 3,880,598 | � | � | � | 4,165,529 | � | � | � | 7.3 | % | � | � | 20.9 | % |
| � | � | � | � | � | � | � | � | � | � | � | � | � | � | � | � | � | � | � | � | � |
| Total assets | � | � | 95,526,282 | � | � | � | 109,391,816 | � | � | � | 113,800,880 | � | � | � | 4.0 | % | � | � | 19.1 | % |
| � | � | � | � | � | � | � | � | � | � | � | � | � | � | � | � | � | � | � | � | � |
| LIABILITIES AND NET SHAREHOLDERS' EQUITY | � | � | � | � | � | � | � | � | � | � | � | � | � | � | � | � | � | � | � | � |
| Deposits and obligations | � | � | 63,385,311 | � | � | � | 72,094,494 | � | � | � | 70,820,125 | � | � | � | -1.8 | % | � | � | 11.7 | % |
| Demand deposits | � | � | 19,899,443 | � | � | � | 22,390,079 | � | � | � | 22,766,750 | � | � | � | 1.7 | % | � | � | 14.4 | % |
| Saving deposits | � | � | 16,888,339 | � | � | � | 19,036,056 | � | � | � | 19,965,805 | � | � | � | 4.9 | % | � | � | 18.2 | % |
| Time deposits | � | � | 20,468,453 | � | � | � | 23,314,183 | � | � | � | 21,466,868 | � | � | � | -7.9 | % | � | � | 4.9 | % |
| Severance indemnity deposits (CTS) | � | � | 5,926,255 | � | � | � | 7,148,162 | � | � | � | 6,390,609 | � | � | � | -10.6 | % | � | � | 7.8 | % |
| Interest payable | � | � | 202,821 | � | � | � | 206,014 | � | � | � | 230,093 | � | � | � | 11.7 | % | � | � | 13.4 | % |
| � | � | � | � | � | � | � | � | � | � | � | � | � | � | � | � | � | � | � | � | � |
| Due to banks and correspondents | � | � | 10,662,697 | � | � | � | 13,674,528 | � | � | � | 17,871,327 | � | � | � | 30.7 | % | � | � | 67.6 | % |
| Bonds and subordinated debt | � | � | 11,537,940 | � | � | � | 12,263,511 | � | � | � | 12,644,297 | � | � | � | 3.1 | % | � | � | 9.6 | % |
| Acceptances outstanding | � | � | 179,730 | � | � | � | 152,901 | � | � | � | 175,687 | � | � | � | 14.9 | % | � | � | -2.2 | % |
| Other liabilities | � | � | 1,833,463 | � | � | � | 1,932,295 | � | � | � | 2,605,865 | � | � | � | 34.9 | % | � | � | 42.1 | % |
| � | � | � | � | � | � | � | � | � | � | � | � | � | � | � | � | � | � | � | � | � |
| Total liabilities | � | � | 87,599,141 | � | � | � | 100,117,729 | � | � | � | 104,117,301 | � | � | � | 4.0 | % | � | � | 18.9 | % |
| � | � | � | � | � | � | � | � | � | � | � | � | � | � | � | � | � | � | � | � | � |
| Net shareholders' equity | � | � | 7,910,039 | � | � | � | 8,937,830 | � | � | � | 9,513,534 | � | � | � | 6.4 | % | � | � | 20.3 | % |
| Capital stock | � | � | 3,443,147 | � | � | � | 4,429,372 | � | � | � | 4,429,372 | � | � | � | 0.0 | % | � | � | 28.6 | % |
| Reserves | � | � | 2,193,120 | � | � | � | 2,542,915 | � | � | � | 2,542,915 | � | � | � | 0.0 | % | � | � | 15.9 | % |
| Unrealized Gains and Losses | � | � | 421,272 | � | � | � | 423,344 | � | � | � | 413,285 | � | � | � | -2.4 | % | � | � | -1.9 | % |
| Retained Earnings | � | � | 994,474 | � | � | � | 631,001 | � | � | � | 631,001 | � | � | � | 0.0 | % | � | � | -36.5 | % |
| Income for the year | � | � | 858,026 | � | � | � | 911,198 | � | � | � | 1,496,961 | � | � | � | 64.3 | % | � | � | 74.5 | % |
| � | � | � | � | � | � | � | � | � | � | � | � | � | � | � | � | � | � | � | � | � |
| Minority interest | � | � | 17,103 | � | � | � | 336,257 | � | � | � | 170,046 | � | � | � | -49.4 | % | � | � | 894.2 | % |
| � | � | � | � | � | � | � | � | � | � | � | � | � | � | � | � | � | � | � | � | � |
| Total liabilities and net shareholders' equity | � | � | 95,526,283 | � | � | � | 109,391,816 | � | � | � | 113,800,881 | � | � | � | 4.0 | % | � | � | 19.1 | % |
| � | � | � | � | � | � | � | � | � | � | � | � | � | � | � | � | � | � | � | � | � |
| Off-balance sheet | � | � | 39,661,115 | � | � | � | 45,253,550 | � | � | � | 52,342,183 | � | � | � | 15.7 | % | � | � | 32.0 | % |
��
| 58 |
|
��
BANCO DE CREDITO DEL PERU AND SUBSIDIARIES
QUARTERLY INCOME STATEMENT
(In PEN thousands, IFRS)
�
| � | � | Quarter | � | � | % Change | � | � | Year to date | � | � | % Change | � | ||||||||||||||||||||
| � | � | 3Q13 | � | � | 2Q14 | � | � | 3Q14 | � | � | QoQ | � | � | YoY | � | � | Sep 13 | � | � | Sep 14 | � | � | Sep 14 / Sep 13 | � | ||||||||
| Interest income and expense | � | � | � | � | � | � | � | � | � | � | � | � | � | � | � | � | � | � | � | � | � | � | � | � | � | � | � | � | � | � | � | � |
| Interest and dividend income | � | � | 1,700,362 | � | � | � | 2,014,370 | � | � | � | 2,110,370 | � | � | � | 4.8 | % | � | � | 24.1 | % | � | � | 4,871,729 | � | � | � | 5,881,967 | � | � | � | 20.7 | % |
| Interest expense | � | � | (512,338 | ) | � | � | (506,908 | ) | � | � | (522,412 | ) | � | � | 3.1 | % | � | � | 2.0 | % | � | � | (1,516,333 | ) | � | � | (1,495,550 | ) | � | � | -1.4 | % |
| Net interest income | � | � | 1,188,024 | � | � | � | 1,507,462 | � | � | � | 1,587,958 | � | � | � | 5.3 | % | � | � | 33.7 | % | � | � | 3,355,396 | � | � | � | 4,386,417 | � | � | � | 30.7 | % |
| Net provision for loan losses | � | � | (332,505 | ) | � | � | (481,036 | ) | � | � | (433,343 | ) | � | � | -9.9 | % | � | � | 30.3 | % | � | � | (890,671 | ) | � | � | (1,279,399 | ) | � | � | 43.6 | % |
| � | � | � | � | � | � | � | � | � | � | � | � | � | � | � | � | � | � | � | � | � | � | � | � | � | � | � | � | � | � | � | � | � |
| Non financial income | � | � | � | � | � | � | � | � | � | � | � | � | � | � | � | � | � | � | � | � | � | � | � | � | � | � | � | � | � | � | � | � |
| Fee income, net | � | � | 454,557 | � | � | � | 478,007 | � | � | � | 484,541 | � | � | � | 1.4 | % | � | � | 6.6 | % | � | � | 1,289,802 | � | � | � | 1,434,534 | � | � | � | 11.2 | % |
| Gain on foreign exchange transactions, net | � | � | 132,653 | � | � | � | 136,567 | � | � | � | 156,641 | � | � | � | 14.7 | % | � | � | 18.1 | % | � | � | 394,960 | � | � | � | 419,175 | � | � | � | 6.1 | % |
| Gain on sales of securities, net | � | � | (2,209 | ) | � | � | 13,897 | � | � | � | 35,055 | � | � | � | 152.2 | % | � | � | 1686.9 | % | � | � | (75,200 | ) | � | � | 51,125 | � | � | � | 168.0 | % |
| Other | � | � | 6,129 | � | � | � | 13,860 | � | � | � | 12,581 | � | � | � | -9.2 | % | � | � | 105.3 | % | � | � | 47,613 | � | � | � | 37,223 | � | � | � | -21.8 | % |
| Total non financial income, net | � | � | 591,130 | � | � | � | 642,331 | � | � | � | 688,818 | � | � | � | 7.2 | % | � | � | 16.5 | % | � | � | 1,657,175 | � | � | � | 1,942,057 | � | � | � | 17.2 | % |
| � | � | � | � | � | � | � | � | � | � | � | � | � | � | � | � | � | � | � | � | � | � | � | � | � | � | � | � | � | � | � | � | � |
| Operating expenses | � | � | � | � | � | � | � | � | � | � | � | � | � | � | � | � | � | � | � | � | � | � | � | � | � | � | � | � | � | � | � | � |
| Salaries and employees benefits | � | � | (417,818 | ) | � | � | (560,131 | ) | � | � | (532,961 | ) | � | � | -4.9 | % | � | � | 27.6 | % | � | � | (1,271,149 | ) | � | � | (1,565,616 | ) | � | � | 23.2 | % |
| Administrative expenses | � | � | (331,203 | ) | � | � | (387,550 | ) | � | � | (386,242 | ) | � | � | -0.3 | % | � | � | 16.6 | % | � | � | (949,769 | ) | � | � | (1,072,070 | ) | � | � | 12.9 | % |
| Depreciation and amortization | � | � | (69,910 | ) | � | � | (81,439 | ) | � | � | (82,570 | ) | � | � | 1.4 | % | � | � | 18.1 | % | � | � | (197,910 | ) | � | � | (236,945 | ) | � | � | 19.7 | % |
| Other | � | � | (28,679 | ) | � | � | (33,579 | ) | � | � | (47,401 | ) | � | � | 41.2 | % | � | � | 65.3 | % | � | � | (122,215 | ) | � | � | (106,506 | ) | � | � | -12.9 | % |
| Total operating expenses | � | � | (847,610 | ) | � | � | (1,062,699 | ) | � | � | (1,049,174 | ) | � | � | -1.3 | % | � | � | 23.8 | % | � | � | (2,541,043 | ) | � | � | (2,981,137 | ) | � | � | 17.3 | % |
| � | � | � | � | � | � | � | � | � | � | � | � | � | � | � | � | � | � | � | � | � | � | � | � | � | � | � | � | � | � | � | � | � |
| Operating Income | � | � | 599,039 | � | � | � | 606,058 | � | � | � | 794,259 | � | � | � | 31.1 | % | � | � | 32.6 | % | � | � | 1,580,857 | � | � | � | 2,067,938 | � | � | � | 30.8 | % |
| Translation result | � | � | (8,144 | ) | � | � | (1,198 | ) | � | � | 13,066 | � | � | � | 1190.7 | % | � | � | 260.4 | % | � | � | (220,998 | ) | � | � | 9,921 | � | � | � | 104.5 | % |
| Income taxes | � | � | (169,166 | ) | � | � | (170,049 | ) | � | � | (224,940 | ) | � | � | 32.3 | % | � | � | 33.0 | % | � | � | (500,324 | ) | � | � | (581,802 | ) | � | � | 16.3 | % |
| Minority interest | � | � | (528 | ) | � | � | (1,732 | ) | � | � | 3,379 | � | � | � | 295.1 | % | � | � | 740.0 | % | � | � | (1,510 | ) | � | � | 904 | � | � | � | 159.9 | % |
| Net income | � | � | 421,201 | � | � | � | 433,079 | � | � | � | 585,764 | � | � | � | 35.3 | % | � | � | 39.1 | % | � | � | 858,025 | � | � | � | 1,496,961 | � | � | � | 74.5 | % |
�
| 59 |
|
�
BANCO DE CREDITO DEL PERU AND SUBSIDIARIES
SELECTED FINANCIAL INDICATORS
�
| � | � | Quarter | � | � | Year to date | � | ||||||||||||||
| � | � | 3Q13 | � | � | 2Q14 | � | � | 3Q14 | � | � | Sep 13 | � | � | Sep 14 | � | |||||
| Profitability | � | � | � | � | � | � | � | � | � | � | � | � | � | � | � | � | � | � | � | � |
| Net income per common share (PEN per share) (1) | � | � | 0.09 | � | � | � | 0.09 | � | � | � | 0.12 | � | � | � | 0.18 | � | � | � | 0.32 | � |
| Net interest margin on interest earning assets (2) | � | � | 5.33 | % | � | � | 5.90 | % | � | � | 6.02 | % | � | � | 5.21 | % | � | � | 5.84 | % |
| Return on average total assets (2)(3) | � | � | 1.8 | % | � | � | 1.6 | % | � | � | 2.1 | % | � | � | 1.2 | % | � | � | 1.9 | % |
| Return on average shareholders' equity (2)(3) | � | � | 22.0 | % | � | � | 19.9 | % | � | � | 25.4 | % | � | � | 15.3 | % | � | � | 22.4 | % |
| No. of outstanding shares (million) | � | � | 4,722.8 | � | � | � | 4,722.8 | � | � | � | 4,722.8 | � | � | � | 4,722.8 | � | � | � | 4,722.8 | � |
| � | � | � | � | � | � | � | � | � | � | � | � | � | � | � | � | � | � | � | � | � |
| Quality of loan portfolio | � | � | � | � | � | � | � | � | � | � | � | � | � | � | � | � | � | � | � | � |
| PDL ratio | � | � | 2.25 | % | � | � | 2.72 | % | � | � | 2.66 | % | � | � | 2.25 | % | � | � | 2.66 | % |
| NPL ratio | � | � | 2.84 | % | � | � | 3.40 | % | � | � | 3.35 | % | � | � | 2.84 | % | � | � | 3.35 | % |
| Coverage of PDLs | � | � | 162.7 | % | � | � | 158.4 | % | � | � | 161.5 | % | � | � | 162.7 | % | � | � | 161.5 | % |
| Coverage of NPLs | � | � | 128.7 | % | � | � | 126.6 | % | � | � | 128.3 | % | � | � | 128.7 | % | � | � | 128.3 | % |
| Reserves for loan losses as a percentage of total loans | � | � | 3.7 | % | � | � | 4.3 | % | � | � | 4.3 | % | � | � | 3.7 | % | � | � | 4.3 | % |
| � | � | � | � | � | � | � | � | � | � | � | � | � | � | � | � | � | � | � | � | � |
| Operating efficiency | � | � | � | � | � | � | � | � | � | � | � | � | � | � | � | � | � | � | � | � |
| Oper. expenses as a percent. of total income - reported (4) | � | � | 46.1 | % | � | � | 48.5 | % | � | � | 44.9 | % | � | � | 48.0 | % | � | � | 46.1 | % |
| Oper. expenses as a percent. of av. tot. Assets (2)(3)(4) | � | � | 3.4 | % | � | � | 3.8 | % | � | � | 3.6 | % | � | � | 3.5 | % | � | � | 3.6 | % |
| � | � | � | � | � | � | � | � | � | � | � | � | � | � | � | � | � | � | � | � | � |
| Capital adequacy | � | � | � | � | � | � | � | � | � | � | � | � | � | � | � | � | � | � | � | � |
| Total Regulatory Capital (PEN million) | � | � | 10,213 | � | � | � | 11,472 | � | � | � | 12,524 | � | � | � | 10,213 | � | � | � | 12,524 | � |
| Tier��I ratio | � | � | 9.27 | % | � | � | 9.72 | % | � | � | 10.19 | % | � | � | 9.27 | % | � | � | 10.19 | % |
| Common Equity Tier I ratio | � | � | 7.26 | % | � | � | 7.18 | % | � | � | 7.20 | % | � | � | 7.26 | % | � | � | 7.20 | % |
| BIS ratio | � | � | 14.12 | % | � | � | 14.58 | % | � | � | 14.78 | % | � | � | 14.12 | % | � | � | 14.78 | % |
| � | � | � | � | � | � | � | � | � | � | � | � | � | � | � | � | � | � | � | � | � |
| Average balances (PEN million) (3) | � | � | � | � | � | � | � | � | � | � | � | � | � | � | � | � | � | � | � | � |
| Interest earning assets | � | � | 89,137 | � | � | � | 102,190 | � | � | � | 105,482 | � | � | � | 85,924 | � | � | � | 85,924 | � |
| Total Assets | � | � | 95,266 | � | � | � | 108,234 | � | � | � | 111,596 | � | � | � | 93,399 | � | � | � | 93,399 | � |
| Net shareholders' equity | � | � | 7,670 | � | � | � | 8,709 | � | � | � | 9,226 | � | � | � | 7,494 | � | � | � | 7,494 | � |
(1) Shares outstanding of 4,722 million is used for all periods since shares have been issued only for capitalization of profits and inflation adjustment.
(2) Ratios are annualized.
(3) Averages are determined as the average of period-beginning and period-ending balances.
(4) Total income includes net interest income, fee income and net gain on foreign exchange transactions. Operating expense includes personnel expenses, administrative expenses and depreciation and amortization.
(5) Regulatory Capital / risk-weighted assets. Risk weighted assets include market risk and operation risk.
�
| 60 |
|
�
�
PACIFICO GRUPO ASEGURADOR (PGA)
(In PEN thousand)
�
| � | � | Quarter | � | � | % Change | � | � | Year to date | � | � | % Change | � | ||||||||||||||||||||
| � | � | 3Q13 | � | � | 2Q14 | � | � | 3Q14 | � | � | QoQ | � | � | YoY | � | � | Sep 13 | � | � | Sep 14 | � | � | Sep 14 / Sep 13 | � | ||||||||
| Results | � | � | � | � | � | � | � | � | � | � | � | � | � | � | � | � | � | � | � | � | � | � | � | � | � | � | � | � | � | � | � | � |
| Written premiums | � | � | 793,586 | � | � | � | 779,524 | � | � | � | 793,062 | � | � | � | 1.7 | % | � | � | -0.1 | % | � | � | 2,296,133 | � | � | � | 2,317,587 | � | � | � | 0.9 | % |
| Ceded Premiums | � | � | 112,842 | � | � | � | 125,731 | � | � | � | 96,816 | � | � | � | -23.0 | % | � | � | -14.2 | % | � | � | 325,256 | � | � | � | 317,590 | � | � | � | -2.4 | % |
| Unearned premium reserves | � | � | 95,864 | � | � | � | 99,929 | � | � | � | 122,394 | � | � | � | 22.5 | % | � | � | 27.7 | % | � | � | 313,967 | � | � | � | 337,270 | � | � | � | 7.4 | % |
| Net earned premiums | � | � | 584,880 | � | � | � | 553,864 | � | � | � | 573,853 | � | � | � | 3.6 | % | � | � | -1.9 | % | � | � | 1,656,909 | � | � | � | 1,662,728 | � | � | � | 0.4 | % |
| Direct claims | � | � | 419,625 | � | � | � | 375,557 | � | � | � | 372,543 | � | � | � | -0.8 | % | � | � | -11.2 | % | � | � | 1,219,201 | � | � | � | 1,128,399 | � | � | � | -7.4 | % |
| Reinsurance ceded | � | � | 32,980 | � | � | � | 19,202 | � | � | � | 14,051 | � | � | � | -26.8 | % | � | � | -57.4 | % | � | � | 115,410 | � | � | � | 76,722 | � | � | � | -33.5 | % |
| Net claims | � | � | 386,646 | � | � | � | 356,355 | � | � | � | 358,492 | � | � | � | 0.6 | % | � | � | -7.3 | % | � | � | 1,103,791 | � | � | � | 1,051,677 | � | � | � | -4.7 | % |
| Paid commissions | � | � | 119,855 | � | � | � | 110,808 | � | � | � | 120,663 | � | � | � | 8.9 | % | � | � | 0.7 | % | � | � | 317,584 | � | � | � | 346,664 | � | � | � | 9.2 | % |
| Commissions received | � | � | 12,360 | � | � | � | 11,575 | � | � | � | 14,995 | � | � | � | 29.5 | % | � | � | 21.3 | % | � | � | 30,885 | � | � | � | 35,244 | � | � | � | 14.1 | % |
| Net commissions | � | � | 107,495 | � | � | � | 99,233 | � | � | � | 105,668 | � | � | � | 6.5 | % | � | � | -1.7 | % | � | � | 286,699 | � | � | � | 311,420 | � | � | � | 8.6 | % |
| Underwriting expenses | � | � | 26,048 | � | � | � | 34,479 | � | � | � | 23,485 | � | � | � | -31.9 | % | � | � | -9.8 | % | � | � | 99,742 | � | � | � | 87,725 | � | � | � | -12.0 | % |
| Underwriting income | � | � | 10,277 | � | � | � | 10,831 | � | � | � | 10,775 | � | � | � | -0.5 | % | � | � | 4.8 | % | � | � | 29,356 | � | � | � | 32,407 | � | � | � | 10.4 | % |
| Net underwriting expenses | � | � | 15,771 | � | � | � | 23,648 | � | � | � | 12,710 | � | � | � | -46.3 | % | � | � | -19.4 | % | � | � | 70,386 | � | � | � | 55,318 | � | � | � | -21.4 | % |
| Underwriting result before Medical Services | � | � | 74,968 | � | � | � | 74,629 | � | � | � | 96,982 | � | � | � | 30.0 | % | � | � | 29.4 | % | � | � | 196,033 | � | � | � | 244,312 | � | � | � | 24.6 | % |
| � | � | � | � | � | � | � | � | � | � | � | � | � | � | � | � | � | � | � | � | � | � | � | � | � | � | � | � | � | � | � | � | � |
| Medical Services gross margin | � | � | 19,343 | � | � | � | 25,242 | � | � | � | 28,813 | � | � | � | 14.1 | % | � | � | 49.0 | % | � | � | 51,157 | � | � | � | 74,765 | � | � | � | 46.1 | % |
| � | � | � | � | � | � | � | � | � | � | � | � | � | � | � | � | � | � | � | � | � | � | � | � | � | � | � | � | � | � | � | � | � |
| Financial income | � | � | 71,048 | � | � | � | 77,885 | � | � | � | 73,298 | � | � | � | -5.9 | % | � | � | 3.2 | % | � | � | 201,610 | � | � | � | 221,394 | � | � | � | 9.8 | % |
| Gains on sale of securities | � | � | 22,929 | � | � | � | 573 | � | � | � | 13,741 | � | � | � | 2298.4 | % | � | � | -40.1 | % | � | � | 57,987 | � | � | � | 26,188 | � | � | � | -54.8 | % |
| Net property and rental income | � | � | 5,916 | � | � | � | 5,619 | � | � | � | 5,648 | � | � | � | 0.5 | % | � | � | -4.5 | % | � | � | 16,078 | � | � | � | 16,607 | � | � | � | 3.3 | % |
| (-) Financial expenses | � | � | 6,142 | � | � | � | 6,621 | � | � | � | 5,652 | � | � | � | -14.6 | % | � | � | -8.0 | % | � | � | 17,856 | � | � | � | 19,375 | � | � | � | 8.5 | % |
| Financial income, net | � | � | 93,750 | � | � | � | 77,457 | � | � | � | 87,035 | � | � | � | 12.4 | % | � | � | -7.2 | % | � | � | 257,819 | � | � | � | 244,814 | � | � | � | -5.0 | % |
| � | � | � | � | � | � | � | � | � | � | � | � | � | � | � | � | � | � | � | � | � | � | � | � | � | � | � | � | � | � | � | � | � |
| Salaries and benefits | � | � | 65,907 | � | � | � | 59,255 | � | � | � | 65,392 | � | � | � | 10.4 | % | � | � | -0.8 | % | � | � | 190,379 | � | � | � | 183,045 | � | � | � | -3.9 | % |
| Administrative expenses | � | � | 68,136 | � | � | � | 72,504 | � | � | � | 72,694 | � | � | � | 0.3 | % | � | � | 6.7 | % | � | � | 199,485 | � | � | � | 213,210 | � | � | � | 6.9 | % |
| Third party services | � | � | 33,006 | � | � | � | 28,592 | � | � | � | 32,774 | � | � | � | 14.6 | % | � | � | -0.7 | % | � | � | 97,778 | � | � | � | 89,364 | � | � | � | -8.6 | % |
| Management expenses | � | � | 13,727 | � | � | � | 14,837 | � | � | � | 15,578 | � | � | � | 5.0 | % | � | � | 13.5 | % | � | � | 41,699 | � | � | � | 45,593 | � | � | � | 9.3 | % |
| Provisions | � | � | 11,800 | � | � | � | 15,977 | � | � | � | 13,792 | � | � | � | -13.7 | % | � | � | 16.9 | % | � | � | 33,222 | � | � | � | 44,048 | � | � | � | 32.6 | % |
| Taxes | � | � | 6,624 | � | � | � | 7,557 | � | � | � | 7,460 | � | � | � | -1.3 | % | � | � | 12.6 | % | � | � | 18,203 | � | � | � | 21,975 | � | � | � | 20.7 | % |
| Other expenses | � | � | 2,979 | � | � | � | 5,540 | � | � | � | 3,089 | � | � | � | -44.2 | % | � | � | 3.7 | % | � | � | 8,582 | � | � | � | 12,230 | � | � | � | 42.5 | % |
| Opertating expenses | � | � | 134,043 | � | � | � | 131,759 | � | � | � | 138,085 | � | � | � | 4.8 | % | � | � | 3.0 | % | � | � | 389,864 | � | � | � | 396,254 | � | � | � | 1.6 | % |
| � | � | � | � | � | � | � | � | � | � | � | � | � | � | � | � | � | � | � | � | � | � | � | � | � | � | � | � | � | � | � | � | � |
| Other income | � | � | 3,868 | � | � | � | 5,635 | � | � | � | 1,853 | � | � | � | -67.1 | % | � | � | -52.1 | % | � | � | 5,018 | � | � | � | 10,679 | � | � | � | 112.8 | % |
| Traslation results | � | � | 640 | � | � | � | 1,235 | � | � | � | 740 | � | � | � | -40.1 | % | � | � | 15.6 | % | � | � | (21,819 | ) | � | � | 2,465 | � | � | � | -111.3 | % |
| Income tax | � | � | 7,774 | � | � | � | 4,697 | � | � | � | 15,075 | � | � | � | 221.0 | % | � | � | 93.9 | % | � | � | 3,325 | � | � | � | 31,618 | � | � | � | 850.9 | % |
| � | � | � | � | � | � | � | � | � | � | � | � | � | � | � | � | � | � | � | � | � | � | � | � | � | � | � | � | � | � | � | � | � |
| Income before minority interest | � | � | 50,752 | � | � | � | 47,742 | � | � | � | 62,264 | � | � | � | 30.4 | % | � | � | 22.7 | % | � | � | 95,019 | � | � | � | 149,162 | � | � | � | 57.0 | % |
| Minority interest | � | � | 5,486 | � | � | � | 5,909 | � | � | � | 6,390 | � | � | � | 8.1 | % | � | � | 16.5 | % | � | � | 14,988 | � | � | � | 17,223 | � | � | � | 14.9 | % |
| � | � | � | � | � | � | � | � | � | � | � | � | � | � | � | � | � | � | � | � | � | � | � | � | � | � | � | � | � | � | � | � | � |
| Net income | � | � | 45,266 | � | � | � | 41,833 | � | � | � | 55,874 | � | � | � | 33.6 | % | � | � | 23.4 | % | � | � | 80,031 | � | � | � | 131,939 | � | � | � | 64.9 | % |
| � | � | � | � | � | � | � | � | � | � | � | � | � | � | � | � | � | � | � | � | � | � | � | � | � | � | � | � | � | � | � | � | � |
| Balance (end of period) | � | � | � | � | � | � | � | � | � | � | � | � | � | � | � | � | � | � | � | � | � | � | � | � | � | � | � | � | � | � | � | � |
| Total assets | � | � | 7,561,700 | � | � | � | 8,119,771 | � | � | � | 8,521,038 | � | � | � | 401,267 | � | � | � | 959,338 | � | � | � | 7,561,700 | � | � | � | 8,521,038 | � | � | � | 959,338 | � |
| Invesment in securities (1) | � | � | 4,636,852 | � | � | � | 5,112,710 | � | � | � | 5,229,270 | � | � | � | 116,560 | � | � | � | 592,418 | � | � | � | 4,636,852 | � | � | � | 5,229,270 | � | � | � | 592,418 | � |
| Technical reserves | � | � | 4,840,325 | � | � | � | 5,143,041 | � | � | � | 5,322,961 | � | � | � | 179,920 | � | � | � | 482,636 | � | � | � | 4,840,325 | � | � | � | 5,322,961 | � | � | � | 482,636 | � |
| Net equity | � | � | 1,396,035 | � | � | � | 1,593,792 | � | � | � | 1,611,494 | � | � | � | 17,702 | � | � | � | 215,459 | � | � | � | 1,396,035 | � | � | � | 1,611,494 | � | � | � | 215,459 | � |
| Ratios | � | � | � | � | � | � | � | � | � | � | � | � | � | � | � | � | � | � | � | � | � | � | � | � | � | � | � | � | � | � | � | � |
| Ceded | � | � | 14.2 | % | � | � | 16.1 | % | � | � | 12.2 | % | � | � | (3.9 | ) | � | � | (2.0 | ) | � | � | 14.2 | % | � | � | 13.7 | % | � | � | (0.5 | ) |
| Loss ratio | � | � | 66.1 | % | � | � | 64.3 | % | � | � | 62.5 | % | � | � | (1.9 | ) | � | � | (3.6 | ) | � | � | 66.6 | % | � | � | 63.3 | % | � | � | (3.4 | ) |
| Commissions + underwriting expenses, net / net earned premiums | � | � | 21.1 | % | � | � | 22.2 | % | � | � | 20.6 | % | � | � | (1.6 | ) | � | � | (0.4 | ) | � | � | 21.6 | % | � | � | 22.1 | % | � | � | 0.5 | � |
| Underwriting results / net premiums earned | � | � | 12.8 | % | � | � | 13.5 | % | � | � | 16.9 | % | � | � | 3.4 | � | � | � | 4.1 | � | � | � | 11.8 | % | � | � | 14.7 | % | � | � | 2.9 | � |
| Operating expenses / net premiums earned | � | � | 22.9 | % | � | � | 23.8 | % | � | � | 24.1 | % | � | � | 0.3 | � | � | � | 1.1 | � | � | � | 23.5 | % | � | � | 23.8 | % | � | � | 0.3 | � |
| Return on equity (2)(3) | � | � | 13.7 | % | � | � | 11.0 | % | � | � | 13.9 | % | � | � | 3.0 | � | � | � | 0.3 | � | � | � | 10.6 | % | � | � | 17.6 | % | � | � | 7.0 | � |
| Return on written premiums | � | � | 5.7 | % | � | � | 5.4 | % | � | � | 7.0 | % | � | � | 1.7 | � | � | � | 1.3 | � | � | � | 3.5 | % | � | � | 5.7 | % | � | � | 2.2 | � |
| � | � | � | � | � | � | � | � | � | � | � | � | � | � | � | � | � | � | � | � | � | � | � | � | � | � | � | � | � | � | � | � | � |
| Combined ratio of��PPS + PS (4)(5) | � | � | 101.9 | % | � | � | 99.6 | % | � | � | 94.6 | % | � | � | (5.1 | ) | � | � | (7.3 | ) | � | � | 105.5 | % | � | � | 97.9 | % | � | � | (7.6 | ) |
| Net claims / net earned premiums | � | � | 68.8 | % | � | � | 71.1 | % | � | � | 67.3 | % | � | � | (3.8 | ) | � | � | (1.6 | ) | � | � | 70.6 | % | � | � | 68.9 | % | � | � | (1.6 | ) |
| General expenses and commissions / net earned premiums | � | � | 33.1 | % | � | � | 28.5 | % | � | � | 27.3 | % | � | � | (1.2 | ) | � | � | (5.8 | ) | � | � | 34.9 | % | � | � | 28.9 | % | � | � | (6.0 | ) |
(1) Doesn�t include investments in real estate.
(2) Annualized.
(3) Average is determined as the average of period - beginning and period ending.
(4) Without consolidated adjustments.
(5) EPS includes M�dica, Doctor+, Cl�nica San Borja, An�lisis Cl�nicos, Oncocare, Prosemedic, Cl�nica El Golf, Cl�nica Sanchez Ferrer and Centro Odontol�gico Americano.
�
| 61 |
Serious News for Serious Traders! Try StreetInsider.com Premium Free!
You May Also Be Interested In
- Credicorp Ltd.: Credicorp’s “1Q24 quiet period”
- Travel + Leisure Co. and Allegiant Announce Multi-Year Marketing Agreement
- Trustmark Corporation Announces First Quarter 2024 Financial Results
Create E-mail Alert Related Categories
SEC FilingsSign up for StreetInsider Free!
Receive full access to all new and archived articles, unlimited portfolio tracking, e-mail alerts, custom newswires and RSS feeds - and more!
