

Form 6-K CEMENTOS PACASMAYO SAA For: Oct 29
 Tweet
Tweet Share
ShareUNITED STATES
SECURITIES AND EXCHANGE COMMISSION
Washington, D.C. 20549
FORM 6-K
REPORT OF FOREIGN ISSUER
PURSUANT TO RULE 13a-16 OR 15b-16 OF
THE SECURITIES EXCHANGE ACT OF 1934
For the month of October 2015
Commission File Number 001-35401
CEMENTOS PACASMAYO S.A.A.
(Exact name of registrant as specified in its charter)
PACASMAYO CEMENT CORPORATION
(Translation of registrant’s name into English)
Republic of Peru
(Jurisdiction of incorporation or organization)
Calle La Colonia 150, Urbanización El Vivero
Surco, Lima
Peru
(Address of principal executive offices)
Indicate by check mark whether the registrant files or will file annual reports under cover Form 20-F or Form 40-F.
Form 20-F ____X___ Form 40-F _______
Indicate by check mark if the registrant is submitting the Form 6-K in paper as permitted by Regulation S-T Rule 101(b)(1): [ ]
Indicate by check mark if the registrant is submitting the Form 6-K in paper as permitted by Regulation S-T Rule 101(b)(7): [ ]
Indicate by check mark whether the registrant by furnishing the information contained in this Form is also thereby furnishing the information to the Commission pursuant to Rule 12g3-2(b) under the Securities Exchange Act of 1934.
Yes _______ No ___X____
If “Yes” is marked, indicate below the file number assigned to the registrant in connection with Rule 12g3-2(b): Not applicable.
Signature
Pursuant to the requirements of the Securities Exchange Act of 1934, the registrant has duly caused this report to be signed on its behalf by the undersigned, thereunto duly authorized.
CEMENTOS PACASMAYO S.A.A.
 |
 |
Cementos Pacasmayo S.A.A. Announces Consolidated
Results for Third Quarter 2015
Lima, Peru, October 28, 2015 – Cementos Pacasmayo S.A.A. and subsidiaries (NYSE: CPAC; BVL: CPACASC1) (“the Company” or “Cementos Pacasmayo”) a leading cement company serving the growing Peruvian construction industry, announced today its consolidated results for the third quarter (“3Q15”) and nine months (“9M15”) ended September 30, 2015. These results have been prepared in accordance with International Financial Reporting Standards (“IFRS”) and are stated in nominal Peruvian Nuevos Soles (S/.).
Financial and Operational Highlights:
3Q15 Highlights
| ● |
Piura plant began cement production on time and under budget; final stage of ramp-up on track
|
|
| ● |
Consolidated EBITDA increased 14.4% to S/. 99.6 million in 3Q15 from S/. 87.1 million in 3Q14; achieving a Consolidated EBITDA margin of 31.8%, compared with 27.5% in 3Q14
|
|
| ● |
Net income increased 36.5% to S/. 55.3 million in 3Q15 from S/. 40.5 million in 3Q14
|
|
| ● |
Gross margin increased to 45.1% in 3Q15 from 40.8% in 3Q14, driven by efficiency gains
|
|
| ● |
Revenues fell 1.0% from 3Q14
|
|
| ● |
A successful share buyback program was completed in October. Over 37 million investment shares were purchased at a value of S/. 2.9 per share.
|
9M15 Highlights
| ● |
Consolidated EBITDA increased 10.5% to S/. 278.1 million from S/.251.7 million in 9M14, achieving a Consolidated EBITDA margin of 31.6%, compared with 27.4% in 9M14
|
|
| ● |
Net income increased 25.1% to S/. 151.8 million
|
|
| ● |
Gross margin increased to 43.8% in 9M15 from 40.6% in 9M14
|
2
|
|
|
Financial and Operating Results
|
|||||||
|
3Q15
|
3Q14
|
% Var.
|
9M15
|
9M14
|
% Var.
|
||
|
In millions of S/.
|
|||||||
|
Sales of goods
|
313.0
|
316.2
|
-1.0%
|
880.0
|
919.5
|
-4.3%
|
|
|
Gross profit
|
141.1
|
129.1
|
9.3%
|
385.7
|
373.3
|
3.3%
|
|
|
Operating profit
|
81.9
|
70.4
|
16.3%
|
227.2
|
204.1
|
11.3%
|
|
|
Net Income
|
55.3
|
40.5
|
36.5%
|
151.8
|
121.3
|
25.1%
|
|
|
Net income of controller
|
56.3
|
41.2
|
36.7%
|
154.7
|
123.6
|
25.2%
|
|
|
Consolidated adjusted EBITDA
|
99.6
|
87.1
|
14.4%
|
278.1
|
251.7
|
10.5%
|
|
|
Cement EBITDA*
|
102.9
|
89.8
|
14.6%
|
287.3
|
259.8
|
10.6%
|
|
|
Gross Margin
|
45.1%
|
40.8%
|
4.3 pp.
|
43.8%
|
40.6%
|
3.2 pp.
|
|
|
Operating Margin
|
26.2%
|
22.3%
|
3.9 pp.
|
25.8%
|
22.2%
|
3.6 pp.
|
|
|
Net Income
|
17.7%
|
12.8%
|
4.9 pp.
|
17.3%
|
13.2%
|
4.1 pp.
|
|
|
Net Income of Controller Margin
|
18.0%
|
13.0%
|
5.0 pp.
|
17.6%
|
13.4%
|
4.2 pp.
|
|
|
Consolidated adjusted EBITDA Margin
|
31.8%
|
27.5%
|
4.3 pp.
|
31.6%
|
27.4%
|
4.2 pp.
|
|
|
Cement EBITDA Margin
|
32.9%
|
28.4%
|
4.5 pp.
|
32.6%
|
28.3%
|
4.3 pp.
|
|
* Corresponds to EBITDA excluding the Fosfatos del Pacifico and Salmueras Sudamericanas projects which are not linked to the cement business and are currently in pre-operating stages, therefore they are not generating revenues.
3
|
|
Management Comments
The third quarter of 2015 was another important advance for Cementos Pacasmayo in our strategy as a high-efficiency cement producer serving the northern region of Peru. Cement production began at our Piura facility, the most advanced plant in Peru, and the project remains on schedule and is now below budget. We expect this facility to make a major contribution to our business in 2016 and the years ahead. Our third quarter financial results also posted major improvements, with double digit growth in both gross profit and EBITDA despite slightly lower revenue, leveraging our strategy to maximize efficiency throughout our organization.
At the Piura facility, all the equipment for cement production is now in place and operational. We made our first shipment of cement late in the quarter, as scheduled. This US$386 million plant is the culmination of four years of work from Cementos Pacasmayo; it will have a final capacity of 1.6 million tons of cement per year, and offers a major enhancement to the flexibility of our operations. The plant has two major advantages. Firstly, Piura will have capacity for 1 million tons of clinker. This will allow us to eliminate the use of imported clinker, removing the added cost and exposure to volatility in prices and significantly boosting margins. Secondly, the location of the Piura plant will give much greater flexibility to our logistics operation, allowing us to meet demand in different parts of our market from locally-produced cement. We remain on track for the facility to reach full production, including clinker, by year-end.
The demand environment in the northern region of Peru showed some improvement from recent quarters. Though total cement volumes fell slightly, we saw steady improvement in public sector demand as the quarter progressed, posting 2 consecutive months of positive growth, for the first time this year. This is in keeping with our expectations, as recently-elected local governments completed their bedding-in period, and began to place orders for construction and infrastructure projects. While it remains to be seen if this improvement will continue, we remain cautiously optimistic about the outlook for the fourth quarter and 2016. The self-construction market, which accounts for close to 60% of our total volumes, remains resilient, and we expect this to continue for the medium-term. One important risk factor to our outlook will be the intensity of the El Niño phenomenon. An intense El Niño will depress economic activity in Northern Peru, and this temporarily lowers cement demand, though there is usually a rapid recovery, with additional volumes from reconstruction projects. We are monitoring the situation with El Niño closely, and hope to receive greater clarity on the outlook by the end of the year.
In this environment of slight improvement in demand, we were able to deliver a robust financial performance, leveraging our market-leading efficiency and cost-cutting efforts. Gross margin expanded to 45.1% from 40.8%, more than offsetting a slight decline in revenue. This improvement in costs of production allowed us to absorb slight higher personnel costs, most of which was related to severance payments. Consolidated EBITDA expanded by 14.4% from 3Q14, while EBITDA margin was 31.8%, representing an expansion of 440 basis points in just 12 months.
We continue to actively manage our capital structure in order to create shareholder value. In the third quarter, the Board of Directors approved a cash dividend of S/.0.39 per common and investment share. This higher than usual dividend reflects the funds freed up by our successful management of the Piura project, which has come in under budget. In October, we announced the completion of a major repurchase of Lima-traded investment shares at advantageous prices. We believe this exercise created shareholder value, and we will examine options for these investment shares, which are currently being held in Treasury.
4
|
|
Our priority for the fourth quarter of 2015 will be the smooth ramp up of Piura. Cement production began on schedule in the third quarter, and the beginnings of clinker production in the fourth quarter. This additional capacity and the improvement to our logistical flexibility, means we expect to enter 2016 with an EBITDA margin run-rate in the mid-30s. In terms of demand, we continue to monitor environment, and we are cautiously optimistic about the outlook for 2016 in both the self-construction and public sector markets. The efficiency of our current operations, the addition of Piura and our proven ability to deliver healthy financial results in a variety of market conditions means we are well positioned for a positive close to 2015, and a strong 2016.
5
|
|
Economic Overview for 3Q15:
GDP growth was 3.0% in the June-August period according to Apoyo Consultoria, above the growth of 2.0% registered in 2Q15. Consensus estimates for 2015 GDP growth are approximately 2.7%, compared with 2.4% in 2014, with a possible further acceleration in 2016, depending on the intensity of the El Niño phenomenon.
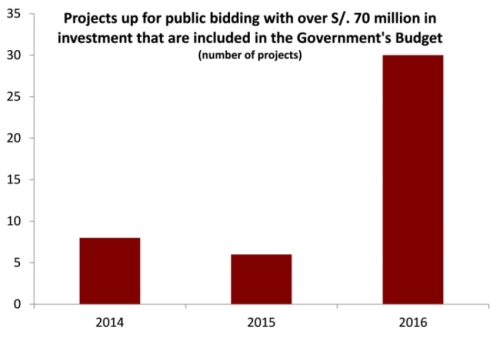
During 2015, the Government has declared 47 large infrastructure projects, totaling more than S/. 8.5 billion, to be viable. This is the step that precedes a public bidding process. These projects should go for public bid in the next 12 months. It is important to note that most of these projects have been included in the 2016 budget, further increasing the likelihood that they will proceed as planned. The rest can be included afterwards or awarded as private public partnerships.
In recent weeks, 4 projects have been set up for public bidding, all of them above S/. 100 million in investment. This trend is expected to continue during the upcoming months.
Source: Apoyo Consultoría
6
|
|
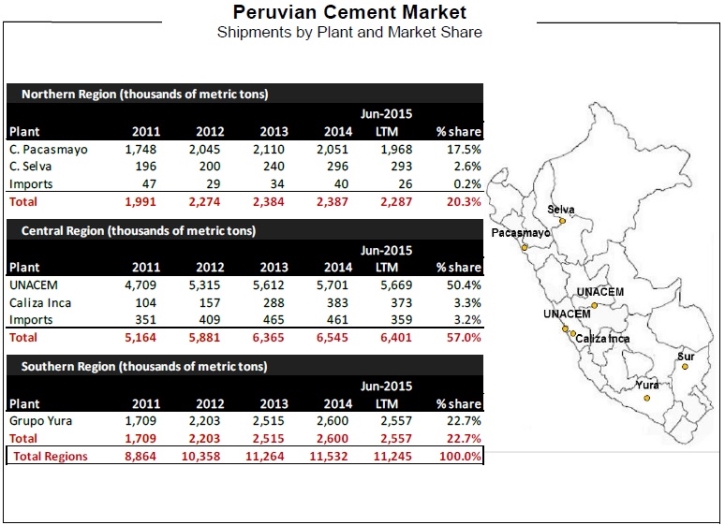
Peruvian Cement Industry Overview:
Cement demand in Peru is mainly supplied by Cementos Pacasmayo, UNACEM and Cementos Yura. Cementos Pacasmayo primarily supplies the northern region of Peru, while UNACEM supplies the central region and Cementos Yura the southern region.
The northern region of Peru, according to the Instituto Nacional de Estadística e Informática (INEI) and Apoyo Consultoría, represents approximately 23% of the country’s population and 14% of national Gross Domestic Product (“GDP”). During the last 10 years, cement dispatches grew at a CAGR of 24%; however, despite this growth, Peru continues to have a significant housing deficit estimated at 1.9 million households throughout the country as per the Ministry of Housing, Construction and Sanitation.
In Peru, the majority of cement is sold to a highly fragmented consumer base of individuals that tend to gradually buy bags of cement to build or to improve their homes, a segment the industry refers to as “self-construction”.
Source: INEI
7
|
|
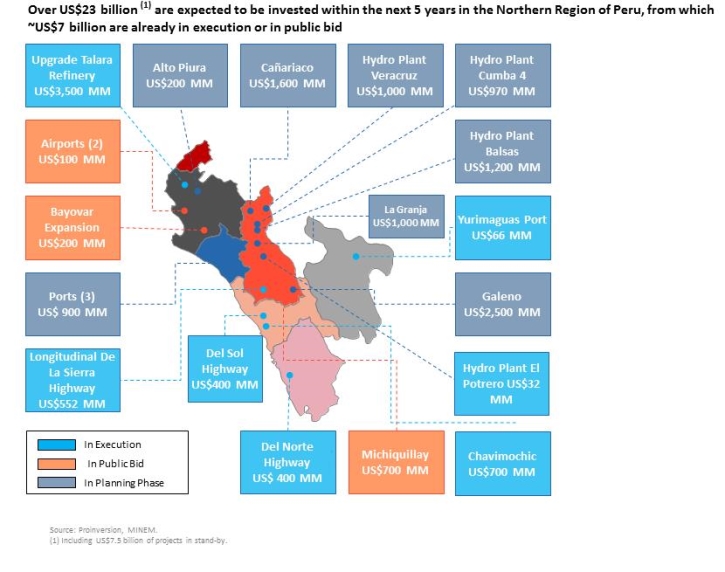
Main Infrastructure Projects in the Area of Influence:
Infrastructure spending in 2015 is expected to total $6.5 billion, a 40% increase from 2014, and to be one of the main drivers of growth for 2016, according to Apoyo Consultoría.
Specifically in the northern region of Peru, where Cementos Pacasmayo is the leading provider of cement, there are three projects in the execution phase.
| ● |
Talara Refinery – Cementos Pacasmayo has been contracted to provide cement, concrete and piles for this project. The Company estimates that as of September 30, 2015, around 15% of the total cement needed has been shipped.
|
|
| ● |
Chavimochic Project – Small shipments began in 3Q15, although Cementos Pacasmayo is still the final stages of contract negotiations to provide cement and concrete for this project.
|
|
| ● |
Longitudinal de la Sierra Highway – Cementos Pacasmayo has been contracted to provide cement and concrete for this project. As of September 30, 2015, the Company estimates that around 30% of the total demand for the project has been shipped.
|
8
|
|
Operating Results:
Production:
Cement Production Volume
(thousands of metric tons)
|
Production
|
||||||
|
3Q15
|
3Q14
|
% Var.
|
9M15
|
9M14
|
% Var.
|
|
|
Pacasmayo Plant
|
491.9
|
501.5
|
-1.9%
|
1,414.5
|
1,516.7
|
-6.7%
|
|
Rioja Plant
|
73.3
|
76.5
|
-4.2%
|
207.1
|
213.3
|
-2.9%
|
|
Piura Plant
|
39.7
|
-
|
N/R
|
39.7
|
-
|
N/R
|
|
Total
|
604.9
|
578.0
|
4.7%
|
1,661.3
|
1,730.0
|
-4.0%
|
Cement production volume at the Pacasmayo plant in 3Q15 remained stable compared to 3Q14, and decreased 6.7% in 9M15 compared to 9M14, due to lower cement demand during the first half of the year, mainly from local and regional governments. This trend has started to reverse during 3Q15 and we expected volumes to continue increasing steadily.
Cement production volume at the Rioja Plant decreased 4.2% in 3Q15 compared to 3Q14, and 2.9% in 9M15 compared to 9M14.
With the new cement plant in Piura now producing cement, total cement production volumes in 3Q15 increased 4.7% compared to 3Q14, and decreased 4.0% in 9M15 compared to 9M14.
Clinker Production Volume
(thousands of metric tons)
|
Production
|
||||||
|
3Q15
|
3Q14
|
% Var.
|
9M15
|
9M14
|
% Var.
|
|
|
Pacasmayo Plant
|
232.3
|
221.5
|
4.9%
|
720.9
|
753.0
|
-4.3%
|
|
Rioja Plant
|
54.0
|
54.8
|
-1.5%
|
170.6
|
163.2
|
4.5%
|
|
Total
|
286.3
|
276.3
|
3.6%
|
891.5
|
916.2
|
-2.7%
|
Clinker production volume at the Pacasmayo plant in 3Q15 increased by 4.9% compared with 3Q14, mainly due to increased cement production in the Pacasmayo and Piura plants. In 9M15 clinker production volume in this plant decrease 4.3% compared to 9M14. Likewise, during 3Q15, 122,857MT of imported clinker were consumed, 6.9% less than the 131,997 MT used in 3Q14. During 9M15, 237,840 MT of imported clinker were consumed, 35.4% less than the 368,320 MT consumed in 9M14. The Company expects to stop using imported clinker as soon as the Piura plant is fully operational.
Clinker production volume at the Rioja plant decreased slightly in 3Q15 compared to 3Q14. In 9M15, production increased 4.5% compared to 9M14, mainly explained by a higher production for inventory purposes during 1Q15.
9
|
|
Quicklime Production Volume
(thousands of metric tons)
|
Production
|
||||||
|
3Q15
|
3Q14
|
% Var.
|
9M15
|
9M14
|
% Var.
|
|
|
Pacasmayo Plant
|
20.3
|
21.2
|
-4.2%
|
77.2
|
75.3
|
2.5%
|
Quicklime production volume decreased 4.2% in 3Q15 compared to 3Q14, in line with a slight decrease in sales volume. During 9M15, quicklime production volume increased 2.5% compared to 9M14, in line with increased demand during the first half of the year.
Installed Capacity:
Installed Cement and Clinker Capacity
Annual installed cement capacity at the Pacasmayo and Rioja plants was stable at 2.9 million MT and 440,000 MT respectively.
The annual installed clinker capacity at the Pacasmayo and Rioja plants remained stable at 1.5 million MT and 280,000 MT respectively.
Utilization Rate1:
Pacasmayo Plant Utilization Rate
|
Utilization Rate
|
||||||
|
3Q15
|
3Q14
|
% Var.
|
9M15
|
9M14
|
% Var.
|
|
|
Cement
|
67.8%
|
69.2%
|
-1.4 pp.
|
65.0%
|
69.7%
|
-4.7 pp.
|
|
Clinker
|
61.9%
|
59.1%
|
2.8 pp.
|
64.1%
|
66.9%
|
-2.8 pp.
|
|
Quicklime
|
33.8%
|
35.3%
|
-1.5 pp.
|
42.9%
|
41.8%
|
1.1 pp.
|
The utilization rate of cement production at the Pacasmayo plant remained stable in 3Q15 compared to 3Q14, and decreased 4.7 percentage points in 9M15 compared to 9M14, reflecting lower demand during the first half of the year.
The utilization rate of clinker production in 3Q15 was 2.8 percentage points higher than in 3Q14, due to improved demand during this quarter. In 9M15 the utilization rate decreased 2.8 percentage points compared to 9M14.
Additionally, the utilization rate of quicklime production remained stable during 3Q15, compared with 3Q14, as in 9M15 compared to 9M14.
10
|
|
Rioja Plant Utilization Rate
|
Utilization Rate
|
||||||
|
3Q15
|
3Q14
|
% Var.
|
9M15
|
9M14
|
% Var.
|
|
|
Cement
|
66.6%
|
69.5%
|
-2.9 pp.
|
62.8%
|
64.6%
|
-1.8 pp.
|
|
Clinker
|
77.0%
|
78.3%
|
-1.3 pp.
|
81.2%
|
43.7%
|
37.5 pp.
|
The utilization rate of cement production at the Rioja plant was 66.6% in 3Q15, slightly below 3Q14.
The utilization rate of clinker production at the Rioja plant remained stable in 3Q15 compared to 3Q14, reaching 77.0%.
New Cement Plant in Piura
3Q15 was a very important quarter for the new cement plant in Piura since cement production began, according to schedule. The first ton of cement from the Piura facility was produced and shipped September 17, 2015. This is a very important milestone for the Company, which has been investing in this project since 2012 and can now begin to reap the benefits of this investment.
The startup of the plant has gone as planned, reaching its desired production capacity level, with all of the cement related equipment working optimally.
The new plant improves the Company’s competitive position in the northern region of Peru. With production from three plants, the Company is able to serve its market more efficiently. This state-of-the-art plant is the most modern in Latin America. It also reduces transportation costs by enabling the dispatching of cement from plants within closer proximity to the point of sale. Once the clinker production is operational during 4Q15, the Company will achieve significant efficiencies at the consolidated level due to the elimination of imported clinker and the use of more advanced production technology.
As of September 30, 2015, the Company has invested approximately US$ 330.3 million. It is important to highlight that at this point the project is under budget, with a total estimated investment below the original budget of US$ 386 million.

11
|
|
Cement is now being produced and shipped from the Piura plant.


12
|
|
Financial Results:
Income Statement:
The following table shows a summary of the Consolidated Financial Results:
Consolidated Financial Results
(in millions of Nuevos Soles S/.)
|
Income Statement
|
||||||
|
3Q15
|
3Q14
|
% Var.
|
9M15
|
9M14
|
% Var.
|
|
|
Sales of goods
|
313.0
|
316.2
|
-1.0%
|
880.0
|
919.5
|
-4.3%
|
|
Gross Profit
|
141.1
|
129.1
|
9.3%
|
385.7
|
373.3
|
3.3%
|
|
Total operating expenses, net
|
-59.2
|
-58.7
|
0.9%
|
-158.5
|
-169.2
|
-6.3%
|
|
Operating Profit
|
81.9
|
70.4
|
16.3%
|
227.2
|
204.1
|
11.3%
|
|
Total other expenses, net
|
-5.1
|
-11.3
|
-54.9%
|
-15.4
|
-26.9
|
-42.8%
|
|
Profit before income tax
|
76.8
|
59.1
|
29.9%
|
211.8
|
177.2
|
19.5%
|
|
Income tax expense
|
-21.5
|
-18.6
|
15.6%
|
-59.9
|
-55.9
|
7.2%
|
|
Net Income
|
55.3
|
40.5
|
36.5%
|
151.8
|
121.3
|
25.1%
|
|
Non-controlling interests
|
-0.9
|
-0.7
|
28.6%
|
-2.9
|
-2.3
|
26.1%
|
|
Net Income of controller
|
56.3
|
41.2
|
36.7%
|
154.7
|
123.6
|
25.2%
|
Profit for the period increased 36.5% during 3Q15 compared to 3Q14, and 25.1% in 9M15 compared to 9M14, mainly due to a higher gross profit thanks to effective cost cutting initiatives, and a favorable effective exchange rate impact due to a better management of foreign currency risk. As of September 30, 2015, the Company had cross currency swap contracts for all of its US$ 300 million dollar denominated debt.
Sales of Goods:
The following table shows the Sales of Goods and their respective margins by business segment:
Sales: cement, concrete and blocks
(in millions of Nuevos Soles S/.)
|
Cement, concrete and blocks
|
||||||
|
3Q15
|
3Q14
|
% Var.
|
9M15
|
9M14
|
% Var.
|
|
|
Sales of goods
|
280.2
|
276.2
|
1.4%
|
771.1
|
801.6
|
-3.8%
|
|
Cost of Sales
|
-142.6
|
-150.1
|
-5.0%
|
-398.5
|
-436.2
|
-8.6%
|
|
Gross Profit
|
137.5
|
126.1
|
9.0%
|
372.6
|
365.4
|
2.0%
|
|
Gross Margin
|
49.1%
|
45.7%
|
3.4 pp.
|
48.3%
|
45.6%
|
2.7 pp.
|
Sales of cement, concrete and blocks increased 1.4% during 3Q15 compared to 3Q14, as demand from the public sector started to materialize. Likewise, gross margin increased 3.4 percentage points during 3Q15 compared to 3Q14, mainly driven by lower use of imported clinker and sustained operational efficiencies.
During 9M15 sales of cement, concrete and blocks decreased 3.8% compared to 9M14. However, gross margin increased 2.7 percentage points during 9M15 compared to 9M14, mainly driven by lower use of imported clinker and a lower clinker/cement ratio.
13
|
|
Sales of cement represented 85.8% of cement, concrete and block sales during 3Q15.
|
Cement
|
||||||
|
3Q15
|
3Q14
|
% Var.
|
9M15
|
9M14
|
% Var.
|
|
|
Sales of goods
|
240.3
|
234.6
|
2.4%
|
664.1
|
683.5
|
-2.8%
|
|
Cost of Sales
|
-116.7
|
-121.2
|
-3.7%
|
-323.0
|
-354.6
|
-8.9%
|
|
Gross Profit
|
123.6
|
113.4
|
9.0%
|
341.1
|
328.9
|
3.7%
|
|
Gross Margin
|
51.4%
|
48.3%
|
3.1 pp.
|
51.4%
|
48.1%
|
3.3 pp.
|
Sales of cement increased 2.4% in 3Q15 compared to 3Q14, reflecting the improvement in cement demand in the northern market. Likewise, gross margin improved 3.1 percentage points in 3Q15 compared to 3Q14. During 9M15, cement sales decreased 2.8% compared to 9M14. However, gross margin improved by 3.3 percentage points in 9M15 compared to 9M14. This was mainly driven by lower use of imported clinker, an improvement in the clinker/cement ratio.
Sales of concrete represented 10.6% of cement, concrete and block sales during 3Q15.
|
Concrete
|
||||||
|
3Q15
|
3Q14
|
% Var.
|
9M15
|
9M14
|
% Var.
|
|
|
Sales of goods
|
29.8
|
33.1
|
-10.0%
|
82.2
|
93.1
|
-11.7%
|
|
Cost of Sales
|
-20.2
|
-22.9
|
-11.8%
|
-59.7
|
-64.2
|
-7.0%
|
|
Gross Profit
|
9.5
|
10.2
|
-6.9%
|
22.5
|
28.9
|
-22.1%
|
|
Gross Margin
|
31.9%
|
30.8%
|
1.1 pp.
|
27.4%
|
31.0%
|
-3.6 pp.
|
Sales of concrete decreased 10.0% during 3Q15 compared to 3Q14. Although still decreasing, there has been an improvement in quarterly volumes when compared to previous quarters. Gross margin increased 1.1 percentage points during 3Q15 compared to 3Q14, mainly due to increase in prices. Likewise, sales decreased 11.7% and gross margin 3.6 percentage points during 9M15 compared to 9M14, mainly explained by a decrease in sales volume due to delays in medium and large infrastructure projects during the first 6 months of the year.
Sales of blocks represented 3.6% of cement, concrete and block sales during 3Q15.
|
Blocks, bricks and pavers
|
||||||
|
3Q15
|
3Q14
|
% Var.
|
9M15
|
9M14
|
% Var.
|
|
|
Sales of goods
|
10.1
|
8.5
|
18.8%
|
24.7
|
25.0
|
-1.2%
|
|
Cost of Sales
|
-5.7
|
-6.0
|
-5.0%
|
-15.8
|
-17.4
|
-9.2%
|
|
Gross Profit
|
4.4
|
2.5
|
76.0%
|
8.9
|
7.6
|
17.1%
|
|
Gross Margin
|
43.6%
|
29.4%
|
14.2 pp.
|
36.0%
|
30.4%
|
5.6 pp.
|
During 3Q15, blocks, bricks and pavers sales increased 18.8% compared to 3Q14 and gross margin improved 14.2 percentage points, mainly due to greater sales for infrastructure projects. In 9M15, sales remained stable compared to 9M14. However, gross margin improved 5.6 percentage points compared to 9M14, mainly due to the higher margin from products provided to infrastructure projects.
14
|
|
Sales: Quicklime
(in millions of Nuevos Soles S/.)
|
Quicklime
|
||||||
|
3Q15
|
3Q14
|
% Var.
|
9M15
|
9M14
|
% Var.
|
|
|
Sales of goods
|
14.7
|
15.2
|
-3.3%
|
53.9
|
45.7
|
17.9%
|
|
Cost of Sales
|
-11.7
|
-13.0
|
-10.0%
|
-42.6
|
-39.9
|
6.8%
|
|
Gross Profit
|
3.0
|
2.2
|
36.4%
|
11.3
|
5.8
|
N/R
|
|
Gross Margin
|
20.4%
|
14.5%
|
5.9 pp.
|
21.0%
|
12.7%
|
8.3 pp.
|
Quicklime sales decreased 3.3% in 3Q15 compared to 3Q14, mainly due to a decrease in demand. However, gross margin increased 5.9 percentage points during 3Q15 compared to 3Q14, mainly due to higher sales price. During 9M15, sales increased 17.9% compared to 9M14, mainly due to an increase in sales volume during the first 6 months of the year. Likewise, gross margin increased 8.3 percentage points in 9M15 compared to 9M14 mainly due to operational efficiencies and higher prices.
Sales: Construction Supplies2
(in millions of Nuevos Soles S/.)
|
Construction Supplies
|
||||||
|
3Q15
|
3Q14
|
% Var.
|
9M15
|
9M14
|
% Var.
|
|
|
Sales of goods
|
17.6
|
24.7
|
-28.7%
|
54.2
|
71.6
|
-24.3%
|
|
Cost of Sales
|
-17.2
|
-23.9
|
-28.0%
|
-52.5
|
-69.3
|
-24.2%
|
|
Gross Profit
|
0.4
|
0.8
|
-50.0%
|
1.7
|
2.3
|
-26.1%
|
|
Gross Margin
|
2.3%
|
3.2%
|
-0.9 pp.
|
3.1%
|
3.2%
|
-0.1 pp.
|
During 3Q15, sales of construction supplies decreased 28.7% compared to 3Q14, and 24.3% in 9M15 compared to 9M14, mainly due to lower demand, in line with the rest of the construction sector, and increased competition which resulted in lower prices. Gross margin during 3Q15 and 9M15 remained stable compared to 3Q14 and 9M14 respectively.
2 Construction supplies include the following products: steel rebars, wires, nails, corrugated iron, electric conductors, plastic tubes and accessories, among others.
15
|
|
Operating Expenses:
Administrative Expenses
(in millions of Nuevos Soles S/.)
|
Administrative expenses
|
||||||
|
3Q15
|
3Q14
|
% Var.
|
9M15
|
9M14
|
% Var.
|
|
|
Personnel expenses
|
29.9
|
25.2
|
18.7%
|
83.8
|
77.6
|
8.0%
|
|
Third-party services
|
14.4
|
16.5
|
-12.7%
|
42.6
|
45.0
|
-5.3%
|
|
Board of directors compensation
|
1.7
|
1.8
|
-5.6%
|
5.1
|
4.4
|
15.9%
|
|
Depreciation and amortization
|
2.9
|
3.5
|
-17.1%
|
8.7
|
8.9
|
-2.2%
|
|
Other
|
2.5
|
2.6
|
-3.8%
|
9.0
|
8.4
|
7.1%
|
|
Total
|
51.4
|
49.6
|
3.6%
|
149.2
|
144.3
|
3.4%
|
Although we have continued to successfully execute our administrative expenses reduction policy, during 3Q15, administrative expenses increased 3.6% compared with 3Q14 mainly due to a one-off increase in personnel expenses due to severance payments. During 9M15 administrative expenses increased 3.4% compared to 9M14.
Selling Expenses
(in millions of Nuevos Soles S/.)
|
Selling and distribution expenses
|
||||||
|
3Q15
|
3Q14
|
% Var.
|
9M15
|
9M14
|
% Var.
|
|
|
Personnel expenses
|
4.8
|
3.7
|
29.7%
|
11.8
|
11.3
|
4.4%
|
|
Advertising and promotion
|
1.9
|
2.3
|
-17.4%
|
6.4
|
7.9
|
-19.0%
|
|
Other
|
1.6
|
1.6
|
0.0%
|
4.3
|
3.9
|
10.3%
|
|
Total
|
8.3
|
7.6
|
9.2%
|
22.5
|
23.1
|
-2.6%
|
During 3Q15 selling expenses increased 9.2% compared to 3Q14, due to a one-off increase in personnel expenses due to severance payments. During 9M15 selling expenses decreased 2.6% compared to 9M14.
EBITDA Reconciliation:
Consolidated EBITDA
(in millions of Nuevos Soles S/.)
|
Consolidated EBITDA
|
||||||
|
3Q15
|
3Q14
|
Var %.
|
9M15
|
9M14
|
Var %.
|
|
|
Net Income
|
55.3
|
40.5
|
36.5%
|
151.8
|
121.3
|
25.1%
|
|
+ Income tax expense
|
21.5
|
18.6
|
15.6%
|
59.9
|
55.9
|
7.2%
|
|
- Finance income
|
-1.3
|
-1.2
|
8.3%
|
-2.8
|
-7.2
|
-61.1%
|
|
+ Finance costs
|
8.4
|
6.4
|
31.3%
|
25.5
|
24.7
|
3.2%
|
|
+/- Net (loss) gain from exchange rate
|
-2.0
|
6.1
|
N/R
|
-7.2
|
9.4
|
N/R
|
|
+ Depreciation and Amortization
|
17.7
|
16.7
|
6.0%
|
50.9
|
47.6
|
6.9%
|
|
Consolidated adjusted EBITDA
|
99.6
|
87.1
|
14.4%
|
278.1
|
251.7
|
10.5%
|
|
EBITDA from FdP y Salsud *
|
3.3
|
2.7
|
22.2%
|
9.2
|
8.1
|
13.6%
|
|
Cement EBITDA
|
102.9
|
89.8
|
14.6%
|
287.3
|
259.8
|
10.6%
|
* Corresponds to EBITDA excluding the Fosfatos del Pacifico and Salmueras Sudamericanas projects which are not linked to the cement business and are currently in pre-operating stages, therefore they are not generating revenues.
16
|
|
During 3Q15, consolidated EBITDA increased 14.4% to S/. 99.6 million compared to S/. 87.1 million in 3Q14, mainly as a result of higher gross margin. During 9M15 EBITDA increased 10.5% compared to 9M14, mainly as a result of the above, as well as the administrative expenses reduction policy.
Cash and Debt Position:
Cash:
Consolidated Cash
(in millions of Nuevos Soles S/.)
As of September 30, 2015, the Company’s cash position was S/. 405.6 million (US$ 125.9 million). This balance includes certificates of deposit for S/. 331.2 million (US$ 102.9 million), distributed as follows:
Certificates of deposits in Nuevos Soles
|
Bank
|
Amount (S/.)
|
Interest rate
|
Initial Date
|
Maturity Date
|
|
Banco de Crédito del Perú
|
S/. 5.0
|
3.60%
|
August 17,2015
|
October 20, 2015
|
|
BBVA Banco Continental
|
S/. 3.0
|
3.95%
|
August 19,2015
|
October 20, 2015
|
|
Banco de Crédito del Perú
|
S/. 10.0
|
4.10%
|
September 14,2015
|
October 13, 2015
|
|
Banco de Crédito del Perú
|
S/. 17.0
|
4.10%
|
August 26,2015
|
October 20, 2015
|
|
Banco de Crédito del Perú
|
S/. 5.0
|
4.10%
|
September 9,2015
|
October 13, 2015
|
|
Banco de Crédito del Perú
|
S/. 30.0
|
4.15%
|
September 1,2015
|
October 20, 2015
|
|
BBVA Banco Continental
|
S/. 10.0
|
4.20%
|
September 10,2015
|
October 13, 2015
|
|
Scotiabank
|
S/. 10.0
|
4.20%
|
September 18,2015
|
October 15, 2015
|
|
Scotiabank
|
S/. 15.0
|
4.80%
|
August 27, 2015
|
October 26, 2015
|
|
S/. 105.0
|
Certificates of deposits in US Dollars
|
Bank
|
Amount (S/.)
|
Interest rate
|
Initial Date
|
Maturity Date
|
|
Banco de Crédito del Perú
|
USD 5.0
|
0.10%
|
August 17,2015
|
October 20, 2015
|
|
Banco de Crédito del Perú
|
USD 7.0
|
0.17%
|
September 30,2015
|
October 13, 2015
|
|
Banco de Crédito del Perú
|
USD 5.0
|
0.22%
|
September 14,2015
|
October 13, 2015
|
|
Banco de Crédito del Perú
|
USD 10.0
|
0.25%
|
May 14,2015
|
November 12,2015
|
|
Banco de Crédito del Perú
|
USD 43.3
|
0.25%
|
July 16,2015
|
October 20, 2015
|
|
USD 70.3
|
The remaining balance of S/. 74.4 million (US$ 23 million) is held mainly in the Company’s bank accounts, of which US$ 8.5million are denominated in US dollars and the remainder in Nuevos Soles.
17
|
|
Debt Position:
Consolidated Debt
(in millions of Nuevos Soles S/.)
Below are the contractual obligations with payment deadlines related to the Company’s debt, including interest.
|
Payments due by period
|
|||||
|
Less than 1 year
|
1-3 Years
|
3-5 Years
|
More than 5
Years
|
Total
|
|
|
Indebtedness
|
-
|
-
|
-
|
966.6
|
966.6
|
|
Future interest payments
|
43.5
|
87.0
|
87.0
|
108.9
|
326.4
|
|
Total
|
43.5
|
87.0
|
87.0
|
1,075.5
|
1,293.0
|
As of September 30, 2015, the Company’s total outstanding debt reached S/. 966.6 million (US$ 300.0 million), which correspond to the international bonds issued in February 2013. These bonds have a coupon rate of 4.50% with a 10-year bullet maturity.
As of September 30, 2015, the Company has entered into cross currency swap hedging agreements for US$300 million to manage foreign exchange risks related to US dollar-denominated debt.
Net Debt/EBITDA ratio was 1.4x
Capex
Capex
(in millions of Nuevos Soles S/.)
During the first nine months of 2015, the Company invested S/. 380.2 million (US$ 118.0 million), allocated to the following projects:
|
Projects
|
9M15
|
|
New Piura Plant
|
335.8
|
|
Pacasmayo Plant Projects
|
6.8
|
|
Construction of diatomite brick plant
|
10.0
|
|
Concrete and aggregates equipment
|
3.6
|
|
Phosphate Project
|
20.5
|
|
Rioja Plant Projects
|
3.3
|
|
Other investing activities
|
0.2
|
|
Total
|
380.2
|
18
|
|
Projects
Fosfatos del Pacífico S.A.
In December 2011, the Company sold a 30% stake of the subsidiary Fosfatos del Pacifico S.A. for US$ 46.1 million to an affiliate of Mitsubishi Corporation, a globally-integrated company listed on the Tokyo Stock Exchange, which develops and operates business in multiple sectors.
In accordance with the terms of sale, Mitsubishi Corporation signed a long-term contract of purchase and sale (Off Take Agreement), in which it commits to acquire 2 million MT of phosphate per year with the option to buy an additional 0.5 million MT per year. The agreement has a term of 20 years.
Fosfatos del Pacifico hired companies to begin a basic engineering study for the project’s various sections. Those selected were: Golder Associates to study the mine, a FL Smidth Minerals-Jacobs-Golder Associates consortium to study the plant, Berenguer Ingenieros to study the port, and Pepsa Tecsult and Aecom to study the electrical transmission and water. During the second half of 2014, value engineering was developed to identify opportunities to improve design, construction, and project operations. Fosfatos del Pacifico hired the main engineering companies (Hatch, Ausenco and WorleyParsons) according to experience and knowledge in various areas. Within the main scope of this value engineering are the change in the methodology of mining, from a conventional mining to a continuous mining system, thereby making the mining process more efficient; the reduction of the footprint of the processing plant without reducing capacity; and size reduction of the port according to the capacity requirements of the project.
In March 2014, the environmental impact study for the phosphate project was approved. This is an important milestone in the development of the project and reflects the Company’s commitment to its execution.
In April 2015, the onsite Laboratory was certified as Overseas Member of the Association of Fertilizer and Phosphate Chemists and ISO 9001.
Currently, the project is in the process of incorporating value engineering findings, from a conceptual level to a basic engineering level, which will allow for a more accurate analysis of the project. In order to integrate the engineering efforts of the different components of the project, through a bidding process, Pacasmayo hired WorleyParsons to act as “Project Management Consultant”, a position it will hold throughout the engineering process, as well as during the procurement, construction, and start of operations.
Salmueras Sudamericanas S.A.
In 2011, the Company signed an agreement with Quimica del Pacifico (Quimpac), a leading Peruvian chemical company, to establish Salmueras Sudamericanas S.A., in which the Company owns 74.9% of the outstanding shares, with Quimpac holding the remaining 25.1%.
The basic engineering study was conducted by the German company, K-Utec AG Salt Technologies, which has over 50 years of experience in the salt business, and is currently being evaluated by both partners in order to determine how to move forward according to their investment priorities. The environmental impact study was approved in December 2014.
19
|
|
About Cementos Pacasmayo S.A.A.
Cementos Pacasmayo S.A.A. is a cement company, located in the Northern region of Peru. In February 2012, the Company’s shares were listed on The New York Stock Exchange - Euronext under the ticker symbol "CPAC". With more than 57 years of operating history, the Company produces, distributes and sells cement and cement-related materials, such as concrete blocks and ready-mix concrete. Cementos Pacasmayo’s products are primarily used in construction, which has been one of the fastest-growing segments of the Peruvian economy in recent years. The Company also produces and sells quicklime for use in mining operations.
For more information, please visit: http://www.cementospacasmayo.com.pe/investors
Note: The Company presented some figures converted from Nuevos Soles to U.S. Dollars for comparison purposes. The exchange rate used to convert Nuevos Soles to U.S. dollars was S/. 3.222 per US$ 1.00, which was the exchange rate, reported as of September 30, 2015 by the Superintendencia de Banca, Seguros y AFP’s (SBS). The information presented in U.S. dollars is for the convenience of the reader only. Certain figures included in this report have been subject to rounding adjustments. Accordingly, figures shown as totals in certain tables may not be arithmetic aggregations of the figures presented in previous quarters.
| This press release may contain forward-looking statements. These statements are statements that are not historical facts, and are based on management’s current view and estimates of future economic circumstances, industry conditions, Company performance and financial results. Also, certain reclassifications have been made to make figures comparable for the periods. The words “anticipates”, “believes”, “estimates”, “expects”, “plans” and similar expressions, as they relate to the Company, are intended to identify forward-looking statements. Statements regarding the declaration or payment of dividends, the implementation of principal operating and financing strategies and capital expenditure plans, the direction of future operations and the factors or trends affecting financial condition, liquidity or results of operations are examples of forward-looking statements. Such statements reflect the current views of management and are subject to a number of risks and uncertainties. There is no guarantee that the expected events, trends or results will actually occur. The statements are based on many assumptions and factors, including general economic and market conditions, industry conditions, and operating factors. Any changes in such assumptions or factors could cause actual results to differ materially from current expectations. |
20
|
|
|
Interim condensed consolidated statements of financial position
|
||||||||
|
As of September 30, 2015 (unaudited) and December 31, 2014 (audited)
|
||||||||
|
Assets
|
As of sep-15
|
As of Dec-14
|
||||||
|
Current Assets
|
S/. (000) | S/. (000) | ||||||
|
Cash and term deposits
|
405,611 | 580,499 | ||||||
|
Trade and other receivables
|
126,575 | 110,843 | ||||||
|
Income tax prepayments
|
29,057 | 15,042 | ||||||
|
Inventories
|
309,217 | 324,070 | ||||||
|
Prepayments
|
12,538 | 4,367 | ||||||
| 882,998 | 1,034,821 | |||||||
|
As of sep-15
|
As of Dec-14
|
|||||||
|
Non-current assets
|
S/. (000) | S/. (000) | ||||||
|
Other receivables
|
62,346 | 53,948 | ||||||
|
Prepayments
|
1,585 | 744 | ||||||
|
Available-for-sale financial investments
|
470 | 12,251 | ||||||
|
Other financial instruments
|
108,287 | 12,251 | ||||||
|
Property, plant and equipment
|
2,396,914 | 2,060,976 | ||||||
|
Exploration and evaluation assets
|
77,145 | 57,740 | ||||||
|
Deferred income tax assets
|
20,485 | 17,175 | ||||||
|
Other assets
|
828 | 981 | ||||||
| 2,668,060 | 2,216,066 | |||||||
|
Total assets
|
3,551,058 | 3,250,887 | ||||||
|
Liabilities and equity
|
As of sep-15
|
As of Dec-14
|
||||||
|
Current liabilities
|
S/. (000) | S/. (000) | ||||||
|
Trade and other payables
|
300,878 | 137,569 | ||||||
|
Income tax payable
|
2,467 | 8,720 | ||||||
|
Provisions
|
49,126 | 53,826 | ||||||
| 352,471 | 200,115 | |||||||
|
As of sep-15
|
As of Dec-14
|
|||||||
|
Non-current liabilities
|
S/. (000) | S/. (000) | ||||||
|
Interest-bearing loans and borrowings
|
954,996 | 883,564 | ||||||
|
Other non-current provisions
|
4,435 | 657 | ||||||
|
Deferred income tax liabilities
|
114,589 | 85,883 | ||||||
| 1,074,020 | 970,104 | |||||||
|
Total liabilities
|
1,426,491 | 1,170,219 | ||||||
|
Equity
|
As of sep-15
|
As of Dec-14
|
||||||
| S/. (000) | S/. (000) | |||||||
|
Capital stock
|
531,461 | 531,461 | ||||||
|
Investment shares
|
50,503 | 50,503 | ||||||
|
Additional paid-in capital
|
553,466 | 553,791 | ||||||
|
Legal reserve
|
170,380 | 154,905 | ||||||
|
Other reserves
|
41,656 | 5,144 | ||||||
|
Retained earnings
|
673,058 | 696,736 | ||||||
|
Equity attributable to equity holders of the parent
|
2,020,524 | 1,992,540 | ||||||
|
Non-controlling interests
|
104,043 | 78,145 | ||||||
|
Total equity
|
2,124,567 | 2,070,685 | ||||||
|
Total liabilities and equity
|
3,551,058 | 3,240,904 | ||||||
21
|
|
|
Interim condensed consolidated statements of profit or loss
|
||||||||||||||||
|
For the three and nine-month periods ended September 30, 2015 and 2014 (both unaudited)
|
||||||||||||||||
| 3Q15 | 3Q14 | 9M15 | 9M14 | |||||||||||||
| S/.(000) | S/.(000) | S/.(000) | S/.(000) | |||||||||||||
|
Sales of goods
|
312,965 | 316,204 | 880,031 | 919,547 | ||||||||||||
|
Cost of sales
|
-171,889 | -187,127 | -494,337 | -546,260 | ||||||||||||
|
Gross profit
|
141,076 | 129,077 | 385,694 | 373,287 | ||||||||||||
|
Operating expenses
|
||||||||||||||||
|
Administrative expenses
|
-51,383 | -49,583 | -149,145 | -144,349 | ||||||||||||
|
Selling and distribution expenses
|
-8,305 | -7,553 | -22,510 | -23,119 | ||||||||||||
|
Other operating expenses, net
|
532 | -1,514 | 13,132 | -1,715 | ||||||||||||
|
Total operating expenses , net
|
-59,156 | -58,650 | -158,523 | -169,183 | ||||||||||||
|
Operating profit
|
81,920 | 70,427 | 227,171 | 204,104 | ||||||||||||
|
Other income (expenses)
|
||||||||||||||||
|
Finance income
|
1,271 | 1,252 | 2,757 | 7,231 | ||||||||||||
|
Finance costs
|
-8,411 | -6,355 | -25,456 | -24,698 | ||||||||||||
|
Loss from exchange difference, net
|
2,013 | -6,217 | 7,279 | -9,435 | ||||||||||||
|
Total other expenses, net
|
-5,127 | -11,320 | -15,420 | -26,902 | ||||||||||||
|
Profit before income tax
|
76,793 | 59,107 | 211,751 | 177,202 | ||||||||||||
|
Income tax expense
|
-21,472 | -18,635 | -59,906 | -55,933 | ||||||||||||
|
Profit for the period
|
55,321 | 40,472 | 151,845 | 121,269 | ||||||||||||
|
Attributable to:
|
||||||||||||||||
|
Equity holders of the parent
|
56,262 | 41,197 | 154,747 | 123,560 | ||||||||||||
|
Non-controlling interests
|
-941 | -725 | -2,902 | -2,291 | ||||||||||||
|
Net income
|
55,321 | 40,472 | 151,845 | 121,269 | ||||||||||||
|
Earnings per share
|
||||||||||||||||
|
Basic and diluted for period attributable to equity holders of common
shares and investment shares of the parent (S/. per share)
|
0.10 | 0.07 | 0.27 | 0.21 | ||||||||||||
22
|
|
|
Capital stock
S/.(000)
|
Investment
shares
S/.(000)
|
Additional
paid-in capital
S/.(000)
|
Legal reserve
S/.(000)
|
Unrealized
gain on
available-for-
sale
investments
S/.(000)
|
Unrealized
gain on
derivative
financial
instrument
S/.(000)
|
Retained
earnings
S/.(000)
|
Total
S/.(000)
|
Non
controlling
interests
S/.(000)
|
Total equity
S/.(000)
|
|||||||||||||||||||||||||||||||
|
Balance as of January 1, 2014
|
531,461 | 50,503 | 556,294 | 119,833 | 19,045 | - | 653,704 | 1,930,840 | 78,630 | 2,009,470 | ||||||||||||||||||||||||||||||
|
Profit for the period
|
- | - | - | - | - | - | 123,560 | 123,560 | -2,291 | 121,269 | ||||||||||||||||||||||||||||||
|
Other comprehensive income
|
- | - | - | - | -4,685 | - | - | -4,685 | - | -4,685 | ||||||||||||||||||||||||||||||
|
Total comprehensive income
|
- | - | - | - | -4,685 | 123,560 | 118,875 | -2,291 | 116,584 | |||||||||||||||||||||||||||||||
|
Appropriation of legal reserve
|
- | - | - | 11,267 | - | - | -11,267 | - | - | - | ||||||||||||||||||||||||||||||
|
Terminated dividends
|
- | - | - | 1,670 | - | - | - | 1,670 | - | 1,670 | ||||||||||||||||||||||||||||||
|
Contribution of non-controlling interests
|
- | - | - | - | - | - | - | - | 1,050 | 1,050 | ||||||||||||||||||||||||||||||
|
Other adjustments of non-controlling interests
|
- | - | -2,503 | - | - | - | - | -2,503 | 2,503 | - | ||||||||||||||||||||||||||||||
|
Balance as of September 30, 2014
|
531,461 | 50,503 | 553,791 | 132,770 | 14,360 | - | 765,997 | 2,048,882 | 79,892 | 2,128,774 | ||||||||||||||||||||||||||||||
|
Profit for the year
|
- | - | - | - | - | - | 155,634 | 155,634 | -3,351 | 152,283 | ||||||||||||||||||||||||||||||
|
Other comprehensive income
|
- | - | - | - | 819 | - | - | 2,334 | 76 | 2,410 | ||||||||||||||||||||||||||||||
|
Total comprehensive income
|
- | - | - | - | 819 | - | 155,634 | 156,453 | -3,275 | 153,178 | ||||||||||||||||||||||||||||||
|
Refund of capital in subsidiary to non-controlling interests
|
- | - | - | - | - | - | - | - | -1,024 | -1,024 | ||||||||||||||||||||||||||||||
|
Appropriation of legal reserve
|
- | - | - | 14,612 | - | - | -14,612 | - | - | - | ||||||||||||||||||||||||||||||
|
Dividends
|
- | - | - | - | - | - | -58,196 | -58,196 | - | -58,196 | ||||||||||||||||||||||||||||||
|
Contribution of non-controlling interests
|
- | - | - | - | - | - | - | - | 19,882 | 19,882 | ||||||||||||||||||||||||||||||
|
Other adjustments of non-controlling interests
|
- | - | -2,184 | - | - | - | - | -2,184 | 2,184 | - | ||||||||||||||||||||||||||||||
|
Balance as of January 1, 2015
|
531,461 | 50,503 | 553,791 | 154,905 | 218 | 4,926 | 696,736 | 1,992,540 | 78,145 | 2,070,685 | ||||||||||||||||||||||||||||||
|
Profit for the period
|
- | - | - | - | - | - | 154,747 | 154,747 | -2,902 | 151,845 | ||||||||||||||||||||||||||||||
|
Other comprehensive income
|
- | - | - | - | -204 | 36,716 | - | 36,512 | - | 36,512 | ||||||||||||||||||||||||||||||
|
Total comprehensive income
|
- | - | - | - | -204 | 36,716 | 154,747 | 191,259 | -2,902 | 188,357 | ||||||||||||||||||||||||||||||
23
Serious News for Serious Traders! Try StreetInsider.com Premium Free!
You May Also Be Interested In
- Infectious Disease Connect Expands Telemedicine Services
- DP World Names Manuel Martinez CEO of DP World Dominicana
- PowerBand Provides Update on Filing of Financial Statements
Create E-mail Alert Related Categories
SEC FilingsSign up for StreetInsider Free!
Receive full access to all new and archived articles, unlimited portfolio tracking, e-mail alerts, custom newswires and RSS feeds - and more!
