

Form 6-K CEMENTOS PACASMAYO SAA For: Feb 13
 Tweet
Tweet Share
ShareUNITED STATES
SECURITIES AND EXCHANGE COMMISSION
Washington, D.C. 20549
FORM 6-K
REPORT OF FOREIGN ISSUER
PURSUANT TO RULE 13a-16 OR 15b-16 OF
THE SECURITIES EXCHANGE ACT OF 1934
For the month of February 2015
Commission File Number 001-35401
CEMENTOS PACASMAYO S.A.A.
(Exact name of registrant as specified in its charter)
PACASMAYO CEMENT CORPORATION
(Translation of registrant’s name into English)
Republic of Peru
(Jurisdiction of incorporation or organization)
Calle La Colonia 150, Urbanización El Vivero
Surco, Lima
Peru
(Address of principal executive offices)
Indicate by check mark whether the registrant files or will file annual reports under cover Form 20-F or Form 40-F.
Form 20-F ____X___ Form 40-F _______
Indicate by check mark if the registrant is submitting the Form 6-K in paper as permitted by Regulation S-T Rule 101(b)(1): [ ]
Indicate by check mark if the registrant is submitting the Form 6-K in paper as permitted by Regulation S-T Rule 101(b)(7): [ ]
Indicate by check mark whether the registrant by furnishing the information contained in this Form is also thereby furnishing the information to the Commission pursuant to Rule 12g3-2(b) under the Securities Exchange Act of 1934.
Yes _______ No ___X____
If “Yes” is marked, indicate below the file number assigned to the registrant in connection with Rule 12g3-2(b): Not applicable.
Signature
Pursuant to the requirements of the Securities Exchange Act of 1934, the registrant has duly caused this report to be signed on its behalf by the undersigned, thereunto duly authorized.
CEMENTOS PACASMAYO S.A.A.
By: /s/ CARLOS JOSE MOLINELLI MATEO
Name: Carlos Jose Molinelli Mateo
Title: Stock Market Representative
Date: February 13, 2015

 |
 |
Cementos Pacasmayo S.A.A. Announces Consolidated
Results for Fourth Quarter 2014
Lima, Peru, February 13, 2015 – Cementos Pacasmayo S.A.A. and subsidiaries (NYSE: CPAC; BVL: CPACASC1) (“the Company” or “Cementos Pacasmayo”) a Peruvian cement company, announced today its consolidated results for the fourth quarter (“4Q14”) and twelve months (“2014”) ended December 31, 2014. These results have been prepared in accordance with International Financial Reporting Standards (“IFRS”) and are stated in nominal Peruvian Nuevos Soles (S/.).
Financial Highlights:
It is important to note the following highlights:
|
●
|
Net income increased 24.0% (S/. 188.8 million in 2014 vs. S/. 152.3 million in 2013), as a result of operating efficiencies, a decrease in administrative expenses, and a lower loss from exchange rate difference.
|
|
●
|
Operating margin increased 0.6 percentage points in 2014, compared to 2013, mainly explained by lower administrative expenses, and an extraordinary income.
|
|
●
|
Gross margin decreased 0.5 percentage points in 2014, compared to 2013, mainly due to a lower gross profit in the concrete segment.
|
|
●
|
Consolidated EBITDA increased 4.7% (S/. 365.3 million in 2014 vs. S/. 348.9 million in 2013).
|
|
●
|
Cement sales volume remained flat in 2014, compared to 2013.1
|
|
●
|
Sales increased 0.2% in 2014, compared to 2013.
|
|
●
|
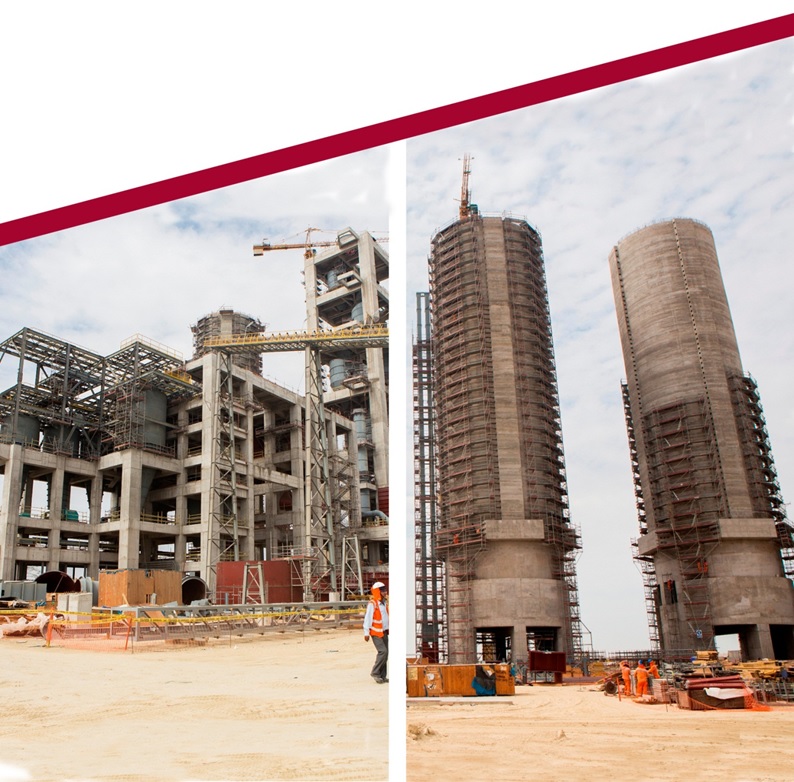
The Piura plant project, remains within the timeline and budget planned; production is scheduled to begin during the second half of 2015.
|
1 Cement sales volume during 2014 includes the cement used for the construction of the new Piura plant.
2
| |
|
4Q14 versus 4Q13:
|
●
|
Net income increased 92.9% (S/. 67.5 million in 4Q14 vs. S/. 35.0 million in 4Q13), mainly driven by an increase in operating profit, and a lower net loss from exchange rate differences during the quarter.
|
|
●
|
Operating margin increased by 7.4 percentage points in 4Q14 compared to 4Q13, mainly as a result of operating efficiencies, a decrease in administrative expenses, and an extraordinary income.
|
|
●
|
Gross margin increased by 4.6 percentage points in 4Q14 compared to 4Q13, mainly due to a cement production optimization.
|
|
●
|
Consolidated EBITDA increased 32.4% (S/. 113.6 million in 4Q14 vs. S/. 85.8 million in 4Q13).
|
|
●
|
Sales volumes remained flat in 4Q14 compared to 4Q13.2
|
|
●
|
Sales increased 2.0% in 4Q14 compared to 4Q13, mainly due to an increase in cement and quicklime sales.
|
|
Financial and Operating Results
|
||||||||||||||||||||||||
| 4Q14 | 4Q13 |
% Var.
|
2014 | 2013 |
% Var.
|
|||||||||||||||||||
|
In millions of S/.
|
||||||||||||||||||||||||
|
Sales of goods
|
323.0 | 316.7 | 2.0 | % | 1,242.6 | 1,239.7 | 0.2 | % | ||||||||||||||||
|
Gross profit
|
145.1 | 127.6 | 13.7 | % | 518.4 | 523.4 | -1.0 | % | ||||||||||||||||
|
Operating profit
|
96.4 | 71.0 | 35.8 | % | 300.5 | 293.0 | 2.6 | % | ||||||||||||||||
|
Net income
|
67.5 | 35.0 | 92.9 | % | 188.8 | 152.3 | 24.0 | % | ||||||||||||||||
|
Net income of Controlling Interest
|
69.3 | 36.0 | 92.5 | % | 192.8 | 155.6 | 23.9 | % | ||||||||||||||||
|
Consolidated EBITDA
|
113.6 | 85.8 | 32.4 | % | 365.3 | 348.9 | 4.7 | % | ||||||||||||||||
|
Cement EBITDA *
|
117.3 | 89.5 | 31.1 | % | 377.1 | 361.5 | 4.3 | % | ||||||||||||||||
|
Gross Margin
|
44.9 | % | 40.3 | % |
4.6 pp.
|
41.7 | % | 42.2 | % |
-0.5 pp.
|
||||||||||||||
|
Operating Margin
|
29.8 | % | 22.4 | % |
7.4 pp.
|
24.2 | % | 23.6 | % |
0.6 pp.
|
||||||||||||||
|
Net income Margin
|
20.9 | % | 11.1 | % |
9.8 pp.
|
15.2 | % | 12.3 | % |
2.9 pp.
|
||||||||||||||
|
Net Income of Controlling Interest Margin
|
21.5 | % | 11.4 | % |
10.1 pp.
|
15.5 | % | 12.6 | % |
2.9 pp.
|
||||||||||||||
|
Consolidated EBITDA Margin
|
35.2 | % | 27.1 | % |
8.1 pp.
|
29.4 | % | 28.1 | % |
1.3 pp.
|
||||||||||||||
|
Cement EBITDA Margin
|
36.3 | % | 28.3 | % |
8.0 pp.
|
30.3 | % | 29.2 | % |
1.1 pp.
|
||||||||||||||
* Corresponds to EBITDA excluding the Fosfatos del Pacifico and Salmueras Sudamericanas projects which are not linked to the cement business and are currently in pre-operating stages, therefore they are not generating revenues.
2 Cement sales volume during 4Q14 includes the cement used for the construction of the new Piura plant.
3
| |
|
Economic Overview for 4Q14:
During 2014, the Peruvian economy faced a lesser growth in consumption and investment due to a decrease in the terms of trade, and a reduction of public spending. This is mainly as a result of difficulties in the implementation of regional and local government investment programs, and some climate-related factors, such as a slight increase in water temperature, which affected key sectors such as agriculture and fishing
.
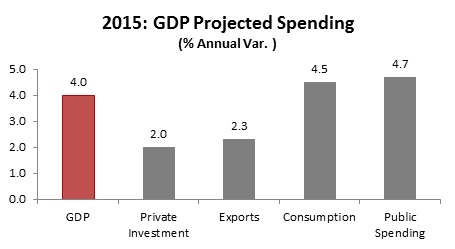
For 2015, a recovery of the GDP is expected, which would be increased from 2.4 % in 2014, to 4.0 %, mainly due to the partial reversal of supply shocks observed during 2014 (climate-related factors), the recovery of demand based on higher public spending, and the recovery of business confidence.
In terms of the construction sector, after some months of decline, 4Q14 has already seen a slight recovery which is expected to remain and increase during 2015-2016. An increase in investment in infrastructure already granted is expected, in addition to the recovery of local and regional governments spending, after having been stagnat during 2014. The greater dynamism will be during the second half of 2015, due to the new local authorities needing time to adjust at the beginning of their administration. Finally, during the second half also, the impact of the measures implemented by the government to recover domestic demand will be felt.
Source: BCRP, Apoyo Consultoria
4
| |
|
Peruvian Cement Industry Overview:
Cement production in Peru is naturally segmented between three geographic regions: the northern region, the central region (including the Lima Metropolitan Area), and the southern region. Cementos Pacasmayo is the only cement manufacturer in the northern region of Peru. UNACEM mainly supplies the central region, while Cementos Yura and Cementos Sur operate in the southern region.
Cementos Pacasmayo supplies all cement needs in the northern region of Peru, which, according to the Instituto Nacional de Estadística e Informática (INEI) and Apoyo Consultoría, represents approximately 23% of the country’s population and 15% of national Gross Domestic Product (“GDP”). During the last 10 years, cement dispatches have grown steadily; however, despite this growth, Peru continues to have a significant housing deficit estimated at 1.9 million households throughout the country as per the Ministry of Housing, Construction and Sanitation.
In Peru, the majority of cement is sold to a highly fragmented consumer base that tend to gradually buy bags of cement to build or to improve their homes, a segment the industry refers to as “self-construction”.
Peruvian Cement Market
Shipments by Plant and Market Share
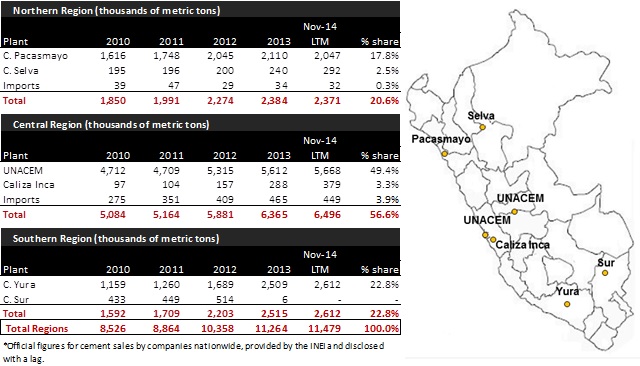 |
Source: INEI
5
| |
|
Main Infrastructure Projects in the Area of Influence:
The current government has expressed its intention to increase and accelerate investment in infrastructure. According to Proinversion, this government has granted the largest amount of public-private partnerships (Asociaciones publico privadas APPs) compared to the last four previous governments, and continues in this direction and has unblocked more than S/. 1,700 million of investment in infrastructure in January of this year. Similarly, the government is actively promoting a higher number of ”Taxes for Infrastructure” (Obras por Impuestos), a mechanism that allows companies to finance public investment projects in exchange for the payment of Income Tax. During 2014, ProInversion reached an amount of S/. 609 million in investment commitments in 83 projects. This investment level is 48% higher than 2013 (S/. 411 million).
This potential increase in infrastructure investment generates a direct impact on the demand for cement. Bearing in mind the natural geographic segmentation of the market, we can infer that the vast majority of public and private infrastructure projects in the northern region would be served by Cementos Pacasmayo. There are currently 3 projects which are close to the execution phase. First is the upgrade of the Talara refinery for which we have already signed a contract for the supply of cement, concrete and piles. Second is the construction of the third phase of the hydraulic infrastructure of Chavimochic project, which is very important for the country and the region since it will incorporate more than 63,000 hectares of agricultural land, and improve irrigation of an additional 48,000 hectares, creating 150,000 jobs in the stage of maturity of the project. Construction is expected to begin during the first half of 2015. Lastly is the North Highway, which will be extended by approximately 900 kilometers to reach the La Libertad and Cajamarca provinces. This project is already under construction and there is a contract for the provision of cement.
In addition, it is important to note that in November 2014, the Minister of Housing, Construction and Sanitation, Milton Von Hesse, announced that a new city entirely planned around to the hydraulic Olmos project, in Lambayeque will be built. According to the Minister, for 2015 the government has already budgeted S/. 140 million to start the construction of roads, sidewalks and sanitation in March. Also, there are some projects in the area of Cajamarca, which despite not being major projects, are important as they reflect the recovery of the economy of the area.
On the map below, we highlight the major projects in execution phase for the coming years.
6
| |
|
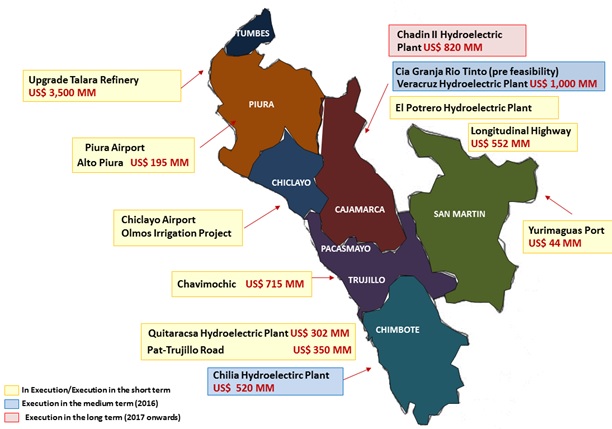
Source: Proinversión, MINEM
7
| |
|
Operating Results:
Production:
Cement Production Volume
(thousands of metric tons)
|
Production
|
||||||||||||||||||||||||
| 4Q14 | 4Q13 |
% Var.
|
2014 | 2013 |
% Var.
|
|||||||||||||||||||
|
Pacasmayo Plant
|
537.1 | 537.0 | 0.0 | % | 2,053.8 | 2,100.5 | -2.2 | % | ||||||||||||||||
|
Rioja Plant
|
83.1 | 72.2 | 15.1 | % | 296.4 | 240.1 | 23.4 | % | ||||||||||||||||
|
Total
|
620.2 | 609.2 | 1.8 | % | 2,350.2 | 2,340.6 | 0.4 | % | ||||||||||||||||
Cement production volume at the Pacasmayo plant in 4Q14 remained flat compared to 4Q13.
Cement production volume at the Rioja Plant increased 15.1% in 4Q14 compared to 4Q13, due to higher cement demand, mainly as a result of serving new markets, and public and private investment projects. During 2014, cement production volume increased 23.4% compared to 2013, due to the initiation of operations of the plant’s expanded capacity, as well as higher demand.
During 2014, total cement production volume remained stable compared to the same period of the previous year, as a result of the lower cement production in the Pacasmayo plant being offset by a production increase in the Rioja plant.
Clinker Production Volume
(thousands of metric tons)
|
Production
|
||||||||||||||||||||||||
| 4Q14 | 4Q13 |
% Var.
|
2014 | 2013 |
% Var.
|
|||||||||||||||||||
|
Pacasmayo Plant
|
260.9 | 324.5 | -19.6 | % | 1,013.9 | 1,189.3 | -14.7 | % | ||||||||||||||||
|
Rioja Plant
|
64.4 | 57.6 | 11.8 | % | 227.6 | 196.2 | 16.0 | % | ||||||||||||||||
|
Total
|
325.3 | 382.1 | -14.9 | % | 1,241.5 | 1,385.5 | -10.4 | % | ||||||||||||||||
Clinker production volume at the Pacasmayo plant decreased 19.6% in 4Q14 compared to 4Q13, mainly due to the scheduled stoppage of the vertical kilns. During 4Q14, 75 thousand MT of imported clinker were consumed, compared with 78 thousand MT in 4Q13; during 2014, 443 thousand MT were consumed, compared with 351 thousand MT in 2013. Additionally, 35 thousand MT of clinker produced internally in stock were used.
Clinker production volume at the Rioja plant increased 11.8% in 4Q14, and 16% in 2014, compared to 4Q13 and 2013, respectively.
8
| |
|
Quicklime Production Volume
(thousands of metric tons)
|
Production
|
||||||||||||||||||||||||
| 4Q14 | 4Q13 |
% Var.
|
2014 | 2013 |
% Var.
|
|||||||||||||||||||
|
Pacasmayo Plant
|
25.2 | 16.2 | 55.6 | % | 100.5 | 66.9 | 50.2 | % | ||||||||||||||||
Quicklime production volume increased 55.6% in 4Q14 compared to 4Q13, and increased 50.2% during 2014 compared with the same period of the prior year, in order to fulfill quicklime demand.
Installed Capacity:
Installed Cement and Clinker Capacity
Annual installed cement capacity at the Pacasmayo plant remained stable at 2.9 million MT. Annual installed cement capacity at the Rioja plant remained flat at 0.44 million MT.
Furthermore, the annual installed clinker capacity at the Pacasmayo plant remained stable at 1.5 million MT. The annual installed clinker capacity at the Rioja plant remained at 0.28 million MT.
Utilization Rate:
Pacasmayo Plant Utilization Rate3
|
Utilization Rate
|
|||||||||||||||||||||
| 4Q14 | 4Q13 |
% Var.
|
2014 | 2013 |
% Var.
|
||||||||||||||||
|
Cement
|
74.1 | % | 74.1 | % |
0.0 pp.
|
70.8 | % | 72.4 | % |
-1.6 pp.
|
|||||||||||
|
Clinker
|
69.6 | % | 86.5 | % |
-16.9 pp.
|
67.6 | % | 79.3 | % |
-11.7 pp.
|
|||||||||||
|
Quicklime
|
42.0 | % | 27.0 | % |
15.0 pp.
|
41.9 | % | 27.9 | % |
14.0 pp.
|
|||||||||||
The utilization rate of cement production at the Pacasmayo plant remained flat during 4Q14 compared to 4Q13.
The utilization rate of clinker production in 4Q14 decreased 16.9 percentage points compared to 4Q13, mainly due to a scheduled maintenance stoppage of the vertical kilns.
Additionally, the utilization rate of quicklime production increased 15.0 percentage points during 4Q14, compared with 4Q13, explained by an increase in quicklime demand.
The utilization rate of cement and clinker production decreased 1.6 and 11.7 percentage points, respectively, during 2014 compared with 2013.
In addition, the utilization rate of quicklime production increased 14.0 percentage points in 2014, compared to 2013, reaching a utilization rate of 41.9%.
3 The utilization rates are calculated by dividing production in a given period over nominal installed capacity. The utilization rate implies annualized production, which is calculated by multiplying real production for each quarter by 4.
9
| |
|
Rioja Plant Utilization Rate4
|
Utilization Rate
|
||||||||||||||||||||||
| 4Q14 | 4Q13 |
% Var.
|
2014 | 2013 |
% Var.
|
|||||||||||||||||
|
Cement
|
75.5 | % | 65.6 | % |
9.9 pp.
|
67.4 | % | 54.6 | % | N/R | ||||||||||||
|
Clinker
|
92.0 | % | 82.3 | % |
9.7 pp.
|
81.3 | % | 70.1 | % | N/R | ||||||||||||
The utilization rate of cement production at the Rioja plant increased 9.9 percentage points in 4Q14, reaching 75.5% compared to 65.6% in 4Q13.
The utilization rate of clinker production at the Rioja plant reached 92.0% in 4Q14 compared to 82.3% reached in 4Q13.
Utilization rates during 2014 and 2013 are not comparable due to the increase by more than 100% of installed capacity for cement production in 2Q13.
4 The utilization rates are calculated by dividing production in a given period over nominal installed capacity. The utilization rate implies annualized production, which is calculated by multiplying real production for each quarter by 4.
10
| |
|
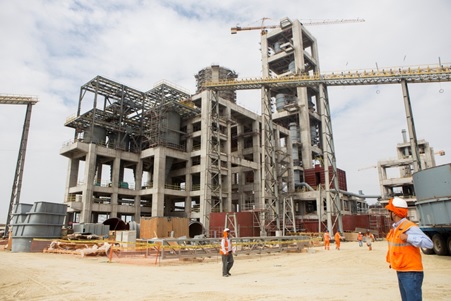
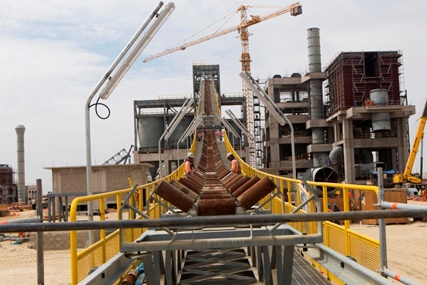
New Cement Plant in Piura
Construction of the new cement plant in Piura began in October 2013. This plant will have a production capacity of 1.6 million tons of cement and 1.0 million tons of clinker.
The new plant will improve our competitive position in the northern region of Peru, thereby covering the territory efficiently with production from 3 plants. This state-of-the-art plant will be the most modern in Peru. It will begin operating during the second half of 2015, and the Company will achieve significant efficiencies at the consolidated level including the elimination of imported clinker usage and decreasing production costs by using improved technology. It will also reduce transportation costs by enabling the dispatching of cement from a plant within closer proximity to the northern part of our area of influence.
As of December 31, 2014, the Company invested approximately US$ 211.5 million. It is important to highlight that, both total investment, estimated at US$ 386 million, and the estimated date to initiate operations, are perfectly aligned with the plan.
11
| |
|
Financial Results:
Income Statement:
The following table shows a summary of the Consolidated Financial Results:
Consolidated Financial Results
(in millions of Nuevos Soles S/.)
|
Income Statement
|
||||||||||||||||||||||||
| 4Q14 | 4Q13 |
% Var.
|
2014 | 2013 |
% Var.
|
|||||||||||||||||||
|
Sales of goods
|
323.0 | 316.7 | 2.0 | % | 1,242.6 | 1,239.7 | 0.2 | % | ||||||||||||||||
|
Gross Profit
|
145.1 | 127.6 | 13.7 | % | 518.4 | 523.4 | -1.0 | % | ||||||||||||||||
|
Total operating expenses, net
|
-48.7 | -56.6 | -14.0 | % | -217.9 | -230.4 | -5.4 | % | ||||||||||||||||
|
Operating Profit
|
96.4 | 71.0 | 35.8 | % | 300.5 | 293.0 | 2.6 | % | ||||||||||||||||
|
Total other expenses, net
|
-7.3 | -6.8 | 7.4 | % | -34.2 | -58.3 | -41.3 | % | ||||||||||||||||
|
Profit before income tax
|
89.1 | 64.2 | 38.8 | % | 266.3 | 234.7 | 13.5 | % | ||||||||||||||||
|
Income tax expense
|
-21.6 | -29.2 | -26.0 | % | -77.5 | -82.4 | -5.9 | % | ||||||||||||||||
|
Profit for the period
|
67.5 | 35.0 | 92.9 | % | 188.8 | 152.3 | 24.0 | % | ||||||||||||||||
|
Non-controlling interests
|
-1.8 | -1.0 | 80.0 | % | -4.0 | -3.3 | 21.2 | % | ||||||||||||||||
|
Equity holders of the parent
|
69.3 | 36.0 | 92.5 | % | 192.8 | 155.6 | 23.9 | % | ||||||||||||||||
Net income increased 92.9% during 4Q14 compared to 4Q13, mainly due to a higher gross margin, lower administrative expenses, extraordinary income and a lower impact of differences in exchange rate due to a better financial management of our obligations. The decrease in income tax, both in 4Q14 and 2014 is explained mainly by the resolution adopted by the Government during December 2014, by which income tax rate is progressively reduced, generating a positive effect on differed income tax.
Sales of Goods:
The following table shows the Sales of Goods and their respective margins by business segment:
Sales: cement, concrete and blocks
(in millions of Nuevos Soles S/.)
|
Cement, concrete and blocks
|
||||||||||||||||||||||||
| 4Q14 | 4Q13 |
% Var.
|
2014 | 2013 |
% Var.
|
|||||||||||||||||||
|
Sales of goods
|
283.8 | 285.1 | -0.5 | % | 1,085.4 | 1,102.1 | -1.5 | % | ||||||||||||||||
|
Cost of Sales
|
-142.7 | -156.0 | -8.5 | % | -578.9 | -587.3 | -1.4 | % | ||||||||||||||||
|
Gross Profit
|
141.1 | 129.1 | 9.3 | % | 506.5 | 514.8 | -1.6 | % | ||||||||||||||||
|
Gross Margin
|
49.7 | % | 45.3 | % |
4.4 pp.
|
46.7 | % | 46.7 | % |
0.0 pp.
|
||||||||||||||
Sales of cement, concrete and blocks decreased 0.5% during 4Q14 with respect to 4Q13. However, gross profit increased 9.3% during 4Q14 compared to 4Q13, and gross margin increased 4.4 percentage points, mainly driven by optimization in cement production costs.
12
| |
|
Sales of cement represented 86.7%, and 85.6% of cement, concrete and block sales during 4Q14 and 2014, respectively.
|
Cement
|
||||||||||||||||||||||||
| 4Q14 | 4Q13 |
% Var.
|
2014 | 2013 |
% Var.
|
|||||||||||||||||||
|
Sales of goods
|
246.0 | 241.6 | 1.8 | % | 929.5 | 919.9 | 1.0 | % | ||||||||||||||||
|
Cost of Sales
|
-116.8 | -127.9 | -8.7 | % | -471.4 | -474.5 | -0.7 | % | ||||||||||||||||
|
Gross Profit
|
129.2 | 113.7 | 13.6 | % | 458.1 | 445.4 | 2.9 | % | ||||||||||||||||
|
Gross Margin
|
52.5 | % | 47.1 | % |
5.4 pp.
|
49.3 | % | 48.4 | % |
0.9 pp.
|
||||||||||||||
Sales of cement increased 1.8% in 4Q14 compared to 4Q13, explained by slight improvement in the economy during the last months of the year. Gross margin improved 5.4 percentage points as a result of higher operating efficiencies during 4Q14 compared to 4Q13.
During 2014 sales of cement increased 1% compared to 2013. Gross profit and gross margin increased 2.9% and 0.9 percentage points respectively, compared to the same period in the prior year.
Sales of concrete represented 10.9% and 11.4% of cement, concrete and block sales during 4Q14 and 2014, respectively.
|
Concrete
|
||||||||||||||||||||||||
| 4Q14 | 4Q13 |
% Var.
|
2014 | 2013 |
% Var.
|
|||||||||||||||||||
|
Sales of goods
|
30.9 | 35.7 | -13.4 | % | 124.0 | 153.6 | -19.3 | % | ||||||||||||||||
|
Cost of Sales
|
-20.9 | -23.6 | -11.4 | % | -85.1 | -96.3 | -11.6 | % | ||||||||||||||||
|
Gross Profit
|
10.0 | 12.1 | -17.4 | % | 38.9 | 57.3 | -32.1 | % | ||||||||||||||||
|
Gross Margin
|
32.4 | % | 33.9 | % |
-1.5 pp.
|
31.4 | % | 37.3 | % |
-5.9 pp.
|
||||||||||||||
Sales of concrete decreased 13.4% during 4Q14 compared to 4Q13, mainly explained by a decrease in sales volume, due to delays in certain public and private projects.
During 2014 sales of concrete decreased 19.3% compared to 2013, while gross margin decreased 5.9 percentage points.
Sales of blocks, bricks and pavers represented 2.4% and 2.9% of cement, concrete and block sales during 4Q14 and 2014, respectively.
|
Blocks, bricks and pavers
|
||||||||||||||||||||||||
| 4Q14 | 4Q13 |
% Var.
|
2014 | 2013 |
% Var.
|
|||||||||||||||||||
|
Sales of goods
|
6.9 | 7.8 | -11.5 | % | 31.9 | 28.6 | 11.5 | % | ||||||||||||||||
|
Cost of Sales
|
-5.0 | -4.5 | 11.1 | % | -22.4 | -16.5 | 35.8 | % | ||||||||||||||||
|
Gross Profit
|
1.9 | 3.3 | -42.4 | % | 9.5 | 12.1 | -21.5 | % | ||||||||||||||||
|
Gross Margin
|
27.5 | % | 42.3 | % |
-14.8 pp.
|
29.8 | % | 42.3 | % |
-12.5 pp.
|
||||||||||||||
During 4Q14, sales of blocks, bricks and pavers decreased 11.5% compared to 4Q13, mainly due to lower sales volume of pavers. Gross margin decreased 14.8 percentage points mainly due to lower fixed cost dilution driven by lower sales volumes.
During 2014, sales of blocks, bricks and pavers increased 11.5%, mainly due to higher sales volume of blocks. Gross margin decreased 12.5 percentage points mainly due to lower sales of pavers.
13
| |
|
Sales: Construction Supplies5
(in millions of Nuevos Soles S/.)
|
Construction Supplies
|
||||||||||||||||||||||||
| 4Q14 | 4Q13 |
% Var.
|
2014 | 2013 |
% Var.
|
|||||||||||||||||||
|
Sales of goods
|
23.8 | 25.6 | -7.0 | % | 95.4 | 103.3 | -7.6 | % | ||||||||||||||||
|
Cost of Sales
|
-23.2 | -24.8 | -6.5 | % | -92.5 | -99.9 | -7.4 | % | ||||||||||||||||
|
Gross Profit
|
0.6 | 0.8 | -25.0 | % | 2.9 | 3.4 | -14.7 | % | ||||||||||||||||
|
Gross Margin
|
2.5 | % | 3.1 | % |
-0.6 pp.
|
3.0 | % | 3.3 | % |
-0.3 pp.
|
||||||||||||||
During 4Q14, sales of construction supplies decreased 7.0% compared to 4Q13. Gross margin during 4Q14 decreased 0.6 percentage points compared to 4Q13.
Sales of construction supplies decreased 7.6% during 2014 compared to 2013, mainly driven by stronger competition in steel rebars.
Sales: Quicklime
(in millions of Nuevos Soles S/.)
|
Quicklime
|
||||||||||||||||||||||||
| 4Q14 | 4Q13 |
% Var.
|
2014 | 2013 |
% Var.
|
|||||||||||||||||||
|
Sales of goods
|
15.4 | 5.6 | 175.0 | % | 61.1 | 31.9 | 91.5 | % | ||||||||||||||||
|
Cost of Sales
|
-12.1 | -7.7 | 57.1 | % | -52.0 | -26.9 | 93.3 | % | ||||||||||||||||
|
Gross Profit
|
3.3 | -2.1 | N/R | 9.1 | 5.0 | 82.0 | % | |||||||||||||||||
|
Gross Margin
|
21.4 | % | -37.5 | % | N/R | 14.9 | % | 15.7 | % |
-0.8 pp.
|
||||||||||||||
Quicklime sales increased 175.0% in 4Q14 compared to 4Q13, mainly due to an increase in the sales volume of ground quicklime, and to a lesser extent, to higher prices.
Quicklime sales increased 91.5% in 2014 compared with 2014. Gross margin decreased slightly in 2014 compared with 2013.
5 Construction supplies include the following products: steel rebars, wires, nails, corrugated iron, electric conductors, plastic tubes and accessories, among others.
14
| |
|
Operating Expenses:
Administrative Expenses
(in millions of Nuevos Soles S/.)
|
Administrative expenses
|
||||||||||||||||||||||||
| 4Q14 | 4Q13 |
% Var.
|
2014 | 2013 |
% Var.
|
|||||||||||||||||||
|
Personnel expenses
|
22.9 | 27.3 | -16.1 | % | 100.5 | 106.4 | -5.5 | % | ||||||||||||||||
|
Third-party services
|
19.4 | 25.0 | -22.4 | % | 64.4 | 72.6 | -11.3 | % | ||||||||||||||||
|
Board of directors compensation
|
0.5 | 1.4 | -64.3 | % | 4.9 | 5.6 | -12.5 | % | ||||||||||||||||
|
Depreciation and amortization
|
3.7 | 0.3 | N/R | 12.6 | 10.4 | 21.2 | % | |||||||||||||||||
|
Other
|
4.1 | 4.5 | -8.9 | % | 12.5 | 14.0 | -10.7 | % | ||||||||||||||||
|
Total
|
50.6 | 58.5 | -13.5 | % | 194.9 | 209.0 | -6.7 | % | ||||||||||||||||
During 4Q14, administrative expenses decreased 13.5% compared with 4Q13. During 2014 administrative expenses decreased 6.7% compared to 2013, as a result of an expense adjustment policy.
Selling Expenses
(in millions of Nuevos Soles S/.)
|
Selling and distribution expenses
|
||||||||||||||||||||||||
| 4Q14 | 4Q13 |
% Var.
|
2014 | 2013 |
% Var.
|
|||||||||||||||||||
|
Personnel expenses
|
4.1 | 4.1 | - | 15.4 | 14.5 | 6.2 | % | |||||||||||||||||
|
Advertising and promotion
|
1.8 | 1.8 | - | 9.7 | 10.5 | -7.6 | % | |||||||||||||||||
|
Other
|
1.5 | 1.9 | -21.1 | % | 5.4 | 4.8 | 12.5 | % | ||||||||||||||||
|
Total
|
7.4 | 7.8 | -5.1 | % | 30.5 | 29.8 | 2.3 | % | ||||||||||||||||
During 4Q14 selling expenses decreased slightly, mainly due to lower advertising and promotional fees incurred with third parties. During 2014, selling expenses increased slightly, mainly driven by investments in market studies.
15
| |
|
EBITDA Reconciliation:
Consolidated EBITDA
(in millions of Nuevos Soles S/.)
|
Consolidated EBITDA
|
||||||||||||||||||||||||
| 4Q14 | 4Q13 |
Var %.
|
2014 | 2013 |
Var %.
|
|||||||||||||||||||
|
Net Income
|
67.5 | 35.0 | 92.9 | % | 188.8 | 152.3 | 24.0 | % | ||||||||||||||||
|
+ Income tax expense
|
21.6 | 29.3 | -26.3 | % | 77.5 | 82.4 | -5.9 | % | ||||||||||||||||
|
- Finance income
|
-4.5 | -5.7 | -21.1 | % | -11.7 | -27.2 | -57.0 | % | ||||||||||||||||
|
+ Finance costs
|
6.5 | 10.0 | -35.0 | % | 31.2 | 37.1 | -15.9 | % | ||||||||||||||||
|
+/- Net (loss) gain from exchange rate
|
5.3 | 2.4 | N/R | 14.7 | 48.4 | -69.6 | % | |||||||||||||||||
|
+ Depreciation and Amortization
|
17.2 | 14.8 | 16.2 | % | 64.8 | 55.9 | 15.9 | % | ||||||||||||||||
|
Consolidated adjusted EBITDA
|
113.6 | 85.8 | 32.4 | % | 365.3 | 348.9 | 4.7 | % | ||||||||||||||||
|
EBITDA from FdP y Salsud *
|
3.7 | 3.7 | - | 11.8 | 12.6 | -6.3 | % | |||||||||||||||||
|
Cement EBITDA
|
117.3 | 89.5 | 31.1 | % | 377.1 | 361.5 | 4.3 | % | ||||||||||||||||
|
* Corresponds to EBITDA excluding the Fosfatos del Pacifico and Salmueras Sudamericanas projects which are not linked to the cement business and are currently in pre-operating stages, therefore they are not generating revenues.
|
||||||||||||||||||||||||
During 4Q14 consolidated EBITDA increased 32.4% or S/. 27.8 million compared with 4Q13, resulting in a consolidated EBITDA equal to S/. 113.6 million compared to S/. 85.8 millon. The increase was mainly the result of a higher gross margin, lower administrative expenses, an extraordinary income and a lower difference in exchange rate due to improved management of our obligations. Similarly, during 2014 consolidated EBITDA increased 4.7% compared to 2013, equal to S/. 16.4 million which resulted in consolidated EBITDA equal to S/. 365.3 million, compared to S/. 348.9 million during the prior year.
Cash and Debt Position:
Cash:
Consolidated Cash
(in millions of Nuevos Soles S/.)
As of December 31, 2014, the Company’s cash position was S/. 580.5 million (US$ 194.4 million). This balance includes certificates of deposit in Nuevos Soles for S/. 46.0 million (US$ 15.4 million), and in US Dollars for US$ 83.3 million (S/. 248.7 million), distributed as follows:
Certificates of deposits in Nuevos Soles
|
Bank
|
Amount (S/.)
|
Interest rate
|
Initial Date
|
Maturity Date
|
||||||
|
BBVA Banco Continental
|
S/. 41.0 | 3.90 | % |
December 31, 2014
|
January 8, 2015
|
|||||
|
BBVA Banco Continental
|
S/. 5.0 | 3.75 | % |
December 31, 2014
|
January 8, 2015
|
|||||
| S/. 46.0 | ||||||||||
Certificates of deposits in American Dollars
|
Bank
|
Amount (S/.)
|
Interest rate
|
Initial Date
|
Maturity Date
|
|||
|
Banco de Crédito del Perú
|
USD 83.3
|
0.23 | % |
November 27, 2014
|
January 8, 2015
|
||
|
USD 83.3
|
|||||||
16
| |
|
The remaining balance of S/. 285.8 million (US$ 95.7 million) is held in the Company’s bank accounts, in which US$ 79.9 million are denominated in US dollars and the remaining in Nuevos Soles.
Debt Position:
Consolidated Debt
(in millions of Nuevos Soles S/.)
As of December 31, 2014, the Company’s total outstanding debt reached S/. 895.8 million (US$ 300.0 million), which correspond to the international bonds issued in February 2013. These bonds have a coupon rate of 4.50% with a 10-year bullet maturity.
Below are the contractual obligations with payment deadlines related to the Company’s debt, including interest:
|
Payments due by period
|
||||||||||||||||||||
|
Less than 1 year
|
1-3 Years
|
3-5 Years
|
More than 5 Years
|
Total
|
||||||||||||||||
|
Indebtedness
|
- | - | - | 895.8 | 895.8 | |||||||||||||||
|
Future interest payments
|
40.3 | 80.7 | 80.7 | 141.2 | 342.9 | |||||||||||||||
|
Total
|
40.3 | 80.7 | 80.7 | 1,037.0 | 1,238.7 | |||||||||||||||
As of December 31, 2014, the Company has entered into a cross currency swap hedging agreement for US$ 120 million to manage foreign exchange risks related to US dollar-denominated debt.
Capex
Capex
(in millions of Nuevos Soles S/.)
As of December 31, 2014, the Company invested S/. 587.3 million (US$ 196.5 million), allocated to the following projects:
|
Projects
|
2014
|
|||
|
New Piura Plant
|
506.0 | |||
|
Pacasmayo Plant Projects
|
28.8 | |||
|
Construction of diatomite brick plant
|
15.8 | |||
|
Concrete and aggregates equipment
|
17.5 | |||
|
Phosphate Project
|
12.1 | |||
|
Rioja Plant Projects
|
5.4 | |||
|
Other investing activities
|
1.7 | |||
|
Total
|
587.3 | |||
17
| |
|
Projects
Fosfatos del Pacífico S.A.
In December 2011, the Company sold a 30.0% of the shares of the subsidiary Fosfatos del Pacifico S.A. for US$ 46.1 million to an affiliate of Mitsubishi Corporation, a globally-integrated company listed on the Tokyo Stock Exchange, which develops and operates business in multiple sectors.
In accordance with the terms of sale, Mitsubishi Corporation signed a long-term contract of purchase and sale (Off Take Agreement), in which it commits to acquire 2.0 million MT of phosphate per year with the option to buy an additional 0.5 million MT per year. The agreement has a term of 20 years.
Pacasmayo hired companies to begin a basic engineering study for the project’s various sections. Those selected were: Golder Associates to study the mine, a FL Smidth Minerals-Jacobs-Golder Associates consortium to study the plant, Berenguer Ingenieros to study the port, and Pepsa Tecsult and Aecom to study the electrical transmission and water. During the second half of 2014, value engineering was developed to identify opportunities to improve design, construction, and project operations. Pacasmayo hired the main engineering companies (Hatch, Ausenco and WorleyParsons) according to experience and knowledge in various areas. Within the main scope of this value engineering are the change in the methodology of mining, from a conventional mining to a continuous mining system, thereby making the mining process more efficient; comparting the plant while maintaining the production capacity; and reducing the size of the port according to requirements.
In March 2014, the environmental impact study for the phosphate project was approved. This is an important milestone in the development of the project and reflects the Company’s commitment to its execution.
Currently, the project is in the process of incorporating value engineering findings, from a conceptual level to a basic engineering level, which will allow for a more accurate analysis of the project. In order to integrate the engineering efforts of the different components of the project, through a bidding process, Pacasmayo hired WorleyParsons to act as “Project Management Consultant”, a position it will hold throughout the engineering process, as well as during the procurement, construction, and start of operations.
Salmueras Sudamericanas S.A.
In 2011, the Company signed an agreement with Quimica del Pacifico (Quimpac), a leading Peruvian chemical company, to establish Salmueras Sudamericanas S.A., in which the Company owns 74.9% of the outstanding shares, with Quimpac holding the remaining 25.1%.
Currently, the Company continues in the basic engineering development stage with German company, K-UTEC AG Salt Technologies, which has over 50 years of experience in the salt business, which will provide accurate information with which to measure the size of the industrial complex and provide more details regarding the production process. In December 2014 the Ministry of Production granted approval to the Environmental Impact Study.
18
| |
|
About Cementos Pacasmayo S.A.A.
Cementos Pacasmayo S.A.A. is a cement company, located in the Northern region of Peru. In February 2012, the Company’s shares were listed on The New York Stock Exchange - Euronext under the ticker symbol "CPAC". With more than 56 years of operating history, the Company produces, distributes and sells cement and cement-related materials, such as concrete blocks and ready-mix concrete. Cementos Pacasmayo’s products are primarily used in construction, which has been one of the fastest-growing segments of the Peruvian economy in recent years. The Company also produces and sells quicklime for use in mining operations.
For more information, please visit: http://www.cementospacasmayo.com.pe/investors/
Note: The Company presented some figures converted from Nuevos Soles to U.S. Dollars for comparison purposes. The exchange rate used to convert Nuevos Soles to U.S. dollars was S/. 2.986 per US$ 1.00, which was the exchange rate, reported as of December 31, 2014 by the Superintendencia de Banca, Seguros y AFP’s (SBS). The information presented in U.S. dollars is for the convenience of the reader only. Certain figures included in this report have been subject to rounding adjustments. Accordingly, figures shown as totals in certain tables may not be arithmetic aggregations of the figures presented in previous quarters.
This press release may contain forward-looking statements. These statements are statements that are not historical facts, and are based on management’s current view and estimates of future economic circumstances, industry conditions, Company performance and financial results. Also, certain reclassifications have been made to make figures comparable for the periods. The words “anticipates”, “believes”, “estimates”, “expects”, “plans” and similar expressions, as they relate to the Company, are intended to identify forward-looking statements. Statements regarding the declaration or payment of dividends, the implementation of principal operating and financing strategies and capital expenditure plans, the direction of future operations and the factors or trends affecting financial condition, liquidity or results of operations are examples of forward-looking statements. Such statements reflect the current views of management and are subject to a number of risks and uncertainties. There is no guarantee that the expected events, trends or results will actually occur. The statements are based on many assumptions and factors, including general economic and market conditions, industry conditions, and operating factors. Any changes in such assumptions or factors could cause actual results to differ materially from current expectations.
19
| |
|
|
Consolidated statements of financial position
|
||||||||
|
As of December 31, 2014 and 2013
|
||||||||
|
Assets
|
As of Dic-14
|
As of Dec-13
|
||||||
|
Current assets
|
S/.(000) | S/.(000) | ||||||
|
Cash and term deposits
|
580,499 | 976,952 | ||||||
|
Trade and other receivables
|
110,843 | 68,542 | ||||||
|
Income tax prepayments
|
15,042 | 27,679 | ||||||
|
Inventories
|
324,070 | 334,471 | ||||||
|
Prepayments
|
4,367 | 11,727 | ||||||
| 1,034,821 | 1,419,371 | |||||||
|
As of Dic-14
|
As of Dec-13
|
|||||||
|
Non-current assets
|
S/.(000) | S/.(000) | ||||||
|
Other receivables
|
53,948 | 46,292 | ||||||
|
Prepayments
|
2,268 | 0 | ||||||
|
Available-for-sale financial investments
|
744 | 36,058 | ||||||
|
Other financial instruments
|
12,251 | 0 | ||||||
|
Property, plant and equipment
|
2,060,976 | 1,537,111 | ||||||
|
Exploration and evaluation assets
|
57,740 | 59,330 | ||||||
|
Deferred income tax assets
|
17,175 | 15,155 | ||||||
|
Other assets
|
981 | 1,220 | ||||||
| 2,206,083 | 1,695,166 | |||||||
|
Total assets
|
3,240,904 | 3,114,537 | ||||||
|
Liabilities and equity
|
As of Dic-14
|
As of Dec-13
|
||||||
|
Current liabilities
|
S/.(000) | S/.(000) | ||||||
|
Trade and other payables
|
137,569 | 126,897 | ||||||
|
Income tax payable
|
8,720 | 2,780 | ||||||
|
Provisions
|
53,826 | 27,984 | ||||||
| 200,115 | 157,661 | |||||||
|
As of Dic-14
|
As of Dec-13
|
|||||||
|
Non-current liabilities
|
S/.(000) | S/.(000) | ||||||
|
Interest-bearing loans and borrowings
|
883,564 | 824,022 | ||||||
|
Other non-current provisions
|
657 | 20,497 | ||||||
|
Deferred income tax liabilities, net
|
85,883 | 102,887 | ||||||
| 970,104 | 947,406 | |||||||
|
Total liabilities
|
1,170,219 | 1,105,067 | ||||||
|
Equity
|
As of Dic-14
|
As of Dec-13
|
||||||
|
Capital stock
|
S/.(000) | S/.(000) | ||||||
|
Capital stock
|
531,461 | 531,461 | ||||||
|
Investment shares
|
50,503 | 50,503 | ||||||
|
Additional paid-in capital
|
553,791 | 556,294 | ||||||
|
Legal reserve
|
154,905 | 119,833 | ||||||
|
Other components of equity
|
5,144 | 19,045 | ||||||
|
Retained earnings
|
696,736 | 653,704 | ||||||
|
Equity attributable to owners of the parent
|
1,992,540 | 1,930,840 | ||||||
|
Non-controlling interests
|
78,145 | 78,630 | ||||||
|
Total equity
|
2,070,685 | 2,009,470 | ||||||
|
Total liabilities and equity
|
3,240,904 | 3,114,537 | ||||||
20
| |
|
|
Consolidated statements of profit or loss
|
||||||||||||||||
|
For the three and twelve-month periods ended December 31, 2014 and 2013
|
||||||||||||||||
| 4Q14 | 4Q13 | 2014 | 2013 | |||||||||||||
| S/.(000) | S/.(000) | S/.(000) | S/.(000) | |||||||||||||
|
Sales of goods
|
323,032 | 316,724 | 1,242,579 | 1,239,688 | ||||||||||||
|
Cost of sales
|
(177,888 | ) | (189,122 | ) | (724,148 | ) | (716,239 | ) | ||||||||
|
Gross profit
|
145,144 | 127,602 | 518,431 | 523,449 | ||||||||||||
|
Operating expenses
|
||||||||||||||||
|
Administrative expenses
|
(50,506 | ) | (58,533 | ) | (194,855 | ) | (208,915 | ) | ||||||||
|
Selling and distribution expenses
|
(7,415 | ) | (7,788 | ) | (30,534 | ) | (29,817 | ) | ||||||||
|
Net gain on sale of available-for-sale financial investment
|
10,397 | 10,537 | - | |||||||||||||
|
Other operating (expenses) income, net
|
-1,185 | 9,706 | -3,040 | 8,281 | ||||||||||||
|
Total operating expenses , net
|
(48,709 | ) | (56,615 | ) | (217,892 | ) | (230,451 | ) | ||||||||
|
Operating profit
|
96,435 | 70,987 | 300,539 | 292,998 | ||||||||||||
|
Operating income (expenses)
|
||||||||||||||||
|
Finance income
|
4,474 | 5,682 | 11,705 | 27,213 | ||||||||||||
|
Finance costs
|
(6,498 | ) | (9,989 | ) | (31,196 | ) | (37,103 | ) | ||||||||
|
Loss from exchange difference, net
|
(5,356 | ) | (2,436 | ) | (14,791 | ) | (48,430 | ) | ||||||||
|
Total other expenses, net
|
(7,380 | ) | (6,743 | ) | (34,282 | ) | (58,320 | ) | ||||||||
|
Profit before income tax
|
89,055 | 64,244 | 266,257 | 234,678 | ||||||||||||
|
Income tax expense
|
(21,535 | ) | (29,241 | ) | (77,468 | ) | (82,395 | ) | ||||||||
|
Profit for the period
|
67,520 | 35,003 | 188,789 | 152,283 | ||||||||||||
|
Attributable to:
|
||||||||||||||||
|
Equity holders of the parent
|
69,267 | 36,037 | 192,827 | 155,634 | ||||||||||||
|
Non-controlling interests
|
1,747 | 1,034 | (4,038 | ) | (3,351 | ) | ||||||||||
| 67,520 | 35,003 | 188,789 | 152,283 | |||||||||||||
|
|
||||||||||||||||
|
Earnings per share
|
||||||||||||||||
|
Basic and diluted profit for period attributable to holders of common
shares and investment shares of the parent (S/. per share) |
0.12 | 0.06 | 0.33 | 0.27 | ||||||||||||
|
Profit for the period
|
67,520 | 35,003 | 188,789 | 152,283 | ||||||||||||
21
| |
|
|
Consolidated statements of changes in equity
|
||||||||||||||||||||||||||||||||||||||||||||
|
For the years ended December 31, 2014, 2013 and 2012
|
||||||||||||||||||||||||||||||||||||||||||||
|
Attributable to equity holders of the parent
|
||||||||||||||||||||||||||||||||||||||||||||
|
Capital
stock S/.(000)
|
Investment shares
S/.(000)
|
Additional paid-in capital
S/.(000)
|
Legal
reserve S/.(000)
|
Unrealized gain on available-for-sale investments
S/.(000)
|
Unrealized gain on
cash flow hedge S/.(000) |
Foreign currency translation reserve
S/.(000)
|
Retained earnings
S/.(000)
|
Total
S/.(000)
|
Non-controlling interests
S/.(000)
|
Total
equity S/.(000)
|
||||||||||||||||||||||||||||||||||
|
Balance as of January 1, 2012
|
418,777 | 49,575 | - | 90,451 | 9,257 | - | -1,228 | 473,721 | 1,040,553 | 33,032 | 1,073,585 | |||||||||||||||||||||||||||||||||
|
Profit for the year
|
- | - | - | - | - | - | - | 159,005 | 159,005 | -3,405 | 155,600 | |||||||||||||||||||||||||||||||||
|
Other comprehensive income
|
- | - | - | - | 8,969 | - | -287 | - | 8,682 | -34 | 8,648 | |||||||||||||||||||||||||||||||||
|
Total comprehensive income
|
- | - | - | - | 8,969 | -287 | 159,005 | 167,687 | -3,439 | 164,248 | ||||||||||||||||||||||||||||||||||
|
Proceeds from the issue of
common and investment shares |
111,484 | 928 | 561,191 | - | - | - | - | - | 673,603 | - | 673,603 | |||||||||||||||||||||||||||||||||
|
Appropriation of legal reserve
|
- | - | - | 14,770 | - | - | - | -14,770 | - | - | - | |||||||||||||||||||||||||||||||||
|
Dividends
|
- | - | - | - | - | - | - | -52,000 | -52,000 | - | -52,000 | |||||||||||||||||||||||||||||||||
|
Contribution of
non-controlling interests |
- | - | - | - | - | - | - | - | - | 28,557 | 28,557 | |||||||||||||||||||||||||||||||||
|
Sale of treasury shares
|
1,200 | - | - | - | - | - | - | 4,922 | 6,122 | - | 6,122 | |||||||||||||||||||||||||||||||||
|
Other adjustments of
non-controlling interests |
- | - | -2,713 | - | - | - | - | - | -2,713 | 2,713 | - | |||||||||||||||||||||||||||||||||
|
Balance as of December 31, 2012
|
531,461 | 50,503 | 558,478 | 105,221 | 18,226 | - | -1,515 | 570,878 | 1,833,252 | 60,863 | 1,894,115 | |||||||||||||||||||||||||||||||||
|
Profit for the year
|
- | - | - | - | - | - | - | 155,634 | 155,634 | -3,351 | 152,283 | |||||||||||||||||||||||||||||||||
|
Other comprehensive income
|
- | - | - | - | 819 | - | 1,515 | 0 | 2,334 | 76 | 2,410 | |||||||||||||||||||||||||||||||||
|
Total comprehensive income
|
- | - | - | - | 819 | - | 1,515 | 155,634 | 157,968 | -3,275 | 154,693 | |||||||||||||||||||||||||||||||||
|
Refund of capital in subsidiary
to non-controlling interests |
- | - | - | - | - | - | - | - | - | -1,024 | -1,024 | |||||||||||||||||||||||||||||||||
|
Appropriation of legal reserve
|
- | - | - | 14,612 | - | - | - | -14,612 | - | - | - | |||||||||||||||||||||||||||||||||
|
Dividends
|
- | - | - | - | - | - | - | -58,196 | -58,196 | - | -58,196 | |||||||||||||||||||||||||||||||||
|
Contribution of
non-controlling interests |
- | - | - | - | - | - | - | - | - | 19,882 | 19,882 | |||||||||||||||||||||||||||||||||
|
Other adjustments of
non-controlling interests |
- | - | -2,184 | - | - | - | - | - | -2,184 | 2,184 | - | |||||||||||||||||||||||||||||||||
|
Balance as of December 31, 2013
|
531,461 | 50,503 | 556,294 | 119,833 | 19,045 | - | - | 653,704 | 1,930,840 | 78,630 | 2,009,470 | |||||||||||||||||||||||||||||||||
|
Profit for the year
|
- | - | - | - | - | - | - | 192,827 | 192,827 | -4,038 | 188,789 | |||||||||||||||||||||||||||||||||
|
Other comprehensive loss
|
- | - | - | - | -18,827 | 4,926 | - | - | -13,901 | - | -13,901 | |||||||||||||||||||||||||||||||||
|
Total comprehensive income
|
- | - | - | - | -18,827 | 4,926 | - | 192,827 | 178,926 | -4,038 | 174,888 | |||||||||||||||||||||||||||||||||
|
Appropriation of legal reserve
|
- | - | - | 33,402 | - | - | - | -33,402 | - | - | - | |||||||||||||||||||||||||||||||||
|
Terminated dividends
|
- | - | - | 1,670 | - | - | - | - | 1,670 | - | 1,670 | |||||||||||||||||||||||||||||||||
|
Dividends
|
- | - | - | - | - | - | - | -116,393 | -116,393 | - | -116,393 | |||||||||||||||||||||||||||||||||
|
Contribution of
non-controlling interests |
- | - | - | - | - | - | - | - | - | 1,050 | 1,050 | |||||||||||||||||||||||||||||||||
|
Other adjustments of
non-controlling interests |
- | - | -2,503 | - | - | - | - | - | -2,503 | 2,503 | - | |||||||||||||||||||||||||||||||||
|
Balance as of December 31, 2014
|
531,461 | 50,503 | 553,791 | 154,905 | 218 | 4,926 | - | 696,736 | 1,992,540 | 78,145 | 2,070,685 | |||||||||||||||||||||||||||||||||
22
Serious News for Serious Traders! Try StreetInsider.com Premium Free!
You May Also Be Interested In
- AgencyBloc and Ideon Partner to Enhance the Benefits Quoting Experience for Agencies
- Avanos Medical, Inc. to Webcast Conference Call Discussing First Quarter 2024 Financial Results
- CORRECTION FROM SOURCE: KS Bancorp, Inc. (KSBI) Announces First Quarter 2024 Financial Results and Cash Dividend Increase
Create E-mail Alert Related Categories
SEC FilingsSign up for StreetInsider Free!
Receive full access to all new and archived articles, unlimited portfolio tracking, e-mail alerts, custom newswires and RSS feeds - and more!
