

Form 6-K CAMECO CORP For: Sep 30
 Tweet
Tweet Share
Share
UNITED STATES
SECURITIES AND EXCHANGE COMMISSION
Washington, DC 20549
FORM 6-K
Report of Foreign Private Issuer
Pursuant to Rule 13a-16 or 15d-16
Under the Securities Exchange Act of 1934
For the month of November, 2016
Cameco Corporation
(Commission file No. 1-14228)
2121-11th Street West
Saskatoon, Saskatchewan, Canada S7M 1J3
(Address of Principal Executive Offices)
Indicate by check mark whether the registrant files or will file annual reports under cover Form 20-F or Form 40-F.
Form 20-F ¨ Form 40-F x
Indicate by check mark whether the registrant by furnishing the information contained in this Form is also thereby furnishing the information to the Commission pursuant to Rule 12g3-2(b) under the Securities Exchange Act of 1934.
Yes ¨ No x
If “Yes” is marked, indicate below the file number assigned to the registrant in connection with Rule 12g3-2(b):
Exhibit Index
| Exhibit No. |
Description |
Page No. | ||
| 99.1 | Press Release dated November 2, 2016 | |||
| 99.2 | Management’s Discussion & Analysis for the third quarter ending September 30, 2016 | |||
| 99.3 | Condensed Consolidated Interim Unaudited Financial Statements for the third quarter ending September 30, 2016 | |||
| 99.4 | Certification of Chief Executive Officer pursuant to Section 302 of the Sarbanes-Oxley Act of 2002 dated November 2, 2016 | |||
| 99.5 | Certification of Chief Financial Officer pursuant to Section 302 of the Sarbanes-Oxley Act of 2002 dated November 2, 2016 | |||
SIGNATURE
Pursuant to the requirements of the Securities Exchange Act of 1934, the registrant has duly caused this report to be signed on its behalf by the undersigned, thereunto duly authorized.
| Date: November 2, 2016 | Cameco Corporation | |||||
| By: | “Sean A. Quinn” | |||||
| Sean A. Quinn | ||||||
| Senior Vice-President, Chief Legal Officer and Corporate Secretary | ||||||
Exhibit 99.1
| TSX: CCO NYSE: CCJ |

|
website: cameco.com currency: Cdn (unless noted) | ||
2121 – 11th Street West, Saskatoon, Saskatchewan, S7M 1J3 Canada
Tel: (306) 956-6200 Fax: (306) 956-6201
Cameco reports third quarter financial results
| • | Maintaining annual delivery guidance at better-than-market prices |
| • | Optimized contract portfolio to extract value and reduce future uncertainty |
| • | Continued taking actions to reduce costs and remain competitive |
Saskatoon, Saskatchewan, Canada, November 2, 2016 .. . . . . . . . . . .. . . . . . . .
Cameco (TSX: CCO; NYSE: CCJ) today reported its consolidated financial and operating results for the third quarter ended September 30, 2016 in accordance with International Financial Reporting Standards (IFRS).
“Uranium prices are at the lowest levels we’ve seen in over a decade, and that’s making for difficult times in our market” said president and CEO, Tim Gitzel. “However, the strength of our long-term contract portfolio continues to keep our average realized price well above the weak market price.
“While we can’t control the market, we’re not idly waiting for the recovery we see coming. We’ve flexed our production levels, we’ve optimized our contract portfolio, and we’ve identified efficiencies within our business to streamline and adapt the company to the current conditions. We’ve taken significant actions and we’re continuing to make the changes necessary to remain competitive in a depressed environment. We are confident that our strategy will help us effectively manage through these low times, while positioning the company to benefit as the market improves and additional uranium is required to meet demand over the long term.”
| HIGHLIGHTS | THREE MONTHS ENDED SEPTEMBER 30 |
NINE MONTHS ENDED SEPTEMBER 30 |
||||||||||||||
| ($ MILLIONS EXCEPT WHERE INDICATED) |
2016 | 2015 | 2016 | 2015 | ||||||||||||
| Revenue |
670 | 649 | 1,544 | 1,779 | ||||||||||||
| Gross profit |
146 | 133 | 307 | 415 | ||||||||||||
| Net earnings (losses) attributable to equity holders |
142 | (4 | ) | 83 | 75 | |||||||||||
| $ per common share (diluted) |
0.36 | (0.01 | ) | 0.21 | 0.19 | |||||||||||
| Adjusted net earnings (non-IFRS, see page 2) |
118 | 78 | 54 | 193 | ||||||||||||
| $ per common share (adjusted and diluted) |
0.30 | 0.20 | 0.14 | 0.49 | ||||||||||||
| Cash provided by (used in) operations (after working capital changes) |
385 | (121 | ) | 57 | (53 | ) | ||||||||||
THIRD QUARTER
Net earnings attributable to equity holders this quarter were $142 million ($0.36 per share diluted) compared to net losses of $4 million (losses of $0.01 per share diluted) in the third quarter of 2015 due to:
| • | lower mark-to-market losses on foreign exchange derivatives compared to the third quarter of 2015 |
| • | gain from termination of long-term contracts |
| • | higher gross profit from our uranium segment |
partially offset by:
| • | lower foreign exchange gains |
| • | lower gross profit from our NUKEM segment |
| • | lower tax recovery |
- 1 -
On an adjusted basis, our earnings this quarter were $118 million ($0.30 per share diluted) compared to earnings of $78 million ($0.20 per share diluted) (non-IFRS measure, see page 2) in the third quarter of 2015. The change was mainly due to:
| • | gain from termination of long-term contracts |
| • | higher gross profit from our uranium segment |
| • | higher tax recovery |
partially offset by:
| • | higher losses on foreign exchange derivatives designated for use in the period compared to the third quarter of 2015 |
| • | lower foreign exchange gains |
| • | lower gross profit from our NUKEM segment |
See Financial results by segment on page 5 for more detailed discussion.
FIRST NINE MONTHS
Net earnings attributable to equity holders in the first nine months of the year were $83 million ($0.21 per share diluted) compared to earnings of $75 million ($0.19 per share diluted) in the first nine months of 2015 mainly due to:
| • | higher gross profit from our fuel services segment |
| • | mark-to-market gains on foreign exchange derivatives compared to losses in the first nine months of 2015 |
| • | gain from termination of long-term contracts |
partially offset by:
| • | impairment of our Rabbit Lake operation |
| • | lower gross profit from our uranium and NUKEM segments |
| • | higher administration costs |
| • | higher exploration costs |
| • | higher foreign exchange losses compared to gains in the first nine months of 2015 |
| • | lower tax recovery |
On an adjusted basis, our earnings for the first nine months of this year were $54 million ($0.14 per share diluted) compared to earnings of $193 million ($0.49 per share diluted) (non-IFRS measure, see page 2) for the first nine months of 2015. Key variances include:
| • | lower gross profit from our uranium and NUKEM segments |
| • | higher administration costs |
| • | higher exploration costs |
| • | higher foreign exchange losses compared to gains in the first nine months of 2015 |
partially offset by:
| • | higher gross profit from our fuel services segment |
| • | gain from termination of long-term contracts |
| • | higher tax recovery |
ADJUSTED NET EARNINGS (NON-IFRS MEASURE)
Adjusted net earnings is a measure that does not have a standardized meaning or a consistent basis of calculation under IFRS (non-IFRS measure). We use this measure as a more meaningful way to compare our financial performance from period to period. We believe that, in addition to conventional measures prepared in accordance with IFRS, certain investors use this information to evaluate our performance. Adjusted net earnings is our net earnings attributable to equity holders, adjusted to better reflect the underlying financial performance for the reporting period. The adjusted earnings measure reflects the matching of the net benefits of our hedging program with the inflows of foreign currencies in the applicable reporting period, and has also been adjusted for NUKEM purchase price inventory adjustments, Rabbit Lake reclamation provisions, impairment charges, and income taxes on adjustments.
Adjusted net earnings is non-standard supplemental information and should not be considered in isolation or as a substitute for financial information prepared according to accounting standards. Other companies may calculate this measure differently, so you may not be able to make a direct comparison to similar measures presented by other companies.
- 2 -
The following table reconciles adjusted net earnings with our net earnings.
| THREE MONTHS ENDED SEPTEMBER 30 |
NINE MONTHS ENDED SEPTEMBER 30 |
|||||||||||||||
| ($ MILLIONS) |
2016 | 2015 | 2016 | 2015 | ||||||||||||
| Net earnings (losses) attributable to equity holders |
142 | (4 | ) | 83 | 75 | |||||||||||
|
|
|
|
|
|
|
|
|
|||||||||
| Adjustments |
||||||||||||||||
| Adjustments on foreign exchange derivatives |
(27 | ) | 112 | (153 | ) | 157 | ||||||||||
| NUKEM purchase price inventory adjustment |
— | — | (6 | ) | (3 | ) | ||||||||||
| Impairment charges |
— | — | 124 | 6 | ||||||||||||
| Rabbit Lake reclamation provision |
(6 | ) | — | (6 | ) | — | ||||||||||
| Income taxes on adjustments |
9 | (30 | ) | 12 | (42 | ) | ||||||||||
|
|
|
|
|
|
|
|
|
|||||||||
| Adjusted net earnings |
118 | 78 | 54 | 193 | ||||||||||||
|
|
|
|
|
|
|
|
|
|||||||||
See Financial results by segment on page 5 for more detailed discussion.
Strategy in action
Since the accident at Fukushima over five years ago, our industry has faced considerable market challenges, with the uranium spot price down 70% and term price down 45%. While we cannot control the conditions in the market, we have not been complacent. We have taken action – focussing on our tier-one assets, streamlining the company, demonstrating supply discipline, protecting and even extending the value of our contract portfolio, and maintaining our focus on safety, people and the environment.
And, we have seen results from our actions. We have continued to achieve average realized prices above market prices, and taken steps to reduce our operating expenses, capital expenditures, and general and administrative spend, and maintained our investment grade rating. Ultimately, we have stayed competitive, protected our balance sheet, and positioned the company for price and operating leverage.
Going forward, we will continue to look for opportunities to enhance the value of the company for our shareholders, including further strengthening our balance sheet.
In today’s weak market environment, the strength of our contract portfolio has been tested and proven to be sound. In cases where a customer is seeking relief due to a challenging policy, operating or economic environment, we evaluate their specific circumstances to determine if uncertain future value can be converted into certain present value.
In the third quarter, our evaluation resulted in agreements to terminate long-term supply contracts with two of our utility customers where future uranium requirements were uncertain. In both instances, we were able to harvest that uncertain future value to improve earnings and cash flow in the near-term. The first, which we disclosed as a subsequent event in our second quarter MD&A, had product deliveries from 2016 through 2021 and resulted in a gain on contract settlement of $46.7 million. The second had product deliveries from 2016 through 2020 and resulted in a contract settlement of $12.3 million. These gains have been reflected in our financial results for the third quarter as other income.
Uranium market update
The market remained weak during the third quarter, with low demand and persistent oversupply driving both spot and term prices down to new 10-year lows.
New reactor startups continued to be a bright spot, with four more reactors – two in China, one in India, one in Russia – added to the grid, bringing the 2016 total to nine. However, the generally anemic sentiment in the nuclear space was unchanged amid continued uncertainty around the path for restarting reactors in Japan, and economic pressure on nuclear operators in the United States. Despite the prolonged stress on near-term demand, there have been very few adjustments to primary supply, softening market conditions to where they are today.
We expect the market environment to remain depressed until catalysts such as reactor restarts in Japan take place, primary suppliers react to low uranium price, excess supply clears the market, and there is a significant return to long-term contracting.
Longer-term, uranium demand is backed by steady reactor growth that supports a positive story for the industry. Over the next decade, as the 57 reactors under construction today come online, and as planned units move into the construction phase, the increasing demand will have to be met with new primary supply. However, today’s low uranium prices and lack of long-term contracting are delaying the development of those new supply sources, adding uncertainty to security of supply, and favouring established producers that will be able to draw upon low-cost, long-lived assets for stable future production.
- 3 -
Caution about forward-looking information relating to our uranium market update
This discussion of our expectations for the nuclear industry, including its growth profile, future global uranium supply and demand is forward-looking information that is based upon the assumptions and subject to the material risks discussed under the heading Caution about forward-looking information beginning on page 9.
Outlook for 2016
Our outlook for 2016 reflects the expenditures necessary to help us achieve our strategy. Our outlook for NUKEM revenue and gross profit, fuel services average unit cost of sales, consolidated revenue, consolidated tax rate, and capital expenditures has changed. We do not provide an outlook for the items in the table that are marked with a dash.
See 2016 Financial results by segment on page 5 for details.
2016 FINANCIAL OUTLOOK
| CONSOLIDATED | URANIUM | FUEL SERVICES | NUKEM | |||||||||||||
| Production |
— |
|
25.8 million lbs |
|
|
8 to 9 million kgU |
|
— | ||||||||
| Delivery volume1 |
— |
|
30 to 32 million lbs2 |
|
|
Decrease up to 5% |
|
|
7 to 8 million lbs U3O8 |
| ||||||
| Revenue compared to 20153 |
|
Decrease 10% to 15% |
|
|
Decrease 5% to 10%4 |
|
|
Increase up to 5% |
|
|
Decrease 20% to 25% |
| ||||
| Average unit cost of sales (including D&A) |
— |
|
Increase up to 5%5 |
|
|
Increase 5% to 10% |
|
— | ||||||||
| Direct administration costs compared to 20156 |
|
Increase 10% to 15% |
|
— | — | — | ||||||||||
| Gross profit |
— | — | — |
|
Gross profit 1% to 2%7 |
| ||||||||||
| Exploration costs compared to 2015 |
— |
|
Increase 15% to 20% |
|
— | — | ||||||||||
| Tax rate8 |
|
Recovery of > 200% |
|
— | — | — | ||||||||||
| Capital expenditures |
$245 million | — | — | — | ||||||||||||
| 1 | Our 2016 outlook for delivery volume does not include sales between our uranium, fuel services and NUKEM segments. |
| 2 | Our uranium delivery volume is based on the volumes we currently have commitments to deliver under contract in 2016. |
| 3 | For comparison of our 2016 outlook and 2015 results for revenue, we do not include sales between our uranium, fuel services and NUKEM segments. |
| 4 | Based on a uranium spot price of $18.75 (US) per pound (the Ux spot price as of October 31, 2016), a long-term price indicator of $36.00 (US) per pound (the Ux long-term indicator on October 31, 2016) and an exchange rate of $1.00 (US) for $1.30 (Cdn). |
| 5 | This increase is based on the unit cost of sale for produced material and committed long-term purchases. If we make discretionary purchases in the remainder of 2016, then we expect the overall unit cost of sales could be different. |
| 6 | Direct administration costs do not include stock-based compensation expenses. |
| 7 | NUKEM gross profit is net of inventory write-downs. |
| 8 | Our outlook for the tax rate is based on adjusted net earnings. |
We have reduced our outlook for NUKEM revenue to a decrease of 20% to 25% (previously a decrease of 5% to 10%) due to a continued decrease in the spot price. As a result, our outlook for consolidated revenue has also changed to a decrease of 10% to 15% (previously a decrease of 5% to 10%). We have also recast our outlook for NUKEM gross profit to be 1% to 2%, net of inventory write-downs (NUKEM gross profit was previously shown as up to 1%, including inventory write-downs).
Average unit cost of sales in our fuel services segment is now expected to increase 5% to 10% (previously an increase of 10% to 15%) due to an overall decrease in production costs and the mix of products sold.
Our outlook for capital expenditures has decreased to $245 million (previously $275 million) due to a reduction in spending at McArthur River, as well as the timing of expenditures on projects in our fuel services segment.
- 4 -
We have adjusted our outlook for consolidated tax rate to a recovery of greater than 200% (previously 175% to 200%). The increase in expected recovery is due to the changes in our outlook noted above, which result in a change in the distribution of earnings between jurisdictions, as well as the effect of losses recognized in Canada offset by foreign income.
In our uranium and fuel services segments, our customers choose when in the year to receive deliveries, so our quarterly delivery patterns, sales volumes and revenue can vary significantly. We are on track to meet our 2016 uranium sales targets, and, therefore, expect to deliver between 10 million and 12 million pounds in the fourth quarter.
REVENUE, CASH FLOW AND EARNINGS SENSITIVITY ANALYSIS
For the rest of 2016:
| • | an increase or decrease of $5 (US) per pound in both the Ux spot price ($18.75 (US) per pound on October 31, 2016) and the Ux long-term price indicator ($36.00 (US) per pound on October 31, 2016) would increase or decrease revenue by $7 million and net earnings by $5 million. |
| • | a one-cent change in the value of the Canadian dollar versus the US dollar would change adjusted net earnings by $3 million, with a decrease in the value of the Canadian dollar versus the US dollar having a positive impact. Cash flow would change by $1 million, with a decrease in the value of the Canadian dollar versus the US dollar having a negative impact. |
TRANSFER PRICING DISPUTES
We have been reporting on our transfer pricing disputes with Canada Revenue Agency (CRA) since 2008, when it originated, and with the Internal Revenue Service (IRS) since the first quarter of 2015. Please see our third quarter MD&A for a discussion of the general nature of transfer pricing disputes and, more specifically, the ongoing disputes we have.
The trial for the 2003, 2005 and 2006 reassessments commenced in October, 2016. Final arguments are expected in the second half of 2017. If this timing is adhered to, we expect to receive a Tax Court decision within six to 18 months after the trial is complete.
Financial results by segment
Uranium
| THREE MONTHS ENDED SEPTEMBER 30 |
NINE MONTHS ENDED SEPTEMBER 30 |
|||||||||||||||||||||||||||
| HIGHLIGHTS |
2016 | 2015 | CHANGE | 2016 | 2015 | CHANGE | ||||||||||||||||||||||
| Production volume (million lbs) |
5.9 | 8.2 | (28 | )% | 19.9 | 18.7 | 6 | % | ||||||||||||||||||||
| Sales volume (million lbs)1 |
9.3 | 6.9 | 35 | % | 19.9 | 21.2 | (6 | )% | ||||||||||||||||||||
| Average spot price |
($ | US/lb | ) | 24.57 | 36.21 | (32 | )% | 27.86 | 36.91 | (25 | )% | |||||||||||||||||
| Average long-term price |
($ | US/lb | ) | 37.83 | 44.17 | (14 | )% | 41.06 | 47.06 | (13 | )% | |||||||||||||||||
| Average realized price |
($ | US/lb | ) | 43.37 | 43.61 | (1 | )% | 42.92 | 44.57 | (4 | )% | |||||||||||||||||
| ($ | Cdn/lb | ) | 56.34 | 56.07 | — | 56.77 | 55.65 | 2 | % | |||||||||||||||||||
| Average unit cost of sales (including D&A) |
($ | Cdn/lb | ) | 39.97 | 40.16 | — | 41.63 | 39.13 | 6 | % | ||||||||||||||||||
| Revenue ($ millions)1 |
526 | 388 | 36 | % | 1,129 | 1,179 | (4 | )% | ||||||||||||||||||||
| Gross profit ($ millions) |
153 | 110 | 39 | % | 301 | 350 | (14 | )% | ||||||||||||||||||||
| Gross profit (%) |
29 | 28 | 4 | % | 27 | 30 | (10 | )% | ||||||||||||||||||||
| 1 | There were no significant intersegment transactions in the periods shown. |
THIRD QUARTER
Production volumes this quarter were 28% lower compared to the third quarter of 2015, mainly due to planned lower production from McArthur River/Key Lake and Rabbit Lake, and lower production from Inkai. See Uranium 2016 Q3 updates starting on page 9 for more information.
The 36% increase in uranium revenues was a result of a 35% increase in sales volume. Sales in the third quarter were higher than in 2015 due to the timing of deliveries, which are driven by customer requests and can vary significantly.
The US dollar average realized price decreased by 1% compared to 2015, mainly due to lower prices on market-related contracts, while the higher Canadian dollar realized prices this quarter were a result of the weakening of the Canadian dollar compared to 2015. This quarter, the exchange rate on the average realized price was $1.00 (US) for $1.30 (Cdn) compared to $1.00 (US) for $1.29 (Cdn) in the third quarter of 2015.
- 5 -
Total cost of sales (including D&A) increased by 34% ($373 million compared to $278 million in 2015) due to a 35% increase in sales volume.
The net effect was a $43 million increase in gross profit for the quarter.
FIRST NINE MONTHS
Production volumes for the first nine months of the year were 6% higher than in the previous year due to the addition of production from Cigar Lake and higher production at Inkai, partially offset by planned lower production at McArthur River/Key Lake, Rabbit Lake and our US operations. See Uranium 2016 Q3 updates starting on page 9 for more information.
Uranium revenues decreased 4% compared to the first nine months of 2015 due to a 6% decrease in sales volumes, partially offset by a 2% increase in the Canadian dollar average realized price.
Our Canadian dollar realized prices for the first nine months of 2016 were higher than 2015, primarily as a result of the weakening of the Canadian dollar compared to 2015. For the first nine months of 2016, the exchange rate on the average realized price was $1.00 (US) for $1.32 (Cdn) compared to $1.00 (US) for $1.25 (Cdn) for the same period in 2015.
Total cost of sales (including D&A) remained virtually unchanged ($828 million compared to $829 million in 2015) mainly due to a 6% decrease in sales volume for the first nine months, offset by a 6% increase in the unit cost of sales. The increase in the unit cost of sales was mainly the result of care and maintenance costs and severance costs related to the curtailment of production at Rabbit Lake and in the US.
The net effect was a $49 million decrease in gross profit for the first nine months.
The table below shows the costs of produced and purchased uranium incurred in the reporting periods (which are non-IFRS measures, see the paragraphs below the table). These costs do not include care and maintenance costs, selling costs such as royalties, transportation and commissions, nor do they reflect the impact of opening inventories on our reported cost of sales.
| THREE MONTHS ENDED SEPTEMBER 30 |
NINE MONTHS ENDED SEPTEMBER 30 |
|||||||||||||||||||||||
| ($CDN/LB) |
2016 | 2015 | CHANGE | 2016 | 2015 | CHANGE | ||||||||||||||||||
| Produced |
||||||||||||||||||||||||
| Cash cost |
16.31 | 17.56 | (7 | )% | 17.72 | 22.97 | (23 | )% | ||||||||||||||||
| Non-cash cost |
13.07 | 9.53 | 37 | % | 12.18 | 11.79 | 3 | % | ||||||||||||||||
| Total production cost |
29.38 | 27.09 | 8 | % | 29.90 | 34.76 | (14 | )% | ||||||||||||||||
| Quantity produced (million lbs) |
5.9 | 8.2 | (28 | )% | 19.9 | 18.7 | 6 | % | ||||||||||||||||
| Purchased |
||||||||||||||||||||||||
| Cash cost |
39.91 | 47.19 | (15 | )% | 48.91 | 46.83 | 4 | % | ||||||||||||||||
| Quantity purchased (million lbs) |
0.5 | 2.7 | (81 | )% | 6.2 | 9.3 | (33 | )% | ||||||||||||||||
| Totals |
||||||||||||||||||||||||
| Produced and purchased costs |
30.20 | 32.07 | (6 | )% | 34.42 | 38.77 | (11 | )% | ||||||||||||||||
| Quantities produced and purchased (million lbs) |
6.4 | 10.9 | (41 | )% | 26.1 | 28.0 | (7 | )% | ||||||||||||||||
The average cash cost of production was 7% lower for the quarter and 23% lower in the first nine months than in comparable periods in 2015. The change was primarily due to the rampup of low-cost production from Cigar Lake, and the impact of our second quarter actions to curtail higher cost production in the US and from Rabbit Lake.
Although purchased pounds are transacted in US dollars, we account for the purchases in Canadian dollars. In the third quarter, the average cash cost of purchased material was $39.91 (Cdn) per pound, or $30.75 (US) per pound in US dollar terms, compared to $37.78 (US) per pound in the third quarter of 2015. For the first nine months, the average cash cost of purchased material was $48.91 (Cdn), or $35.70 (US) per pound, compared to $37.51 (US) per pound in the same period in 2015.
Cash cost per pound, non-cash cost per pound and total cost per pound for produced and purchased uranium presented in the above table are non-IFRS measures. These measures do not have a standardized meaning or a consistent basis of calculation under IFRS. We use these measures in our assessment of the performance of our uranium business. We believe that, in addition to conventional measures prepared in accordance with IFRS, certain investors use this information to evaluate our performance and ability to generate cash flow.
- 6 -
These measures are non-standard supplemental information and should not be considered in isolation or as a substitute for measures of performance prepared according to accounting standards. These measures are not necessarily indicative of operating profit or cash flow from operations as determined under IFRS. Other companies may calculate these measures differently, so you may not be able to make a direct comparison to similar measures presented by other companies.
To facilitate a better understanding of these measures, the following table presents a reconciliation of these measures to our unit cost of sales for the third quarter and the first nine months of 2016 and 2015.
Cash and total cost per pound reconciliation
| THREE MONTHS ENDED SEPTEMBER 30 |
NINE MONTHS ENDED SEPTEMBER 30 |
|||||||||||||||
| ($ MILLIONS) |
2016 | 2015 | 2016 | 2015 | ||||||||||||
| Cost of product sold |
285.7 | 205.5 | 654.6 | 660.9 | ||||||||||||
| Add / (subtract) |
||||||||||||||||
| Royalties |
(37.4 | ) | (31.3 | ) | (77.3 | ) | (67.0 | ) | ||||||||
| Care and maintenance and severance costs |
(20.1 | ) | — | (58.8 | ) | — | ||||||||||
| Other selling costs |
(5.6 | ) | (1.9 | ) | (8.5 | ) | (7.1 | ) | ||||||||
| Change in inventories |
(106.4 | ) | 99.1 | 145.9 | 278.1 | |||||||||||
| Cash operating costs (a) |
116.2 | 271.4 | 655.9 | 864.9 | ||||||||||||
| Add / (subtract) |
||||||||||||||||
| Depreciation and amortization |
87.6 | 72.2 | 173.1 | 168.2 | ||||||||||||
| Change in inventories |
(10.5 | ) | 6.0 | 69.3 | 52.5 | |||||||||||
| Total operating costs (b) |
193.3 | 349.6 | 898.3 | 1,085.6 | ||||||||||||
| Uranium produced & purchased (million lbs) (c) |
6.4 | 10.9 | 26.1 | 28.0 | ||||||||||||
| Cash costs per pound (a ÷ c) |
18.16 | 24.90 | 25.13 | 30.89 | ||||||||||||
| Total costs per pound (b ÷ c) |
30.20 | 32.07 | 34.42 | 38.77 | ||||||||||||
Fuel services
(includes results for UF6, UO2 and fuel fabrication)
| THREE MONTHS ENDED SEPTEMBER 30 |
NINE MONTHS ENDED SEPTEMBER 30 |
|||||||||||||||||||||||||
| HIGHLIGHTS |
2016 | 2015 | CHANGE | 2016 | 2015 | CHANGE | ||||||||||||||||||||
| Production volume (million kgU) |
0.6 | 0.6 | — | 6.5 | 6.3 | 3 | % | |||||||||||||||||||
| Sales volume (million kgU)1 |
3.5 | 3.8 | (8 | )% | 8.7 | 9.1 | (4 | )% | ||||||||||||||||||
| Average realized price |
($Cdn/kgU) | 22.09 | 22.22 | (1 | )% | 25.06 | 24.11 | 4 | % | |||||||||||||||||
| Average unit cost of sales (including D&A) |
($Cdn/kgU) | 18.62 | 18.75 | (1 | )% | 19.98 | 19.71 | 1 | % | |||||||||||||||||
| Revenue ($ millions)1 |
77 | 83 | (7 | )% | 217 | 220 | (1 | )% | ||||||||||||||||||
| Gross profit ($ millions) |
12 | 13 | (8 | )% | 44 | 40 | 10 | % | ||||||||||||||||||
| Gross profit (%) |
16 | 16 | — | 20 | 18 | 11 | % | |||||||||||||||||||
| 1 | Includes sales and revenue between our fuel services and NUKEM segments (65,000 kgU in sales and revenue of $0.5 million in Q3 2016, nil in Q3 2015; 65,000 kgU in sales and revenue of $0.5 million in the first nine months of 2016, nil in the first nine months of 2015). |
THIRD QUARTER
Total revenue for the third quarter of 2016 decreased to $77 million from $83 million for the same period last year. This was primarily due to an 8% decrease in sales volumes compared to 2015.
The total cost of products and services sold (including D&A) decreased by 7% ($65 million compared to $70 million in the third quarter of 2015) due to the decrease in sales volumes and a decrease in the average unit cost of sales. When compared to 2015, the average unit cost of sales was 1% lower.
The net effect was a $1 million decrease in gross profit.
- 7 -
FIRST NINE MONTHS
In the first nine months of the year, total revenue decreased by 1% due to a 4% decrease in sales volumes, partially offset by a 4% increase in realized price that was the result of the weakening Canadian dollar and the mix of products sold.
The total cost of products and services sold (including D&A) decreased 4% ($173 million compared to $180 million in 2015) due to the 4% decrease in sales volume, partially offset by a 1% increase in the average unit cost of sales.
The net effect was a $4 million increase in gross profit.
NUKEM
| THREE MONTHS ENDED SEPTEMBER 30 |
NINE MONTHS ENDED SEPTEMBER 30 |
|||||||||||||||||||||||||
| HIGHLIGHTS |
2016 | 2015 | CHANGE | 2016 | 2015 | CHANGE | ||||||||||||||||||||
| Uranium sales (million lbs)1 |
1.5 | 2.9 | (48 | )% | 4.0 | 6.9 | (42 | )% | ||||||||||||||||||
| Average realized price |
($Cdn/lb) | 43.52 | 52.70 | (17 | )% | 48.89 | 46.97 | 4 | % | |||||||||||||||||
| Cost of product sold (including D&A)2 |
82 | 170 | (52 | )% | 224 | 326 | (31 | )% | ||||||||||||||||||
| Revenue ($ millions)1, 2 |
67 | 183 | (63 | )% | 198 | 361 | (45 | )% | ||||||||||||||||||
| Gross profit (loss) ($ millions)2 |
(15 | ) | 13 | >(100 | %) | (26 | ) | 35 | >(100 | %) | ||||||||||||||||
| Gross profit (loss) (%)2 |
(22 | ) | 7 | >(100 | %) | (13 | ) | 10 | >(100 | %) | ||||||||||||||||
| 1 | Includes sales and revenue between our uranium, fuel services and NUKEM segments (nil in Q3 2016, 130,000 pounds in sales and revenue of $6.0 million in Q3 2015); (nil in the first nine months of 2016, 873,000 pounds in sales and revenue of $19.3 million in the first nine months of 2015). |
| 2 | Includes U3O8, UF6, and SWU. |
THIRD QUARTER
During the third quarter of 2016, NUKEM delivered 1.5 million pounds of uranium, a decrease of 48% from the same period last year due largely to the timing of customer requirements. The majority of the deliveries in the quarter were under existing long-term contracts with utilities. Activity in the spot market continued to be light, as was the case in the first two quarters. Total revenues decreased by 63% as a result of lower sales volumes.
NUKEM recorded a gross loss of $15 million in the third quarter of 2016, compared to a $13 million gross profit in the third quarter of 2015. Included in the 2016 gross loss is a $12 million net write-down of inventory. The write-down was a result of a decline in the spot price during the period.
FIRST NINE MONTHS
During the nine months ended September 30, 2016, NUKEM delivered 4.0 million pounds of uranium, a decrease of 42%, due to very light market activity with a lack of profitable opportunities, and the timing of customer requirements. Total revenues decreased 45% due to a decrease in sales volumes, partially offset by a 4% increase in average realized price. The increase in realized price was mainly the result of deliveries under contracts negotiated in prior years when market prices were higher.
Gross profit percentage was a loss of 13% for the first nine months of 2016, a decrease from a profit of 10% in the same period in 2015. Included in the 2015 margin was a $3 million net recovery compared to a $26 million net write-down of inventory in 2016. The write-down in 2016 was a result of a decline in the spot price during the period.
The net effect was a $61 million decrease in gross profit.
- 8 -
Uranium 2016 Q3 updates
URANIUM PRODUCTION
| THREE MONTHS ENDED SEPTEMBER 30 |
NINE MONTHS ENDED SEPTEMBER 30 |
|||||||||||||||||||||||||||
| OUR SHARE (MILLION LBS) |
2016 | 2015 | CHANGE | 2016 | 2015 | CHANGE | 2016 PLAN | |||||||||||||||||||||
| McArthur River/Key Lake |
3.1 | 3.9 | (21 | )% | 8.8 | 9.5 | (7 | )% | 12.6 | |||||||||||||||||||
| Cigar Lake |
1.9 | 1.8 | 6 | % | 6.2 | 3.3 | 88 | % | 8.0 | |||||||||||||||||||
| Inkai |
0.6 | 1.0 | (40 | )% | 2.8 | 2.2 | 27 | % | 3.0 | |||||||||||||||||||
| Rabbit Lake |
— | 1.1 | (100 | )% | 1.1 | 2.2 | (50 | )% | 1.1 | |||||||||||||||||||
| Smith Ranch-Highland |
0.2 | 0.3 | (33 | )% | 0.8 | 1.2 | (33 | )% | 0.9 | |||||||||||||||||||
| Crow Butte |
0.1 | 0.1 | — | 0.2 | 0.3 | (33 | )% | 0.2 | ||||||||||||||||||||
|
|
|
|
|
|
|
|
|
|
|
|
|
|
|
|||||||||||||||
| Total |
5.9 | 8.2 | (28 | )% | 19.9 | 18.7 | 6 | % | 25.8 | |||||||||||||||||||
|
|
|
|
|
|
|
|
|
|
|
|
|
|
|
|||||||||||||||
MCARTHUR RIVER/KEY LAKE
Production for the third quarter was 21% lower compared to the same period last year due to a longer planned mill maintenance shut down. Production for the first nine months was slightly lower than last year due to lower planned annual production.
CIGAR LAKE
Total packaged production from Cigar Lake was 6% higher in the third quarter, and 88% higher in the first nine months compared to the same periods last year. The year-over-year increase is the result of the scheduled rampup of the operation.
INKAI
Production was 40% lower for the quarter and 27% higher for the first nine months compared to the same periods last year due to the timing of new wellfield development in our 2016 mine plan.
RABBIT LAKE
The transition of the Rabbit Lake operation to care and maintenance was completed at the end of August, at a cost of $39.6 million. The site will remain in a safe care and maintenance state for the remainder of the year at a cost of about $15 million. Additionally, the total severance cost of $10.6 million is included in our cost of sales and reflected in our results.
We are continually weighing the value of maintaining the operation in standby, against the cost of doing so. However, as long as production is suspended, we expect care and maintenance costs to range between $35 million and $40 million annually for the first few years.
Qualified persons
The technical and scientific information discussed in this document for our material properties (McArthur River/Key Lake, Inkai and Cigar Lake) was approved by the following individuals who are qualified persons for the purposes of NI 43-101:
Caution about forward-looking information
This document includes statements and information about our expectations for the future. When we discuss our strategy, plans, future financial and operating performance, or other things that have not yet taken place, we are making statements considered to be forward-looking information or forward-looking statements under Canadian and United States securities laws. We refer to them in this document as forward-looking information.
- 9 -
Key things to understand about the forward-looking information in this document:
| • | It typically includes words and phrases about the future, such as: anticipate, believe, estimate, expect, plan, will, intend, goal, target, forecast, project, strategy and outlook (see examples below). |
| • | It represents our current views, and can change significantly. |
| • | It is based on a number of material assumptions, including those we have listed beginning on page 10, which may prove to be incorrect. |
| • | Actual results and events may be significantly different from what we currently expect, due to the risks associated with our business. We list a number of these material risks beginning on page 10. We recommend you also review our annual information form, first quarter, second quarter and third quarter MD&A, and annual MD&A, which includes a discussion of other material risks that could cause actual results to differ significantly from our current expectations. |
| • | Forward-looking information is designed to help you understand management’s current views of our near and longer term prospects, and it may not be appropriate for other purposes. We will not necessarily update this information unless we are required to by securities laws. |
Examples of forward-looking information in this document
Material risks
Material assumptions
- 10 -
Conference call
We invite you to join our third quarter conference call on Wednesday, November 2, 2016 at 1:00 p.m. Eastern.
The call will be open to all investors and the media. To join the call, please dial (800) 769-8320 (Canada and US) or (416) 340-8530. An operator will put your call through. The slides and a live webcast of the conference call will be available from a link at cameco.com. See the link on our home page on the day of the call.
A recorded version of the proceedings will be available:
| • | on our website, cameco.com, shortly after the call |
| • | on post view until midnight, Eastern, December 2, 2016, by calling (800) 408-3053 (Canada and US) or (905) 694-9451 (Passcode 7935679) |
Additional information
You can find a copy of our third quarter MD&A and interim financial statements on our website at cameco.com, on SEDAR at sedar.com and on EDGAR at sec.gov/edgar.shtml.
Additional information, including our 2015 annual management’s discussion and analysis, annual audited financial statements and annual information form, is available on SEDAR at sedar.com, on EDGAR at sec.gov/edgar.shtml and on our website at cameco.com.
Profile
We are one of the world’s largest uranium producers, a significant supplier of conversion services and one of two CANDU fuel manufacturers in Canada. Our competitive position is based on our controlling ownership of the world’s largest high-grade reserves and low-cost operations. Our uranium products are used to generate clean electricity in nuclear power plants around the world. We also explore for uranium in the Americas, Australia and Asia. Our shares trade on the Toronto and New York stock exchanges. Our head office is in Saskatoon, Saskatchewan.
As used in this news release, the terms we, us, our, the Company and Cameco mean Cameco Corporation and its subsidiaries; including NUKEM Energy GmbH, unless otherwise indicated.
- End -
| Investor inquiries: | Rachelle Girard | (306) 956-6403 | ||
| Media inquiries: | Gord Struthers | (306) 956-6593 |
- 11 -
Table of Contents
Exhibit 99.2

Management’s discussion and analysis
for the quarter ended September 30, 2016
| 4 | ||||
| 6 | ||||
| 13 | ||||
| 15 | ||||
| 17 | ||||
| 19 | ||||
| 20 | ||||
| 21 | ||||
| 21 | ||||
| 21 | ||||
| 22 | ||||
This management’s discussion and analysis (MD&A) includes information that will help you understand management’s perspective of our unaudited condensed consolidated interim financial statements and notes for the quarter ended September 30, 2016 (interim financial statements). The information is based on what we knew as of November 1, 2016 and updates our first quarter, second quarter and annual MD&A included in our 2015 annual report.
As you review this MD&A, we encourage you to read our interim financial statements as well as our audited consolidated financial statements and notes for the year ended December 31, 2015 and annual MD&A. You can find more information about Cameco, including our audited consolidated financial statements and our most recent annual information form, on our website at cameco.com, on SEDAR at sedar.com or on EDGAR at sec.gov. You should also read our annual information form before making an investment decision about our securities.
The financial information in this MD&A and in our financial statements and notes are prepared according to International Financial Reporting Standards (IFRS), unless otherwise indicated.
Unless we have specified otherwise, all dollar amounts are in Canadian dollars.
Throughout this document, the terms we, us, our and Cameco mean Cameco Corporation and its subsidiaries, including NUKEM Energy Gmbh (NUKEM), unless otherwise indicated.
Table of Contents
Caution about forward-looking information
Our MD&A includes statements and information about our expectations for the future. When we discuss our strategy, plans, future financial and operating performance, or other things that have not yet taken place, we are making statements considered to be forward-looking information or forward-looking statements under Canadian and United States securities laws. We refer to them in this MD&A as forward-looking information.
Key things to understand about the forward-looking information in this MD&A:
| • | It typically includes words and phrases about the future, such as: anticipate, believe, estimate, expect, plan, will, intend, goal, target, forecast, project, strategy and outlook (see examples below). |
| • | It represents our current views, and can change significantly. |
| • | It is based on a number of material assumptions, including those we have listed on page 3, which may prove to be incorrect. |
| • | Actual results and events may be significantly different from what we currently expect, due to the risks associated with our business. We list a number of these material risks on pages 2 and 3. We recommend you also review our annual information form, first quarter, second quarter and annual MD&A, which includes a discussion of other material risks that could cause actual results to differ significantly from our current expectations. |
| • | Forward-looking information is designed to help you understand management’s current views of our near and longer term prospects, and it may not be appropriate for other purposes. We will not necessarily update this information unless we are required to by securities laws. |
Examples of forward-looking information in this MD&A
Material risks
| 2 CAMECO CORPORATION |
Table of Contents
Material assumptions
| 2016 THIRD QUARTER REPORT 3 |
Table of Contents
Our strategy
We are a pure-play nuclear fuel supplier, focused on taking advantage of the long-term growth we see coming in our industry, while maintaining the ability to respond to market conditions as they evolve. Our strategy is to profitably produce from our tier-one assets at a pace aligned with market signals to increase long-term shareholder value, and to do that with an emphasis on safety, people and the environment.
We believe the best way to create value is to focus our investible capital on maintaining a strong balance sheet and on preserving the production flexibility of our tier-one assets. This approach provides us with the opportunity to meet rising demand with increased production from our best margin assets, and helps to mitigate risk during a prolonged period of uncertainty. In the context of continued depressed market conditions, we have positioned our production to come from our lower-cost operations.
Going forward, we plan to:
| • | ensure continued safe, reliable, low-cost production from our tier-one assets – McArthur River/Key Lake, Cigar Lake and Inkai |
| • | complete ramp up of production at Cigar Lake |
| • | continue to evaluate the position of the other sources of supply in our portfolio, including Rabbit Lake and the US operations, and retain the flexibility to respond to market signals and take advantage of value adding opportunities, including expanded production capacity at McArthur River/Key Lake and at Inkai |
| • | maintain our low-cost advantage by focusing on execution and operational excellence |
You can read more about our strategy in our 2015 annual management’s discussion and analysis (MD&A).
Strategy in action
Since the accident at Fukushima over five years ago, our industry has faced considerable market challenges, with the uranium spot price down 70% and term price down 45%. While we cannot control the conditions in the market, we have not been complacent. We have taken action – focussing on our tier-one assets, streamlining the company, demonstrating supply discipline, protecting and even extending the value of our contract portfolio, and maintaining our focus on safety, people and the environment.
And, we have seen results from our actions. We have continued to achieve average realized prices above market prices, and taken steps to reduce our operating expenses, capital expenditures, and general and administrative spend, and maintained our investment grade rating. Ultimately, we have stayed competitive, protected our balance sheet, and positioned the company for price and operating leverage.
Going forward, we will continue to look for opportunities to enhance the value of the company for our shareholders, including further strengthening our balance sheet.
Uranium market update
The market remained weak during the third quarter, with low demand and persistent oversupply driving both spot and term prices down to new 10-year lows.
New reactor startups continued to be a bright spot, with four more reactors – two in China, one in India, one in Russia – added to the grid, bringing the 2016 total to nine. However, the generally anemic sentiment in the nuclear space was unchanged amid continued uncertainty around the path for restarting reactors in Japan, and economic pressure on nuclear operators in the United States. Despite the prolonged stress on near-term demand, there have been very few adjustments to primary supply, softening market conditions to where they are today.
We expect the market environment to remain depressed until catalysts such as reactor restarts in Japan take place, primary suppliers react to low uranium price, excess supply clears the market, and there is a significant return to long-term contracting.
| 4 CAMECO CORPORATION |
Table of Contents
Longer-term, uranium demand is backed by steady reactor growth that supports a positive story for the industry. Over the next decade, as the 57 reactors under construction today come online, and as planned units move into the construction phase, the increasing demand will have to be met with new primary supply. However, today’s low uranium prices and lack of long-term contracting are delaying the development of those new supply sources, adding uncertainty to security of supply, and favouring established producers that will be able to draw upon low-cost, long-lived assets for stable future production.
Caution about forward-looking information relating to our uranium market update
This discussion of our expectations for the nuclear industry, including its growth profile, future global uranium supply and demand is forward-looking information that is based upon the assumptions and subject to the material risks discussed under the heading Caution about forward-looking information beginning on page 2.
Industry prices at quarter end
| SEP 30 2016 |
JUN 30 2016 |
MAR 31 2016 |
DEC 31 2015 |
SEP 30 2015 |
JUN 30 2015 |
|||||||||||||||||||
| Uranium ($US/lb U3O8)1 |
||||||||||||||||||||||||
| Average spot market price |
23.00 | 26.70 | 28.70 | 34.23 | 36.38 | 36.38 | ||||||||||||||||||
| Average long-term price |
37.50 | 40.50 | 43.50 | 44.00 | 44.00 | 46.00 | ||||||||||||||||||
|
|
|
|
|
|
|
|
|
|
|
|
|
|||||||||||||
| Fuel services ($US/kgU as UF6)1 |
||||||||||||||||||||||||
| Average spot market price |
||||||||||||||||||||||||
| North America |
5.93 | 6.75 | 6.75 | 6.88 | 7.00 | 7.50 | ||||||||||||||||||
| Europe |
6.45 | 7.25 | 7.25 | 7.38 | 7.50 | 8.00 | ||||||||||||||||||
| Average long-term price |
||||||||||||||||||||||||
| North America |
12.25 | 12.75 | 12.75 | 13.50 | 15.00 | 16.00 | ||||||||||||||||||
| Europe |
13.00 | 14.00 | 14.00 | 14.50 | 16.25 | 17.00 | ||||||||||||||||||
Note: the industry does not publish UO2 prices.
| 1 | Average of prices reported by TradeTech and Ux Consulting (Ux) |
On the spot market, where purchases call for delivery within one year, the volume reported by Ux Consulting (UxC) for the third quarter of 2016 was approximately 12 million pounds. This compares to approximately 10 million pounds in the third quarter of 2015. At the end of the quarter, the average reported spot price was $23.00 (US) per pound, down $3.70 (US) from the previous quarter. The reported total spot market volume for the first nine months of 2016 was 32 million pounds, compared to 36 million pounds over the same period in 2015.
Long-term contracts usually call for deliveries to begin more than two years after the contract is finalized, and use a number of pricing formulas, including fixed prices escalated over the term of the contract, and market referenced prices (spot and long-term indicators) quoted near the time of delivery. The volume of long-term contracting continued to be low, reported by UxC to be approximately 38 million pounds for the first nine months of 2016, compared to approximately 56 million pounds over the same period in 2015. The average reported long-term price at the end of the quarter was $37.50 (US) per pound, down $3.00 (US) from the previous quarter.
Spot and long-term UF6 conversion prices also declined during the quarter.
| 2016 THIRD QUARTER REPORT 5 |
Table of Contents
Financial results
This section of our MD&A discusses our performance, financial condition and outlook for the future.
Consolidated financial results
| CONSOLIDATED HIGHLIGHTS ($ MILLIONS EXCEPT WHERE INDICATED) |
THREE MONTHS ENDED SEPTEMBER 30 |
NINE MONTHS ENDED SEPTEMBER 30 |
||||||||||||||||||||||
| 2016 | 2015 | CHANGE | 2016 | 2015 | CHANGE | |||||||||||||||||||
| Revenue |
670 | 649 | 3 | % | 1,544 | 1,779 | (13 | )% | ||||||||||||||||
| Gross profit |
146 | 133 | 10 | % | 307 | 415 | (26 | )% | ||||||||||||||||
| Net earnings (losses) attributable to equity holders |
142 | (4 | ) | >100 | % | 83 | 75 | 11 | % | |||||||||||||||
| $ per common share (basic) |
0.36 | (0.01 | ) | >100 | % | 0.21 | 0.19 | 11 | % | |||||||||||||||
| $ per common share (diluted) |
0.36 | (0.01 | ) | >100 | % | 0.21 | 0.19 | 11 | % | |||||||||||||||
| Adjusted net earnings (non-IFRS, see page 7) |
118 | 78 | 51 | % | 54 | 193 | (72 | )% | ||||||||||||||||
| $ per common share (adjusted and diluted) |
0.30 | 0.20 | 50 | % | 0.14 | 0.49 | (71 | )% | ||||||||||||||||
| Cash provided by (used in) operations (after working capital changes) |
385 | (121 | ) | >100 | % | 57 | (53 | ) | >100 | % | ||||||||||||||
NET EARNINGS
Net earnings attributable to equity holders this quarter were $142 million ($0.36 per share diluted) compared to net losses of $4 million (losses of $0.01 per share diluted) in the third quarter of 2015 due to:
| • | lower mark-to-market losses on foreign exchange derivatives compared to the third quarter of 2015 |
| • | gain from termination of long-term contracts |
| • | higher gross profit from our uranium segment |
partially offset by:
| • | lower foreign exchange gains |
| • | lower gross profit from our NUKEM segment |
| • | lower tax recovery |
On an adjusted basis, our earnings this quarter were $118 million ($0.30 per share diluted) compared to earnings of $78 million ($0.20 per share diluted) (non-IFRS measure, see page 7) in the third quarter of 2015. The change was mainly due to:
| • | gain from termination of long-term contracts |
| • | higher gross profit from our uranium segment |
| • | higher tax recovery |
partially offset by:
| • | higher losses on foreign exchange derivatives designated for use in the period compared to the third quarter of 2015 |
| • | lower foreign exchange gains |
| • | lower gross profit from our NUKEM segment |
See Financial results by segment on page 17 for more detailed discussion.
FIRST NINE MONTHS
Net earnings attributable to equity holders in the first nine months of the year were $83 million ($0.21 per share diluted) compared to earnings of $75 million ($0.19 per share diluted) in the first nine months of 2015 mainly due to:
| • | higher gross profit from our fuel services segment |
| • | mark-to-market gains on foreign exchange derivatives compared to losses in the first nine months of 2015 |
| • | gain from termination of long-term contracts |
partially offset by:
| • | impairment of our Rabbit Lake operation |
| • | lower gross profit from our uranium and NUKEM segments |
| 6 CAMECO CORPORATION |
Table of Contents
| • | higher administration costs |
| • | higher exploration costs |
| • | higher foreign exchange losses compared to gains in the first nine months of 2015 |
| • | lower tax recovery |
On an adjusted basis, our earnings for the first nine months of this year were $54 million ($0.14 per share diluted) compared to earnings of $193 million ($0.49 per share diluted) (non-IFRS measure, see page 7) for the first nine months of 2015. Key variances include:
| • | lower gross profit from our uranium and NUKEM segments |
| • | higher administration costs |
| • | higher exploration costs |
| • | higher foreign exchange losses compared to gains in the first nine months of 2015 |
partially offset by:
| • | higher gross profit from our fuel services segment |
| • | gain from termination of long-term contracts |
| • | higher tax recovery |
See Financial results by segment on page 17 for more detailed discussion.
ADJUSTED NET EARNINGS (NON-IFRS MEASURE)
Adjusted net earnings is a measure that does not have a standardized meaning or a consistent basis of calculation under IFRS (non-IFRS measure). We use this measure as a more meaningful way to compare our financial performance from period to period. We believe that, in addition to conventional measures prepared in accordance with IFRS, certain investors use this information to evaluate our performance. Adjusted net earnings is our net earnings attributable to equity holders, adjusted to better reflect the underlying financial performance for the reporting period. The adjusted earnings measure reflects the matching of the net benefits of our hedging program with the inflows of foreign currencies in the applicable reporting period, and has also been adjusted for NUKEM purchase price inventory adjustments, Rabbit Lake reclamation provisions, impairment charges, write off of assets, and income taxes on adjustments.
Adjusted net earnings is non-standard supplemental information and should not be considered in isolation or as a substitute for financial information prepared according to accounting standards. Other companies may calculate this measure differently, so you may not be able to make a direct comparison to similar measures presented by other companies.
The following table reconciles adjusted net earnings with our net earnings.
| THREE MONTHS ENDED SEPTEMBER 30 |
NINE MONTHS ENDED SEPTEMBER 30 |
|||||||||||||||
| ($ MILLIONS) |
2016 | 2015 | 2016 | 2015 | ||||||||||||
| Net earnings (losses) attributable to equity holders |
142 | (4 | ) | 83 | 75 | |||||||||||
|
|
|
|
|
|
|
|
|
|||||||||
| Adjustments |
||||||||||||||||
| Adjustments on foreign exchange derivatives |
(27 | ) | 112 | (153 | ) | 157 | ||||||||||
| NUKEM purchase price inventory adjustment |
— | — | (6 | ) | (3 | ) | ||||||||||
| Impairment charges |
— | — | 124 | 6 | ||||||||||||
| Rabbit Lake reclamation provision |
(6 | ) | — | (6 | ) | — | ||||||||||
| Income taxes on adjustments |
9 | (30 | ) | 12 | (42 | ) | ||||||||||
|
|
|
|
|
|
|
|
|
|||||||||
| Adjusted net earnings |
118 | 78 | 54 | 193 | ||||||||||||
|
|
|
|
|
|
|
|
|
|||||||||
| 2016 THIRD QUARTER REPORT 7 |
Table of Contents
The following table shows what contributed to the change in adjusted net earnings for this quarter and for the first nine months of the year.
| THREE MONTHS | NINE MONTHS | |||||||||
| ($ MILLIONS) |
ENDED SEPTEMBER 30 | ENDED SEPTEMBER 30 | ||||||||
| Adjusted net earnings – 2015 |
78 | 193 | ||||||||
| Change in gross profit by segment |
||||||||||
| (We calculate gross profit by deducting from revenue the cost of products and services sold, and depreciation and amortization (D&A)) |
||||||||||
| Uranium |
Higher (lower) sales volume | 36 | (24 | ) | ||||||
| Lower realized prices ($US) | — | (31 | ) | |||||||
| Foreign exchange impact on realized prices | 5 | 56 | ||||||||
| Lower (higher) costs | 2 | (50 | ) | |||||||
|
|
|
|
|
|||||||
| change – uranium | 43 | (49 | ) | |||||||
|
|
|
|
|
|||||||
| Fuel services |
Lower sales volume | (1 | ) | (2 | ) | |||||
| Higher realized prices ($Cdn) | — | 8 | ||||||||
|
|
|
|
|
|||||||
| Higher costs | — | (2 | ) | |||||||
| change – fuel services | (1 | ) | 4 | |||||||
|
|
|
|
|
|||||||
| NUKEM |
Gross profit | (28 | ) | (64 | ) | |||||
|
|
|
|
|
|||||||
| change – NUKEM | (28 | ) | (64 | ) | ||||||
|
|
|
|
|
|||||||
| Other changes |
||||||||||
| Lower (higher) administration expenditures |
1 | (19 | ) | |||||||
| Higher exploration expenditures |
— | (4 | ) | |||||||
| Higher income tax recovery |
14 | 34 | ||||||||
| Gain on customer contract settlements |
59 | 59 | ||||||||
| Higher loss on disposal of assets |
(1 | ) | (9 | ) | ||||||
| Higher loss on derivatives |
(24 | ) | (9 | ) | ||||||
| Higher foreign exchange losses |
(21 | ) | (75 | ) | ||||||
| Other |
(2 | ) | (7 | ) | ||||||
|
|
|
|
|
|||||||
| Adjusted net earnings – 2016 |
118 | 54 | ||||||||
|
|
|
|
|
|||||||
See Financial results by segment on page 17 for more detailed discussion.
Quarterly trends
| HIGHLIGHTS ($ MILLIONS EXCEPT PER SHARE AMOUNTS) |
2016 | 2015 | 2014 | |||||||||||||||||||||||||||||
| Q3 | Q2 | Q1 | Q4 | Q3 | Q2 | Q1 | Q4 | |||||||||||||||||||||||||
| Revenue |
670 | 466 | 408 | 975 | 649 | 565 | 566 | 889 | ||||||||||||||||||||||||
| Net earnings (losses) attributable to equity holders |
142 | (137 | ) | 78 | (10 | ) | (4 | ) | 88 | (9 | ) | 73 | ||||||||||||||||||||
| $ per common share (basic) |
0.36 | (0.35 | ) | 0.20 | (0.03 | ) | (0.01 | ) | 0.22 | (0.02 | ) | 0.18 | ||||||||||||||||||||
| $ per common share (diluted) |
0.36 | (0.35 | ) | 0.20 | (0.03 | ) | (0.01 | ) | 0.22 | (0.02 | ) | 0.18 | ||||||||||||||||||||
| Adjusted net earnings (losses) (non-IFRS, see page 7) |
118 | (57 | ) | (7 | ) | 151 | 78 | 46 | 69 | 205 | ||||||||||||||||||||||
| $ per common share (adjusted and diluted) |
0.30 | (0.14 | ) | (0.02 | ) | 0.38 | 0.20 | 0.12 | 0.18 | 0.52 | ||||||||||||||||||||||
| Cash provided by (used in) operations (after working capital changes) |
385 | (51 | ) | (277 | ) | 503 | (121 | ) | (65 | ) | 134 | 236 | ||||||||||||||||||||
Key things to note:
| • | our financial results are strongly influenced by the performance of our uranium segment, which accounted for 79% of consolidated revenues in the third quarter of 2016 |
| • | the timing of customer requirements, which tend to vary from quarter to quarter, drives revenue in the uranium and fuel services segments, meaning quarterly results are not necessarily a good indication of annual results due to seasonal variability |
| 8 CAMECO CORPORATION |
Table of Contents
| • | net earnings do not trend directly with revenue due to unusual items and transactions that occur from time to time. We use adjusted net earnings, a non-IFRS measure, as a more meaningful way to compare our results from period to period (see page 7 for more information). |
| • | cash from operations tends to fluctuate as a result of the timing of deliveries and product purchases in our uranium and fuel services segments |
The table that follows presents the differences between net earnings and adjusted net earnings for the previous seven quarters.
| HIGHLIGHTS ($ MILLIONS EXCEPT PER SHARE AMOUNTS) |
2016 | 2015 | 2014 | |||||||||||||||||||||||||||||
| Q3 | Q2 | Q1 | Q4 | Q3 | Q2 | Q1 | Q4 | |||||||||||||||||||||||||
| Net earnings (losses) attributable to equity holders |
142 | (137 | ) | 78 | (10 | ) | (4 | ) | 88 | (9 | ) | 73 | ||||||||||||||||||||
|
|
|
|
|
|
|
|
|
|
|
|
|
|
|
|
|
|||||||||||||||||
| Adjustments |
||||||||||||||||||||||||||||||||
| Adjustments on foreign exchange derivatives |
(27 | ) | (10 | ) | (116 | ) | 10 | 112 | (57 | ) | 101 | 10 | ||||||||||||||||||||
| NUKEM purchase price inventory adjustment |
— | (6 | ) | — | — | — | — | (3 | ) | (4 | ) | |||||||||||||||||||||
| Impairment charges |
— | 124 | — | 210 | — | — | 6 | 131 | ||||||||||||||||||||||||
| Rabbit Lake reclamation provision |
(6 | ) | — | — | — | — | — | — | — | |||||||||||||||||||||||
| Write-off of assets |
— | — | — | — | — | — | — | 41 | ||||||||||||||||||||||||
| Income taxes on adjustments |
9 | (28 | ) | 31 | (59 | ) | (30 | ) | 15 | (26 | ) | (46 | ) | |||||||||||||||||||
|
|
|
|
|
|
|
|
|
|
|
|
|
|
|
|
|
|||||||||||||||||
| Adjusted net earnings (losses) (non-IFRS, see page 7) |
118 | (57 | ) | (7 | ) | 151 | 78 | 46 | 69 | 205 | ||||||||||||||||||||||
|
|
|
|
|
|
|
|
|
|
|
|
|
|
|
|
|
|||||||||||||||||
Corporate expenses
ADMINISTRATION
| THREE MONTHS ENDED SEPTEMBER 30 |
NINE MONTHS ENDED SEPTEMBER 30 |
|||||||||||||||||||||||
| ($ MILLIONS) |
2016 | 2015 | CHANGE | 2016 | 2015 | CHANGE | ||||||||||||||||||
| Direct administration |
39 | 38 | 3 | % | 145 | 122 | 19 | % | ||||||||||||||||
| Stock-based compensation |
— | 2 | (100 | )% | 6 | 10 | (40 | )% | ||||||||||||||||
|
|
|
|
|
|
|
|
|
|
|
|
|
|||||||||||||
| Total administration |
39 | 40 | (3 | )% | 151 | 132 | 14 | % | ||||||||||||||||
|
|
|
|
|
|
|
|
|
|
|
|
|
|||||||||||||
Direct administration costs were $1 million higher for the third quarter of 2016 compared to the same period last year, and $23 million higher for the first nine months. The increase was mainly due to:
| • | one-time costs related to collaboration agreements |
| • | charges related to the consolidation of office space |
| • | legal costs as our CRA dispute progresses towards trial |
| • | restructuring of our NUKEM segment, and corporate office changes resulting from operational changes at Rabbit Lake and our US ISR operations |
We have reduced staffing levels at our corporate office by 10% to date in 2016, and we are continuing to evaluate corporate support functions in light of the operational changes at our Rabbit Lake and US ISR operations, and the continued weak market conditions.
EXPLORATION
In the third quarter, uranium exploration expenses were $10 million, unchanged from the third quarter of 2015. Exploration expenses for the first nine months of the year increased by $4 million compared to 2015, to $37 million, due to a planned increase in expenditures.
INCOME TAXES
We recorded an income tax recovery of $10 million in the third quarter of 2016, compared to $35 million in the third quarter of 2015.
| 2016 THIRD QUARTER REPORT 9 |
Table of Contents
On an adjusted basis, we recorded an income tax recovery of $19 million this quarter compared to $5 million in the third quarter of 2015 primarily due to a change in the distribution of earnings among foreign jurisdictions. In 2016, we recorded losses of $121 million in Canada compared to $115 million in 2015, while earnings in foreign jurisdictions increased to $221 million from $187 million.
In the first nine months of 2016, we recorded an income tax recovery of $66 million compared to $85 million in 2015.
On an adjusted basis, we recorded an income tax recovery of $79 million for the first nine months compared to $45 million in 2015 due to lower pre-tax adjusted earnings in 2016. We recorded losses of $22 million during the first nine months compared to earnings of $147 million for the same period in 2015.
| THREE MONTHS ENDED SEPTEMBER 30 |
NINE MONTHS ENDED SEPTEMBER 30 |
|||||||||||||||
| ($ MILLIONS) |
2016 | 2015 | 2016 | 2015 | ||||||||||||
| Pre-tax adjusted earnings1 |
||||||||||||||||
| Canada2 |
(121 | ) | (115 | ) | (371 | ) | (382 | ) | ||||||||
| Foreign |
221 | 187 | 349 | 529 | ||||||||||||
|
|
|
|
|
|
|
|
|
|||||||||
| Total pre-tax adjusted earnings |
100 | 72 | (22 | ) | 147 | |||||||||||
|
|
|
|
|
|
|
|
|
|||||||||
| Adjusted income taxes1 |
||||||||||||||||
| Canada2 |
(28 | ) | (26 | ) | (96 | ) | (86 | ) | ||||||||
| Foreign |
9 | 21 | 17 | 41 | ||||||||||||
|
|
|
|
|
|
|
|
|
|||||||||
| Adjusted income tax recovery |
(19 | ) | (5 | ) | (79 | ) | (45 | ) | ||||||||
|
|
|
|
|
|
|
|
|
|||||||||
| 1 | Pre-tax adjusted earnings and adjusted income taxes are non-IFRS measures. |
| 2 | Our IFRS-based measures have been adjusted by the amounts reflected in the table in adjusted net earnings (non-IFRS measure on page 7). |
TRANSFER PRICING DISPUTES
We have been reporting on our transfer pricing disputes with CRA since 2008, when they originated, and with the IRS since the first quarter of 2015. Below, we discuss the general nature of transfer pricing disputes and, more specifically, the ongoing disputes we have.
Transfer pricing is a complex area of tax law, and it is difficult to predict the outcome of cases like ours. However, tax authorities generally test two things:
| • | the governance (structure) of the corporate entities involved in the transactions |
| • | the price at which goods and services are sold by one member of a corporate group to another |
We have a global customer base and we established a marketing and trading structure involving foreign subsidiaries, including Cameco Europe Limited (CEL), which entered into various intercompany arrangements, including purchase and sale agreements, as well as uranium purchase and sale agreements with third parties. Cameco and its subsidiaries made reasonable efforts to put arm’s-length transfer pricing arrangements in place, and these arrangements expose the parties to the risks and rewards accruing to them under these contracts. The intercompany contract prices are generally comparable to those established in comparable contracts between arm’s-length parties entered into at that time.
For the years 2003 to 2010, CRA has shifted CEL’s income (as recalculated by CRA) back to Canada and applied statutory tax rates, interest and instalment penalties, and, from 2007 to 2010, transfer pricing penalties. The IRS is also proposing to allocate a portion of CEL’s income for the years 2009 through 2012 to the US, resulting in such income being taxed in multiple jurisdictions. Taxes of approximately $320 million for the 2003 – 2015 years have already been paid in a jurisdiction outside Canada and the US. Bilateral international tax treaties contain provisions that generally seek to prevent taxation of the same income in both countries. As such, in connection with these disputes, we are considering our options, including remedies under international tax treaties that would limit double taxation; however, there is a risk that we will not be successful in eliminating all potential double taxation. The expected income adjustments under our tax disputes are represented by the amounts claimed by CRA and IRS and are described below.
CRA dispute
Since 2008, CRA has disputed our corporate structure and the related transfer pricing methodology we used for certain intercompany uranium sale and purchase agreements. To date, we have received notices of reassessment for our 2003 through 2010 tax returns. We have recorded a cumulative tax provision of $54 million, where an argument could be made that our transfer price may have fallen outside of an appropriate range of pricing in uranium contracts for the period from 2003 through September 30, 2016. We are confident that we will be successful in our case and continue to believe the ultimate resolution of this matter will not be material to our financial position, results of operations and cash flows in the year(s) of resolution.
| 10 CAMECO CORPORATION |
Table of Contents
For the years 2003 through 2010, CRA issued notices of reassessment for approximately $3.4 billion of additional income for Canadian tax purposes, which would result in a related tax expense of approximately $1.1 billion. CRA has also issued notices of reassessment for transfer pricing penalties for the years 2007 through 2010 in the amount of $292 million. The Canadian income tax rules include provisions that require larger companies like us to remit or otherwise secure 50% of the cash tax plus related interest and penalties at the time of reassessment. To date, under these provisions, after applying elective deductions, we have paid a net amount of $264 million cash. In addition, we have provided $340 million in letters of credit (LC) to secure 50% of the cash taxes and related interest amounts reassessed to date. The amounts paid or secured are shown in the table below.
| YEAR PAID ($ MILLIONS) |
CASH TAXES |
INTEREST AND INSTALMENT PENALTIES |
TRANSFER PRICING PENALTIES |
TOTAL | CASH REMITTANCE |
SECURED BY LC |
||||||||||||||||||
| Prior to 2013 |
— | 13 | — | 13 | 13 | — | ||||||||||||||||||
| 2013 |
1 | 9 | 36 | 46 | 46 | — | ||||||||||||||||||
| 2014 |
106 | 47 | — | 153 | 153 | — | ||||||||||||||||||
| 2015 |
202 | 71 | 79 | 352 | 20 | 332 | ||||||||||||||||||
| 2016 |
7 | 2 | 31 | 40 | 32 | 8 | ||||||||||||||||||
|
|
|
|
|
|
|
|
|
|
|
|
|
|||||||||||||
| Total |
316 | 142 | 146 | 604 | 264 | 340 | ||||||||||||||||||
|
|
|
|
|
|
|
|
|
|
|
|
|
|||||||||||||
Using the methodology we believe CRA will continue to apply, and including the $3.4 billion already reassessed, we expect to receive notices of reassessment for a total of approximately $7.4 billion of additional income taxable in Canada for the years 2003 through 2015, which would result in a related tax expense of approximately $2.2 billion. As well, CRA may continue to apply transfer pricing penalties to taxation years subsequent to 2010. As a result, we estimate that cash taxes and transfer pricing penalties for all years would be between $1.5 billion and $1.7 billion. In addition, we estimate there would be interest and instalment penalties applied that would be material to us. While in dispute, we would be responsible for remitting or otherwise providing security for 50% of the cash taxes and transfer pricing penalties (between $750 million and $850 million), plus related interest and instalment penalties assessed, which would be material to us.
Under the Canadian federal and provincial tax rules, the amount required to be paid or secured each year will depend on the amount of income reassessed in that year and the availability of elective deductions and tax loss carryovers. In 2015, the CRA decided to disallow the use of any loss carry-backs for any transfer pricing adjustment, starting with the 2008 tax year. This does not impact the anticipated income tax expense for a particular year, but does impact the timing of any required security or payment. For the 2010 tax year, as an alternative to paying cash, we used letters of credit to satisfy our obligations related to the reassessed income tax and related interest amounts. We expect to be able to continue to provide security in the form of letters of credit to satisfy these requirements. The estimated amounts summarized in the table below reflect actual amounts paid or secured and estimated future amounts owing based on the actual and expected reassessments for the years 2003 through 2015, and include the expected timing adjustment for the inability to use any loss carry-backs starting in 2008. We will update this table annually to include the estimated impact of reassessments expected for completed years subsequent to 2015.
| $ MILLIONS |
2003-2015 | 2016-2017 | 2018-2023 | TOTAL | ||||||||||||
| 50% of cash taxes and transfer pricing penalties paid, secured or owing in the period |
||||||||||||||||
| Cash payments |
156 | 105 - 130 | 100 - 125 | 360 - 410 | ||||||||||||
| Secured by letters of credit |
264 | 40 - 65 | 85 - 110 | 390 - 440 | ||||||||||||
|
|
|
|
|
|
|
|
|
|||||||||
| Total paid1 |
420 | 145 - 195 | 185 - 235 | 750 - 850 | ||||||||||||
|
|
|
|
|
|
|
|
|
|||||||||
| 1 | These amounts do not include interest and instalment penalties, which totalled approximately $142 million to September 30, 2016. |
In light of our view of the likely outcome of the case as described above, we expect to recover the amounts remitted, including the $604 million already paid or otherwise secured to date.
| 2016 THIRD QUARTER REPORT 11 |
Table of Contents
The trial for the 2003, 2005 and 2006 reassessments commenced in October 2016. Final arguments are expected in the second half of 2017. If this timing is adhered to, we expect to receive a Tax Court decision within six to 18 months after the trial is complete.
IRS dispute
We have received Revenue Agents Reports (RAR) from the IRS for the tax years 2009 to 2012. The IRS is challenging the transfer pricing used under certain intercompany transactions pertaining to the 2009 to 2012 tax years for certain of our US subsidiaries. The 2009 to 2012 RARs list the adjustments proposed by the IRS and calculate the tax and any penalties owing based on the proposed adjustments.
The current position of the IRS is that a portion of the non-US income reported under our corporate structure and taxed in non-US jurisdictions should be recognized and taxed in the US on the basis that:
| • | the prices received by our US mining subsidiaries for the sale of uranium to CEL are too low |
| • | the compensation earned by Cameco Inc., one of our US subsidiaries, is inadequate |
The proposed adjustments result in an increase in taxable income in the US of approximately $419 million (US) and a corresponding increased income tax expense of approximately $122 million (US) for the 2009 through 2012 taxation years, with interest being charged thereon. In addition, the IRS proposed cumulative penalties of approximately $8 million (US) in respect of the adjustment.
We believe that the conclusions of the IRS in the RARs are incorrect and we are contesting them in an administrative appeal, during which we are not required to make any cash payments. Until this matter progresses further, we cannot provide an estimation of the likely timeline for a resolution of the dispute.
We believe that the ultimate resolution of the IRS matter will not be material to our financial position, results of operations and cash flows in the year(s) of resolution.
Caution about forward-looking information relating to our CRA and IRS tax disputes
This discussion of our expectations relating to our tax disputes with CRA and IRS and future tax reassessments by CRA and IRS is forward-looking information that is based upon the assumptions and subject to the material risks discussed under the heading Caution about forward-looking information beginning on page 2 and also on the more specific assumptions and risks listed below. Actual outcomes may vary significantly.
| 12 CAMECO CORPORATION |
Table of Contents
FOREIGN EXCHANGE
At September 30, 2016:
| • | The value of the US dollar relative to the Canadian dollar was $1.00 (US) for $1.31 (Cdn), up from $1.30 at June 30, 2016. The exchange rate averaged $1.00 (US) for $1.30 (Cdn) over the quarter. |
| • | We had foreign currency forward contracts of $0.9 billion (US) and foreign currency options of $120 million (US). The US currency forward contracts had an average exchange rate of $1.00 (US) for $1.29 (Cdn), US currency option contracts had an average exchange rate range of $1.00 (US) for $1.29 to $1.34 (Cdn). |
| • | The mark-to-market loss on all foreign exchange contracts was $15 million, compared to a $16 million loss at June 30, 2016. |
Our outlook for 2016 reflects the expenditures necessary to help us achieve our strategy. Our outlook for NUKEM revenue and gross profit, fuel services average unit cost of sales, consolidated revenue, consolidated tax rate, and capital expenditures has changed. We do not provide an outlook for the items in the table that are marked with a dash.
See 2016 Financial results by segment on page 17 for details.
2016 FINANCIAL OUTLOOK
| CONSOLIDATED | URANIUM | FUEL SERVICES | NUKEM | |||||||||||||
| Production |
— |
|
25.8 million lbs |
|
|
8 to 9 million kgU |
|
— | ||||||||
| Delivery volume1 |
— |
|
30 to 32 million lbs2 |
|
|
Decrease up to 5% |
|
|
7 to 8 million lbs U3O8 |
| ||||||
| Revenue compared to 20153 |
|
Decrease 10% to 15% |
|
|
Decrease 5% to 10%4 |
|
|
Increase up to 5% |
|
|
Decrease 20% to 25% |
| ||||
| Average unit cost of sales (including D&A) | — |
|
Increase up to 5% 5 |
|
|
Increase 5% to 10% |
|
— | ||||||||
| Direct administration costs compared to 20156 |
|
Increase 10% to 15% |
|
— | — | — | ||||||||||
| Gross profit |
— | — | — |
|
Gross profit 1% to 2% 7 |
| ||||||||||
| Exploration costs compared to 2015 |
— |
|
Increase 15% to 20% |
|
— | — | ||||||||||
| Tax rate8 |
|
Recovery of > 200% |
|
— | — | — | ||||||||||
| Capital expenditures |
$245 million | — | — | — | ||||||||||||
| 1 | Our 2016 outlook for delivery volume does not include sales between our uranium, fuel services and NUKEM segments. |
| 2 | Our uranium delivery volume is based on the volumes we currently have commitments to deliver under contract in 2016. |
| 3 | For comparison of our 2016 outlook and 2015 results for revenue, we do not include sales between our uranium, fuel services and NUKEM segments. |
| 4 | Based on a uranium spot price of $18.75 (US) per pound (the Ux spot price as of October 31, 2016), a long-term price indicator of $36.00 (US) per pound (the Ux long-term indicator on October 31, 2016) and an exchange rate of $1.00 (US) for $1.30 (Cdn). |
| 5 | This increase is based on the unit cost of sale for produced material and committed long-term purchases. If we make discretionary purchases in the remainder of 2016, then we expect the overall unit cost of sales could be different. |
| 6 | Direct administration costs do not include stock-based compensation expenses. See page 9 for more information. |
| 7 | NUKEM gross profit is net of inventory write-downs. |
| 8 | Our outlook for the tax rate is based on adjusted net earnings. |
We have reduced our outlook for NUKEM revenue to a decrease of 20% to 25% (previously a decrease of 5% to 10%) due to a continued decrease in the spot price. As a result, our outlook for consolidated revenue has also changed to a decrease of 10% to 15% (previously a decrease of 5% to 10%). We have also recast our outlook for NUKEM gross profit to be 1% to 2%, net of inventory write-downs (NUKEM gross profit was previously shown as up to 1%, including inventory write-downs).
Average unit cost of sales in our fuel services segment is now expected to increase 5% to 10% (previously an increase of 10% to 15%) due to an overall decrease in production costs and the mix of products sold.
| 2016 THIRD QUARTER REPORT 13 |
Table of Contents
Our outlook for capital expenditures has decreased to $245 million (previously $275 million) due to a reduction in spending at McArthur River, as well as the timing of expenditures on projects in our fuel services segment.
We have adjusted our outlook for consolidated tax rate to a recovery of greater than 200% (previously 175% to 200%). The increase in expected recovery is due to the changes in our outlook noted above, which result in a change in the distribution of earnings between jurisdictions, as well as the effect of losses recognized in Canada offset by foreign income.
In our uranium and fuel services segments, our customers choose when in the year to receive deliveries, so our quarterly delivery patterns, sales volumes and revenue can vary significantly. We are on track to meet our 2016 uranium sales targets, and, therefore, expect to deliver between 10 million and 12 million pounds in the fourth quarter.
REVENUE, CASH FLOW AND EARNINGS SENSITIVITY ANALYSIS
For the rest of 2016:
| • | an increase or decrease of $5 (US) per pound in both the Ux spot price ($18.75 (US) per pound on October 31, 2016) and the Ux long-term price indicator ($36.00 (US) per pound on October 31, 2016) would increase or decrease revenue by $7 million and net earnings by $5 million. |
| • | a one-cent change in the value of the Canadian dollar versus the US dollar would change adjusted net earnings by $3 million, with a decrease in the value of the Canadian dollar versus the US dollar having a positive impact. Cash flow would change by $1 million, with a decrease in the value of the Canadian dollar versus the US dollar having a negative impact. |
PRICE SENSITIVITY ANALYSIS: URANIUM SEGMENT
The following table and graph are not forecasts of prices we expect to receive. The prices we actually realize will be different from the prices shown in the table and graph. They are designed to indicate how the portfolio of long-term contracts we had in place on September 30, 2016 would respond to different spot prices. In other words, we would realize these prices only if the contract portfolio remained the same as it was on September 30, 2016 and none of the assumptions we list below change.
We intend to update this table and graph each quarter in our MD&A to reflect deliveries made and changes to our contract portfolio. As a result, we expect the table and graph to change from quarter to quarter.
Expected realized uranium price sensitivity under various spot price assumptions
(rounded to the nearest $1.00)
| SPOT PRICES ($US/lb U3O8) |
$ | 20 | $ | 40 | $ | 60 | $ | 80 | $ | 100 | $ | 120 | $ | 140 | ||||||||||||||
| 2016 |
41 | 41 | 42 | 44 | 46 | 48 | 49 | |||||||||||||||||||||
| 2017 |
38 | 45 | 56 | 67 | 78 | 87 | 95 | |||||||||||||||||||||
| 2018 |
39 | 47 | 58 | 69 | 80 | 89 | 97 | |||||||||||||||||||||
| 2019 |
38 | 47 | 59 | 70 | 80 | 88 | 95 | |||||||||||||||||||||
| 2020 |
41 | 48 | 59 | 69 | 78 | 86 | 92 |
URANIUM PRICE SENSITIVITY
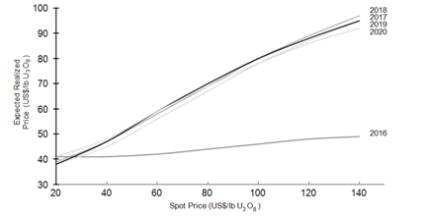
| 14 CAMECO CORPORATION |
Table of Contents
The table and graph illustrate the mix of long-term contracts in our September 30, 2016 portfolio, and are consistent with our marketing strategy. Both have been updated to September 30, 2016 to reflect deliveries made and contracts entered into or terminated.
Our portfolio includes a mix of fixed-price and market-related contracts, which we target at a 40:60 ratio. Those that are fixed at higher prices or have high floor prices will yield prices that are higher than current market prices.
In today’s weak market environment, the strength of our contract portfolio has been tested and proven to be sound. In cases where a customer is seeking relief due to a challenging policy, operating or economic environment, we evaluate their specific circumstances to determine if uncertain future value can be converted into certain present value.
In the third quarter, our evaluation resulted in agreements to terminate long-term supply contracts with two of our utility customers where future uranium requirements were uncertain. In both instances, we were able to harvest that uncertain future value to improve earnings and cash flow in the near-term. The first, which we disclosed as a subsequent event in our second quarter MD&A, had product deliveries from 2016 through 2021 and resulted in a gain on contract settlement of $46.7 million. The second had product deliveries from 2016 through 2020 and resulted in a contract settlement of $12.3 million. These gains have been reflected in our financial results for the third quarter as other income.
Our portfolio is affected by more than just the spot price. We made the following assumptions (which are not forecasts) to create the table:
Liquidity and capital resources
Our financial objective is to make sure we have the cash and debt capacity to fund our operating activities, investments and growth.
We have large, creditworthy customers that continue to need uranium even during weak economic conditions, and we expect the uranium contract portfolio we have built to provide a solid revenue stream for years to come.
We expect to continue investing in maintaining our tier-one production capacity and flexibility over the next several years. We have a number of alternatives to fund future capital requirements, including drawing on our existing credit facilities, entering new credit facilities, using our operating cash flow, and raising additional capital through debt or equity financings. We are always considering our financing options so we can take advantage of favourable market conditions when they arise. We expect our cash balances and operating cash flows to meet our capital requirements for the remainder of 2016.
We have an ongoing transfer pricing dispute with CRA. See page 10 for more information. Until this dispute is settled, we expect to pay cash or provide security in the form of letters of credit for future amounts owing to the Government of Canada for 50% of the cash taxes payable and the related interest and penalties.
CASH FROM OPERATIONS
Cash provided by operations was $506 million higher this quarter than in the third quarter of 2015. Contributing to this change was a decrease in working capital requirements, which required $394 million less in 2016 than in 2015. In the third quarter of 2016, inventories declined; however in 2015, there was an increase in inventory, which required more working capital. In addition, there was a large increase in accounts receivable in 2015 compared to the current quarter, which also required more working capital. Not including working capital requirements, our operating cash flows this quarter were higher by $112 million.
| 2016 THIRD QUARTER REPORT 15 |
Table of Contents
Cash provided by operations was $110 million higher in the first nine months of 2016 than for the same period in 2015 due largely to a decrease in working capital requirements. This was a result of the increase in inventory being higher in 2015 compared to the current period. Working capital required $168 million less in 2016. Partially offsetting the decreased working capital requirements were lower gross profits in our operating segments. Not including working capital requirements, our operating cash flows in the first nine months were lower by $58 million.
FINANCING ACTIVITIES
We use debt to provide additional liquidity. We have sufficient borrowing capacity with unsecured lines of credit totalling about $2.7 billion at September 30, 2016, unchanged from June 30, 2016. At September 30, 2016, we had approximately $1.4 billion outstanding in letters of credit, unchanged from June 30, 2016. At September 30, 2016, we had no short-term debt outstanding on our $1.25 billion unsecured revolving credit facility, down from $235 million on June 30, 2016, and during the quarter, we extended the maturity date of the facility from November 1, 2019, to November 1, 2020. At September 30, 2016, NUKEM had $26 million ($20 million (US)) outstanding on their 75 million (€) multicurrency revolving loan facility in the form of a short-term loan, compared to nil on June 30, 2016.
Long-term contractual obligations
Since December 31, 2015, there have been no material changes to our long-term contractual obligations. Please see our annual MD&A for more information.
Debt covenants
We are bound by certain covenants in our unsecured revolving credit facility. The financially related covenants place restrictions on total debt, including guarantees. As at September 30, 2016, we met these financial covenants and do not expect our operating and investment activities for the remainder of 2016 to be constrained by them.
NUKEM financing arrangements
NUKEM enters into financing arrangements with third parties where future receivables arising from certain sales contracts are sold to financial institutions in exchange for cash. These arrangements require NUKEM to satisfy its delivery obligations under the sales contracts, which are recognized as deferred sales (see notes 5 and 7 to the financial statements for more information). In addition, NUKEM is required to pledge the underlying inventory as security against these performance obligations. As of September 30, 2016, we had $4.8 million ($3.6 million (US)) of inventory pledged as security under financing arrangements, compared with $97.9 million ($70.8 million (US)) at December 31, 2015.
OFF-BALANCE SHEET ARRANGEMENTS
We had three kinds of off-balance sheet arrangements at September 30, 2016:
| • | purchase commitments |
| • | financial assurances |
| • | other arrangements |
There have been no material changes to our purchase commitments since June 30, 2016. Please see our second quarter MD&A for more information.
Financial assurances
At September 30, 2016, our financial assurances totalled $1.4 billion, unchanged from June 30, 2016.
Other arrangements
We continue to use factoring and other third party arrangements to manage short-term cash flow fluctuations. You can read more about these arrangements in our 2015 annual MD&A.
| 16 CAMECO CORPORATION |
Table of Contents
BALANCE SHEET
| ($ MILLIONS) |
SEP 30, 2016 | DEC 31, 2015 | CHANGE | |||||||||
| Cash and cash equivalents |
199 | 459 | (57 | )% | ||||||||
| Total debt |
1,519 | 1,492 | 2 | % | ||||||||
| Inventory |
1,388 | 1,285 | 8 | % | ||||||||
Total cash and cash equivalents at September 30, 2016 were $199 million, or 57% lower than at December 31, 2015, primarily due to capital expenditures of $167 million, dividend payments of $119 million, and interest payments of $50 million, offset by cash provided by operations of $57 million and short-term borrowings of $26 million. Net debt at September 30, 2016 was $1,320 million.
Total product inventories increased to $1,388 million, including NUKEM’s inventories ($142 million). Inventories increased as sales were lower than production and purchases in the first nine months of the year. As of September 30, 2016, we held an inventory of 31 million pounds of U3O8 equivalent in our uranium segment (excluding broken ore).
| THREE MONTHS ENDED SEPTEMBER 30 |
NINE MONTHS ENDED SEPTEMBER 30 |
|||||||||||||||||||||||||||
| HIGHLIGHTS |
2016 | 2015 | CHANGE | 2016 | 2015 | CHANGE | ||||||||||||||||||||||
| Production volume (million lbs) |
5.9 | 8.2 | (28 | )% | 19.9 | 18.7 | 6 | % | ||||||||||||||||||||
| Sales volume (million lbs)1 |
9.3 | 6.9 | 35 | % | 19.9 | 21.2 | (6 | )% | ||||||||||||||||||||
| Average spot price |
($ | US/lb | ) | 24.57 | 36.21 | (32 | )% | 27.86 | 36.91 | (25 | )% | |||||||||||||||||
| Average long-term price |
($ | US/lb | ) | 37.83 | 44.17 | (14 | )% | 41.06 | 47.06 | (13 | )% | |||||||||||||||||
| Average realized price |
($ | US/lb | ) | 43.37 | 43.61 | (1 | )% | 42.92 | 44.57 | (4 | )% | |||||||||||||||||
| ($ | Cdn/lb | ) | 56.34 | 56.07 | — | 56.77 | 55.65 | 2 | % | |||||||||||||||||||
| Average unit cost of sales (including D&A) |
($ | Cdn/lb | ) | 39.97 | 40.16 | — | 41.63 | 39.13 | 6 | % | ||||||||||||||||||
| Revenue ($ millions)1 |
526 | 388 | 36 | % | 1,129 | 1,179 | (4 | )% | ||||||||||||||||||||
| Gross profit ($ millions) |
153 | 110 | 39 | % | 301 | 350 | (14 | )% | ||||||||||||||||||||
| Gross profit (%) |
29 | 28 | 4 | % | 27 | 30 | (10 | )% | ||||||||||||||||||||
| 1 | There were no significant intersegment transactions in the periods shown. |
THIRD QUARTER
Production volumes this quarter were 28% lower compared to the third quarter of 2015, mainly due to planned lower production from McArthur River/Key Lake and Rabbit Lake, and lower production from Inkai. See Uranium 2016 Q3 updates starting on page 21 for more information.
The 36% increase in uranium revenues was a result of a 35% increase in sales volume. Sales in the third quarter were higher than in 2015 due to the timing of deliveries, which are driven by customer requests and can vary significantly.
The US dollar average realized price decreased by 1% compared to 2015, mainly due to lower prices on market-related contracts, while the higher Canadian dollar realized prices this quarter were a result of the weakening of the Canadian dollar compared to 2015. This quarter, the exchange rate on the average realized price was $1.00 (US) for $1.30 (Cdn) compared to $1.00 (US) for $1.29 (Cdn) in the third quarter of 2015.
Total cost of sales (including D&A) increased by 34% ($373 million compared to $278 million in 2015) due to a 35% increase in sales volume.
The net effect was a $43 million increase in gross profit for the quarter.
FIRST NINE MONTHS
Production volumes for the first nine months of the year were 6% higher than in the previous year due to the addition of production from Cigar Lake and higher production at Inkai, partially offset by planned lower production at McArthur River/Key Lake, Rabbit Lake and our US operations. See Uranium 2016 Q3 updates starting on page 21 for more information.
| 2016 THIRD QUARTER REPORT 17 |
Table of Contents
Uranium revenues decreased 4% compared to the first nine months of 2015 due to a 6% decrease in sales volumes, partially offset by a 2% increase in the Canadian dollar average realized price.
Our Canadian dollar realized prices for the first nine months of 2016 were higher than 2015, primarily as a result of the weakening of the Canadian dollar compared to 2015. For the first nine months of 2016, the exchange rate on the average realized price was $1.00 (US) for $1.32 (Cdn) compared to $1.00 (US) for $1.25 (Cdn) for the same period in 2015.
Total cost of sales (including D&A) remained virtually unchanged ($828 million compared to $829 million in 2015) mainly due to a 6% decrease in sales volume for the first nine months, offset by a 6% increase in the unit cost of sales. The increase in the unit cost of sales was mainly the result of care and maintenance costs and severance costs related to the curtailment of production at Rabbit Lake and in the US.
The net effect was a $49 million decrease in gross profit for the first nine months.
The table below shows the costs of produced and purchased uranium incurred in the reporting periods (which are non-IFRS measures, see the paragraphs below the table). These costs do not include care and maintenance costs, selling costs such as royalties, transportation and commissions, nor do they reflect the impact of opening inventories on our reported cost of sales.
| THREE MONTHS ENDED SEPTEMBER 30 |
NINE MONTHS ENDED SEPTEMBER 30 |
|||||||||||||||||||||||
| ($CDN/LB) |
2016 | 2015 | CHANGE | 2016 | 2015 | CHANGE | ||||||||||||||||||
| Produced |
||||||||||||||||||||||||
| Cash cost |
16.31 | 17.56 | (7 | )% | 17.72 | 22.97 | (23 | )% | ||||||||||||||||
| Non-cash cost |
13.07 | 9.53 | 37 | % | 12.18 | 11.79 | 3 | % | ||||||||||||||||
| Total production cost |
29.38 | 27.09 | 8 | % | 29.90 | 34.76 | (14 | )% | ||||||||||||||||
| Quantity produced (million lbs) |
5.9 | 8.2 | (28 | )% | 19.9 | 18.7 | 6 | % | ||||||||||||||||
| Purchased |
||||||||||||||||||||||||
| Cash cost |
39.91 | 47.19 | (15 | )% | 48.91 | 46.83 | 4 | % | ||||||||||||||||
| Quantity purchased (million lbs) |
0.5 | 2.7 | (81 | )% | 6.2 | 9.3 | (33 | )% | ||||||||||||||||
| Totals |
||||||||||||||||||||||||
| Produced and purchased costs |
30.20 | 32.07 | (6 | )% | 34.42 | 38.77 | (11 | )% | ||||||||||||||||
| Quantities produced and purchased (million lbs) |
6.4 | 10.9 | (41 | )% | 26.1 | 28.0 | (7 | )% | ||||||||||||||||
The average cash cost of production was 7% lower for the quarter and 23% lower in the first nine months than in comparable periods in 2015. The change was primarily due to the rampup of low-cost production from Cigar Lake, and the impact of our second quarter actions to curtail higher cost production in the US and from Rabbit Lake.
Although purchased pounds are transacted in US dollars, we account for the purchases in Canadian dollars. In the third quarter, the average cash cost of purchased material was $39.91 (Cdn) per pound, or $30.75 (US) per pound in US dollar terms, compared to $37.78 (US) per pound in the third quarter of 2015. For the first nine months, the average cash cost of purchased material was $48.91 (Cdn), or $35.70 (US) per pound, compared to $37.51 (US) per pound in the same period in 2015.
Cash cost per pound, non-cash cost per pound and total cost per pound for produced and purchased uranium presented in the above table are non-IFRS measures. These measures do not have a standardized meaning or a consistent basis of calculation under IFRS. We use these measures in our assessment of the performance of our uranium business. We believe that, in addition to conventional measures prepared in accordance with IFRS, certain investors use this information to evaluate our performance and ability to generate cash flow.
These measures are non-standard supplemental information and should not be considered in isolation or as a substitute for measures of performance prepared according to accounting standards. These measures are not necessarily indicative of operating profit or cash flow from operations as determined under IFRS. Other companies may calculate these measures differently, so you may not be able to make a direct comparison to similar measures presented by other companies.
To facilitate a better understanding of these measures, the following table presents a reconciliation of these measures to our unit cost of sales for the third quarter and the first nine months of 2016 and 2015.
| 18 CAMECO CORPORATION |
Table of Contents
Cash and total cost per pound reconciliation
| THREE MONTHS ENDED SEPTEMBER 30 |
NINE MONTHS ENDED SEPTEMBER 30 |
|||||||||||||||
| ($ MILLIONS) |
2016 | 2015 | 2016 | 2015 | ||||||||||||
| Cost of product sold |
285.7 | 205.5 | 654.6 | 660.9 | ||||||||||||
| Add / (subtract) |
||||||||||||||||
| Royalties |
(37.4 | ) | (31.3 | ) | (77.3 | ) | (67.0 | ) | ||||||||
| Care and maintenance and severance costs |
(20.1 | ) | — | (58.8 | ) | — | ||||||||||
| Other selling costs |
(5.6 | ) | (1.9 | ) | (8.5 | ) | (7.1 | ) | ||||||||
| Change in inventories |
(106.4 | ) | 99.1 | 145.9 | 278.1 | |||||||||||
| Cash operating costs (a) |
116.2 | 271.4 | 655.9 | 864.9 | ||||||||||||
| Add / (subtract) |
||||||||||||||||
| Depreciation and amortization |
87.6 | 72.2 | 173.1 | 168.2 | ||||||||||||
| Change in inventories |
(10.5 | ) | 6.0 | 69.3 | 52.5 | |||||||||||
| Total operating costs (b) |
193.3 | 349.6 | 898.3 | 1,085.6 | ||||||||||||
| Uranium produced & purchased (million lbs) (c) |
6.4 | 10.9 | 26.1 | 28.0 | ||||||||||||
| Cash costs per pound (a ÷ c) |
18.16 | 24.90 | 25.13 | 30.89 | ||||||||||||
| Total costs per pound (b ÷ c) |
30.20 | 32.07 | 34.42 | 38.77 | ||||||||||||
(includes results for UF6, UO2 and fuel fabrication)
| THREE MONTHS ENDED SEPTEMBER 30 |
NINE MONTHS ENDED SEPTEMBER 30 |
|||||||||||||||||||||||||||
| HIGHLIGHTS |
2016 | 2015 | CHANGE | 2016 | 2015 | CHANGE | ||||||||||||||||||||||
| Production volume (million kgU) |
0.6 | 0.6 | — | 6.5 | 6.3 | 3 | % | |||||||||||||||||||||
| Sales volume (million kgU)1 |
3.5 | 3.8 | (8 | )% | 8.7 | 9.1 | (4 | )% | ||||||||||||||||||||
| Average realized price |
($ | Cdn/kgU | ) | 22.09 | 22.22 | (1 | )% | 25.06 | 24.11 | 4 | % | |||||||||||||||||
| Average unit cost of sales (including D&A) |
($ | Cdn/kgU | ) | 18.62 | 18.75 | (1 | )% | 19.98 | 19.71 | 1 | % | |||||||||||||||||
| Revenue ($ millions)1 |
77 | 83 | (7 | )% | 217 | 220 | (1 | )% | ||||||||||||||||||||
| Gross profit ($ millions) |
12 | 13 | (8 | )% | 44 | 40 | 10 | % | ||||||||||||||||||||
| Gross profit (%) |
16 | 16 | — | 20 | 18 | 11 | % | |||||||||||||||||||||
| 1 | Includes sales and revenue between our fuel services and NUKEM segments (65,000 kgU in sales and revenue of $0.5 million in Q3 2016, nil in Q3 2015; 65,000 kgU in sales and revenue of $0.5 million in the first nine months of 2016, nil in the first nine months of 2015). |
THIRD QUARTER
Total revenue for the third quarter of 2016 decreased to $77 million from $83 million for the same period last year. This was primarily due to an 8% decrease in sales volumes compared to 2015.
The total cost of products and services sold (including D&A) decreased by 7% ($65 million compared to $70 million in the third quarter of 2015) due to the decrease in sales volumes and a decrease in the average unit cost of sales. When compared to 2015, the average unit cost of sales was 1% lower.
The net effect was a $1 million decrease in gross profit.
FIRST NINE MONTHS
In the first nine months of the year, total revenue decreased by 1% due to a 4% decrease in sales volumes, partially offset by a 4% increase in realized price that was the result of the weakening Canadian dollar and the mix of products sold.
The total cost of products and services sold (including D&A) decreased 4% ($173 million compared to $180 million in 2015) due to the 4% decrease in sales volume, partially offset by a 1% increase in the average unit cost of sales.
The net effect was a $4 million increase in gross profit.
| 2016 THIRD QUARTER REPORT 19 |
Table of Contents
| THREE MONTHS ENDED SEPTEMBER 30 |
NINE MONTHS ENDED SEPTEMBER 30 |
|||||||||||||||||||||||||||
| HIGHLIGHTS |
2016 | 2015 | CHANGE | 2016 | 2015 | CHANGE | ||||||||||||||||||||||
| Uranium sales (million lbs)1 |
1.5 | 2.9 | (48 | )% | 4.0 | 6.9 | (42 | )% | ||||||||||||||||||||
| Average realized price |
($ | Cdn/lb | ) | 43.52 | 52.70 | (17 | )% | 48.89 | 46.97 | 4 | % | |||||||||||||||||
| Cost of product sold (including D&A)2 |
82 | 170 | (52 | )% | 224 | 326 | (31 | )% | ||||||||||||||||||||
| Revenue ($ millions)1, 2 |
67 | 183 | (63 | )% | 198 | 361 | (45 | )% | ||||||||||||||||||||
| Gross profit (loss) ($ millions)2 |
(15 | ) | 13 | >(100 | %) | (26 | ) | 35 | >(100 | %) | ||||||||||||||||||
| Gross profit (loss) (%)2 |
(22 | ) | 7 | >(100 | %) | (13 | ) | 10 | >(100 | %) | ||||||||||||||||||
| 1 | Includes sales and revenue between our uranium, fuel services and NUKEM segments (nil in Q3 2016, 130,000 pounds in sales and revenue of $6.0 million in Q3 2015); (nil in the first nine months of 2016, 873,000 pounds in sales and revenue of $19.3 million in the first nine months of 2015). |
| 2 | Includes U3O8, UF6, and SWU. |
THIRD QUARTER
During the third quarter of 2016, NUKEM delivered 1.5 million pounds of uranium, a decrease of 48% from the same period last year due largely to the timing of customer requirements. The majority of the deliveries in the quarter were under existing long-term contracts with utilities. Activity in the spot market continued to be light, as was the case in the first two quarters. Total revenues decreased by 63% as a result of lower sales volumes.
NUKEM recorded a gross loss of $15 million in the third quarter of 2016, compared to a $13 million gross profit in the third quarter of 2015. Included in the 2016 gross loss is a $12 million net write-down of inventory. The write-down was a result of a decline in the spot price during the period.
FIRST NINE MONTHS
During the nine months ended September 30, 2016, NUKEM delivered 4.0 million pounds of uranium, a decrease of 42%, due to very light market activity with a lack of profitable opportunities, and the timing of customer requirements. Total revenues decreased 45% due to a decrease in sales volumes, partially offset by a 4% increase in average realized price. The increase in realized price was mainly the result of deliveries under contracts negotiated in prior years when market prices were higher.
Gross profit percentage was a loss of 13% for the first nine months of 2016, a decrease from a profit of 10% in the same period in 2015. Included in the 2015 margin was a $3 million net recovery compared to a $26 million net write-down of inventory in 2016. The write-down in 2016 was a result of a decline in the spot price during the period.
The net effect was a $61 million decrease in gross profit.
Uranium – production overview
Production in our uranium segment this quarter was 28% lower than the third quarter of 2015. See below for more information.
URANIUM PRODUCTION
| THREE MONTHS ENDED SEPTEMBER 30 |
CHANGE | NINE MONTHS ENDED SEPTEMBER 30 |
CHANGE | 2016 PLAN | ||||||||||||||||||||||||
| OUR SHARE (MILLION LBS) |
2016 | 2015 | 2016 | 2015 | ||||||||||||||||||||||||
| McArthur River/Key Lake |
3.1 | 3.9 | (21 | )% | 8.8 | 9.5 | (7 | )% | 12.6 | |||||||||||||||||||
| Cigar Lake |
1.9 | 1.8 | 6 | % | 6.2 | 3.3 | 88 | % | 8.0 | |||||||||||||||||||
| Inkai |
0.6 | 1.0 | (40 | )% | 2.8 | 2.2 | 27 | % | 3.0 | |||||||||||||||||||
| Rabbit Lake |
— | 1.1 | (100 | )% | 1.1 | 2.2 | (50 | )% | 1.1 | |||||||||||||||||||
| Smith Ranch-Highland |
0.2 | 0.3 | (33 | )% | 0.8 | 1.2 | (33 | )% | 0.9 | |||||||||||||||||||
| Crow Butte |
0.1 | 0.1 | — | 0.2 | 0.3 | (33 | )% | 0.2 | ||||||||||||||||||||
|
|
|
|
|
|
|
|
|
|
|
|
|
|
|
|||||||||||||||
| Total |
5.9 | 8.2 | (28 | )% | 19.9 | 18.7 | 6 | % | 25.8 | |||||||||||||||||||
|
|
|
|
|
|
|
|
|
|
|
|
|
|
|
|||||||||||||||
| 20 CAMECO CORPORATION |
Table of Contents
PRODUCTION UPDATE
McArthur River/Key Lake
Production for the third quarter was 21% lower compared to the same period last year due to a longer planned mill maintenance shut down. Production for the first nine months was slightly lower than last year due to lower planned annual production.
Cigar Lake
Total packaged production from Cigar Lake was 6% higher in the third quarter, and 88% higher in the first nine months compared to the same periods last year. The year-over-year increase is the result of the scheduled rampup of the operation.
Inkai
Production was 40% lower for the quarter and 27% higher for the first nine months compared to the same periods last year due to the timing of new wellfield development in our 2016 mine plan.
Smith Ranch-Highland/Crow Butte
At our US operations, total production was 25% lower for the quarter and 33% lower for the first nine months compared to the same periods in 2015, as a result of the decision to curtail production and defer all wellfield development beginning in May, 2016.
PRODUCTION CURTAILMENT
Rabbit Lake
The transition of the Rabbit Lake operation to care and maintenance was completed at the end of August, at a cost of $39.6 million. The site will remain in a safe care and maintenance state for the remainder of the year at a cost of about $15 million. Additionally, the total severance cost of $10.6 million is included in our cost of sales and reflected in our results.
We are continually weighing the value of maintaining the operation in standby, against the cost of doing so. However, as long as production is suspended, we expect care and maintenance costs to range between $35 million and $40 million annually for the first few years.
PORT HOPE CONVERSION SERVICES
CAMECO FUEL MANUFACTURING INC. (CFM)
Production update
Fuel services produced 0.6 million kgU in the third quarter, unchanged from the same period last year. Production in the first nine months was 3% higher than the same period in 2015.
Licensing
Our operating licence for the Port Hope Conversion Facility expires on February 29, 2017. The relicensing process with the Canadian Nuclear Safety Commission will begin in the fourth quarter.
The technical and scientific information discussed in this document for our material properties (McArthur River/Key Lake, Inkai and Cigar Lake) was approved by the following individuals who are qualified persons for the purposes of NI 43-101:
| 2016 THIRD QUARTER REPORT 21 |
Table of Contents
Critical accounting estimates
Due to the nature of our business, we are required to make estimates that affect the amount of assets and liabilities, revenues and expenses, commitments and contingencies we report. We base our estimates on our experience, our best judgment, guidelines established by the Canadian Institute of Mining, Metallurgy and Petroleum and on assumptions we believe are reasonable.
Controls and procedures
As of September 30, 2016, we carried out an evaluation under the supervision and with the participation of our management, including our chief executive officer (CEO) and chief financial officer (CFO), of the effectiveness of our disclosure controls and procedures. There are inherent limitations to the effectiveness of any system of disclosure controls and procedures, including the possibility of human error and the circumvention or overriding of the controls and procedures. Accordingly, even effective disclosure controls and procedures can only provide reasonable assurance of achieving their control objectives.
Based upon that evaluation and as of September 30, 2016, the CEO and CFO concluded that:
| • | the disclosure controls and procedures were effective to provide reasonable assurance that information required to be disclosed in the reports we file and submit under applicable securities laws is recorded, processed, summarized and reported as and when required |
| • | such information is accumulated and communicated to our management, including our CEO and CFO, as appropriate to allow timely decisions regarding required disclosure |
There has been no change in our internal control over financial reporting during the quarter ended September 30, 2016 that has materially affected, or is reasonably likely to materially affect, our internal control over financial reporting.
| 22 CAMECO CORPORATION |
Exhibit 99.3

Cameco Corporation
2016 condensed consolidated interim financial statements
(unaudited)
November 1, 2016
Cameco Corporation
Consolidated statements of earnings
| (Unaudited) | Three months ended | Nine months ended | ||||||||||||||||||
|
($Cdn thousands, except per share amounts) |
Note | Sep 30/16 | Sep 30/15 | Sep 30/16 | Sep 30/15 | |||||||||||||||
| Revenue from products and services |
$ | 669,654 | $ | 649,050 | $ | 1,544,301 | $ | 1,779,338 | ||||||||||||
| Cost of products and services sold |
411,704 | 440,822 | 963,930 | 1,163,695 | ||||||||||||||||
| Depreciation and amortization |
111,811 | 75,137 | 273,427 | 200,415 | ||||||||||||||||
|
|
|
|
|
|
|
|
|
|||||||||||||
| Cost of sales |
523,515 | 515,959 | 1,237,357 | 1,364,110 | ||||||||||||||||
|
|
|
|
|
|
|
|
|
|||||||||||||
| Gross profit |
146,139 | 133,091 | 306,944 | 415,228 | ||||||||||||||||
| Administration |
38,689 | 40,120 | 151,461 | 131,792 | ||||||||||||||||
| Impairment charge |
4 | — | — | 124,368 | 5,688 | |||||||||||||||
| Exploration |
9,643 | 9,681 | 36,543 | 32,953 | ||||||||||||||||
| Research and development |
1,347 | 1,571 | 4,108 | 4,865 | ||||||||||||||||
| Other operating income |
8 | (6,319 | ) | — | (6,319 | ) | — | |||||||||||||
| Loss on disposal of assets |
439 | 2 | 9,033 | 446 | ||||||||||||||||
|
|
|
|
|
|
|
|
|
|||||||||||||
| Earnings (loss) from operations |
102,340 | 81,717 | (12,250 | ) | 239,484 | |||||||||||||||
| Finance costs |
10 | (26,513 | ) | (26,040 | ) | (85,406 | ) | (76,377 | ) | |||||||||||
| Gain (loss) on derivatives |
16 | (12,361 | ) | (127,382 | ) | 63,768 | (237,015 | ) | ||||||||||||
| Finance income |
669 | 868 | 3,176 | 4,638 | ||||||||||||||||
| Share of earnings (loss) from equity-accounted investees |
— | 746 | — | (622 | ) | |||||||||||||||
| Other income |
11 | 68,148 | 30,617 | 49,614 | 58,703 | |||||||||||||||
|
|
|
|
|
|
|
|
|
|||||||||||||
| Earnings (loss) before income taxes |
132,283 | (39,474 | ) | 18,902 | (11,189 | ) | ||||||||||||||
| Income tax recovery |
12 | (10,407 | ) | (35,116 | ) | (66,303 | ) | (85,027 | ) | |||||||||||
|
|
|
|
|
|
|
|
|
|||||||||||||
| Net earnings (loss) |
142,690 | (4,358 | ) | 85,205 | 73,838 | |||||||||||||||
|
|
|
|
|
|
|
|
|
|||||||||||||
| Net earnings (loss) attributable to: |
||||||||||||||||||||
| Equity holders |
$ | 142,145 | $ | (3,911 | ) | $ | 82,801 | $ | 75,223 | |||||||||||
| Non-controlling interest |
545 | (447 | ) | 2,404 | (1,385 | ) | ||||||||||||||
|
|
|
|
|
|
|
|
|
|||||||||||||
| Net earnings (loss) |
$ | 142,690 | $ | (4,358 | ) | $ | 85,205 | $ | 73,838 | |||||||||||
|
|
|
|
|
|
|
|
|
|||||||||||||
| Earnings (loss) per common share attributable |
||||||||||||||||||||
| Basic |
13 | $ | 0.36 | $ | (0.01 | ) | $ | 0.21 | $ | 0.19 | ||||||||||
|
|
|
|
|
|
|
|
|
|||||||||||||
| Diluted |
13 | $ | 0.36 | $ | (0.01 | ) | $ | 0.21 | $ | 0.19 | ||||||||||
|
|
|
|
|
|
|
|
|
|||||||||||||
See accompanying notes to condensed consolidated interim financial statements.
| 2 CAMECO CORPORATION |
Cameco Corporation
Consolidated statements of comprehensive income
| (Unaudited) | Three months ended | Nine months ended | ||||||||||||||||||
| ($Cdn thousands) |
Note | Sep 30/16 | Sep 30/15 | Sep 30/16 | Sep 30/15 | |||||||||||||||
| Net earnings (loss) |
$ | 142,690 | $ | (4,358 | ) | $ | 85,205 | $ | 73,838 | |||||||||||
| Other comprehensive income (loss), net of taxes |
||||||||||||||||||||
| Items that are or may be reclassified to net earnings: |
||||||||||||||||||||
| Exchange differences on translation of foreign operations |
26,904 | 49,271 | (69,547 | ) | 99,809 | |||||||||||||||
| Unrealized gains on available-for-sale assets1 |
754 | — | 2,489 | 22 | ||||||||||||||||
|
|
|
|
|
|
|
|
|
|||||||||||||
| Other comprehensive income (loss), net of taxes |
27,658 | 49,271 | (67,058 | ) | 99,831 | |||||||||||||||
|
|
|
|
|
|
|
|
|
|||||||||||||
| Total comprehensive income |
$ | 170,348 | $ | 44,913 | 18,147 | 173,669 | ||||||||||||||
|
|
|
|
|
|
|
|
|
|||||||||||||
| Other comprehensive income (loss) attributable to: |
||||||||||||||||||||
| Equity holders |
$ | 27,653 | $ | 49,351 | $ | (67,222 | ) | $ | 99,931 | |||||||||||
| Non-controlling interest |
5 | (80 | ) | 164 | (100 | ) | ||||||||||||||
|
|
|
|
|
|
|
|
|
|||||||||||||
| Other comprehensive income (loss) for the period |
$ | 27,658 | $ | 49,271 | $ | (67,058 | ) | $ | 99,831 | |||||||||||
|
|
|
|
|
|
|
|
|
|||||||||||||
| Total comprehensive income (loss) attributable to: |
||||||||||||||||||||
| Equity holders |
$ | 169,798 | $ | 45,440 | $ | 15,579 | $ | 175,154 | ||||||||||||
| Non-controlling interest |
550 | (527 | ) | 2,568 | (1,485 | ) | ||||||||||||||
|
|
|
|
|
|
|
|
|
|||||||||||||
| Total comprehensive income for the period |
$ | 170,348 | $ | 44,913 | $ | 18,147 | $ | 173,669 | ||||||||||||
|
|
|
|
|
|
|
|
|
|||||||||||||
| 1 | Net of tax (Q3 2016 - $(67); Q3 2015 - nil; 2016 - $199; 2015 - $3) |
See accompanying notes to condensed consolidated interim financial statements.
| 2016 THIRD QUARTER REPORT 3 |
Cameco Corporation
Consolidated statements of financial position
| (Unaudited) | As at | |||||||||||
| ($Cdn thousands) |
Note | Sep 30/16 | Dec 31/15 | |||||||||
| Assets |
||||||||||||
| Current assets |
||||||||||||
| Cash and cash equivalents |
$ | 199,360 | $ | 458,604 | ||||||||
| Accounts receivable |
115,556 | 246,865 | ||||||||||
| Current tax assets |
3,252 | 493 | ||||||||||
| Inventories |
5 | 1,388,047 | 1,285,266 | |||||||||
| Supplies and prepaid expenses |
183,839 | 180,544 | ||||||||||
|
Current portion of long-term receivables, investments and other |
6 | 33,714 | 12,193 | |||||||||
|
|
|
|
|
|||||||||
| Total current assets |
1,923,768 | 2,183,965 | ||||||||||
|
|
|
|
|
|||||||||
| Property, plant and equipment |
5,090,094 | 5,228,160 | ||||||||||
| Goodwill and intangible assets |
202,838 | 217,130 | ||||||||||
| Long-term receivables, investments and other |
6 | 487,082 | 449,236 | |||||||||
| Investments in equity-accounted investees |
— | 2,472 | ||||||||||
| Deferred tax assets |
805,044 | 713,674 | ||||||||||
|
|
|
|
|
|||||||||
| Total non-current assets |
6,585,058 | 6,610,672 | ||||||||||
|
|
|
|
|
|||||||||
| Total assets |
$ | 8,508,826 | $ | 8,794,637 | ||||||||
|
|
|
|
|
|||||||||
| Liabilities and shareholders’ equity |
||||||||||||
| Current liabilities |
||||||||||||
| Accounts payable and accrued liabilities |
$ | 221,119 | $ | 317,856 | ||||||||
| Current tax liabilities |
28,752 | 56,494 | ||||||||||
| Short-term debt |
26,234 | — | ||||||||||
| Dividends payable |
39,579 | 39,579 | ||||||||||
| Current portion of other liabilities |
7 | 62,983 | 241,113 | |||||||||
| Current portion of provisions |
8 | 38,494 | 16,595 | |||||||||
|
|
|
|
|
|||||||||
| Total current liabilities |
417,161 | 671,637 | ||||||||||
|
|
|
|
|
|||||||||
| Long-term debt |
1,493,045 | 1,492,237 | ||||||||||
| Other liabilities |
7 | 101,009 | 132,142 | |||||||||
| Provisions |
8 | 1,027,522 | 918,163 | |||||||||
| Deferred tax liabilities |
21,649 | 35,179 | ||||||||||
|
|
|
|
|
|||||||||
| Total non-current liabilities |
2,643,225 | 2,577,721 | ||||||||||
|
|
|
|
|
|||||||||
| Shareholders’ equity |
||||||||||||
| Share capital |
1,862,646 | 1,862,646 | ||||||||||
| Contributed surplus |
212,859 | 209,115 | ||||||||||
| Retained earnings |
3,205,973 | 3,241,902 | ||||||||||
| Other components of equity |
166,135 | 233,357 | ||||||||||
|
|
|
|
|
|||||||||
| Total shareholders’ equity attributable to equity holders |
5,447,613 | 5,547,020 | ||||||||||
| Non-controlling interest |
827 | (1,741 | ) | |||||||||
|
|
|
|
|
|||||||||
| Total shareholders’ equity |
5,448,440 | 5,545,279 | ||||||||||
|
|
|
|
|
|||||||||
| Total liabilities and shareholders’ equity |
$ | 8,508,826 | $ | 8,794,637 | ||||||||
|
|
|
|
|
|||||||||
Commitments and contingencies [notes 8, 12]
See accompanying notes to condensed consolidated interim financial statements.
| 4 CAMECO CORPORATION |
Cameco Corporation
Consolidated statements of changes in equity
| Attributable to equity holders | ||||||||||||||||||||||||||||||||
| (Unaudited) ($Cdn thousands) |
Share capital |
Contributed surplus |
Retained earnings |
Foreign currency translation |
Available- for-sale assets |
Total | Non- controlling interest |
Total equity |
||||||||||||||||||||||||
| Balance at January 1, 2016 |
$ | 1,862,646 | $ | 209,115 | $ | 3,241,902 | $ | 233,918 | $ | (561 | ) | $ | 5,547,020 | $ | (1,741 | ) | $ | 5,545,279 | ||||||||||||||
| Net earnings |
— | — | 82,801 | — | — | 82,801 | 2,404 | 85,205 | ||||||||||||||||||||||||
| Other comprehensive income (loss) for the period |
— | — | — | (69,711 | ) | 2,489 | (67,222 | ) | 164 | (67,058 | ) | |||||||||||||||||||||
|
|
|
|
|
|
|
|
|
|
|
|
|
|
|
|
|
|||||||||||||||||
| Total comprehensive income (loss) for the period |
— | — | 82,801 | (69,711 | ) | 2,489 | 15,579 | 2,568 | 18,147 | |||||||||||||||||||||||
|
|
|
|
|
|
|
|
|
|
|
|
|
|
|
|
|
|||||||||||||||||
| Share-based compensation |
— | 10,746 | — | — | — | 10,746 | — | 10,746 | ||||||||||||||||||||||||
| Restricted and performance share units released |
— | (7,002 | ) | — | — | — | (7,002 | ) | — | (7,002 | ) | |||||||||||||||||||||
| Dividends |
— | — | (118,730 | ) | — | — | (118,730 | ) | — | (118,730 | ) | |||||||||||||||||||||
|
|
|
|
|
|
|
|
|
|
|
|
|
|
|
|
|
|||||||||||||||||
| Balance at September 30, 2016 |
$ | 1,862,646 | $ | 212,859 | $ | 3,205,973 | $ | 164,207 | $ | 1,928 | $ | 5,447,613 | $ | 827 | $ | 5,448,440 | ||||||||||||||||
|
|
|
|
|
|
|
|
|
|
|
|
|
|
|
|
|
|||||||||||||||||
| Balance at January 1, 2015 |
$ | 1,862,646 | $ | 196,815 | $ | 3,333,099 | $ | 51,667 | $ | (583 | ) | $ | 5,443,644 | $ | 160 | $ | 5,443,804 | |||||||||||||||
| Net earnings (loss) |
— | — | 75,223 | — | — | 75,223 | (1,385 | ) | 73,838 | |||||||||||||||||||||||
| Other comprehensive income (loss) for the period |
— | — | — | 99,909 | 22 | 99,931 | (100 | ) | 99,831 | |||||||||||||||||||||||
|
|
|
|
|
|
|
|
|
|
|
|
|
|
|
|
|
|||||||||||||||||
| Total comprehensive income (loss) for the period |
— | — | 75,223 | 99,909 | 22 | 175,154 | (1,485 | ) | 173,669 | |||||||||||||||||||||||
|
|
|
|
|
|
|
|
|
|
|
|
|
|
|
|
|
|||||||||||||||||
| Share-based compensation |
— | 12,944 | — | — | — | 12,944 | — | 12,944 | ||||||||||||||||||||||||
| Restricted and performance share units released |
— | (4,553 | ) | — | — | — | (4,553 | ) | — | (4,553 | ) | |||||||||||||||||||||
| Dividends |
— | — | (118,734 | ) | — | — | (118,734 | ) | — | (118,734 | ) | |||||||||||||||||||||
|
|
|
|
|
|
|
|
|
|
|
|
|
|
|
|
|
|||||||||||||||||
| Balance at September 30, 2015 |
$ | 1,862,646 | $ | 205,206 | $ | 3,289,588 | $ | 151,576 | $ | (561 | ) | $ | 5,508,455 | $ | (1,325 | ) | $ | 5,507,130 | ||||||||||||||
|
|
|
|
|
|
|
|
|
|
|
|
|
|
|
|
|
|||||||||||||||||
See accompanying notes to condensed consolidated interim financial statements.
| 2016 THIRD QUARTER REPORT 5 |
Cameco Corporation
Consolidated statements of cash flows
| (Unaudited) ($Cdn thousands) |
Note | Three months ended | Nine months ended | |||||||||||||||
| Sep 30/16 | Sep 30/15 | Sep 30/16 | Sep 30/15 | |||||||||||||||
| Operating activities |
||||||||||||||||||
| Net earnings (loss) |
$ | 142,690 | $ | (4,358 | ) | $ | 85,205 | $ | 73,838 | |||||||||
| Adjustments for: |
||||||||||||||||||
| Depreciation and amortization |
111,811 | 75,137 | 273,427 | 200,415 | ||||||||||||||
| Deferred charges |
(6,777 | ) | 4,541 | (99,385 | ) | (14,390 | ) | |||||||||||
| Unrealized loss (gain) on derivatives |
2,736 | 80,778 | (126,455 | ) | 127,038 | |||||||||||||
| Share-based compensation |
15 | 2,514 | 3,803 | 10,746 | 12,944 | |||||||||||||
| Loss on disposal of assets |
439 | 2 | 9,033 | 446 | ||||||||||||||
| Finance costs |
10 | 26,513 | 26,040 | 85,406 | 76,377 | |||||||||||||
| Finance income |
(669 | ) | (868 | ) | (3,176 | ) | (4,638 | ) | ||||||||||
| Share of loss (earnings) in equity-accounted investees |
— | (746 | ) | — | 622 | |||||||||||||
| Impairment charges |
4 | — | — | 124,368 | 5,688 | |||||||||||||
| Other operating income |
8 | (6,319 | ) | — | (6,319 | ) | — | |||||||||||
| Other expense (income) |
11 | (9,117 | ) | (30,617 | ) | 9,433 | (58,392 | ) | ||||||||||
| Income tax recovery |
12 | (10,407 | ) | (35,116 | ) | (66,303 | ) | (85,027 | ) | |||||||||
| Interest received |
32 | 483 | 1,340 | 3,686 | ||||||||||||||
| Income taxes received (paid) |
(6,325 | ) | 15,329 | (97,091 | ) | (80,870 | ) | |||||||||||
| Other operating items |
14 | 137,822 | (255,668 | ) | (142,942 | ) | (310,568 | ) | ||||||||||
|
|
|
|
|
|
|
|
|
|||||||||||
| Net cash provided by (used in) operations |
384,943 | (121,260 | ) | 57,287 | (52,831 | ) | ||||||||||||
|
|
|
|
|
|
|
|
|
|||||||||||
| Investing activities |
||||||||||||||||||
| Additions to property, plant and equipment |
(54,253 | ) | (96,978 | ) | (167,497 | ) | (292,072 | ) | ||||||||||
| Decrease (increase) in long-term receivables, investments and other |
(836 | ) | 1,574 | (2,111 | ) | 3,512 | ||||||||||||
| Proceeds from sale of property, plant and equipment |
33 | 69 | 1,877 | 165 | ||||||||||||||
|
|
|
|
|
|
|
|
|
|||||||||||
| Net cash used in investing |
(55,056 | ) | (95,335 | ) | (167,731 | ) | (288,395 | ) | ||||||||||
|
|
|
|
|
|
|
|
|
|||||||||||
| Financing activities |
||||||||||||||||||
| Increase (decrease) in debt |
(208,757 | ) | (5 | ) | 25,988 | (8 | ) | |||||||||||
| Interest paid |
(14,198 | ) | (14,173 | ) | (49,805 | ) | (48,870 | ) | ||||||||||
| Dividends paid |
(39,579 | ) | (39,579 | ) | (118,730 | ) | (118,734 | ) | ||||||||||
|
|
|
|
|
|
|
|
|
|||||||||||
| Net cash used in financing |
(262,534 | ) | (53,757 | ) | (142,547 | ) | (167,612 | ) | ||||||||||
|
|
|
|
|
|
|
|
|
|||||||||||
| Increase (decrease) in cash and cash equivalents, during the period |
67,353 | (270,352 | ) | (252,991 | ) | (508,838 | ) | |||||||||||
| Exchange rate changes on foreign currency cash balances |
480 | 2,030 | (6,253 | ) | 4,795 | |||||||||||||
| Cash and cash equivalents, beginning of period |
131,527 | 330,862 | 458,604 | 566,583 | ||||||||||||||
|
|
|
|
|
|
|
|
|
|||||||||||
| Cash and cash equivalents, end of period |
$ | 199,360 | $ | 62,540 | $ | 199,360 | $ | 62,540 | ||||||||||
|
|
|
|
|
|
|
|
|
|||||||||||
| Cash and cash equivalents is comprised of: |
||||||||||||||||||
| Cash |
63,741 | 62,540 | ||||||||||||||||
| Cash equivalents |
135,619 | — | ||||||||||||||||
|
|
|
|
|
|||||||||||||||
| Cash and cash equivalents |
$ | 199,360 | $ | 62,540 | ||||||||||||||
|
|
|
|
|
|||||||||||||||
See accompanying notes to condensed consolidated interim financial statements.
| 6 CAMECO CORPORATION |
Cameco Corporation
Notes to condensed consolidated interim financial statements
(Unaudited)
(Cdn$ thousands, except per share amounts and as noted)
| 1. | Cameco Corporation |
Cameco Corporation is incorporated under the Canada Business Corporations Act. The address of its registered office is 2121 11th Street West, Saskatoon, Saskatchewan, S7M 1J3. The condensed consolidated interim financial statements as at and for the period ended September 30, 2016 comprise Cameco Corporation and its subsidiaries (collectively, the Company or Cameco) and the Company’s interests in associates and joint arrangements. The Company is primarily engaged in the exploration for and the development, mining, refining, conversion, fabrication and trading of uranium for sale as fuel for generating electricity in nuclear power reactors in Canada and other countries.
| 2. | Significant accounting policies |
| A. | Statement of compliance |
These condensed consolidated interim financial statements have been prepared in accordance with IAS 34 Interim Financial Reporting. The condensed consolidated interim financial statements do not include all of the information required for full annual financial statements and should be read in conjunction with Cameco’s annual consolidated financial statements as at and for the year ended December 31, 2015.
These condensed consolidated interim financial statements were authorized for issuance by the Company’s board of directors on November 1, 2016.
| B. | Basis of presentation |
These condensed consolidated interim financial statements are presented in Canadian dollars, which is the Company’s functional currency. All financial information is presented in Canadian dollars, unless otherwise noted. Amounts presented in tabular format have been rounded to the nearest thousand except per share amounts and where otherwise noted.
The condensed consolidated interim financial statements have been prepared on the historical cost basis except for the following material items which are measured on an alternative basis at each reporting date:
| Derivative financial instruments at fair value through profit and loss | Fair value | |
| Non-derivative financial instruments at fair value through profit and loss | Fair value | |
| Available-for-sale financial assets | Fair value | |
| Liabilities for cash-settled share-based payment arrangements | Fair value | |
| Net defined benefit liability | Fair value of plan assets less the present value of the defined benefit obligation |
The preparation of the condensed consolidated interim financial statements in conformity with International Financial Reporting Standards (IFRS) requires management to make judgments, estimates and assumptions that affect the application of accounting policies and the reported amounts of assets, liabilities, revenue and expenses. Actual results may vary from these estimates.
In preparing these condensed consolidated interim financial statements, the significant judgments made by management in applying the Company’s accounting policies and key sources of estimation uncertainty were the same as those that applied to the consolidated financial statements as at and for the year ended December 31, 2015.
| 2016 THIRD QUARTER REPORT 7 |
Estimates and underlying assumptions are reviewed on an ongoing basis. Revisions to accounting estimates are recognized in the period in which the estimates are revised and in any future periods affected. The areas involving a higher degree of judgment or complexity, or areas where assumptions and estimates are significant to the consolidated financial statements are disclosed in note 5 of the December 31, 2015 consolidated financial statements.
| 3. | Accounting standards |
New standards and interpretations not yet adopted
A number of new standards and amendments to existing standards are not yet effective for the period ended September 30, 2016 and have not been applied in preparing these condensed consolidated interim financial statements. Cameco does not intend to early adopt any of the following amendments to existing standards and does not expect the amendments to have a material impact on the financial statements, unless otherwise noted.
| i. | Revenue |
In May 2014, the International Accounting Standards Board (IASB) issued IFRS 15, Revenue from Contracts with Customers (IFRS 15). IFRS 15 is effective for periods beginning on or after January 1, 2018 and is to be applied retrospectively. IFRS 15 clarifies the principles for recognizing revenue from contracts with customers. The extent of the impact of adoption of IFRS 15 has not yet been determined.
| ii. | Financial instruments |
In July 2014, the IASB issued IFRS 9, Financial Instruments (IFRS 9). IFRS 9 replaces the existing guidance in IAS 39, Financial Instruments: Recognition and Measurement (IAS 39). IFRS 9 includes revised guidance on the classification and measurement of financial assets, a new expected credit loss model for calculating impairment on financial assets and new hedge accounting requirements. It also carries forward, from IAS 39, guidance on recognition and derecognition of financial instruments.
IFRS 9 is effective for annual periods beginning on or after January 1, 2018, with early adoption of the new standard permitted. Cameco does not intend to early adopt IFRS 9. The extent of the impact of adoption of IFRS 9 has not yet been determined.
| iii. | Leases |
In January 2016, the IASB issued IFRS 16, Leases (IFRS 16). IFRS 16 is effective for periods beginning on or after January 1, 2019, with early adoption permitted. IFRS 16 eliminates the current dual model for lessees, which distinguishes between on-balance sheet finance leases and off-balance sheet operating leases. Instead, there is a single, on-balance sheet accounting model that is similar to current finance lease accounting. The extent of the impact of adoption of IFRS 16 has not yet been determined.
| 4. | Impairment |
In the second quarter of 2016, production was suspended at our Rabbit Lake operation. In accordance with the provisions of IAS 36, Impairment of Assets, Cameco considered this to be an indicator that the assets of the cash generating unit could potentially be impaired and accordingly, we were required to estimate the recoverable amount of these assets.
An impairment charge of $124,368,000 was recognized relating to our Rabbit Lake operation in northern Saskatchewan, which is part of the uranium segment. The charge was for the full carrying value of this cash generating unit. The recoverable amount of the mine and mill was based on a fair value less costs to sell model, which incorporated the future cash flows, including care and maintenance costs, expected to be derived from the operation. It was categorized as a non-recurring level 3 fair value measurement.
| 8 CAMECO CORPORATION |
The discount rate used in the fair value less costs to sell calculation was 8% and was determined based on a market participant’s incremental borrowing cost, adjusted for the marginal return that the participant would expect to use on an investment in the mine and mill. Other key assumptions included uranium price forecasts and operating and capital cost forecasts. Uranium prices applied in the calculation were based on approved internal price forecasts, which reflect management’s expectation of prices that a market participant would use. Operating and capital cost forecasts were determined based on management’s internal cost estimates.
| 5. | Inventories |
| Sep 30/16 | Dec 31/15 | |||||||
| Uranium |
| |||||||
| Concentrate |
$ | 1,061,216 | $ | 887,083 | ||||
| Broken ore |
46,187 | 41,722 | ||||||
|
|
|
|
|
|||||
| 1,107,403 | 928,805 | |||||||
| NUKEM |
142,032 | 216,361 | ||||||
| Fuel services |
138,612 | 140,100 | ||||||
|
|
|
|
|
|||||
| Total |
$ | 1,388,047 | $ | 1,285,266 | ||||
|
|
|
|
|
|||||
In the second quarter of 2015, commercial production was achieved at Cameco’s Cigar Lake operation. Effective May 1, 2015, we commenced charging all production costs, including depreciation, to inventory and subsequently recognizing in cost of sales as the product is sold.
Cameco expensed $458,864,000 of inventory as cost of sales during the third quarter of 2016 (2015 - $484,745,000). For the nine months ended September 30, 2016, Cameco expensed $1,072,309,000 of inventory as cost of sales (2015 - $1,298,399,000). Included in cost of sales for the period ended September 30, 2016, is a $25,752,000 net write-down of NUKEM inventory to reflect net realizable value (September 30, 2015 - net recovery of $3,394,000).
NUKEM enters into financing arrangements where future receivables arising from certain sales contracts are sold to financial institutions in exchange for cash. These arrangements require NUKEM to satisfy its delivery obligations under the sales contracts, which are recognized as deferred sales (note 7). In addition, NUKEM is required to pledge the underlying inventory as security against these performance obligations. As of September 30, 2016, NUKEM had $4,771,000 ($3,638,000 (US)) of inventory pledged as security under financing arrangements ((December 31, 2015 - $97,945,000 ($70,770,000 (US)).
| 6. | Long-term receivables, investments and other |
| Sep 30/16 | Dec 31/15 | |||||||
| Investments in equity securities [note 16] |
$ | 13,314 | $ | 938 | ||||
| Derivatives [note 16] |
24,253 | 11,143 | ||||||
| Advances receivable from JV Inkai LLP [note 18] |
86,386 | 87,188 | ||||||
| Investment tax credits |
93,237 | 93,972 | ||||||
| Amounts receivable related to tax dispute [note 12] |
264,042 | 232,614 | ||||||
| Other |
39,564 | 35,574 | ||||||
|
|
|
|
|
|||||
| 520,796 | 461,429 | |||||||
| Less current portion |
(33,714 | ) | (12,193 | ) | ||||
|
|
|
|
|
|||||
| Net |
$ | 487,082 | $ | 449,236 | ||||
|
|
|
|
|
|||||
| 2016 THIRD QUARTER REPORT 9 |
| 7. | Other liabilities |
| Sep 30/16 | Dec 31/15 | |||||||
| Deferred sales |
$ | 33,817 | $ | 132,904 | ||||
| Derivatives [note 16] |
53,311 | 168,236 | ||||||
| Accrued pension and post-retirement benefit liability |
66,258 | 64,135 | ||||||
| Other |
10,606 | 7,980 | ||||||
|
|
|
|
|
|||||
| 163,992 | 373,255 | |||||||
| Less current portion |
(62,983 | ) | (241,113 | ) | ||||
|
|
|
|
|
|||||
| Net |
$ | 101,009 | $ | 132,142 | ||||
|
|
|
|
|
|||||
Deferred sales includes $6,001,000 ($4,575,000 (US)) of performance obligations relating to financing arrangements entered into by NUKEM (December 31, 2015 - $110,749,000 ($80,021,000 (US))) (note 5).
| 8. | Provisions |
| Reclamation | Waste disposal | Total | ||||||||||
| Beginning of year |
$ | 917,034 | $ | 17,724 | $ | 934,758 | ||||||
| Changes in estimates and discount rates |
||||||||||||
| Capitalized in property, plant, and equipment |
146,399 | — | 146,399 | |||||||||
| Recognized in earnings |
(6,319 | ) | 1,487 | (4,832 | ) | |||||||
| Provisions used during the period |
(8,124 | ) | (202 | ) | (8,326 | ) | ||||||
| Unwinding of discount |
15,796 | 70 | 15,866 | |||||||||
| Impact of foreign exchange |
(17,849 | ) | — | (17,849 | ) | |||||||
|
|
|
|
|
|
|
|||||||
| End of period |
$ | 1,046,937 | $ | 19,079 | $ | 1,066,016 | ||||||
|
|
|
|
|
|
|
|||||||
| Current |
29,758 | 8,736 | 38,494 | |||||||||
| Non-current |
1,017,179 | 10,343 | 1,027,522 | |||||||||
|
|
|
|
|
|
|
|||||||
| $ | 1,046,937 | $ | 19,079 | $ | 1,066,016 | |||||||
|
|
|
|
|
|
|
|||||||
The increase of $146,399,000 in the reclamation provision was due largely to a change in estimate at our Port Hope conversion facility resulting from accelerated remediation plans. In addition, the provision increased as a result of a decrease in discount rates during the year.
| 9. | Share capital |
At September 30, 2016, there were 395,792,522 common shares outstanding. Options in respect of 8,332,077 shares are outstanding under the stock option plan and are exercisable up to 2024. For the quarters and nine month periods ended September 30, 2016 and September 30, 2015, there were no options that were exercised resulting in the issuance of shares.
| 10. | Finance costs |
| Three months ended | Nine months ended | |||||||||||||||
| Sep 30/16 | Sep 30/15 | Sep 30/16 | Sep 30/15 | |||||||||||||
| Interest on long-term debt |
$ | 17,671 | $ | 18,838 | $ | 55,658 | $ | 56,096 | ||||||||
| Unwinding of discount on provisions |
4,715 | 5,628 | 15,866 | 15,727 | ||||||||||||
| Other charges |
3,769 | 1,523 | 13,003 | 4,485 | ||||||||||||
| Interest on short-term debt |
358 | 51 | 879 | 69 | ||||||||||||
|
|
|
|
|
|
|
|
|
|||||||||
| Total |
$ | 26,513 | $ | 26,040 | $ | 85,406 | $ | 76,377 | ||||||||
|
|
|
|
|
|
|
|
|
|||||||||
| 10 CAMECO CORPORATION |
| 11. | Other income (expense) |
| Three months ended | Nine months ended | |||||||||||||||
| Sep 30/16 | Sep 30/15 | Sep 30/16 | Sep 30/15 | |||||||||||||
| Foreign exchange gains (losses) |
$ | 9,119 | $ | 30,617 | $ | (16,465 | ) | $ | 58,392 | |||||||
| Contract settlements |
59,027 | — | 59,027 | — | ||||||||||||
| Gain on change in investment accounting |
— | — | 7,032 | — | ||||||||||||
| Other |
2 | — | 20 | 311 | ||||||||||||
|
|
|
|
|
|
|
|
|
|||||||||
| Total |
$ | 68,148 | $ | 30,617 | $ | 49,614 | $ | 58,703 | ||||||||
|
|
|
|
|
|
|
|
|
|||||||||
During the quarter, Cameco agreed to terminate two long-term supply contracts with two of its utility customers that were effective for the years 2016 through 2020 and 2016 through 2021. The resulting gain on contract settlements was $59,027,000.
In the first quarter of 2016, Cameco’s share in one of its associates decreased such that equity accounting was no longer appropriate. As a result, the difference between its carrying value and fair value was recognized in other income. As an available-for-sale investment, future changes in fair value are being recognized in other comprehensive income.
| 12. | Income taxes |
| Three months ended | Nine months ended | |||||||||||||||
| Sep 30/16 | Sep 30/15 | Sep 30/16 | Sep 30/15 | |||||||||||||
| Earnings (loss) before income taxes |
||||||||||||||||
| Canada |
$ | (88,224 | ) | $ | (226,999 | ) | $ | (335,675 | ) | $ | (544,264 | ) | ||||
| Foreign |
220,507 | 187,525 | 354,577 | 533,075 | ||||||||||||
|
|
|
|
|
|
|
|
|
|||||||||
| $ | 132,283 | $ | (39,474 | ) | $ | 18,902 | $ | (11,189 | ) | |||||||
|
|
|
|
|
|
|
|
|
|||||||||
| Current income taxes |
||||||||||||||||
| Canada |
$ | 160 | $ | 3,359 | $ | 2,134 | $ | 4,582 | ||||||||
| Foreign |
20,236 | 10,536 | 33,373 | 31,801 | ||||||||||||
|
|
|
|
|
|
|
|
|
|||||||||
| $ | 20,396 | $ | 13,895 | $ | 35,507 | $ | 36,383 | |||||||||
| Deferred income taxes (recovery) |
||||||||||||||||
| Canada |
$ | (19,226 | ) | $ | (59,535 | ) | $ | (87,024 | ) | $ | (131,879 | ) | ||||
| Foreign |
(11,577 | ) | 10,524 | (14,786 | ) | 10,469 | ||||||||||
|
|
|
|
|
|
|
|
|
|||||||||
| $ | (30,803 | ) | $ | (49,011 | ) | $ | (101,810 | ) | $ | (121,410 | ) | |||||
|
|
|
|
|
|
|
|
|
|||||||||
| Income tax recovery |
$ | (10,407 | ) | $ | (35,116 | ) | $ | (66,303 | ) | $ | (85,027 | ) | ||||
|
|
|
|
|
|
|
|
|
|||||||||
Cameco has recorded $805,044,000 of deferred tax assets (December 31, 2015 - $713,674,000). Based on projections of future income, realization of these deferred tax assets is probable and consequently a deferred tax asset has been recorded.
Canada
In 2008, as part of the ongoing annual audits of Cameco’s Canadian tax returns, Canada Revenue Agency (CRA) disputed the transfer pricing structure and methodology used by Cameco and its wholly owned Swiss subsidiary, Cameco Europe Ltd., in respect of sale and purchase agreements for uranium products. From December 2008 to date, CRA issued notices of reassessment for the taxation years 2003 through 2010, which in aggregate have increased Cameco’s income for Canadian tax purposes by approximately $3,400,000,000. CRA has also issued notices of reassessment for transfer pricing penalties for the years 2007 through 2010 in the amount of $292,400,000. Cameco believes it is likely that CRA will reassess Cameco’s tax returns for subsequent years on a similar basis and that these will require Cameco to make future remittances or provide security on receipt of the reassessments.
| 2016 THIRD QUARTER REPORT 11 |
Using the methodology we believe that CRA will continue to apply and including the $3,400,000,000 already reassessed, we expect to receive notices of reassessment for a total of approximately $7,400,000,000 for the years 2003 through 2015, which would increase Cameco’s income for Canadian tax purposes and result in a related tax expense of approximately $2,200,000,000. In addition to penalties already imposed, CRA may continue to apply penalties to taxation years subsequent to 2010. As a result, we estimate that cash taxes and transfer pricing penalties would be between $1,500,000,000 and $1,700,000,000. In addition, we estimate there would be interest and instalment penalties applied that would be material to Cameco. While in dispute, we would be responsible for remitting or otherwise securing 50% of the cash taxes and transfer pricing penalties (between $750,000,000 and $850,000,000), plus related interest and instalment penalties assessed, which would be material to Cameco.
Under Canadian federal and provincial tax rules, the amount required to be remitted each year will depend on the amount of income reassessed in that year and the availability of elective deductions. Recently, the CRA disallowed the use of any loss carry-backs to be applied to any transfer pricing adjustment, starting with the 2008 tax year. In light of our view of the likely outcome of the case, we expect to recover the amounts remitted to CRA, including cash taxes, interest and penalties totalling $264,042,000 already paid as at September 30, 2016 (December 31, 2015 - $232,614,000) (note 6). In addition to the cash remitted, we have provided $340,000,000 in letters of credit to secure 50% of the cash taxes and related interest.
The trial for the 2003, 2005 and 2006 reassessments commenced in October, 2016. Final arguments are expected in the second half of 2017. If this timing is adhered to, we expect to have a Tax Court decision within six to 18 months after the trial is complete.
Having regard to advice from its external advisors, Cameco’s opinion is that CRA’s position is incorrect and Cameco is contesting CRA’s position and expects to recover any amounts remitted or secured as a result of the reassessments. However, to reflect the uncertainties of CRA’s appeals process and litigation, Cameco has recorded a cumulative tax provision related to this matter for the years 2003 through the current period in the amount of $54,000,000. While the resolution of this matter may result in liabilities that are higher or lower than the reserve, management believes that the ultimate resolution will not be material to Cameco’s financial position, results of operations or liquidity in the year(s) of resolution. Resolution of this matter as stipulated by CRA would be material to Cameco’s financial position, results of operations or liquidity in the year(s) of resolution and other unfavourable outcomes for the years 2003 to date could be material to Cameco’s financial position, results of operations and cash flows in the year(s) of resolution.
Further to Cameco’s decision to contest CRA’s reassessments, Cameco is pursuing its appeal rights under Canadian federal and provincial tax rules.
United States
We have received Revenue Agent’s Reports (RARs) from the Internal Revenue Service (IRS) for the taxation years 2009 to 2012, challenging the transfer pricing used under certain intercompany transactions. The RARs list the IRS’ proposed adjustments to taxable income and calculate the tax and penalties owing based on the proposed adjustments.
The proposed adjustments reflected in the RARs are focused on transfer pricing in respect of certain intercompany transactions within our corporate structure. The IRS asserts that a portion of the non-US income reported under our corporate structure and taxed outside the US should be recognized and taxed in the US.
The proposed adjustments result in an increase in taxable income in the US of approximately $419,000,000 (US) and a corresponding increased income tax expense of approximately $122,000,000 (US) for the 2009 through 2012 taxation years, with interest being charged thereon. In addition, the IRS proposed cumulative penalties of approximately $8,000,000 (US) in respect of the adjustment. Having regard to advice from its external advisors, management believes that the conclusions of the IRS in the RARs are incorrect and is contesting them in an administrative appeal of the proposed adjustments. No cash payments are required while pursuing an administrative appeal. Management believes that the ultimate resolution of this matter will not be material to our financial position, results of operations or liquidity in the year(s) of resolution.
| 12 CAMECO CORPORATION |
| 13. | Per share amounts |
Per share amounts have been calculated based on the weighted average number of common shares outstanding during the period. The weighted average number of paid shares outstanding in 2016 was 395,792,522 (2015 - 395,792,522).
| Three months ended | Nine months ended | |||||||||||||||
| Sep 30/16 | Sep 30/15 | Sep 30/16 | Sep 30/15 | |||||||||||||
| Basic earnings (loss) per share computation |
|
|||||||||||||||
| Net earnings (loss) attributable to equity holders |
$ | 142,145 | $ | (3,911 | ) | $ | 82,801 | $ | 75,223 | |||||||
| Weighted average common shares outstanding |
395,793 | 395,793 | 395,793 | 395,793 | ||||||||||||
|
|
|
|
|
|
|
|
|
|||||||||
| Basic earnings (loss) per common share |
$ | 0.36 | $ | (0.01 | ) | $ | 0.21 | $ | 0.19 | |||||||
|
|
|
|
|
|
|
|
|
|||||||||
| Diluted earnings (loss) per share computation |
||||||||||||||||
| Net earnings (loss) attributable to equity holders |
$ | 142,145 | $ | (3,911 | ) | $ | 82,801 | $ | 75,223 | |||||||
| Weighted average common shares outstanding |
395,793 | 395,793 | 395,793 | 395,793 | ||||||||||||
|
|
|
|
|
|
|
|
|
|||||||||
| Weighted average common shares outstanding, assuming dilution |
395,793 | 395,793 | 395,793 | 395,793 | ||||||||||||
|
|
|
|
|
|
|
|
|
|||||||||
| Diluted earnings (loss) per common share |
$ | 0.36 | $ | (0.01 | ) | $ | 0.21 | $ | 0.19 | |||||||
|
|
|
|
|
|
|
|
|
|||||||||
| 14. | Statements of cash flows |
| Three months ended | Nine months ended | |||||||||||||||
| Sep 30/16 | Sep 30/15 | Sep 30/16 | Sep 30/15 | |||||||||||||
| Changes in non-cash working capital: |
||||||||||||||||
| Accounts receivable |
$ | 8,479 | $ | (187,702 | ) | $ | 127,701 | $ | 110,070 | |||||||
| Inventories |
144,213 | (27,521 | ) | (150,140 | ) | (312,569 | ) | |||||||||
| Supplies and prepaid expenses |
11,250 | (17,489 | ) | (4,179 | ) | (40,684 | ) | |||||||||
| Accounts payable and accrued liabilities |
(31,012 | ) | (14,202 | ) | (113,175 | ) | (64,382 | ) | ||||||||
| Reclamation payments |
(4,407 | ) | (3,303 | ) | (8,326 | ) | (7,380 | ) | ||||||||
| Other |
9,299 | (5,451 | ) | 5,177 | 4,377 | |||||||||||
|
|
|
|
|
|
|
|
|
|||||||||
| Other operating items |
$ | 137,822 | $ | (255,668 | ) | $ | (142,942 | ) | $ | (310,568 | ) | |||||
|
|
|
|
|
|
|
|
|
|||||||||
| 15. | Share-based compensation plans |
| A. | Stock option plan |
The Company has established a stock option plan under which options to purchase common shares may be granted to employees of Cameco. Options granted under the stock option plan have an exercise price of not less than the closing price quoted on the Toronto Stock Exchange (TSX) for the common shares of Cameco on the trading day prior to the date on which the option is granted. The options carry vesting periods of one to three years, and expire eight years from the date granted.
The aggregate number of common shares that may be issued pursuant to the Cameco stock option plan shall not exceed 43,017,198 of which 27,870,079 shares have been issued.
| 2016 THIRD QUARTER REPORT 13 |
| B. | Executive performance share unit (PSU) |
The Company has established a PSU plan whereby it provides each plan participant an annual grant of PSUs in an amount determined by the board. Each PSU represents one phantom common share that entitles the participant to a payment of one Cameco common share purchased on the open market or cash with an equivalent market value, at the board’s discretion, at the end of each three-year period if certain performance and vesting criteria have been met. The final value of the PSUs will be based on the value of Cameco common shares at the end of the three-year period and the number of PSUs that ultimately vest. Vesting of PSUs at the end of the three-year period will be based on total shareholder return over the three years, Cameco’s ability to meet its annual operating targets and whether the participating executive remains employed by Cameco at the end of the three-year vesting period. As of September 30, 2016, the total number of PSUs held by the participants, after adjusting for forfeitures on retirement, was 899,303 (December 31, 2015 - 791,071).
| C. | Restricted share unit (RSU) |
The Company has established an RSU plan whereby it provides each plan participant an annual grant of RSUs in an amount determined by the board. Each RSU represents one phantom common share that entitles the participant to a payment of one Cameco common share purchased on the open market or cash with an equivalent market value, at the board’s discretion. The RSUs carry vesting periods of one to three years, and the final value of the units will be based on the value of Cameco common shares at the end of the vesting periods. As of September 30, 2016, the total number of RSUs held by the participants was 596,030 (December 31, 2015 - 479,320).
Cameco records compensation expense under its equity-settled plans with an offsetting credit to contributed surplus, to reflect the estimated fair value of units granted to employees. During the period, the Company recognized the following expenses under these plans:
| Three months ended | Nine months ended | |||||||||||||||
| Sep 30/16 | Sep 30/15 | Sep 30/16 | Sep 30/15 | |||||||||||||
| Stock option plan |
$ | 288 | $ | 949 | $ | 3,741 | $ | 4,625 | ||||||||
| Performance share unit plan |
1,623 | 1,624 | 4,017 | 4,949 | ||||||||||||
| Restricted share unit plan |
603 | 1,230 | 2,988 | 3,370 | ||||||||||||
|
|
|
|
|
|
|
|
|
|||||||||
| $ | 2,514 | $ | 3,803 | $ | 10,746 | $ | 12,944 | |||||||||
|
|
|
|
|
|
|
|
|
|||||||||
Fair value measurement of equity-settled plans
The fair value of the units granted through the PSU plan was determined based on Monte Carlo simulation and the fair value of options granted under the stock option plan was measured based on the Black-Scholes option-pricing model. The fair value of RSUs granted was determined based on their intrinsic value on the date of grant. Expected volatility was estimated by considering historic average share price volatility.
| 14 CAMECO CORPORATION |
The inputs used in the measurement of the fair values at grant date of the equity-settled share-based payment plans were as follows:
| Stock option plan |
PSU | RSU | ||||||||||
| Number of options granted |
1,273,340 | 411,490 | 329,422 | |||||||||
| Average strike price |
$ | 16.38 | — | $ | 16.46 | |||||||
| Expected dividend |
$ | 0.40 | — | — | ||||||||
| Expected volatility |
32 | % | 31 | % | — | |||||||
| Risk-free interest rate |
0.7 | % | 0.5 | % | — | |||||||
| Expected life of option |
4.7 years | 3.0 years | — | |||||||||
| Expected forfeitures |
7 | % | 5 | % | 8 | % | ||||||
| Weighted average grant date fair values |
$ | 3.49 | $ | 16.35 | $ | 16.46 | ||||||
In addition to these inputs, other features of the PSU grant were incorporated into the measurement of fair value. The market condition based on total shareholder return was incorporated by utilizing a Monte Carlo simulation. The non-market criteria relating to realized selling prices and operating targets have been incorporated into the valuation at grant date by reviewing prior history and corporate budgets.
| 16. | Financial instruments and related risk management |
| A. | Fair value hierarchy |
The fair value of an asset or liability is generally estimated as the amount that would be received on sale of an asset, or paid to transfer a liability in an orderly transaction between market participants at the reporting date. Fair values of assets and liabilities traded in an active market are determined by reference to last quoted prices, in the principal market for the asset or liability. In the absence of an active market for an asset or liability, fair values are determined based on market quotes for assets or liabilities with similar characteristics and risk profiles, or through other valuation techniques. Fair values determined using valuation techniques require the use of inputs, which are obtained from external, readily observable market data when available. In some circumstances, inputs that are not based on observable data must be used. In these cases, the estimated fair values may be adjusted in order to account for valuation uncertainty, or to reflect the assumptions that market participants would use in pricing the asset or liability.
All fair value measurements are categorized into one of three hierarchy levels, described below, for disclosure purposes. Each level is based on the transparency of the inputs used to measure the fair values of assets and liabilities:
Level 1 – Values based on unadjusted quoted prices in active markets that are accessible at the reporting date for identical assets or liabilities.
Level 2 – Values based on quoted prices in markets that are not active or model inputs that are observable either directly or indirectly for substantially the full term of the asset or liability.
Level 3 – Values based on prices or valuation techniques that require inputs that are both unobservable and significant to the overall fair value measurement.
When the inputs used to measure fair value fall within more than one level of the hierarchy, the level within which the fair value measurement is categorized is based on the lowest level input that is significant to the fair value measurement in its entirety.
| 2016 THIRD QUARTER REPORT 15 |
The following tables summarize the carrying amounts and fair values of Cameco’s financial instruments that are measured at fair value, including their levels in the fair value hierarchy:
As at September 30, 2016
| Fair value | ||||||||||||||||
| Carrying value | Level 1 | Level 2 | Total | |||||||||||||
| Derivative assets [note 6] |
||||||||||||||||
| Foreign currency contracts |
$ | 11,417 | $ | — | $ | 11,417 | $ | 11,417 | ||||||||
| Interest rate contracts |
9,286 | — | 9,286 | 9,286 | ||||||||||||
| Uranium contracts |
3,550 | — | 3,550 | 3,550 | ||||||||||||
| Investments in equity securities [note 6] |
13,314 | 13,314 | — | 13,314 | ||||||||||||
| Derivative liabilities [note 7] |
||||||||||||||||
| Foreign currency contracts |
(25,961 | ) | — | (25,961 | ) | (25,961 | ) | |||||||||
| Uranium contracts |
(27,350 | ) | — | (27,350 | ) | (27,350 | ) | |||||||||
| Long-term debt |
(1,493,045 | ) | — | (1,796,468 | ) | (1,796,468 | ) | |||||||||
|
|
|
|
|
|
|
|
|
|||||||||
| Net |
$ | (1,508,789 | ) | $ | 13,314 | $ | (1,825,526 | ) | $ | (1,812,212 | ) | |||||
|
|
|
|
|
|
|
|
|
|||||||||
As at December 31, 2015
| Fair value | ||||||||||||||||
| Carrying value | Level 1 | Level 2 | Total | |||||||||||||
| Derivative assets [note 6] |
||||||||||||||||
| Foreign currency contracts |
$ | 360 | $ | — | $ | 360 | $ | 360 | ||||||||
| Interest rate contracts |
10,783 | — | 10,783 | 10,783 | ||||||||||||
| Investments in equity securities [note 6] |
938 | 938 | — | 938 | ||||||||||||
| Derivative liabilities [note 7] |
||||||||||||||||
| Foreign currency contracts |
(167,420 | ) | — | (167,420 | ) | (167,420 | ) | |||||||||
| Uranium contracts |
(816 | ) | — | (816 | ) | (816 | ) | |||||||||
| Long-term debt |
(1,492,237 | ) | — | (1,786,567 | ) | (1,786,567 | ) | |||||||||
|
|
|
|
|
|
|
|
|
|||||||||
| Net |
$ | (1,648,392 | ) | $ | 938 | $ | (1,943,660 | ) | $ | (1,942,722 | ) | |||||
|
|
|
|
|
|
|
|
|
|||||||||
The preceding tables exclude fair value information for financial instruments whose carrying amounts are a reasonable approximation of fair value.
There were no transfers between level 1 and level 2 during the period. Cameco does not have any financial instruments that are classified as level 3 as of the reporting date.
| B. | Financial instruments measured at fair value |
Cameco measures its derivative financial instruments, material investments in equity securities and long-term debt at fair value. Investments in publicly held equity securities are classified as a recurring level 1 fair value measurement while derivative financial instruments and long-term debt are classified as recurring level 2 fair value measurements.
The fair value of investments in equity securities is determined using quoted share prices observed in the principal market for the securities as of the reporting date. The fair value of Cameco’s long-term debt is determined using quoted market yields as of the reporting date, which ranged from 0.5% to 1.7% (2015 - 0.6% to 2.2%).
Foreign currency derivatives consist of foreign currency forward contracts, options and swaps. The fair value of foreign currency options is measured based on the Black Scholes option-pricing model. The fair value of foreign currency forward contracts and swaps is measured using a market approach, based on the difference between contracted foreign exchange rates and quoted forward exchange rates as of the reporting date.
| 16 CAMECO CORPORATION |
Interest rate derivatives consist of interest rate swap contracts. The fair value of interest rate swaps is determined by discounting expected future cash flows from the contracts. The future cash flows are determined by measuring the difference between fixed interest payments to be received and floating interest payments to be made to the counterparty based on Canada Dealer Offer Rate forward interest rate curves.
Uranium contract derivatives consist of written options and price swaps. The fair value of uranium options is measured based on the Black Scholes option-pricing model. The fair value of uranium price swaps is determined by discounting expected future cash flows from the contracts. The future cash flows are determined by measuring the difference between fixed purchases or sales under contracted prices, and floating purchases or sales based on Numerco forward uranium price curves.
Where applicable, the fair value of the derivatives reflects the credit risk of the instrument and includes adjustments to take into account the credit risk of the Company and counterparty. These adjustments are based on credit ratings and yield curves observed in active markets at the reporting date.
| C. | Other financial instruments |
The carrying value of Cameco’s cash and cash equivalents, accounts receivable, accounts payable and accrued liabilities and short-term debt approximates its fair value as a result of the short-term nature of the instruments.
| D. | Derivatives |
The following table summarizes the fair value of derivatives and classification on the consolidated statements of financial position:
| Sep 30/16 | Dec 31/15 | |||||||
| Non-hedge derivatives: |
||||||||
| Foreign currency contracts |
$ | (14,544 | ) | $ | (167,060 | ) | ||
| Interest rate contracts |
9,286 | 10,783 | ||||||
| Uranium contracts |
(23,800 | ) | (816 | ) | ||||
|
|
|
|
|
|||||
| Net |
$ | (29,058 | ) | $ | (157,093 | ) | ||
|
|
|
|
|
|||||
| Classification: |
||||||||
| Current portion of long-term receivables, investments and other [note 6] |
$ | 15,923 | $ | 3,823 | ||||
| Long-term receivables, investments and other [note 6] |
8,330 | 7,320 | ||||||
| Current portion of other liabilities [note 7] |
(25,717 | ) | (168,236 | ) | ||||
| Other liabilities [note 7] |
(27,594 | ) | — | |||||
|
|
|
|
|
|||||
| Net |
$ | (29,058 | ) | $ | (157,093 | ) | ||
|
|
|
|
|
|||||
The following table summarizes the different components of the gain (loss) on derivatives included in net earnings (loss):
| Three months ended | Nine months ended | |||||||||||||||
| Sep 30/16 | Sep 30/15 | Sep 30/16 | Sep 30/15 | |||||||||||||
| Non-hedge derivatives |
||||||||||||||||
| Foreign currency contracts |
$ | (8,945 | ) | $ | (130,390 | ) | $ | 87,106 | $ | (248,324 | ) | |||||
| Interest rate contracts |
(108 | ) | 2,715 | 1,724 | 10,430 | |||||||||||
| Uranium contracts |
(3,308 | ) | — | (25,062 | ) | — | ||||||||||
| Other |
— | 293 | — | 879 | ||||||||||||
|
|
|
|
|
|
|
|
|
|||||||||
| Net |
$ | (12,361 | ) | $ | (127,382 | ) | $ | 63,768 | $ | (237,015 | ) | |||||
|
|
|
|
|
|
|
|
|
|||||||||
| 2016 THIRD QUARTER REPORT 17 |
| 17. | Segmented information |
Cameco has three reportable segments: uranium, fuel services and NUKEM. The uranium segment involves the exploration for, mining, milling, purchase and sale of uranium concentrate. The fuel services segment involves the refining, conversion and fabrication of uranium concentrate and the purchase and sale of conversion services. The NUKEM segment acts as a market intermediary between uranium producers and nuclear-electric utilities.
Cameco’s reportable segments are strategic business units with different products, processes and marketing strategies.
Accounting policies used in each segment are consistent with the policies outlined in the summary of significant accounting policies. Segment revenues, expenses and results include transactions between segments incurred in the ordinary course of business. These transactions are priced on an arm’s length basis, are eliminated on consolidation and are reflected in the “other” column.
| 18 CAMECO CORPORATION |
Business segments
For the three months ended September 30, 2016
| Uranium | Fuel services | NUKEM | Other | Total | ||||||||||||||||
| Revenue |
$ | 526,230 | $ | 77,289 | $ | 66,569 | $ | (434 | ) | $ | 669,654 | |||||||||
| Expenses |
||||||||||||||||||||
| Cost of products and services sold |
285,724 | 56,255 | 70,525 | (800 | ) | 411,704 | ||||||||||||||
| Depreciation and amortization |
87,612 | 8,889 | 11,735 | 3,575 | 111,811 | |||||||||||||||
|
|
|
|
|
|
|
|
|
|
|
|||||||||||
| Cost of sales |
373,336 | 65,144 | 82,260 | 2,775 | 523,515 | |||||||||||||||
|
|
|
|
|
|
|
|
|
|
|
|||||||||||
| Gross profit (loss) |
152,894 | 12,145 | (15,691 | ) | (3,209 | ) | 146,139 | |||||||||||||
| Administration |
— | — | 2,774 | 35,915 | 38,689 | |||||||||||||||
| Exploration |
9,643 | — | — | — | 9,643 | |||||||||||||||
| Research and development |
— | — | — | 1,347 | 1,347 | |||||||||||||||
| Other operating income |
(6,319 | ) | — | — | — | (6,319 | ) | |||||||||||||
| Loss on disposal of assets |
439 | — | — | — | 439 | |||||||||||||||
| Finance costs |
— | — | (68 | ) | 26,581 | 26,513 | ||||||||||||||
| Loss (gain) on derivatives |
— | — | (3,113 | ) | 15,474 | 12,361 | ||||||||||||||
| Finance income |
— | — | 101 | (770 | ) | (669 | ) | |||||||||||||
| Other expense (income) |
(48,655 | ) | (10,372 | ) | 386 | (9,507 | ) | (68,148 | ) | |||||||||||
|
|
|
|
|
|
|
|
|
|
|
|||||||||||
| Earnings (loss) before income taxes |
197,786 | 22,517 | (15,771 | ) | (72,249 | ) | 132,283 | |||||||||||||
| Income tax recovery |
(10,407 | ) | ||||||||||||||||||
|
|
|
|||||||||||||||||||
| Net earnings |
$ | 142,690 | ||||||||||||||||||
|
|
|
|||||||||||||||||||
For the three months ended September 30, 2015
| Uranium | Fuel services | NUKEM | Other | Total | ||||||||||||||||
| Revenue |
$ | 387,661 | $ | 83,479 | $ | 183,381 | $ | (5,471 | ) | $ | 649,050 | |||||||||
| Expenses |
||||||||||||||||||||
| Cost of products and services sold |
205,487 | 62,004 | 179,251 | (5,920 | ) | 440,822 | ||||||||||||||
| Depreciation and amortization |
72,155 | 8,432 | (9,537 | ) | 4,087 | 75,137 | ||||||||||||||
|
|
|
|
|
|
|
|
|
|
|
|||||||||||
| Cost of sales |
277,642 | 70,436 | 169,714 | (1,833 | ) | 515,959 | ||||||||||||||
|
|
|
|
|
|
|
|
|
|
|
|||||||||||
| Gross profit (loss) |
110,019 | 13,043 | 13,667 | (3,638 | ) | 133,091 | ||||||||||||||
| Administration |
— | — | 4,294 | 35,826 | 40,120 | |||||||||||||||
| Exploration |
9,681 | — | — | — | 9,681 | |||||||||||||||
| Research and development |
— | — | — | 1,571 | 1,571 | |||||||||||||||
| Loss on disposal of assets |
2 | — | — | — | 2 | |||||||||||||||
| Finance costs |
— | — | 1,128 | 24,912 | 26,040 | |||||||||||||||
| Loss (gain) on derivatives |
— | — | (461 | ) | 127,843 | 127,382 | ||||||||||||||
| Finance income |
— | — | — | (868 | ) | (868 | ) | |||||||||||||
| Share of earnings from equity-accounted investees |
(746 | ) | — | — | — | (746 | ) | |||||||||||||
| Other expense (income) |
— | — | 77 | (30,694 | ) | (30,617 | ) | |||||||||||||
|
|
|
|
|
|
|
|
|
|
|
|||||||||||
| Earnings (loss) before income taxes |
101,082 | 13,043 | 8,629 | (162,228 | ) | (39,474 | ) | |||||||||||||
| Income tax recovery |
(35,116 | ) | ||||||||||||||||||
|
|
|
|||||||||||||||||||
| Net loss |
$ | (4,358 | ) | |||||||||||||||||
|
|
|
|||||||||||||||||||
| 2016 THIRD QUARTER REPORT 19 |
For the nine months ended September 30, 2016
| Uranium | Fuel services | NUKEM | Other | Total | ||||||||||||||||
| Revenue |
$ | 1,128,898 | $ | 217,384 | $ | 197,518 | $ | 501 | $ | 1,544,301 | ||||||||||
| Expenses |
||||||||||||||||||||
| Cost of products and services sold |
654,592 | 150,599 | 158,984 | (245 | ) | 963,930 | ||||||||||||||
| Depreciation and amortization |
173,096 | 22,759 | 64,609 | 12,963 | 273,427 | |||||||||||||||
|
|
|
|
|
|
|
|
|
|
|
|||||||||||
| Cost of sales |
827,688 | 173,358 | 223,593 | 12,718 | 1,237,357 | |||||||||||||||
|
|
|
|
|
|
|
|
|
|
|
|||||||||||
| Gross profit (loss) |
301,210 | 44,026 | (26,075 | ) | (12,217 | ) | 306,944 | |||||||||||||
| Administration |
— | — | 16,099 | 135,362 | 151,461 | |||||||||||||||
| Impairment charge |
124,368 | — | — | — | 124,368 | |||||||||||||||
| Exploration |
36,543 | — | — | — | 36,543 | |||||||||||||||
| Research and development |
— | — | — | 4,108 | 4,108 | |||||||||||||||
| Other operating income |
(6,319 | ) | — | — | — | (6,319 | ) | |||||||||||||
| Loss on disposal of assets |
9,005 | — | 28 | — | 9,033 | |||||||||||||||
| Finance costs |
— | — | 3,911 | 81,495 | 85,406 | |||||||||||||||
| Gain on derivatives |
— | — | (3,725 | ) | (60,043 | ) | (63,768 | ) | ||||||||||||
| Finance income |
— | — | (228 | ) | (2,948 | ) | (3,176 | ) | ||||||||||||
| Other expense (income) |
(55,687 | ) | (10,372 | ) | 915 | 15,530 | (49,614 | ) | ||||||||||||
|
|
|
|
|
|
|
|
|
|
|
|||||||||||
| Earnings (loss) before income taxes |
193,300 | 54,398 | (43,075 | ) | (185,721 | ) | 18,902 | |||||||||||||
| Income tax recovery |
(66,303 | ) | ||||||||||||||||||
|
|
|
|||||||||||||||||||
| Net earnings |
$ | 85,205 | ||||||||||||||||||
|
|
|
|||||||||||||||||||
For the nine months ended September 30, 2015
| Uranium | Fuel services | NUKEM | Other | Total | ||||||||||||||||
| Revenue |
$ | 1,179,157 | $ | 219,711 | $ | 361,319 | $ | 19,151 | $ | 1,779,338 | ||||||||||
| Expenses |
||||||||||||||||||||
| Cost of products and services sold |
660,934 | 158,305 | 327,455 | 17,001 | 1,163,695 | |||||||||||||||
| Depreciation and amortization |
168,209 | 21,279 | (1,514 | ) | 12,441 | 200,415 | ||||||||||||||
|
|
|
|
|
|
|
|
|
|
|
|||||||||||
| Cost of sales |
829,143 | 179,584 | 325,941 | 29,442 | 1,364,110 | |||||||||||||||
|
|
|
|
|
|
|
|
|
|
|
|||||||||||
| Gross profit (loss) |
350,014 | 40,127 | 35,378 | (10,291 | ) | 415,228 | ||||||||||||||
| Administration |
— | — | 11,379 | 120,413 | 131,792 | |||||||||||||||
| Impairment charge |
5,688 | — | — | — | 5,688 | |||||||||||||||
| Exploration |
32,953 | — | — | — | 32,953 | |||||||||||||||
| Research and development |
— | — | — | 4,865 | 4,865 | |||||||||||||||
| Loss on disposal of assets |
415 | 28 | 3 | — | 446 | |||||||||||||||
| Finance costs |
— | — | 3,432 | 72,945 | 76,377 | |||||||||||||||
| Loss (gain) on derivatives |
— | — | (1,229 | ) | 238,244 | 237,015 | ||||||||||||||
| Finance income |
— | — | (2 | ) | (4,636 | ) | (4,638 | ) | ||||||||||||
| Share of loss from equity-accounted investees |
622 | — | — | — | 622 | |||||||||||||||
| Other expense (income) |
(312 | ) | — | 335 | (58,726 | ) | (58,703 | ) | ||||||||||||
|
|
|
|
|
|
|
|
|
|
|
|||||||||||
| Earnings (loss) before income taxes |
310,648 | 40,099 | 21,460 | (383,396 | ) | (11,189 | ) | |||||||||||||
| Income tax recovery |
(85,027 | ) | ||||||||||||||||||
|
|
|
|||||||||||||||||||
| Net earnings |
$ | 73,838 | ||||||||||||||||||
|
|
|
|||||||||||||||||||
| 20 CAMECO CORPORATION |
| 18. | Related parties |
The shares of Cameco are widely held and no shareholder, resident in Canada, is allowed to own more than 25% of the Company’s outstanding common shares, either individually or together with associates. A non-resident of Canada is not allowed to own more than 15%.
Related party transactions
Through an unsecured shareholder loan, Cameco has agreed to fund Inkai’s costs related to the evaluation and development of block 3. The limit of the loan facility is $175,000,000 (US) and advances under this facility bear interest at a rate of LIBOR plus 2%. At September 30, 2016, $164,645,000 (US) of principal and interest was outstanding (December 31, 2015 - $157,492,000 (US)).
Cameco’s share of the outstanding principal and interest was $86,386,000 at September 30, 2016 (December 31, 2015 - $87,188,000) (note 6). For the quarter ended September 30, 2016, Cameco recorded interest income of $524,000 relating to this balance (2015 - $518,000). For the nine month period ended September 30, 2016, interest income was $1,569,000 (2015 - $1,500,000).
| 2016 THIRD QUARTER REPORT 21 |
Exhibit 99.4
Certification Pursuant to Section 302 of the Sarbanes-Oxley Act of 2002
I, Tim Gitzel, president and chief executive officer of Cameco Corporation, certify that:
| 1. | I have reviewed this quarterly report on Form 6-K of Cameco Corporation; |
| 2. | Based on my knowledge, this report does not contain any untrue statement of a material fact or omit to state a material fact necessary to make the statements made, in light of the circumstances under which such statements were made, not misleading with respect to the period covered by this report; |
| 3. | Based on my knowledge, the financial statements, and other financial information included in this report, fairly present in all material respects the financial condition, results of operations and cash flows of the registrant as of, and for, the periods presented in this report; |
| 4. | The registrant’s other certifying officer and I are responsible for establishing and maintaining disclosure controls and procedures (as defined in Exchange Act Rules 13a-15(e) and 15d-15(e)) and internal control over financial reporting (as defined in Exchange Act Rules 13a-15(f) and 15d-15(f)) for the registrant and have: |
| (a) | designed such disclosure controls and procedures, or caused such disclosure controls and procedures to be designed under our supervision, to ensure that material information relating to the registrant, including its consolidated subsidiaries, is made known to us by others within those entities, particularly during the period in which this report is being prepared; |
| (b) | designed such internal control over financial reporting, or caused such internal control over financial reporting to be designed under our supervision, to provide reasonable assurance regarding the reliability of financial reporting and the preparation of financial statements for external purposes in accordance with generally accepted accounting principles; |
| (c) | evaluated the effectiveness of the registrant’s disclosure controls and procedures and presented in this report our conclusions about the effectiveness of the disclosure controls and procedures, as of the end of the period covered by this report based on such evaluation; and |
| (d) | disclosed in this report any change in the registrant’s internal control over financial reporting that occurred during the registrant’s most recent fiscal quarter (the registrant’s fourth fiscal quarter in the case of an annual report) that has materially affected, or is reasonably likely to materially affect, the registrant’s internal control over financial reporting; and |
| 5. | The registrant’s other certifying officer and I have disclosed, based on our most recent evaluation of internal control over financial reporting, to the registrant’s auditors and the audit committee of the registrant’s board of directors (or persons performing the equivalent functions): |
| (a) | all significant deficiencies and material weaknesses in the design or operation of internal control over financial reporting which are reasonably likely to adversely affect the registrant’s ability to record, process, summarize and report financial information; and |
| (b) | any fraud, whether or not material, that involves management or other employees who have a significant role in the registrant’s internal control over financial reporting. |
Date: November 2, 2016
| “Tim Gitzel” |
| Tim Gitzel |
| President and Chief Executive Officer |
Page 2
Exhibit 99.5
Certification Pursuant to Section 302 of the Sarbanes-Oxley Act of 2002
I, Grant Isaac, senior vice-president and chief financial officer, of Cameco Corporation, certify that:
| 1. | I have reviewed this quarterly report on Form 6-K of Cameco Corporation; |
| 2. | Based on my knowledge, this report does not contain any untrue statement of a material fact or omit to state a material fact necessary to make the statements made, in light of the circumstances under which such statements were made, not misleading with respect to the period covered by this report; |
| 3. | Based on my knowledge, the financial statements, and other financial information included in this report, fairly present in all material respects the financial condition, results of operations and cash flows of the registrant as of, and for, the periods presented in this report; |
| 4. | The registrant’s other certifying officer and I are responsible for establishing and maintaining disclosure controls and procedures (as defined in Exchange Act Rules 13a-15(e) and 15d-15(e)) and internal control over financial reporting (as defined in Exchange Act Rules 13a-15(f) and 15d-15(f)) for the registrant and have: |
| (a) | designed such disclosure controls and procedures, or caused such disclosure controls and procedures to be designed under our supervision, to ensure that material information relating to the registrant, including its consolidated subsidiaries, is made known to us by others within those entities, particularly during the period in which this report is being prepared; |
| (b) | designed such internal control over financial reporting, or caused such internal control over financial reporting to be designed under our supervision, to provide reasonable assurance regarding the reliability of financial reporting and the preparation of financial statements for external purposes in accordance with generally accepted accounting principles; |
| (c) | evaluated the effectiveness of the registrant’s disclosure controls and procedures and presented in this report our conclusions about the effectiveness of the disclosure controls and procedures, as of the end of the period covered by this report based on such evaluation; and |
| (d) | disclosed in this report any change in the registrant’s internal control over financial reporting that occurred during the registrant’s most recent fiscal quarter (the registrant’s fourth fiscal quarter in the case of an annual report) that has materially affected, or is reasonably likely to materially affect, the registrant’s internal control over financial reporting; and |
| 5. | The registrant’s other certifying officer and I have disclosed, based on our most recent evaluation of internal control over financial reporting, to the registrant’s auditors and the audit committee of the registrant’s board of directors (or persons performing the equivalent functions): |
| (a) | all significant deficiencies and material weaknesses in the design or operation of internal control over financial reporting which are reasonably likely to adversely affect the registrant’s ability to record, process, summarize and report financial information; and |
| (b) | any fraud, whether or not material, that involves management or other employees who have a significant role in the registrant’s internal control over financial reporting. |
Date: November 2, 2016
| “Grant Isaac” |
| Grant Isaac |
| Senior Vice-President and Chief Financial Officer |
Page 2
Serious News for Serious Traders! Try StreetInsider.com Premium Free!
You May Also Be Interested In
- Tenaris Announces 2024 First Quarter Results
- Celestica Announces Election of Directors and Approval to Proceed with Share Reclassification
- Publication of 2023 Annual Report of Azerion Group N.V.
Create E-mail Alert Related Categories
SEC FilingsSign up for StreetInsider Free!
Receive full access to all new and archived articles, unlimited portfolio tracking, e-mail alerts, custom newswires and RSS feeds - and more!
