

Form 6-K BANK BRADESCO For: Dec 31
 Tweet
Tweet Share
Share
SECURITIES AND EXCHANGE COMMISSION
06029-900 - Osasco - SP
Federative Republic of Brazil
Indicate by check mark whether the registrant by furnishing the information contained in this Form is also thereby furnishing the information to the Commission pursuant to Rule 12g3-2(b) under the Securities Exchange Act of 1934.
Yes _______ No ___X____.

| Press Release | ||||
| Highlights | ||||
The main figures obtained by Bradesco in the year of 2015 are presented below: 1. Adjusted Net Income(1) for the year of 2015 stood at R$17.873 billion (an 16.4% increase compared to the R$15.359 billion recorded in the same period of 2014), corresponding to earnings per share of R$3.55 and Return on Average Adjusted Equity(2) of 20.5%. 2. As for the source, the Adjusted Net Income is composed of R$12.584 billion from financial activities, representing 70.4% of the total, and of R$5.289 billion from insurance, pension plans and capitalization bonds operations, which together account for 29.6%. 3. In December 2015, Bradesco’s market value stood at R$100.044 billion(3). 4. Total Assets, in December 2015, stood at R$1.080 trillion, an increase of 4.6% over the December 2014 balance. The return on Average Total Assets was 1.7%, an increase of 0.1 p.p. over December 2014 (1.6%). 5. In December 2015, the Expanded Loan Portfolio(4) reached R$474.027 billion, up 4.2% over December 2014. Operations with individuals totaled R$147.749 billion (an increase of 4.5% over December 2014), while corporate segment operations totaled R$326.278 billion (up 4.0% over December 2014). 6. Assets under Management stood at R$1.510 trillion, a 5.9% increase over 7. Shareholders’ Equity totaled R$88.907 billion in December 2015, 9.1% higher than in December 2014. Basel III Ratio, calculated based on the Prudential Consolidated stood at 16.8% in December 2015, 12.7% of which was classified as Common Equity / Tier I. 8. A total of R$6.035 billion was paid to shareholders as Interest on Shareholders’ Equity and Dividends for the profit generated in 2015, of which R$1.981 billion were paid in monthly and interim installments and R$4.054 billion, as complementary, whose payment will be made on March 1, 2016. 9. The Interest Earning Portion of the Net Interest Income stood at R$54.777 billion, an increase of 15.3% compared to the year of 2014. 10. The Delinquency Ratio over 90 days stood at 4.1% in December 2015 (3.5% in December 2014). 11. The Operating Efficiency Ratio (ER)(5) in December 2015 was 37.5% (39.2% in December 2014), while in the “risk-adjusted” concept, it stood at 46.5% (47.9% in December 2014). 12. Insurance Written Premiums, Pension Plan Contributions and Capitalization Bond Income totaled R$64.612 billion in the year of 2015, up 15.1% when compared to the year of 2014. Technical Reserves stood at R$177.835 billion, an increase of 16.0% compared to the balance in December 2014. 13. Investments in infrastructure, information technology and telecommunications amounted to R$5.720 billion in the year of 2015, up 14.4% over the same period in the previous year. 14. Taxes and contributions paid or recorded in provision, including social security, totaled R$25.763 billion, of which R$12.401 billion were related to taxes withheld and collected from third parties, and R$13.362 billion were calculated based on activities developed by Organização Bradesco, equivalent to 74.8% of the Adjusted Net Income(1). 15. Bradesco has an extensive Customer Service Network in Brazil, with 4,507 Branches and 3,511 Service Points (PAs). Customers of Bradesco can also count on 736 ATMs located on a company’s premises (PAEs), 43,560 Bradesco Expresso service points, 31,527 Bradesco ATMs, and 18,940 Banco24Horas Network ATMs. 16. Payroll, plus charges and benefits totaled R$12.507 billion. Social benefits provided to all 92,861 employees of Organização Bradesco and their dependents amounted R$3.150 billion, while investments in education, training and development programs totaled R$145.135 million. 17. In December 2015, the addendum to the contracts for the Offer of Credit Cards and other related financial services was firmed with Via Varejo S.A., related to the "Casas Bahia" brand, and the Services Contract as Banking Correspondent in the country, related to the correspondent activity provided by Via Varejo to Bradesco.
December 2014.
| 4 |
Economic and Financial Analysis Report December 2015 |
| Press Release | ||||
| Highlights | ||||
|
18. In January 2016, Bradesco informed the market that Central Bank approved the acquisition of 100% of the share capital of HSBC Bank Brasil S.A. – Banco Múltiplo and HSBC Serviços e Participações Ltda. ("HSBC"). The completion of the operation is subject to the approval of the other competent regulatory authorities and in compliance with the legal formalities. 19. In January 2016, Bradesco signed a non-binding Memorandum of Understanding with Banco do Brasil S.A., Banco Santander (Brasil) S.A., Caixa Econômica Federal and Itaú Unibanco S.A., in order to create a holding company of credit intelligence ("GIC"), which will develop a database with the goal of adding, reconciling and handling database and credit-related information, of individuals and legal entities, which expressly authorize their inclusion in the database, as required by the applicable rules. 20. Major Awards and Acknowledgments in the period: · Considered the best Brazilian bank of 2015 of The Banker Awards (The Banker / Financial Times); · Largest private group in the country, with revenues of R$201.2 billion, in the ranking "Valor Grandes Grupos", which lists the 200 largest groups that operate in Brazil (Valor Econômico); · For the 11th consecutive year, the common and preferred shares are on the list of the Índice de Sustentabilidade Empresarial (ISE - Corporate Sustainability Index) of BMF&Bovespa; · Grupo Bradesco Seguros was the highlight of the Award "Cobertura Performance 2015" (publisher Editora Cobertura); · Highlight in three important rankings of efficiency in people management: "Best Companies to Work For in Brazil" (Guia 2015 Você S/A – The 150 Best Companies to Work); "The best in People Management" (newspaper Valor Econômico in partnership with Aon-Hewitt); and "50 Best Psychologically Healthy Companies" (publisher Editora Gestão e RH); |
· It was one of the highlights among the best fund managers of Brazil (Revista Exame / Fundação Getúlio Vargas (FGV)); and · Featured among "The Best Companies for the Consumer 2015", according to the survey Época Reclame Aqui, appearing as champion in the categories "Banks", "Banks and Financial Services", "Cards and Insurance”. Organização Bradesco is fully committed to internationally recognized sustainability and corporate governance initiatives, particularly: Global Compact, PRI (Principles for Responsible Investment), and Equator Principles. We set our guidelines and strategies with a view to incorporating the best sustainability practices into our businesses, considering the context and the potential of each region, thus contributing to the generation of value in the Organization. Our management process adopts economic and socio-environmental indexes developed in Brazil and abroad, such as the Dow Jones Sustainability Index (DJSI), the Corporate Sustainability Index (ISE, of BM&FBovespa), and the Carbon Efficient Index (ICO2, also of BM&FBovespa), as well as the guidelines and indexes of the Global Reporting Initiative (GRI) and the Carbon Disclosure Project (CDP). With a broad social and educational program in place for 59 years, Fundação Bradesco operates 40 schools across Brazil. In 2015, a R$502.721 million budget benefitted 102,182 students enrolled in its schools at the following levels: basic education (from kindergarten to high school and higher secondary technical-professional education), youth and adult education; and preliminary and continuing vocational training, which focuses on creating jobs and income. In addition to being guaranteed free quality education, over 42 thousand students enrolled in the Basic Education system also receive uniforms, school supplies, meals, and medical and dental assistance. With regard to the distance learning system (EaD), it is estimated that more than 590 thousand students were benefitted from it, through its e-learning portal Escola Virtual (Virtual School). These students concluded, at least, one of the various courses offered in its schedule, and another 22,990 students will benefit from projects and initiatives carried out in partnership with Centers for Digital Inclusion (CDIs), the Educa+Ação, and from Technology courses (Educar e Aprender – Educating and Learning). |
(1) According to the non-recurring events described on page 8 of this Economic and Financial Analysis Report; (2) Excludes mark-to-market effect of Available-for-Sale Securities recorded under Shareholders’ Equity; (3) Number of shares (excluding treasury shares) multiplied by the closing price for common and preferred shares on the last trading day of the period; (4) Includes sureties and guarantees, letters of credit, advances of credit card receivables, co-obligations in loan assignments (receivables-backed investment funds and mortgage-backed receivables), co-obligations in rural loan assignments and operations bearing credit risk – commercial portfolio, which includes debentures and promissory notes; and (5) In the last 12 months.
| Bradesco | 5 |
| Press Release | ||||
| Main Information | ||||
|
|
4Q15 |
3Q15 |
2Q15 |
1Q15 |
4Q14 |
3Q14 |
2Q14 |
1Q14 |
Variation % | |
|
|
4Q15 x 3Q15 |
4Q15 x 4Q14 | ||||||||
|
Income Statement for the Period - R$ million |
|
|
|
|
|
|
|
|
|
|
|
Book Net Income |
4,353 |
4,120 |
4,473 |
4,244 |
3,993 |
3,875 |
3,778 |
3,443 |
5.7 |
9.0 |
|
Adjusted Net Income |
4,562 |
4,533 |
4,504 |
4,274 |
4,132 |
3,950 |
3,804 |
3,473 |
0.6 |
10.4 |
|
Total Net Interest Income |
14,512 |
13,735 |
13,541 |
13,599 |
12,986 |
12,281 |
12,066 |
10,962 |
5.7 |
11.8 |
|
Gross Credit Intermediation Margin |
11,313 |
10,806 |
10,427 |
10,242 |
10,061 |
9,798 |
9,460 |
9,048 |
4.7 |
12.4 |
|
Net Credit Intermediation Margin |
7,121 |
6,954 |
6,877 |
6,662 |
6,754 |
6,450 |
6,319 |
6,187 |
2.4 |
5.4 |
|
Provision for Loan Losses (ALL) Expenses |
(4,192) |
(3,852) |
(3,550) |
(3,580) |
(3,307) |
(3,348) |
(3,141) |
(2,861) |
8.8 |
26.8 |
|
Fee and Commission Income |
6,597 |
6,380 |
6,118 |
5,744 |
5,839 |
5,639 |
5,328 |
5,283 |
3.4 |
13.0 |
|
Administrative and Personnel Expenses |
(8,413) |
(7,997) |
(7,544) |
(7,084) |
(7,835) |
(7,192) |
(7,023) |
(6,765) |
5.2 |
7.4 |
|
Insurance Written Premiums, Pension Plan Contributions and Capitalization Bond Income |
19,130 |
15,125 |
16,723 |
13,634 |
17,806 |
12,904 |
13,992 |
11,450 |
26.5 |
7.4 |
|
Statement of Financial Position - R$ million |
|
|
|
|
|
|
|
|
|
|
|
Total Assets (1) |
1,079,755 |
1,050,983 |
1,029,762 |
1,034,815 |
1,032,040 |
987,364 |
931,132 |
922,229 |
2.7 |
4.6 |
|
Securities |
407,584 |
364,472 |
356,115 |
344,430 |
346,358 |
343,445 |
333,200 |
321,970 |
11.8 |
17.7 |
|
Loan Operations (2) |
474,027 |
474,488 |
463,406 |
463,305 |
455,127 |
444,195 |
435,231 |
432,297 |
(0.1) |
4.2 |
|
- Individuals |
147,749 |
145,234 |
143,461 |
142,051 |
141,432 |
138,028 |
135,068 |
132,652 |
1.7 |
4.5 |
|
- Corporate |
326,278 |
329,253 |
319,945 |
321,254 |
313,695 |
306,167 |
300,163 |
299,645 |
(0.9) |
4.0 |
|
Allowance for Loan Losses (ALL) (3) |
(29,499) |
(28,670) |
(23,801) |
(23,618) |
(23,146) |
(22,623) |
(21,791) |
(21,407) |
2.9 |
27.4 |
|
Total Deposits |
195,760 |
203,637 |
195,926 |
211,702 |
211,612 |
211,882 |
213,270 |
218,709 |
(3.9) |
(7.5) |
|
Technical Reserves |
177,835 |
168,629 |
164,566 |
157,295 |
153,267 |
145,969 |
142,731 |
137,751 |
5.5 |
16.0 |
|
Shareholders' Equity |
88,907 |
86,233 |
86,972 |
83,937 |
81,508 |
79,242 |
76,800 |
73,326 |
3.1 |
9.1 |
|
Assets under Management |
1,510,396 |
1,452,528 |
1,443,989 |
1,431,090 |
1,426,099 |
1,385,135 |
1,304,690 |
1,277,670 |
4.0 |
5.9 |
|
Performance Indicators (%) on Adjusted Net Income (unless otherwise stated) |
|
|
|
|
|
|
|
| ||
|
Adjusted Net Income per Share - R$ (4) (5) |
3.55 |
3.47 |
3.35 |
3.21 |
3.05 |
2.87 |
2.69 |
2.53 |
2.3 |
16.4 |
|
Book Value per Common and Preferred Share - R$ (5) |
17.68 |
17.14 |
17.28 |
16.67 |
16.19 |
15.74 |
15.25 |
14.56 |
3.2 |
9.2 |
|
Annualized Return on Average Equity (6) (7) |
20.5 |
21.2 |
21.9 |
22.3 |
20.1 |
20.4 |
20.7 |
20.5 |
(0.7) p.p. |
0.4 p.p. |
|
Annualized Return on Common Equity to 11% - BIS III (4) |
27.4 |
26.9 |
26.3 |
25.3 |
24.2 |
22.8 |
21.4 |
20.1 |
0.5 p.p. |
3.2 p.p. |
|
Annualized Return on Average Assets (7) |
1.7 |
1.7 |
1.7 |
1.7 |
1.6 |
1.6 |
1.6 |
1.5 |
- |
0.1 p.p. |
|
Average Rates - 12 months = (Adjusted Net Interest Income / Total Average Assets - Repos - Permanent Assets) (NIM) |
7.5 |
7.6 |
7.6 |
7.5 |
7.3 |
7.1 |
7.0 |
6.9 |
(0.1) p.p. |
0.2 p.p. |
|
Fixed Asset Ratio (13) |
35.2 |
38.6 |
39.6 |
47.9 |
47.2 |
46.8 |
46.7 |
47.1 |
(3.4) p.p. |
(12.0) p.p. |
|
Combined Ratio - Insurance (8) |
86.5 |
86.9 |
86.5 |
86.8 |
85.9 |
86.5 |
86.3 |
86.4 |
(0.4) p.p. |
0.6 p.p. |
|
Efficiency Ratio (ER) (4) |
37.5 |
37.9 |
37.9 |
38.3 |
39.2 |
39.9 |
40.9 |
41.9 |
(0.4) p.p. |
(1.7) p.p. |
|
Coverage Ratio (Fee and Commission Income/Administrative and Personnel Expenses) (4) |
80.0 |
79.1 |
78.7 |
77.4 |
76.7 |
75.9 |
74.1 |
73.6 |
0.9 p.p. |
3.3 p.p. |
|
Market Capitalization - R$ million (9) |
100,044 |
113,288 |
142,098 |
150,532 |
145,536 |
146,504 |
134,861 |
135,938 |
(11.7) |
(31.3) |
|
Loan Portfolio Quality % (10) |
|
|
|
|
|
|
|
|
|
|
|
ALL / Loan Portfolio (3) |
8.0 |
7.8 |
6.7 |
6.7 |
6.7 |
6.7 |
6.6 |
6.5 |
0.2 p.p. |
1.3 p.p. |
|
Non-performing Loans (> 60 days (11) / Loan Portfolio) |
5.0 |
4.7 |
4.6 |
4.5 |
4.3 |
4.4 |
4.4 |
4.2 |
0.3 p.p |
0.7 p.p. |
|
Delinquency Ratio (> 90 days (11) / Loan Portfolio) |
4.1 |
3.8 |
3.7 |
3.6 |
3.5 |
3.6 |
3.5 |
3.4 |
0.3 p.p. |
0.6 p.p. |
|
Coverage Ratio (> 90 days (11)) (3) |
198.0 |
205.7 |
180.4 |
187.0 |
189.0 |
187.2 |
186.9 |
193.8 |
(7.7) p.p. |
9.0 p.p. |
|
Coverage Ratio (> 60 days (11)) (3) |
161.7 |
168.4 |
146.5 |
149.8 |
156.6 |
154.2 |
149.9 |
153.7 |
(6.7) p.p. |
5.1 p.p. |
|
Operating Limits % |
|
|
|
|
|
|
|
|
|
|
|
Basel Ratio - Total (12) (13) |
16.8 |
14.5 |
16.0 |
15.2 |
16.5 |
16.3 |
15.8 |
15.7 |
2.3 p.p. |
0.3 p.p. |
|
Tier I Capital |
12.7 |
11.4 |
12.8 |
12.1 |
12.9 |
12.6 |
12.1 |
11.9 |
1.3 p.p. |
(0.2) p.p. |
|
- Common Equity |
12.7 |
11.4 |
12.8 |
12.1 |
12.9 |
12.6 |
12.1 |
11.9 |
1.3 p.p. |
(0.2) p.p. |
|
Tier II Capital |
4.1 |
3.0 |
3.2 |
3.1 |
3.6 |
3.7 |
3.7 |
3.8 |
1.1 p.p. |
0.5 p.p. |
| 6 |
Economic and Financial Analysis Report December 2015 |
| Press Release | ||||
| Main Information | ||||
|
Dec15 |
Sept15 |
Jun15 |
Mar15 |
Dec14 |
Sept14 |
Jun14 |
Mar14 |
Variation % | ||
|
|
Dec15 x Sept15 |
Dec15 x Dec14 | ||||||||
|
Structural Information - Units |
|
|
|
|
|
|
|
|
|
|
|
Service Points (14) |
65,851 |
71,738 |
74,270 |
74,917 |
75,176 |
74,028 |
73,208 |
73,320 |
(8.2) |
(12.4) |
|
- Branches |
4,507 |
4,593 |
4,628 |
4,661 |
4,659 |
4,659 |
4,680 |
4,678 |
(1.9) |
(3.3) |
|
- PAs (15) |
3,511 |
3,496 |
3,463 |
3,502 |
3,486 |
3,497 |
3,497 |
3,484 |
0.4 |
0.7 |
|
- PAEs (15) |
736 |
845 |
980 |
1,135 |
1,145 |
1,159 |
1,175 |
1,186 |
(12.9) |
(35.7) |
|
- External ATM Network - Bradesco (16) (17) |
627 |
874 |
1,112 |
1,243 |
1,344 |
1,398 |
1,684 |
2,701 |
(28.3) |
(53.3) |
|
- Banco24Horas Network (16) |
11,721 |
11,917 |
12,127 |
12,268 |
12,450 |
12,213 |
12,023 |
11,873 |
(1.6) |
(5.9) |
|
- Bradesco Expresso (Correspondent Banks) |
43,560 |
48,175 |
50,042 |
50,043 |
50,006 |
49,020 |
48,186 |
47,430 |
(9.6) |
(12.9) |
|
- Bradesco Promotora de Vendas |
1,175 |
1,824 |
1,904 |
2,051 |
2,073 |
2,068 |
1,949 |
1,955 |
(35.6) |
(43.3) |
|
- Branches / Subsidiaries Abroad |
14 |
14 |
14 |
14 |
13 |
14 |
14 |
13 |
- |
7.7 |
|
ATMs |
50,467 |
50,113 |
49,410 |
48,941 |
48,682 |
48,053 |
47,612 |
48,295 |
0.7 |
3.7 |
|
- Bradesco Network |
31,527 |
31,495 |
31,132 |
31,091 |
31,089 |
31,107 |
31,509 |
32,909 |
0.1 |
1.4 |
|
- Banco24Horas Network |
18,940 |
18,618 |
18,278 |
17,850 |
17,593 |
16,946 |
16,103 |
15,386 |
1.7 |
7.7 |
|
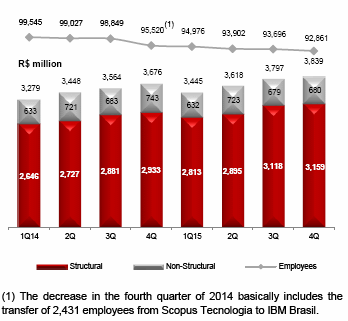
Employees (18) |
92,861 |
93,696 |
93,902 |
94,976 |
95,520 |
98,849 |
99,027 |
99,545 |
(0.9) |
(2.8) |
|
Outsourced Employees and Interns |
13,223 |
13,333 |
13,111 |
12,977 |
12,916 |
12,896 |
12,790 |
12,671 |
(0.8) |
2.4 |
|
Customers - in millions |
|
|
|
|
|
|
|
|
|
|
|
Active Account Holders (19) (20) |
26.0 |
26.4 |
26.5 |
26.6 |
26.5 |
26.6 |
26.5 |
26.6 |
(1.5) |
(1.9) |
|
Savings Accounts (21) |
60.1 |
57.0 |
57.6 |
58.1 |
59.1 |
52.9 |
51.8 |
49.0 |
5.4 |
1.7 |
|
Insurance Group |
49.8 |
48.2 |
47.8 |
47.8 |
46.9 |
46.3 |
45.5 |
45.3 |
3.3 |
6.2 |
|
- Policyholders |
44.2 |
42.5 |
42.0 |
42.0 |
41.1 |
40.5 |
39.6 |
39.4 |
4.0 |
7.5 |
|
- Pension Plan Participants |
2.4 |
2.4 |
2.4 |
2.4 |
2.4 |
2.4 |
2.4 |
2.4 |
- |
- |
|
- Capitalization Bond Customers |
3.2 |
3.3 |
3.4 |
3.4 |
3.4 |
3.4 |
3.5 |
3.5 |
(3.0) |
(5.9) |
|
Bradesco Financiamentos (19) |
2.8 |
2.8 |
2.9 |
3.0 |
3.1 |
3.1 |
3.2 |
3.2 |
- |
(9.7) |
(1) For more information, please check note 4 – Statement of Financial Position and Statement of Managerial Income, in chapter 6 of this report;
(2) Expanded Loan Portfolio: includes sureties and guarantees, letters of credit, advances of credit card receivables, co-obligations in loan assignments (receivables-backed investment funds and mortgage-backed receivables), co-obligations in rural loan assignments and operations bearing credit risk – commercial portfolio, covering debentures and promissory notes;
(3) Includes provision for guarantees provided, encompassing sureties, guarantees, letters of credit, and standby letter of credit, which comprises the concept of “excess” ALL. In the third quarter of 2015, includes an ALL Surplus/Worsening of Ratings, considered as an extraordinary event, totaling R$3,704 million; This way, the balance of the ALL - Surplus provision went from R$4,004 million in June 2015 to R$6,409 million in September 2015;
(4) In the last 12 months;
(5) For comparison purposes, shares were adjusted in accordance with bonuses and stock splits;
(6) Excluding mark-to-market effect of Available-for-Sale Securities recorded under Shareholders’ Equity;
(7) Year-to-Date Adjusted Net Income;
(8) Excludes additional reserves;
(9) Number of shares (excluding treasury shares) multiplied by the closing price for common and preferred shares on the period’s last trading day;
(10) As defined by the Brazilian Central Bank (Bacen);
(11) Overdue loans;
(12) Since October 2013, the Basel Ratio calculation has followed regulatory guidelines set forth in CMN Resolutions No. 4,192/13 and No. 4,193/13 (Basel III);
(13) As of March 2015, the ratio calculated based on the Prudential Consolidated is included, as set forth in CMN Resolution No. 4,192/13. It is important to note that the Prudential Consolidated is calculated in accordance with the regulatory guidelines set forth in CMN Resolution No. 4,280/13;
(14) The decrease as of March 2015 is related to (i) the migration of “External ATM Network– Bradesco” to “Banco24Horas Network”; (ii) the deactivation of ATMs from “Banco24Horas Network”; and (iii) the reduction of Bradesco Expresso correspondents;
(15) PA (Service Branch): a result of the consolidation of PAB (Banking Service Branch), PAA (Advanced Service Branch) and Exchange Branches, according to CMN Resolution No. 4,072/12; and PAEs – ATMs located on a company’s premises;
(16) Including overlapping ATMs within the Bank’s own network and the Banco24Horas Network;
(17) This decrease is related to the sharing of external network ATMs by the Banco24Horas Network ATMs;
(18) The decrease in the fourth quarter of 2014 includes, primarily, the transfer of 2,431 employees from Scopus Tecnologia to IBM Brasil;
(19) Number of individual customers (National Registry of Legal Entities (CNPJ) and Individual Taxpayer Registry (CPF));
(20) Refers to first and second checking account holders; and
(21) Number of accounts.
| Bradesco | 7 |
| Press Release | ||||
| Ratings | ||||
|
|
Main Ratings | |||
|
Fitch Ratings | |||||||
|
International Scale |
Domestic Scale | ||||||
|
Viability |
Support |
Domestic Currency |
Foreign Currency |
Domestic | |||
|
bbb- |
3 |
Long Term |
Short Term |
Long Term |
Short Term |
Long Term |
Short Term |
|
BBB- |
F3 |
BBB- |
F3 |
AAA(bra) |
F1+(bra) | ||
|
|
|
|
|
|
|
| |
|
Moody´s Investors Service | |||||||
|
International Scale |
Domestic Scale | ||||||
|
Domestic Currency Deposit |
Foreign Currency Deposit |
Domestic Currency | |||||
|
Long Term |
Short Term |
Long Term |
Short Term |
Long Term |
Short Term | ||
|
Baa3 |
P-3 |
Baa3 |
P-3 |
Aaa.br |
BR-1 | ||
|
Standard & Poor's |
Austin Rating | |||||||
|
International Scale - Issuer's Credit Rating |
Domestic Scale |
Corporate Governance |
Domestic Scale | |||||
|
Foreign Currency |
Domestic Currency |
Issuer's Credit Rating |
Long Term |
Short Term | ||||
|
Long Term |
Short Term |
Long Term |
Short Term |
Long Term |
Short Term |
AA+ |
brAAA |
brA-1 |
|
BB+ |
B |
BB+ |
B |
brAA+ |
brA-1 | |||
|
Book Net Income vs.Adjusted Net Income |
The main non-recurring events that affected Book Net Income in the periods below are presented in the following comparative chart:
|
|
R$ million | |||
|
|
12M15 |
12M14 |
4Q15 |
3Q15 |
|
Book Net Income |
17,190 |
15,089 |
4,353 |
4,120 |
|
|
|
|
|
|
|
Non-recurring events (net of tax effects) |
683 |
270 |
209 |
413 |
|
- Tax liability |
(2,341) |
- |
- |
(2,341) |
|
- Reversal of technical reserves |
(276) |
(432) |
(276) |
- |
|
- ALL Surplus/Worsening of Ratings |
2,222 |
- |
- |
2,222 |
|
- Contingent Liabilities |
606 |
(98) |
13 |
532 |
|
- Impairment of assets (1) |
472 |
800 |
472 |
- |
|
Adjusted Net Income |
17,873 |
15,359 |
4,562 |
4,533 |
|
|
||||
|
ROAE % (2) |
19.7 |
19.8 |
20.5 |
20.0 |
|
|
|
|||
|
ROAE (ADJUSTED) % (2) |
20.5 |
20.1 |
21.6 |
22.1 |
(1) In 2015 and in 4Q15, it refers to the impairment of: (i) Shares, in the amount of R$238 million (R$749 million in 2014); and (ii) Permanent/Intangible Assets, in the amount of R$234 million (R$51 million in 2014); and
(2) Annualized.
| 8 |
Economic and Financial Analysis Report December 2015 |
| Press Release | ||||
| Summarized Analysis of Adjusted Income | ||||
|
To provide for better understanding and comparison of Bradesco results, we use in the comments of chapters 1 and 2 of this report the Adjusted Income Statement, obtained from |
adjustments made to the Managerial Income Statement, detailed at the end of this Press Release. |
|
|
|
|
|
|
|
|
R$ million | |
|
|
Adjusted Income Statement | |||||||
|
|
12M15 |
12M14 |
Variation |
4Q15 |
3Q15 |
Variation | ||
|
|
12M15 x 12M14 |
4Q15 x 3Q15 | ||||||
|
|
Amount |
% |
Amount |
% | ||||
|
Net Interest Income |
55,387 |
48,295 |
7,092 |
14.7 |
14,512 |
13,735 |
777 |
5.7 |
|
- Interest Earning Portion |
54,777 |
47,497 |
7,280 |
15.3 |
14,380 |
13,709 |
671 |
4.9 |
|
- Non-Interest Earning Portion |
610 |
798 |
(188) |
(23.6) |
132 |
26 |
106 |
407.7 |
|
ALL |
(15,174) |
(12,657) |
(2,517) |
19.9 |
(4,192) |
(3,852) |
(340) |
8.8 |
|
Gross Income from Financial Intermediation |
40,213 |
35,638 |
4,575 |
12.8 |
10,320 |
9,883 |
437 |
4.4 |
|
Income from Insurance Premiums, Pension Plans and Capitalization bonds, minus Variation of Technical Reserves, Retained Claims and others (1) |
5,426 |
5,047 |
379 |
7.5 |
1,493 |
1,411 |
82 |
5.8 |
|
Fee and Commission Income |
24,839 |
22,089 |
2,750 |
12.4 |
6,597 |
6,380 |
217 |
3.4 |
|
Personnel Expenses |
(14,699) |
(13,967) |
(732) |
5.2 |
(3,839) |
(3,797) |
(42) |
1.1 |
|
Other Administrative Expenses |
(16,339) |
(14,848) |
(1,491) |
10.0 |
(4,574) |
(4,200) |
(374) |
8.9 |
|
Tax Expenses |
(5,640) |
(4,627) |
(1,013) |
21.9 |
(1,650) |
(1,330) |
(320) |
24.1 |
|
Equity in the Earnings (Losses) of Unconsolidated Companies |
144 |
187 |
(43) |
(23.0) |
93 |
38 |
55 |
144.7 |
|
Other Operating Income/ (Expenses) |
(6,708) |
(5,395) |
(1,313) |
24.3 |
(1,586) |
(1,604) |
18 |
(1.1) |
|
Operating Result |
27,236 |
24,124 |
3,112 |
12.9 |
6,854 |
6,781 |
73 |
1.1 |
|
Non-Operating Result |
(283) |
(183) |
(100) |
54.6 |
(68) |
(92) |
24 |
(26.1) |
|
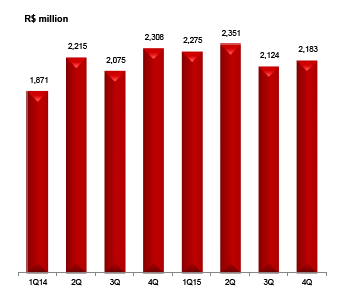
Income Tax / Social Contribution |
(8,933) |
(8,469) |
(464) |
5.5 |
(2,183) |
(2,124) |
(59) |
2.8 |
|
Non-controlling Interest |
(147) |
(113) |
(34) |
30.1 |
(41) |
(32) |
(9) |
28.1 |
|
Adjusted Net Income |
17,873 |
15,359 |
2,514 |
16.4 |
4,562 |
4,533 |
29 |
0.6 |
(1) In “Others”, it includes: Capitalization Bond Draws and Redemption – Insurance and Pension Plan and Capitalization Bond Sales Expenses.
| Bradesco | 9 |
| Press Release | ||||
| Summarized Analysis of Adjusted Income | ||||
|
Adjusted Net Income and Profitability |
||||
The return on the Average Adjusted Shareholder’s Equity (ROAE) stood at 20.5% in December 2015. Such performance stems from the growth of adjusted net income, which increased by 0.6% quarter-over-quarter and 16.4%, in the year-over-year comparison. The main events that affected adjusted net income are detailed below. Adjusted net income reached R$4,562 million in the fourth quarter of 2015, up R$29 million or 0.6% compared to the previous quarter, mainly due to (i) the increment of the “interest” and "non-interest" earning portion; (ii) higher fee and commission income, result of the enhanced segmentation of clients and of investment in technology to enable new strategies of customer service; (iii) the highest operating result of Insurance, Pension Plans and Capitalization Bonds, net of technical reserves, retained claims and others; and impacted, partly, by higher: (iv) administrative expenses; (v) cost of the provision for doubtful accounts; and (vi) tax expenses. In the financial year of 2015, the adjusted net income reached R$17,873 million, increase of R$2,514 million, or 16.4%, compared to the previous year, which reflects the highest revenues due to: (i) the interest earning portion, partially due to the effect the margin of intermediation and of the assets and liabilities management (ALM); and (ii) fees and commissions; being partially offset by: (iii) higher allowance for loan losses expenses; (iv) higher personnel and administrative expenses, whose variation was below the index of inflation (IPCA) in the period; (v) increased operating expenses, net; and (vi) higher tax expenses. Shareholders’ Equity totaled R$88,907 million in December 2015, up 9.1% over December 2014. Basel III Ratio, calculated based on the Prudential Consolidated, stood at 16.8%, 12.7% of which was classified as Common Equity / Tier I. Total Assets registered R$1.080 trillion in December 2015, a 4.6% increase over December 2014, driven by the increased turnover. Return on Average Assets (ROAA) reached 1.7%.

| 10 |
Economic and Financial Analysis Report December 2015 |
| Press Release | ||||
| Summarized Analysis of Adjusted Income | ||||
| Operating Efficiency Ratio (ER) | ||||
The 12-month accumulated ER(1) reached 37.5% in the fourth quarter of 2015, once again registering the best historical level, showing improvement of 0.4 p.p.in comparison to the previous quarter, and 1.7 p.p. in comparison to the same period of the previous year, whereby the main variations were due to: (i) the increase in the net interest income and fee and commission income; and (ii) the operational expenses performance, which have evolved below the inflation in the year. These factors also contributed to the improvement of the ER in the "risk adjusted" concept, reflecting the impact of the risk associated with loan operations(2), reached 46.5%. It is important to mention that the ER performance reflects the strategy of sustainable growth, which includes, among others, the availability of appropriate products and services for clients through the segmentation of the base, the optimization of points of service, and the strict control of operating expenses, arising from the actions of the Efficiency Committee and of investments in Information Technology. The quarterly ER, the indicator remained stable

(1) ER = (Personnel Expenses – Employee Profit Sharing + Administrative Expenses) / (Net Interest Income + Fee and Commission Income + Income from Insurance + Equity in the Earnings (Losses) of Unconsolidated Companies + Other Operating Income – Other Operating Expenses). If we considered the ratio between (i) total administrative costs (Personnel Expenses + Administrative Expenses + Other Operating Expenses + Tax Expenses not related to income generation + Insurance Sales Expenses); and (ii) net income generation of related taxes (not considering Insurance Claims and Sales Expenses), our ER accumulated in the last 12 months in the fourth quarter of 2015 would be 42.0%; and
(2) Including ALL expenses, adjusted for discounts granted, loan recovery and sale of foreclosed assets, among others.
| Bradesco | 11 |
| Press Release | ||||
| Summarized Analysis of Adjusted Income | ||||
|
NII (Net Interest Income) |
||||

In the year-over-year comparison, the net interest income increased by R$7,092 million, or 14.7%, mainly due to: (i) a higher interest earning portion income, in the amount of R$7,280 million, particularly in “Credit Intermediation” and “Securities/Other” and offset by: (ii) lower result obtained with non-interest earning portion, in the amount of R$188 million.
In the quarterly comparison, the R$777 million, or 5.7%, increase was, mainly, due to: (i) by the higher result obtained with the "interest" earning portion, to the value of R$671 million, with emphasis on "Credit Intermediation", a result of an improved management in investment resources and funding operations; and (ii) non-interest earning portion, in the amount of R$106 million.
|
|
|
|
|
|
|
R$ million |
|
|
12M15 |
12M14 |
|
| ||
|
|
Interest |
Average |
Average Rate |
Interest |
Average |
Average Rate |
|
Credit Intermediation |
42,788 |
366,001 |
11.7% |
38,366 |
341,470 |
11.2% |
|
Insurance |
5,558 |
164,894 |
3.4% |
4,303 |
143,307 |
3.0% |
|
Securities/Other |
6,431 |
395,896 |
1.6% |
4,828 |
342,564 |
1.4% |
|
0 |
|
|
|
|
|
|
|
Interest Earning Portion |
54,777 |
- |
7.5% |
47,497 |
- |
7.1% |
|
0 |
||||||
|
|
4Q15 |
3Q15 | ||||
|
|
Interest |
Average |
Average Rate |
Interest |
Average |
Average Rate |
|
Credit Intermediation |
11,313 |
370,405 |
11.7% |
10,806 |
369,422 |
11.5% |
|
Insurance |
1,523 |
174,030 |
3.4% |
1,349 |
167,661 |
3.3% |
|
Securities/Other |
1,544 |
395,578 |
1.6% |
1,554 |
419,074 |
1.6% |
|
0 |
|
|
|
|
|
|
|
Interest Earning Portion |
14,380 |
- |
7.5% |
13,709 |
- |
7.5% |
The interest earning portion rate in the last 12 months remained 7.5% in the fourth quarter of 2015. In the year-over-year comparison, the growth of 0.4 p.p. was the reflection of increased profits obtained in the interest earning portions of “Credit Intermediation”, "Insurance” and “TVM/Other”.
| 12 |
Economic and Financial Analysis Report December 2015 |
| Press Release | ||||
| Summarized Analysis of Adjusted Income | ||||
|
Expanded Loan Portfolio(1) |
||||
|
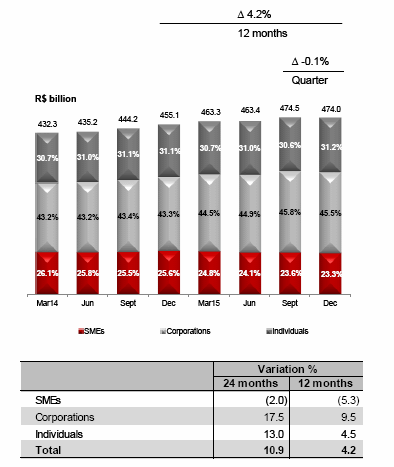
In December 2015, the expanded loan portfolio of Bradesco totaled R$474.0 billion, maintaining stable in comparison to the previous quarter. Micro, Small and Medium Sized Enterprises and Corporations presented a reduction of 1.2% and 0.8%, respectively, while the Individual, in turn, registered an expansion of 1.7% in the period. In the last 12 months, the portfolio increased by 4.2% primarily represented by: (i) 9.5% in Corporations; and (ii) 4.5% in Individuals, and partially offset by: (iii) a decrease of 5.3% of the SMEs segment. For Individuals, the products that have the strongest growth in the last 12 months were: (i) real estate financing; and (ii) payroll-deductible loans especially for the public sector and INSS beneficiaries. While for the Corporate segment, the highlights were: (i) export financing; and (ii) operations abroad, influenced by the exchange rate variation in the period. |
 |
(1) In addition to Bacen loan portfolio, it includes sureties, guarantees, letters of credit, advances of credit card receivables, debentures, promissory notes, co-obligation in mortgage-backed receivables, and farm loans.
For more information, see Chapter 2 of this Report.
In the fourth quarter of 2015, allowance for loan losses totaled R$4,192 million, registering an increase of 8.8% over the previous quarter due to the delinquency rate in the period, mainly resulting from the deceleration of economic activity. It is important to note that loan operations, as defined by Bacen, remained stable in the quarter. In the year-over-year comparison, these expenses presented a variation of 19.9%, impacted, mainly by: (i) the effect of the alignment of the allowance level of certain operations with corporate clients; (ii) the higher delinquency rate in the period; and (iii) the increase in credit operations - Bacen concept, which presented an evolution of 5.9% in the last 12 months. The worsening of delinquency rates was mitigated by the reinforcement of the loan assignment and monitoring policy and processes, quality of guarantees, as well as the improvement of the credit recovery processes.

(1) Includes provision for guarantees provided, encompassing sureties, guarantees, letters of credit, and standby letter of credit, which comprises the concept of “excess” ALL. In the third quarter of 2015, includes an ALL Surplus/Worsening of Ratings, considered as an extraordinary event, totaling R$3,704 million. This way, the balance of the ALL - Surplus provision went from R$4,004 million in June 2015 to R$6,409 million in September 2015
For more information, see Chapter 2 of this Report..
| Bradesco | 13 |
| Press Release | ||||
| Summarized Analysis of Adjusted Income | ||||
|
Delinquency Ratio(1) |
||||
| The total delinquency ratio, which refers to operations that are over 90 days past due, increased mainly due to the loan portfolio lower |
pace of growth and the downturn in the economy. It is worth to mention the retraction of the delinquency ratio of the Corporations segment in the period, that partially offset, the effects of higher delinquency rate for the Individual and Micro, Small and Medium Sized Enterprises. |

The increase in the Corporate segment was offset by the decrease in the Individuals segment.
In the quarter, short-term delinquency, including operations past due between 15 and 90 days remained stable.

| 14 |
Economic and Financial Analysis Report December 2015 |
| Press Release | ||||
| Summarized Analysis of Adjusted Income | ||||
|
Coverage Ratios |
||||
The following graph presents the performance of the Allowance for Loan Losses (ALL) coverage ratios, with regard to loans past due for more than 60 and 90 days. In December 2015, these ratios stood at comfortable levels, reaching 161.7% and 198.0%, respectively. In addition to the allowance for loan losses (ALL) required by Bacen, Bradesco has excess of R$6.4 billion, to support potential stress scenarios, as well as other operations/commitments bearing credit risks.
Bradesco monitors the loan portfolio, as well as respective risks, by internally applying the expanded portfolio concept.

(*) Includes provision for guarantees provided, encompassing sureties, guarantees, letters of credit, and standby letter of credit, which comprises the concept of “excess” ALL. In September 2015, it includes the ALL Surplus/ Worsening of Ratings, considered as an extraordinary event, totaling R$3,704 million. This way, the balance of the ALL - Surplus provision went from R$4,004 million in June 2015 to R$6,409 million in September 2015.
| Bradesco | 15 |
| Press Release | ||||
| Summarized Analysis of Adjusted Income | ||||
|
Income from Insurance, Pension Plans and Capitalization Bonds |
||||
|
Net Income for the fourth quarter of 2015 totaled R$1.405 billion,with a growth of 13.7% in relation to the same period of the previous year (R$1.236 billion),and of 6.7% in relation to the third quarter of 2015 (R$1.317 billion), presenting annualized return on Adjusted Shareholder’s Equity of 28.3%. |
In the financial year of 2015, the Net Income totaled R$5.289 billion, which exceeds by 20.0% the Net Income in the same period of the previous year (R$4.406 billion), presenting a return on the Adjusted Shareholder’s Equity of 24.2%. |

|
|
|
R$ million (unless otherwise stated) | ||||||||
|
|
4Q15 |
3Q15 |
2Q15 |
1Q15 |
4Q14 |
3Q14 |
2Q14 |
1Q14 |
Variation % | |
|
|
4Q15 x 3Q15 |
4Q15 x 4Q14 | ||||||||
|
Net Income |
1,405 |
1,317 |
1,284 |
1,283 |
1,236 |
1,058 |
1,072 |
1,040 |
6.7 |
13.7 |
|
Insurance Written Premiums, Pension Plan Contributions and Capitalization Bond Income |
19,130 |
15,125 |
16,723 |
13,634 |
17,806 |
12,904 |
13,992 |
11,450 |
26.5 |
7.4 |
|
Technical Reserves |
177,835 |
168,629 |
164,566 |
157,295 |
153,267 |
145,969 |
142,731 |
137,751 |
5.5 |
16.0 |
|
Financial Assets |
191,921 |
182,391 |
179,129 |
170,395 |
166,022 |
158,207 |
154,261 |
147,725 |
5.2 |
15.6 |
|
Claims Ratio (%) |
71.9 |
73.1 |
71.4 |
71.7 |
70.9 |
72.7 |
70.2 |
70.1 |
(1.2) p.p. |
1.0 p.p. |
|
Combined Ratio (%) |
86.5 |
86.9 |
86.5 |
86.8 |
85.9 |
86.5 |
86.3 |
86.4 |
(0.4) p.p. |
0.6 p.p. |
|
Policyholders / Participants and Customers (in thousands) |
49,806 |
48,185 |
47,758 |
47,789 |
46,956 |
46,303 |
45,468 |
45,260 |
3.4 |
6.1 |
|
Employees |
7,023 |
7,052 |
7,074 |
7,082 |
7,113 |
7,135 |
7,152 |
7,265 |
(0.4) |
(1.3) |
|
Market Share of Insurance Written Premiums, Pension Plan Contributions and Capitalization Bond Income (%) (1) |
25.0 |
24.7 |
24.8 |
23.5 |
24.4 |
23.3 |
23.5 |
23.4 |
0.3 p.p. |
0.6 p.p. |
(1) The fourth quarter of 2015 includes the latest data released by SUSEP (November 2015).
Note: For comparability between the indexes in the periods demonstrated above, we disregarded extraordinary effects from the calculation.
| 16 |
Economic and Financial Analysis Report December 2015 |
| Press Release | ||||
| Summarized Analysis of Adjusted Income | ||||
|
In the fourth quarter of 2015, the revenue showed an increase of 26.5% in comparison to the previous quarter, particularly "Life and Pension" products, that were fueled by the highest concentration of private pension contributions in the period. In the comparative study between the fourth quarter of 2015 and the same period of the previous year, there was an increase of 7.4% in Insurance Written Premiums, Pension Plan Contributions and CapitalizationBond Revenue. In the financial year of 2015, the production registered an increase of 15.1% over the same period in the previous year, influenced by “Health Plans” and “Life and Pension Plans” products, which increased 20.1% and 18.1%, respectively. The net income of the fourth quarter of 2015 was 13.7% higher than the results presented in the same period last year, basically due to: (i) the growth of 7.4% in the turnover; (ii) the improvement in the financial and equity results; partially offset by: (iii) the increase of the Social Contribution (CSLL) rate, from 15% to 20%, as of September 2015, proportionally influencing the fourth quarter of 2015 results; (iv) by the increase of 1.0 p.p. in the claims ratio. |
The net income for 2015 was 20.0% higher compared to the same period in the previous year, due to: (i) an increase in revenue; (ii) the improvement of the financial and equity results; (iii) the improvement of the administrative efficiency index; compensated, partly: (iv) by the increase of 1.0 p.p. in the claims ratio; and (v) by the increase of the Social Contribution (CSLL) rate. The net income of the fourth quarter of 2015 was 6.7% higher than in the previous quarter, basically, due to: (i) an increase in revenue; (ii) reduction of 1.2 p.p. in the claims ratio; (iii) improvement in the administrative efficiency ratio; (iv) improvement in the financial and equity results; and (v) the increase of the Social Contribution (CSLL) rate. |
|
According to CNSP Resolution No.321/15, corporations should have adjusted shareholder’s equity (ASE) equal to or higher than the minimum capital required (MCR). MCR is equivalent to the highest value between the base capital and the risk capital. For companies regulated by the ANS, Normative Resolution No.373/15 establishes that corporations should have adjusted shareholder’s equity (ASE) equal to or higher than the Solvency Margin. The capital adjustment and management process is continuously monitored and aims to ensure that Grupo Bradesco Seguros keeps a solid capital |
base to support the development of activities and cope with the risks in any market situation, in compliance with regulatory requirements and/or Corporate Governance principles. Companies must permanently maintain a capital compatible with the risks for their activities and operations, according to the characteristics and peculiarities of each company belonging to Grupo Bradesco Seguros, represented by adequate capital levels. Grupo Bradesco Seguros permanently observes the limits required by the respective regulatory entities. The Minimum Capital Required in November 2015 was R$8,200 billion. |
| Bradesco | 17 |
| Press Release | ||||
| Summarized Analysis of Adjusted Income | ||||
|
Fee and Commission Income |
||||
In the year-over-year comparison, the increase of R$2,750 million, or 12.4%, was mainly due to: (i) an increase of volume of operations, which are arising from the continuous investments in service channels and in technology; and (ii) advance of the process of segmentation of clients for a better offer of products and services. It must be noted that the lines that have most contributed to this result derived from: (i) the good performance of the cards activity, as a result of (a) the increase in the financial volume traded; and (b) the highest volume of transactions performed; (ii) an increase in the checking account income, mainly due to an improvement in the customer segmentation process; and evolution of revenue with: (iii) loan operations, especially income from collaterals; (iv) asset management; and (v) consortium management. In the fourth quarter of 2015, fee and commission income totaled R$6,597 million, showing increase of R$217 million, or 3.4%, in comparison to the previous quarter, primarily due to the increase in the volume of business, with emphasis on the performance of revenues of: (i) cards; (ii) checking accounts; and (iii) underwriting.

In the year-over-year comparison, the increase of R$732 million, or 5.2%, is mainly due to the structural portion due to the increase in expenses with payroll, social charges and benefits, impacted by higher salaries, in accordance with the 2014 and 2015 collective agreements. In the fourth quarter of 2015, the increase of R$42 million, or 1.1%, compared to the previous quarter is mainly composed by the structural portion due to: (i) lower number of employees on vacation in the previous quarter; and (ii) increased wage levels, according to collective agreement.
Note: Structural Expenses = Salaries + Social Charges + Benefits + Pension Plans.
Non-Structural Expenses = Employee and Management Profit Sharing + Training + Labor Provision + Costs with termination of employment contracts.
| 18 |
Economic and Financial Analysis Report December 2015 |
| Press Release | ||||
| Summarized Analysis of Adjusted Income | ||||
|
Administrative Expenses |
||||
In the year-over-year comparison the 10.0%, or R$1,491 million increase was primarily due to an increase of expenses originated: (i) by the growth in turnover and services in the period; (ii) by contractual adjustments; and (iii) by the dollar performance over the past 12 months since it reached 47.0% of recovery against the Brazilian real. It is important to stress that, the continuous control of operating expenses resulting from actions of the Efficiency Committee, whose efficiency initiatives resulted in a rebalance among personnel and administrative expenses. In the fourth quarter of 2015, the increase of 8.9%, or R$374 million, in the administrative expenses over the previous quarter, was mainly due to: (i) to the seasonal effect of higher expenses with advertising and marketing, due to the higher concentration of actions related to the Institutional Campaign and to support the offer of products and services; (ii) the growth in turnover and services occurred in the period, consequently, impacting in higher expenses with: (a) outsourced services; (b) data processing; and (c) financial system services; and higher expenses with: (iii) depreciation and amortization; and (iv) rental.
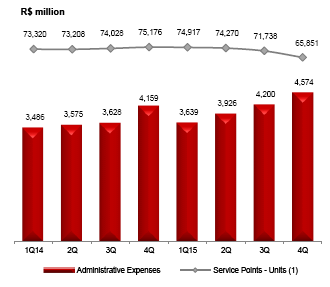
(1) The decrease as of March 2015 is related to: (i) the migration of “External ATM Network – Bradesco” to “Banco24Horas Network”; (ii) the deactivation of ATMs from “Banco24Horas Network”; and (iii) the decrease of Bradesco Expresso correspondents.
|
In the financial year of 2015, other operating expenses, net, totaled R$6,708 million, a R$1,313 million increase over the financial year of 2014, primarily due to: (i) the constitution of tax provisions, in the first semester of 2015, relating to the levy of pension plan contributions and IRPJ/CSLL on credit losses, in the amount of R$570 million; (ii) higher expenses related to: (a) the constitution of civil provisions; and (b) various losses; (iii) the impact of the creation of a services joint venture (Cateno) in Cielo; and (iv) the amortization of goodwill. In the fourth quarter of 2015, other net operating expenses totaled R$1,586 million, remaining stable over the previous quarter. |
 |
| Bradesco | 19 |
| Press Release | ||||
| Summarized Analysis of Adjusted Income | ||||
|
Income Tax and Social Contribution |
||||
|
Income tax and social contribution expenses, in the quarterly comparison showed an increase of 2.8%, or R$59 million, reflecting, in part: (i) the increase of the CSLL (social contribution) rate; and was partially offset by: (ii) the increase of the TJLP (from 6.5% in the third quarter of 2015 to 7.0% in the fourth quarter of 2015), which provided a greater constitution of interest on own capital, in the fourth quarter of 2015. In the year-over-year comparison, the increase of 5.5%, or R$464 million, is related: (i) to the greater taxable income in the period; (ii) the increase of the CSLL (social contribution) rate; partially offset by the: (iii) increase of the TJLP (from an average rate of 5.0% in 2014 to an average rate of 6.3% in 2015), which provided a greater constitution of interest on own capital, comparing the financial year of 2015 to the financial year of 2014. |
 |
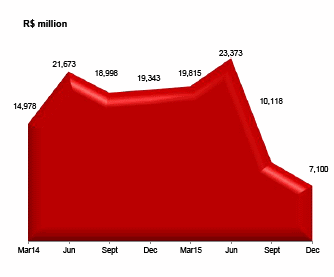
Unrealized gains totaled R$7,100 million at the end of the fourth quarter of 2015, a R$3,018 million decrease over the end of the previous quarter. Such variation was mainly due to: (i) the devaluation of the investments, mainly impacted, by Cielo shares which devalued 8.4%; and (ii) by the increase of unrealized loss in loans and leasing operations, impacted by the interest rate increase.
| 20 |
Economic and Financial Analysis Report December 2015 |
| Press Release | ||||
| Capital Ratios - Basel III | ||||
|
Basel Ratio |
||||
In December 2015, the Capital stood at R$102,825 million, against risk-weighted assets totaling R$612,217 million. The total Basel Ratio presented an increase of 2.3 p.p., from 14.5% in September 2015 to 16.8% in December 2015, and the Common Equity from 11.4% in September 2015 to 12.7% in December 2015. In the table below are the main events that impacted the Tier I Capital / Principal Capital Index in the quarter:
Additionally, it is important to stress that in the fourth quarter of 2015, the Central Bank authorized the use of Subordinated Letters of Credit to compose Tier II, whose restated amount reached R$5,805 million on December 31, 2015.


Full Impact – Basel III
We included a Basel III simulation, considering some of the main future adjustments, which include: (i) the application of 100% of the deductions provided in the implementation schedule; (ii) the allocation of resources, obtained via payment of dividends, of our Insurance Group; (iii) the use of tax credits; and (iv) the impact of the acquisition of HSBC, for a rate of 10.3% of Common Equity, which, added to funding obtained via subordinated debt, may amount to an approximate Tier I Basel Ratio of 11.8%, in the end of 2018.

Capital Management Buffer / Return on Tier I Capital
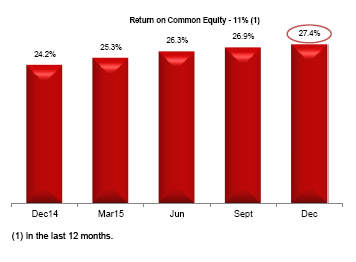
Bradesco has improved its measurement and governance methodology, and has structured processes for buffer capital, so that it can maintain adequate capital levels to cope with the risks incurred. The Organization considers it feasible, in the medium and long term, to maintain a margin of Level of Tier I Capital of at least 25%, in relation to the minimum capital buffer, observing the schedule established by the Central Bank, for the full adoption of the Basel III guidelines. Considering the 11% minimum required to Common Equity according to the full interpretation of Basel III rules, profitability would be 27.4% in the period of 12 months ended in December 2015.
| Bradesco | 21 |
| Press Release | ||||
| Economic Scenario | ||||
The confirmation of the initial monetary standardization in the United States reduced the uncertainties in the world scenario in the fourth quarter of 2015. The persistent strengthening of the North American labor market led the Federal Reserve (Fed) to increase the interest rate in its last meeting of the year – decision that was already being widely signaled. At the same time, the stabilization of the Chinese stock and exchange markets favored the perception of risk in the international markets. Even so, the deceleration of the Chinese economy was not interrupted, which contributed to maintain the international prices of commodities at a lower level. Additionally, this country has adopted new stimuli to the economy in the period, in an attempt to contain the weakening of the economic activity. Finally, the European Central Bank, also with the aim of stimulating the growth of the region and combat the deflationary risks, extended its program for the purchase of sovereign bonds. The domestic economy maintained a trajectory of deceleration in the fourth quarter, albeit at a slower speed to the one recorded in previous periods. Highlight for the further weakening of the labor market and the continued drop in confidence of the economic agents. On the other hand, the adjustments in the external accounts continued and the rebalance of administered prices in relation to the free ones and of domestic against the external prices did as well. This behavior of activity, in turn, impacted negatively the collection of the public sector and the fiscal results, leading the government to continually review its goals of primary balance for 2015 and 2016. Thus, actions to ensure fiscal sustainability in the medium term and the progress on the reform agenda become even more relevant. Efforts in this direction are a necessary condition to maintain the economic predictability and to increase the level of trust of families and entrepreneurs, enabling the resumption of the trend to increase actual income and productive investments. Additional actions of a structural nature that leverage the future growth are also fundamental. The constant search for excellence in education is Brazil’s front line in its struggle to become more competitive and to expedite its efforts to upgrade infrastructure. It is never too much to remember that, in the long term, the main source of economic growth is productivity, a theme that is even more relevant in a global context characterized by increased competition and economic growth that is still fragile. The investments tend to have an increasingly important role in the composition of growth in coming years, especially in the process of recovery of the economic activity. This should still be favored by greater participation of the capital market in the financing of these projects. At the same time, despite the cyclical retraction of the consumer market in some segments, structurally the potential of domestic demand for goods and services is not exhausted and there is still much to be exploited. Bradesco maintains a positive outlook towards Brazil, with favorable perspectives for its operating segments. Credit volume is growing at sustainable and risk-compatible rates, whereas delinquency rates are stabilized at historically controlled levels, in spite of a cyclic elevation due to the retraction of the activity and the reduction of the employment level this year. The scenario is still promising for Brazilian banking and insurance sectors in the medium and long term.
| 22 |
Economic and Financial Analysis Report December 2015 |
| Press Release | ||||
| Main Economic Indicators | ||||
|
Main Indicators (%) |
4Q15 |
3Q15 |
2Q15 |
1Q15 |
4Q14 |
3Q14 |
2Q14 |
1Q14 |
12M15 |
12M14 | |
|
Interbank Deposit Certificate (CDI) |
3.37 |
3.43 |
3.03 |
2.81 |
2.76 |
2.72 |
2.51 |
2.40 |
13.25 |
10.81 | |
|
Ibovespa |
(3.79) |
(15.11) |
3.77 |
2.29 |
(7.59) |
1.78 |
5.46 |
(2.12) |
(13.31) |
(2.91) | |
|
USD – Commercial Rate |
(1.71) |
28.05 |
(3.29) |
20.77 |
8.37 |
11.28 |
(2.67) |
(3.40) |
47.01 |
13.39 | |
|
General Price Index - Market (IGP-M) |
3.95 |
1.93 |
2.27 |
2.02 |
1.89 |
(0.68) |
(0.10) |
2.55 |
10.54 |
3.69 | |
|
Extended Consumer Price Index (IPCA) |
2.82 |
1.39 |
2.26 |
3.83 |
1.72 |
0.83 |
1.54 |
2.18 |
10.67 |
6.41 | |
|
Federal Government Long-Term Interest Rate (TJLP) |
1.72 |
1.59 |
1.48 |
1.36 |
1.24 |
1.24 |
1.24 |
1.24 |
6.29 |
5.03 | |
|
Reference Interest Rate (TR) |
0.53 |
0.61 |
0.40 |
0.23 |
0.26 |
0.25 |
0.15 |
0.19 |
1.80 |
0.86 | |
|
Savings Account |
2.05 |
2.13 |
1.92 |
1.75 |
1.77 |
1.76 |
1.66 |
1.70 |
8.07 |
7.08 | |
|
Business Days (number) |
63 |
65 |
61 |
61 |
65 |
66 |
61 |
61 |
250 |
253 | |
|
Indicators (Closing Rate) |
Dec15 |
Sept15 |
Jun15 |
Mar15 |
Dec14 |
Sept14 |
Jun14 |
Mar14 |
Dec15 |
Dec14 | |
|
USD – Commercial Selling Rate - (R$) |
3.9048 |
3.9729 |
3.1026 |
3.2080 |
2.6562 |
2.4510 |
2.2025 |
2.2630 |
3.9048 |
2.6562 | |
|
Euro - (R$) |
4.2504 |
4.4349 |
3.4603 |
3.4457 |
3.2270 |
3.0954 |
3.0150 |
3.1175 |
4.2504 |
3.2270 | |
|
Country Risk (points) |
521 |
442 |
304 |
322 |
259 |
239 |
208 |
228 |
521 |
259 | |
|
Basic Selic Rate Copom (% p.a.) |
14.25 |
14.25 |
13.75 |
12.75 |
11.75 |
11.00 |
11.00 |
10.75 |
14.25 |
11.75 | |
|
BM&F Fixed Rate (% p.a.) |
15.86 |
15.56 |
14.27 |
13.52 |
12.96 |
11.77 |
10.91 |
11.38 |
15.86 |
12.96 |
|
% |
2016 |
2017 |
2018 |
|
USD - Commercial Rate (year-end) - R$ |
4.00 |
4.20 |
4.00 |
|
Extended Consumer Price Index (IPCA) |
6.90 |
5.40 |
5.00 |
|
General Price Index - Market (IGP-M) |
6.00 |
5.00 |
5.00 |
|
Selic (year-end) |
13.25 |
12.25 |
11.25 |
|
Gross Domestic Product (GDP) |
(3.50) |
1.50 |
3.00 |
| Bradesco | 23 |
| Press Release | ||||
| Guidance | ||||
| Bradesco's Perspective for 2016 | ||||
| Loan Portfolio (1) | 1 to 5% |
| Individuals | 4 to 8% |
| Companies | 0 to 4% |
| NII - Interest Earning Portion | 6 to 10% |
| Fee and Commission Income | 7 to 11% |
| Operating Expenses (2) | 4.5 to 8.5% |
| Insurance Premiums | 8 to 12% |
| Allowance for Loan Losses Expenses (3) | R$16.5 bi to R$18.5 bi |
(1) Expanded Loan Portfolio;
(2) Administrative and Personnel Expenses; and
(3) Includes incomes with credit recovery.
| 24 |
Economic and Financial Analysis Report December 2015 |
| Press Release | ||||
| Managerial Income vs. Adjusted Income Statement | ||||
| Analytical Breakdown of Managerial Income(1) vs. Adjusted Income(3) Statement | ||||
Fourth Quarter of 2015
|
|
|
|
R$ million | |
|
|
4Q15 | |||
|
|
Managerial Income Statement (1) |
Reclassifications (2) |
Non-Recurring Events |
Adjusted Income Statement (3) |
|
| ||||
|
Net Interest Income |
15,771 |
(1,684) |
425 |
14,512 |
|
ALL |
(4,799) |
607 |
- |
(4,192) |
|
Gross Income from Financial Intermediation |
10,972 |
(1,077) |
425 |
10,320 |
|
Income from Insurance, Pension Plans and Capitalization Bonds |
2,019 |
- |
(526) |
1,493 |
|
Fee and Commission Income |
6,573 |
24 |
- |
6,597 |
|
Personnel Expenses |
(3,839) |
- |
- |
(3,839) |
|
Other Administrative Expenses |
(4,615) |
41 |
- |
(4,574) |
|
Tax Expenses |
(1,749) |
80 |
19 |
(1,650) |
|
Equity in the Earnings (Losses) of Unconsolidated Companies |
93 |
- |
- |
93 |
|
Other Operating Income/Expenses |
(1,796) |
(24) |
234 |
(1,586) |
|
Operating Result |
7,658 |
(956) |
152 |
6,854 |
|
Non-Operating Result |
(344) |
94 |
182 |
(68) |
|
Income Tax / Social Contribution and Non-controlling Interest |
(2,961) |
862 |
(125) |
(2,224) |
|
Net Income |
4,353 |
- |
209 |
4,562 |
(1) For more information, please check note 4 – Statement of Financial Position and Managerial Income Statement, in chapter 6 of this report;
(2) Includes reclassifications in items from the income statement which do not affect the Net Income, but allow a better analysis of business items, particularly hedge adjustment, which represents the partial result of derivatives used for hedge investments abroad, which in terms of Net Income, simply cancels the tax effect (IR/CS and PIS/COFINS) of this hedge strategy, in the amount of R$955 million; and
(3) It refers to Managerial Income Statement(1) with the reclassifications between lines, which do not affect the Net Income, and without the extraordinary events of the period.
| Bradesco | 25 |
| Press Release | ||||
| Managerial Income vs. Adjusted Income Statement | ||||
| Analytical Breakdown of Managerial Income(1) vs. Adjusted Income(3) Statement | ||||
Third Quarter of 2015
|
|
|
|
R$ million | |
|
|
3Q15 | |||
|
|
Managerial Income Statement (1) |
Reclassifications (2) |
Non-Recurring Events |
Adjusted Income Statement (3) |
|
| ||||
|
Net Interest Income |
5,510 |
8,225 |
- |
13,735 |
|
ALL |
(7,944) |
388 |
3,704 |
(3,852) |
|
Gross Income from Financial Intermediation |
(2,434) |
8,613 |
3,704 |
9,883 |
|
Income from Insurance, Pension Plans and Capitalization Bonds |
1,411 |
- |
- |
1,411 |
|
Fee and Commission Income |
6,362 |
18 |
- |
6,380 |
|
Personnel Expenses |
(4,064) |
- |
267 |
(3,797) |
|
Other Administrative Expenses |
(4,242) |
42 |
- |
(4,200) |
|
Tax Expenses |
(941) |
(389) |
- |
(1,330) |
|
Equity in the Earnings (Losses) of Unconsolidated Companies |
38 |
- |
- |
38 |
|
Other Operating Income/Expenses |
(2,950) |
648 |
699 |
(1,604) |
|
Operating Result |
(6,820) |
8,932 |
4,670 |
6,781 |
|
Non-Operating Result |
(131) |
38 |
- |
(92) |
|
Income Tax / Social Contribution and Non-controlling Interest |
11,071 |
(8,970) |
(4,257) |
(2,156) |
|
Net Income |
4,120 |
- |
413 |
4,533 |
(1) For more information, please check note 4 – Statement of Financial Position and Managerial Income Statement, in chapter 6 of this report;
(2) Includes reclassifications in items from the income statement which do not affect the Net Income, but allow a better analysis of business items, particularly hedge adjustment, which represents the partial result of derivatives used for hedge investments abroad, which in terms of Net Income, simply cancels the tax effect (IR/CS and PIS/COFINS) of this hedge strategy, in the amount of R$9,216 million; and
(3) It refers to Managerial Income Statement(1) with the reclassifications between lines, which do not affect the Net Income, and without the extraordinary events of the period.
| 26 |
Economic and Financial Analysis Report December 2015 |
| Press Release | ||||
| Managerial Income vs. Adjusted Income Statement | ||||
| Analytical Breakdown of Managerial Income(1) vs. Adjusted Income Statement(3) | ||||
Financial Year of 2015
|
|
|
|
R$ million | |
|
|
12M15 | |||
|
|
Managerial Income Statement (1) |
Reclassifications (2) |
Non-Recurring Events |
Adjusted Income Statement (3) |
|
| ||||
|
Net Interest Income |
46,636 |
8,326 |
425 |
55,387 |
|
ALL |
(20,722) |
1,844 |
3,704 |
(15,174) |
|
Gross Income from Financial Intermediation |
25,914 |
10,170 |
4,129 |
40,213 |
|
Income from Insurance, Pension Plans and Capitalization Bonds |
5,952 |
- |
(526) |
5,426 |
|
Fee and Commission Income |
24,743 |
96 |
- |
24,839 |
|
Personnel Expenses |
(14,966) |
- |
267 |
(14,699) |
|
Other Administrative Expenses |
(16,506) |
167 |
- |
(16,339) |
|
Tax Expenses |
(5,228) |
(431) |
19 |
(5,640) |
|
Equity in the Earnings (Losses) of Unconsolidated Companies |
144 |
- |
- |
144 |
|
Other Operating Income/Expenses |
(9,849) |
2,107 |
1,034 |
(6,708) |
|
Operating Result |
10,204 |
12,109 |
4,923 |
27,236 |
|
Non-Operating Result |
(599) |
134 |
182 |
(283) |
|
Income Tax / Social Contribution and Non-controlling Interest |
7,585 |
(12,243) |
(4,422) |
(9,080) |
|
Net Income |
17,190 |
- |
683 |
17,873 |
(1) For more information, please check note 4 – Statement of Financial Position and Managerial Income Statement, in chapter 6 of this report;
(2) Includes reclassifications in items from the income statement which do not affect the Net Income, but allow a better analysis of business items, particularly hedge adjustment, which represents the partial result of derivatives used for hedge investments abroad, which in terms of Net Income, simply cancels the tax effect (IR/CS and PIS/COFINS) of this hedge strategy, in the amount of R$12,490 million; and
(3) It refers to Managerial Income Statement(1) with the reclassifications between lines, which do not affect the Net Income, and without the extraordinary events of the period.
| Bradesco | 27 |
| Press Release | ||||
| Managerial Income vs. Adjusted Income Statement | ||||
| Analytical Breakdown of Managerial Income(1) vs. Adjusted Income Statement(3) | ||||
Financial Year of 2014
|
|
|
|
R$ million | |
|
|
12M14 | |||
|
|
Managerial Income Statement (1) |
Reclassifications (2) |
Non-Recurring Events |
Adjusted Income Statement (3) |
|
| ||||
|
Net Interest Income |
48,457 |
(1,377) |
1,215 |
48,295 |
|
ALL |
(14,451) |
1,794 |
- |
(12,657) |
|
Gross Income from Financial Intermediation |
34,006 |
417 |
1,215 |
35,638 |
|
Income from Insurance, Pension Plans and Capitalization Bonds |
5,803 |
- |
(754) |
5,047 |
|
Fee and Commission Income |
21,790 |
299 |
- |
22,089 |
|
Personnel Expenses |
(14,455) |
- |
488 |
(13,967) |
|
Other Administrative Expenses |
(15,015) |
166 |
- |
(14,848) |
|
Tax Expenses |
(4,232) |
(449) |
53 |
(4,627) |
|
Equity in the Earnings (Losses) of Unconsolidated Companies |
187 |
- |
- |
187 |
|
Other Operating Income/Expenses |
(7,030) |
2,282 |
(648) |
(5,395) |
|
Operating Result |
21,054 |
2,715 |
354 |
24,124 |
|
Non-Operating Result |
(516) |
334 |
- |
(183) |
|
Income Tax / Social Contribution and Non-controlling Interest |
(5,449) |
(3,048) |
(84) |
(8,582) |
|
Net Income |
15,089 |
- |
270 |
15,359 |
(1) For more information, please check note 4 – Statement of Financial Position and Managerial Income Statement, in chapter 6 of this report;
(2) Includes reclassifications in items from the income statement which do not affect the Net Income, but allow a better analysis of business items, particularly hedge adjustment, which represents the partial result of derivatives used for hedge investments abroad, which in terms of Net Income, simply cancels the tax effect (IR/CS and PIS/COFINS) of this hedge strategy, in the amount of R$3,452 million; and
(3) It refers to Managerial Income Statement(1) with the reclassifications between lines, which do not affect the Net Income, and without the extraordinary events of the period.
| 28 |
Economic and Financial Analysis Report December 2015 |
|
BANCO BRADESCO S.A. | ||
|
By: |
/S/ Luiz Carlos Angelotti
| |
| Luiz Carlos Angelotti Executive Managing Officer and Investor Relations Officer | ||
This press release may contain forward-looking statements. These statements are statements that are not historical facts, and are based on management's current view and estimates of future economic circumstances, industry conditions, company performance and financial results. The words "anticipates", "believes", "estimates", "expects", "plans" and similar expressions, as they relate to the company, are intended to identify forward-looking statements. Statements regarding the declaration or payment of dividends, the implementation of principal operating and financing strategies and capital expenditure plans, the direction of future operations and the factors or trends affecting financial condition, liquidity or results of operations are examples of forward-looking statements. Such statements reflect the current views of management and are subject to a number of risks and uncertainties. There is no guarantee that the expected events, trends or results will actually occur. The statements are based on many assumptions and factors, including general economic and market conditions, industry conditions, and operating factors. Any changes in such assumptions or factors could cause actual results to differ materially from current expectations.
Serious News for Serious Traders! Try StreetInsider.com Premium Free!
You May Also Be Interested In
- Suzano Ventures invests up to US$5 million into Bioform Technologies to further develop bio-based plastic alternatives
- Arkema: Information Relating to the Combined Annual General Meeting of 15 May 2024
- Marqeta Partners with OakNorth to Offer Commercial Cards in the UK, Embracing Growing Small and Medium-Sized Business Demand for Better Banking Tools
Create E-mail Alert Related Categories
SEC FilingsSign up for StreetInsider Free!
Receive full access to all new and archived articles, unlimited portfolio tracking, e-mail alerts, custom newswires and RSS feeds - and more!
