

Form 6-K AerCap Holdings N.V. For: Feb 26
 Tweet
Tweet Share
ShareUNITED STATES
SECURITIES AND EXCHANGE COMMISSION
Washington, DC 20549
FORM 6-K
REPORT OF FOREIGN PRIVATE ISSUER PURSUANT TO RULE 13a-16 OR 15d-16 UNDER THE SECURITIES EXCHANGE ACT OF 1934
|
For the month of February 2016
|
|
Commission File Number 001-33159
|
AERCAP HOLDINGS N.V.
(Translation of Registrant’s Name into English)
La Touche House, IFSC, Dublin 1, Ireland, +353 1 819 2010
(Address of Principal Executive Office)
Indicate by check mark whether the registrant files or will file annual reports under cover of Form 20-F or Form 40-F.
|
Form 20-F ☒
|
|
Form 40-F ☐
|
Indicate by check mark if the registrant is submitting the Form 6-K in paper as permitted by Regulation S-T Rule 101(b)(1): ☐
Note: Regulation S-T Rule 101(b)(1) only permits the submission in paper of a Form 6-K if submitted solely to provide an attached annual report to security holders.
Indicate by check mark if the registrant is submitting the Form 6-K in paper as permitted by Regulation S-T Rule 101(b)(7): ☐
Note: Regulation S-T Rule 101(b)(7) only permits the submission in paper of a Form 6-K if submitted to furnish a report or other document that the registrant foreign private issuer must furnish and make public under the laws of the jurisdiction in which the registrant is incorporated, domiciled or legally organized (the registrant’s “home country”), or under the rules of the home country exchange on which the registrant’s securities are traded, as long as the report or other document is not a press release, is not required to be and has not been distributed to the registrant’s security holders, and, if discussing a material event, has already been the subject of a Form 6-K submission or other Commission filing on EDGAR.
Other Events
Attached hereto as Exhibit 99.1 is a copy of a presentation made to certain AerCap Holdings N.V. bondholders on February 26, 2016, by AerCap Holdings N.V.
|
Exhibits
|
|
|
|
|
|
99.1
|
AerCap Holdings N.V. bondholder presentation dated February 26, 2016.
|
SIGNATURE
Pursuant to the requirements of the Securities Exchange Act of 1934, the registrant has duly caused this report to be signed on its behalf by the undersigned, thereunto duly authorized.
|
|
AERCAP HOLDINGS N.V.
|
|
|
|
|
|
|
|
|
|
By:
|
/s/ Aengus Kelly
|
|
|
|
|
Name: Aengus Kelly
|
|
|
|
|
Title: Authorized Signatory
|
|
|
|
|
|
|
Date: February 26, 2016
EXHIBIT INDEX
|
99.1
|
AerCap Holdings N.V. bondholder presentation dated February 26, 2016.
|
Exhibit 99.1
AerCap Global Leader in Aviation Bondholder Presentation AerCap Holdings N.V. February, 2016

Disclaimer Incl. Forward Looking Statements & Safe Harbor This presentation contains certain statements, estimates and forecasts with respect to future performance and events. These statements, estimates and forecasts are “forward-looking statements”. In some cases, forward-looking statements can be identified by the use of forward-looking terminology such as “may,” “might,” “should,” “expect,” “plan,” “intend,” “estimate,” “anticipate,” “believe,” “predict,” “potential” or “continue” or the negatives thereof or variations thereon or similar terminology. All statements other than statements of historical fact included in this presentation are forward-looking statements and are based on various underlying assumptions and expectations and are subject to known and unknown risks, uncertainties and assumptions and may include projections of our future financial performance based on our growth strategies and anticipated trends in our business. These statements are only predictions based on our current expectations and projections about future events. There are important factors that could cause our actual results, level of activity, performance or achievements to differ materially from the results, level of activity, performance or achievements expressed or implied in the forward-looking statements. As a result, we cannot assure you that the forward-looking statements included in this presentation will prove to be accurate or correct. In light of these risks, uncertainties and assumptions, the future performance or events described in the forward-looking statements in this presentation might not occur. Accordingly, you should not rely upon forward-looking statements as a prediction of actual results and we do not assume any responsibility for the accuracy or completeness of any of these forward-looking statements. Except as required by applicable law, we do not undertake any obligation to, and will not, update any forward-looking statements, whether as a result of new information, future events or otherwise. No warranty or representation is given concerning such information, which must not be taken as establishing any contractual or other commitment binding upon AerCap Holdings N.V. or any of its subsidiaries or associated companies. In addition to presenting financial results in conformity with U.S. generally accepted accounting principles (“GAAP”), this presentation includes certain non-GAAP financial measures. Reconciliations of such non-GAAP financial measures are set forth or referred to in the presentation where relevant. Non-GAAP financial measures should be considered in addition to, not as a substitute for or superior to, financial measures determined in conformity with GAAP.

AerCap Investment Case AerCap is the largest and most profitable aircraft lessor Strong and resilient industry fundamentals Global and efficient platform with high quality, diversified and transferrable assets Stable fleet utilization through all economic cycles Stable and durable cash flows with revenue line booked well into the future Strong balance sheet, liquidity and access to capital Hedging strategies to mitigate risk Highly experienced management team with deep industry expertise

Strategic Initiatives Update 2015 was AerCap’s most successful year ever We have exceeded all financial and integration targets set at announcement of ILFC acquisition Record level of 359 lease and sale transactions completed, including ~100 widebody aircraft transactions Over $1.7 billion of asset sales executed in 2015, almost double the original plan Debt/equity ratio of 2.9 to 1 as of 4Q 2015, within our targeted range of 2.7 - 3.0 to 1 Record liquidity of $9.2 billion as of December 31, 2015 Continued strong access to funding, with $1.9 billion raised since December at an average cost of ~3.6% AerCap’s financial and operating performance remains very strong
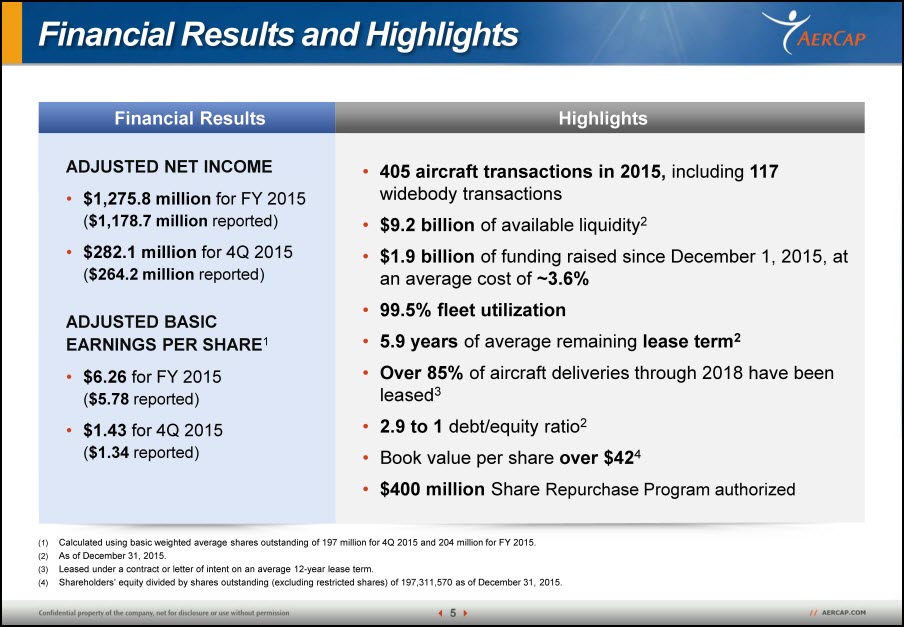
Financial Results and Highlights Financial Results ADJUSTED NET INCOME $1,275.8 million for FY 2015 ($1,178.7 million reported) $282.1 million for 4Q 2015 ($264.2 million reported) ADJUSTED BASIC EARNINGS PER SHARE1 $6.26 for FY 2015 ($5.78 reported) $1.43 for 4Q 2015 ($1.34 reported) Highlights 405 aircraft transactions in 2015, including 117 widebody transactions $9.2 billion of available liquidity2 $1.9 billion of funding raised since December 1, 2015, at an average cost of ~3.6% 99.5% fleet utilization 5.9 years of average remaining lease term2 Over 85% of aircraft deliveries through 2018 have been leased3 2.9 to 1 debt/equity ratio2 Book value per share over $424 $400 million Share Repurchase Program authorized (1) Calculated using basic weighted average shares outstanding of 197 million for 4Q 2015 and 204 million for FY 2015. (2) As of December 31, 2015. (3) Leased under a contract or letter of intent on an average 12-year lease term. (4) Shareholders’ equity divided by shares outstanding (excluding restricted shares) of 197,311,570 as of December 31, 2015.

Market Concerns vs. Reality CONCERN Low oil prices diminishing value of orderbook China & other emerging markets Declining widebody aircraft values Availability of credit REALITY Stable new aircraft placements Robust traffic growth in most markets Stable demand for most widebodies Closed 2015 with record liquidity

Low Oil Prices Low oil prices are unequivocally good for aircraft leasing companies Airlines Continue to Demand New Aircraft Despite Low Fuel Environment Low oil prices boost airlines’ profitability and credit quality as fuel is one of their largest costs Airlines are passing along benefits to consumers via lower fares, driving higher traffic Airlines’ long-term fleet planning unaffected by short-term oil price volatility Fuel-efficient aircraft are the only way airlines can hedge against higher oil prices over the long term

China & Other Emerging Markets AerCap continues to place aircraft on favorable terms across the globe China Remains a Strong Market for AerCap Despite slower GDP growth, demand for air travel remains strong as China shifts toward consumer-based economy 10.9% traffic growth (RPKs) in 20151 Chinese airlines remain solidly profitable Over next 5 years, China domestic passenger traffic is expected to grow 8.6% annually1 Global Traffic Remains Healthy Strong overall global traffic growth 6.5% in 2015 and 6.9% expected in 20161 South America2 represents less than 5% of AerCap’s overall 2015 lease revenue, Brazil represents less than 1% Strong demand for used aircraft in the U.S. and Europe is absorbing the excess EM capacity Reduced exposure to Russia by 32 aircraft since 1H 2014 (1) Source: IATA. (2) Includes Argentina, Bolivia, Brazil, Chile, Colombia, and Ecuador.

China Growth Despite a slowing economy and volatile stock market, Chinese passenger growth remains robust China’s Real GDP Growth1 China’s Domestic Traffic Growth (RPK)2 Shanghai Stock Exchange Index3 (1) Source: IMF. (2) Source: IATA. (3) Source: Bloomberg (SHCOMP Index).

Track Record of Widebody Placement AerCap platform continues to successfully place widebody aircraft REMARKETING OF USED WIDEBODY AIRCRAFT IS WELL UNDER WAY Scheduled expiries (Dec. 31, 2014) Releases / Extensions1 Sales Planned Part-outs Current Placement Requirement 83% of expiries through 2017 have already been placed2 AerCap leased or sold ~100 widebody aircraft in 2015 Since September 2015, we have sold 6 Boeing 777- 200ERs with an average age of ~13 years for an average price of ~$50 million, all at a gain3 Demand for widebody aircraft remains strong; we have entered into LOIs or contracts for 15 Boeing 777 aircraft with 4 different airlines in the past 60 days Our conversion rate from LOI to contract is over 90% (1) Released or extended either under a lease or letter of intent as of February 15, 2016. (2) Either released, extended, sold or to be parted-out. (3) Includes disposals either executed, under a sale agreement or under a letter of intent as of February 15, 2016.

Operating Update

Consistent Margins Since 2007, AerCap has grown its assets ten-fold with consistent 12% annual average EPS1 growth through all economic cycles (1) 2007 Adjusted Basic EPS: $2.48; 2015 Adjusted Basic EPS: $6.26.

Consistent Fleet Utilization AerCap has achieved stable fleet utilization through all economic cycles
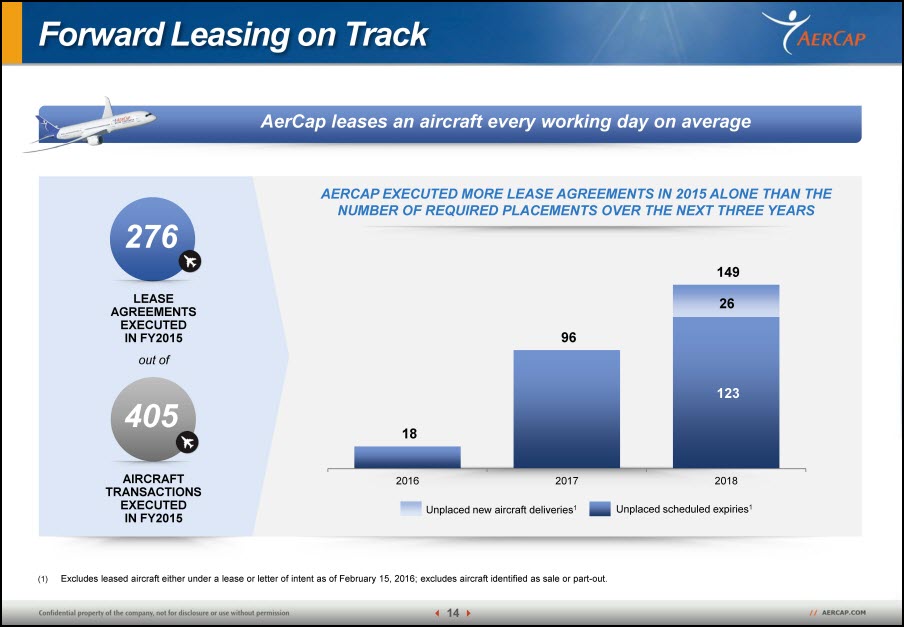
Forward Leasing on Track AerCap leases an aircraft every working day on average 276 Lease Agreements Executed in FY2015 out of 405 Aircraft Transactions Executed in FY2015 AERCAP EXECUTED MORE LEASE AGREEMENTS IN 2015 ALONE THAN THE NUMBER OF REQUIRED PLACEMENTS OVER THE NEXT THREE YEARS Unplaced new aircraft deliveries1 Unplaced scheduled expiries1 (1) Excludes leased aircraft either under a lease or letter of intent as of February 15, 2016; excludes aircraft identified as sale or part-out.
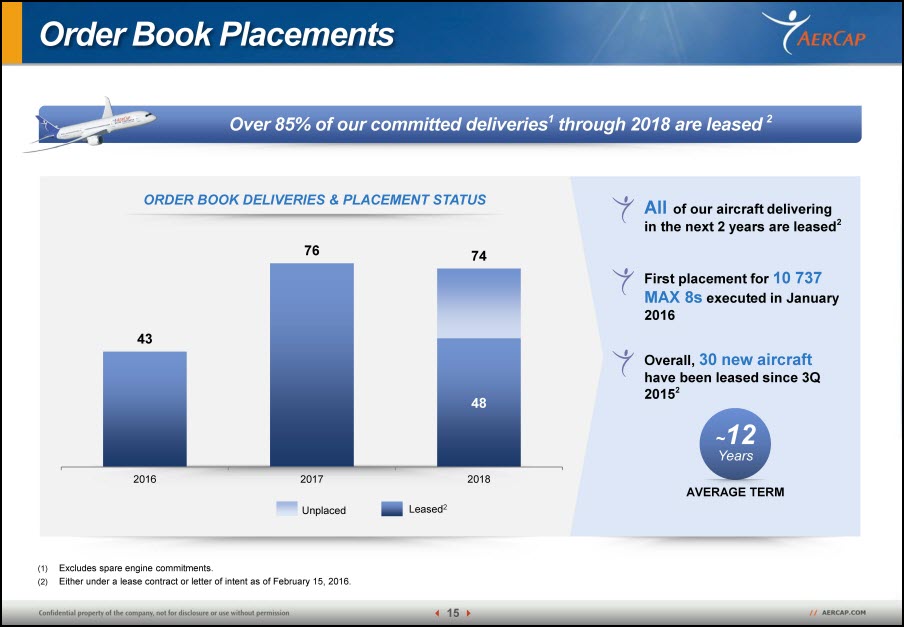
Order Book Placements Over 85% of our committed deliveries1 through 2018 are leased2 ORDER BOOK DELIVERIES & PLACEMENT STATUS All of our aircraft delivering in the next 2 years are leased2 First placement for 10 737 MAX 8s executed in January 2016 Overall, 30 new aircraft have been leased since 3Q 20152 (1) Excludes spare engine commitments. (2) Either under a lease contract or letter of intent as of February 15, 2016.

Trading Update Proven track record of active portfolio management ACTIVE TRADING OF BOTH OWNED AND MANAGED FLEET 438 aircraft sold and parted-out since 2006 Profitably managing aircraft through their lifecycle Average gain of ~$1.7 million per aircraft on owned aircraft sales and part-outs since 2006 Average age of aircraft sold ~14 years since 2006 AERCAP CONTINUED TO GENERATE SUSBTANTIAL GAIN ON SALES OF AIRCRAFT THROUGHOUT 2015 FY2015 Performance1 On average, aircraft sold in 2015 were over 15 years old (1) Pre-tax gain on sale of assets and part-outs (owned fleet).

Receivables Trend AerCap continues to closely manage receivables Increase in arrears during September mainly attributable to Transaero - all 10 aircraft have been recovered and have already been leased or sold In spite of currency pressures in other emerging market economies, we have not seen any impact on payment punctuality

Investment Grade Capital Management AerCap remains committed to conservative capital management Metric AerCap Targets Debt maturities Continue to align debt maturities with operating cash flows Liquidity Maintain strong liquidity position at ≥1.2x sources to uses - investment grade standard Maintain access to diverse sources of funding Available liquidity of over $9 billion as of December 31, 2015. Since the announcement of the ILFC transaction ~$20 billion of funding has been raised Debt mix Targeting conservative secured/unsecured debt mix Secured debt is 28% of total assets as of December 31, 2015 – investment grade standard Leverage Commitment to deleveraging – targeted debt to equity range: ~2.7-3.0 to 1 Ratio of 2.9 to 1 as of December 31, 2015 – investment grade standard Hedging Hedge ~100% of interest rate risk Capex Manageable capital expenditures of ~$5 billion per annum on average over the next three years for deliveries of contracted new aircraft Portfolio mix Targeted sales of ~$1 billion of aircraft per annum, exceeded in 2015 for the second consecutive year; annual depreciation of ~$2 billion

Capital and Liquidity Initiatives Secured and unsecured markets are AerCap’s key sources for accessing capital $7.3 BILLION OF FUNDING COMPLETED IN 2015, including: $1.0 billion Senior Unsecured Notes Issued upsized from $800 million $1.0 billion Senior Unsecured Notes Issued upsized from $400 million ~$2.0 billion New Secured Credit Facilities for 54 new & used aircraft ~$0.9 billion Upsize of Existing Revolvers and LCs ~$1.9 billion Refinancing of Existing Secured Term Loans $0.5 billion New Junior Subordinated Notes RECORD AVAILABLE LIQUIDITY: $9.2 billion of available liquidity as of December 31, 2015 Total sources of liquidity cover debt repayments and capital commitments for the next ~18 months $1.9 billion of funding raised since December at an average cost of ~3.6%

Strong Liquidity Position Record liquidity of $9.2 billion demonstrates AerCap’s strong access to capital CONSISTENT COMMITMENT TO LIQUIDITY Available Liquidity Sources to Uses1 Coverage Target (1) Total sources compared to next 12 months’ contractual obligations. Sources do not assume any additional financing for deliveries of new aircraft. Total sources of liquidity cover debt repayments and capital commitments for the next ~18 months Strong access to capital at attractive rates Raised $1.9 billion of funding since December 1, 2015 at blended cost of ~3.6 %

Cash ($ million) 2015 2014 Cash and Cash Equivalents as of December 31 (excl. restricted cash) 2,403.1 1,490.4 Total Cash Balance as of December 31 (incl. restricted cash) 2,822.5 2,207.8 Operating Cash Flow for the Full Year 3,360.0 2,313.7 Operating Cash Flow for the Fourth Quarter 953.8 839.7 Annual run-rate for operating cash flow is over $3 billion

Capital Structure Summary 4Q 2015 4Q 2014 Average Cost of Debt (including all fees)1 3.7% 3.6% Debt / Equity Ratio 2.9 to 1 3.4 to 1 Debt/Equity Calculation ($ million) 4Q 2015 4Q 2014 Debt at Quarter-End (incl. fair value adjustments) 29,807 30,402 Adjusted for: Unrestricted cash & cash equivalents (2,403) (1,490) 50% equity credit for long-term subordinated debt2 (750) (500) Adjusted Debt at Quarter-End 26,654 28,412 Equity at Quarter-End 8,426 7,943 Adjusted for: 50% equity credit for long-term subordinated debt2 750 500 Adjusted Equity at Quarter-End 9,176 8,443 (1) Interest expense divided by average debt balance, excluding mark-to-market on interest rate caps and swaps. Our average cost of debt increased resulting from the repayment of older ILFC debt which was fair-valued at lower rates because of the shorter remaining tenor of the debt at the time of the acquisition. (2) Please refer to Note 12 – Debt in our quarterly report on Form 6-K for the second quarter ended June 30, 2015, filed with the SEC on August 18, 2015.

Q&A

Supplemental Information

Executed 405 Aircraft Transactions – Full Year 2015 AerCap continues to lease or sell an aircraft on average every 24 hours, consisting of two widebody and five narrowbody aircraft transactions per week 276 LEASE AGREEMENTS EXECUTED including: 71 widebody and 205 narrowbody aircraft 46 AIRCRAFT PURCHASED 83 AIRCRAFT DISPOSED Sale or part-out: 68 from our owned portfolio 15 from our managed portfolio

Aircraft Type Leases Signed Sales Executed Airbus A320 Family 104 22 Airbus A320neo Family 25 - Airbus A330 35 7 Airbus A340 3 5 Boeing 737NG 68 5 Boeing 737Classic 6 12 Boeing 747 3 5 Boeing 757 2 15 Boeing 767 14 3 Boeing 777 6 5 Boeing 787 9 2 Other 1 2 Total 276 83
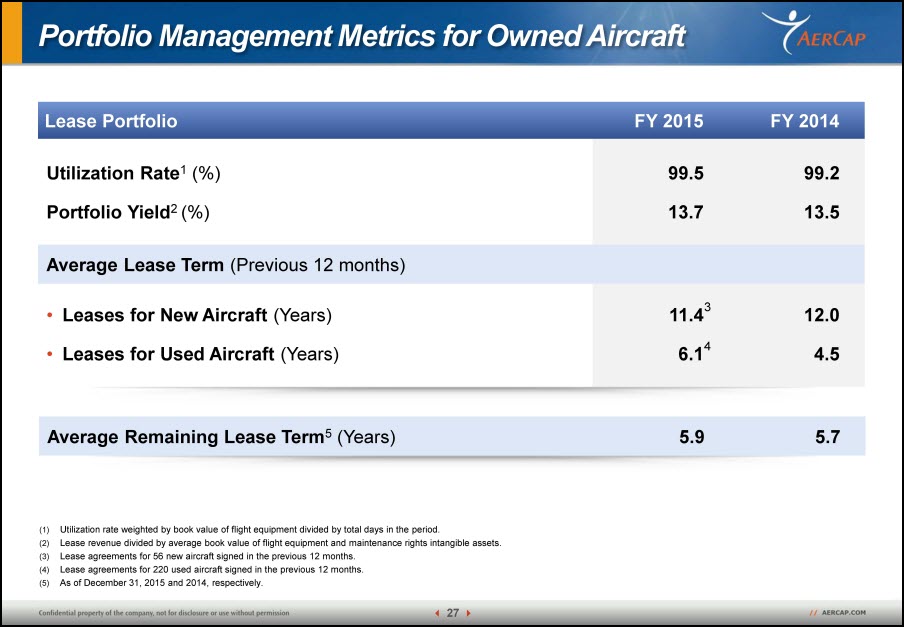
Lease Portfolio FY 2015 FY 2014 Utilization Rate1 (%) 99.5 99.2 Portfolio Yield2 (%) 13.7 13.5 Average Lease Term (Previous 12 months) Leases for New Aircraft (Years) 11.43 12.0 Leases for Used Aircraft (Years) 6.14 4.5 Average Remaining Lease Term5 (Years) 5.9 5.7 (1) Utilization rate weighted by book value of flight equipment divided by total days in the period. (2) Lease revenue divided by average book value of flight equipment and maintenance rights intangible assets. (3) Lease agreements for 56 new aircraft signed in the previous 12 months. (4) Lease agreements for 220 used aircraft signed in the previous 12 months. (5) As of December 31, 2015 and 2014, respectively.

AerCap’s Platform Capabilities AerCap has executed 468 leases over the past 18 months, approx. 26 each month 355 narrowbody aircraft leases ~57% extensions1 113 widebody aircraft leases ~66% extensions1 (1) Extension rate on existing leases.

High Quality and Well Diversified Portfolio as of December 31, 2015 Aircraft Type Number of Owned Aircraft1 % Net Book Value Number of Managed & AerDragon Aircraft Aircraft on Order2 Total Aircraft Airbus A319 137 7 11 - 148 Airbus A320 231 15 32 - 263 Airbus A320neo Family - - - 209 209 Airbus A321 97 7 14 - 111 Airbus A330 115 15 13 - 128 Airbus A350 2 1 - 27 29 Boeing 737NG 319 28 43 1 363 Boeing 737MAX - - - 109 109 Boeing 767 43 1 - - 43 Boeing 777-200ER 34 5 4 - 38 Boeing 777-300 / 300ER 32 8 3 - 35 Boeing 787 31 11 - 51 82 Embraer E190 / 195-E2 - - - 50 50 Other 68 2 21 - 89 Total 1,109 100 141 447 1,697 Average age of owned aircraft fleet is 7.7 years Average remaining lease term is 5.9 years (1) Excluding AeroTurbine which owned four aircraft. (2) Excludes spare engine commitments.

AerCap La Touche House IFSC Dublin 1, Ireland +353 1 819 2010 [email protected]
Serious News for Serious Traders! Try StreetInsider.com Premium Free!
You May Also Be Interested In
- AerCap Holdings N.V. Announces Expiration of Registered Exchange Offer for 6.450% Senior Notes due 2027
- ROSEN, RECOGNIZED INVESTOR COUNSEL, Encourages CI&T Inc Investors to Inquire About Securities Class Action Investigation – CINT
- TabaPay to Acquire the Assets of Synapse Financial Technologies, Inc.
Create E-mail Alert Related Categories
SEC FilingsSign up for StreetInsider Free!
Receive full access to all new and archived articles, unlimited portfolio tracking, e-mail alerts, custom newswires and RSS feeds - and more!
