

Form 6-K AU OPTRONICS CORP For: Jan 28
 Tweet
Tweet Share
ShareFORM 6-K
SECURITIES AND EXCHANGE COMMISSION
Washington, D.C. 20549
Report of Foreign Private Issuer
Pursuant to Rule 13a-16 or 15d-16
of the Securities Exchange Act of 1934
January 28, 2016
| Commission File Number | 001-31335 |
| . |
| AU Optronics Corp. |
| (Translation of registrant’s name into English) |
| No. 1 Li-Hsin Road 2 |
| Hsinchu Science Park |
| Hsinchu, Taiwan |
| (Address of principal executive offices) |
Indicate by check mark whether the registrant files or will file annual reports under cover Form 20-F or Form 40-F.
| Form 20-F X Form 40-F ___ |
Indicate by check mark if the registrant is submitting the Form 6-K in paper as permitted by Regulation S-T Rule 101(b)(1):
____
Note: Regulation S-T Rule 101(b)(1) only permits the submission in paper of a Form 6-K if submitted solely to provide an attached annual report to security holders.
Indicate by check mark if the registrant is submitting the Form 6-K in paper as permitted by Regulation S-T Rule 101(b)(7):
____
Note: Regulation S-T Rule 101(b)(7) only permits the submission in paper of a Form 6-K if submitted to furnish a report or other document that the registrant foreign private issuer must furnish and make public under the laws of the
jurisdiction in which the registrant is incorporated, domiciled or legally organized (the registrant's "home country"), or under the rules of the home country exchange on which the registrant's securities are traded, as long as the report or other document is not a press release, is not required to be and has not been distributed to the registrant's security holders, and, if discussing a material event, has already been the subject of a Form 6-K submission or other Commission filing on EDGAR.
Indicate by check mark whether by furnishing the information contained in this Form, the registrant is also thereby furnishing the information to the Commission pursuant to Rule 12g3-2(b) under the Securities Exchange Act of 1934.
Yes ..... No ..X...
If "Yes" is marked, indicate below the file number assigned to the registrant in connection with Rule 12g3-2(b):
Not applicable
INDEX TO EXHIBITS
Item
| 1. | Press release entitled, “AU Optronics Corp. Reports Fourth Quarter 2015 Financial Results” dated January 28, 2016. |
| 2. | Investor Conference Materials entitled, “AU Optronics Corp. Fourth Quarter 2015 Results”, dated January 28, 2016. |
Signatures
Pursuant to the requirements of the Securities Exchange Act of 1934, the registrant has duly caused this report to be signed on its behalf by the undersigned, thereunto duly authorized.
| AU Optronics Corp. | ||||
| Date: January 28, 2016 | By: | /s/ Andy Yang | ||
| Name: | Andy Yang | |||
| Title: | Chief Strategy Officer | |||
Item 1

News Release
AU Optronics Corp. Reports 2015 Full-Year Results and Third Consecutive Year of Profitability
Issued by:
AU Optronics Corp.
Issued on: January 28, 2016
Hsinchu, Taiwan, January 28, 2016–
AU Optronics Corp. ("AUO" or the "Company") (TAIEX: 2409; NYSE: AUO) today held its investor conference and announced its unaudited consolidated financial results for the fourth quarter and fiscal year of 2015(1).
Consolidated revenues in the fourth quarter of 2015 were NT$83.44 billion, down 6.6% from the previous quarter. Gross profit was NT$4.49 billion, with gross margin of 5.4%. Operating loss was NT$1.17 billion, with the operating margin of -1.4%. AUO’s net loss for the fourth quarter of 2015 was NT$8.24 billion. Net loss attributable to owners of the Company was NT$8.18 billion, with a basic EPS(2) of -NT$0.85.
For the fiscal year of 2015, unaudited consolidated revenues totaled NT$360.35 billion, a decrease of 11.7% year-over-year. Net profit was NT$4.84 billion, with a basic EPS(2) of NT$0.51.
In the fourth quarter of 2015, large-sized panel(3) shipments reached around 27.61 million units, increased by 4.8% quarter-over-quarter. Shipments of small-and-medium-sized panels in the same quarter exceeded 33.41 million units, down by 31.4% quarter-over-quarter. For the full year of 2015, large-sized panel shipments exceeded 105.65 million units, a decrease of 9.6% from the previous year. Small and medium-sized panel shipments totaled around 172.81 million units, up by 1.2% year-over-year.
AUO’s unaudited consolidated results for the fourth quarter of 2015 were highlighted as below:
| Ÿ | Revenues of NT$83.44 billion |
| Ÿ | Net loss of NT$8.24 billion |
| Ÿ | Basic EPS(2) of -NT$0.85 |
| Ÿ | Gross margin was 5.4% |
| Ÿ | Operating margin was -1.4% |
| Ÿ | EBITDA(4) margin was 11.2% |
| Ÿ | Operating margin of Display Segment was -1.0% |
| Ÿ | EBITDA(4) margin of Display Segment was 11.8% |
AUO’s unaudited consolidated results for the fiscal year of 2015 were highlighted as below:
| Ÿ | Revenues of NT$360.35 billion |
| Ÿ | Net profit of NT$4.84 billion |
| Ÿ | Basic EPS(2) of NT$0.51 |
| Ÿ | Gross margin was11.1% |
| Ÿ | Operating margin was 4.9% |
| Ÿ | EBITDA(4) margin was 18.1% |
| Ÿ | Operating margin of Display Segment was 5.8% |
| Ÿ | EBITDA(4) margin of Display Segment was 19.2% |
Looking back to the fourth quarter, the Company's loss came mainly from non-operating items. Among which, M.Setek, a subsidiary of AUO, conducted a one-time impairment of all of its plants and equipments associated with polysilicon production and recognized associated asset impairment charge of around NT$6.75 billion. For the core operations, as the fourth quarter was the traditional slow season, AUO’s revenue decreased by 6.6% from the previous quarter, and operating loss came in at NT$1.17 billion. Nevertheless, in terms of the full year of 2015, AUO tackled the challenges posed by macroeconomic uncertainties and was able to perform quite well by progressing firmly and steadily. AUO's operating and EBITDA(4) margins for the year of 2015 remained at 4.9% and 18.1%, respectively. Furthermore, the Company's interest-bearing debt level has been significantly decreased by NT$33.45 billion in 2015. As of the end of the fourth quarter, the Company's net debt to equity ratio was lowered to 14.8%, again the lowest since 2009.
Over the past few years, AUO has proactively adjusted its business structure to substantially lower its financial burdens and to significantly improve its soundness of the operations. Looking forward to the future, by leveraging its solid foundations, the Company hopes to be more well prepared in the face of the fierce industry competition. Meanwhile, led by its professional management team, the Company looks forward to
extending its strengths and developing new growth momentum to elevate its operating performance.
(1) All financial information was unaudited and was prepared by the Company in accordance with Taiwan IFRS.
(2) Basic EPS in the fourth quarter and the fiscal year of 2015 were calculated based on the weighted average outstanding shares of the fiscal year of 2015 (9,624 million shares).
(3) Large size refers to panels that are 10 inches and above in diagonal measurement.
(4) EBITDA = Operating Profit + D&A, that is, operating profit before depreciation and amortization.
###
ABOUT AU OPTRONICS
AU Optronics Corp. (AUO) is one of the world’s leading providers of optoelectronic solutions. AUO offers a full range of panel sizes and comprehensive applications ranging from 1.2 inches to 85 inches. Based on its profound R&D and manufacturing experience, AUO continues to develop advanced display technologies of the next generation. AUO extended its market to the green energy industry in 2008. By building a vertically integrated high-efficiency solar value chain, AUO provides its customers with high-efficiency solar solutions. AUO currently has global operations in Taiwan, Mainland China, the U.S., Japan, South Korea, Singapore, the Netherlands, Czech and Slovakia. Additionally, AUO is the first pure TFT-LCD manufacturer to be successfully listed at the New York Stock Exchange (NYSE). AUO has also been named to Dow Jones Sustainability World Index from 2010 to 2015. AUO generated consolidated revenues of NT$360.35 billion in 2015. For more information, please visit AUO.com.
Safe Harbour Notice
AU Optronics Corp. (“AUO” or the “Company”) (TAIEX: 2409; NYSE: AUO), a global leader of TFT-LCD panels, today announced the above news. Except for statements in respect of historical matters, the statements contained in this Release are “forward-looking statements” within the meaning of Section 27A of the U.S. Securities Act of 1933 and Section 21E of the U.S. Securities Exchange Act of 1934. These forward-looking statements were based on our management's expectations, projections and beliefs at the time regarding matters including, among other things, future revenues and costs, financial performance, technology changes, capacity, utilization rates, yields, process and geographical diversification, future expansion plans and business strategy. Such forward looking statements are subject to a number of known and unknown risks and uncertainties that can cause actual results to differ materially from those expressed or implied by such statements, including risks related to the pace of development of the flat panel display industry and the solar industry, the growth in demand in those markets, acceptance of and demand for our products, technological and development risks, competitive factors, and other risks described in the section entitled "Risk Factors" in our Form 20-F filed with the United States Securities and Exchange Commission on March 24th, 2015.
For more information, please contact:
| Gwen Ting | Jessie Lee |
| Corporate Communications Division | Corporate Communications Division |
| AU Optronics Corp. | AU Optronics Corp. |
| Tel: +886-3-5008800 ext 7259 | Tel: +886-3-5008800 ext 3206 |
| Fax: +886-3-5772730 | Fax: +886-3-5772730 |
| Email: [email protected] | Email : [email protected] |
Item 2
AU Optronics Corp.
Fourth Quarter 2015 Results Investor Conference
友達光電
2015年第四季法人說明會
Jan. 28, 2016

Safe Harbor Notice
The statements included in this presentation that are not historical in nature are “forward-looking statements” within the meaning of Section 27A of the United States Securities Act of 1933 and Section 21E of the United States Securities Exchange Act of 1934. These forward-looking statements, which may include statements regarding AU Optronics’ future results of operations, financial condition or business prospects, are subject to significant risks and uncertainties and are based on AU Optronics’ current expectations.
Actual results may differ materially from those expressed or implied in these forward-looking statements for a variety of reasons, including, among other things: the cyclical nature of our industry; our dependence on introducing new products on a timely basis; our dependence on growth in the demand for our products; our ability to compete effectively; our ability to successfully expand our capacity; our dependence on key personnel; general economic and political conditions, including those related to the TFT-LCD industry; possible disruptions in commercial activities caused by natural and human-induced disasters, including terrorist activity and armed conflict; and fluctuations in foreign currency exchange rates.
Beginning on January 1, 2013, we have adopted the International Financial Reporting Standards as issued by the International Accounting Standards Board (“IFRS”) to the extent endorsed by the ROC Financial Supervisory Commission (“FSC”) (“Taiwan IFRS”) for reporting our annual and interim consolidated financial statements in the ROC in accordance with the requirements of the FSC. All financial information contained herewithin is presented in conformity with Taiwan IFRS. Readers should be cautioned that Taiwan IFRS differs in many material respects from IFRS including to the extent that any new or amended standards or interpretations applicable under IFRS may not be timely endorsed by the FSC.
Our release of financial forecasts and forward-looking statements at any particular time does not create any duty of disclosure beyond that which is imposed by law, and we expressly disclaim any obligation to publicly update or revise any forecasts or forward-looking statements, whether as a result of new information, future events or otherwise.
© 2015 AU Optronics Corporation – Proprietary and Confidential 2
Statement of Comprehensive Income
Selected Items from Statement of Comprehensive Income
Amount : NT$ Million
4Q15 3Q15 QoQ % 4Q14 Net Sales 83,442 100.0% 89,299 100.0% (6.6%) 105,449 100.0% Cost of Goods Sold (78,954) (94.6%) (80,151) (89.8%) (1.5%) (89,828) (85.2%) Gross Profit 4,489 5.4% 9,148 10.2% (50.9%) 15,621 14.8% Operating Expenses (5,659) (6.8%) (5,755) (6.4%) (1.7%) (6,798) (6.4%) Operating Profit (Loss) (1,171) (1.4%) 3,393 3.8% - 8,823 8.4% Net Non-operating Income(Expenses) (6,859) (8.2%) 515 0.6% - (890) (0.8%) Profit (Loss) before Tax (8,030) (9.6%) 3,909 4.4% - 7,933 7.5% Net Profit (Loss) (8,239) (9.9%) 3,379 3.8% - 6,575 6.2% Attributable to: Owners of Company (8,182) (9.8%) 3,463 3.9% - 6,004 5.7% Non-controlling Interests (58) (0.1%) (84) (0.1%) (31.1%) 571 0.5% Net Profit (Loss) (8,239) (9.9%) 3,379 3.8% - 6,575 6.2% Basic EPS (NT$)(a) (0.85) 0.36 - 0.62 Operating Profit + D&A 9,371 11.2% 14,872 16.7% (37.0%) 22,339 21.2% Display Segment Information: Net Sales 76,129 100.0% 82,236 100.0% (7.4%) 99,385 100.0% Operating Profit (Loss) (735) (1.0%) 3,615 4.4% - 9,225 9.3% Operating Profit + D&A 9,019 11.8% 14,372 17.5% (37.2%) 21,831 22.0% Unit Shipments (mn)(b) Large Size Panels 27.6 26.3 4.8% 29.4 Small & Medium Size Panels 33.4 48.7 (31.4%) 42.7
– Unaudited, prepared by AUO based on Taiwan IFRS
a) Basic EPS in both 4Q15 and 3Q15 were calculated based on the weighted average outstanding shares of 2015 (9,624m shares); Basic EPS in 4Q14 was calculated based on the weighted average outstanding shares of 2014 (9,624m shares).
b) Large size refers to panels that are 10 inches and above
| © 2015 AU Optronics Corporation – Proprietary and Confidential | 3 |
Statement of Comprehensive Income
Selected Items from Statement of Comprehensive Income
Amount : NT$ Million FY 2015 FY 2014 YoY % Net Sales 360,346 100 .0% 408,179 100 .0% (11.7%) Cost of Goods Sold (320,509) (88.9%) (359,668) (88.1%) (10.9%) Gross Profit 39,837 11 .1% 48,511 11 .9% (17.9%) Operating Expenses (22,316) (6.2%) (26,345) (6.5%) (15.3%) Operating Profit 17,521 4 .9% 22,165 5 .4% (21.0%) Net Non-operating Expenses (9,922) (2.8%) (2,185) (0.5%) 354.1% Profit before Tax 7,599 2 .1% 19,980 4 .9% (62.0%) Net Profit 4,843 1 .3% 18,065 4 .4% (73.2%) Attributable to: Owners of Company 4,932 1.4% 17,628 4.3% (72.0%) Non-controlling Interests (89) (0.0%) 436 0.1% - Net Profit 4,843 1 .3% 18,065 4 .4% (73.2%) Basic EPS (NT$)(a) 0.51 1.83 (72.0%) Operating Profit + D&A 65,267 18 .1% 79,068 19 .4% (17.5%) ROE(b) 2.7% 10.2% (73.4%) Display Segment Information: Net Sales 333,392 100.0% 384,335 100.0% (13.3%) Operating Profit 19,226 5.8% 24,423 6.4% (21.3%) Operating Profit + D&A 64,016 19.2% 77,574 20.2% (17.5%) Unit Shipments (mn)(c) Large Size Panels 105.7 116.9 (9.6%) Small & Medium Size Panels 172.8 170.7 1.2%
– Unaudited, prepared by AUO based on Taiwan IFRS
a) Basic EPS in both 2015 and 2014 were calculated based on the weighted average outstanding shares of 9,624m shares.
b) ROE was based on average equity attributable to shareholders of the parent company
c) Large size refers to panels that are 10 inches and above
© 2015 AU Optronics Corporation – Proprietary and Confidential 4

Consolidated Balance Sheet Highlights
Amount : NT$ Million 4Q15 3Q15 QoQ % 4Q14 Cash & ST Investment(a) 78,881 76,915 2.6% 81,965 Inventory 31,796 38,099 (16.5%) 36,420 Short Term Debt( b ) 40,701 51,093 (20.3%) 56,998 Long Term Debt 68,537 68,008 0.8% 85,689 Equity 204,636 214,107 (4.4%) 200,370 Total Assets 425,554 450,168 (5.5%) 469,860 Inventory Turnover (Days)( c) 40 43 36 Net Debt to Equity(d) 14.8% 19.7% 30.3%
– Unaudited, prepared by AUO based on Taiwan IFRS
a) Excluding time deposit with maturity longer than 3 months (NT$9,998m in 4Q15 , NT$15,262m in 3Q15, and NT$2,100m in 4Q14)
b) Short term debt refers to all interest bearing debt maturing within one year
c) Calculated by dividing the average inventory into the annualized cost of goods sold during such period, then multiplying by 365 days
d) Net Debt to Equity = (Short Term Debt + Long Term Debt - Cash and ST Investment) / Equity
© 2015 AU Optronics Corporation – Proprietary and Confidential 5
Consolidated Cash Flow Highlights
Amount : NT$ Million 4Q15 3Q15 QoQ From Operating Activities 25,318 8,029 17,289 Profit (Loss) before Tax (8,030) 3,909 (11,939) Depreciation & Amortization 10,542 11,478 (936) Net Change in Working Capital 16,857 (9,069) 25,925 From Investing Activities (13,039) (9,607) (3,431) Capital Expenditure (13,936) (9,326) (4,610) From Financing Activities (10,112) (12,350) 2,238 Net Change in Debt (9,685) (12,908) 3,223 Net Change in Cash( a) 1,965 (12,839) 14,804
– Unaudited, prepared by AUO based on Taiwan IFRS
a) In addition to cash generated from operating, investing and financing activities, net change in cash also include effect on currency exchange of foreign subsidiaries
© 2015 AU Optronics Corporation – Proprietary and Confidential 6

Display Revenue Breakdown by Application
100%
80% 46% 45% 48% 49% 49% 60% 15% 16% 14% 14% 14% 40% 18% 18% 14% 14% 17% 20% 9% 8% 9% 6% 6% 12% 13% 15% 17% 14% 0% 4Q14 1Q15 2Q15 3Q15 4Q15
– Unaudited, prepared by AUO based on Taiwan IFRS
– Mobile PC : including Notebook and Tablet displays
– Mobile Device : including displays for mobile phones and other related products
– Commercial and Others: including displays for automobile, industrial PC, ATM, point of sale (POS), pachinko, and etc.
© 2015 AU Optronics Corporation – Proprietary and Confidential 7
TV Monitor Mobile PC Mobile Device Commercial and Others
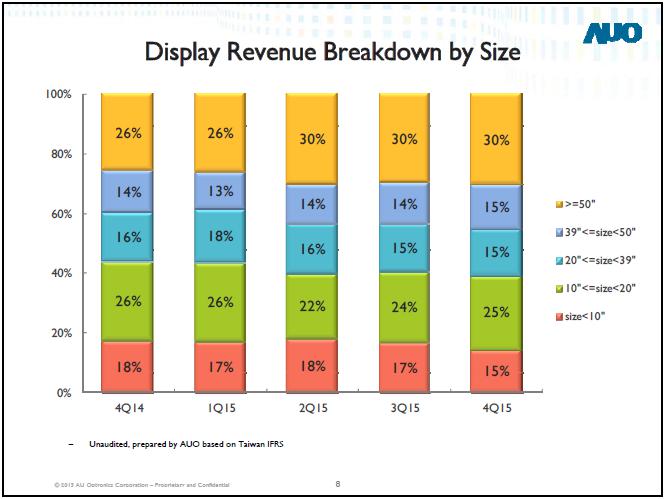
Display Revenue Breakdown by Size
100%
26% 26% 30% 30% 30% 80% 14% 13% 14% 14% 15% >=50" 60% 16% 18% 16% 15% 15% 39"<=size<50" 20"<=size<39" 40% 26% 26% 10"<=size<20" 22% 24% 25% size<10" 20% 18% 17% 18% 17% 15% 0% 4Q14 1Q15 2Q15 3Q15 4Q15
– Unaudited, prepared by AUO based on Taiwan IFRS
© 2015 AU Optronics Corporation – Proprietary and Confidential 8

Consolidated Shipments & ASP by Area
Shipments in square meter ASP per square meter (K m2) (US$) 6,000 600 $512 $534 5,000 $484 500 4,000 $442 3,000 5,717 5,874 400 $385 5,954 5,390 5,620 2,000 300 1,000 0 200 4Q14 1Q15 2Q15 3Q15 4Q15 4Q14 1Q15 2Q15 3Q15 4Q15
– Unaudited, prepared by AUO based on Taiwan IFRS
– ASP per square meter in US$ was translated from NT$ based on average exchange rates announced by Customs Administration, Ministry of Finance of each respective quarter
© 2015 AU Optronics Corporation – Proprietary and Confidential 9

Consolidated Small & Medium Panel
Shipments by Area & Revenues
Shipments in square meter Revenues (K m2) (NT$ bn) 400 20.0 17.2 300 14.9 15.3 16.0 13.6 10.8 200 12.0 354.3 365.0 315.5 318.3 8.0 256.8 100 4.0 0 0.0 4Q14 1Q15 2Q15 3Q15 4Q15 4Q14 1Q15 2Q15 3Q15 4Q15
– Unaudited, prepared by AUO based on Taiwan IFRS
– Small & Medium size refers to panels that are under 10 inches
© 2015 AU Optronics Corporation – Proprietary and Confidential 10

www.auo.com
© 2015 AU Optronics Corporation – Proprietary and Confidential 11
AU OPTRONICS CORP.
CONSOLIDATED COMPREHENSIVE INCOME STATEMENT
For the Three Months Ended December 31, 2015 and 2014 and September 30, 2015
(Expressed in Millions of New Taiwan Dollars (NTD) and US Dollars (USD) except for per share amounts and shares outstanding)
| Year over Year Comparison | Sequential Comparison | ||||||||||||||||||
| 4Q 2015 | 4Q 2014 | 4Q 2015 | 3Q 2015 | ||||||||||||||||
| USD | NTD | % | NTD | YoY% | USD | NTD | % | NTD | QoQ% | ||||||||||
| Net Sales | 2,545 | 83,442 | 100.0 | 105,449 | (20.9) | 2,545 | 83,442 | 100.0 | 89,299 | (6.6) | |||||||||
| Cost of Goods Sold | 2,408 | 78,954 | 94.6 | 89,828 | (12.1) | 2,408 | 78,954 | 94.6 | 80,151 | (1.5) | |||||||||
| Gross Profit | 137 | 4,489 | 5.4 | 15,621 | (71.3) | 137 | 4,489 | 5.4 | 9,148 | (50.9) | |||||||||
| Operating Expenses | 173 | 5,659 | 6.8 | 6,798 | (16.7) | 173 | 5,659 | 6.8 | 5,755 | (1.7) | |||||||||
| Operating Profit (Loss) | (36) | (1,171) | (1.4) | 8,823 | - | (36) | (1,171) | (1.4) | 3,393 | - | |||||||||
| Net Non-Operating Income (Expense) | (209) | (6,859) | (8.2) | (890) | 670.7 | (209) | (6,859) | (8.2) | 515 | - | |||||||||
| Profit (Loss) before Income Tax | (245) | (8,030) | (9.6) | 7,933 | - | (245) | (8,030) | (9.6) | 3,909 | - | |||||||||
| Income Tax Expense | (6) | (209) | (0.3) | (1,358) | (84.6) | (6) | (209) | (0.3) | (529) | (60.5) | |||||||||
| Net Profit (Loss) | (251) | (8,239) | (9.9) | 6,575 | - | (251) | (8,239) | (9.9) | 3,379 | - | |||||||||
| Other Comprehensive Income (Loss) | (41) | (1,353) | (1.6) | 1,854 | - | (41) | (1,353) | (1.6) | 2,566 | - | |||||||||
| Total Comprehensive Income (Loss) | (293) | (9,592) | (11.5) | 8,429 | - | (293) | (9,592) | (11.5) | 5,945 | - | |||||||||
| Net Profit Attributable to: | |||||||||||||||||||
| Owners of Company | (250) | (8,182) | (9.8) | 6,004 | - | (250) | (8,182) | (9.8) | 3,463 | - | |||||||||
| Non-controlling Interests | (2) | (58) | (0.1) | 571 | - | (2) | (58) | (0.1) | (84) | (31.1) | |||||||||
| Net Profit (Loss) | (251) | (8,239) | (9.9) | 6,575 | - | (251) | (8,239) | (9.9) | 3,379 | - | |||||||||
| Total Comprehensive Income Attributable to: | |||||||||||||||||||
| Owners of Company | (276) | (9,046) | (10.8) | 7,462 | - | (276) | (9,046) | (10.8) | 5,864 | - | |||||||||
| Non-controlling Interests | (17) | (546) | (0.7) | 967 | - | (17) | (546) | (0.7) | 82 | - | |||||||||
| Total Comprehensive Income (Loss) | (293) | (9,592) | (11.5) | 8,429 | - | (293) | (9,592) | (11.5) | 5,945 | - | |||||||||
| Basic Earnings Per Share | (0.03) | (0.85) | 0.62 | (0.03) | (0.85) | 0.36 | |||||||||||||
| Basic Earnings Per ADS(3) | (0.26) | (8.50) | 6.24 | (0.26) | (8.50) | 3.60 | |||||||||||||
| Weighted-Average Shares Outstanding ('M) | 9,624 | 9,624 | 9,624 | 9,624 | |||||||||||||||
| Note: | (1) | Unaudited, prepared by AUO based on Taiwan IFRS |
| (2) | Amounts in New Taiwan dollars were translated into US dollars at the exchange rate of NTD 32.79 per USD as of December 31, 2015 | |
| (3) | 1 ADS equals 10 common shares |
AU OPTRONICS CORP.
CONSOLIDATED INCOME STATEMENT
For the Year Ended December 31, 2015 and 2014
(Expressed in Millions of New Taiwan Dollars (NTD) and US Dollars (USD) except for per share amounts and shares outstanding)
| Year over Year Comparison | |||||||||
| 2015 | 2014 | ||||||||
| USD | NTD | % | NTD | YoY% | |||||
| Net Sales | 10,990 | 360,346 | 100.0 | 408,179 | (11.7) | ||||
| Cost of Goods Sold | 9,775 | 320,509 | 88.9 | 359,668 | (10.9) | ||||
| Gross Profit | 1,215 | 39,837 | 11.1 | 48,511 | (17.9) | ||||
| Operating Expenses | 681 | 22,316 | 6.2 | 26,345 | (15.3) | ||||
| Operating Profit | 534 | 17,521 | 4.9 | 22,165 | (21.0) | ||||
| Net Non-Operating Expenses | (303) | (9,922) | (2.8) | (2,185) | 354.1 | ||||
| Profit before Income Tax | 232 | 7,599 | 2.1 | 19,980 | (62.0) | ||||
| Income Tax Expense | (84) | (2,756) | (0.8) | (1,916) | 43.9 | ||||
| Net Profit | 148 | 4,843 | 1.3 | 18,065 | (73.2) | ||||
| Other Comprehensive Income(Loss) | (23) | (768) | (0.2) | 1,878 | - | ||||
| Total Comprehensive Income | 124 | 4,075 | 1.1 | 19,942 | (79.6) | ||||
| Net Profit Attributable to: | |||||||||
| Owners of Company | 150 | 4,932 | 1.4 | 17,628 | (72.0) | ||||
| Non-controlling Interests | (3) | (89) | (0.0) | 436 | - | ||||
| Net Profit | 148 | 4,843 | 1.3 | 18,065 | (73.2) | ||||
| Total Comprehensive Income Attributable to: | |||||||||
| Owners of Company | 148 | 4,839 | 1.3 | 19,087 | (74.6) | ||||
| Non-controlling Interests | (23) | (764) | (0.2) | 855 | - | ||||
| Total Comprehensive Income | 124 | 4,075 | 1.1 | 19,942 | (79.6) | ||||
| Basic Earnings Per Share | 0.02 | 0.51 | 1.83 | ||||||
| Basic Earnings Per ADS(3) | 0.16 | 5.12 | 18.32 | ||||||
| Weighted-Average Shares Outstanding ('M) | 9,624 | 9,624 | |||||||
| Note: | (1) | Unaudited, prepared by AUO based on Taiwan IFRS |
| (2) | Amounts in New Taiwan dollars were translated into US dollars at the exchange rate of NTD 32.79 per USD as of December 31, 2015 | |
| (3) | 1 ADS equals 10 common shares |
AU OPTRONICS CORP.
CONSOLIDATED BALANCE SHEET
December 31, 2015 and 2014
(Expressed in Millions of New Taiwan Dollars (NTD) and US Dollars (USD) )
| December 31, 2015 | December 31, 2014 | YoY | |||||||||
| ASSETS | USD | NTD | % | NTD | % | NTD | % | ||||
| Cash and Cash Equivalents | 2,406 | 78,881 | 18.5 | 81,965 | 17.4 | (3,085) | (3.8) | ||||
| Notes & Accounts Receivables | 1,063 | 34,840 | 8.2 | 59,621 | 12.7 | (24,781) | (41.6) | ||||
| Other Current Financial Assets | 364 | 11,948 | 2.8 | 3,157 | 0.7 | 8,791 | 278.4 | ||||
| Inventories | 970 | 31,796 | 7.5 | 36,420 | 7.8 | (4,625) | (12.7) | ||||
| Other Current Assets | 138 | 4,527 | 1.1 | 4,450 | 0.9 | 77 | 1.7 | ||||
| Total Current Assets | 4,940 | 161,992 | 38.1 | 185,615 | 39.5 | (23,622) | (12.7) | ||||
| Long-term Investments | 444 | 14,550 | 3.4 | 14,874 | 3.2 | (324) | (2.2) | ||||
| Net Fixed Assets | 6,367 | 208,786 | 49.1 | 231,815 | 49.3 | (23,029) | (9.9) | ||||
| Other Assets | 1,227 | 40,227 | 9.5 | 37,557 | 8.0 | 2,670 | 7.1 | ||||
| Total Assets | 12,978 | 425,554 | 100.0 | 469,860 | 100.0 | (44,305) | (9.4) | ||||
| LIABILITIES | |||||||||||
| Short-term Borrowings | 49 | 1,594 | 0.4 | 381 | 0.1 | 1,212 | 317.9 | ||||
| Accounts Payable | 1,874 | 61,443 | 14.4 | 74,881 | 15.9 | (13,438) | (17.9) | ||||
| Current Installments of Long-term Borrowings | 1,193 | 39,108 | 9.2 | 41,507 | 8.8 | (2,399) | (5.8) | ||||
| Current Installments of Bonds Payable | 0 | 0 | 0.0 | 15,110 | 3.2 | (15,110) | (100.0) | ||||
| Current Financial Liabilities | 17 | 554 | 0.1 | 233 | 0.0 | 321 | 137.7 | ||||
| Accrued Expense & Other Current Liabilities | 946 | 31,029 | 7.3 | 35,832 | 7.6 | (4,802) | (13.4) | ||||
| Machinery and Equipment Payable | 232 | 7,622 | 1.8 | 4,497 | 1.0 | 3,125 | 69.5 | ||||
| Total Current Liabilities | 4,311 | 141,349 | 33.2 | 172,440 | 36.7 | (31,091) | (18.0) | ||||
| Long-term Borrowings | 2,090 | 68,537 | 16.1 | 85,689 | 18.2 | (17,152) | (20.0) | ||||
| Non Current Financial Liabilities | 0 | 11 | 0.0 | 7 | 0.0 | 4 | 51.4 | ||||
| Other Long-term Liabilities | 336 | 11,020 | 2.6 | 11,353 | 2.4 | (333) | (2.9) | ||||
| Total Long-term Liabilities | 2,427 | 79,568 | 18 .7 | 97,049 | 20 .7 | (17,481) | (18 .0) | ||||
| Total Liabilities | 6,737 | 220,918 | 51.9 | 269,490 | 57.4 | (48,572) | (18.0) | ||||
| EQUITY | |||||||||||
| Common Stock | 2,935 | 96,242 | 22.6 | 96,242 | 20.5 | 0 | 0.0 | ||||
| Capital Surplus | 1,837 | 60,250 | 14.2 | 59,258 | 12.6 | 992 | 1.7 | ||||
| Retained Earnings | 622 | 20,407 | 4.8 | 20,529 | 4.4 | (122) | (0.6) | ||||
| Other Equity | 155 | 5,086 | 1.2 | 4,946 | 1.1 | 140 | 2.8 | ||||
| Non-Controlling Interests | 691 | 22,651 | 5.3 | 19,395 | 4.1 | 3,256 | 16.8 | ||||
| Total Equity | 6,241 | 204,636 | 48.1 | 200,370 | 42.6 | 4,266 | 2.1 | ||||
| Total Liabilities & Equity | 12,978 | 425,554 | 100.0 | 469,860 | 100.0 | (44,305) | (9.4) | ||||
| Note: | (1) | Unaudited, prepared by AUO based on Taiwan IFRS |
| (2) | Amounts in New Taiwan dollars were translated into US dollars at the exchange rate of NTD 32.79 per USD as of December 31, 2015 | |
| (3) | Cash and Cash Equivalents excluding time deposit with maturity longer than 3 months |
AU OPTRONICS CORP.
CONSOLIDATED STATEMENT OF CASH FLOW
For the Period Ended December 31, 2015 and 2014
(Expressed in Millions of New Taiwan Dollars (NTD) and US Dollars (USD))
| 2015 | 2014 | ||||
| USD | NTD | NTD | |||
| Cash Flow from Operating Activities: | |||||
| Profit before Income Taxes | 232 | 7,599 | 19,980 | ||
| Depreciation & Amortization | 1,456 | 47,746 | 56,903 | ||
| Share of Profit of Equity-Accounted Investees | (14) | (449) | (500) | ||
| Changes in Working Capital | 10 | 320 | (13,068) | ||
| Changes in Others | 207 | 6,788 | 77 | ||
| Net Cash Provided by Operating Activities | 1,891 | 62,003 | 63,393 | ||
| Cash Flow from Investing Activities: | |||||
| Acquisition of Property, Plant and Equipment | (1,020) | (33,440) | (16,971) | ||
| Proceeds from Disposal of Property, Plant and Equipment | 54 | 1,762 | 2,003 | ||
| Acquisition of Equity-Accounted Investees and Financial Assets Carried at Cost | (3) | (85) | (2,531) | ||
| Proceeds from Disposal of Equity-Accounted Investees and Financial Assets Carried at Cost | 3 | 100 | 1,148 | ||
| Decrease(Increase) in Other Financial Assets | 7 | 227 | (84) | ||
| Increase in Intangible Assets | (9) | (303) | (291) | ||
| Decrease in Other Assets | 0 | 5 | 515 | ||
| Cash Increase Resulting from Change in Consolidated Entity | 0 | 0 | 3,104 | ||
| Net Cash Used in Investing Activities | (968) | (31,735) | (13,107) | ||
| Cash Flow from Financing Activities: | |||||
| Increase(Decrease) in Short-term Borrowings | 37 | 1,212 | (3,076) | ||
| Decrease in Long-term Borrowings and Bonds Payable | (1,085) | (35,580) | (40,404) | ||
| Increase(Decrease) in Guarantee Deposits | 5 | 157 | (87) | ||
| Cash Dividends and Cash Distributed from Capital Surplus | (147) | (4,812) | (1,444) | ||
| Changes in Non-Controlling Interests and Others | 145 | 4,745 | (31) | ||
| Net Cash Used by Financing Activities | (1,045) | (34,277) | (45,041) | ||
| Effect of Exchange Rate Changes on Cash | 28 | 924 | 409 | ||
| Net Increase(Decrease) in Cash and Cash Equivalents | (94) | (3,085) | 5,653 | ||
| Cash and Cash Equivalents at Beginning of Period | 2,500 | 81,965 | 76,312 | ||
| Cash and Cash Equivalents at End of Period | 2,406 | 78,881 | 81,965 | ||
| Note: | (1) | Unaudited, prepared by AUO based on Taiwan IFRS |
| (2) | Amounts in New Taiwan dollars were translated into US dollars at the exchange rate of NTD 32.79 per USD as of December 31, 2015 |
Serious News for Serious Traders! Try StreetInsider.com Premium Free!
You May Also Be Interested In
- IHT S-3 OPENS DOORS FOR DIVERSIFICATION CAPITAL INFUSION
- Oak Valley Bancorp Reports 1st Quarter Results
- Early Warning News Release
Create E-mail Alert Related Categories
SEC FilingsSign up for StreetInsider Free!
Receive full access to all new and archived articles, unlimited portfolio tracking, e-mail alerts, custom newswires and RSS feeds - and more!
