

Form 497K VANGUARD INTERNATIONAL
 Tweet
Tweet Share
Share
![]()
| Vanguard FTSE Emerging Markets ETF |
| Summary Prospectus |
| November 28, 2016 |
| Exchange-traded fund shares that are not individually redeemable and are listed |
| on NYSE Arca |
| Vanguard Emerging Markets Stock Index Fund ETF Shares (VWO) |
| The Fund’s statutory Prospectus and Statement of Additional Information dated |
| November 28, 2016, as may be amended or supplemented, are incorporated |
| into and made part of this Summary Prospectus by reference. |
| Before you invest, you may want to review the Fund’s Prospectus, which |
| contains more information about the Fund and its risks. You can find |
| the Fund’s Prospectus and other information about the Fund online at |
| www.vanguard.com/prospectus. You can also obtain this information at no |
| cost by calling 866-499-8473 or by sending an email request to |
| [email protected]. |
| The Securities and Exchange Commission (SEC) has not approved or disapproved these securities or |
| passed upon the adequacy of this prospectus. Any representation to the contrary is a criminal offense. |
Investment Objective
The Fund seeks to track the performance of a benchmark index that measures the investment return of stocks issued by companies located in emerging market countries.
Fees and Expenses
The following table describes the fees and expenses you may pay if you buy and hold ETF Shares of the Fund.
Shareholder Fees
(Fees paid directly from your investment)
Transaction Fee on Purchases and Sales
Transaction Fee on Reinvested Dividends
Transaction Fee on Conversion to ETF Shares
None through Vanguard
(Broker fees vary)
None through Vanguard
(Broker fees vary)
None through Vanguard
(Broker fees vary)
Annual Fund Operating Expenses
(Expenses that you pay each year as a percentage of the value of your investment)
| Management Fees | 0.08% |
| 12b-1 Distribution Fee | None |
| Other Expenses | 0.07% |
| Total Annual Fund Operating Expenses | 0.15% |
1
Example
The following example is intended to help you compare the cost of investing in the Fund’s ETF Shares with the cost of investing in other funds. It illustrates the hypothetical expenses that you would incur over various periods if you invested $10,000 in the Fund’s shares. This example assumes that the Shares provide a return of 5% each year and that total annual fund operating expenses remain as stated in the preceding table. You would incur these hypothetical expenses whether or not you redeem your investment at the end of the given period. Although your actual costs may be higher or lower, based on these assumptions your costs would be:
| 1 Year | 3 Years | 5 Years | 10 Years |
| $15 | $48 | $85 | $192 |
This example does not include the brokerage commissions that you may pay to buy and sell ETF Shares of the Fund.
Portfolio Turnover
The Fund pays transaction costs, such as commissions, when it buys and sells securities (or “turns over” its portfolio). A higher portfolio turnover rate may indicate higher transaction costs and may result in more taxes when Fund shares are held in a taxable account. These costs, which are not reflected in annual fund operating expenses or in the previous expense example, reduce the Fund’s performance. During the most recent fiscal year, the Fund’s portfolio turnover rate was 7% of the average value of its portfolio.
Principal Investment Strategies
The Fund employs an indexing investment approach designed to track the performance of the FTSE Emerging Markets All Cap China A Inclusion Index, a market-capitalization-weighted index that is made up of approximately 3,500 common stocks of large-, mid-, and small-cap companies located in emerging markets around the world. The Fund invests by sampling the Index, meaning that it holds a broadly diversified collection of securities that, in the aggregate, approximates the Index in terms of key characteristics. These key characteristics include industry weightings and market capitalization, as well as certain financial measures, such as price/earnings ratio and dividend yield.
2
Principal Risks
An investment in the Fund could lose money over short or even long periods. You should expect the Fund’s share price and total return to fluctuate within a wide range. The Fund is subject to the following risks, which could affect the Fund’s performance:
• Stock market risk, which is the chance that stock prices overall will decline. Stock markets tend to move in cycles, with periods of rising prices and periods of falling prices. The Fund’s investments in foreign stocks can be riskier than U.S. stock investments. Foreign stocks tend to be more volatile and less liquid than U.S. stocks. The prices of foreign stocks and the prices of U.S. stocks may move in opposite directions. In addition, the Fund’s target index may, at times, become focused in stocks of a particular market sector, which would subject the Fund to proportionately higher exposure to the risks of that sector.
• Emerging markets risk, which is the chance that the stocks of companies located in emerging markets will be substantially more volatile, and substantially less liquid, than the stocks of companies located in more developed foreign markets because, among other factors, emerging markets can have greater custodial and operational risks; less developed legal, tax, regulatory, and accounting systems; and greater political, social, and economic instability than developed markets.
• Country/regional risk, which is the chance that world events—such as political upheaval, financial troubles, or natural disasters—will adversely affect the value of securities issued by companies in foreign countries or regions. The Index’s, and therefore the Fund’s, heavy exposure to China, Taiwan, Brazil, India, and South Africa subjects the Fund to a higher degree of country risk than that of more geographically diversified international funds.
• Currency risk, which is the chance that the value of a foreign investment, measured in U.S. dollars, will decrease because of unfavorable changes in currency exchange rates. Currency risk is especially high in emerging markets.
• China A-shares risk, which is the chance that the Fund may not be able to access a sufficient amount of China A-shares to track its target index. China A-shares are only available to foreign investors through a quota license or the China Stock Connect program.
• Index sampling risk, which is the chance that the securities selected for the Fund, in the aggregate, will not provide investment performance matching that of the Fund’s target index.
Because ETF Shares are traded on an exchange, they are subject to additional risks:
• The Fund’s ETF Shares are listed for trading on NYSE Arca and are bought and sold on the secondary market at market prices. Although it is expected that the market price of an ETF Share typically will approximate its net asset value (NAV), there may be times when the market price and the NAV differ significantly. Thus, you may pay more or less than NAV when you buy ETF Shares on the secondary market, and you may receive more or less than NAV when you sell those shares.
3
• Although the Fund’s ETF Shares are listed for trading on NYSE Arca, it is possible that an active trading market may not be maintained.
• Trading of the Fund’s ETF Shares may be halted by the activation of individual or marketwide trading halts (which halt trading for a specific period of time when the price of a particular security or overall market prices decline by a specified percentage). Trading of the Fund’s ETF Shares may also be halted if (1) the shares are delisted from NYSE Arca without first being listed on another exchange or (2) NYSE Arca officials determine that such action is appropriate in the interest of a fair and orderly market or for the protection of investors.
An investment in the Fund is not a deposit of a bank and is not insured or guaranteed by the Federal Deposit Insurance Corporation or any other government agency.
Annual Total Returns
The following bar chart and table are intended to help you understand the risks of investing in the Fund. The bar chart shows how the performance of the Fund‘s ETF Shares (based on NAV) has varied from one calendar year to another over the periods shown. The table shows how the average annual total returns of the ETF Shares compare with those of the Fund’s target index and other comparative indexes, which have investment characteristics similar to those of the Fund.The Spliced Emerging Markets Index reflects performance of the Select Emerging Markets Index through August 23, 2006; the MSCI Emerging Markets Index through January 9, 2013; the FTSE Emerging Transition Index through June 27, 2013; the FTSE Emerging Index through November 1, 2015; and the FTSE Emerging Markets All Cap China A Transition Index thereafter. Returns for the FTSE Indexes shown are adjusted for withholding taxes applicable to U.S.-based mutual funds organized as Delaware statutory trusts. MSCI Emerging Markets Index returns also are adjusted for withholding taxes. Keep in mind that the Fund’s past performance (before and after taxes) does not indicate how the Fund will perform in the future. Updated performance information is available on our website at vanguard.com/performance or by calling Vanguard toll-free at 800-662-7447.
4
Annual Total Returns — Vanguard Emerging Markets Stock Index Fund ETF Shares1
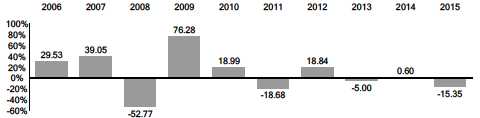
1 The year-to-date return as of the most recent calendar quarter, which ended on September 30, 2016, was 16.22%.
During the periods shown in the bar chart, the highest return for a calendar quarter was 34.17% (quarter ended June 30, 2009), and the lowest return for a quarter was –27.82% (quarter ended December 31, 2008).
| Average Annual Total Returns for Periods Ended December 31, 2015 | |||
| 1 Year | 5 Years | 10 Years | |
| Vanguard Emerging Markets Stock Index Fund ETF Shares | |||
| Based on NAV | |||
| Return Before Taxes | –15.35% | –4.80% | 3.39% |
| Return After Taxes on Distributions | –16.09 | –5.40 | 2.88 |
| Return After Taxes on Distributions and Sale of Fund Shares | –8.29 | –3.51 | 2.77 |
| Based on Market Price | |||
| Return Before Taxes | –15.82 | –4.98 | 3.22 |
| Comparative Indexes | |||
| (reflect no deduction for fees or expenses) | |||
| FTSE Emerging Markets All Cap China A Transition Index1 | —% | —% | —% |
| FTSE Emerging Index | –15.49 | –4.79 | 4.02 |
| Spliced Emerging Markets Index | –15.40 | –4.59 | 3.55 |
| MSCI Emerging Markets Index | –14.92 | –4.81 | 3.61 |
| FTSE Emerging Markets All Cap China A Inclusion Fair Value | |||
| Transition Index2 | — | — | — |
1 Index returns for the period from November 2, 2015, through December 31, 2015, were –5.73%.
2 Index returns for the period from November 2, 2015, through December 31, 2015, were –6.65%.
5
Actual after-tax returns depend on your tax situation and may differ from those shown in the preceding table. When after-tax returns are calculated, it is assumed that the shareholder was in the highest individual federal marginal income tax bracket at the time of each distribution of income or capital gains or upon redemption. State and local income taxes are not reflected in the calculations. Please note that after-tax returns are not relevant for a shareholder who holds fund shares in a tax-deferred account, such as an individual retirement account or a 401(k) plan. Also, figures captioned Return After Taxes on Distributions and Sale of Fund Shares may be higher than other figures for the same period if a capital loss occurs upon redemption and results in an assumed tax deduction for the shareholder.
Investment Advisor
The Vanguard Group, Inc. (Vanguard)
Portfolio Managers
Michael Perre, Principal of Vanguard. He has managed the Fund since 2008 (co-managed since 2016).
Jeffrey D. Miller, Portfolio Manager at Vanguard. He has co-managed the Fund since 2016.
Purchase and Sale of Fund Shares
You can buy and sell ETF Shares of the Fund through a brokerage firm. The price you pay or receive for ETF Shares will be the prevailing market price, which may be more or less than the NAV of the shares. The brokerage firm may charge you a commission to execute the transaction. Unless imposed by your brokerage firm, there is no minimum dollar amount you must invest and no minimum number of shares you must buy. ETF Shares of the Fund cannot be directly purchased from or redeemed with the Fund, except by certain authorized broker-dealers. These broker-dealers may purchase and redeem ETF Shares only in large blocks (Creation Units) worth several million dollars, typically in exchange for baskets of securities. For this Fund, the number of ETF Shares in a Creation Unit is 200,000.
Tax Information
The Fund’s distributions may be taxable as ordinary income or capital gain. If you are investing through a tax-deferred retirement account, such as an IRA, special tax rules apply.
Payments to Financial Intermediaries
The Fund and its investment advisor do not pay financial intermediaries for sales of Fund shares.
Vanguard Emerging Markets Stock Index Fund ETF Shares—Fund Number 964
London Stock Exchange Group companies include FTSE International Limited (“FTSE”), Frank Russell Company (“Russell”), MTS Next Limited (“MTS”), and FTSE TMX Global Debt Capital Markets Inc. (“FTSE TMX”). All rights reserved. “FTSE®”, “Russell®”, “MTS®", “FTSE TMX®” and “FTSE Russell” and other service marks and trademarks related to the FTSE or Russell indexes are trademarks of the London Stock Exchange Group companies and are used by FTSE, MTS, FTSE TMX and Russell under licence. All information is provided for information purposes only. Every effort is made to ensure that all information given in this publication is accurate, but no responsibility or liability can be accepted by the London Stock Exchange Group companies nor its licensors for any errors or for any loss from use of this publication. Neither the London Stock Exchange Group companies nor any of their licensors make any claim, prediction, warranty or representation whatsoever, expressly or impliedly, either as to the results to be obtained from the use of the Indices or the fitness or suitability of the Indices for any particular purpose to which they might be put. The London Stock Exchange Group companies do not provide investment advice and nothing in this document should be taken as constituting financial or investment advice. The London Stock Exchange Group companies make no representation regarding the advisability of investing in any asset. A decision to invest in any such asset should not be made in reliance on any information herein. Indexes cannot be invested in directly. Inclusion of an asset in an index is not a recommendation to buy, sell or hold that asset. The general information contained in this publication should not be acted upon without obtaining specific legal, tax, and investment advice from a licensed professional. No part of this information may be reproduced, stored in a retrieval system or transmitted in any form or by any means, electronic, mechanical, photocopying, recording or otherwise, without prior written permission of the London Stock Exchange Group companies. Distribution of the London Stock Exchange Group companies’ index values and the use of their indexes to create financial products require a licence with FTSE, FTSE TMX, MTS and/or Russell and/or its licensors.
- 2016 The Vanguard Group, Inc. All rights reserved.
- Patent Nos. 6,879,964; 7,337,138; 7,720,749; 7,925,573; 8,090,646; and 8,417,623.
Vanguard Marketing Corporation, Distributor.
SP 964 112016
Create E-mail Alert Related Categories
SEC FilingsRelated Entities
VanguardSign up for StreetInsider Free!
Receive full access to all new and archived articles, unlimited portfolio tracking, e-mail alerts, custom newswires and RSS feeds - and more!
