

Form 497K JPMORGAN TRUST II
November 1, 2016 2:54 PM EDT Tweet
Tweet Share
Share| Summary Prospectus November 1, 2016 |

|
JPMorgan Small Cap Growth Fund
Class/Ticker: A/PGSGX C/OSGCX Select/OGGFX
Before you invest, you may want to review the Fund’s Prospectus, which contains more information about the Fund and its risks. You can find the Fund’s Prospectus and other information about the Fund, including the Statement of Additional Information, online at www.jpmorganfunds.com/funddocuments. You can also get this information at no cost by calling 1-800-480-4111 or by sending an e-mail request to [email protected] or by asking any financial intermediary that offers shares of the Fund. The Fund’s Prospectus and Statement of Additional Information, both dated November 1, 2016, are incorporated by reference into this Summary Prospectus.
What is the goal of the Fund?
The Fund seeks long-term capital growth primarily by investing in a portfolio of equity securities of small-capitalization and emerging growth companies.
Fees and Expenses of the Fund
The following tables describe the fees and expenses that you may pay if you buy and hold shares of the Fund. You may qualify for sales charge discounts on purchases of Class A Shares if you and your family invest, or agree to invest in the future, at least $50,000 in the J.P. Morgan Funds. More information about these and other discounts is available from your financial intermediary and in “Investing with J.P. Morgan Funds — SALES CHARGES AND FINANCIAL INTERMEDIARY COMPENSATION” on page 95 of the prospectus and in “PURCHASES, REDEMPTIONS AND EXCHANGES” in Appendix A to Part II of the Statement of Additional Information.
| SHAREHOLDER FEES (Fees paid directly from your investment) | ||||||
| Class A | Class C | Select Class | ||||
| Maximum Sales Charge (Load) Imposed on Purchases, as % of the Offering Price | 5.25% | NONE | NONE | |||
| Maximum Deferred Sales Charge (Load), as % of Original Cost of the Shares | NONE | 1.00% | NONE | |||
| (under $1 million) |
||||||
“Acquired Fund Fees and Expenses” are expenses incurred indirectly by the Fund through its ownership of shares in other investment companies, including affiliated money market funds, other mutual funds, exchange-traded funds and business development companies. The impact of Acquired Fund Fees and Expenses is included in the total returns of the Fund. Acquired Fund Fees and Expenses are not direct costs of the Fund, are not used to calculate the Fund’s net asset value per share and are not included in the calculation of the ratio of expenses to average net assets shown in the Financial Highlights section of the Fund’s prospectus.
| ANNUAL FUND OPERATING EXPENSES (Expenses that you pay each year as a percentage of the value |
||||||||||||
| Class A | Class C | Select Class |
||||||||||
| Management Fees | 0.65 | % | 0.65 | % | 0.65 | % | ||||||
| Distribution (Rule 12b-1) Fees | 0.25 | 0.75 | NONE | |||||||||
| Other Expenses | 0.60 | 0.51 | 0.53 | |||||||||
| Shareholder Service Fees |
0.25 | 0.25 | 0.25 | |||||||||
| Remainder of Other Expenses |
0.35 | 0.26 | 0.28 | |||||||||
| Acquired Fund Fees and Expenses | 0.06 | 0.06 | 0.06 | |||||||||
|
|
|
|
|
|
|
|||||||
| Total Annual Fund Operating Expenses | 1.56 | 1.97 | 1.24 | |||||||||
| Fee Waivers and Expense Reimbursements 1 | (0.25 | ) | (0.16 | ) | (0.18 | ) | ||||||
|
|
|
|
|
|
|
|||||||
| Total Annual Fund Operating Expenses After Fee Waivers and Expense Reimbursements1 | 1.31 | 1.81 | 1.06 | |||||||||
| 1 | The Fund’s adviser and/or its affiliates have contractually agreed to waive fees and/or reimburse expenses to the extent Total Annual Fund Operating Expenses (excluding Acquired Fund Fees and Expenses other than certain money market fund fees as described below, dividend and interest expenses related to short sales, interest, taxes, expenses related to litigation and potential litigation, and extraordinary expenses) exceed 1.25%, 1.75% and 1.00% of the average daily net assets of Class A, Class C and Select Class Shares, respectively. The Fund may invest in one or more money market funds advised by the adviser or its affiliates (affiliated money market funds). The Fund’s adviser, shareholder servicing agent and/or administrator have contractually agreed to waive fees and/or reimburse expenses in an amount sufficient to offset the respective net fees each collects from the affiliated money market funds on the Fund’s investment in such money market funds. These waivers are in effect through 10/31/17, at which time the adviser and/or its affiliates will determine whether to renew or revise them. |
Example
This Example is intended to help you compare the cost of investing in the Fund with the cost of investing in other mutual funds. The Example assumes that you invest $10,000 in the Fund for the time periods indicated. The Example also assumes that your investment has a 5% return each year and that the Fund’s operating expenses are equal to the total annual fund operating expenses after fee waivers and expense reimbursements shown in the fee table through 10/31/17 and total annual fund operating expenses thereafter. Your actual costs may be higher or lower.
1
| IF YOU SELL YOUR SHARES, YOUR COST WOULD BE: | ||||||||||||||||
| 1 Year | 3 Years | 5 Years | 10 Years | |||||||||||||
| CLASS A SHARES ($) | 651 | 969 | 1,308 | 2,264 | ||||||||||||
| CLASS C SHARES ($) | 284 | 603 | 1,048 | 2,283 | ||||||||||||
| SELECT CLASS SHARES ($) | 108 | 376 | 664 | 1,484 | ||||||||||||
| IF YOU DO NOT SELL YOUR SHARES, YOUR COST WOULD BE: |
||||||||||||||||
| 1 Year | 3 Years | 5 Years | 10 Years | |||||||||||||
| CLASS A SHARES ($) | 651 | 969 | 1,308 | 2,264 | ||||||||||||
| CLASS C SHARES ($) | 184 | 603 | 1,048 | 2,283 | ||||||||||||
| SELECT CLASS SHARES ($) | 108 | 376 | 664 | 1,484 | ||||||||||||
Portfolio Turnover
The Fund pays transaction costs, such as commissions, when it buys and sells securities (or “turns over” its portfolio). A higher portfolio turnover rate may indicate higher transaction costs and may result in higher taxes when Fund shares are held in a taxable account. These costs, which are not reflected in annual fund operating expenses, or in the Example, affect the Fund’s performance. During the Fund’s most recent fiscal year, the Fund’s portfolio turnover rate was 47% of the average value of its portfolio.
What are the Fund’s main investment strategies?
Under normal circumstances, at least 80% of the Fund’s Assets will be invested in the securities of small capitalization companies. “Assets” means net assets, plus the amount of borrowings for investment purposes. Small cap companies are companies with market capitalizations equal to those within the universe of the Russell 2000® Growth Index stocks and/or with market capitalizations of less than $4 billion at the time of purchase. As of the reconstitution of the Russell 2000 Growth Index on June 24, 2016, the market capitalizations of the companies in the index ranged from $60.0 million to $4.0 billion. In implementing its main strategies, the Fund will invest primarily in common stocks. Typically, the Fund invests in securities of companies with a history of above-average growth, as well as companies expected to have above-average growth.
Derivatives, which are instruments that have a value based on another instrument, exchange rate or index, may be used as substitutes for securities in which the Fund can invest. To the extent the Fund uses derivatives, the Fund will primarily use futures contracts to more effectively gain targeted equity exposure from its cash positions.
Investment Process: In managing the Fund, the adviser employs a process that combines research, valuation and stock
selection to identify companies that have a history of above-average growth or which the adviser believes will achieve above-average growth in the future. Growth companies purchased for the Fund include those with leading competitive positions, predictable and durable business models and management that can achieve sustained growth.
The adviser may sell a security for several reasons. A security may be sold due to a change in the company’s fundamentals or if the adviser believes the security is no longer attractively valued. Investments may also be sold if the adviser identifies a stock that it believes offers a better investment opportunity.
The Fund’s Main Investment Risks
The Fund is subject to management risk and may not achieve its objective if the adviser’s expectations regarding particular instruments or markets are not met.
An investment in this Fund or any other fund may not provide a complete investment program. The suitability of an investment in the Fund should be considered based on the investment objective, strategies and risks described in this Prospectus, considered in light of all of the other investments in your portfolio, as well as your risk tolerance, financial goals and time horizons. You may want to consult with a financial advisor to determine if this Fund is suitable for you.
The Fund is subject to the main risks noted below, any of which may adversely affect the Fund’s performance and ability to meet its investment objective.
Equity Market Risk. The price of equity securities may rise or fall because of changes in the broad market or changes in a company’s financial condition, sometimes rapidly or unpredictably. These price movements may result from factors affecting individual companies, sectors or industries selected for the Fund’s portfolio or the securities market as a whole, such as changes in economic or political conditions. When the value of the Fund’s securities goes down, your investment in the Fund decreases in value.
General Market Risk. Economies and financial markets throughout the world are becoming increasingly interconnected, which increases the likelihood that events or conditions in one country or region will adversely impact markets or issuers in other countries or regions. Securities in the Fund’s portfolio may underperform securities in comparison to general financial markets, a particular financial market or other asset classes, due to a number of factors, including inflation, interest rates, global demand for particular products or resources, natural disasters or events, terrorism, regulatory events and government controls.
2
Smaller Company Risk. Investments in smaller companies may be riskier, less liquid, more volatile and more vulnerable to economic, market and industry changes than investment in larger, more established companies. The securities of smaller companies may trade less frequently and in smaller volumes than securities of larger companies. As a result, the share price changes may be more sudden or erratic than the prices of other securities, especially over the short term.
Growth Investing Risk. Because growth investing attempts to identify companies that the adviser believes will experience rapid earnings growth relative to value or other types of stocks, growth stocks may trade at higher multiples of current earnings compared to value or other stocks, leading to inflated prices and thus potentially greater declines in value.
Derivative Risk. Derivatives, including futures, may be riskier than other types of investments and may increase the volatility of the Fund. Derivatives may be sensitive to changes in economic and market conditions and may create leverage, which could result in losses that significantly exceed the Fund’s original investment. Derivatives expose the Fund to counterparty risk, which is the risk that the derivative counterparty will not fulfill its contractual obligations (and includes credit risk associated with the counterparty). Certain derivatives are synthetic instruments that attempt to replicate the performance of certain reference assets. With regard to such derivatives, the Fund does not have a claim on the reference assets and is subject to enhanced counterparty risk. Derivatives may not perform as expected, so the Fund may not realize the intended benefits. When used for hedging, the change in value of a derivative may not correlate as expected with the security or other risk being hedged. In addition, given their complexity, derivatives expose the Fund to risks of mispricing or improper valuation.
Industry and Sector Focus Risk. At times the Fund may increase the relative emphasis of its investments in a particular industry or sector. The prices of securities of issuers in a particular industry or sector may be more susceptible to fluctuations due to changes in economic or business conditions, government regulations, availability of basic resources or supplies, or other events that affect that industry or sector more than securities of issuers in other industries and sectors. To the extent that the Fund increases the relative emphasis of its investments in a particular industry or sector, its shares’ values may fluctuate in response to events affecting that industry or sector.
Transactions Risk. The Fund could experience a loss and its liquidity may be negatively impacted when selling securities to meet redemption requests by shareholders. The risk of loss increases if the redemption requests are unusually large or frequent or occur in times of overall market turmoil or declining prices. Similarly, large purchases of Fund shares may adversely affect the Fund’s performance to the extent that the
Fund is delayed in investing new cash and is required to maintain a larger cash position than it ordinarily would.
Investments in the Fund are not deposits or obligations of, or guaranteed or endorsed by, any bank and are not insured or guaranteed by the FDIC, the Federal Reserve Board or any other government agency.
You could lose money investing in the Fund.
The Fund’s Past Performance
This section provides some indication of the risks of investing in the Fund. The bar chart shows how the performance of the Fund’s Class A Shares has varied from year to year for the past ten calendar years. The table shows the average annual total returns over the past one year, five years and ten years. The table compares that performance to the Russell 2000® Growth Index and Lipper Small-Cap Growth Funds Index, an index based on the total returns of certain mutual funds within the Fund’s designated category as determined by Lipper. Unlike the other index, the Lipper index includes the fees and expenses of the mutual funds included in the index. Past performance (before and after taxes) is not necessarily an indication of how any class of the Fund will perform in the future. Updated performance information is available by visiting www.jpmorganfunds.com or by calling 1-800-480-4111.
The performance figures in the bar chart do not reflect any deduction for the front-end sales load which is assessed on Class A Shares. If the load were reflected, the performance figures would have been lower.
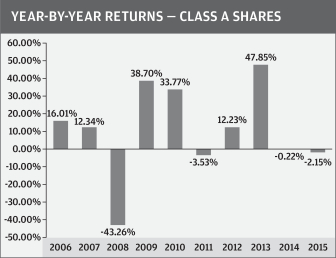
| Best Quarter | 2nd quarter, 2009 | 23.01% | ||||
| Worst Quarter | 4th quarter, 2008 | –25.95% |
The Fund’s year-to-date total return through 9/30/16 was 7.91%.
3
| AVERAGE ANNUAL TOTAL RETURNS (For periods ended December 31, 2015) |
||||||||||||
| Past 1 Year |
Past 5 Years |
Past 10 Years |
||||||||||
| CLASS A SHARES | ||||||||||||
| Return Before Taxes | (7.27 | )% | 8.17 | % | 7.35 | % | ||||||
| Return After Taxes on Distributions | (9.07 | ) | 6.45 | 5.83 | ||||||||
| Return After Taxes on Distributions and Sale of Fund Shares | (2.68 | ) | 6.42 | 5.76 | ||||||||
| CLASS C SHARES | ||||||||||||
| Return Before Taxes | (3.61 | ) | 8.79 | 7.34 | ||||||||
| SELECT CLASS SHARES | ||||||||||||
| Return Before Taxes | (1.93 | ) | 9.61 | 8.20 | ||||||||
| RUSSELL 2000 GROWTH INDEX | (1.38 | ) | 10.67 | 7.95 | ||||||||
| (Reflects No Deduction for Fees, Expenses, or Taxes) | ||||||||||||
| LIPPER SMALL-CAP GROWTH FUNDS INDEX | (1.15 | ) | 9.56 | 6.70 | ||||||||
| (Reflects No Deduction for Taxes) | ||||||||||||
After-tax returns are shown only for the Class A Shares, and after-tax returns for the other classes will vary. After-tax returns are calculated using the historical highest individual federal marginal income tax rates and do not reflect the impact of state and local taxes. Actual after-tax returns depend on your tax situation and may differ from those shown. The after-tax returns shown are not relevant to investors who hold their shares through tax-deferred arrangements such as 401(k) plans or individual retirement accounts.
Management
J.P. Morgan Investment Management Inc.
| Portfolio Manager | Managed the Fund Since |
Primary Title with Investment Adviser | ||
| Eytan Shapiro | 2004 | Managing Director | ||
| Felise Agranoff | 2016 | Managing Director | ||
| Greg Tuorto | 2016 | Managing Director | ||
| Matthew Cohen | 2016 | Managing Director |
Purchase and Sale of Fund Shares
Purchase minimums
| For Class A and Class C Shares | ||||
| To establish an account |
$1,000 | |||
| To add to an account |
$50 | |||
| For Select Class Shares | ||||
| To establish an account |
$1,000,000 | |||
| To add to an account |
No minimum levels |
In general, you may purchase or redeem shares on any business day:
| • | Through your Financial Intermediary |
| • | By writing to J.P. Morgan Funds Services, P.O. Box 8528, Boston, MA 02266-8528 |
| • | After you open an account, by calling J.P. Morgan Funds Services at 1-800-480-4111 |
Tax Information
The Fund intends to make distributions that may be taxed as ordinary income or capital gains, except when your investment is in an IRA, 401(k) plan or other tax-advantaged investment plan, in which case you may be subject to federal income tax upon withdrawal from the tax-advantaged investment plan.
Payments to Broker-Dealers and Other Financial Intermediaries
If you purchase shares of the Fund through a broker-dealer or other financial intermediary (such as a bank), the Fund and its related companies may pay the financial intermediary for the sale of Fund shares and related services. These payments may create a conflict of interest by influencing the broker-dealer or financial intermediary and your salesperson to recommend the Fund over another investment. Ask your salesperson or visit your financial intermediary’s website for more information.
SPRO-SCG-ACS-1116
4
FREE Breaking News Alerts from StreetInsider.com!
StreetInsider.com Top Tickers, 4/24/2024
- S&P 500 ends higher as markets weigh rising yields, upbeat corporate results
- Meta Platforms reports softer Q2 revenue guidance on plans to boost spending on AI
- IBM (IBM) announces mixed Q1 results, HashiCorp acquisition; shares down
- Equities mixed as investors eye earnings; yen on intervention watch
- ServiceNow (NOW) stock falls as refreshed subscription outlook trails estimates
- Fisker (FSR) Appoints Michael Healy as Chief Restructuring Officer
- Seagate Technology (STX) Enters $600M Asset Purchase Agreement with Avago
- Meta Platforms (META) Tops Q1 EPS by 39c, Offers Guidance
- Hasbro (HAS) brand strength sees earnings top expectations
- IBM (IBM) announces mixed Q1 results, HashiCorp acquisition; shares down
- After-hours movers: Meta, Ford, IBM, ServiceNow and more
- Midday movers: Tesla, Boeing rise; Uber, Old Dominion Freight fall
- After-hours movers: Tesla, Texas Instruments, Seagate, Visa and more
- Midday movers: PepsiCo, JetBlue fall; GM, Danaher and UPS rise
- After-hours movers: Cadence Design Systems, Cleveland-Cliffs, Riot Platforms, and more
Serious News for Serious Traders! Try StreetInsider.com Premium Free!
You May Also Be Interested In
- JPMorgan First Take on Biogen (BIIB)
- Illinois Tool Works (ITW) PT Lowered to $280 at JPMorgan
- AGNC Investment Corp (AGNC) PT Lowered to $9.50 at JPMorgan
Create E-mail Alert Related Categories
SEC FilingsRelated Entities
JPMorganSign up for StreetInsider Free!
Receive full access to all new and archived articles, unlimited portfolio tracking, e-mail alerts, custom newswires and RSS feeds - and more!
