

Form 425 ACCESS NATIONAL CORP Filed by: ACCESS NATIONAL CORP
 Tweet
Tweet Share
ShareUNITED STATES
SECURITIES AND EXCHANGE COMMISSION
Washington, D.C. 20549
--------------------
FORM 8-K
Current Report Pursuant to Section 13 or 15(d) of
The Securities Exchange Act of 1934
November 30, 2016
Date of Report
(Date of earliest event reported)
Access National Corporation
(Exact name of registrant as specified in its charter)
| Virginia | 000-49929 | 82-0545425 |
|
(State or other
jurisdiction
of incorporation)
|
(Commission
File Number)
|
(IRS Employer Identification No.)
|
1800 Robert Fulton Drive, Suite 300, Reston, VA 20191
(Address of principal executive offices) (Zip Code)
(703) 871-2100
(Registrant's telephone number, including area code)
____________________________n/a_______________________
(Former name or former address, if changed since last report.)
Check the appropriate box below if the Form 8-K filing is intended to simultaneously satisfy the filing obligation of the registrant under any of the following provisions (see General Instruction A.2. below):
☒ Written communications pursuant to Rule 425 under the Securities Act (17 CFR 230.425)
☐ Soliciting material pursuant to Rule 14a-12 under the Exchange Act (17 CFR 240.14a-12)
☐ Pre-commencement communications pursuant to Rule 14d-2(b) under the Exchange Act (17 CFR 240.14d-2(b))
☐ Soliciting material pursuant to Rule 14a-12 under the Exchange Act (17 CFR 240.14a-12)
☐ Pre-commencement communications pursuant to Rule 14d-2(b) under the Exchange Act (17 CFR 240.14d-2(b))
☐ Pre-commencement communications pursuant to Rule 13e-4(c) under the Exchange Act (17 CFR 240.13e-4(c))
Item 8.01. Other Events.
Access National Corporation, Inc. ("Access") has updated its presentation materials to be used in meetings with shareholders and the investment community. The updated materials are attached hereto as Exhibit 99.1 and incorporated herein by reference.
Additional Information About the Proposed Transaction and Where to Find It
As previously announced, Access and Middleburg Financial Corporation ("Middleburg") have entered into an Agreement and Plan of Reorganization (the "Merger Agreement") pursuant to which Middleburg will merge with and into Access (the "Merger"). Access will be the surviving corporation in the Merger.
Investors are urged to review carefully and consider all public filings by Access and Middleburg with the Securities and Exchange Commission (the "SEC"), including but not limited to their Annual Reports on Form 10-K, their proxy statements, their Quarterly Reports on Form 10-Q, and their Current Reports on Form 8-K. The documents filed with the SEC may be obtained free of charge at the SEC's website at www.sec.gov. The documents filed by Access with the SEC may also be obtained free of charge at Access's website at www.accessnationalbank.com or by requesting them in writing to Access National Corporation, 1800 Robert Fulton Drive, Suite 300, Reston, VA 20191, Attention: Investor Relations. The documents filed by Middleburg with the SEC may also be obtained free of charge at Middleburg's website at www.middleburgbank.com or by requesting them in writing to Middleburg Financial Corporation, 111 West Washington Street, Middleburg, Virginia 20117, Attention: Investor Relations.
In connection with the proposed transaction, Access intends to file a registration statement on Form S-4 with the SEC which will include a joint proxy statement of Access and Middleburg and a prospectus of Access. A definitive joint proxy statement/prospectus will be sent to the shareholders of each company seeking the required shareholder approvals. Before making any voting or investment decision, investors and security holders of Access and Middleburg are urged to read carefully the entire registration statement and joint proxy statement/prospectus when they become available, including any amendments thereto, because they will contain important information about the proposed transaction. Information in this report is not a substitute for the registration statement or the joint proxy statement/prospectus. Free copies of these documents may be obtained as described above.
Access, Middleburg and certain of their directors and executive officers may be deemed participants in the solicitation of proxies from Access and Middleburg shareholders in connection with the proposed transaction. Information about the directors and officers of Access and their ownership of Access common stock is set forth in the definitive proxy statement for Access's 2016 annual meeting of shareholders, as previously filed with the SEC on April 18, 2016. Information about the directors and officers of Middleburg and their ownership of Middleburg common stock is set forth in the definitive proxy statement for Middleburg's 2016 annual meeting of shareholders, as previously filed with the SEC on April 12, 2016. Investors may obtain additional information regarding the interests of such participants by reading the registration statement and the joint proxy statement/prospectus when they become available. Free copies of these documents may be obtained as described above.
Forward-Looking Statements
The information presented herein contains "forward-looking statements" within the meaning of the Private Securities Litigation Reform Act of 1995 regarding Access's and Middleburg's expectations or predictions of future financial or business performance or conditions. Forward-looking statements may be identified by words such as "may," "could," "will," "expect," "believe," "anticipate," "forecast," "intend," "plan," "prospects," "estimate," "potential," or by variations of such words or by similar expressions. These forward-looking statements are subject to numerous assumptions, risks and uncertainties which change over time. Forward-looking statements in this report (including in the exhibits hereto) may include, but are not limited to, statements about project impacts of and financial results generated by the transaction. Forward-looking statements speak only as of the date they are made and Access and Middleburg assume no duty to update forward-looking statements.
In addition to factors previously disclosed in Access's and Middleburg's reports filed with the SEC and those identified elsewhere in this report, the following factors, among others, could cause actual results to differ materially from the results expressed in or implied by forward-looking statements and historical performance: ability to obtain regulatory approvals and meet other closing conditions to the transaction; delays in closing the transaction; changes in asset quality and credit risk; changes in interest rates and capital markets; the introduction, timing and success of business initiatives; competitive conditions; and the inability to recognize cost savings or revenues or to implement integration plans associated with the transaction. Annualized, pro forma, projected, and estimated numbers are used for illustrative purposes only, may not reflect actual results and may not be relied upon.
Item 9.01. Financial Statements and Exhibits.
(d) Exhibits.
| Exhibit No. |
Description
|
| 99.1 |
Investor presentation materials
|
SIGNATURES
Pursuant to the requirements of the Securities Exchange Act of 1934, the registrant has duly caused this report to be signed on its behalf by the undersigned hereunto duly authorized.
| ACCESS NATIONAL CORPORATION | |||
| (Registrant) | |||
|
Date: November 30, 2016
|
By: |
/s/ Michael W. Clarke
|
|
| Name: |
Michael W. Clarke
|
||
| Title: |
President & Chief Executive Officer
|
||
Exhibit Index
| Exhibit No. |
Description
|
| 99.1 |
Investor presentation materials
|
Exhibit 99.1

2016 INVESTOR BRIEFING Results through SEPTEMBER 30, 2016
2 FORWARD LOOKING STATEMENTS The information presented herein contains “forward-looking statements” within the meaning of the Private Securities Litigation Reform Act of 1995 regarding Access National Corporation’s (“Access”) and Middleburg Financial Corporation’s (“Middleburg”) expectations or predictions of future financial or business performance or conditions. Forward-looking statements may be identified by words such as “may,” “could,” “will,” “expect,” “believe,” “anticipate,” “forecast,” “intend,” “plan,” “prospects,” “estimate,” “potential,” or by variations of such words or by similar expressions. These forward-looking statements are subject to numerous assumptions, risks and uncertainties which change over time. Forward-looking statements in this communication may include, but are not limited to, statements about project impacts of and financial results generated by the transaction. Forward-looking statements speak only as of the date they are made and Access and Middleburg assume no duty to update forward-looking statements.In addition to factors previously disclosed in Access’s and Middleburg’s reports filed with the Securities and Exchange Commission and those identified elsewhere in this communication, the following factors, among others, could cause actual results to differ materially from the results expressed in or implied by forward-looking statements and historical performance: ability to obtain regulatory approvals and meet other closing conditions to the transaction; delays in closing the transaction; changes in asset quality and credit risk; changes in interest rates and capital markets; the introduction, timing and success of business initiatives; competitive conditions; and the inability to recognize cost savings or revenues or to implement integration plans associated with the transaction. Annualized, pro forma, projected, and estimated numbers are used for illustrative purposes only, may not reflect actual results and may not be relied upon.
3 ADDITIONAL INFORMATION Additional Information About the Proposed Transaction and Where to Find It Investors are urged to review carefully and consider all public filings by Access and Middleburg with the Securities and Exchange Commission (the “SEC”), including but not limited to their Annual Reports on Form 10-K, their proxy statements, their Quarterly Reports on Form 10-Q, and their Current Reports on Form 8-K. The documents filed with the SEC may be obtained free of charge at the SEC’s website at www.sec.gov. The documents filed by Access with the SEC may also be obtained free of charge at Access’s website at www.accessnationalbank.com or by requesting them in writing to Access National Corporation, 1800 Robert Fulton Drive, Suite 300, Reston, VA 20191, Attention: Investor Relations. The documents filed by Middleburg with the SEC may also be obtained free of charge at Middleburg’s website at www.middleburgbank.com or by requesting them in writing to Middleburg Financial Corporation, 111 West Washington Street, Middleburg, Virginia 20117, Attention: Investor Relations. In connection with the proposed transaction, Access intends to file a registration statement on Form S-4 with the SEC which will include a joint proxy statement of Access and Middleburg and a prospectus of Access. A definitive joint proxy statement/prospectus will be sent to the shareholders of each company seeking the required shareholder approvals. Before making any voting or investment decision, investors and security holders of Access and Middleburg are urged to read carefully the entire registration statement and joint proxy statement/prospectus when they become available, including any amendments thereto, because they will contain important information about the proposed transaction. Free copies of these documents may be obtained as described above.Access, Middleburg and certain of their directors and executive officers may be deemed participants in the solicitation of proxies from Access and Middleburg shareholders in connection with the proposed transaction. Information about the directors and officers of Access and their ownership of Access common stock is set forth in the definitive proxy statement for Access’s 2016 annual meeting of shareholders, as previously filed with the SEC on April 18, 2016. Information about the directors and officers of Middleburg and their ownership of Middleburg common stock is set forth in the definitive proxy statement for Middleburg’s 2016 annual meeting of shareholders, as previously filed with the SEC on April 12, 2016. Investors may obtain additional information regarding the interests of such participants by reading the registration statement and the joint proxy statement/prospectus when they become available. Free copies of these documents may be obtained as described above.

ACCESS NATIONAL BANK: INVESTMENT CASE SUMMARY Business bank 16 years — $1.4B assets — focused planBest banking market in the countryInvested and stable leadershipExceptional financial performance recordDiversified earnings streamAttractive dividend yieldConsistent growth in Tangible Book ValueCapital available for growth, acquisitions, dividendsSmart M&A can generate meaningful up-sideStrategic partnership with MBRG announced October 24, 2016 4

5 STRATEGIC PLAN: MISSION AND VALUES MISSION STATEMENT:Our mission is to provide on-target and superior financial solutions to the clients that we serve. All of our endeavors must enrich the interests of our clients, shareholders, associates and communities. CORE VALUES: Innovation Integrity Efficiency Tailored Service Opportunity

STRATEGIC PLAN: VISION We are “The CEO’s Best Friend”We provide: Capital — Debt and/or EquityA Trusted AdvisorPersonalized ServicePrivate Banking (Wealth Management, Mortgage Banking)Cash Flow/Funds ManagementRisk ManagementAccess to Financial InformationEmployee BenefitsCommunity Involvement and AwarenessThe MBRG strategic partnership strengthens the capacity to deliver. 6
Priority Industry Segments Target $1-100MM Revenue Operating Cos• Accounting Services• Community Associations• Financial Planning Services• Government Contracting• Healthcare IndustriesDental PracticesMedical PracticesVeterinary Practices• Legal Services• Nonprofits/Trade Associations• PACs & Political Organizations• Real Estate Services• Staffing Services• Title Companies 7 BUSINESS BANKING
EXPERIENCED LEADERSHIP: ALIGNED AND STABLE Core energetic leadership team since 1990Among the most experienced management in our marketSignificant insider banking relationshipsBoard and Executive Officers are alignedMajority of insiders purchase stock regularlyExecutive Officers & Directors hold ~ 24% of our common stock Employment contracts contain ownership covenants80% of our bank employees are shareholdersEmployees invest in ANCX through 401(k) and Dividend Reinvestment + Stock Purchase Plan 8

Director Director Position/ Occupation Business/Industry Since SharesMichael G. Anzilotti Retired Bank CEO VA Commerce, 1st VA 2014 25,000J. Randolph Babbitt SVP, Labor Relations Southwest Airlines 2012 130,000Michael W. Clarke CEO Access National Bank 1999 787,000 John (Skip) Edgemond Owner Greenworks 1999 99,000 Martin S. Friedman Chief Executive FJ Capital Mgmt 2009 52,000 Thomas M. Kody Owner, Kody Holdings Retail Sales, Service 1999 725,000Robert C. Shoemaker Chief Banking Officer Access National Bank 1999 419,000 Total Ownership - Directors 2,237,000* *~21% OwnershipExperienced leaders highly vested with shareholders. BOARD OF DIRECTORS TENURE & OWNERSHIP 9

Years Ownership Banking/Market This Team SharesMichael Clarke Chief Executive Officer 30 23 787,000Robert Shoemaker Chief Banking Officer 30 23 419,000Mark Moore President 30 < 1 5,000 Meg Taylor, CPA EVP, Chief Financial Officer 28 4 4,000Dean Hackemer President, Mortgage Division 25 21 276,000Steven Reeder EVP, Chief Deposit Officer 27 1 1,000Cindy Caldwell SVP, Client Services 28 23 65,000Stephanie Ogle EVP, Chief Administrative Officer 34 17 12,000Patricia Fisher SVP, Loan Admin 30 16 50,000Sheila Linton VP, Corp Secretary 23 23 82,000 Total 1,701,000* *~16% OwnershipAn experienced and stable team highly motivated to serve shareholder value. MANAGEMENT EQUITY MARKET EXPERIENCE & OWNERSHIP 10

BEST BANKING MARKET IN U.S. SERVING VIBRANT MARKETSHighly Affluent — 2016 median household income est $110,178 — 198% of national avgHighly Educated — Most highly educated MSA in USAGrowth — 2010-2016 population growth +10.50% vs. 4.43% nationallyStrong Employment Base — NoVa unemployment rate = 3.4%, MSA = 3.9% vs. 5.0% nationallyVirginia is the pro-business engine of the region6th Banking Center opens Q4 2016 in Alexandria VA 7th Banking Center opens late Q4 2016/Q1 2017 in Arlington VA 11 ANCX Banking Centers source – SNL, GMU Center for Regional Analysis Planned Banking Center

BEST BANKING MARKET: GROWING RELEVANCE 12 Deposit Market Share - Fairfax County, Virginia Rank Institution Offices Total Deposit Market Share ($000) Total Market Share (%) Parent Deposits (%) 1 Wells Fargo & Co. (CA) 36 14,094,415 29.50 1.30 2 Capital One Financial Corp. (VA) 34 8,027,053 16.80 4.10 3 Bank of America Corp. (NC) 29 4,974,921 10.41 0.43 4 BB&T Corp. (NC) 47 4,290,280 8.98 3.02 5 SunTrust Banks Inc. (GA) 30 2,900,220 6.07 1.96 6 United Bankshares Inc. (WV) 16 1,893,419 3.96 37.82 7 Citigroup Inc. (NY) 6 1,873,375 3.92 0.40 8 Cardinal Financial Corp. (VA) 11 1,576,857 3.30 53.32 9 PNC Financial Services Group (PA) 37 1,400,396 2.93 .59 10 Burke & Herbert Bank & Trust (VA) 12 879,726 1.84 39.40 11 Access National Corp. (VA) 3 831,653 1.74 90.04 Total For Institutions In Market 332 47,769,747 Fairfax County VA 2015 Deposits - SNL Financial

ANCX DELIVERS AGAINST STRATEGIC GOALS Strategic Financial TargetsROE 12%+ROA 1.20%+Tangible Equity/Asset Ratio 8.0% - 10.50%5%+ Basic Earnings Growth$100MM/year Loan/Deposit Growth80% Earnings from Core BankBank-only Efficiency Ratio <60%$1.5B Total Assets 3-years 13 Financial targets to be recast post settlement with MBRG.
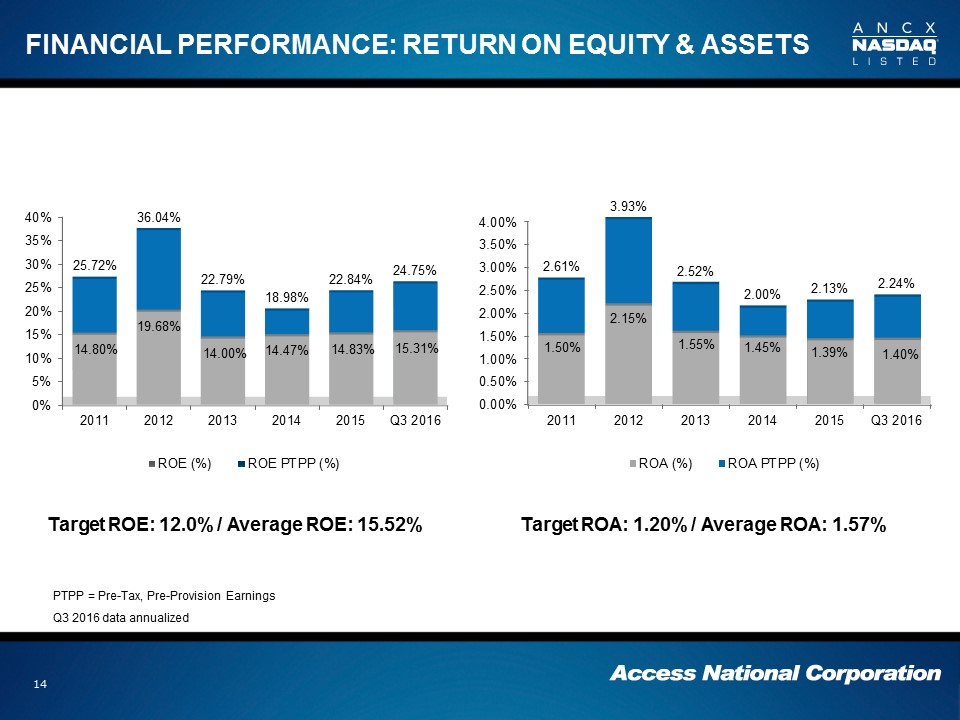
14 FINANCIAL PERFORMANCE: RETURN ON EQUITY & ASSETS Target ROA: 1.20% / Average ROA: 1.57% Target ROE: 12.0% / Average ROE: 15.52% PTPP = Pre-Tax, Pre-Provision EarningsQ3 2016 data annualized

People & technology drive deposit growth, 5 offices support the effort. Production leadership possess extensive in-market experience * Loans Held for Investment Excludes Loans Held for Sale 15 FINANCIAL PERFORMANCE: LOAN/DEPOSIT GROWTH

Relationships with operating businesses / related professionals drive our business. C&I loans dominate post-recession loan growth. *Chart reflects loans held for investment only. FINANCIAL PERFORMANCE: LOAN PROFILE HELD FOR INVESTMENT 16

Core deposit funding has climbed consistently since the recession due to focus on operating companies Wholesale CDs fluctuate with loans held for sale and securities. See table in supplement.. FINANCIAL PERFORMANCE: DEPOSIT PROFILE 17

Focus is on quality loans with liquid and reliable markets.Skilled management focuses on profit and risk management. FEE INCOME STRATEGY: MORTGAGE VOLUME 18 *Q3 2016 data is annualized.

MORTGAGE BANKING: ADEPT AT EXECUTION Expert management at evaluating and adapting for risk and opportunityExperienced and tenured managementBest in class operational expertisePurchase loans 65% of YTD volumeExperienced at making tough decisions for long-term successRep/warranty reserve = $1.029 millionPriority is to manage for measured risk and profit 19 Dean HackemerDivision President
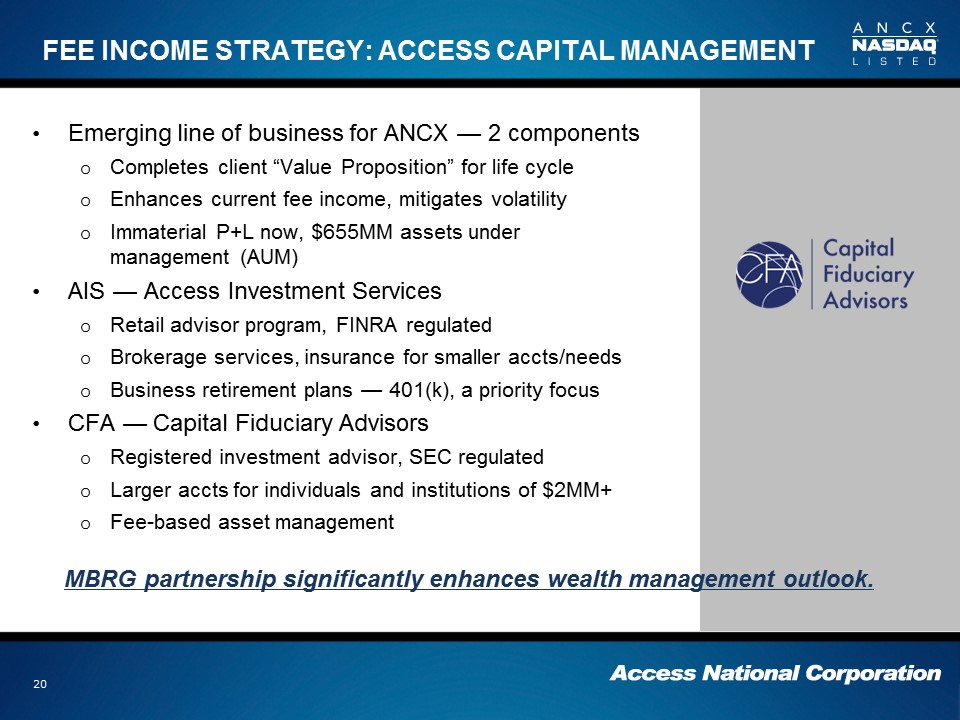
FEE INCOME STRATEGY: ACCESS CAPITAL MANAGEMENT Emerging line of business for ANCX — 2 componentsCompletes client “Value Proposition” for life cycleEnhances current fee income, mitigates volatilityImmaterial P+L now, $655MM assets under management (AUM)AIS — Access Investment ServicesRetail advisor program, FINRA regulatedBrokerage services, insurance for smaller accts/needsBusiness retirement plans — 401(k), a priority focusCFA — Capital Fiduciary AdvisorsRegistered investment advisor, SEC regulatedLarger accts for individuals and institutions of $2MM+Fee-based asset management 20 MBRG partnership significantly enhances wealth management outlook.
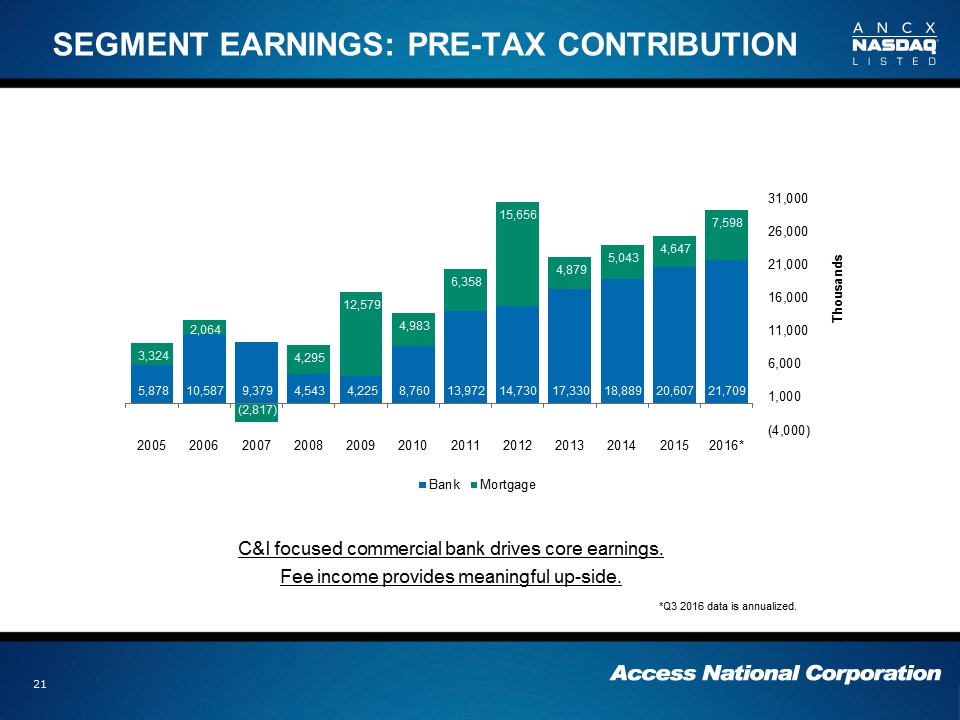
C&I focused commercial bank drives core earnings.Fee income provides meaningful up-side.Fee income provides meaningful up-side. SEGMENT EARNINGS: PRE-TAX CONTRIBUTION 21 *Q3 2016 data is annualized.

Profitable and steady dividends paid throughout the financial crisis. $0.35 Special Dividend paid Q1 2015 Regular Dividend Q1 2015 = $0.14 / share FINANCIAL PERFORMANCE: EARNINGS PER SHARE 22 - All EPS are primary *Q3 2016 data is annualized.
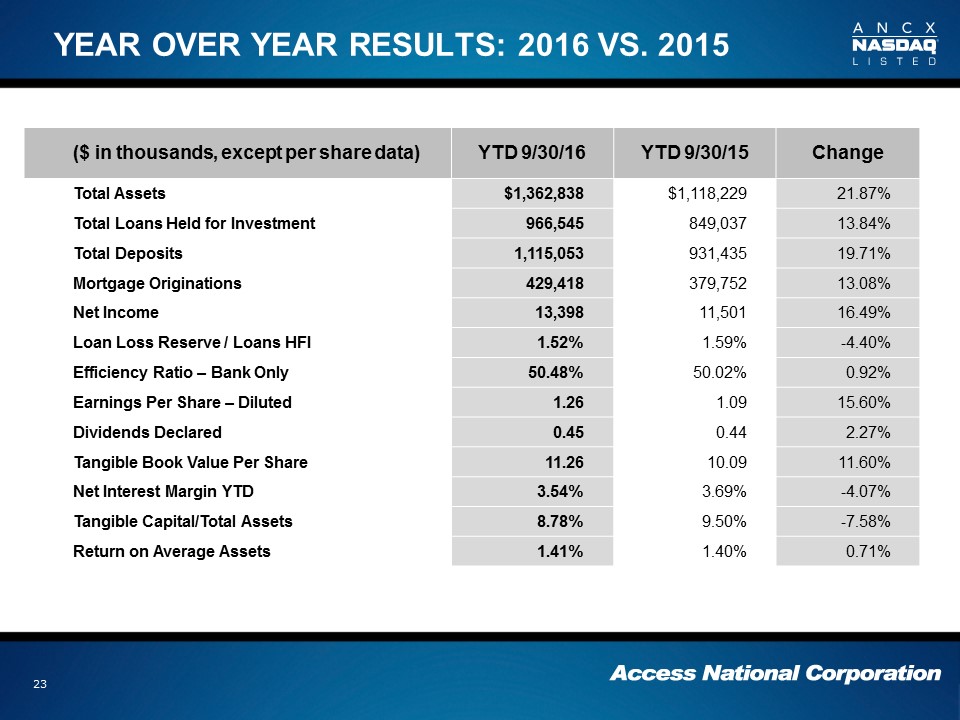
YEAR OVER YEAR RESULTS: 2016 VS. 2015 23 ($ in thousands, except per share data) YTD 9/30/16 YTD 9/30/15 Change Total Assets $1,362,838 $1,118,229 21.87% Total Loans Held for Investment 966,545 849,037 13.84% Total Deposits 1,115,053 931,435 19.71% Mortgage Originations 429,418 379,752 13.08% Net Income 13,398 11,501 16.49% Loan Loss Reserve / Loans HFI 1.52% 1.59% -4.40% Efficiency Ratio – Bank Only 50.48% 50.02% 0.92% Earnings Per Share – Diluted 1.26 1.09 15.60% Dividends Declared 0.45 0.44 2.27% Tangible Book Value Per Share 11.26 10.09 11.60% Net Interest Margin YTD 3.54% 3.69% -4.07% Tangible Capital/Total Assets 8.78% 9.50% -7.58% Return on Average Assets 1.41% 1.40% 0.71%
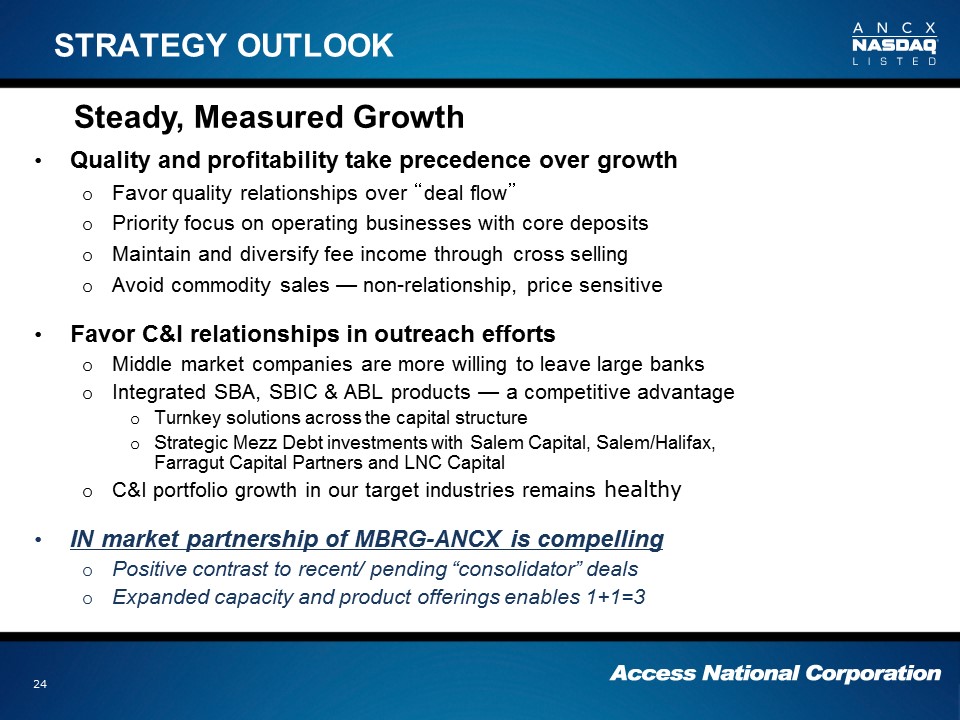
STRATEGY OUTLOOK Quality and profitability take precedence over growthFavor quality relationships over “deal flow”Priority focus on operating businesses with core depositsMaintain and diversify fee income through cross sellingAvoid commodity sales — non-relationship, price sensitive Favor C&I relationships in outreach effortsMiddle market companies are more willing to leave large banksIntegrated SBA, SBIC & ABL products — a competitive advantageTurnkey solutions across the capital structureStrategic Mezz Debt investments with Salem Capital, Salem/Halifax, Farragut Capital Partners and LNC CapitalC&I portfolio growth in our target industries remains healthyIN market partnership of MBRG-ANCX is compellingPositive contrast to recent/ pending “consolidator” dealsExpanded capacity and product offerings enables 1+1=3 24 Steady, Measured Growth
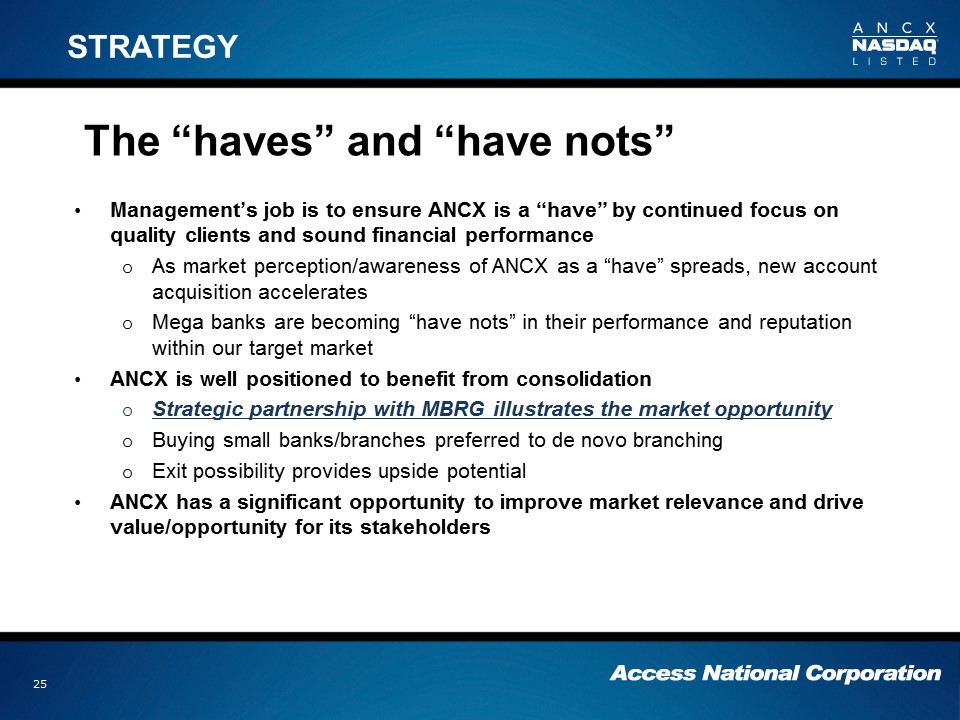
The “haves” and “have nots” Management’s job is to ensure ANCX is a “have” by continued focus on quality clients and sound financial performanceAs market perception/awareness of ANCX as a “have” spreads, new account acquisition acceleratesMega banks are becoming “have nots” in their performance and reputation within our target marketANCX is well positioned to benefit from consolidationStrategic partnership with MBRG illustrates the market opportunityBuying small banks/branches preferred to de novo branchingExit possibility provides upside potential ANCX has a significant opportunity to improve market relevance and drive value/opportunity for its stakeholders 25 STRATEGY

CAPITAL MANAGEMENT STRATEGY Tangible Capital to Asset Ratio target range 8.0% - 10.50%At Q3 2016 ratio stood at 8.78%, cushion for growthUpdate - Preservation of capital a priority with M&A pendingSpecial dividends likely when capital exceeds 10.50% Share repurchase program in effect for value buysManage dilutive effect of options, keep positive pressure on EPSUpdate - Suspended with M&A pendingDividend outlook positive — $0.15 recent quarterly dividend rate Increases unlikely with M&A pending, otherwise:Target Payout — 40-50% of “core” earnings. Q3 2016 payout = 36%Dividend yield: 2.5% +/- attracts, broadens investor baseBias to increase routine dividends when cushion existsReinvestment/stock purchase plan stimulates retail investor activity 26

Steady book value protects downside risks, YOY Growth 14.6% (Left Axis). CAREFUL EXECUTION DRIVES BOOK VALUE AND INCOME 27 *Interim Q Dividend Data is Annualized.

Why Invest in ANCX? BUILDING SHAREHOLDER VALUEReturns Independent of “Market Value”$11.26…………………………Tangible Book Value Q3 2016$10.09…………………………Tangible Book Value Q3 2015$ 1.17…………………………TBV Increase- YOYAdd:$ 0.60…………………………Dividends Paid last 12 months$ 1.77…………………………Tangible Value Delivered 17.54%……………….…YOY Return on Book Value 28

CAPITAL TO LEVERAGE 29 AS OF SEPTEMBER 30, 2016 REGULATORY RATIOS
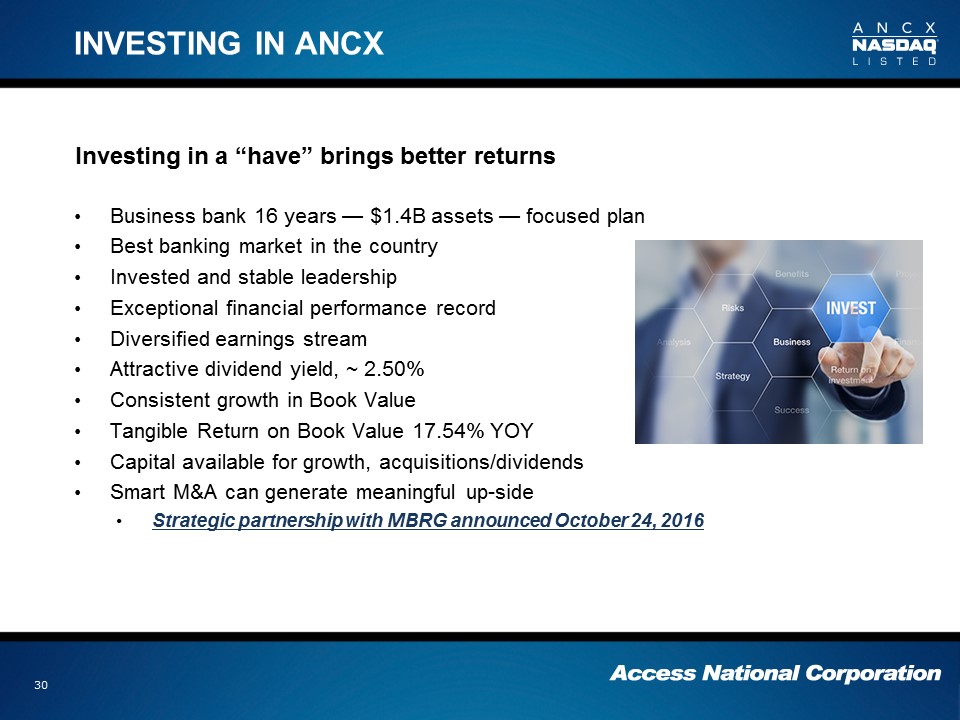
INVESTING IN ANCX Investing in a “have” brings better returns Business bank 16 years — $1.4B assets — focused planBest banking market in the countryInvested and stable leadershipExceptional financial performance recordDiversified earnings streamAttractive dividend yield, ~ 2.50%Consistent growth in Book Value Tangible Return on Book Value 17.54% YOY Capital available for growth, acquisitions/dividendsSmart M&A can generate meaningful up-sideStrategic partnership with MBRG announced October 24, 2016 30

SELECT INVESTOR DETAIL 31

LOAN PORTFOLIO PROFILE 32 September 30, 2016 December 31, 2015 (Dollars In Thousands) Amount % Total Amount % Total CRE Owner occupied $ 238,224 57.74% $ 219,877 59.84% CRE Non-owner occupied 174,342 42.26% 147,580 40.16% 100.00% 100.00% Commercial real estate — all $ 412,566 42.68% $ 367,457 41.40% Residential real estate 202,605 20.96% 201,447 22.70% Commercial 264,794 27.40% 242,527 27.33% Real estate construction 79,621 8.24% 66,003 7.44% Consumer 6,959 0.72% 10,044 1.13% Total loans $ 966,545 100.00% $ 887,478 100.00% Less allowance for loan losses 14,696 13,563 $ 951,849 $ 873,915 Highlights Commercial loan balances increased 8.9% since December 31, 2015 Year over year increase in total loans is 13.84%
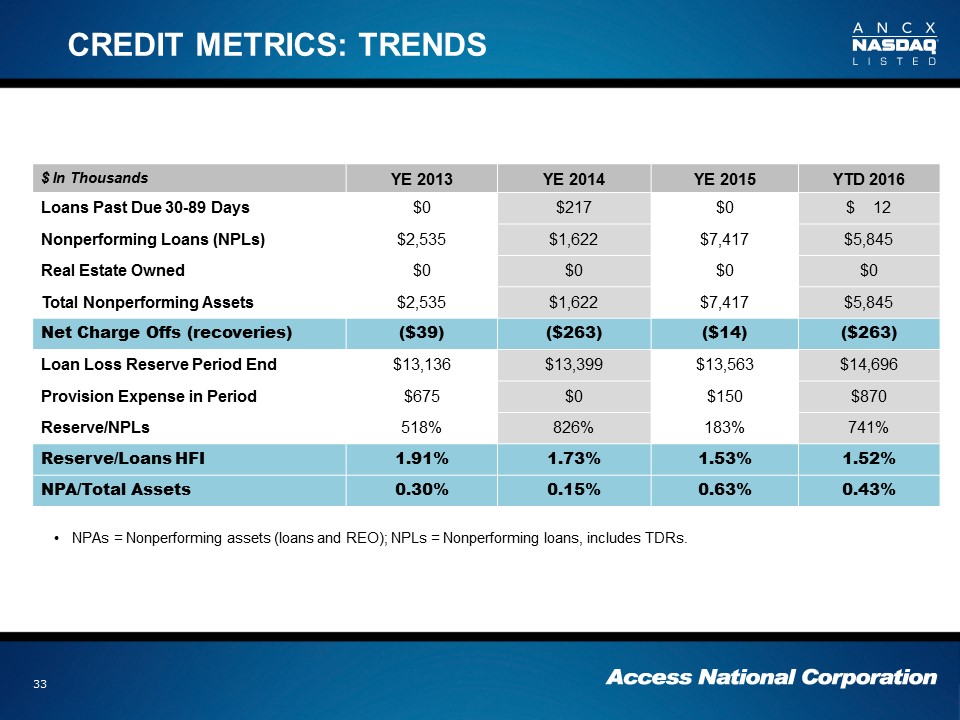
CREDIT METRICS: TRENDS $ In Thousands YE 2013 YE 2014 YE 2015 YTD 2016 Loans Past Due 30-89 Days $0 $217 $0 $ 12 Nonperforming Loans (NPLs) $2,535 $1,622 $7,417 $5,845 Real Estate Owned $0 $0 $0 $0 Total Nonperforming Assets $2,535 $1,622 $7,417 $5,845 Net Charge Offs (recoveries) ($39) ($263) ($14) ($263) Loan Loss Reserve Period End $13,136 $13,399 $13,563 $14,696 Provision Expense in Period $675 $0 $150 $870 Reserve/NPLs 518% 826% 183% 741% Reserve/Loans HFI 1.91% 1.73% 1.53% 1.52% NPA/Total Assets 0.30% 0.15% 0.63% 0.43% NPAs = Nonperforming assets (loans and REO); NPLs = Nonperforming loans, includes TDRs. 33

DEPOSIT PORTFOLIO PROFILE 34 September 30, 2016 December 31, 2015 (Dollars In Thousands) Amount % Total Amount % Total Core Deposits: Demand deposits $ 409,558 42.51 $ 307,797 42.64 Interest-bearing demand deposits 124,856 12.96 127,980 17.73 Savings and money market 265,308 27.54 150,021 20.78 Time deposits 163,744 16.99 136,022 18.85 Total Core Deposits 963,466 100.00 721,820 100.00 Wholesale Deposits: Brokered deposits 68,483 45.18 103,390 53.87 CDARS 83,104 54.82 88,534 46.13 Total Wholesale Deposits 151,587 100.00 191,924 100.00 Total Deposits $ 1,115,053 $ 913,744 Core Deposits defined as direct customer relationships without regard to dollar amount. Wholesale deposits issued by the Bank on a discretionary basis to rate sensitive institutional accounts.

VALUABLE DEPOSITOR BASE Significant Corporate Customer BaseDDAs/Total Deposits: 36.7%DDA + Repo Sweep Balances/Total Deposit + Repo Sweep Balances = 37.6% ($426MM)Average Money Market Acct: $369,215Average NOW Account: $142,220E-deposit Volume/Cash Letter: ~76%Internet Banking Penetration of Core Business Depositors: ~ 72%Transaction acct growth: 9.0% YTD 2016; 8.7% 2015; 7.0% in 2014; 5.9% in 2013; 17.7% in 2012 35 Interim Q data Annualized.

MORTGAGE CONTRIBUTION: KEY PERFORMANCE MEASURE 36 (Dollars in thousands)

Holding company and “other” account for the negative difference in consolidation. ANCX OPERATING PERFORMANCE 37 Pre-Tax Segment Contribution FY 2005 Forward Period Bank Mortgage Cons Pre-Tax Bank ROAA ROAE 2005 5,878,000 3,324,000 9,202,000 64% 1.26% 20.63% 2006 10,587,000 2,064,000 12,651,000 84% 1.29% 17.15% 2007 9,379,000 (2,817,000) 6,562,000 143% 0.57% 5.84% 2008 4,543,000 4,295,000 8,838,000 51% 0.76% 8.34% 2009 4,225,000 12,579,000 16,804,000 25% 1.35% 15.04% 2010 8,760,000 4,983,000 13,743,000 64% 0.98% 10.85% 2011 13,972,000 6,358,000 20,330,000 69% 1.50% 14.80% 2012 14,730,000 15,656,000 30,386,000 48% 2.15% 19.68% 2013 17,330,000 4,879,000 22,209,000 78% 1.55% 14.00% 2014 18,889,000 5,043,000 23,932,000 79% 1.45% 14.47% 2015 20,606,000 4,647,000 23,596,000 87% 1.39% 14.83% YTD 2016 16,282,000 5,698,000 20,661,000 79% 1.41% 15.56% Totals $145,181,000 $66,709,000 $208,914,000 73% 1.31% 14.27%

Visitors are welcome! Michael W. ClarkePresident and CEO, Access National CorporationCEO, Access National [email protected] C. ShoemakerChief Banking [email protected] D. MoorePresident, Access National [email protected] Meg M. Taylor, CPAEVP, [email protected] F. HackemerMortgage Division [email protected] M. LintonVP, Corporate SecretaryInvestor [email protected] 38 CONTACTS 1800 Robert Fulton Drive, Reston, Virginia 20191 | 703-871-2100 | AccessNationalBank.com
Serious News for Serious Traders! Try StreetInsider.com Premium Free!
You May Also Be Interested In
- IDEX Biometrics 2023 annual report and 2023 executive remuneration report
- NorthEast Community Bancorp, Inc. Reports Results for the Three Months Ended March 31, 2024
- Jessica Holmes Launches the 2024 Defeat Depression Campaign to Encourage Canada-Wide Participation
Create E-mail Alert Related Categories
SEC FilingsSign up for StreetInsider Free!
Receive full access to all new and archived articles, unlimited portfolio tracking, e-mail alerts, custom newswires and RSS feeds - and more!
