

Form 10-Q NATIONAL OILWELL VARCO For: Jun 30
 Tweet
Tweet Share
Share
UNITED STATES
SECURITIES AND EXCHANGE COMMISSION
Washington, D.C. 20549
FORM 10-Q
(Mark one)
| x | QUARTERLY REPORT PURSUANT TO SECTION 13 OR 15(d) OF THE SECURITIES EXCHANGE ACT OF 1934 |
FOR THE QUARTERLY PERIOD ENDED JUNE 30, 2016
OR
| ¨ | TRANSITION REPORT PURSUANT TO SECTION 13 OR 15(d) OF THE SECURITIES EXCHANGE ACT OF 1934 |
Commission File Number 1-12317
NATIONAL OILWELL VARCO, INC.
(Exact name of registrant as specified in its charter)
| Delaware | 76-0475815 | |
| (State or other jurisdiction of incorporation or organization) |
(I.R.S. Employer Identification No.) |
7909 Parkwood Circle Drive
Houston, Texas
77036-6565
(Address of principal executive offices)
(713) 346-7500
(Registrant’s telephone number, including area code)
Indicate by check mark whether the registrant (1) has filed all reports required to be filed by Section 13 or 15(d) of the Securities Exchange Act of 1934 during the preceding 12 months (or for such shorter period that the registrant was required to file such reports), and (2) has been subject to such filing requirements for the past 90 days. Yes x No ¨
Indicate by check mark whether the registrant has submitted electronically and posted on its corporate Web site, if any, every Interactive Data File required to be submitted and posted pursuant to Rule 405 of Regulation S-T (§232.405 of this chapter) during the preceding 12 months (or for such shorter period that the registrant was required to submit and post such files). Yes x No ¨
Indicate by check mark whether the registrant is a large accelerated filer, an accelerated filer, a non-accelerated filer, or a smaller reporting company. See the definitions of “large accelerated filer,” “accelerated filer” and “smaller reporting company” in Rule 12b-2 of the Exchange Act. (Check one):
| Large accelerated filer | þ | Accelerated filer | ¨ | |||
| Non-accelerated filer | ¨ (Do not check if a smaller reporting company) | Smaller reporting company | ¨ | |||
Indicate by check mark whether the registrant is a shell company (as defined in Rule 12b-2 of the Exchange Act). Yes ¨ No þ
As of July 29, 2016 the registrant had 377,631,319 shares of common stock, par value $0.01 per share, outstanding.
PART I—FINANCIAL INFORMATION
Item 1. Financial Statements
NATIONAL OILWELL VARCO, INC.
CONSOLIDATED BALANCE SHEETS (UNAUDITED)
(In millions, except share data)
| June 30, 2016 |
December 31, 2015 |
|||||||
| ASSETS |
||||||||
| Current assets: |
||||||||
| Cash and cash equivalents |
$ | 1,661 | $ | 2,080 | ||||
| Receivables, net |
2,044 | 2,926 | ||||||
| Inventories, net |
4,287 | 4,678 | ||||||
| Costs in excess of billings |
790 | 1,250 | ||||||
| Prepaid and other current assets |
422 | 491 | ||||||
|
|
|
|
|
|||||
| Total current assets |
9,204 | 11,425 | ||||||
| Property, plant and equipment, net |
3,277 | 3,124 | ||||||
| Deferred income taxes |
147 | 130 | ||||||
| Goodwill |
6,986 | 6,980 | ||||||
| Intangibles, net |
3,709 | 3,849 | ||||||
| Investment in unconsolidated affiliates |
314 | 327 | ||||||
| Other assets |
147 | 135 | ||||||
|
|
|
|
|
|||||
| Total assets |
$ | 23,784 | $ | 25,970 | ||||
|
|
|
|
|
|||||
| LIABILITIES AND STOCKHOLDERS’ EQUITY |
||||||||
| Current liabilities: |
||||||||
| Accounts payable |
$ | 434 | $ | 623 | ||||
| Accrued liabilities |
1,774 | 2,284 | ||||||
| Billings in excess of costs |
653 | 785 | ||||||
| Current portion of long-term debt and short-term borrowings |
12 | 2 | ||||||
| Accrued income taxes |
74 | 264 | ||||||
|
|
|
|
|
|||||
| Total current liabilities |
2,947 | 3,958 | ||||||
| Long-term debt |
3,268 | 3,907 | ||||||
| Deferred income taxes |
1,103 | 1,362 | ||||||
| Other liabilities |
280 | 283 | ||||||
|
|
|
|
|
|||||
| Total liabilities |
7,598 | 9,510 | ||||||
|
|
|
|
|
|||||
| Commitments and contingencies |
||||||||
| Stockholders’ equity: |
||||||||
| Common stock - par value $.01; 1 billion shares authorized; 377,085,852 and 375,764,794
shares |
4 | 4 | ||||||
| Additional paid-in capital |
8,040 | 8,005 | ||||||
| Accumulated other comprehensive loss |
(1,325 | ) | (1,553 | ) | ||||
| Retained earnings |
9,399 | 9,927 | ||||||
|
|
|
|
|
|||||
| Total Company stockholders’ equity |
16,118 | 16,383 | ||||||
| Noncontrolling interests |
68 | 77 | ||||||
|
|
|
|
|
|||||
| Total stockholders’ equity |
16,186 | 16,460 | ||||||
|
|
|
|
|
|||||
| Total liabilities and stockholders’ equity |
$ | 23,784 | $ | 25,970 | ||||
|
|
|
|
|
|||||
See notes to unaudited consolidated financial statements.
2
NATIONAL OILWELL VARCO, INC.
CONSOLIDATED STATEMENTS OF INCOME (LOSS) (UNAUDITED)
(In millions, except per share data)
| Three Months Ended June 30, |
Six Months Ended June 30, |
|||||||||||||||
| 2016 | 2015 | 2016 | 2015 | |||||||||||||
| Revenue |
$ | 1,724 | $ | 3,909 | $ | 3,913 | $ | 8,729 | ||||||||
| Cost of revenue |
1,689 | 3,054 | 3,634 | 6,697 | ||||||||||||
|
|
|
|
|
|
|
|
|
|||||||||
| Gross profit |
35 | 855 | 279 | 2,032 | ||||||||||||
| Selling, general and administrative |
305 | 417 | 738 | 1,024 | ||||||||||||
|
|
|
|
|
|
|
|
|
|||||||||
| Operating profit (loss) |
(270 | ) | 438 | (459 | ) | 1,008 | ||||||||||
| Interest and financial costs |
(30 | ) | (26 | ) | (55 | ) | (52 | ) | ||||||||
| Interest income |
3 | 2 | 8 | 7 | ||||||||||||
| Equity income (loss) in unconsolidated affiliates |
(7 | ) | 7 | (13 | ) | 16 | ||||||||||
| Other income (expense), net |
(34 | ) | (30 | ) | (55 | ) | (86 | ) | ||||||||
|
|
|
|
|
|
|
|
|
|||||||||
| Income (loss) before income taxes |
(338 | ) | 391 | (574 | ) | 893 | ||||||||||
| Provision for income taxes |
(121 | ) | 105 | (239 | ) | 294 | ||||||||||
|
|
|
|
|
|
|
|
|
|||||||||
| Net income (loss) |
(217 | ) | 286 | (335 | ) | 599 | ||||||||||
| Net income (loss) attributable to noncontrolling interests |
— | (3 | ) | 1 | — | |||||||||||
|
|
|
|
|
|
|
|
|
|||||||||
| Net income (loss) attributable to Company |
$ | (217 | ) | $ | 289 | $ | (336 | ) | $ | 599 | ||||||
|
|
|
|
|
|
|
|
|
|||||||||
| Net income (loss) attributable to Company per share: |
||||||||||||||||
| Basic |
$ | (0.58 | ) | $ | 0.75 | $ | (0.90 | ) | $ | 1.51 | ||||||
|
|
|
|
|
|
|
|
|
|||||||||
| Diluted |
$ | (0.58 | ) | $ | 0.74 | $ | (0.90 | ) | $ | 1.51 | ||||||
|
|
|
|
|
|
|
|
|
|||||||||
| Cash dividends per share |
$ | 0.05 | $ | 0.46 | $ | 0.51 | $ | 0.92 | ||||||||
|
|
|
|
|
|
|
|
|
|||||||||
| Weighted average shares outstanding: |
||||||||||||||||
| Basic |
375 | 387 | 375 | 397 | ||||||||||||
|
|
|
|
|
|
|
|
|
|||||||||
| Diluted |
375 | 388 | 375 | 398 | ||||||||||||
|
|
|
|
|
|
|
|
|
|||||||||
See notes to unaudited consolidated financial statements.
3
NATIONAL OILWELL VARCO, INC.
CONSOLIDATED STATEMENTS OF COMPREHENSIVE INCOME (LOSS) (UNAUDITED)
(In millions)
| Three Months Ended June 30, |
Six Months Ended June 30, |
|||||||||||||||
| 2016 | 2015 | 2016 | 2015 | |||||||||||||
| Net income (loss) |
$ | (217 | ) | $ | 286 | $ | (335 | ) | $ | 599 | ||||||
| Currency translation adjustments |
(46 | ) | 107 | 97 | (311 | ) | ||||||||||
| Changes in derivative financial instruments, net of tax |
29 | 92 | 131 | 26 | ||||||||||||
|
|
|
|
|
|
|
|
|
|||||||||
| Comprehensive income (loss) |
(234 | ) | 485 | (107 | ) | 314 | ||||||||||
| Comprehensive income (loss) attributable to noncontrolling interest |
— | (3 | ) | 1 | — | |||||||||||
|
|
|
|
|
|
|
|
|
|||||||||
| Comprehensive income (loss) attributable to Company |
$ | (234 | ) | $ | 488 | $ | (108 | ) | $ | 314 | ||||||
|
|
|
|
|
|
|
|
|
|||||||||
See notes to unaudited consolidated financial statements.
4
NATIONAL OILWELL VARCO, INC.
CONSOLIDATED STATEMENTS OF CASH FLOWS (UNAUDITED)
(In millions)
| Six Months Ended June 30, |
||||||||
| 2016 | 2015 | |||||||
| Cash flows from operating activities: |
||||||||
| Net income (loss) |
$ | (335 | ) | $ | 599 | |||
| Adjustments to reconcile net income (loss) to net cash provided by operating activities: |
||||||||
| Depreciation and amortization |
353 | 380 | ||||||
| Deferred income taxes |
(288 | ) | 26 | |||||
| Equity (income) loss in unconsolidated affiliates |
13 | (16 | ) | |||||
| Dividend from unconsolidated affiliate |
6 | 34 | ||||||
| Other, net |
195 | 162 | ||||||
| Change in operating assets and liabilities, net of acquisitions: |
||||||||
| Receivables |
858 | 907 | ||||||
| Inventories |
320 | (192 | ) | |||||
| Costs in excess of billings |
460 | 68 | ||||||
| Prepaid and other current assets |
70 | 41 | ||||||
| Accounts payable |
(190 | ) | (343 | ) | ||||
| Accrued liabilities |
(514 | ) | (498 | ) | ||||
| Billings in excess of costs |
(132 | ) | (507 | ) | ||||
| Income taxes payable |
(190 | ) | (406 | ) | ||||
| Other assets/liabilities, net |
123 | 53 | ||||||
|
|
|
|
|
|||||
| Net cash provided by operating activities |
749 | 308 | ||||||
|
|
|
|
|
|||||
| Cash flows from investing activities: |
||||||||
| Purchases of property, plant and equipment |
(161 | ) | (234 | ) | ||||
| Business acquisitions, net of cash acquired |
(36 | ) | (44 | ) | ||||
| Other |
3 | 6 | ||||||
|
|
|
|
|
|||||
| Net cash used in investing activities |
(194 | ) | (272 | ) | ||||
|
|
|
|
|
|||||
| Cash flows from financing activities: |
||||||||
| Borrowings against lines of credit and other debt |
2,963 | 4,751 | ||||||
| Payments against lines of credit and other debt |
(3,748 | ) | (3,612 | ) | ||||
| Cash dividends paid |
(192 | ) | (363 | ) | ||||
| Share repurchases |
— | (1,777 | ) | |||||
| Proceeds from stock options exercised |
1 | 5 | ||||||
| Other |
(14 | ) | (1 | ) | ||||
|
|
|
|
|
|||||
| Net cash used in financing activities |
(990 | ) | (997 | ) | ||||
| Effect of exchange rates on cash |
16 | (31 | ) | |||||
|
|
|
|
|
|||||
| Decrease in cash and cash equivalents |
(419 | ) | (992 | ) | ||||
| Cash and cash equivalents, beginning of period |
2,080 | 3,536 | ||||||
|
|
|
|
|
|||||
| Cash and cash equivalents, end of period |
$ | 1,661 | $ | 2,544 | ||||
|
|
|
|
|
|||||
| Supplemental disclosures of cash flow information: |
||||||||
| Cash payments during the period for: |
||||||||
| Interest |
$ | 53 | $ | 50 | ||||
| Income taxes |
$ | 120 | $ | 660 | ||||
See notes to unaudited consolidated financial statements.
5
NATIONAL OILWELL VARCO, INC.
Notes to Consolidated Financial Statements (Unaudited)
1. Basis of Presentation
The preparation of financial statements in conformity with generally accepted accounting principles (“GAAP”) in the United States requires management to make estimates and assumptions that affect reported and contingent amounts of assets and liabilities as of the date of the financial statements and reported amounts of revenues and expenses during the reporting period. Actual results could differ from those estimates.
The accompanying unaudited consolidated financial statements of National Oilwell Varco, Inc. (“NOV” or the “Company”) present information in accordance with GAAP in the United States for interim financial information and the instructions to Form 10-Q and applicable rules of Regulation S-X. They do not include all information or footnotes required by GAAP in the United States for complete consolidated financial statements and should be read in conjunction with our 2015 Annual Report on Form 10-K.
In our opinion, the consolidated financial statements include all adjustments, which are of a normal recurring nature, unless otherwise disclosed, necessary for a fair presentation of the results for the interim periods. Certain reclassifications have been made to the prior year financial statements in order for them to conform with the 2016 presentation. The results of operations for the three and six months ended June 30, 2016 are not necessarily indicative of the results to be expected for the full year.
Fair Value of Financial Instruments
The carrying amounts of cash and cash equivalents, receivables, and payables approximated fair value because of the relatively short maturity of these instruments. Cash equivalents include only those investments having a maturity date of three months or less at the time of purchase. See Note 7 for the fair value of long-term debt and Note 10 for the fair value of derivative financial instruments.
2. Inventories, net
Inventories consist of (in millions):
| June 30, 2016 |
December 31, 2015 |
|||||||
| Raw materials and supplies |
$ | 1,066 | $ | 1,069 | ||||
| Work in process |
605 | 632 | ||||||
| Finished goods and purchased products |
2,616 | 2,977 | ||||||
|
|
|
|
|
|||||
| Total |
$ | 4,287 | $ | 4,678 | ||||
|
|
|
|
|
|||||
6
3. Accrued Liabilities
Accrued liabilities consist of (in millions):
| June 30, 2016 |
December 31, 2015 |
|||||||
| Customer prepayments and billings |
$ | 355 | $ | 426 | ||||
| Vendor costs |
278 | 449 | ||||||
| Compensation |
232 | 241 | ||||||
| Warranty |
208 | 244 | ||||||
| Taxes (non-income) |
128 | 175 | ||||||
| Fair value of derivative financial instruments |
104 | 261 | ||||||
| Insurance |
97 | 113 | ||||||
| Commissions |
60 | 73 | ||||||
| Interest |
8 | 8 | ||||||
| Other |
304 | 294 | ||||||
|
|
|
|
|
|||||
| Total |
$ | 1,774 | $ | 2,284 | ||||
|
|
|
|
|
|||||
Service and Product Warranties
The Company provides service and warranty policies on certain of its products. The Company accrues liabilities under service and warranty policies based upon specific claims and a review of historical warranty and service claim experience in accordance with Accounting Standards Codification (“ASC”) Topic 450 “Contingencies”. Adjustments are made to accruals as claim data and historical experience change. In addition, the Company incurs discretionary costs to service its products in connection with product performance issues and accrues for them when they are encountered.
The changes in the carrying amount of service and product warranties are as follows (in millions):
| Balance at December 31, 2015 |
$ | 244 | ||
|
|
|
|||
| Net provisions for warranties issued during the year |
31 | |||
| Amounts incurred |
(67 | ) | ||
| Currency translation adjustments and other |
— | |||
|
|
|
|||
| Balance at June 30, 2016 |
$ | 208 | ||
|
|
|
4. Costs and Estimated Earnings on Uncompleted Contracts
Costs and estimated earnings on uncompleted contracts consist of (in millions):
| June 30, 2016 |
December 31, 2015 |
|||||||
| Costs incurred on uncompleted contracts |
$ | 7,937 | $ | 9,082 | ||||
| Estimated earnings |
3,700 | 4,080 | ||||||
|
|
|
|
|
|||||
| 11,637 | 13,162 | |||||||
| Less: Billings to date |
11,500 | 12,697 | ||||||
|
|
|
|
|
|||||
| $ | 137 | $ | 465 | |||||
|
|
|
|
|
|||||
| Costs and estimated earnings in excess of billings on uncompleted contracts |
$ | 790 | $ | 1,250 | ||||
| Billings in excess of costs and estimated earnings on uncompleted contracts |
(653 | ) | (785 | ) | ||||
|
|
|
|
|
|||||
| $ | 137 | $ | 465 | |||||
|
|
|
|
|
|||||
7
5. Accumulated Other Comprehensive Income (Loss)
The components of accumulated other comprehensive income (loss) are as follows (in millions):
| Currency Translation Adjustments |
Derivative Financial Instruments, Net of Tax |
Defined Benefit Plans, Net of Tax |
Total | |||||||||||||
| Balance at December 31, 2015 |
$ | (1,279 | ) | $ | (205 | ) | $ | (69 | ) | $ | (1,553 | ) | ||||
| Accumulated other comprehensive income (loss) before reclassifications |
97 | 47 | — | 144 | ||||||||||||
| Amounts reclassified from accumulated other comprehensive income (loss) |
|
— |
|
|
84 |
|
|
— |
|
|
84 |
| ||||
|
|
|
|
|
|
|
|
|
|||||||||
| Balance at June 30, 2016 |
$ | (1,182 | ) | $ | (74 | ) | $ | (69 | ) | $ | (1,325 | ) | ||||
|
|
|
|
|
|
|
|
|
|||||||||
The components of amounts reclassified from accumulated other comprehensive income (loss) are as follows (in millions):
| Three Months Ended June 30, | ||||||||||||||||||||||||||||||||
| 2016 | 2015 | |||||||||||||||||||||||||||||||
| Currency Translation Adjustments |
Derivative Financial Instruments |
Defined Benefit Plans |
Total | Currency Translation Adjustments |
Derivative Financial Instruments |
Defined Benefit Plans |
Total | |||||||||||||||||||||||||
| Revenue |
$ | — | $ | (2 | ) | $ | — | $ | (2 | ) | $ | — | $ | (66 | ) | $ | — | $ | (66 | ) | ||||||||||||
| Cost of revenue |
— | 46 | — | 46 | — | 153 | — | 153 | ||||||||||||||||||||||||
| Tax effect |
— | (12 | ) | — | (12 | ) | — | (26 | ) | — | (26 | ) | ||||||||||||||||||||
|
|
|
|
|
|
|
|
|
|
|
|
|
|
|
|
|
|||||||||||||||||
| $ | — | $ | 32 | $ | — | $ | 32 | $ | — | $ | 61 | $ | — | $ | 61 | |||||||||||||||||
|
|
|
|
|
|
|
|
|
|
|
|
|
|
|
|
|
|||||||||||||||||
| Six Months Ended June 30, | ||||||||||||||||||||||||||||||||
| 2016 | 2015 | |||||||||||||||||||||||||||||||
| Currency Translation Adjustments |
Derivative Financial Instruments |
Defined Benefit Plans |
Total | Currency Translation Adjustments |
Derivative Financial Instruments |
Defined Benefit Plans |
Total | |||||||||||||||||||||||||
| Revenue |
$ | — | $ | (3 | ) | $ | — | $ | (3 | ) | $ | — | $ | (1 | ) | $ | — | $ | (1 | ) | ||||||||||||
| Cost of revenue |
— | 122 | — | 122 | — | 152 | — | 152 | ||||||||||||||||||||||||
| Other income (expense), net |
— | — | — | — | — | — | — | — | ||||||||||||||||||||||||
| Tax effect |
— | (35 | ) | — | (35 | ) | — | (44 | ) | — | (44 | ) | ||||||||||||||||||||
|
|
|
|
|
|
|
|
|
|
|
|
|
|
|
|
|
|||||||||||||||||
| $ | — | $ | 84 | $ | — | $ | 84 | $ | — | $ | 107 | $ | — | $ | 107 | |||||||||||||||||
|
|
|
|
|
|
|
|
|
|
|
|
|
|
|
|
|
|||||||||||||||||
The Company’s reporting currency is the U.S. dollar. A majority of the Company’s international entities in which there is a substantial investment have the local currency as their functional currency. As a result, currency translation adjustments resulting from the process of translating the entities’ financial statements into the reporting currency are reported in other comprehensive income or loss in accordance with ASC Topic 830 “Foreign Currency Matters” (“ASC Topic 830”). For the three months ended June 30, 2016, a majority of these local currencies weakened against the U.S. dollar resulting in net other comprehensive loss of $46 million, upon the translation from local currencies to the U.S. dollar. For the six months ended June 30, 2016, a majority of these local currencies strengthened against the U.S. dollar resulting in net other comprehensive income of $97 million, upon the translation from local currencies to the U.S. dollar. For the three months ended June 30, 2015, a majority of these local currencies strengthened against the U.S. dollar resulting in net other comprehensive income of $107 million, upon the translation from local currencies to the U.S. dollar. For the six months ended June 30, 2015, a majority of these local currencies weakened against the U.S. dollar resulting in net other comprehensive loss of $311 million, upon the translation from local currencies to the U.S. dollar.
The effect of changes in the fair values of derivatives designated as cash flow hedges are accumulated in other comprehensive income or loss, net of tax, until the underlying transactions to which they are designed to hedge are realized. The movement in other comprehensive income or loss from period to period will be the result of the combination of changes in fair value for open derivatives and the outflow of other comprehensive income or loss related to cumulative changes in the fair value of derivatives that have settled in the current or prior periods. The accumulated effect was other comprehensive income of $29 million (net of tax of $12 million) and $131 million (net of tax of $52 million) for the three and six months ended June 30, 2016, respectively. The accumulated effect was other comprehensive income of $92 million (net of tax of $34 million) and $26 million (net of tax of $13 million) for the three and six months ended June 30, 2015, respectively.
8
6. Business Segments
Operating results by segment are as follows (in millions):
| Three Months Ended June 30, |
Six Months Ended June 30, |
|||||||||||||||
| 2016 | 2015 | 2016 | 2015 | |||||||||||||
| Revenue: |
||||||||||||||||
| Rig Systems |
$ | 564 | $ | 1,930 | $ | 1,490 | $ | 4,453 | ||||||||
| Rig Aftermarket |
364 | 657 | 755 | 1,376 | ||||||||||||
| Wellbore Technologies |
511 | 956 | 1,142 | 2,127 | ||||||||||||
| Completion & Production Solutions |
538 | 873 | 1,096 | 1,821 | ||||||||||||
| Eliminations |
(253 | ) | (507 | ) | (570 | ) | (1,048 | ) | ||||||||
|
|
|
|
|
|
|
|
|
|||||||||
| Total revenue |
$ | 1,724 | $ | 3,909 | $ | 3,913 | $ | 8,729 | ||||||||
|
|
|
|
|
|
|
|
|
|||||||||
| Operating profit (loss): |
||||||||||||||||
| Rig Systems |
$ | 7 | $ | 421 | $ | 74 | $ | 898 | ||||||||
| Rig Aftermarket |
62 | 153 | 131 | 357 | ||||||||||||
| Wellbore Technologies |
(146 | ) | 48 | (237 | ) | 143 | ||||||||||
| Completion & Production Solutions |
(33 | ) | 85 | (71 | ) | 173 | ||||||||||
| Eliminations and corporate costs |
(160 | ) | (269 | ) | (356 | ) | (563 | ) | ||||||||
|
|
|
|
|
|
|
|
|
|||||||||
| Total operating profit (loss) |
$ | (270 | ) | $ | 438 | $ | (459 | ) | $ | 1,008 | ||||||
|
|
|
|
|
|
|
|
|
|||||||||
| Operating profit (loss)%: |
||||||||||||||||
| Rig Systems |
1.2 | % | 21.8 | % | 5.0 | % | 20.2 | % | ||||||||
| Rig Aftermarket |
17.0 | % | 23.3 | % | 17.4 | % | 25.9 | % | ||||||||
| Wellbore Technologies |
(28.6 | %) | 5.0 | % | (20.8 | %) | 6.7 | % | ||||||||
| Completion & Production Solutions |
(6.1 | %) | 9.7 | % | (6.5 | %) | 9.5 | % | ||||||||
| Total operating profit (loss) % |
(15.7 | %) | 11.2 | % | (11.7 | %) | 11.5 | % | ||||||||
Sales from one segment to another generally are priced at estimated equivalent commercial selling prices; however, segments originating an external sale are credited with the full profit to the Company. Eliminations include intercompany transactions conducted between the four reporting segments that are eliminated in consolidation. Intercompany transactions within each reporting segment are eliminated within each reporting segment.
Included in operating profit are other items primarily related to costs associated with Voluntary Early Retirement Plans (“VERP”) established by the Company during the first quarters of 2016 and 2015 and certain costs related to severance and facility closures. As of June 30, 2016, the Company had approximately $72 million accrued for the VERP postretirement medical benefits. Other items by segment are as follows (in millions):
| Three Months Ended June 30, |
Six Months Ended June 30, |
|||||||||||||||
| 2016 | 2015 | 2016 | 2015 | |||||||||||||
| Other items: |
||||||||||||||||
| Rig Systems |
$ | 23 | $ | 3 | $ | 75 | $ | 43 | ||||||||
| Rig Aftermarket |
5 | 2 | 13 | 10 | ||||||||||||
| Wellbore Technologies |
50 | 9 | 88 | 54 | ||||||||||||
| Completion & Production Solutions |
38 | 3 | 72 | 32 | ||||||||||||
| Eliminations and corporate costs |
1 | — | 10 | — | ||||||||||||
|
|
|
|
|
|
|
|
|
|||||||||
| Total other items |
$ | 117 | $ | 17 | $ | 258 | $ | 139 | ||||||||
|
|
|
|
|
|
|
|
|
|||||||||
9
7. Debt
Debt consists of (in millions):
| June 30, | December 31, | |||||||
| 2016 | 2015 | |||||||
| $500 million in Senior Notes, interest at 1.35% payable semiannually, principal due on December 1, 2017 |
$ | 499 | $ | 498 | ||||
| $1.4 billion in Senior Notes, interest at 2.60% payable semiannually, principal due on December 1, 2022 |
1,390 | 1,389 | ||||||
| $1.1 billion in Senior Notes, interest at 3.95% payable semiannually, principal due on December 1, 2042 |
1,087 | 1,087 | ||||||
| Commercial paper |
108 | 890 | ||||||
| Other |
196 | 45 | ||||||
|
|
|
|
|
|||||
| Total debt |
3,280 | 3,909 | ||||||
| Less current portion |
12 | 2 | ||||||
|
|
|
|
|
|||||
| Long-term debt |
$ | 3,268 | $ | 3,907 | ||||
|
|
|
|
|
|||||
On January 1, 2016, the Company adopted Accounting Standards Update No. 2015-03 “Simplifying the Presentation of Debt Issuance Costs.” This update requires that debt issuance costs related to a recognized debt liability be presented in the balance sheet as a direct deduction from the carrying amount of that debt liability, consistent with debt discounts. We have applied the change retrospectively for prior period balances of unamortized debt issuance costs, resulting in a $21 million reduction in other assets and long-term debt on our consolidated balance sheet as of December 31, 2015. The table above now presents our debt liability net of the related debt discount and debt issuance costs.
The Company has a $4.5 billion, five-year credit facility which expires September 28, 2018. The Company also has a commercial paper program under which borrowings are classified as long-term since the program is supported by the $4.5 billion, five-year credit facility. At June 30, 2016, there were $110 million in commercial paper borrowings (gross of debt issuance costs), and there were no outstanding letters of credit issued under the credit facility, resulting in $4,390 million of funds available under this credit facility. Interest under this multicurrency facility is based upon LIBOR, NIBOR or EURIBOR plus 1.125% subject to a ratings-based grid, or the U.S. prime rate. The credit facility contains a financial covenant regarding maximum debt-to-capitalization ratio of 60%. As of June 30, 2016, the Company was in compliance with a debt-to-capitalization ratio of 16.8%.
The Company had $1,343 million of outstanding letters of credit at June 30, 2016 that are under various bilateral letter of credit facilities. Letters of credit are issued as bid bonds, advanced payment bonds and performance bonds.
The fair value of the Company’s debt is estimated using Level 2 inputs in the fair value hierarchy and is based on quoted prices for those or similar instruments. At June 30, 2016 and December 31, 2015, the fair value of the Company’s unsecured Senior Notes approximated $2,665 million and $2,551 million, respectively. At June 30, 2016 and December 31, 2015, the carrying value of the Company’s unsecured Senior Notes approximated $2,976 million and $2,974 million, respectively. The carrying value of the Company’s variable rate borrowings approximates fair value.
10
8. Tax
The effective tax rate for the three and six months ended June 30, 2016 was 35.8% and 41.6%, respectively, compared to 26.9% and 32.9% for the same periods in 2015. Lower tax rates on income earned in foreign jurisdictions, foreign dividends net of foreign tax credits, foreign exchange losses for tax reporting in Norway, and a reduction in tax reserves due to audit settlements provided tax benefits which, when applied to losses generated during the six-month period, resulted in a higher effective tax rate than the U.S. statutory rate. The tax benefits were partially offset by nondeductible expenses and an increase in valuation allowance on deferred taxes.
The difference between the effective tax rate reflected in the provision for income taxes and the U.S. federal statutory rate of 35% was as follows (in millions):
| Three Months Ended | Six Months Ended | |||||||||||||||
| June 30, | June 30, | |||||||||||||||
| 2016 | 2015 | 2016 | 2015 | |||||||||||||
| Federal income tax at U.S. federal statutory rate |
$ | (118 | ) | $ | 137 | $ | (201 | ) | $ | 313 | ||||||
| Foreign income tax rate differential |
3 | (41 | ) | (24 | ) | (87 | ) | |||||||||
| State income tax, net of federal benefit |
(1 | ) | — | (5 | ) | 3 | ||||||||||
| Nondeductible expenses |
9 | 12 | 21 | 17 | ||||||||||||
| Tax benefit of manufacturing deduction |
— | — | — | (10 | ) | |||||||||||
| Foreign dividends, net of foreign tax credits |
(24 | ) | 8 | (19 | ) | 15 | ||||||||||
| Tax impact of foreign exchange |
1 | (19 | ) | (7 | ) | (18 | ) | |||||||||
| Change in valuation allowance |
11 | 3 | 21 | 6 | ||||||||||||
| Tax rate change on temporary differences |
(5 | ) | 1 | (3 | ) | (3 | ) | |||||||||
| Change in tax reserves |
3 | — | (20 | ) | 69 | |||||||||||
| Other |
— | 4 | (2 | ) | (11 | ) | ||||||||||
|
|
|
|
|
|
|
|
|
|||||||||
| Provision for income taxes |
$ | (121 | ) | $ | 105 | $ | (239 | ) | $ | 294 | ||||||
|
|
|
|
|
|
|
|
|
|||||||||
The balance of unrecognized tax benefits at June 30, 2016 was $27 million. The Company does not anticipate its total unrecognized tax benefits at June 30, 2016 to significantly change due to the settlement of audits or the expiration of statutes of limitation within 12 months of this reporting date.
The Company is subject to taxation in the U.S., various states and foreign jurisdictions. The Company has significant operations in the United States, Canada, the United Kingdom, the Netherlands and Norway. Tax years that remain subject to examination by major tax jurisdiction vary by legal entity, but are generally open in the U.S. for tax years after 2012 and outside the U.S. for tax years after 2008.
To the extent penalties and interest would be assessed on any underpayment of income tax, such accrued amounts have been classified as a component of income tax expense in the financial statements.
For the three and six months ended June 30, 2016, the Company is utilizing the discrete-period method to compute its interim tax provision due to significant variations in the relationship between income tax expense and pre-tax accounting income or loss; consequently, the actual effective rate for the interim period is being reported. The discrete-period method is applied when the application of the estimated annual effective tax rate is impractical because it is not possible to reliably estimate the annual effective tax rate.
For the three and six months ended June 30, 2015, the Company utilized the estimated annual effective tax rate method in computing its interim tax provisions. The relationship between pre-tax accounting income and income tax for these periods allowed the Company to estimate the annual effective tax rate to be applied to year-to-date income in those periods.
On January 1, 2016, the Company adopted Accounting Standard Update No. 2015-17, “Balance Sheet Classification of Deferred Taxes” on a retrospective basis. Rather than classify deferred tax assets and liabilities as current and non-current, this update requires that deferred tax assets and liabilities be classified as non-current in the Consolidated Balance Sheet. Adoption of this standard resulted in a reclassification of our current deferred tax assets and liabilities to non-current deferred tax assets and liabilities in our Consolidated Balance Sheet. Prior periods have been retrospectively adjusted. At December 31, 2015, $376 million of current deferred tax assets have been reclassified to non-current deferred tax liabilities, $358 million of non-current deferred tax assets have been reclassified to non-current deferred tax liabilities, and $291 million of current deferred tax liabilities have been reclassified to non-current deferred tax liabilities.
11
9. Stock-Based Compensation
The Company has a stock-based compensation plan known as the National Oilwell Varco, Inc. Long-Term Incentive Plan (the “Plan”). The Plan provides for the granting of stock options, performance-based share awards, restricted stock, phantom shares, stock payments and stock appreciation rights (“SARs”). The number of shares authorized under the Plan was increased during the second quarter of 2016 to 69.4 million. The Plan is now subject to a fungible ratio concept, such that the issuance of stock options and SARs reduces the number of available shares under the Plan on a 1-for-1 basis, and the issuance of other awards reduces the number of available shares under the Plan on a 3-for-1 basis. At June 30, 2016, 31,391,412 shares remain available for future grants under the Plan, all of which are available for grants of stock options, performance-based share awards, restricted stock awards, phantom shares, stock payments and SARs.
On February 24, 2016, the Company granted 3,672,411 stock options with a fair value of $6.44 per share and an exercise price of $28.24 per share; 1,732,095 shares of restricted stock and restricted stock units with a fair value of $28.24 per share; performance share awards to senior management employees with potential payouts varying from zero to 341,780 shares; and 4,618,400 SARs with an exercise price of $28.24 and a fair value of $6.44 per SAR. The stock options vest over a three-year period from the grant date while the restricted stock and restricted stock units vest on the third anniversary of the date of grant. The performance share awards can be earned based on performance against established goals over a three-year performance period. The performance share awards are based entirely on a TSR (total shareholder return) goal. Performance against the TSR goal is determined by comparing the performance of the Company’s TSR with the TSR performance of the members of the OSX index for the three year performance period. The SARs are cash-settled awards and vest over a three-year period from the grant date. Upon exercise of the SARs, the employee is entitled to receive cash payment for the appreciation in the value of our common stock over the exercise price. We account for the cash-settled SARs as liability awards, which require the awards to be revalued at each reporting period.
On May 18, 2016, the Company granted 44,520 restricted stock awards with a fair value of $31.45 per share. The awards were granted to non-employee members of the board of directors and vest on the first anniversary of the grant date.
Total stock-based compensation for all stock-based compensation arrangements under the Plan was $21 million and $50 million for the three and six months ended June 30, 2016, respectively, and $22 million and $62 million for the three and six months ended June 30, 2015, respectively. Included in stock-based compensation for the six months ended June 30, 2016 and 2015 is $5 million and $18 million, respectively, related to the Voluntary Early Retirement Plan established by the Company in the first quarter of each year. The total income tax benefit recognized in the Consolidated Statements of Income for all stock-based compensation arrangements under the Plan was $5 million and $12 million for the three and six months ended June 30, 2016, respectively, and $6 million and $13 million for the three and six months ended June 30 2015, respectively.
12
10. Derivative Financial Instruments
ASC Topic 815, “Derivatives and Hedging” requires a company to recognize all of its derivative instruments as either assets or liabilities in the Consolidated Balance Sheet at fair value. The accounting for changes in the fair value (i.e., gains or losses) of a derivative instrument depends on whether it has been designated and qualifies as part of a hedging relationship and further, on the type of hedging relationship. For those derivative instruments that are designated and qualify as hedging instruments, a company must designate the hedging instrument, based upon the exposure being hedged, as a fair value hedge, cash flow hedge, or a hedge of a net investment in a foreign operation.
The Company is exposed to certain risks relating to its ongoing business operations. The primary risk managed by using derivative instruments is foreign currency exchange rate risk. Forward contracts against various foreign currencies are entered into to manage the foreign currency exchange rate risk on forecasted revenues and expenses denominated in currencies other than the functional currency of the operating unit (cash flow hedge). In addition, the Company will enter into non-designated forward contracts against various foreign currencies to manage the foreign currency exchange rate risk on recognized nonfunctional currency monetary accounts (non-designated hedge).
The Company records all derivative financial instruments at their fair value in its Consolidated Balance Sheet. Except for certain non-designated hedges discussed below, all derivative financial instruments that the Company holds are designated as cash flow hedges and are highly effective in offsetting movements in the underlying risks. Such arrangements typically have terms between 2 and 24 months, but may have longer terms depending on the underlying cash flows being hedged, typically related to the projects in our backlog. The Company may also use interest rate contracts to mitigate its exposure to changes in interest rates on anticipated long-term debt issuances.
At June 30, 2016, the Company has determined that the fair value of its derivative financial instruments representing assets of $43 million and liabilities of $109 million (primarily currency related derivatives) are determined using level 2 inputs (inputs other than quoted prices in active markets for identical assets and liabilities that are observable either directly or indirectly for substantially the full term of the asset or liability) in the fair value hierarchy as the fair value is based on publicly available foreign exchange and interest rates at each financial reporting date. At June 30, 2016, the net fair value of the Company’s foreign currency forward contracts totaled a net liability of $66 million.
At June 30, 2016, the Company did not have any interest rate swaps and its financial instruments do not contain any credit-risk-related or other contingent features that could cause accelerated payments when the Company’s financial instruments are in net liability positions. We do not use derivative financial instruments for trading or speculative purposes.
Cash Flow Hedging Strategy
To protect against the volatility of forecasted foreign currency cash flows resulting from forecasted revenues and expenses, the Company has instituted a cash flow hedging program. The Company hedges portions of its forecasted revenues and expenses denominated in nonfunctional currencies with forward contracts. When the U.S. dollar strengthens or weakens against the foreign currencies, the change in present value of future foreign currency revenues and expenses is offset by changes in the fair value of the forward contracts designated as hedges.
For derivative instruments that are designated and qualify as a cash flow hedge (i.e., hedging the exposure to variability in expected future cash flows that is subject to a particular currency risk), the effective portion of the gain or loss on the derivative instrument is reported as a component of other comprehensive income (loss) and reclassified into earnings in the same line item associated with the forecasted transaction and in the same period or periods during which the hedged transaction affects earnings (e.g., in “revenues” when the hedged transactions are cash flows associated with forecasted revenues). The remaining gain or loss on the derivative instrument in excess of the cumulative change in the present value of future cash flows of the hedged item, if any (i.e., the ineffective portion), or hedge components excluded from the assessment of effectiveness, is recognized in the Consolidated Statements of Income during the current period.
For the three and six months ended June 30, 2016, the Company recognized losses of $1 million and $17 million, respectively, as a result of the discontinuance of certain cash flow hedges when it became probable that the original forecasted transactions would not occur by the end of the originally specified time period. At June 30, 2016, there were $96 million in pre-tax losses recorded in accumulated other comprehensive income (loss). Significant changes in forecasted operating levels or delays in large capital construction projects, whereby certain hedged transactions associated with these projects are no longer probable of occurring by the end of the originally specified time period, could result in additional losses due to the de-designation of existing hedge contracts.
13
The Company had the following outstanding foreign currency forward contracts that were entered into to hedge nonfunctional currency cash flows from forecasted revenues and expenses (in millions):
| Currency Denomination | ||||||||
| Foreign Currency |
June 30, 2016 |
December 31, 2015 |
||||||
| Norwegian Krone |
NOK | 7,277 | NOK | 9,655 | ||||
| Euro |
EUR | 246 | EUR | 78 | ||||
| U.S. Dollar |
USD | 193 | USD | 321 | ||||
| Danish Krone |
DKK | 52 | DKK | 57 | ||||
| Singapore Dollar |
SGD | 10 | SGD | 14 | ||||
| British Pound Sterling |
GBP | 1 | GBP | 4 | ||||
| Canadian Dollar |
CAD | — | CAD | 2 | ||||
Non-designated Hedging Strategy
The Company enters into forward exchange contracts to hedge certain nonfunctional currency monetary accounts. The purpose of the Company’s foreign currency hedging activities is to protect the Company from risk that the eventual U.S. dollar equivalent cash flows from the nonfunctional currency monetary accounts will be adversely affected by changes in the exchange rates.
For derivative instruments that are non-designated, the gain or loss on the derivative instrument subject to the hedged risk (i.e., nonfunctional currency monetary accounts) is recognized in other income (expense), net in current earnings.
The Company had the following outstanding foreign currency forward contracts that hedge the fair value of nonfunctional currency monetary accounts (in millions):
| Currency Denomination | ||||||||
| Foreign Currency |
June 30, 2016 |
December 31, 2015 |
||||||
| Russian Ruble |
RUB | 1,997 | RUB | 2,164 | ||||
| Norwegian Krone |
NOK | 1,756 | NOK | 2,265 | ||||
| U.S. Dollar |
USD | 399 | USD | 515 | ||||
| Euro |
EUR | 227 | EUR | 371 | ||||
| Danish Krone |
DKK | 80 | DKK | 153 | ||||
| British Pound Sterling |
GBP | 12 | GBP | 11 | ||||
| Canadian Dollar |
CAD | 6 | CAD | 7 | ||||
| Singapore Dollar |
SGD | 2 | SGD | 5 | ||||
14
The Company has the following gross fair values of its derivative instruments and their balance sheet classifications:
| Asset Derivatives |
Liability Derivatives |
|||||||||||||||||||
| Fair Value | Fair Value | |||||||||||||||||||
| Balance Sheet Location |
June 30, 2016 |
December 31, 2015 |
Balance Sheet Location |
June 30, 2016 |
December 31, 2015 |
|||||||||||||||
| Derivatives designated as hedging instruments under ASC Topic 815 |
||||||||||||||||||||
| Foreign exchange contracts |
Prepaid and other current assets |
$ | 5 | $ | 5 | Accrued liabilities | $ | 88 | $ | 212 | ||||||||||
| Foreign exchange contracts |
Other Assets |
19 | — | Other liabilities |
4 | 25 | ||||||||||||||
|
|
|
|
|
|
|
|
|
|||||||||||||
| Total derivatives designated as hedging instruments under ASC Topic 815 |
$ | 24 | $ | 5 | $ | 92 | $ | 237 | ||||||||||||
|
|
|
|
|
|
|
|
|
|||||||||||||
| Derivatives not designated as hedging instruments under ASC Topic 815 |
||||||||||||||||||||
| Foreign exchange contracts |
Prepaid and other current assets |
$ | 12 | $ | 21 | Accrued liabilities | $ | 16 | $ | 49 | ||||||||||
| Foreign exchange contracts |
Other Assets | 7 | — | Other Liabilities | 1 | — | ||||||||||||||
|
|
|
|
|
|
|
|
|
|||||||||||||
| Total derivatives not designated as hedging instruments under ASC Topic 815 |
$ | 19 | $ | 21 | $ | 17 | $ | 49 | ||||||||||||
|
|
|
|
|
|
|
|
|
|||||||||||||
| Total derivatives |
$ | 43 | $ | 26 | $ | 109 | $ | 286 | ||||||||||||
|
|
|
|
|
|
|
|
|
|||||||||||||
| The Effect of Derivative Instruments on the Consolidated Statements of Income | ||||||||||||||||||||||||||||
| ($ in millions) | ||||||||||||||||||||||||||||
| Derivatives in ASC Topic 815 Cash Flow Hedging Relationships |
Amount of Gain (Loss) Recognized in OCI on Derivative (Effective Portion) (a) |
Location of Gain (Loss) (Effective Portion) |
Amount of Gain (Loss) Reclassified from Accumulated OCI into Income (Effective Portion) |
Location of Gain (Loss) Testing) |
Amount of Gain (Loss) Recognized in Income on Derivative (Ineffective Portion and Amount Excluded from Effectiveness Testing) (b) |
|||||||||||||||||||||||
| Six Months Ended June 30, |
Six Months Ended June 30, | Six Months Ended June 30, |
||||||||||||||||||||||||||
| 2016 | 2015 | 2016 | 2015 | 2016 | 2015 | |||||||||||||||||||||||
| Revenue | 3 | 1 | Cost of revenue | (17) | (22) | |||||||||||||||||||||||
| Foreign exchange contracts |
65 | (105 | ) | Cost of revenue | (105 | ) | (138 | ) | Other income (expense), net | 1 | (1 | ) | ||||||||||||||||
|
|
|
|
|
|
|
|
|
|
|
|
|
|||||||||||||||||
| Total |
65 | (105) | (102) | (137) | (16) | (23) | ||||||||||||||||||||||
|
|
|
|
|
|
|
|
|
|
|
|
|
|||||||||||||||||
| Derivatives Not Designated as Hedging Instruments under ASC Topic 815 |
Location of Gain (Loss) Recognized in Income on Derivative |
Amount of Gain (Loss) Recognized in Income on Derivative | ||||
| Six Months Ended June 30, | ||||||
| 2016 | 2015 | |||||
| Foreign exchange contracts |
Other income (expense), net | 3 | (55) | |||
|
|
| |||||
| Total |
3 | (55) | ||||
|
|
| |||||
| (a) | The Company expects that $(94) million of the accumulated other comprehensive income (loss) will be reclassified into earnings within the next twelve months with an offset by gains from the underlying transactions resulting in no impact to earnings or cash flow. |
| (b) | The amount of gain (loss) recognized in income represents $(17) million and $(22) million related to the ineffective portion of the hedging relationships for each of the six months ended June 30, 2016 and 2015, respectively, and $1 million and $(1) million related to the amount excluded from the assessment of the hedge effectiveness for the six months ended June 30, 2016 and 2015, respectively. |
15
11. Net Income (Loss) Attributable to Company Per Share
The following table sets forth the computation of weighted average basic and diluted shares outstanding (in millions, except per share data):
| Three Months Ended | Six Months Ended | |||||||||||||||
| June 30, | June 30, | |||||||||||||||
| 2016 | 2015 | 2016 | 2015 | |||||||||||||
| Numerator: |
||||||||||||||||
| Net income (loss) attributable to Company |
$ | (217 | ) | $ | 289 | $ | (336 | ) | $ | 599 | ||||||
|
|
|
|
|
|
|
|
|
|||||||||
| Denominator: |
||||||||||||||||
| Basic—weighted average common shares outstanding |
375 | 387 | 375 | 397 | ||||||||||||
| Dilutive effect of employee stock options and other |
— | 1 | — | 1 | ||||||||||||
|
|
|
|
|
|
|
|
|
|||||||||
| Diluted outstanding shares |
375 | 388 | 375 | 398 | ||||||||||||
|
|
|
|
|
|
|
|
|
|||||||||
| Net income (loss) attributable to Company per share: |
||||||||||||||||
| Basic |
$ | (0.58 | ) | $ | 0.75 | $ | (0.90 | ) | $ | 1.51 | ||||||
|
|
|
|
|
|
|
|
|
|||||||||
| Diluted |
$ | (0.58 | ) | $ | 0.74 | $ | (0.90 | ) | $ | 1.51 | ||||||
|
|
|
|
|
|
|
|
|
|||||||||
| Cash dividends per share |
$ | 0.05 | $ | 0.46 | $ | 0.51 | $ | 0.92 | ||||||||
|
|
|
|
|
|
|
|
|
|||||||||
ASC Topic 260, “Earnings Per Share” requires companies with unvested participating securities to utilize a two-class method for the computation of net income attributable to Company per share. The two-class method requires a portion of net income attributable to Company to be allocated to participating securities, which are unvested awards of share-based payments with non-forfeitable rights to receive dividends or dividend equivalents, if declared. Net income attributable to Company allocated to these participating securities was immaterial for the three and six months ended June 30, 2016 and therefore not excluded from net income attributable to Company per share calculation.
The Company had stock options outstanding that were anti-dilutive totaling 14 million shares for each of the three and six months ended June 30, 2016 and 14 million shares for each of the three and six months ended June 30, 2015.
12. Cash Dividends
On May 19, 2016, the Company’s Board of Directors approved a cash dividend of $0.05 per share. The cash dividend was paid on June 24, 2016, to each stockholder of record on June 10, 2016. Cash dividends were $19 million and $192 million for the three and six months ended June 30, 2016, and $178 million and $363 million for the three and six months ended June 30, 2015, respectively. The declaration and payment of future dividends is at the discretion of the Company’s Board of Directors and will be dependent upon the Company’s results of operations, financial condition, capital requirements and other factors deemed relevant by the Company’s Board of Directors.
16
13. Commitments and Contingencies
In 2008, we received U.S. federal grand jury subpoenas and subsequent inquiries from U.S. governmental agencies requesting records related to our compliance with U.S. export trade laws and regulations. We have cooperated fully with agents from the U.S. Department of Justice, the Department of Commerce Bureau of Industry and Security, the United States Department of Treasury, Office of Foreign Assets Control, and U.S. Immigration and Customs Enforcement in responding to the inquiries. We have also cooperated with an informal inquiry from the Securities and Exchange Commission in connection with the inquiries previously made by the aforementioned federal agencies. We have conducted our own internal review of this matter. At the conclusion of our internal review in the fourth quarter of 2009, we identified possible areas of concern and discussed these areas of concern with the relevant agencies. We are currently negotiating a potential resolution with the agencies involved related to these matters. We currently anticipate that any administrative fine or penalty agreed to as part of a resolution would be within established accruals, and would not have a material effect on our financial position or results of operations. To the extent a resolution is not negotiated, we cannot predict the timing or effect that any resulting government actions may have on our financial position or results of operations.
In addition, we are involved in various other claims, internal investigations, regulatory agency audits and pending or threatened legal actions involving a variety of matters. As of June 30, 2016, the Company recorded an immaterial amount for contingent liabilities representing all contingencies believed to be probable. The Company has also assessed the potential for additional losses above the amounts accrued as well as potential losses for matters that are not probable but are reasonably possible. The total potential loss on these matters cannot be determined; however, in our opinion, any ultimate liability, to the extent not otherwise provided for and except for the specific cases referred to above, will not materially affect our financial position, cash flow or results of operations. As it relates to the specific cases referred to above we currently anticipate that any administrative fine or penalty agreed to as part of a resolution would be within established accruals, and would not have a material effect on our financial position or results of operations. To the extent a resolution is not negotiated as anticipated, we cannot predict the timing or effect that any resulting government actions may have on our financial position, cash flow or results of operations. These estimated liabilities are based on the Company’s assessment of the nature of these matters, their progress toward resolution, the advice of legal counsel and outside experts as well as management’s intention and experience.
Our business is affected both directly and indirectly by governmental laws and regulations relating to the oilfield service industry in general, as well as by environmental and safety regulations that specifically apply to our business. Although we have not incurred material costs in connection with our compliance with such laws, there can be no assurance that other developments, such as new environmental laws, regulations and enforcement policies hereunder may not result in additional, presently unquantifiable, costs or liabilities to us.
Further, in some instances, direct or indirect consumers of our products and services, entities providing financing for purchases of our products and services or members of the supply chain for our products and services may become involved in governmental investigations, internal investigations, political or other enforcement matters. In such circumstances, such investigations may adversely impact the ability of consumers of our products, entities providing financial support to such consumers or entities in the supply chain to timely perform their business plans or to timely perform under agreements with us. For example, the on-going, publicly disclosed investigations in Brazil have adversely impacted our shipyard customers, their customers, entities providing financing for our shipyard customers and/or entities in the supply chain. The investigations in Brazil have led to, and are expected to continue to lead to, delays in deliveries to our shipyard customers in Brazil, along with temporary suspension of performance under our supply contracts, and have resulted in cancellations and could result in further attempted cancellation or other breaches of our contracts by our shipyard customers.
In other jurisdictions, our shipyard customers’ customers in some instances have, and may in the future, sought suspension, delay or cancellation of the contracts or payment due between our shipyard customers and their customers. To the extent our shipyard customers and their customers become engaged in disputes or litigation related to any such suspensions, delays or cancellations, we may also become involved, either directly or indirectly, in such disputes or litigation, as we enforce the terms of our contracts with our shipyard customers. Further, customers in other markets may seek delay or suspension of deliveries, extending delivery into future periods, or may attempt cancellations. While we manage deliveries and collection of payment to achieve milestone payments that mitigate our financial risk, such delays, suspensions, attempted cancellations, breaches of contract or other similar circumstances, could adversely affect our operating results, collections of accounts receivable and financial condition and could reduce our backlog.
17
14. Recently Issued Accounting Standards
In March 2016, the FASB issued Accounting Standard Update No. 2016-09 “Improvements to Employee Share-Based Payment Accounting” (ASU 2016-09). This update requires that entities record all of the tax effects related to share-based payments at settlement (or expiration) through the income statement. ASU No. 2016-09 is effective for fiscal years beginning after December 15, 2016, and for interim periods within those fiscal years. The Company will adopt ASU No. 2016-09 on January 1, 2017.
In February 2016, the FASB issued Accounting Standard Update No. 2016-02 “Leases” (ASU No. 2016-02), which supersedes the lease requirements in Accounting Standard Codification Topic No. 840 “Leases” and most industry-specific guidance. This update increases transparency and comparability among organizations by recognizing lease assets and lease liabilities on the balance sheet and disclosing key information about leasing arrangements. ASU No. 2016-02 is effective for fiscal years beginning after December 15, 2018, and for interim periods within those fiscal years. The Company is currently assessing the impact of the adoption of ASU No. 2016-02 on its consolidated financial position and results of operations.
In November 2015, the FASB issued Accounting Standard Update No. 2015-17 “Balance Sheet Classification of Deferred Taxes” (ASU 2015-17). This update requires companies to classify all deferred tax assets and liabilities as non-current on its consolidated financial position. The Company has early adopted ASU 2015-17 on a retrospective basis, resulting in a reclassification of current deferred tax assets and liabilities to non-current deferred tax assets and liabilities. The ASU adoption is effective January 1, 2016, and prior periods have been retrospectively adjusted. See Note 8 for further information on the presentation of deferred taxes.
In April 2015, the FASB issued Accounting Standard Update No. 2015-03 “Simplifying the Presentation of Debt Issuance Costs” (ASU 2015-03) to simplify the presentation of debt issuance costs. This update requires that debt issuance costs related to a recognized debt liability be presented in the balance sheet as a direct deduction from the carrying amount of that debt liability, consistent with debt discounts, as opposed to historical presentation as an asset on the balance sheet. ASU No. 2015-03 is effective for fiscal years beginning after December 15, 2015, and for interim periods within those fiscal years. The Company adopted this update on January 1, 2016, and has applied the change retrospectively to prior periods for unamortized debt issuance costs. See Note 7 for further information on the presentation of debt issuance costs.
In August 2014, the FASB issued Accounting Standard Update No. 2014-15 “Disclosure of Uncertainties about an Entity’s Ability to Continue as a Going Concern” (ASU No. 2014-15), which amends FASB Accounting Standards Codification 205 “Presentation of Financial Statements.” This update requires management to assess an entity’s ability to continue as a going concern by incorporating and expanding upon certain principles that are currently in U.S. auditing standards. ASU No. 2014-15 is effective for the annual period ending after December 15, 2016, and for annual periods and interim periods thereafter. The Company is currently assessing the impact of the adoption of ASU No. 2014-15 on its consolidated financial position and results of operations.
In May 2014, the FASB issued Accounting Standard Update No. 2014-09 “Revenue from Contracts with Customers” (ASU
No. 2014-09), which supersedes the revenue recognition requirements in Accounting Standard Codification Topic No. 605 “Revenue
Recognition” and most industry-specific guidance. This update requires that entities recognize revenue to depict the transfer of promised goods or services to customers in an amount that reflects the consideration to which a company expects to be entitled in exchange for those goods or services. ASU No. 2014-09 is effective for fiscal years beginning after December 15, 2017, and for interim periods within those fiscal years. The Company is currently assessing the impact of the adoption of ASU No. 2014-09 on its consolidated financial position and results of operations.
18
| Item 2. | Management’s Discussion and Analysis of Financial Condition and Results of Operations |
Introduction
National Oilwell Varco, Inc. (the “Company”) is a worldwide leader in the design, manufacture and sale of equipment and components used in oil and gas drilling, completion and production operations, and the provision of oilfield services to the upstream oil and gas industry.
Unless indicated otherwise, results of operations data are presented in accordance with accounting principles generally accepted in the United States (“GAAP”). In an effort to provide investors with additional information regarding our results of operations, certain non-GAAP financial measures, including operating profit excluding other items, operating profit percentage excluding other items and operating (non-GAAP) earnings per share, are provided. See Non-GAAP Financial Measures and Reconciliations in Results of Operations for an explanation of our use of non-GAAP financial measures and reconciliations to their corresponding measures calculated in accordance with GAAP.
Rig Systems
The Company’s Rig Systems segment makes and supports the capital equipment and integrated systems needed to drill oil and gas wells on land and offshore. The segment designs, manufactures and sells land rigs, offshore drilling equipment packages, including installation and commissioning services, and drilling rig components that mechanize and automate the drilling process and rig functionality.
Equipment and technologies in Rig Systems include: substructures, derricks, and masts; cranes; pipe lifting, racking, rotating, and assembly systems; fluid transfer technologies, such as mud pumps; pressure control equipment, including blowout preventers; power transmission systems, including drives and generators; and rig instrumentation and control systems.
Rig Systems supports land and offshore drillers. Demand for the segment’s products depends on drilling contractors’ and oil and gas companies’ capital spending plans, specifically capital expenditures on rig construction and refurbishment.
To achieve higher efficiencies and reduce costs in the current market, the Company intends to combine the Rig Offshore and Land reporting units during the third quarter of 2016. We will test each of the two reporting units for goodwill impairment before merging them, in accordance with accounting guidance ASC Topic 350, “Intangibles – Goodwill and Other.”
Rig Aftermarket
The Company’s Rig Aftermarket segment provides comprehensive aftermarket products and services to support land and offshore rigs, and drilling rig components manufactured by the Company’s Rig Systems segment.
The segment provides spare parts, repair, and rentals as well as technical support, field service and first well support, field engineering, and customer training through a network of aftermarket service and repair facilities strategically located in major areas of drilling operations.
Rig Aftermarket supports land and offshore drillers. Demand for the segment’s products and services depends on overall levels of oilfield drilling activity, which drives demand for spare parts, service, and repair for Rig Systems’ large installed base of equipment; and secondarily on drilling contractors’ and oil and gas companies’ capital spending plans, specifically capital expenditures on rig refurbishment and re-certification.
Wellbore Technologies
The Company’s Wellbore Technologies segment designs, manufactures, rents, and sells a variety of equipment and technologies used to perform drilling operations, and offers services that optimize their performance, including: solids control and waste management equipment and services; drilling fluids; portable power generation; premium drill pipe; wired pipe; drilling optimization and automation services; tubular inspection, repair and coating services; rope access inspection; instrumentation; measuring and monitoring; downhole and fishing tools; steerable technologies; hole openers; and drill bits.
Wellbore Technologies focuses on oil and gas companies and supports drilling contractors, oilfield service companies, and oilfield equipment rental companies. Demand for the segment’s products and services depends on the level of oilfield drilling activity by oil and gas companies, drilling contractors, and oilfield service companies.
19
Completion & Production Solutions
The Company’s Completion & Production Solutions segment integrates technologies for well completions and oil and gas production. The segment designs, manufactures, and sells equipment and technologies needed for hydraulic fracture stimulation, including pressure pumping trucks, blenders, sanders, hydration units, injection units, flowline, manifolds, wellheads and completion tools; well intervention, including coiled tubing units, coiled tubing, and wireline units and tools; onshore production, including composite pipe, surface transfer and progressive cavity pumps, and artificial lift systems; and, offshore production, including floating production systems and subsea production technologies.
Completion & Production Solutions supports service companies and oil and gas companies. Demand for the segment’s products depends on the level of oilfield completions and workover activity by oilfield service companies and drilling contractors, and capital spending plans by oil and gas companies and oilfield service companies.
Critical Accounting Policies and Estimates
In our annual report on Form 10-K for the year ended December 31, 2015, we identified our most critical accounting policies. In preparing the financial statements, we make assumptions, estimates and judgments that affect the amounts reported. We periodically evaluate our estimates and judgments that are most critical in nature which are related to revenue recognition under long-term construction contracts; allowance for doubtful accounts; inventory reserves; impairment of long-lived assets (excluding goodwill and other indefinite-lived intangible assets); goodwill and other indefinite-lived intangible assets; purchase price allocation of acquisitions; service and product warranties; and income taxes. Our estimates are based on historical experience and on our future expectations that we believe are reasonable. The combination of these factors forms the basis for making judgments about the carrying values of assets and liabilities that are not readily apparent from other sources. Actual results are likely to differ from our current estimates and those differences may be material.
20
EXECUTIVE SUMMARY
For its second quarter ended June 30, 2016, the Company had a $217 million net loss, or $0.58 per fully diluted share, on $1.7 billion in revenue. Compared to the first quarter of 2016, revenue decreased $465 million or 21% and net loss increased $98 million or 82%. Compared to the second quarter of 2015, revenue decreased $2.2 billion or 56%, and net income decreased $506 million or 175%.
Excluding other items from all periods, operating loss was $153 million or (8.9)% of sales in the second quarter of 2016, compared to operating loss of $48 million or (2.2)% of sales in the first quarter of 2016, and operating profit of $455 million or 11.6% of sales in the second quarter of 2015.
During the second quarter of 2016, first quarter of 2016, and second quarter of 2015, pre-tax other items included in operating profit (loss) were $117 million, $141 million and $17 million, respectively. Excluding other items from all periods, second quarter 2016 operating (non-GAAP) losses were $(0.30) per fully diluted share, compared to losses of $(0.06) per fully diluted share in the first quarter of 2016 and earnings of $0.77 per fully diluted share in the second quarter of 2015.
Oil & Gas Equipment and Services Market
Over the past decade, technological advancements in the oilfield equipment and service space unlocked production from formations that were previously deemed uneconomic, especially in North America. From 2004 to 2014 global oil and liquids supply increased dramatically from U.S. unconventional resources, deep-water (defined as water depths greater than 400 feet) resources and from other sources. The advances in technology combined with relatively high commodity prices caused by growing demand enabled and sustained an increase in global drilling activity. In recent years, global supply started to catch up to demand, and in the latter half of 2014, demand growth in areas such as Asia, Europe and the U.S. weakened while drilling activity remained strong and production continued to grow. As a result, the first signs of an oversupply-related imbalance appeared and prices began to decline. Unlike previous cycles, when the Organization of the Petroleum Exporting Countries (OPEC) curtailed production levels to defend pricing, certain members of OPEC increased production in an effort to increase market share and financially stress higher cost producers, most notably those operating in the North American shale market. As a result, the price of oil declined significantly during early 2015, remained depressed throughout the year, and underwent another major reduction toward the end of 2015. In early 2016, the market witnessed oil trading in the high $20 per barrel range, a price range not seen since 2003. During the second quarter the average oil price improved to $45 per barrel, however global supply remained well in excess of demand.
In response to rapidly deteriorating market conditions, operators adjusted accordingly by acutely reducing both operating and capital expenditures. Orders for our equipment and services slowed and rig counts declined rapidly. The market decline continued throughout the second quarter with active drilling rig counts hitting 70 year lows.
Segment Performance
The Rig Systems segment generated $564 million in revenue and $7 million in operating profit or 1.2% of sales in the second quarter of 2016. Compared to the prior quarter, revenue decreased $362 million or 39%, and operating profit decreased $60 million or 90%. Compared to the second quarter of 2015, segment revenue decreased $1.4 billion or 71%, and operating profit decreased $414 million or 98%. Second quarter 2016 revenue out of backlog for the Rig Systems segment decreased 43% sequentially and 74% year-over-year on fewer shipments and postponed delivery dates of some offshore projects. During the second quarter of 2016, the segment received $66 million in new orders, composed entirely of discrete capital equipment. Backlog for capital equipment orders for the Rig Systems segment at June 30, 2016 was $2.9 billion.
The Rig Aftermarket segment generated $364 million in revenue and $62 million in operating profit or 17.0% of sales in the second quarter of 2016. Compared to the prior quarter, revenue decreased $27 million or 7%, and operating profit decreased $7 million or 10%. Compared to the second quarter of 2015, segment revenue decreased $293 million or 45%, and operating profit decreased $91 million or 59%. Revenue decreased year-over-year as drilling contractors reduced spending and depleted existing spares inventories rather than purchase new, and deferred repair and maintenance work on their rig fleets when possible.
The Wellbore Technologies segment generated $511 million in revenue and a $146 million operating loss, or (28.6)% of sales, for the second quarter of 2016. Compared to the prior quarter, revenue decreased $120 million or 19%, and operating loss increased $55 million or 60%. Compared to the second quarter of 2015, revenue decreased $445 million or 47%, and operating profit decreased $194 million or 404%. The declines were driven by lower levels of worldwide drilling activity, which required and consumed less of the segment’s services and product offerings.
The Completion & Production Solutions segment generated $538 million in revenue and $33 million in operating loss or (6.1)% of sales during the second quarter of 2016. Compared to the prior quarter, revenue decreased $20 million or 4%, and operating loss
21
decreased $5 million or 13%. Compared to the second quarter of 2015, revenue decreased $335 million or 38%, and operating profit decreased $118 million or 139%. Revenue decreased sequentially and year-over-year on lower levels of worldwide activity and pricing pressures. Operating profit improved sequentially on lower revenue due to effective cost cutting measures.
Outlook
The persistent supply and demand imbalance has led to low commodity prices and significantly reduced activity by exploration and production companies. The reduced activity has created an oversupply of service capacity and capital equipment, resulting in increasingly challenging prospects for many of our customers in the form of reduced volumes and pricing pressures. Consequently, we are cautious in our outlook for the remainder of 2016, and anticipate that our customers will minimize capital expenditures until they see the early signs of a recovery in commodity prices and overall activity levels. We also expect them to minimize parts purchases and postpone maintenance using existing stocks of spares and cannibalizing idle equipment whenever possible.
In the current environment, contractors are hesitant to invest in older equipment which can be far less productive and competitive. As a result, we anticipate that the industry will retire a significant portion of the current base of capital equipment during this cyclical downturn, which could result in newbuild orders when commodity prices recover and activity increases. However, a meaningful increase in drilling activity is not expected in 2016 as commodity prices remain low. As a result, our near-term outlook remains cautious and visibility beyond 2016 remains limited as the duration of the current market downturn is uncertain.
We expect the slope and timing of revenue decline, stabilization and recovery will be different across our four business segments. Likewise, our global customer base includes national oil companies, international oil companies, onshore and offshore drilling contractors and others whose strategies and reactions to low commodity prices vary. Our Completion & Production Solutions segment is expected to see an increase in activity when decisions are made to complete and produce the inventory of already drilled wells. Our Wellbore Technologies and Rig Aftermarket segments are expected to see stronger recovery as drilling of new wells increases, while orders for newbuild rigs in our Rig Systems segment may come later in the cycle.
Through the second half of 2016, we will continue to focus on cost control, sizing our operations to anticipated levels of activity, while continuing to advance our longer term strategic goals. The Company has a history of implementing cost-control measures and downsizing in response to depressed market conditions and has a track record of executing strategic acquisitions and developing new products and technologies. The Company remains optimistic regarding longer-term market fundamentals as existing oil and gas fields continue to deplete, global demand continues to grow and new sources of oil and gas will require sophisticated technology that the Company provides.
22
Operating Environment Overview
The Company’s results are dependent on, among other things, the level of worldwide oil and gas drilling, well remediation activity, the prices of crude oil and natural gas, capital spending by other oilfield service companies and drilling contractors, and worldwide oil and gas inventory levels. Key industry indicators for the second quarter of 2016 and 2015, and the first quarter of 2016 include the following:
| 2Q16* | 2Q15* | 1Q16* | % 2Q16 2Q15 |
% 2Q16 1Q16 |
||||||||||||||||
| Active Drilling Rigs: |
||||||||||||||||||||
| U.S. |
421 | 909 | 555 | (53.7 | %) | (24.1 | %) | |||||||||||||
| Canada |
49 | 100 | 163 | (51.0 | %) | (69.9 | %) | |||||||||||||
| International |
943 | 1,169 | 1,017 | (19.3 | %) | (7.3 | %) | |||||||||||||
|
|
|
|
|
|
|
|
|
|
|
|||||||||||
| Worldwide |
1,413 | 2,178 | 1,735 | (35.1 | %) | (18.6 | %) | |||||||||||||
| West Texas Intermediate Crude Prices (per barrel) |
$ | 45.41 | $ | 57.85 | $ | 33.18 | (21.5 | %) | 36.9 | % | ||||||||||
| Natural Gas Prices ($/mmbtu) |
$ | 2.13 | $ | 2.73 | $ | 1.98 | (22.0 | %) | 7.6 | % | ||||||||||
| * | Averages for the quarters indicated. See sources below. |
The following table details the U.S., Canadian, and international rig activity and West Texas Intermediate Crude Oil prices for the past nine quarters ended June 30, 2016, on a quarterly basis:
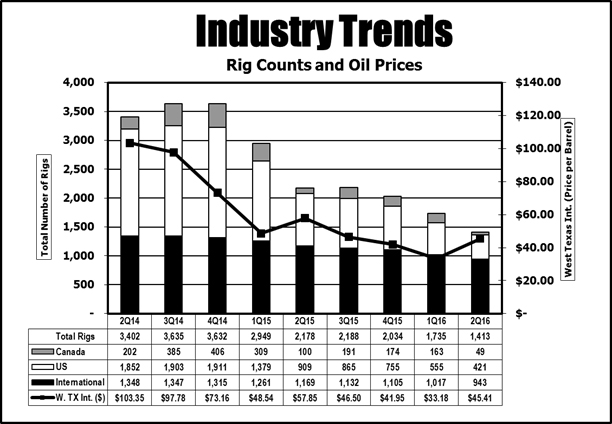
Source: Rig count: Baker Hughes, Inc. (www.bakerhughes.com); West Texas Intermediate Crude Oil and Natural Gas Prices: Department of Energy, Energy Information Administration (www.eia.doe.gov).
23
The worldwide quarterly average rig count decreased 18.6% (from 1,735 to 1,413), and the U.S. decreased 24.1% (from 555 to 421), in the second quarter of 2016 compared to the first quarter of 2016. The average per barrel price of West Texas Intermediate Crude Oil increased 36.9% (from $33.18 per barrel to $45.41 per barrel) and natural gas prices increased 7.6% (from $1.98 per mmbtu to $2.13 per mmbtu) in the second quarter of 2016 compared to the first quarter of 2016.
U.S. rig activity at July 29, 2016 was 463 rigs, increasing 10% compared to the second quarter of 2016 average of 421 rigs. The price for West Texas Intermediate Crude Oil was at $41.60 per barrel at July 29, 2016, decreasing 8% from the second quarter of 2016 average. The price for natural gas was at $2.88 per mmbtu at July 29, 2016, increasing 35% from the second quarter of 2016 average.
24
Results of Operations
Operating results by segment are as follows (in millions):
| Three Months Ended June 30, |
Six Months Ended June 30, |
|||||||||||||||
| 2016 | 2015 | 2016 | 2015 | |||||||||||||
| Revenue: |
||||||||||||||||
| Rig Systems |
$ | 564 | $ | 1,930 | $ | 1,490 | $ | 4,453 | ||||||||
| Rig Aftermarket |
364 | 657 | 755 | 1,376 | ||||||||||||
| Wellbore Technologies |
511 | 956 | 1,142 | 2,127 | ||||||||||||
| Completion & Production Solutions |
538 | 873 | 1,096 | 1,821 | ||||||||||||
| Eliminations |
(253 | ) | (507 | ) | (570 | ) | (1,048 | ) | ||||||||
|
|
|
|
|
|
|
|
|
|||||||||
| Total revenue |
$ | 1,724 | $ | 3,909 | $ | 3,913 | $ | 8,729 | ||||||||
|
|
|
|
|
|
|
|
|
|||||||||
| Operating profit (loss): |
||||||||||||||||
| Rig Systems |
$ | 7 | $ | 421 | $ | 74 | $ | 898 | ||||||||
| Rig Aftermarket |
62 | 153 | 131 | 357 | ||||||||||||
| Wellbore Technologies |
(146 | ) | 48 | (237 | ) | 143 | ||||||||||
| Completion & Production Solutions |
(33 | ) | 85 | (71 | ) | 173 | ||||||||||
| Eliminations and corporate costs |
(160 | ) | (269 | ) | (356 | ) | (563 | ) | ||||||||
|
|
|
|
|
|
|
|
|
|||||||||
| Total operating profit (loss) |
$ | (270 | ) | $ | 438 | $ | (459 | ) | $ | 1,008 | ||||||
|
|
|
|
|
|
|
|
|
|||||||||
| Operating profit (loss)%: |
||||||||||||||||
| Rig Systems |
1.2 | % | 21.8 | % | 5.0 | % | 20.2 | % | ||||||||
| Rig Aftermarket |
17.0 | % | 23.3 | % | 17.4 | % | 25.9 | % | ||||||||
| Wellbore Technologies |
(28.6 | %) | 5.0 | % | (20.8 | %) | 6.7 | % | ||||||||
| Completion & Production Solutions |
(6.1 | %) | 9.7 | % | (6.5 | %) | 9.5 | % | ||||||||
| Total operating profit (loss) % |
(15.7 | %) | 11.2 | % | (11.7 | %) | 11.5 | % | ||||||||
Rig Systems
Three and six months ended June 30, 2016 and 2015. Revenue from Rig Systems was $564 million for the three months ended June 30, 2016, compared to $1,930 million for the three months ended June 30, 2015, a decrease of $1,366 million or 71%. For the six months ended June 30, 2015, revenue from Rig Systems was $1,490 million compared to $4,453 million for the six months ending June 30, 2015, a decrease of $2,963 million or 67%.
Operating profit from Rig Systems was $7 million for the three months ended June 30, 2016 compared to $421 million for the three months ended June 30, 2015, a decrease of $414 million or 98%. Operating profit percentage decreased to 1.2% for the three months ended June 30, 2016, from 21.8% in the three months ended June 30, 2015. For the six months ended June 30, 2016, operating profit from Rig Systems was $74 million compared to $898 million for the six months ending June 30, 2015, a decrease of $824 million or 92%. Operating profit percentage decreased to 5.0% for the six months ended June 30, 2016, from 20.2% in the six months ended June 30, 2015. Operating profit percentage decreased as the segment’s through-put fell in its manufacturing facilities as the Company worked down its backlog.
The Rig Systems segment monitors its capital equipment backlog to plan its business. New orders are added to backlog only when the Company receives a firm written order for major drilling rig components or a signed contract related to a construction project. In light of the vote by the shareholders of SETE Brasil Participacoes SA to authorize Sete to file for bankruptcy, and a further decline in drilling activity during the first quarter to record lows and the resulting effect on certain other customers, the Company removed $2.1 billion of orders from its backlog in the first quarter of 2016. Some of the contracts for these orders remain in place and are enforceable. If these customers obtain funding to continue their projects, the Company will pursue resumption of construction and update the backlog accordingly. The capital equipment backlog was $2.9 billion at June 30, 2016, a decrease of $6.1 billion, or 67%, from backlog of $9.0 billion at June 30, 2015. Numerous factors may affect the timing of revenue out of backlog. Considering these factors, the Company reasonably expects approximately $700 million of revenue out of backlog for the remainder of 2016. At June 30, 2016, approximately 84% of the capital equipment backlog was for offshore products and approximately 86% of the capital equipment backlog was destined for international markets.
Rig Aftermarket
Three and six months ended June 30, 2016 and 2015. Revenue from Rig Aftermarket was $364 million for the three months ended June 30, 2016, compared to $657 million for the three months ended June 30, 2015, a decrease of $293 million or 45%. For the six months ended June 30, 2016, revenue from Rig Aftermarket was $755 million compared to $1,376 million for the six months ending June 30, 2015, a decrease of $621 million or 45%. This decrease was due to the overall decrease in drilling rigs and drilling activity with customers using existing inventories and components from idle and unused rigs rather than purchasing new.
25
Operating profit from Rig Aftermarket was $62 million for the three months ended June 30, 2016 compared to $153 million for the three months ended June 30, 2015, a decrease of $91 million or 59%. Operating profit percentage decreased to 17.0% for the three months ended June 30, 2016, from 23.3% in the three months ended June 30, 2015. For the six months ended June 30, 2016, operating profit from Rig Aftermarket was $131 million compared to $357 million for the six months ending June 30, 2015, a decrease of $226 million or 63%. Operating profit percentage decreased to 17.4% for the six months ended June 30, 2016, from 25.9% in the six months ended June 30, 2015. Operating profit percentage decreased due to lower volumes and pricing pressure.
Wellbore Technologies
Three and six months ended June 30, 2016 and 2015. Revenue from Wellbore Technologies was $511 million for the three months ended June 30, 2016, compared to $956 million for the three months ended June 30, 2015, a decrease of $445 million or 47%. For the six months ended June 30, 2016, revenue from Wellbore Technologies was $1,142 million compared to $2,127 million for the six months ending June 30, 2015, a decrease of $985 million or 46%. This decrease was due to the overall decrease in drilling activity.
Operating loss from Wellbore Technologies was $146 million for the three months ended June 30, 2016 compared to operating profit of $48 million for the three months ended June 30, 2015, a decrease of $194 million or 404%. Operating profit (loss) percentage decreased to (28.6)% for the three months ended June 30, 2016, from 5.0% in the three months ended June 30, 2015. For the six months ended June 30, 2016, operating loss from Wellbore Technologies was $237 million compared to operating profit of $143 million for the six months ending June 30, 2015, a decrease of $380 million or 266%. Operating profit (loss) percentage decreased to (20.8)% for the six months ended June 30, 2016, from 6.7% in the six months ended June 30, 2015. This decrease was due to lower volumes and pricing pressures resulting from an overall decrease in drilling activity.
Completion & Production Solutions
Three and six months ended June 30, 2016 and 2015. Revenue from Completion & Production Solutions was $538 million for the three months ended June 30, 2016, compared to $873 million for the three months ended June 30, 2015, a decrease of $335 million or 38%. For the six months ended June 30, 2016, revenue from Completion & Production Solutions was $1,096 million compared to $1,821 million for the six months ending June 30, 2015, a decrease of $725 million or 40%. This decrease was due to the overall decrease in market activity.
Operating loss from Completion & Production Solutions was $33 million for the three months ended June 30, 2016 compared to operating profit of $85 million for the three months ended June 30, 2015, a decrease of $118 million or 139%. Operating profit (loss) percentage decreased to (6.1)% for the three months ended June 30, 2016, from 9.7% in the three months ended June 30, 2015. For the six months ended June 30, 2016, operating loss from Completion & Production Solutions was $71 million compared to operating profit of $173 million for the six months ending June 30, 2015, a decrease of $244 million or 141%. Operating profit (loss) percentage decreased to (6.5)% for the six months ended June 30, 2016, from 9.5% in the six months ended June 30, 2015. This decrease was due to an overall decrease in market activity and a shift in product mix as revenue decreased more in higher operating profit businesses such as pressure pumping and fiberglass pipe.
The Completion & Productions Solutions segment monitors its capital equipment backlog to plan its business. New orders are added to backlog only when the Company receives a firm written order for major completion and production components or a signed contract related to a construction project. The capital equipment backlog was $947 million at June 30, 2016, a decrease of $242 million, or 20% from backlog of $1,189 million at June 30, 2015. Numerous factors may affect the timing of revenue out of backlog. Considering these factors, the Company reasonably expects approximately $600 million of revenue out of backlog in 2016 and approximately $340 million of revenue out of backlog in 2017 and thereafter. At June 30, 2016, approximately 79% of the capital equipment backlog was for offshore products and approximately 86% of the capital equipment backlog was destined for international markets.
Eliminations and corporate costs
Eliminations and corporate costs were $160 million and $356 million for the three and six months ended June 30, 2016, respectively, compared to $269 million and $563 million for the three and six months ended June 30, 2015, respectively. This change is primarily due to the change in intersegment eliminations. Sales from one segment to another generally are priced at estimated equivalent commercial selling prices; however, segments originating an external sale are credited with the full profit to the company. Eliminations include intercompany transactions conducted between the four reporting segments that are eliminated in consolidation. Intercompany transactions within each reporting segment are eliminated within each reporting segment.
26
Voluntary Early Retirement Plans
Also included in operating profit for the six months ended June 30, 2015, are certain other items primarily related to costs associated with Voluntary Early Retirement Plans (“VERP”) established by the Company during the first quarters of 2016 and 2015. In 2016 and 2015, VERP costs included $45 million and $58 million in severance, respectively, $35 million and $45 million in postretirement medical benefits, respectively, and $5 million and $18 million related to stock-based compensation, respectively.
Other income (expense), net
Other income (expense), net were expenses of $34 million and $55 million for the three and six months ended June 30, 2016, respectively, compared to expenses of $30 million and $86 million for the three and six months ended June 30, 2015, respectively. The decrease in expense was primarily due to the fluctuations in foreign currencies.
Provision for income taxes
The effective tax rate for the three and six months ended June 30, 2016 was 35.8% and 41.6%, respectively, compared to 26.9% and 32.9% for the same periods in 2015. Lower tax rates on income earned in foreign jurisdictions, foreign dividends net of foreign tax credits, foreign exchange losses for tax reporting in Norway, and a reduction in tax reserves due to audit settlements provided tax benefits which, when applied to losses generated during the six-month period, resulted in a higher effective tax rate than the U.S. statutory rate. The tax benefits were partially offset by nondeductible expenses and an increase in valuation allowance on deferred taxes.
27
Non-GAAP Financial Measures and Reconciliations
In an effort to provide investors with additional information regarding our results as determined by GAAP, we disclose various non-GAAP financial measures in our quarterly earnings press releases and other public disclosures. The non-GAAP financial measures we focus on herein are: (i) operating profit excluding other items, (ii) operating profit percentage excluding other items and (iii) operating (non-GAAP) earnings per share. Each of these financial measures excludes the impact of certain amounts as further identified below and have not been calculated in accordance with GAAP. A reconciliation of each of these non-GAAP financial measures to its most comparable GAAP financial measure is included below.
We use these non-GAAP financial measures internally to evaluate and manage the Company’s operations because we believe it provides useful supplemental information regarding the Company’s on-going economic performance. We have chosen to provide this information to investors to enable them to perform more meaningful comparisons of operating results and as a means to emphasize the results of on-going operations.
The following tables set forth the reconciliations of these non-GAAP financial measures to their most comparable GAAP financial measures (in millions, except per share data):
| Three Months Ended | Six Months Ended | |||||||||||||||||||
| June 30, | March 31, | June 30, | ||||||||||||||||||
| 2016 | 2015 | 2016 | 2016 | 2015 | ||||||||||||||||
| Reconciliation of operating profit (loss): |
||||||||||||||||||||
| GAAP operating profit (loss) |
$ | (270 | ) | $ | 438 | $ | (189 | ) | $ | (459 | ) | $ | 1,008 | |||||||
| Other items (1): |
||||||||||||||||||||
| Rig Systems |
23 | 3 | 52 | 75 | 43 | |||||||||||||||
| Rig Aftermarket |
5 | 2 | 8 | 13 | 10 | |||||||||||||||
| Wellbore Technologies |
50 | 9 | 38 | 88 | 54 | |||||||||||||||
| Completion & Production Solutions |
38 | 3 | 34 | 72 | 32 | |||||||||||||||
| Eliminations |
1 | — | 9 | 10 | — | |||||||||||||||
|
|
|
|
|
|
|
|
|
|
|
|||||||||||
| Operating profit (loss) excluding other items |
$ | (153 | ) | $ | 455 | $ | (48 | ) | $ | (201 | ) | $ | 1,147 | |||||||
|
|
|
|
|
|
|
|
|
|
|
|||||||||||
| Three Months Ended | Six Months Ended | |||||||||||||||||||
| June 30, | March 31, | June 30, | ||||||||||||||||||
| 2016 | 2015 | 2016 | 2016 | 2015 | ||||||||||||||||
| Reconciliation of operating profit (loss) %: |
||||||||||||||||||||
| GAAP operating profit (loss) % |
(15.7 | %) | 11.2 | % | (8.6 | %) | (11.7 | %) | 11.5 | % | ||||||||||
| Other items % |
6.8 | % | 0.4 | % | 6.4 | % | 6.6 | % | 1.6 | % | ||||||||||
|
|
|
|
|
|
|
|
|
|
|
|||||||||||
| Operating profit (loss) % excluding other items |
(8.9 | %) | 11.6 | % | (2.2 | %) | (5.1 | %) | 13.1 | % | ||||||||||
|
|
|
|
|
|
|
|
|
|
|
|||||||||||
| Three Months Ended | Six Months Ended | |||||||||||||||||||
| June 30, | March 31, | June 30, | ||||||||||||||||||
| 2016 | 2015 | 2016 | 2016 | 2015 | ||||||||||||||||
| Reconciliation of diluted earnings (loss) per share: |
||||||||||||||||||||
| GAAP earnings (loss) per share |
$ | (0.58 | ) | $ | 0.74 | $ | (0.32 | ) | $ | (0.90 | ) | $ | 1.51 | |||||||
| Other items (1) |
0.23 | 0.03 | 0.25 | 0.48 | 0.22 | |||||||||||||||
| Fixed asset write-downs (Other income (expense), net) |
0.05 | — | 0.01 | 0.06 | — | |||||||||||||||
| Argentina/Venezuela asset write-down (Other income (expense), net) |
— | — | — | — | 0.02 | |||||||||||||||
| Tax items (Provision for income taxes) |
— | — | — | — | 0.17 | |||||||||||||||
|
|
|
|
|
|
|
|
|
|
|
|||||||||||
| Operating (non-GAAP) earnings (loss) per share |
$ | (0.30 | ) | $ | 0.77 | $ | (0.06 | ) | $ | (0.36 | ) | $ | 1.92 | |||||||
|
|
|
|
|
|
|
|
|
|
|
|||||||||||
| (1) | Included in operating profit are other items related to costs associated with Voluntary Early Retirement Plans established by the Company during the first quarters of 2016 and 2015 and costs related to severance, facility closures, and other items. See Note 6. For the three and six months ended June 30, 2016, other items included in operating profit were $117 million and $258 million, respectively. For the three and six months ended June 30, 2015, other items included in operating profit were $17 million and $139 million, respectively. Other items included in operating profit for the three months ended March 31, 2016 totaled $141 million. |
28
Liquidity and Capital Resources
Overview
The Company assesses liquidity in terms of its ability to generate cash to fund operating, investing and financing activities. The Company remains in a strong financial position, with resources available to reinvest in existing businesses, strategic acquisitions and capital expenditures to meet short- and long-term objectives. The Company believes that cash on hand, cash generated from expected results of operations, amounts available under its credit facility and its commercial paper program will be sufficient to fund operations, anticipated working capital needs and other cash requirements such as capital expenditures, debt and interest payments and dividend payments for the foreseeable future.
At June 30, 2016, the Company had cash and cash equivalents of $1,661 million and total debt of $3,280 million. At December 31, 2015, cash and cash equivalents were $2,080 million and total debt was $3,909 million. As of June 30, 2016, approximately $1,614 million of the $1,661 million of cash and cash equivalents was held by our foreign subsidiaries, of which $1,459 million would be subject to a 35% U.S. income tax rate, offset by any available foreign tax credits if repatriated. However, our current plans are to permanently reinvest these funds outside of the U.S. If opportunities to invest in the U.S. are greater than available cash balances that are not subject to income tax, rather than repatriating cash, the Company may choose to borrow against its revolving credit facility or utilize its commercial paper program.
The Company’s outstanding debt at June 30, 2016 was $3,280 million and consisted of $499 million in 1.35% Senior Notes, $1,390 million in 2.60% Senior Notes, $1,087 million in 3.95% Senior Notes, $108 million in commercial paper borrowings and other debt of $196 million. The Company was in compliance with all covenants at June 30, 2016.
At June 30, 2016, there were $110 million in commercial paper borrowings (gross of debt issuance costs) supported by the $4.5 billion credit facility and no outstanding letters of credit issued under the credit facility, resulting in $4,390 million of funds available under this credit facility.
The Company had $1,343 million of outstanding letters of credit at June 30, 2016 that are under various bilateral letter of credit facilities. Letters of credit are issued as bid bonds, advanced payment bonds and performance bonds.
The following table summarizes our net cash provided by (used in) continuing operating activities, continuing investing activities and continuing financing activities for the periods presented (in millions):
| Six Months Ended | ||||||||
| June 30, | ||||||||
| 2016 | 2015 | |||||||
| Net cash provided by operating activities |
$ | 749 | $ | 308 | ||||
| Net cash used in investing activities |
(194 | ) | (272 | ) | ||||
| Net cash used in financing activities |
(990 | ) | (997 | ) | ||||
Operating Activities
For the first six months of 2016, cash provided by operating activities was $749 million compared to $308 million in the same period of 2015. Before changes in operating assets and liabilities, net of acquisitions, cash was used by operations primarily through loss from operations of $335 million plus non-cash charges of $260 million, $6 million in a dividend received from Voest-Alpine Tubulars, an unconsolidated affiliate, and $13 million in equity loss in unconsolidated affiliates.
Net changes in operating assets and liabilities, net of acquisitions, provided $805 million of cash for the first six months of 2016 compared to $877 million used in the same period in 2015. The decrease in cash provided in the first six months of 2016 compared to the same period in 2015 was primarily due to declines in accounts receivable, inventory and costs in excess of billings, partially offset by declines in accounts payable, accrued liabilities and billings in excess of costs.
29
Investing Activities
For the first six months of 2016, net cash used in investing activities was $194 million compared to $272 million for the same period of 2015. Net cash used in investing activities was primarily the result of capital expenditures and acquisition activity, both of which decreased in the first six months of 2016 compared to the same period of 2015. The Company used $161 million during the first six months of 2016 for capital expenditures compared to $234 million for the same period of 2015 and $36 million for acquisitions in the first six months of 2016 compared to $44 million for the same period of 2015.
Financing Activities
For the first six months of 2016, net cash used in financing activities was $990 million compared to $997 million for the same period of 2015. This increase was primarily the result of $785 million used to make payments on net commercial paper borrowings in 2016 compared to $1,139 million of net commercial paper borrowings in 2015 used to purchase $1,777 million (31.3 million shares) of the Company’s outstanding common shares.
Other
The effect of the change in exchange rates on cash flows was an increase of $16 million and a decrease of $31 million for the first six months of 2016 and 2015, respectively.
We believe that cash on hand, cash generated from operations, amounts available under our credit facility and through our commercial paper program, as well as from other sources of debt will be sufficient to fund operations, working capital needs, capital expenditure requirements, dividends and financing obligations.
We intend to pursue additional acquisition candidates, but the timing, size or success of any acquisition effort and the related potential capital commitments cannot be predicted. We continue to expect to fund future acquisitions primarily with cash flow from operations and borrowings, including the unborrowed portion of the credit facility, our commercial paper program or new debt issuances, but may also issue additional equity either directly or in connection with acquisitions. There can be no assurance that additional financing for acquisitions will be available at terms acceptable to us.
30
Recently Issued Accounting Standards
In March 2016, the FASB issued Accounting Standard Update No. 2016-09 “Improvements to Employee Share-Based Payment Accounting” (ASU 2016-09). This update requires that entities record all of the tax effects related to share-based payments at settlement (or expiration) through the income statement. ASU No. 2016-09 is effective for fiscal years beginning after December 15, 2016, and for interim periods within those fiscal years. The Company will adopt ASU No. 2016-09 on January 1, 2017.
In February 2016, the FASB issued Accounting Standard Update No. 2016-02 “Leases” (ASU No. 2016-02), which supersedes the lease requirements in Accounting Standard Codification Topic No. 840 “Leases” and most industry-specific guidance. This update increases transparency and comparability among organizations by recognizing lease assets and lease liabilities on the balance sheet and disclosing key information about leasing arrangements. ASU No. 2016-02 is effective for fiscal years beginning after December 15, 2018, and for interim periods within those fiscal years. The Company is currently assessing the impact of the adoption of ASU No. 2016-02 on its consolidated financial position and results of operations.
In November 2015, the FASB issued Accounting Standard Update No. 2015-17 “Balance Sheet Classification of Deferred Taxes” (ASU 2015-17). This update requires companies to classify all deferred tax assets and liabilities as non-current on its consolidated financial position. The Company has early adopted ASU 2015-17 on a retrospective basis, resulting in a reclassification of current deferred tax assets and liabilities to non-current deferred tax assets and liabilities. The ASU adoption is effective January 1, 2016, and prior periods have been retrospectively adjusted. See Note 8 for further information on the presentation of deferred taxes.
In April 2015, the FASB issued Accounting Standard Update No. 2015-03 “Simplifying the Presentation of Debt Issuance Costs” (ASU 2015-03) to simplify the presentation of debt issuance costs. This update requires that debt issuance costs related to a recognized debt liability be presented in the balance sheet as a direct deduction from the carrying amount of that debt liability, consistent with debt discounts, as opposed to historical presentation as an asset on the balance sheet. ASU No. 2015-03 is effective for fiscal years beginning after December 15, 2015, and for interim periods within those fiscal years. The Company adopted this update on January 1, 2016, and has applied the change retrospectively to prior periods for unamortized debt issuance costs. See Note 7 for further information on the presentation of debt issuance costs.
In August 2014, the FASB issued Accounting Standard Update No. 2014-15 “Disclosure of Uncertainties about an Entity’s Ability to Continue as a Going Concern” (ASU No. 2014-15), which amends FASB Accounting Standards Codification 205 “Presentation of Financial Statements.” This update requires management to assess an entity’s ability to continue as a going concern by incorporating and expanding upon certain principles that are currently in U.S. auditing standards. ASU No. 2014-15 is effective for the annual period ending after December 15, 2016, and for annual periods and interim periods thereafter. The Company is currently assessing the impact of the adoption of ASU No. 2014-15 on its consolidated financial position and results of operations.
In May 2014, the FASB issued Accounting Standard Update No. 2014-09 “Revenue from Contracts with Customers” (ASU
No. 2014-09), which supersedes the revenue recognition requirements in Accounting Standard Codification Topic No. 605 “Revenue
Recognition” and most industry-specific guidance. This update requires that entities recognize revenue to depict the transfer of promised goods or services to customers in an amount that reflects the consideration to which a company expects to be entitled in exchange for those goods or services. ASU No. 2014-09 is effective for fiscal years beginning after December 15, 2017, and for interim periods within those fiscal years. The Company is currently assessing the impact of the adoption of ASU No. 2014-09 on its consolidated financial position and results of operations.
Forward-Looking Statements
Some of the information in this document contains, or has incorporated by reference, forward-looking statements. Statements that are not historical facts, including statements about our beliefs and expectations, are forward-looking statements. Forward-looking statements typically are identified by use of terms such as “may,” “expect,” “anticipate,” “estimate,” and similar words, although some forward-looking statements are expressed differently. All statements herein regarding expected merger synergies are forward-looking statements. You should be aware that our actual results could differ materially from results anticipated in the forward-looking statements due to a number of factors, including but not limited to changes in oil and gas prices, customer demand for our products, difficulties encountered in integrating mergers and acquisitions, and worldwide economic activity. You should also consider carefully the statements under “Risk Factors,” as disclosed in our Annual Report on Form 10-K for the year ended December 31, 2015, which address additional factors that could cause our actual results to differ from those set forth in the forward-looking statements. Given these uncertainties, current or prospective investors are cautioned not to place undue reliance on any such forward-looking statements. We undertake no obligation to update any such factors or forward-looking statements to reflect future events or developments.
31
| Item 3. | Quantitative and Qualitative Disclosures About Market Risk |
We are exposed to changes in foreign currency exchange rates and interest rates. Additional information concerning each of these matters follows:
Foreign Currency Exchange Rates
We have extensive operations in foreign countries. The net assets and liabilities of these operations are exposed to changes in foreign currency exchange rates, although such fluctuations generally do not affect income since their functional currency is typically the local currency. These operations also have net assets and liabilities not denominated in the functional currency, which exposes us to changes in foreign currency exchange rates that impact income. We recorded a foreign exchange loss in our income statement of approximately $2 million in the first six months of 2016, compared to approximately $35 million in foreign exchange loss in the same period of the prior year. The gains and losses are primarily due to exchange rate fluctuations related to monetary asset balances denominated in currencies other than the functional currency and adjustments to our hedged positions as a result of changes in foreign currency exchange rates. Currency exchange rate fluctuations may create losses in future periods to the extent we maintain net monetary assets and liabilities not denominated in the functional currency of the countries using the local currency as their functional currency.
Some of our revenues in foreign countries are denominated in U.S. dollars, and therefore, changes in foreign currency exchange rates impact our earnings to the extent that costs associated with those U.S. dollar revenues are denominated in the local currency. Similarly some of our revenues are denominated in foreign currencies, but have associated U.S. dollar costs, which also give rise to foreign currency exchange rate exposure. In order to mitigate that risk, we may utilize foreign currency forward contracts to better match the currency of our revenues and associated costs. We do not use foreign currency forward contracts for trading or speculative purposes.
The following table details the Company’s foreign currency forward contracts grouped by functional currency and their expected maturity periods (in millions, except contract rates):
| As of June 30, 2016 | December 31, 2015 |
|||||||||||||||
| Functional Currency |
2016 | 2017 | Total | |||||||||||||
| CAD Buy USD/Sell CAD: |
|
|||||||||||||||
| Notional amount to buy (in Canadian dollars) |
— | — | — | 10 | ||||||||||||
| Average USD to CAD contract rate |
— | — | — | 1.3759 | ||||||||||||
| Fair Value at June 30, 2016 in U.S. dollars |
— | — | — | — | ||||||||||||
| Sell USD/Buy CAD: |
||||||||||||||||
| Notional amount to sell (in Canadian dollars) |
95 | 95 | 136 | |||||||||||||
| Average USD to CAD contract rate |
1.3059 | 1.3059 | 1.3554 | |||||||||||||
| Fair Value at June 30, 2016 in U.S. dollars |
1 | — | 1 | (2 | ) | |||||||||||
| EUR Buy USD/Sell EUR: |
|
|||||||||||||||
| Notional amount to buy (in Euros) |
3 | — | 3 | 11 | ||||||||||||
| Average USD to EUR contract rate |
0.8972 | 0.8851 | 0.8955 | 0.8528 | ||||||||||||
| Fair Value at June 30, 2016 in U.S. dollars |
— | — | — | 1 | ||||||||||||
| Sell USD/Buy EUR: |
||||||||||||||||
| Notional amount to buy (in Euros) |
98 | 1 | 99 | 199 | ||||||||||||
| Average USD to EUR contract rate |
0.8908 | 0.8771 | 0.8907 | 0.8953 | ||||||||||||
| Fair Value at June 30, 2016 in U.S. dollars |
(1 | ) | — | (1 | ) | (5 | ) | |||||||||
| KRW Sell USD/Buy KRW: |
|
|||||||||||||||
| Notional amount to buy (in South Korean won) |
40,867 | — | 40,867 | 23,613 | ||||||||||||
| Average USD to KRW contract rate |
1,168 | — | 1,168 | 1,181 | ||||||||||||
| Fair Value at June 30, 2016 in U.S. dollars |
— | — | — | — | ||||||||||||
| GBP Buy USD/Sell GBP: |
|
|||||||||||||||
| Notional amount to buy (in British Pounds Sterling) |
1 | — | 1 | 2 | ||||||||||||
| Average USD to GBP contract rate |
0.6956 | — | 0.6956 | 0.6416 | ||||||||||||
| Fair Value at June 30, 2016 in U.S. dollars |
— | — | — | — | ||||||||||||
| Sell USD/Buy GBP: |
||||||||||||||||
| Notional amount to buy (in British Pounds Sterling) |
156 | — | 156 | 170 | ||||||||||||
| Average USD to GBP contract rate |
0.7404 | — | 0.7404 | 0.6613 | ||||||||||||
| Fair Value at June 30, 2016 in U.S. dollars |
(2 | ) | — | (2 | ) | (5 | ) | |||||||||
32
| As of June 30, 2016 | December 31, 2015 |
|||||||||||||||
| Functional Currency |
2016 | 2017 | Total | |||||||||||||
| USD Buy CAD/Sell USD: |
||||||||||||||||
| Notional amount to buy (in U.S. dollars) |
5 | — | 5 | 7 | ||||||||||||
| Average CAD to USD contract rate |
0.7818 | — | 0.7818 | 0.7635 | ||||||||||||
| Fair Value at June 30, 2016 in U.S. dollars |
— | — | — | — | ||||||||||||
| Buy DKK/Sell USD: |
||||||||||||||||
| Notional amount to buy (in U.S. dollars) |
11 | 4 | 15 | 24 | ||||||||||||
| Average DKK to USD contract rate |
0.1483 | 0.1549 | 0.1500 | 0.1553 | ||||||||||||
| Fair Value at June 30, 2016 in U.S. dollars |
— | — | — | (1 | ) | |||||||||||
| Buy EUR/Sell USD: |
||||||||||||||||
| Notional amount to buy (in U.S. dollars) |
99 | 48 | 147 | 278 | ||||||||||||
| Average EUR to USD contract rate |
1.1296 | 1.1288 | 1.1293 | 1.1925 | ||||||||||||
| Fair Value at June 30, 2016 in U.S. dollars |
(1 | ) | — | (1 | ) | (23 | ) | |||||||||
| Buy GBP/Sell USD: |
||||||||||||||||
| Notional amount to buy (in U.S. dollars) |
13 | — | 13 | 20 | ||||||||||||
| Average GBP to USD contract rate |
1.4525 | — | 1.4525 | 1.5568 | ||||||||||||
| Fair Value at June 30, 2016 in U.S. dollars |
(1 | ) | — | (1 | ) | (1 | ) | |||||||||
| Buy NOK/Sell USD: |
||||||||||||||||
| Notional amount to buy (in U.S. dollars) |
776 | 306 | 1,082 | 1,501 | ||||||||||||
| Average NOK to USD contract rate |
0.1321 | 0.1246 | 0.1299 | 0.1353 | ||||||||||||
| Fair Value at June 30, 2016 in U.S. dollars |
(75 | ) | (13 | ) | (88 | ) | (239 | ) | ||||||||
| Buy SGD/Sell USD: |
||||||||||||||||
| Notional amount to buy (in U.S. dollars) |
4 | 4 | 8 | 12 | ||||||||||||
| Average SGD to USD contract rate |
0.7766 | 0.7262 | 0.7479 | 0.7534 | ||||||||||||
| Fair Value at June 30, 2016 in U.S. dollars |
— | — | — | (1 | ) | |||||||||||
| Sell DKK/Buy USD: |
||||||||||||||||
| Notional amount to buy (in U.S. dollars) |
5 | — | 5 | 8 | ||||||||||||
| Average DKK to USD contract rate |
0.1533 | — | 0.1533 | 0.1510 | ||||||||||||
| Fair Value at June 30, 2016 in U.S. dollars |
— | — | — | — | ||||||||||||
| Sell EUR/Buy USD: |
||||||||||||||||
| Notional amount to sell (in U.S. dollars) |
56 | 7 | 63 | 89 | ||||||||||||
| Average EUR to USD contract rate |
1.1293 | 1.1373 | 1.1302 | 1.1075 | ||||||||||||
| Fair Value at June 30, 2016 in U.S. dollars |
1 | — | 1 | 1 | ||||||||||||
| Sell GBP/Buy USD: |
||||||||||||||||
| Notional amount to sell (in U.S. dollars) |
6 | — | 6 | 3 | ||||||||||||
| Average GBP to USD contract rate |
1.4507 | — | 1.4507 | 1.4961 | ||||||||||||
| Fair Value at June 30, 2016 in U.S. dollars |
— | — | — | — | ||||||||||||
| Sell NOK/Buy USD: |
||||||||||||||||
| Notional amount to sell (in U.S. dollars) |
78 | 7 | 85 | 110 | ||||||||||||
| Average NOK to USD contract rate |
0.1219 | 0.1149 | 0.1213 | 0.1321 | ||||||||||||
| Fair Value at June 30, 2016 in U.S. dollars |
2 | — | 2 | 15 | ||||||||||||
| Sell RUB/Buy USD: |
||||||||||||||||
| Notional amount to sell (in U.S. dollars) |
30 | — | 30 | 30 | ||||||||||||
| Average RUB to USD contract rate |
0.0150 | — | 0.0150 | 0.0139 | ||||||||||||
| Fair Value at June 30, 2016 in U.S. dollars |
— | — | — | 1 | ||||||||||||
| Sell SGD/Buy USD: |
||||||||||||||||
| Notional amount to sell (in U.S. dollars) |
1 | — | 1 | 2 | ||||||||||||
| Average SGD to USD contract rate |
0.7357 | — | 0.7357 | 0.7082 | ||||||||||||
| Fair Value at June 30, 2016 in U.S. dollars |
— | — | — | — | ||||||||||||
33
| As of June 30, 2016 | December 31, 2015 |
|||||||||||||||
| Functional Currency |
2016 | 2017 | Total | |||||||||||||
| BRL Buy EUR/Sell BRL: |
||||||||||||||||
| Notional amount to sell (in U.S. dollars) |
55 | 173 | 228 | 199 | ||||||||||||
| Average EUR to BRL contract rate |
4.2427 | 4.4840 | 4.4237 | 4.3679 | ||||||||||||
| Fair Value at June 30, 2016 in U.S. dollars |
(2 | ) | (5 | ) | (7 | ) | 1 | |||||||||
| Buy USD/Sell BRL: |
||||||||||||||||
| Notional amount to sell (in U.S. dollars) |
4 | 26 | 30 | — | ||||||||||||
| Average USD to BRL contract rate |
3.8229 | 4.0278 | 3.9999 | — | ||||||||||||
| Fair Value at June 30, 2016 in U.S. dollars |
— | (1 | ) | (1 | ) | — | ||||||||||
| Sell EUR/Buy BRL: |
||||||||||||||||
| Notional amount to sell (in U.S. dollars) |
187 | 879 | 1,066 | 427 | ||||||||||||
| Average EUR to BRL contract rate |
4.2892 | 4.5704 | 4.5185 | 4.6985 | ||||||||||||
| Fair Value at June 30, 2016 in U.S. dollars |
7 | 27 | 34 | 4 | ||||||||||||
| Sell USD/Buy BRL: |
||||||||||||||||
| Notional amount to sell (in U.S. dollars) |
4 | 10 | 14 | — | ||||||||||||
| Average USD to BRL contract rate |
3.6258 | 3.7565 | 3.7211 | — | ||||||||||||
| Fair Value at June 30, 2016 in U.S. dollars |
— | — | — | — | ||||||||||||
| DKK Sell DKK/Buy USD: |
||||||||||||||||
| Notional amount to buy (in U.S. dollars) |
946 | — | 946 | 1,396 | ||||||||||||
| Average DKK to USD contract rate |
6.5505 | — | 6.5505 | 6.5618 | ||||||||||||
| Fair Value at June 30, 2016 in U.S. dollars |
(3 | ) | — | (3 | ) | (8 | ) | |||||||||
| Other Currencies |
||||||||||||||||
| Fair Value at June 30, 2016 in U.S. dollars |
— | — | — | 2 | ||||||||||||
|
|
|
|
|
|
|
|
|
|||||||||
| Total Fair Value at June 30, 2016 in U.S. dollars |
(74 | ) | 8 | (66 | ) | (260 | ) | |||||||||
|
|
|
|
|
|
|
|
|
|||||||||
The Company had other financial market risk sensitive instruments denominated in foreign currencies for transactional exposures totaling $86 million and translation exposures totaling $267 million as of June 30, 2016 excluding trade receivables and payables, which approximate fair value. These market risk sensitive instruments consisted of cash balances and overdraft facilities. The Company estimates that a hypothetical 10% movement of all applicable foreign currency exchange rates on the transactional exposures financial market risk sensitive instruments could affect net income by $6 million and the translational exposures financial market risk sensitive instruments could affect the future fair value by $27 million.
The counterparties to forward contracts are major financial institutions. The credit ratings and concentration of risk of these financial institutions are monitored on a continuing basis. In the event that the counterparties fail to meet the terms of a foreign currency contract, our exposure is limited to the foreign currency rate differential.
Interest Rate Risk
At June 30, 2016, long term borrowings consisted of $499 million in 1.35% Senior Notes, $1,390 million in 2.60% Senior Notes and $1,087 million in 3.95% Senior Notes. At June 30, 2016, there were $110 million in commercial paper borrowings (gross of debt issuance costs) and no outstanding letters of credit issued under the credit facility, resulting in $4,390 million of funds available under this credit facility. Occasionally a portion of borrowings under our credit facility could be denominated in multiple currencies which could expose us to market risk with exchange rate movements. These instruments carry interest at a pre-agreed upon percentage point spread from either LIBOR, NIBOR or EURIBOR, or at the U.S. prime rate. Under our credit facility, we may, at our option, fix the interest rate for certain borrowings based on a spread over LIBOR, NIBOR or EURIBOR for 30 days to six months. Our objective is to maintain a portion of our debt in variable rate borrowings for the flexibility obtained regarding early repayment without penalties and lower overall cost as compared with fixed-rate borrowings.
34
| Item 4. | Controls and Procedures |
As of the end of the period covered by this report, we carried out an evaluation, under the supervision and with the participation of the Company’s management, including the Company’s Chief Executive Officer and Chief Financial Officer, of the effectiveness of the design and operation of the Company’s disclosure controls and procedures. The Company’s disclosure controls and procedures are designed to provide reasonable assurance that the information required to be disclosed by the Company in the reports it files under the Exchange Act is accumulated and communicated to the Company’s management, including the Company’s Chief Executive Officer and Chief Financial Officer, as appropriate, to allow timely decisions regarding required disclosures and is recorded, processed, summarized and reported within the time period specified in the rules and forms of the Securities and Exchange Commission. Based upon that evaluation, the Company’s Chief Executive Officer and Chief Financial Officer concluded that the Company’s disclosure controls and procedures are effective as of the end of the period covered by this report at a reasonable assurance level.
There has been no change in our internal control over financial reporting (as defined in Rule 13a-15(f) under the Exchange Act) that occurred during our last fiscal quarter that has materially affected, or is reasonably likely to materially affect, our internal control over financial reporting.
35
PART II - OTHER INFORMATION
| Item 1A. | Risk Factors |
As of the date of this filing, the Company and its operations continue to be subject to the risk factors previously disclosed in Part I, Item 1A “Risk Factors” in our 2015 Annual Report on Form 10-K.
| Item 4. | Mine Safety Disclosures |
Information regarding mine safety and other regulatory actions at our mines is included in Exhibit 95 to this Form 10-Q.
| Item 6. | Exhibits |
Reference is hereby made to the Exhibit Index commencing on page 38.
36
SIGNATURE
Pursuant to the requirements of the Securities Exchange Act of 1934, the registrant has duly caused this report to be signed on its behalf by the undersigned thereunto duly authorized.
| Date: August 3, 2016 | By: | /s/ Scott K. Duff | ||||
| Scott K. Duff | ||||||
| Vice President, Corporate Controller & Chief Accounting Officer (Duly Authorized Officer, Principal Accounting Officer) | ||||||
37
INDEX TO EXHIBITS
| (a) | Exhibits |
| 3.1 | Fifth Amended and Restated Certificate of Incorporation of National Oilwell Varco, Inc. (Exhibit 3.1) (1) | |
| 3.2 | Amended and Restated By-laws of National Oilwell Varco, Inc. (Exhibit 3.1) (2) | |
| 10.1 | Credit Agreement, dated as of September 28, 2012, among National Oilwell Varco, Inc., the financial institutions signatory thereto, including Wells Fargo Bank, N.A., in their capacities as Administrative Agent, Co-Lead Arranger and Joint Book Runner. (Exhibit 10.1) (3) | |
| 10.2 | Amendment No. 2 to the Credit Agreement, dated as of September 28, 2012, among National Oilwell Varco, Inc., the financial institutions signatory thereto, including Wells Fargo Bank, N.A., as Administrative Agent, the other agents named therein, and the lenders parties thereto. (Exhibit 10.1) (4) | |
| 10.3 | National Oilwell Varco Long-Term Incentive Plan, as amended and restated. (5)* | |
| 10.4 | Form of Employee Stock Option Agreement. (Exhibit 10.1) (6) | |
| 10.5 | Form of Non-Employee Director Stock Option Agreement. (Exhibit 10.2) (6) | |
| 10.6 | Form of Performance-Based Restricted Stock. (18 Month) Agreement (Exhibit 10.1) (7) | |
| 10.7 | Form of Performance-Based Restricted Stock. (36 Month) Agreement (Exhibit 10.2) (7) | |
| 10.8 | Form of Performance Award Agreement (Exhibit 10.1) (8) | |
| 10.9 | Form of Executive Employment Agreement. (Exhibit 10.1) (9) | |
| 10.10 | Form of Executive Severance Agreement. (Exhibit 10.2) (9) | |
| 10.11 | Form of Employee Nonqualified Stock Option Grant Agreement (10) | |
| 10.12 | Form of Restricted Stock Agreement (10) | |
| 10.13 | Form of Performance Award Agreement (10) | |
| 31.1 | Certification pursuant to Rule 13a-14a and Rule 15d-14(a) of the Securities and Exchange Act, as amended. | |
| 31.2 | Certification pursuant to Rule 13a-14a and Rule 15d-14(a) of the Securities and Exchange Act, as amended. | |
| 32.1 | Certification pursuant to Section 906 of the Sarbanes-Oxley Act of 2002. | |
| 32.2 | Certification pursuant to Section 906 of the Sarbanes-Oxley Act of 2002. | |
| 95 | Mine Safety Information persuant to section 1503 of the Dodd-Frank Act. | |
| 101 | The following materials from our Quarterly Report on Form 10-Q for the period ended June 30, 2016 formatted in eXtensible Business Reporting Language (XBRL): (i) Consolidated Balance Sheets, (ii) Consolidated Statements of Income, (iii) Consolidated Statements of Cash Flows, and (iv) Notes to the Consolidated Financial Statements, tagged as block text. | |
| * | Compensatory plan or arrangement for management or others. |
| (1) | Filed as an Exhibit to our Quarterly Report on Form 10-Q filed on August 5, 2011. |
| (2) | Filed as an Exhibit to our Current Report on Form 8-K filed on August 17, 2011. |
| (3) | Filed as an Exhibit to our Current Report on Form 8-K filed on October 1, 2012 |
| (4) | Filed as an Exhibit to our Current Report on Form 8-K filed on May 13, 2015. |
38
| (5) | Filed as Appendix I to our Proxy Statement filed on April 11, 2016. |
| (6) | Filed as an Exhibit to our Current Report on Form 8-K filed on February 23, 2006. |
| (7) | Filed as an Exhibit to our Current Report on Form 8-K filed on March 27, 2007. |
| (8) | Filed as an Exhibit to our Current Report on Form 8-K filed on March 27, 2013. |
| (9) | Filed as an Exhibit to our Current Report on Form 8-K filed on November 24, 2014. |
| (10) | Filed as an Exhibit to our Current Report on Form 8-K filed on February 26, 2016. |
We hereby undertake, pursuant to Regulation S-K, Item 601(b), paragraph (4) (iii), to furnish to the U.S. Securities and Exchange Commission, upon request, all constituent instruments defining the rights of holders of our long-term debt not filed herewith.
39
Exhibit 31.1
CERTIFICATION
I, Clay C. Williams, certify that:
1. I have reviewed this quarterly report on Form 10-Q of National Oilwell Varco, Inc.;
2. Based on my knowledge, this report does not contain any untrue statement of a material fact or omit to state a material fact necessary to make the statements made, in light of the circumstances under which such statements were made, not misleading with respect to the period covered by this report;
3. Based on my knowledge, the financial statements, and other financial information included in this report, fairly present in all material respects the financial condition, results of operations and cash flows of the registrant as of, and for, the periods presented in this report;
4. The registrant’s other certifying officer and I are responsible for establishing and maintaining disclosure controls and procedures (as defined in Exchange Act Rules 13a-15(e) and 15d-15(e)) and internal control over financial reporting (as defined in Exchange Act Rules 13a-15(f) and 15d-15(f)) for the registrant and have:
a) Designed such disclosure controls and procedures, or caused such disclosure controls and procedures to be designed under our supervision, to ensure that material information relating to the registrant, including its consolidated subsidiaries, is made known to us by others within those entities, particularly during the period in which this report is being prepared;
b) Designed such internal control over financial reporting, or caused such internal control over financial reporting to be designed under our supervision, to provide reasonable assurance regarding the reliability of financial reporting and the preparation of financial statements for external purposes in accordance with generally accepted accounting principles;
c) Evaluated the effectiveness of the registrant’s disclosure controls and procedures and presented in this report our conclusions about the effectiveness of the disclosure controls and procedures, as of the end of the period covered by this report based on such evaluation; and
d) Disclosed in this report any change in the registrant’s internal control over financial reporting that occurred during the registrant’s most recent fiscal quarter (the registrant’s fourth fiscal quarter in the case of an annual report) that has materially affected, or is reasonably likely to materially affect, the registrant’s internal control over financial reporting; and
5. The registrant’s other certifying officer and I have disclosed, based on our most recent evaluation of internal control over financial reporting, to the registrant’s auditors and the audit committee of registrant’s board of directors (or persons performing the equivalent function):
a) All significant deficiencies and material weaknesses in the design or operation of internal control over financial reporting which are reasonably likely to adversely affect the registrant’s ability to record, process, summarize and report financial information; and
b) Any fraud, whether or not material, that involves management or other employees who have a significant role in the registrant’s internal control over financial reporting.
Date: August 3, 2016
| By: | /s/ Clay C. Williams | |
| Clay C. Williams | ||
| Chairman, President and Chief Executive Officer | ||
Exhibit 31.2
CERTIFICATION
I, Jose A. Bayardo, certify that:
1. I have reviewed this quarterly report on Form 10-Q of National Oilwell Varco, Inc.;
2. Based on my knowledge, this report does not contain any untrue statement of a material fact or omit to state a material fact necessary to make the statements made, in light of the circumstances under which such statements were made, not misleading with respect to the period covered by this report;
3. Based on my knowledge, the financial statements, and other financial information included in this report, fairly present in all material respects the financial condition, results of operations and cash flows of the registrant as of, and for, the periods presented in this report;
4. The registrant’s other certifying officer and I are responsible for establishing and maintaining disclosure controls and procedures (as defined in Exchange Act Rules 13a-15(e) and 15d-15(e)) and internal control over financial reporting (as defined in Exchange Act Rules 13a-15(f) and 15d-15(f)) for the registrant and have:
a) Designed such disclosure controls and procedures, or caused such disclosure controls and procedures to be designed under our supervision, to ensure that material information relating to the registrant, including its consolidated subsidiaries, is made known to us by others within those entities, particularly during the period in which this report is being prepared;
b) Designed such internal control over financial reporting, or caused such internal control over financial reporting to be designed under our supervision, to provide reasonable assurance regarding the reliability of financial reporting and the preparation of financial statements for external purposes in accordance with generally accepted accounting principles;
c) Evaluated the effectiveness of the registrant’s disclosure controls and procedures and presented in this report our conclusions about the effectiveness of the disclosure controls and procedures, as of the end of the period covered by this report based on such evaluation; and
d) Disclosed in this report any change in the registrant’s internal control over financial reporting that occurred during the registrant’s most recent fiscal quarter (the registrant’s fourth fiscal quarter in the case of an annual report) that has materially affected, or is reasonably likely to materially affect, the registrant’s internal control over financial reporting; and
5. The registrant’s other certifying officer and I have disclosed, based on our most recent evaluation of internal control over financial reporting, to the registrant’s auditors and the audit committee of registrant’s board of directors (or persons performing the equivalent function):
a) All significant deficiencies and material weaknesses in the design or operation of internal control over financial reporting which are reasonably likely to adversely affect the registrant’s ability to record, process, summarize and report financial information; and
b) Any fraud, whether or not material, that involves management or other employees who have a significant role in the registrant’s internal control over financial reporting.
| Date: August 3, 2016 | By: | /s/ Jose A. Bayardo | ||||
| Jose A. Bayardo | ||||||
| Senior Vice President and Chief Financial Officer | ||||||
Exhibit 32.1
CERTIFICATION PURSUANT TO SECTION 906 OF THE SARBANES-OXLEY ACT OF 2002
In connection with the Quarterly Report of National Oilwell Varco, Inc. (the “Company”) on Form 10-Q for the period ending June 30, 2016 as filed with the Securities and Exchange Commission on the date hereof (the “Report”), the undersigned, Clay C. Williams, Chairman, President and Chief Executive Officer of the Company, hereby certifies, pursuant to 18 U.S.C. Section 1350, as adopted pursuant to Section 906 of the Sarbanes-Oxley Act of 2002, that:
(i) The Report fully complies with the requirements of Section 13(a) or 15(d) of the Securities Exchange Act of 1934; and
(ii) The information contained in the Report fairly presents, in all material respects, the financial condition and results of operations of the Company.
The certification is given to the knowledge of the undersigned.
| By: | /s/ Clay C. Williams | |
| Name: | Clay C. Williams | |
| Title: | Chairman, President and Chief Executive Officer | |
| Date: | August 3, 2016 |
Exhibit 32.2
CERTIFICATION PURSUANT TO SECTION 906 OF THE SARBANES-OXLEY ACT OF 2002
In connection with the Quarterly Report of National Oilwell Varco, Inc. (the “Company”) on Form 10-Q for the period ending June 30, 2016 as filed with the Securities and Exchange Commission on the date hereof (the “Report”), the undersigned, Jose A. Bayardo, Senior Vice President and Chief Financial Officer of the Company, hereby certifies, pursuant to 18 U.S.C. Section 1350, as adopted pursuant to Section 906 of the Sarbanes-Oxley Act of 2002, that:
(i) The Report fully complies with the requirements of Section 13(a) or 15(d) of the Securities Exchange Act of 1934; and
(ii) The information contained in the Report fairly presents, in all material respects, the financial condition and results of operations of the Company.
The certification is given to the knowledge of the undersigned.
| By: | /s/ Jose A. Bayardo | |
| Name: | Jose A. Bayardo | |
| Title: | Senior Vice President and Chief Financial Officer | |
| Date: | August 3, 2016 |
Exhibit 95
Mine Safety Disclosures
Our mines are operated subject to the regulation of the Federal Mine Safety and Health Administration (“MSHA”), under the Federal Mine Safety and Health Act of 1977 (the “Mine Act”). The following mine safety data is provided pursuant to the Dodd-Frank Wall Street Reform and Consumer Protection Act (the “Dodd-Frank Act”).
As required by the reporting requirements of the Dodd-Frank Act, as amended, the table below presents the following information for the three months ended June 30, 2016.
| Mine |
Section 104 S&S Citations |
Section 104(b) Orders |
Section 104(d) Citations and Orders |
Section 110(b)(2) Violations |
Section 107(a) Orders |
Total Dollar Value of MSHA Assessments Proposed |
Total Number of Mining Related Fatalities |
Received Notice of Pattern of Violations Under Section 104(e) |
Received Notice of Potential to have Patterns Under Section 104(e) |
Legal Actions Pending as of Last Day of Period |
Legal Actions Initiated During Period |
Legal Actions Resolved During Period |
||||||||||||||||||||||||||||||||||||
| Big Ledge (26-02603) |
— | — | — | — | — | $ | — | — | no | no | — | — | — | |||||||||||||||||||||||||||||||||||
| Dry Creek (26-02646) |
— | — | — | — | — | $ | 100 | — | no | no | — | — | — | |||||||||||||||||||||||||||||||||||
| Osino Barite Mill (26-02724) |
— | — | — | — | — | $ | — | — | no | no | — | — | — | |||||||||||||||||||||||||||||||||||
Serious News for Serious Traders! Try StreetInsider.com Premium Free!
You May Also Be Interested In
- VFS Class Action Alert: Robbins LLP Reminds Stockholders of the Lead Plaintiff Deadline in the Lawsuit Against VinFast Auto Ltd.
- BLUE Lawsuit: Robbins LLP Reminds Investors of bluebird bio, Inc. of Pending Lead Plaintiff Deadline
- CF Industries and JERA Announce Joint Development Agreement to Develop Greenfield Low-Carbon Ammonia Production Capacity in the United States
Create E-mail Alert Related Categories
SEC FilingsSign up for StreetInsider Free!
Receive full access to all new and archived articles, unlimited portfolio tracking, e-mail alerts, custom newswires and RSS feeds - and more!
