

Form 10-Q EXA CORP For: Jul 31
 Tweet
Tweet Share
ShareTable of Contents
UNITED STATES
SECURITIES AND EXCHANGE COMMISSION
WASHINGTON, DC 20549
FORM 10-Q
(Mark One)
| x | QUARTERLY REPORT PURSUANT TO SECTION 13 OR 15(d) OF THE SECURITIES EXCHANGE ACT OF 1934 |
For the quarterly period ended July 31, 2015
OR
| ¨ | TRANSITION REPORT PURSUANT TO SECTION 13 OR 15(d) OF THE SECURITIES EXCHANGE ACT OF 1934 |
Commission File Number: 001-35584
EXA CORPORATION
(Exact Name of Registrant as Specified in Its Charter)
| Delaware | 04-3139906 | |
| (State or Other Jurisdiction of Incorporation or Organization) |
(I.R.S. Employer Identification No.) |
55 Network Drive
Burlington, MA 01803
(Address of Principal Executive Offices, Including Zip Code)
(781) 564-0200
(Registrant’s Telephone Number, Including Area Code)
Indicate by check mark whether the registrant: (1) has filed all reports required to be filed by Section 13 or 15(d) of the Securities Exchange Act of 1934 during the preceding 12 months (or for such shorter period that the registrant was required to file such reports), and (2) has been subject to such filing requirements for the past 90 days. Yes x No ¨
Indicate by check mark whether the registrant has submitted electronically and posted on its corporate Web site, if any, every Interactive Data File required to be submitted and posted pursuant to Rule 405 of Regulation S-T during the preceding 12 months (or for such shorter period that the registrant was required to submit and post such files). Yes x No ¨
Indicate by check mark whether the registrant is a large accelerated filer, an accelerated filer, a non-accelerated filer, or a smaller reporting company. See definitions of “large accelerated filer,” “accelerated filer” and “smaller reporting company” in Rule 12b-2 of the Exchange Act. (Check one):
| Large accelerated filer | ¨ | Accelerated filer | x | |||
| Non-accelerated filer | ¨ (Do not check if a smaller reporting company) | Smaller reporting company | ¨ | |||
Indicate by check mark whether the registrant is a shell company (as defined in Rule 12b-2 of the Exchange Act). Yes ¨ No x
As of August 28, 2015, 14,604,254 shares of the registrant’s outstanding common stock, $0.001 par value per share, were outstanding.
Table of Contents
FORM 10-Q
FOR THE QUARTER ENDED July 31, 2015
TABLE OF CONTENTS
2
Table of Contents
EXA CORPORATION
(Unaudited)
(in thousands, except share and per share data)
| July 31, 2015 |
January 31, 2015 |
|||||||
| ASSETS |
||||||||
| Current assets: |
||||||||
| Cash and cash equivalents |
$ | 30,406 | $ | 21,785 | ||||
| Accounts receivable |
6,303 | 27,462 | ||||||
| Prepaid expenses and other current assets |
3,375 | 3,098 | ||||||
|
|
|
|
|
|||||
| Total current assets |
40,084 | 52,345 | ||||||
| Property and equipment, net |
6,208 | 6,961 | ||||||
| Intangible assets, net |
2,220 | 2,395 | ||||||
| Deferred tax assets |
261 | 260 | ||||||
| Other assets |
1,024 | 1,092 | ||||||
|
|
|
|
|
|||||
| Total assets |
$ | 49,797 | $ | 63,053 | ||||
|
|
|
|
|
|||||
| LIABILITIES AND STOCKHOLDERS’ EQUITY |
||||||||
| Current liabilities: |
||||||||
| Accounts payable |
$ | 1,731 | $ | 1,620 | ||||
| Accrued expenses |
6,345 | 10,585 | ||||||
| Current portion of deferred revenue |
19,575 | 26,863 | ||||||
| Current portion of capital lease obligations |
1,824 | 2,390 | ||||||
|
|
|
|
|
|||||
| Total current liabilities |
29,475 | 41,458 | ||||||
| Deferred revenue |
25 | 38 | ||||||
| Capital lease obligations |
862 | 1,602 | ||||||
| Deferred rent |
871 | 472 | ||||||
| Other long-term liabilities |
498 | 592 | ||||||
|
|
|
|
|
|||||
| Total liabilities |
31,731 | 44,162 | ||||||
|
|
|
|
|
|||||
| Commitments and contingencies (Note 9) |
||||||||
| Stockholders’ equity: |
||||||||
| Preferred stock, $0.001 par value; 5,000,000 shares authorized; no shares issued and outstanding |
— | — | ||||||
| Common stock, $0.001 par value; 30,000,000 shares authorized; 14,636,756 and 13,874,744 shares issued, respectively; 14,604,254 and 13,842,242 shares outstanding, respectively |
15 | 14 | ||||||
| Additional paid-in capital |
90,410 | 88,181 | ||||||
| Accumulated deficit |
(71,961 | ) | (68,878 | ) | ||||
| Treasury stock (32,502 common shares, at cost) |
0 | 0 | ||||||
| Accumulated other comprehensive loss |
(398 | ) | (426 | ) | ||||
|
|
|
|
|
|||||
| Total stockholders’ equity |
18,066 | 18,891 | ||||||
|
|
|
|
|
|||||
| Total liabilities and stockholders’ equity |
$ | 49,797 | $ | 63,053 | ||||
|
|
|
|
|
|||||
The accompanying notes are an integral part of the consolidated financial statements
3
Table of Contents
EXA CORPORATION
Consolidated Statements of Operations and Comprehensive Loss
(Unaudited)
(in thousands, except share and per share data)
| Three Months Ended July 31, | Six Months Ended July 31, | |||||||||||||||
| 2015 | 2014 | 2015 | 2014 | |||||||||||||
| Revenue: |
||||||||||||||||
| License revenue |
$ | 12,977 | $ | 12,316 | $ | 25,219 | $ | 23,976 | ||||||||
| Project revenue |
2,478 | 2,527 | 5,004 | 4,637 | ||||||||||||
|
|
|
|
|
|
|
|
|
|||||||||
| Total revenues |
15,455 | 14,843 | 30,223 | 28,613 | ||||||||||||
|
|
|
|
|
|
|
|
|
|||||||||
| Operating expenses: |
||||||||||||||||
| Cost of revenues |
4,755 | 4,632 | 9,398 | 9,228 | ||||||||||||
| Sales and marketing |
2,440 | 2,509 | 4,928 | 5,076 | ||||||||||||
| Research and development |
5,952 | 5,404 | 12,122 | 10,506 | ||||||||||||
| General and administrative |
3,126 | 3,217 | 6,393 | 6,339 | ||||||||||||
|
|
|
|
|
|
|
|
|
|||||||||
| Total operating expenses |
16,273 | 15,762 | 32,841 | 31,149 | ||||||||||||
|
|
|
|
|
|
|
|
|
|||||||||
| Loss from operations |
(818 | ) | (919 | ) | (2,618 | ) | (2,536 | ) | ||||||||
|
|
|
|
|
|
|
|
|
|||||||||
| Other (expense) income, net: |
||||||||||||||||
| Foreign exchange (loss) gain |
(171 | ) | 175 | (223 | ) | 131 | ||||||||||
| Interest expense |
(54 | ) | (94 | ) | (119 | ) | (177 | ) | ||||||||
| Interest income |
2 | 2 | 5 | 6 | ||||||||||||
| Other income, net |
— | 3 | — | 3 | ||||||||||||
|
|
|
|
|
|
|
|
|
|||||||||
| Total other (expense) income, net |
(223 | ) | 86 | (337 | ) | (37 | ) | |||||||||
|
|
|
|
|
|
|
|
|
|||||||||
| Loss before income taxes |
(1,041 | ) | (833 | ) | (2,955 | ) | (2,573 | ) | ||||||||
| Provision for income taxes |
(154 | ) | (176 | ) | (128 | ) | (15,656 | ) | ||||||||
|
|
|
|
|
|
|
|
|
|||||||||
| Net loss |
$ | (1,195 | ) | $ | (1,009 | ) | $ | (3,083 | ) | $ | (18,229 | ) | ||||
|
|
|
|
|
|
|
|
|
|||||||||
| Net loss per share: |
||||||||||||||||
| Basic |
$ | (0.08 | ) | $ | (0.07 | ) | $ | (0.21 | ) | $ | (1.34 | ) | ||||
| Diluted |
$ | (0.08 | ) | $ | (0.07 | ) | $ | (0.21 | ) | $ | (1.34 | ) | ||||
| Weighted average shares outstanding used in computing net loss per share: |
||||||||||||||||
| Basic |
14,535,539 | 13,775,250 | 14,420,562 | 13,639,866 | ||||||||||||
| Diluted |
14,535,539 | 13,775,250 | 14,420,562 | 13,639,866 | ||||||||||||
| Comprehensive loss: |
||||||||||||||||
| Net loss |
$ | (1,195 | ) | $ | (1,009 | ) | $ | (3,083 | ) | $ | (18,229 | ) | ||||
| Foreign currency translation adjustments |
(12 | ) | (75 | ) | 28 | (34 | ) | |||||||||
|
|
|
|
|
|
|
|
|
|||||||||
| Comprehensive loss |
$ | (1,207 | ) | $ | (1,084 | ) | $ | (3,055 | ) | $ | (18,263 | ) | ||||
|
|
|
|
|
|
|
|
|
|||||||||
The accompanying notes are an integral part of the consolidated financial statements
4
Table of Contents
EXA CORPORATION
Consolidated Statements of Cash Flows
(Unaudited)
(in thousands)
| Six Months Ended July 31, | ||||||||
| 2015 | 2014 | |||||||
| Cash flows provided by operating activities: |
||||||||
| Net loss |
$ | (3,083 | ) | $ | (18,229 | ) | ||
| Adjustments to reconcile net loss to net cash provided by operating activities: |
||||||||
| Depreciation and amortization |
1,528 | 1,394 | ||||||
| Stock-based compensation expense |
1,105 | 870 | ||||||
| Deferred rent expense |
(179 | ) | (187 | ) | ||||
| Deferred income taxes |
— | 15,215 | ||||||
| Net change in operating assets and liabilities: |
||||||||
| Accounts receivable |
21,302 | 19,403 | ||||||
| Prepaid expenses and other current assets |
(276 | ) | (374 | ) | ||||
| Other assets |
68 | (35 | ) | |||||
| Accounts payable |
112 | 181 | ||||||
| Accrued expenses |
(3,635 | ) | (4,058 | ) | ||||
| Other liabilities |
(93 | ) | 2 | |||||
| Deferred revenue |
(7,251 | ) | (9,387 | ) | ||||
|
|
|
|
|
|||||
| Net cash provided by operating activities |
9,598 | 4,795 | ||||||
|
|
|
|
|
|||||
| Cash flows used in investing activities: |
||||||||
| Purchases of property and equipment |
(626 | ) | (577 | ) | ||||
|
|
|
|
|
|||||
| Net cash used in investing activities |
(626 | ) | (577 | ) | ||||
|
|
|
|
|
|||||
| Cash flows used in financing activities: |
||||||||
| Proceeds from stock option and warrant exercises |
1,130 | 416 | ||||||
| Payments of capital lease obligations |
(1,301 | ) | (1,358 | ) | ||||
|
|
|
|
|
|||||
| Net cash used in financing activities |
(171 | ) | (942 | ) | ||||
|
|
|
|
|
|||||
| Effect of exchange rate changes on cash |
(180 | ) | (61 | ) | ||||
|
|
|
|
|
|||||
| Net increase in cash and cash equivalents |
8,621 | 3,215 | ||||||
| Cash and cash equivalents, beginning of period |
21,785 | 28,753 | ||||||
|
|
|
|
|
|||||
| Cash and cash equivalents, end of period |
$ | 30,406 | $ | 31,968 | ||||
|
|
|
|
|
|||||
| Supplemental cash flow disclosures: |
||||||||
| Cash paid for interest |
$ | 119 | $ | 177 | ||||
| Cash paid for income taxes |
$ | 1,043 | $ | 1,149 | ||||
| Supplemental disclosure of non-cash investing and financing activities: |
||||||||
| Acquisition of equipment through capital leases |
$ | — | $ | 1,700 | ||||
The accompanying notes are an integral part of the consolidated financial statements
5
Table of Contents
Notes to Consolidated Financial Statements (Unaudited)
(Dollars in thousands except per share amounts)
1. Description of Business
Exa Corporation (the “Company” or “Exa”), a Delaware corporation, develops, sells and supports simulation software and services used primarily by vehicle manufacturers to enhance the performance of their products, reduce product development costs and improve the efficiency of their design and engineering processes. The Company’s solutions enable engineers and designers to augment or replace conventional methods of evaluating designs that rely on expensive and inefficient physical prototypes and test facilities with accurate digital simulations that are more useful, cost effective and timely. The Company’s simulation solutions enable customers to gain crucial insights about design performance early in the design cycle, reducing the likelihood of expensive redesigns and late-stage engineering changes, which result in cost savings and fundamental improvements in the development process. The Company is primarily focused on the ground transportation market, but is also exploring the application of its capabilities in the aerospace, oil and gas production, chemical processing, architecture, engineering and construction, power generation, biomedical and electronics industries.
Exa has offices and sells directly in the United States and through subsidiaries in France, Germany, Italy, Japan, Korea, China, and the United Kingdom. The Company also conducts business in Sweden, India, Brazil, Russia, Canada, Finland, Spain and Australia.
2. Summary of Significant Accounting Policies
Applicable Accounting Guidance
Any reference in these notes to applicable accounting guidance is meant to refer to the authoritative United States generally accepted accounting principles (“GAAP”) as found in the Financial Accounting Standards Board’s (“FASB”) Accounting Standards Codification (“ASC”).
Basis of Presentation
The accompanying unaudited consolidated financial statements have been prepared by the Company in accordance with GAAP for interim financial information and pursuant to the rules and regulations of the Securities and Exchange Commission regarding interim financial reporting. Accordingly, they do not include all of the information and footnotes required by GAAP for complete financial statements and should be read in conjunction with the audited consolidated financial statements and notes thereto included in the Company’s Annual Report on Form 10-K for the year ended January 31, 2015. These financial statements reflect all adjustments (consisting solely of normal, recurring adjustments) that are, in the opinion of management, necessary for a fair statement of results for the interim periods presented.
Use of Estimates
The preparation of financial statements in conformity with GAAP requires management to make significant estimates and assumptions that affect the reported amounts of assets and liabilities and disclosure of contingent assets and liabilities at the date of the financial statements and the reported amounts of revenues and expenses during the reporting periods. Changes in estimates are recorded in the period in which they become known. The Company bases its estimates on historical experience and various other assumptions that it believes to be reasonable under the circumstances. Actual results could differ from management’s estimates if future events differ substantially from past experience, or other assumptions, which reasonable when made, do not turn out to be substantially accurate.
6
Table of Contents
Recent Accounting Pronouncements
In May 2014, the FASB issued ASU 2014-09, Revenue from Contracts with Customers, which supersedes nearly all existing revenue recognition guidance under GAAP. The core principle of ASU 2014-09 is to recognize revenues when promised goods or services are transferred to customers in an amount that reflects the consideration to which an entity expects to be entitled for those goods or services. ASU 2014-09 defines a five-step process to achieve this core principle and, as a result of which, more judgment and estimates may be required within the revenue recognition process than are required under existing GAAP. The standard is effective for annual periods beginning after December 15, 2016, and interim periods therein. However, in July 2015, the FASB approved a one-year deferral that does not require adoption until calendar year 2018 (fiscal 2019 for the Company). The two permitted transition methods under the new standard are: (i) a full retrospective approach reflecting the application of the standard in each prior reporting period with the option to elect certain practical expedients, or (ii) a retrospective approach with the cumulative effect of initially adopting ASU 2014-09 recognized at the date of adoption (which includes additional footnote disclosures). The Company is currently evaluating the impact of its pending adoption of ASU 2014-09 on its consolidated financial statements and has not yet determined the method by which it will adopt the standard when it becomes effective.
In June 2014, the FASB issued ASU 2014-12, Stock Compensation, which is a standards update on accounting for share-based payments when the terms of the award provide that a performance target could be achieved after a requisite service period. The standard is effective for annual periods beginning after December 31, 2015, and interim periods therein, with early adoption permitted. This ASU is not expected to have an impact on the Company’s financial statements or disclosures.
In August 2014, the FASB issued ASU No. 2014-15, Presentation of Financial Statements – Going Concern (Subtopic 205-40): Disclosure of Uncertainties about an Entity’s Ability to Continue as a Going Concern. Under the new guidance, management will be required to assess an entity’s ability to continue as a going concern, and to provide related footnote disclosures in certain circumstances. The provisions of this ASU are effective for annual periods beginning after December 15, 2016, and for interim periods therein. This ASU is not expected to have an impact on the Company’s financial statements or disclosures.
In April 2015, the FASB issued ASU No. 2015-05, Intangibles – Goodwill and Other – Internal-Use Software: Customer’s Accounting for Fees Paid in a Cloud Computing Arrangement. The guidance clarifies the circumstances under which a cloud computing customer would account for the arrangement as a license of internal-use software. The standard will be effective for annual reporting periods beginning after December 15, 2016, and for interim periods therein. Early adoption is permitted. The Company does not believe the guidance will have a material impact on its consolidated financial statements.
3. Computation of Net Loss Per Share
Net loss per share has been computed using the weighted average number of shares of common stock outstanding during each period. Diluted amounts per share include the impact of the Company’s outstanding potential common shares, such as shares issuable upon exercise of in-the-money stock options or warrants, when dilutive. Potential common shares that are anti-dilutive are excluded from the calculation of diluted net loss per common share.
The following summarizes the calculation of basic and diluted net loss per share:
| Three Months Ended July 31, | Six Months Ended July 31, | |||||||||||||||
| 2015 | 2014 | 2015 | 2014 | |||||||||||||
| Numerator: |
||||||||||||||||
| Net loss |
$ | (1,195 | ) | $ | (1,009 | ) | $ | (3,083 | ) | $ | (18,229 | ) | ||||
|
|
|
|
|
|
|
|
|
|||||||||
| Denominator: |
||||||||||||||||
| Weighted average common shares, basic and diluted |
14,535,539 | 13,775,250 | 14,420,562 | 13,639,866 | ||||||||||||
|
|
|
|
|
|
|
|
|
|||||||||
| Basic and diluted net loss per share |
$ | (0.08 | ) | $ | (0.07 | ) | $ | (0.21 | ) | $ | (1.34 | ) | ||||
|
|
|
|
|
|
|
|
|
|||||||||
7
Table of Contents
All of the Company’s outstanding stock options and unvested restricted stock unit awards were excluded from the computation of diluted net loss per share for the three and six months ended July 31, 2015 and 2014 because including them would have had an anti-dilutive effect due to the net loss position of the Company. At July 31, 2015 and 2014, the Company had outstanding options, unvested restricted stock unit awards and warrants of 2,471,058 and 2,754,044, respectively.
4. Property and Equipment, net
Property and equipment, net consists of the following:
| July 31, 2015 |
January 31, 2015 |
|||||||
| Computer software and equipment |
$ | 20,910 | $ | 20,637 | ||||
| Office equipment and furniture |
426 | 422 | ||||||
| Leasehold improvements |
2,588 | 2,593 | ||||||
|
|
|
|
|
|||||
| Total property and equipment |
23,924 | 23,652 | ||||||
| Less: accumulated depreciation |
(17,716 | ) | (16,691 | ) | ||||
|
|
|
|
|
|||||
| Property and equipment, net |
$ | 6,208 | $ | 6,961 | ||||
|
|
|
|
|
|||||
For the three and six months ended July 31, 2015, depreciation expense was $690 and $1,353, respectively. For the three and six months ended July 31, 2014, depreciation expense was $643 and $1,219, respectively. Included in computer software and equipment and office equipment and furniture is equipment held pursuant to capital leases with costs of $18,047 and $18,409 and accumulated depreciation of $13,415 and $11,858 as of July 31, 2015 and 2014, respectively.
During the three and six months ended July 31, 2015, the Company disposed of $11 and $281, respectively, worth of fully-depreciated computer equipment. No gain or loss on the disposals of these assets was recognized.
5. Accrued Expenses
Accrued expenses consist of the following:
| July 31, 2015 |
January 31, 2015 |
|||||||
| Accrued payroll |
$ | 2,164 | $ | 1,695 | ||||
| Accrued commissions and bonuses |
1,406 | 3,150 | ||||||
| Sales and withholding taxes |
660 | 2,427 | ||||||
| Accrued income taxes payable |
436 | 597 | ||||||
| Legal and professional |
530 | 275 | ||||||
| Deferred rent, current portion |
37 | 597 | ||||||
| Other accrued expenses |
1,112 | 1,844 | ||||||
|
|
|
|
|
|||||
| Total accrued expenses |
$ | 6,345 | $ | 10,585 | ||||
|
|
|
|
|
|||||
8
Table of Contents
6. Deferred Rent
Payment escalations, rent holidays and lease incentives specified in the Company’s non-cancelable operating lease and hosting agreements are recognized on a straight-line basis over the terms of the agreements. The differences arising from straight-line expense recognition and cash payments are recorded as deferred rent in the accompanying consolidated balance sheets. Tenant leasehold improvement allowances received from landlords are recorded as leasehold improvements and deferred rent and are amortized as operating expense over the applicable lease terms. Deferred rent consists of the following:
| July 31, 2015 |
January 31, 2015 |
|||||||
| Leasehold improvement incentive |
$ | 196 | $ | 308 | ||||
| Non-cash rent expense |
712 | 761 | ||||||
|
|
|
|
|
|||||
| Total deferred rent |
908 | 1,069 | ||||||
| Less: current portion included in accrued expenses |
(37 | ) | (597 | ) | ||||
|
|
|
|
|
|||||
| Deferred rent, net of current portion |
$ | 871 | $ | 472 | ||||
|
|
|
|
|
|||||
7. Fair Value Measurements
Financial instruments consist primarily of cash and cash equivalents, accounts receivable and capital lease obligations. As of July 31, 2015 and January 31, 2015, the carrying amounts of these instruments approximate their fair values. The estimated fair values have been determined from information obtained from market sources and management estimates.
In determining the fair value of its financial assets and liabilities, the Company uses various valuation approaches. ASC 820, Fair Value Measurements and Disclosures, establishes a hierarchy of inputs used in measuring fair value that maximizes the use of observable inputs and minimizes the use of unobservable inputs by requiring that observable inputs be used when available. Observable inputs are inputs that market participants would use in pricing the asset or liability based on market data obtained from sources independent of the Company. Unobservable inputs are inputs that reflect the Company’s assumptions about the inputs that market participants would use in pricing the asset or liability, and are developed based on the best information available in the circumstances. The fair value hierarchy is broken down into three levels based on the source of inputs as follows:
Level 1 – Valuations based on unadjusted quoted prices in active markets for identical assets or liabilities that the Company has the ability to access.
Level 2 – Valuations based on quoted prices for similar assets or liabilities in active markets, quoted prices for identical or similar assets or liabilities in markets that are not active and models for which all significant inputs are observable, either directly or indirectly.
Level 3 – Valuations based on inputs that are unobservable and significant to the overall fair value measurement and that are based on management’s best estimate of inputs market participants would use for pricing the asset or liability at the measurement date, including assumptions about risk.
The following table summarizes the Company’s fair value hierarchy for its financial assets and liabilities measured at fair value as of July 31, 2015:
| Total | Level 1 | Level 2 | Level 3 | |||||||||||||
| Assets: |
||||||||||||||||
| Money market funds |
$ | 12,516 | $ | 12,516 | $ | — | $ | — | ||||||||
9
Table of Contents
The following table summarizes the Company’s fair value hierarchy for its financial assets and liabilities measured at fair value as of January 31, 2015:
| Total | Level 1 | Level 2 | Level 3 | |||||||||||||
| Assets: |
||||||||||||||||
| Money market funds |
$ | 12,514 | $ | 12,514 | $ | — | $ | — | ||||||||
The availability of observable inputs can vary among the various types of financial assets and liabilities. To the extent that the valuation is based on models or inputs that are less observable or unobservable in the market, the determination of fair value requires more judgment. In certain cases, the inputs used to measure fair value may fall into different levels of the fair value hierarchy. In such cases, for financial statement disclosure purposes, the level in the fair value hierarchy within which the fair value measurement is categorized is based on the lowest level input that is significant to the overall fair value measurement.
8. Acquired Intangible Assets
Intangible assets acquired in a business combination are recorded under the purchase method of accounting at their estimated fair values at the date of acquisition. The Company amortizes acquired intangible assets over their estimated useful lives.
The following table reflects the carrying value of intangible assets as of July 31, 2015:
| July 31, 2015 | ||||||||||||
| Cost | Accumulated Amortization |
Net Book Value |
||||||||||
| Intellectual property |
$ | 3,505 | $ | (1,285 | ) | $ | 2,220 | |||||
| Access to facilities contract |
38 | (38 | ) | — | ||||||||
|
|
|
|
|
|
|
|||||||
| Total |
$ | 3,543 | $ | (1,323 | ) | $ | 2,220 | |||||
|
|
|
|
|
|
|
|||||||
The following table reflects the carrying value of intangible assets as of January 31, 2015:
| January 31, 2015 | ||||||||||||
| Cost | Accumulated Amortization |
Net Book Value |
||||||||||
| Intellectual property |
$ | 3,505 | $ | (1,110 | ) | $ | 2,395 | |||||
| Access to facilities contract |
38 | (38 | ) | — | ||||||||
|
|
|
|
|
|
|
|||||||
| Total |
$ | 3,543 | $ | (1,148 | ) | $ | 2,395 | |||||
|
|
|
|
|
|
|
|||||||
For the three and six months ended July 31, 2015, amortization expense of intangible assets was $87 and $175, respectively. For the three and six months ended July 31, 2014, amortization expense of intangible assets was $88 and $175, respectively.
9. Commitments and Contingencies
Legal Contingencies
From time to time the Company is involved in legal proceedings arising in the ordinary course of business. There is no litigation pending that could, individually or in the aggregate, be reasonably expected to have a material adverse effect on the Company’s financial position, results of operations, or cash flows.
10
Table of Contents
Guarantees and Indemnification Obligations
The Company enters into standard indemnification agreements in the ordinary course of business. Pursuant to these agreements, the Company indemnifies, holds harmless, and agrees to reimburse the indemnified party for losses suffered or incurred by the indemnified party, generally the Company’s business partners or customers, in connection with any United States patent, or any copyright or other intellectual property infringement claim by any third party with respect to the Company’s products. The term of these indemnification provisions is generally perpetual after execution of the agreement. The maximum potential amount of future payments the Company could be required to make under these agreements is unlimited.
Based on historical experience and information known as of July 31, 2015 and January 31, 2015, the Company has not recorded any liabilities for the above guarantees and indemnities.
Operating Leases
Effective July 1, 2015, the Company amended the lease for its corporate headquarters space in Burlington, Massachusetts. Originally set to expire in March 2016, the amendment extends the lease term through March 2023 and reduces the leased space from 65,941 square feet to 44,241 square feet. The 21,700 square foot reduction primarily relates to first floor space that had been subleased by the Company to a subtenant, and under the terms of the amendment, the landlord assumed the sublease effective July 1, 2015. The amendment also provides for a tenant improvement allowance of up to $1,681 to cover renovations that will be made to the retained second floor space over the remainder of fiscal year 2016. Management believes that the renovated space will be suitable and adequate to meet the Company’s planned growth needs at its headquarters over the next several years.
In conjunction with the relinquishment of the first floor space, the amendment reduces the Company’s required security deposit letter of credit from $525 to $352, and accordingly, management plans to reduce the restricted cash account securing the letter of credit to $352 in the third quarter of fiscal 2016. As of July 31, 2015, restricted cash of $352 is included in other long-term assets and $173 is included in other current assets in the accompanying consolidated balance sheet.
As of July 31, 2015, future minimum lease payments under the amended headquarters lease are as follows:
| Fiscal year ended January 31, | ||||
| 2016 (remainder as of July 31, 2015) |
$ | 780 | ||
| 2017 |
1,541 | |||
| 2018 |
1,574 | |||
| 2019 |
1,618 | |||
| 2020 |
1,663 | |||
| 2021 |
1,707 | |||
| Thereafter |
3,847 | |||
|
|
|
|||
| $ | 12,730 | |||
|
|
|
|||
Purchase Obligations
In July 2015, the Company entered into a commitment to lease $4,351 of computer processor equipment for its high performance computing data center in New Jersey. This capital investment will significantly expand the Company’s computing capacity to address current and anticipated demand. It is also expected to improve project simulation cycle times. The equipment, which is expected to be delivered by September 2015, will be financed over three years under an arrangement with IBM that will qualify for capital lease accounting treatment.
11
Table of Contents
10. Stockholders’ Equity and Stock-Based Compensation
Warrants Exercised
On July 29, 2015, Massachusetts Capital Resource Company exercised warrants to purchase 21,538 shares of common stock at a cash exercise price of $6.11 per share. The Company has no remaining outstanding warrants as of July 31, 2015.
Stock-Based Compensation Expense
The fair value of common stock service-based options for employees and directors is estimated on the date of grant using the Black-Scholes option-pricing model with the following weighted average assumptions used:
| Six Months Ended July 31, |
||||||||
| 2015 | 2014 | |||||||
| Estimated dividend yield |
0 | % | 0 | % | ||||
| Expected stock price volatility |
38.1 | % | 47.7 | % | ||||
| Weighted-average risk-free interest rate |
2.0 | % | 2.2 | % | ||||
| Expected life of options (in years) |
6.25 | 6.25 | ||||||
The weighted average grant date fair value per share for service-based stock options granted in the three and six months ended July 31, 2015 was $4.53 and $4.44, respectively. The weighted average grant date fair value per share for service-based stock options granted in the three and six months ended July 31, 2014 was $4.32 and $5.54, respectively.
For standard service-based stock options, the Company records stock-based compensation expense over the estimated service/vesting period. The amount of stock-based compensation expense recognized during a period is based on the value of the portion of the awards that are ultimately expected to vest.
Performance-based stock options are recognized as expense over the requisite service period when it becomes probable that performance measures triggering vesting will be met. Certain grants vested during the first quarter of fiscal year 2016 based on achieved performance metrics. As of July 31, 2015, the Company has concluded that it is not probable that the remaining unvested options will achieve the required metrics for vesting. As a result, the Company has not recognized any additional share-based compensation expense associated with the unvested portion of these performance-based options.
Total stock-based compensation expense related to stock options and restricted stock units issued by the Company is as follows:
| Three Months Ended July 31, |
Six Months Ended July 31, |
|||||||||||||||
| 2015 | 2014 | 2015 | 2014 | |||||||||||||
| Cost of revenues |
$ | 53 | $ | 44 | $ | 122 | $ | 82 | ||||||||
| Sales and marketing |
85 | 86 | 200 | 161 | ||||||||||||
| Research and development |
185 | 191 | 426 | 347 | ||||||||||||
| General and administrative |
168 | 179 | 357 | 280 | ||||||||||||
|
|
|
|
|
|
|
|
|
|||||||||
| Total |
$ | 491 | $ | 500 | $ | 1,105 | $ | 870 | ||||||||
|
|
|
|
|
|
|
|
|
|||||||||
The total unrecognized compensation cost related to outstanding service-based stock options is $3,057 at July 31, 2015. This amount is expected to be recognized over a weighted-average period of 2.47 years.
12
Table of Contents
11. Income Taxes
For the three and six months ended July 31, 2015, the Company’s income tax provision was $154 and $128, respectively. The provision for both periods primarily consists of the tax effects of foreign operating results and foreign withholding taxes. For the three and six months ended July 31, 2014, the income tax provision was $176 and $15,656, respectively. The provision for the six months ended July 31, 2014 includes a $14,506 non-cash charge to record a valuation allowance against the Company’s United States net deferred tax assets and a $700 non-cash write-off of state deferred tax assets.
In determining the realizability of the net United States federal and state deferred tax assets, the Company considers numerous factors including historical profitability, estimated future taxable income, prudent and feasible tax planning strategies and the industry in which it operates. Management reassesses the realization of the deferred tax assets each reporting period, which resulted in a full valuation allowance against the Company’s United States deferred tax assets in the first quarter of fiscal year 2015. To the extent that the financial results of the United States operations improve in the future and the deferred tax assets become realizable, the Company will reduce the valuation allowance through earnings.
The Company does not expect that its unrecognized tax benefit will change significantly within the next twelve months. The Company and one or more of its subsidiaries file United States federal income tax returns and tax returns in various state and foreign jurisdictions. With limited exceptions, the Company is no longer subject to federal, state, local or foreign examinations for years prior to January 31, 2011. However, carryforward attributes that were generated in tax years ending prior to January 31, 2012 may still be adjusted upon examination by state or local tax authorities if they either have been or will be used in a future period.
Under Section 382 of the Internal Revenue Code of 1986, as amended, substantial changes in the Company’s ownership may limit the amount of net operating loss carryforwards that could be utilized annually in the future to offset its taxable income. Specifically, this limitation may arise in the event of a cumulative change in ownership of the Company of more than 50% within a three-year period. During the first quarter of fiscal year 2015, management determined that the Company had experienced an ownership change for purposes of Section 382. This ownership change resulted in annual limitations to the amount of net operating loss carryforwards that can be utilized to offset future taxable income, if any, at the federal level. The Company’s management has determined that, as of July 31, 2015, it had not experienced another ownership change for purposes of Section 382. However, future transactions in the Company’s common stock could trigger an ownership change for purposes of Section 382, which could limit the amount of net operating loss carryforwards that could be utilized annually in the future to offset the Company’s taxable income, if any. Any such limitation, whether as the result of sales of common stock by the Company’s existing stockholders or sales of common stock by the Company, could have a material adverse effect on the Company’s results of operations in future years.
13
Table of Contents
12. Geographic Information
Revenue is attributed to individual countries based upon location of the external customer. Revenue by geographic area is as follows:
| Three Months Ended July 31, |
Six Months Ended July 31, |
|||||||||||||||
| 2015 | 2014 | 2015 | 2014 | |||||||||||||
| United States |
$ | 4,298 | $ | 3,412 | $ | 8,141 | $ | 6,285 | ||||||||
| Japan |
2,138 | 2,147 | 4,479 | 4,518 | ||||||||||||
| Germany |
2,461 | 2,838 | 4,650 | 5,529 | ||||||||||||
| United Kingdom |
1,842 | 1,266 | 3,703 | 2,388 | ||||||||||||
| France |
1,841 | 2,252 | 3,620 | 4,236 | ||||||||||||
| Korea |
1,412 | 1,419 | 2,705 | 2,655 | ||||||||||||
| Sweden |
482 | 651 | 957 | 1,345 | ||||||||||||
| Other |
981 | 858 | 1,968 | 1,657 | ||||||||||||
|
|
|
|
|
|
|
|
|
|||||||||
| Total |
$ | 15,455 | $ | 14,843 | $ | 30,223 | $ | 28,613 | ||||||||
|
|
|
|
|
|
|
|
|
|||||||||
Net long-lived assets, consisting of net property and equipment, are subject to geographic risks because they are generally difficult to move and to effectively utilize in another geographic area in a reasonable time period and because they are relatively illiquid. Net long-lived assets by principal geographic areas were as follows:
| July 31, 2015 |
January 31, 2015 |
|||||||
| United States |
$ | 5,477 | $ | 6,080 | ||||
| France |
474 | 590 | ||||||
| Germany |
129 | 132 | ||||||
| Japan |
56 | 91 | ||||||
| Other |
72 | 68 | ||||||
|
|
|
|
|
|||||
| Total property and equipment, net |
$ | 6,208 | $ | 6,961 | ||||
|
|
|
|
|
|||||
14
Table of Contents
| ITEM 2. | MANAGEMENT’S DISCUSSION AND ANALYSIS OF FINANCIAL CONDITION AND RESULTS OF OPERATIONS |
The following discussion and analysis of our financial condition and results of operations should be read in conjunction with our financial statements and related notes and Management’s Discussion and Analysis of Financial Condition and Result of Operations appearing in our Annual Report on Form 10-K, filed with the SEC on March 24, 2015. In addition to historical financial information, the following discussion contains forward-looking statements that reflect our plans, estimates, assumptions and beliefs. Our actual results could differ materially from those discussed in the forward-looking statements. Factors that could cause or contribute to these differences include those discussed below and elsewhere in this report. Forward-looking statements include information concerning our possible or assumed future results of operations, business strategies and operations, financing plans, potential growth opportunities, potential market opportunities and the effects of competition. Forward-looking statements include all statements that are not historical facts and can be identified by terms such as “anticipates,” “believes,” “could,” “seeks,” “estimates,” “expects,” “intends,” “may,” “plans,” “potential,” “predicts,” “projects,” “should,” “will,” “would” or similar expressions and the negatives of those terms. Given these uncertainties, you should not place undue reliance on these forward-looking statements. Also, forward-looking statements represent our management’s plans, estimates, assumptions and beliefs only as of the date of this report. Except as required by law, we assume no obligation to update these forward-looking statements publicly or to update the reasons actual results could differ materially from those anticipated in these forward-looking statements, even if new information becomes available in the future.
As used herein, except as otherwise indicated by context, references to “we,” “us,” “our,” or the “Company” refer to Exa Corporation.
Overview
We develop, sell and support simulation software and services that manufacturers use to enhance the performance of their products, reduce product development costs and improve the efficiency of their design and engineering processes. Our solutions enable engineers and designers to augment or replace conventional methods of evaluating design alternatives that rely on expensive and inefficient physical prototypes and test facilities, such as wind tunnels used in vehicle design, with accurate digital simulations that are more useful and timely. Our simulation solutions enable our customers to gain crucial insights about design performance early in the design cycle, reducing the likelihood of expensive redesigns and late-stage engineering changes. As a result, our customers realize significant cost savings and fundamental improvements in their vehicle development process.
We currently focus primarily on the ground transportation market, including manufacturers in the passenger vehicle, highway truck, off-highway vehicle and train markets, as well as their suppliers. Over 125 manufacturers currently utilize our products and services, including 14 of the global top 15 passenger vehicle manufacturer groups. We are also beginning to explore other markets in which we believe the capabilities of our solutions have broad application, such as the aerospace, oil and gas production, chemical processing, architecture, engineering and construction, power generation, biomedical and electronics industries.
One of the most critical challenges for our customers in their vehicle development processes is measuring or predicting how a vehicle feature or a mechanical system will interact with air, water or other fluids. For example, developing vehicles with reduced aerodynamic drag is critical to achieving the improvements in fuel efficiency that are increasingly desired by customers and mandated by government regulations. Our core product, PowerFLOW, is an innovative software solution for simulating complex fluid flow problems, including aerodynamics, thermal management, and aeroacoustics, or wind noise. PowerFLOW relies upon proprietary technology that enables it to predict complex fluid flows with a level of reliability comparable to or better than physical testing. The combination of PowerFLOW’s accuracy and timeliness provides results that are superior to those of alternative computational fluid dynamics, or CFD, methods.
We derive our revenue primarily from the sale of our simulation software, using an annual capacity-based licensing model. Our customers usually purchase PowerFLOW simulation capacity under one-year licenses, with
15
Table of Contents
a minority utilizing multi-year arrangements. Simulation capacity may be purchased as software-only, to be run on the customer’s own computer hardware, or provided in the form of software-as-a-service, via our hosted ExaCLOUD or PowerFLOW OnDemand offerings. To introduce new customers to our simulation solutions, we typically perform fixed-price projects that include simulation services accessed via our hosted facilities, along with engineering and consulting services. Customers typically license our products for one application, such as aerodynamics, and over time expand to other applications such as thermal management or aeroacoustics. In our customer engagement model, our applications management teams engage with our customers in long-term relationships focused on identifying problems that we can help them solve, demonstrating the value of our solutions and ensuring that the customer achieves maximum benefit from them. In this process we interact continuously with our customers to improve our software and services and add new solutions, and at the same time deepen our knowledge of their industry.
During the six months ended July 31, 2015, revenue growth was driven by continued deployment of our simulation solutions in the installed base as well as by the addition of new customers. Investments made in field resources over the past two fiscal years are yielding growth in both project and license revenue. The strengthening U.S. dollar, particularly against the Euro and yen, had a material negative impact on revenue performance as compared to the same period last year. The geographic mix of revenue outside of the Americas is consistent with historical trends but does reflect the impact of the weaker Euro and yen. During the six months ended July 31, 2015, 72% of our revenue came from outside of the Americas as compared to 78% for the same period last year. Revenue for the six months ended July 31, 2015 was $30.2 million, with growth of 5.6% over the same period a year ago and 16.8% when measured on a constant currency basis. See “— Non-GAAP Measures” below for information about how we calculate and use revenue on a constant currency basis.
As a percent of revenue, our total operating expenses for the six months ended July 31, 2015 were relatively flat when compared to the same period last year, with only a 0.2% decrease. This reflects our previous investment in resources to drive top line growth, including sales, marketing and research and development. While the majority of our expense base is in the United States, we have field resources based in our international offices which provide some natural foreign exchange hedge. As a result, the strengthening dollar had a positive impact on total operating expenses when compared to the same period last year. For the six months ended July 31, 2015, total operating expenses were $32.8 million, with growth of 5.4% over the same period a year ago and 11.7% when measured on a constant currency basis. See “— Non-GAAP Measures” below for information about how we calculate and use operating expenses on a constant currency basis.
As a percent of revenue, our loss from operations for the six months ended July 31, 2015 was 0.2% lower than the same period last year, primarily as a result of the foreign currency impacts described above. Adjusted EBITDA for the six months ended July 31, 2015, as described in the Non-GAAP Measures section below, was slightly improved at break-even when compared to negative $0.3 million in the same period last year.
We ended the quarter with cash and cash equivalents of $30.4 million compared to $21.8 million as of January 31, 2015. This reflects strong accounts receivable collections activity and normal seasonal cash flows. Capital expenditures were consistent with historical trends.
16
Table of Contents
Results of Operations for the Three Months Ended July 31, 2015 and 2014
The following tables set forth, for the periods presented, data from our consolidated statements of operation, as well as that data as a percentage of revenues.
| Three Months Ended July 31, | ||||||||
| (in thousands) | 2015 | 2014 | ||||||
| Revenue: |
||||||||
| License revenue |
$ | 12,977 | $ | 12,316 | ||||
| Project revenue |
2,478 | 2,527 | ||||||
|
|
|
|
|
|||||
| Total revenues |
15,455 | 14,843 | ||||||
|
|
|
|
|
|||||
| Operating expenses: (1) |
||||||||
| Cost of revenue |
4,755 | 4,632 | ||||||
| Sales and marketing |
2,440 | 2,509 | ||||||
| Research and development |
5,952 | 5,404 | ||||||
| General and administrative (2) |
3,126 | 3,217 | ||||||
|
|
|
|
|
|||||
| Total operating expenses |
16,273 | 15,762 | ||||||
|
|
|
|
|
|||||
| Loss from operations |
(818 | ) | (919 | ) | ||||
|
|
|
|
|
|||||
| Other (expense) income, net: |
||||||||
| Foreign exchange (loss) gain |
(171 | ) | 175 | |||||
| Interest expense |
(54 | ) | (94 | ) | ||||
| Interest income |
2 | 2 | ||||||
| Other income, net |
— | 3 | ||||||
|
|
|
|
|
|||||
| Total other (expense) income, net |
(223 | ) | 86 | |||||
|
|
|
|
|
|||||
| Loss before income taxes |
(1,041 | ) | (833 | ) | ||||
| Provision for income taxes |
(154 | ) | (176 | ) | ||||
|
|
|
|
|
|||||
| Net loss |
$ | (1,195 | ) | $ | (1,009 | ) | ||
|
|
|
|
|
|||||
| (1) | Amounts include stock-based compensation expense as follows: |
| Three Months Ended July 31, | ||||||||
| (in thousands) | 2015 | 2014 | ||||||
| Cost of revenues |
$ | 53 | $ | 44 | ||||
| Sales and marketing |
85 | 86 | ||||||
| Research and development |
185 | 191 | ||||||
| General and administrative |
168 | 179 | ||||||
|
|
|
|
|
|||||
| Total stock-based compensation expense |
$ | 491 | $ | 500 | ||||
|
|
|
|
|
|||||
| (2) | Includes amortization expense related to intangible assets as follows: |
| (in thousands) | ||||||||
| General and administrative |
87 | 88 | ||||||
17
Table of Contents
| Three Months Ended July 31, |
||||||||
| (as a percent of total revenue) | 2015 | 2014 | ||||||
| Revenue: |
||||||||
| License revenue |
84.0 | % | 83.0 | % | ||||
| Project revenue |
16.0 | % | 17.0 | % | ||||
|
|
|
|
|
|||||
| Total revenues |
100.0 | % | 100.0 | % | ||||
|
|
|
|
|
|||||
| Operating expenses: |
||||||||
| Cost of revenue |
30.8 | % | 31.2 | % | ||||
| Sales and marketing |
15.8 | % | 16.9 | % | ||||
| Research and development |
38.5 | % | 36.4 | % | ||||
| General and administrative |
20.2 | % | 21.7 | % | ||||
|
|
|
|
|
|||||
| Total operating expenses |
105.3 | % | 106.2 | % | ||||
|
|
|
|
|
|||||
| Loss from operations |
(5.3 | )% | (6.2 | )% | ||||
|
|
|
|
|
|||||
| Other (expense) income, net: |
||||||||
| Foreign exchange (loss) gain |
(1.1 | )% | 1.2 | % | ||||
| Interest expense |
(0.3 | )% | (0.6 | )% | ||||
| Interest income |
0.0 | % | 0.0 | % | ||||
| Other income, net |
0.0 | % | 0.0 | % | ||||
|
|
|
|
|
|||||
| Total other (expense) income, net |
(1.4 | )% | 0.6 | % | ||||
|
|
|
|
|
|||||
| Loss before income taxes |
(6.7 | )% | (5.6 | )% | ||||
| Provision for income taxes |
(1.0 | )% | (1.2 | )% | ||||
|
|
|
|
|
|||||
| Net loss |
(7.7 | )% | (6.8 | )% | ||||
|
|
|
|
|
|||||
Due to rounding, totals may not equal the sum of line items in the table above.
Comparison of Three Months Ended July 31, 2015 and 2014
Revenue
| Three Months Ended July 31, |
||||||||||||||||
| (in thousands, except percentages) | 2015 | 2014 | Increase | % Change | ||||||||||||
| License revenue |
$ | 12,977 | $ | 12,316 | $ | 661 | 5.4 | % | ||||||||
| Project revenue |
2,478 | 2,527 | (49 | ) | (1.9 | )% | ||||||||||
|
|
|
|
|
|
|
|||||||||||
| Total revenues |
$ | 15,455 | $ | 14,843 | $ | 612 | 4.1 | % | ||||||||
|
|
|
|
|
|
|
|||||||||||
License revenue increased 5.4% from $12.3 million for the three months ended July 31, 2014 to $13.0 million for the three months ended July 31, 2015. The $0.7 million increase was driven by new license customers and by increased utilization of simulation capacity by existing customers. Project revenue for the three months ended July 31, 2015 remained relatively flat at $2.5 million when compared to the same period in the prior year.
Foreign exchange fluctuations, particularly the weakening of the Euro and the Japanese yen, negatively impacted total revenue in the three months ended July 31, 2015 by $1.7 million as compared to the three months ended July 31, 2014. On a constant currency basis, our total revenues in the three months ended July 31, 2015 increased 15.3% compared with the three months ended July 31, 2014.
18
Table of Contents
Cost of revenues
| Three Months Ended July 31, |
||||||||||||||||
| (in thousands, except percentages) | 2015 | 2014 | Increase | % Change | ||||||||||||
| Cost of revenues |
$ | 4,755 | $ | 4,632 | $ | 123 | 2.7 | % | ||||||||
Cost of revenues for the three months ended July 31, 2015 was $4.8 million, an increase of $0.1 million, or 2.7%, compared with $4.6 million during the three months ended July 31, 2014. As a percentage of revenues, cost of revenues decreased to 30.8% for the three months ended July 31, 2015 compared to 31.2% for the three months ended July 31, 2014. Approximately $0.2 million of increased royalty costs associated with higher customer license levels and expanded use of certain embedded sublicensed product were partially offset by reductions in miscellaneous expenses and other personnel-related costs.
Sales and marketing
| Three Months Ended July 31, |
||||||||||||||||
| (in thousands, except percentages) | 2015 | 2014 | Decrease | % Change | ||||||||||||
| Sales and marketing |
$ | 2,440 | $ | 2,509 | $ | (69 | ) | (2.8 | )% | |||||||
Sales and marketing expenses for the three months ended July 31, 2015 were $2.4 million and remained relatively flat compared with the same period a year ago. As a percentage of revenues, sales and marketing expenses decreased to 15.8% for the three months ended July 31, 2015 compared to 16.9% for the three months ended July 31, 2014. Decreases in miscellaneous expenses and other personnel-related costs were partially offset by increases in costs associated with marketing programs and initiatives.
Research and development
| Three Months Ended July 31, |
||||||||||||||||
| (in thousands, except percentages) | 2015 | 2014 | Increase | % Change | ||||||||||||
| Research and development |
$ | 5,952 | $ | 5,404 | $ | 548 | 10.1 | % | ||||||||
Research and development expenses for the three months ended July 31, 2015 were $6.0 million, an increase of $0.5 million, or 10.1%, compared to $5.4 million for the three months ended July 31, 2014. As a percentage of revenues, research and development expense increased to 38.5% for the three months ended July 31, 2015 compared to 36.4% for the three months ended July 31, 2014. Increased payroll and employee-related costs accounted for essentially all of the $0.5 million increase, primarily as a result of the net addition of 15 new scientists and software engineers since the prior year period and merit-based compensation increases for existing personnel.
General and administrative
| Three Months Ended July 31, |
||||||||||||||||
| (in thousands, except percentages) | 2015 | 2014 | Decrease | % Change | ||||||||||||
| General and administrative |
$ | 3,126 | $ | 3,217 | $ | (91 | ) | (2.8 | )% | |||||||
General and administrative expenses for the three months ended July 31, 2015 were $3.1 million, a decrease of $0.1 million, or 2.8%, compared to $3.2 million for the three months ended July 31, 2014. As a percentage of revenues, general and administrative expenses decreased to 20.2% for the three months ended July 31, 2015 compared to 21.7% for the three months ended July 31, 2014. The decrease is primarily attributable to lower professional service fees, including legal and accounting fees, of approximately $0.1 million.
19
Table of Contents
Other (expense) income, net
| Three Months Ended July 31, |
||||||||||||||||
| (in thousands, except percentages) | 2015 | 2014 | Change | % Change | ||||||||||||
| Other (expense) income, net |
$ | (223 | ) | $ | 86 | $ | (309 | ) | (359.3 | )% | ||||||
Other expense, net for the three months ended July 31, 2015 was $0.2 million, compared to other income, net of $0.1 million for the three months ended July 31, 2014. Other (expense) income, net consists primarily of foreign exchange gains and losses and interest expense associated with our capital lease obligations. The period-over-period change in other (expense) income, net is primarily attributed to foreign exchange fluctuations in the Euro and Japanese yen.
Provision for income taxes
| Three Months Ended July 31, |
||||||||||||||||
| (in thousands, except percentages) | 2015 | 2014 | Decrease | % Change | ||||||||||||
| Provision for income taxes |
$ | 154 | $ | 176 | $ | (22 | ) | (12.5 | )% | |||||||
For the three months ended July 31, 2015 and 2014, our income tax provision remained relatively flat at $0.2 million. The provision for both periods primarily consists of the tax effects of foreign operating results and foreign withholding taxes.
In determining the realizability of the net United States federal and state deferred tax assets, we consider numerous factors including historical profitability, estimated future taxable income, prudent and feasible tax planning strategies and the industry in which it operates. Management reassesses the realization of the deferred tax assets each reporting period, which resulted in a full valuation allowance against our United States deferred tax assets in the first quarter of fiscal year 2015. To the extent that the financial results of the United States operations improve in the future and the deferred tax assets become realizable, we will reduce the valuation allowance through earnings.
We do not expect that our unrecognized tax benefit will change significantly within the next twelve months. We and one or more of our subsidiaries file United States federal income tax returns and tax returns in various state and foreign jurisdictions. With limited exceptions, we are no longer subject to federal, state, local or foreign examinations for years prior to January 31, 2011. However, carryforward attributes that were generated in tax years ending prior to January 31, 2012 may still be adjusted upon examination by state or local tax authorities if they either have been or will be used in a future period.
Under Section 382 of the Internal Revenue Code of 1986, as amended, substantial changes in our ownership may limit the amount of net operating loss carryforwards that could be utilized annually in the future to offset its taxable income. Specifically, this limitation may arise in the event we undergo a cumulative change in ownership of more than 50% within a three-year period. During the first quarter of fiscal year 2015, our management determined that the Company had experienced an ownership change for purposes of Section 382. This ownership change resulted in annual limitations to the amount of net operating loss carryforwards that can be utilized to offset future taxable income, if any, at the federal level. Our management has determined that, as of April 30, 2015, we have not experienced another ownership change for purposes of Section 382. However, future transactions in our common stock could trigger an ownership change for purposes of Section 382, which could limit the amount of net operating loss carryforwards that could be utilized annually in the future to offset our taxable income, if any. Any such limitation, whether as the result of sales of common stock by our existing stockholders or sales of common stock by us, could have a material adverse effect on our results of operations in future years.
20
Table of Contents
Results of Operations for the Six Months Ended July 31, 2015 and 2014
| Six Months Ended July 31, | ||||||||
| (in thousands) | 2015 | 2014 | ||||||
| Revenue: |
||||||||
| License revenue |
$ | 25,219 | $ | 23,976 | ||||
| Project revenue |
5,004 | 4,637 | ||||||
|
|
|
|
|
|||||
| Total revenues |
30,223 | 28,613 | ||||||
|
|
|
|
|
|||||
| Operating expenses: (1) |
||||||||
| Cost of revenue |
9,398 | 9,228 | ||||||
| Sales and marketing |
4,928 | 5,076 | ||||||
| Research and development |
12,122 | 10,506 | ||||||
| General and administrative (2) |
6,393 | 6,339 | ||||||
|
|
|
|
|
|||||
| Total operating expenses |
32,841 | 31,149 | ||||||
|
|
|
|
|
|||||
| Loss from operations |
(2,618 | ) | (2,536 | ) | ||||
|
|
|
|
|
|||||
| Other (expense) income, net: |
||||||||
| Foreign exchange (loss) gain |
(223 | ) | 131 | |||||
| Interest expense |
(119 | ) | (177 | ) | ||||
| Interest income |
5 | 6 | ||||||
| Other income, net |
— | 3 | ||||||
|
|
|
|
|
|||||
| Total other (expense) income, net |
(337 | ) | (37 | ) | ||||
|
|
|
|
|
|||||
| Loss before income taxes |
(2,955 | ) | (2,573 | ) | ||||
| Provision for income taxes |
(128 | ) | (15,656 | ) | ||||
|
|
|
|
|
|||||
| Net loss |
$ | (3,083 | ) | $ | (18,229 | ) | ||
|
|
|
|
|
|||||
| (1) | Amounts include stock-based compensation expense as follows: |
| Six Months Ended July 31, | ||||||||
| (in thousands) | 2015 | 2014 | ||||||
| Cost of revenues |
$ | 122 | $ | 82 | ||||
| Sales and marketing |
200 | 161 | ||||||
| Research and development |
426 | 347 | ||||||
| General and administrative |
357 | 280 | ||||||
|
|
|
|
|
|||||
| Total stock-based compensation expense |
$ | 1,105 | $ | 870 | ||||
|
|
|
|
|
|||||
| (2) | Includes amortization expense related to intangible assets as follows: |
| (in thousands) | ||||||||
| General and administrative |
175 | 175 | ||||||
21
Table of Contents
| Six Months Ended July 31, |
||||||||
| (as a percent of total revenue) | 2015 | 2014 | ||||||
| Revenue: |
||||||||
| License revenue |
83.4 | % | 83.8 | % | ||||
| Project revenue |
16.6 | % | 16.2 | % | ||||
|
|
|
|
|
|||||
| Total revenues |
100.0 | % | 100.0 | % | ||||
|
|
|
|
|
|||||
| Operating expenses: |
||||||||
| Cost of revenue |
31.1 | % | 32.3 | % | ||||
| Sales and marketing |
16.3 | % | 17.7 | % | ||||
| Research and development |
40.1 | % | 36.7 | % | ||||
| General and administrative |
21.2 | % | 22.2 | % | ||||
|
|
|
|
|
|||||
| Total operating expenses |
108.7 | % | 108.9 | % | ||||
|
|
|
|
|
|||||
| Loss from operations |
(8.7 | )% | (8.9 | )% | ||||
|
|
|
|
|
|||||
| Other (expense) income, net: |
||||||||
| Foreign exchange (loss) gain |
(0.7 | )% | 0.5 | % | ||||
| Interest expense |
(0.4 | )% | (0.6 | )% | ||||
| Interest income |
0.0 | % | 0.0 | % | ||||
| Other income, net |
0.0 | % | 0.0 | % | ||||
|
|
|
|
|
|||||
| Total other (expense) income, net |
(1.1 | )% | (0.1 | )% | ||||
|
|
|
|
|
|||||
| Loss before income taxes |
(9.8 | )% | (9.0 | )% | ||||
| Provision for income taxes |
(0.4 | )% | (54.7 | )% | ||||
|
|
|
|
|
|||||
| Net loss |
(10.2 | )% | (63.7 | )% | ||||
|
|
|
|
|
|||||
Due to rounding, totals may not equal the sum of line items in the table above.
Comparison of Six Months Ended July 31, 2015 and 2014
Revenue
| Six Months Ended July 31, |
||||||||||||||||
| (in thousands, except percentages) | 2015 | 2014 | Increase | % Change | ||||||||||||
| License revenue |
$ | 25,219 | $ | 23,976 | $ | 1,243 | 5.2 | % | ||||||||
| Project revenue |
5,004 | 4,637 | 367 | 7.9 | % | |||||||||||
|
|
|
|
|
|
|
|||||||||||
| Total revenues |
$ | 30,223 | $ | 28,613 | $ | 1,610 | 5.6 | % | ||||||||
|
|
|
|
|
|
|
|||||||||||
License revenue increased 5.2% from $24.0 million for the six months ended July 31, 2014 to $25.2 million for the six months ended July 31, 2015. The $1.2 million increase was driven by new license customers and by increased utilization of simulation capacity by existing customers. Project revenue increased by $0.4 million during the six months ended July 31, 2015 compared to the six months ended July 31, 2014 due to expanded sales and engineering efforts with new and existing customers.
Foreign exchange fluctuations, particularly the weakening of the Euro and the Japanese yen, negatively impacted total revenue in the six months ended July 31, 2015 by $3.2 million as compared to the six months ended July 31, 2014. On a constant currency basis, our total revenues in the six months ended July 31, 2015 increased 16.8% compared with the six months ended July 31, 2014.
22
Table of Contents
Cost of revenues
| Six Months Ended July 31, |
||||||||||||||||
| (in thousands, except percentages) | 2015 | 2014 | Increase | % Change | ||||||||||||
| Cost of revenues |
$ | 9,398 | $ | 9,228 | $ | 170 | 1.8 | % | ||||||||
Cost of revenues for the six months ended July 31, 2015 was $9.4 million, an increase of $0.2 million, or 1.8%, compared with $9.2 million during the six months ended July 31, 2014. As a percentage of revenues, cost of revenues decreased to 31.1% for the six months ended July 31, 2015 compared to 32.3% for the six months ended July 31, 2014. Approximately $0.4 million of increased royalty costs associated with higher customer license levels and expanded use of certain embedded sublicensed product were partially offset by reduced miscellaneous expenses of approximately $0.1 million and lower recruiting fees of $0.1 million in the current period.
Sales and marketing
| Six Months Ended July 31, |
||||||||||||||||
| (in thousands, except percentages) | 2015 | 2014 | Decrease | % Change | ||||||||||||
| Sales and marketing |
$ | 4,928 | $ | 5,076 | $ | (148 | ) | (2.9 | )% | |||||||
Sales and marketing expenses for the six months ended July 31, 2015 were $4.9 million, a decrease of $0.1 million, or 2.9%, compared to $5.1 million for the six months ended July 31, 2014. As a percentage of revenues, sales and marketing expenses decreased to 16.3% for the six months ended July 31, 2015 compared to 17.7% for the six months ended July 31, 2014. Approximately $0.4 million of the decrease can be attributed to lower payroll and employee-related costs, including reduced commission expense related to the timing of customer orders and lower travel expenses. These decreases were partially offset by approximately $0.3 million of increased costs related to marketing programs and initiatives.
Research and development
| Six Months Ended July 31, |
||||||||||||||||
| (in thousands, except percentages) | 2015 | 2014 | Increase | % Change | ||||||||||||
| Research and development |
$ | 12,122 | $ | 10,506 | $ | 1,616 | 15.4 | % | ||||||||
Research and development expenses for the six months ended July 31, 2015 were $12.1 million, an increase of $1.6 million, or 15.4%, compared to $10.5 million for the six months ended July 31, 2014. As a percentage of revenues, research and development expense increased to 40.1% for the six months ended July 31, 2015 compared to 36.7% for the six months ended July 31, 2014. Increased payroll and employee-related costs accounted for essentially all of the $1.6 million increase, primarily as a result of the net addition of 15 new scientists and software engineers since the prior year period and merit-based compensation increases for existing personnel.
General and administrative
| Six Months Ended July 31, |
||||||||||||||||
| (in thousands, except percentages) | 2015 | 2014 | Increase | % Change | ||||||||||||
| General and administrative |
$ | 6,393 | $ | 6,339 | $ | 54 | 0.9 | % | ||||||||
23
Table of Contents
General and administrative expenses for the six months ended July 31, 2015 remained relatively flat when compared with the six months ended July 31, 2014. As a percentage of revenues, general and administrative expenses decreased to 21.2% for the six months ended July 31, 2015 compared to 22.2% for the six months ended July 31, 2014.
Other expense, net
| Six Months Ended July 31, |
||||||||||||||||
| (in thousands, except percentages) | 2015 | 2014 | Change | % Change | ||||||||||||
| Other expense, net |
$ | (337 | ) | $ | (37 | ) | $ | (300 | ) | 810.8 | % | |||||
Other expense, net for the six months ended July 31, 2015 was $0.3 million, an increase of $0.3 million compared to other expense, net of less than $0.1 million for the six months ended July 31, 2014. Other expense, net consists primarily of foreign exchange gains and losses and interest expense associated with our capital lease obligations. The period-over-period change to other expense, net is primarily attributed to foreign exchange fluctuations in the Euro and Japanese yen.
Provision for income taxes
| Six Months Ended July 31, |
||||||||||||||||
| (in thousands, except percentages) | 2015 | 2014 | Decrease | % Change | ||||||||||||
| Provision for income taxes |
$ | 128 | $ | 15,656 | $ | (15,528 | ) | (99.2 | )% | |||||||
For the six months ended July 31, 2015 and 2014, our income tax provision was $0.1 million and $15.7 million, respectively. The provision for the six months ended July 31, 2015 primarily consists of the tax effects of foreign operating results and foreign withholding taxes. The provision for the six months ended July 31, 2014 includes a $14.5 million non-cash charge to record a valuation allowance against the Company’s United States net deferred tax assets and a $0.7 million non-cash write-off of state deferred tax assets.
In determining the realizability of the net United States federal and state deferred tax assets, we consider numerous factors including historical profitability, estimated future taxable income, prudent and feasible tax planning strategies and the industry in which it operates. Management reassesses the realization of the deferred tax assets each reporting period, which resulted in a full valuation allowance against our United States deferred tax assets in the first quarter of fiscal year 2015. To the extent that the financial results of the United States operations improve in the future and the deferred tax assets become realizable, we will reduce the valuation allowance through earnings.
We do not expect that our unrecognized tax benefit will change significantly within the next twelve months. We and one or more of our subsidiaries file United States federal income tax returns and tax returns in various state and foreign jurisdictions. With limited exceptions, we are no longer subject to federal, state, local or foreign examinations for years prior to January 31, 2011. However, carryforward attributes that were generated in tax years ending prior to January 31, 2012 may still be adjusted upon examination by state or local tax authorities if they either have been or will be used in a future period.
Under Section 382 of the Internal Revenue Code of 1986, as amended, substantial changes in our ownership may limit the amount of net operating loss carryforwards that could be utilized annually in the future to offset its taxable income. Specifically, this limitation may arise in the event we undergo a cumulative change in ownership of more than 50% within a three-year period. During the first quarter of fiscal year 2015, our management determined that the Company had experienced an ownership change for purposes of Section 382. This ownership change resulted in annual limitations to the amount of net operating loss carryforwards that can be utilized to offset future taxable income, if any, at the federal level. Our management has determined that, as of July 31,
24
Table of Contents
2015, we have not experienced another ownership change for purposes of Section 382. However, future transactions in our common stock could trigger an ownership change for purposes of Section 382, which could limit the amount of net operating loss carryforwards that could be utilized annually in the future to offset our taxable income, if any. Any such limitation, whether as the result of sales of common stock by our existing stockholders or sales of common stock by us, could have a material adverse effect on our results of operations in future years.
Non-GAAP Measures
From time to time we provide certain non-GAAP financial measures to investors as additional information in order to supplement our consolidated financial statements, which are presented in accordance with accounting principles generally accepted in the United States, or GAAP. The non-GAAP financial information presented here should be considered in conjunction with, and not as a substitute for, or superior to, the financial information presented in accordance with GAAP and should not be considered a measure of our liquidity. There are significant limitations associated with the use of non-GAAP financial measures. Further, these measures may differ from the non-GAAP information, even where similarly titled or used by other companies and therefore should not be used to compare our performance to that of other companies.
Revenue and total operating expenses on a constant currency basis. Our international operations generate and incur expenses that are denominated in foreign currencies, and changes in currency exchange rates can materially affect our consolidated results of operations. Our principal exposures are to fluctuations in exchange rates for the United States dollar versus the British pound, Chinese yuan, Euro, Japanese yen, and Korean won. To provide investors with information concerning underlying trends in our business, we disclose revenue and total operating expenses on a constant currency basis, which we define as GAAP revenue or operating expenses, adjusted to reverse the impact of changes in the exchange rates of the principal currencies in which our international operations generated revenue and incurred expenses. We calculate revenue and total operating expenses on a constant currency basis by converting revenue or operating expenses that were generated in the currencies specified above during the three and six months ended July 31, 2015 to United States dollars at assumed exchange rates equal to the exchange rates in effect for such currencies during the corresponding period of the previous fiscal year, rather than the exchange rates actually in effect during the current fiscal year.
Adjusted EBITDA. We define Adjusted EBITDA as EBITDA, excluding non-cash, stock-based compensation expense. We define EBITDA as net loss, excluding depreciation and amortization, interest expense, net, other income, net, foreign exchange loss (income) and provision for income taxes. The GAAP measure most comparable to Adjusted EBITDA is net loss.
Non-GAAP operating loss. We define non-GAAP operating loss as GAAP operating loss excluding non-cash, stock-based compensation expense and amortization of acquired intangible assets. The GAAP measure most comparable to non-GAAP operating loss is operating loss.
Non-GAAP net loss. We define non-GAAP net loss as GAAP net loss excluding the after tax impact of non-cash, stock-based compensation expense and amortization of acquired intangible assets. The GAAP measure most comparable to non-GAAP net loss is net loss.
Non-GAAP net loss per diluted share. We define non-GAAP net loss per diluted share as GAAP net loss per diluted share excluding the after tax impact of non-cash, stock-based compensation expense and amortization of acquired intangible assets. The GAAP measure most comparable to non-GAAP net loss per diluted share is net loss per diluted share.
Our management uses these non-GAAP financial measures to evaluate our operating performance and for internal planning and forecasting purposes. We believe that these measures help identify underlying trends in our business, are useful for comparing current results with prior period results, and are helpful to investors and financial analysts in assessing our operating performance. For example, our management considers Adjusted
25
Table of Contents
EBITDA to be an important indicator of our operational strength and the performance of our business and a good measure of our historical operating trends. However, each of these non-GAAP financial measures may have limitations as an analytical tool. In considering our Adjusted EBITDA, non-GAAP loss, non-GAAP net loss and non-GAAP net loss per diluted share, investors should take into account the following reconciliations of these non-GAAP financial measures to the comparable GAAP financial measures:
Adjusted EBITDA:
| Three Months Ended July 31, |
Six Months Ended July 31, |
|||||||||||||||
| (in thousands) | 2015 | 2014 | 2015 | 2014 | ||||||||||||
| Net loss |
$ | (1,195 | ) | $ | (1,009 | ) | $ | (3,083 | ) | $ | (18,229 | ) | ||||
| Add back: |
||||||||||||||||
| Depreciation and amortization |
778 | 731 | 1,528 | 1,394 | ||||||||||||
| Interest expense, net |
52 | 92 | 114 | 171 | ||||||||||||
| Other income, net |
— | (3 | ) | — | (3 | ) | ||||||||||
| Foreign exchange loss (income) |
171 | (175 | ) | 223 | (131 | ) | ||||||||||
| Provision for income taxes |
154 | 176 | 128 | 15,656 | ||||||||||||
|
|
|
|
|
|
|
|
|
|||||||||
| EBITDA |
(40 | ) | (188 | ) | (1,090 | ) | (1,142 | ) | ||||||||
| Stock-based compensation expense |
491 | 500 | 1,105 | 870 | ||||||||||||
|
|
|
|
|
|
|
|
|
|||||||||
| Adjusted EBITDA |
$ | 451 | $ | 312 | $ | 15 | $ | (272 | ) | |||||||
|
|
|
|
|
|
|
|
|
|||||||||
Non-GAAP operating loss:
| Three Months Ended July 31, |
Six Months Ended July 31, |
|||||||||||||||
| (in thousands) | 2015 | 2014 | 2015 | 2014 | ||||||||||||
| Operating loss |
$ | (818 | ) | $ | (919 | ) | $ | (2,618 | ) | $ | (2,536 | ) | ||||
| Add back: |
||||||||||||||||
| Stock-based compensation expense |
491 | 500 | 1,105 | 870 | ||||||||||||
| Amortization of acquired intangible assets |
87 | 88 | 175 | 175 | ||||||||||||
|
|
|
|
|
|
|
|
|
|||||||||
| Non-GAAP operating loss |
$ | (240 | ) | $ | (331 | ) | $ | (1,338 | ) | $ | (1,491 | ) | ||||
|
|
|
|
|
|
|
|
|
|||||||||
Non-GAAP net loss:
| Three Months Ended July 31, |
Six Months Ended July 31, |
|||||||||||||||
| (in thousands) | 2015 | 2014 | 2015 | 2014 | ||||||||||||
| Net loss |
$ | (1,195 | ) | $ | (1,009 | ) | $ | (3,083 | ) | $ | (18,229 | ) | ||||
| Add back: |
||||||||||||||||
| Stock-based compensation expense |
491 | 500 | 1,105 | 870 | ||||||||||||
| Amortization of acquired intangible assets |
87 | 88 | 175 | 175 | ||||||||||||
| Income tax effect (1) |
(199 | ) | (203 | ) | (445 | ) | (363 | ) | ||||||||
|
|
|
|
|
|
|
|
|
|||||||||
| Non-GAAP net loss |
$ | (816 | ) | $ | (624 | ) | $ | (2,248 | ) | $ | (17,547 | ) | ||||
|
|
|
|
|
|
|
|
|
|||||||||
26
Table of Contents
Non-GAAP net loss per diluted share:
| Three Months Ended July 31, |
Six Months Ended July 31, |
|||||||||||||||
| 2015 | 2014 | 2015 | 2014 | |||||||||||||
| Net loss per diluted share (2) |
$ | (0.08 | ) | $ | (0.07 | ) | $ | (0.21 | ) | $ | (1.34 | ) | ||||
| Add back: |
||||||||||||||||
| Stock-based compensation expense |
0.03 | 0.04 | 0.08 | 0.06 | ||||||||||||
| Amortization of acquired intangible assets |
0.01 | 0.01 | 0.01 | 0.01 | ||||||||||||
| Income tax effect (1) |
(0.02 | ) | (0.02 | ) | (0.03 | ) | (0.03 | ) | ||||||||
|
|
|
|
|
|
|
|
|
|||||||||
| Non-GAAP net loss, per diluted share (2)(3): |
$ | (0.06 | ) | $ | (0.05 | ) | $ | (0.16 | ) | $ | (1.29 | ) | ||||
|
|
|
|
|
|
|
|
|
|||||||||
| (1) | The tax effect of non-cash stock-based compensation expense and non-cash amortization of acquired intangibles is estimated using a blended rate equivalent to our statutory United States federal tax rate and our estimated state tax rate. The tax effect is exclusive of any impact from valuation allowances established against our United States net deferred tax assets and other discrete items. Due to the differences in the tax treatment of items excluded from non-GAAP earnings, as well as the methodology applied to our estimated annual tax rates as described above, our estimated tax rate on non-GAAP income may differ from our GAAP tax rate and from our actual tax liabilities. |
| (2) | Share amounts utilized on a fully diluted basis were approximately 14.5 million and 13.8 million for the three months ended July 31, 2015 and 2014, respectively, and 14.4 million and 13.6 million for the six months ended July 31, 2015 and 2014, respectively. |
| (3) | Due to rounding, totals may not equal the sum of line items in the table above. |
Liquidity
Overview
Our primary sources of liquidity during the six months ended July 31, 2015 were cash and cash equivalents on hand, cash flows provided by operating activities and cash proceeds from stock option and warrant exercises. Our primary uses of cash during the six months ended July 31, 2015 were capital expenditures and payments of capital lease obligations. As of July 31, 2015, we had $30.4 million in cash and cash equivalents.
On December 10, 2013, we filed a shelf registration statement on Form S-3, which included a base prospectus relating to, among other things, the registration of $75 million of our common stock that may be offered and sold by us from time to time pursuant to Rule 415 promulgated under the Act, in amounts, at prices and on terms to be determined at the time of the offering.
Net Cash Flows from Operating Activities
Variations in the amount of our net cash provided or used by operating activities are primarily the result of changes in the amount of our working capital accounts, mainly accounts receivable and deferred revenue, the timing of cash payments from our customers and of our cash expenditures, principally employee salaries, accounts payable and payments of value added taxes and consumption taxes on the receivables of our foreign subsidiaries.
Cash payments from our customers fluctuate due to timing of new and renewal license sales, which typically coincide with our customers’ budget cycles. The fourth quarter of each fiscal year generally has the highest license sales, with payment of the license fee typically becoming due at the commencement of the license term. As a result, our cash flows from operations are typically highest in the first quarter of each fiscal year. Generally, customers are invoiced in advance for their annual subscription fee and the invoices are recorded in accounts receivable and deferred revenue, with deferred revenues being recognized ratably over the term of the subscription agreement.
27
Table of Contents
Net cash provided by operating activities for the six months ended July 31, 2015 and 2014 was $9.6 million and $4.8 million, respectively. The increase during the current year period is primarily the result of fluctuations in accounts receivable and deferred revenue, which typically vary depending on the timing of our receipt and invoicing of customer orders and the timing of cash payments to us from customers.
Net Cash Flows from Investing Activities
Net cash used in investing activities for the six months ended July 31, 2015 and 2014 remained relatively flat at $0.6 million for each period, and primarily consisted of purchases of servers, workstations and other computer software and hardware.
Net Cash Flows From Financing Activities
Net cash used in financing activities for the six months ended July 31, 2015 was $0.2 million, and consists of payments on our capital lease obligations of $1.3 million, partially offset by proceeds from stock option and warrant exercises of $1.1 million. Net cash used in financing activities for the six months ended July 31, 2014 was $1.0 million, and consisted primarily of payments on our capital lease obligations of $1.4 million, partially offset by proceeds from stock option exercises of $0.4 million.
In July 2015, we entered into a commitment to lease computer processor equipment for our high performance computing data center in New Jersey for aggregate payments of $4.4 million. The equipment, which is expected to be delivered by September 2015, will be financed over three years under an arrangement with IBM that will qualify for capital lease accounting treatment. The repayment of the arising capital lease obligation will be repaid with cash from financing activities over the next three years.
Off-Balance Sheet Arrangements
We did not have any off-balance sheet arrangements as of either July 31, 2015 or January 31, 2015.
Contractual Commitments
Operating Leases
Effective July 1, 2015, we amended the lease for our corporate headquarters space in Burlington, Massachusetts. Originally set to expire in March 2016, the amendment extends the lease term through March 2023 and reduces the leased space from 65,941 square feet to 44,241 square feet. The 21,700 square foot reduction primarily relates to first floor space that we had previously subleased to a subtenant, and under the terms of the amendment, the landlord assumed the sublease effective July 1, 2015. The amendment also provides for a tenant improvement allowance of up to $1.7 million to cover renovations that will be made to the retained second floor space over the remainder of fiscal year 2016. We believe that the renovated space will be suitable and adequate to meet our planned growth needs at our headquarters over the next several years.
In conjunction with the relinquishment of the first floor space, the amendment reduces our required security deposit letter of credit from $0.5 million to $0.4 million, and accordingly, we plan to reduce the restricted cash account securing the letter of credit to $0.4 million in the third quarter of fiscal 2016. As of July 31, 2015, restricted cash of $0.4 million is included in other long term assets and $0.1 million is included in other current assets in the accompanying consolidated balance sheet.
28
Table of Contents
As of July 31, 2015, future minimum lease payments under the amended headquarters lease are as follows (in millions):
| Fiscal year ended January 31, | ||||
| 2016 (remainder as of July 31, 2015) |
$ | 0.8 | ||
| 2017 |
1.5 | |||
| 2018 |
1.6 | |||
| 2019 |
1.6 | |||
| 2020 |
1.7 | |||
| 2021 |
1.7 | |||
| Thereafter |
3.8 | |||
|
|
|
|||
| $ | 12.7 | |||
|
|
|
|||
Purchase Obligations
In July 2015, we entered into a commitment to lease $4.4 million of computer processor equipment for our high performance computing data center in New Jersey. This capital investment will significantly expand our computing capacity to address current and anticipated demand. It is also expected to improve project simulation cycle times. The equipment, which is expected to be delivered by September 2015, will be financed over three years under an arrangement with IBM that will qualify for capital lease accounting treatment.
Capital Resources
Our future capital requirements may vary materially from those now planned and will depend on many factors, including the costs to develop and implement new solutions and applications, the sales and marketing resources needed to further penetrate our market and gain acceptance of new solutions and applications we develop, the expansion of our operations in the United States and internationally and the response of competitors to our solutions and applications. Historically, we have experienced increases in our expenditures consistent with the growth in our operations and personnel, and we anticipate that our expenditures will continue to increase as we grow our business. Our practice has been to reinvest the undistributed earnings of our foreign subsidiaries in their local jurisdictions, and we currently do not intend to repatriate such earnings. As of July 31, 2015 and January 31, 2015, $6.4 million and $5.8 million, respectively, of our cash is held in bank accounts outside the United States and may not be completely available to fund our domestic operations and obligations without paying taxes upon repatriation.
We expect to be able to meet the funding needs of our United States operations and do not intend on repatriating undistributed earnings that have been indefinitely reinvested in our international subsidiaries.
We believe our cash on hand and cash flows from our operations will be sufficient to meet our working capital and capital expenditure requirements for the foreseeable future, including at least the next twelve months.
Seasonality
We have experienced and expect to continue to experience seasonal variations in the timing of customers’ purchases of our software products. Many customers make purchase decisions based on their budget cycles, which typically coincide with the calendar year, except in Japan, where our customer budget cycles typically begin on April 1. Because our software products are sold pursuant to annual subscription agreements and we recognize revenue from these subscriptions over the term of the agreement, downturns or upturns in invoices may not be immediately reflected in our operating results. However, these seasonal trends materially affect the timing of our cash flows, as we generally receive the annual license fee at the time the license term commences. As a result, our cash flows from operations are typically highest in the first quarter of each fiscal year.
29
Table of Contents
| ITEM 3. | QUANTITATIVE AND QUALITATIVE DISCLOSURES ABOUT MARKET RISK |
Foreign Currency Exchange Risk
As we conduct business in multiple international currencies throughout the world, our international operations generate and incur expenses that are denominated in foreign currencies. These amounts could be materially affected by currency fluctuations. Our principal exposures are to fluctuations in exchange rates for the United States dollar versus the British pound, Chinese yuan, Euro, Japanese yen, and Korean won. Changes in currency exchange rates could adversely affect our consolidated results of operations or financial position. Additionally, our international operations maintain cash balances denominated in foreign currencies. To reduce the risk associated with translation of foreign cash balances into our reporting currency, we typically avoid maintaining excess cash balances in foreign currencies. To date, we have not hedged our exposure to changes in foreign currency exchange rates and, as a result, we could incur unanticipated translation gains and losses.
The Euro was approximately 19.2% weaker against the United States dollar, on average, for the six months ended July 31, 2015, when compared with the six months ended July 31, 2014. The resulting net overall impact to revenue and operating expense was a decrease of approximately $2.4 million and $1.6 million, respectively, during the six months ended July 31, 2015.
The exchange rate impact of other currencies for the six months ended July 31, 2015, primarily driven by a weaker Japanese yen, was a decrease to revenue and operating expense of approximately $0.8 million and $0.4 million, respectively.
For the six months ended July 31, 2015, a 10% change in the exchange rates for the United States dollar versus the British pound, Chinese yuan, Euro, Japanese yen, and Korean won would have resulted in a $1.6 million change in revenue.
Interest Rate Sensitivity
Our interest expense consists solely of fixed-rate interest under our outstanding capital lease obligations. As a result, we do not believe that we are exposed to material interest rate risk at this time. Interest income is sensitive to changes in the general level of United States and international interest rates. The primary objective of our investment activities is to preserve principal while maximizing income without significantly increasing risk. Our cash and cash equivalents are relatively insensitive to interest rate changes. In future periods, we will continue to evaluate our investment policy in order to ensure that we continue to meet our overall objectives.
We do not believe that a 10% change in interest rates would have a material impact on our financial position or results of operations.
| ITEM 4. | CONTROLS AND PROCEDURES |
Disclosure Controls and Procedures
We maintain disclosure controls and procedures that are designed to ensure that information required to be disclosed in our reports under the Securities Exchange Act of 1934, as amended (the “Exchange Act”), is recorded, processed, summarized and reported within the time periods specified in the rules and forms, and that such information is accumulated and communicated to us, including our Chief Executive Officer and Chief Financial Officer, as appropriate, to allow timely decisions regarding required disclosure. In designing and evaluating our disclosure controls and procedures, we recognize that any controls and procedures, no matter how well designed and operated, can provide only reasonable assurance of achieving the desired control objectives, as ours are designed to do, and we necessarily were required to apply our judgment in evaluating whether the benefits of the controls and procedures that we adopt outweigh their costs.
As required by Rule 13a-15(b) under the Exchange Act, an evaluation of the effectiveness of our disclosure controls and procedures (as defined in Rule 13a-15(e) under the Exchange Act) as of July 31, 2015 was
30
Table of Contents
conducted under the supervision and with the participation of our management, including our Chief Executive Officer and Chief Financial Officer. Based on this evaluation, our Chief Executive Officer and Chief Financial Officer concluded that our disclosure controls and procedures were effective as of July 31, 2015.
Changes in Internal Control over Financial Reporting
There were no changes in our internal control over financial reporting during the fiscal quarter ended July 31, 2015 that have materially affected, or are reasonably likely to materially affect, our internal control over financial reporting.
31
Table of Contents
| ITEM 1. | LEGAL PROCEEDINGS |
We are not a party to any pending material legal proceedings. However, because of the nature of our business, we may be subject at any particular time to lawsuits or other claims arising in the ordinary course of our business, and we expect that this will continue to be the case in the future.
| ITEM 1A. | RISK FACTORS |
You should carefully consider the risks and uncertainties described in our Annual Report on Form 10-K for the fiscal year ended January 31, 2015, filed with the SEC on March 24, 2015 and other documents we file with the SEC. The risks and uncertainties described are those that we have identified as material, but are not the only risks and uncertainties facing us. Our business is also subject to general risks and uncertainties that affect many other companies, such as overall U.S. and non-U.S. economic and industry conditions including a global economic slowdown, geopolitical events, changes in laws or accounting rules, fluctuations in interest and exchange rates, terrorism, international conflicts, major health concerns, natural disasters or other disruptions of expected economic and business conditions. Additional risks and uncertainties not currently known to us or that we currently believe are immaterial also may impair our business operations and liquidity.
| ITEM 2. | UNREGISTERED SALES OF EQUITY SECURITIES AND USE OF PROCEEDS |
(b) Use of Proceeds
On July 3, 2012, we completed the initial public offering of our common stock pursuant to our Registration Statement on Form S-1 (File No. 333-176019), which was declared effective by the Securities and Exchange Commission on June 27, 2012. The underwriters for the offering were Stifel Nicolaus & Company, Incorporated, Robert W. Baird & Co. Incorporated, Canaccord Genuity Inc. and Needham & Company, LLC. We did not use any of the net proceeds from this offering during the three months ended July 31, 2015.
| ITEM 5. | OTHER INFORMATION |
Item 1.01 Entry into a Material Definitive Agreement
Effective July 1, 2015, we entered into an amendment to our lease with Network Drive Owner LLC for our corporate headquarters space in Burlington, Massachusetts. The amendment extends the lease term, which was originally scheduled to expire in March 2016, through March 2023 and reduces the leased space from 65,941 square feet to 44,241square feet. The 21,700 square foot reduction primarily relates to space that we subleased to a subtenant, and for which the landlord assumed the sublease. The amendment also provides for a tenant improvement allowance of up to $1.7 million to cover renovations that will be made to the retained space over the remainder of fiscal year 2016. In conjunction with the relinquishment of the subleased space, the amendment reduced our required security deposit letter of credit from $525,000 to $352,232. The amended lease provides for minimum monthly rent as follows:
| Period: |
||||
| Through March 31, 2016 |
$ | 129,958 | ||
| April 1, 2016 – March 31, 2017 |
$ | 128,115 | ||
| April 1, 2017 – March 31, 2018 |
$ | 131,801 | ||
| April 1, 2018 – March 31, 2019 |
$ | 135,488 | ||
| April 1, 2019 – March 31, 2020 |
$ | 139,175 | ||
| April 1, 2020 – March 31, 2021 |
$ | 142,862 | ||
| April 1, 2021 – March 31, 2022 |
$ | 146,548 | ||
| April 1, 2022 – March 31, 2023 |
$ | 150,235 | ||
A copy of the amendment to our headquarters lease is attached hereto as Exhibit 10.1 and is incorporated into this Item 5 by reference.
32
Table of Contents
| ITEM 6. | EXHIBITS |
| Exhibit |
Description | |
| 3.1 | Amended and Restated Certificate of Incorporation (incorporated by reference to Exhibit 3.1 to the Company’s Current Report on Form 8-K, event date June 27, 2012, filed on July 3, 2012). | |
| 3.2 | Amended and Restated By-laws (incorporated by reference to Exhibit 3.2 to the Company’s Current Report on Form 8-K, event date June 27, 2012, filed on July 3, 2012). | |
| 3.3 | Amendment to Amended and Restated Certificate of Incorporation (incorporated by reference to Exhibit 3.3 to the Company’s Quarterly Report on Form 10-Q for the fiscal quarter ended July 31, 2013) | |
| 10.1* | First Amendment and Partial Termination Agreement dated July 31, 2015 between Exa Corporation and Network Drive Owner LLC. | |
| 31.1* | Rule 13a-14(a)/15d-14(a) Certification, executed by Stephen A. Remondi, President and Chief Executive Officer of Exa Corporation. | |
| 31.2* | Rule 13a-14(a)/15d-14(a) Certification, executed by Richard F. Gilbody, Chief Financial Officer of Exa Corporation. | |
| 32.1** | Section 1350 Certification, executed by Stephen A. Remondi, President and Chief Executive Officer of Exa Corporation. | |
| 32.2** | Section 1350 Certification, executed by Richard F. Gilbody, Chief Financial Officer of Exa Corporation. | |
| 101* | Interactive Data Files pursuant to Rule 405 of Regulation S-T (XBRL) | |
| * | Filed herewith. |
| ** | Furnished herewith. |
33
Table of Contents
SIGNATURE
Pursuant to the requirements of the Securities Exchange Act of 1934, as amended, the registrant has duly caused this report to be signed on its behalf by the undersigned thereunto duly authorized.
| EXA CORPORATION (Registrant) | ||
| By: | /s/ Richard F. Gilbody | |
| Richard F. Gilbody | ||
| Chief Financial Officer | ||
| Date: September 1, 2015 | ||
34
Exhibit 10.1
FIRST AMENDMENT AND PARTIAL TERMINATION AGREEMENT
THIS FIRST AMENDMENT AND PARTIAL TERMINATION AGREEMENT (this “Amendment”) is made and entered into as of this 31st day of July, 2015, by and between NETWORK DRIVE OWNER LLC, a Delaware limited liability company (hereinafter called “Landlord”) and EXA CORPORATION (hereinafter called “Tenant”).
BACKGROUND:
A. Netview 5 and 6 LLC, Landlord’s predecessor-in-interest, and Tenant entered into a lease dated July 21, 2008 (the “Lease”) with regard to certain premises located in the building located at 55 Network Drive, Burlington, Massachusetts (the “Building”).
B. The Lease covers certain premises consisting of (i) approximately 21,700 rentable square feet located on the first (1st) floor of the Building as shown on Exhibit A attached hereto (the “First Floor Premises”), and (ii) approximately 44,241 rentable square feet comprising the entire second (2nd) floor of the Building as shown on Exhibit B (the “Second Floor Premises”). The First Floor Premises and the Second Floor Premises contain approximately 65,941 rentable square feet in the aggregate and are collectively referred to as the “Premises”.
C. Tenant and FIS Financial Compliance Solutions (“FIS”) are parties to a certain sublease dated July 20, 2009, as amended by a First Amendment to Sublease Agreement dated October 28, 2011 and a Second Amendment to Sublease Agreement dated June 19, 2013 (as amended, the “Sublease”) with regard to a portion of the First Floor Premises consisting of approximately 15,789 rentable square feet as shown on Exhibit A attached hereto (the “Subleased Premises).
D. The term of the Lease is scheduled to expire on March 31, 2016.
E. Landlord and Tenant desire to terminate the Lease with regard to the First Floor Premises effective as of June 30, 2015, and to extend the Term of the Lease with regard to the Second Floor Premises such that the same shall expire March 31, 2023.
NOW, THEREFORE, in consideration of the mutual promises and undertakings of the parties hereto and for other good and valuable consideration the receipt and sufficiency of which are hereby acknowledged, Landlord and Tenant hereby agree as follows:
1. On or prior to July 1, 2015 (the “First Floor Premises Termination Date”), Tenant shall vacate and surrender the First Floor Premises in accordance with the terms of the Lease (including but not limited to Section 6.1.9 thereof), it being recognized that Landlord and FIS are parties to an agreement of even date hereof (the “FIS Agreement”) whereby FIS will continue to occupy the Subleased Premises following the First Floor Premises Termination Date. Based upon the foregoing, Tenant is not responsible for removing FIS from the Subleased Premises. Notwithstanding the foregoing, Tenant shall be responsible for removing the Personal Property (as defined in Paragraph 16.1 of the Sublease) within five (5) business days following the expiration or earlier termination of the FIS Agreement. Tenant hereby represents and covenants to Landlord that, other than the Sublease, nothing has been done or suffered and nothing will be done or suffered whereby the estate of the Tenant in and to the First Floor Premises or any
portion thereof, has been or will be encumbered in any way whatsoever, and that no one, other than Tenant and FIS, has acquired or will acquire by, through or under Tenant, any right, title or interest in or to the First Floor Premises or any portion thereof.
2. Provided that Tenant has timely surrendered the First Floor Premises in accordance with the terms of the Lease and this Amendment and otherwise complied with its undertakings set forth herein, then as of the First Floor Premises Termination Date (i) Landlord shall accept the surrender of the First Floor Premises, (ii) from and after the First Floor Premises Termination Date, the First Floor Premises shall be released and discharged from the operation of the Lease (subject to the provisions of the Lease which expressly survive termination thereof) and neither Landlord nor Tenant shall have any accruing liability or obligation under the Lease with respect to such First Floor Premises (except for any retroactive adjustments to rent which may be payable pursuant to the terms and provisions of the Lease for which Tenant shall remain liable), and (iii) such terms and conditions of the Lease (as modified by this Amendment) with respect to the Premises shall thereupon apply only to the remaining Premises (as so reduced by the First Floor Premises) as the “Premises” under the Lease. If Tenant shall fail to vacate and deliver the First Floor Premises to Landlord in accordance with the terms of the Lease and this Amendment on or before the First Floor Premises Termination Date, Tenant shall be considered a holdover tenant with respect to such First Floor Premises, thereby entitling Landlord to exercise all rights and remedies available to Landlord under the Lease or now or hereafter existing at law or in equity.
3. Notwithstanding anything to the contrary contained herein, Tenant shall have the right to continue to use and occupy the data center located in the First Floor Premises (the “First Floor Data Center”, as shown on Exhibit A) until the date (the “First Floor Data Center Relocation Deadline”) that is the earlier to occur of (a) the date that is thirty (30) days after Landlord substantially completes construction of a server room in the Second Floor Premises (the “New Server Room”) as part of the Renovation Work (as such term is defined in paragraph 9 hereof), and (b) January 31, 2016, it being agreed that such use shall be subject to all of the terms and conditions of the Lease (excluding the payment of Fixed Rent and Additional Rent). Tenant shall continue to be responsible for electricity used in connection with the First Floor Data Center pursuant to the terms of the Lease. In addition, Tenant shall have the right to continue to use the boardroom located in the First Floor Premises (the “Boardroom”, as shown on Exhibit A) in common with FIS until the date (the “Boardroom Relocation Deadline”) that is the earlier to occur of (a) the date that is five (5) days after Landlord substantially completes construction of a boardroom in the Second Floor Premises as part of the Renovation Work (as such term is defined in paragraph 9 hereof), and (b) January 31, 2016, it being agreed that such use shall be subject to all of the terms and conditions of the Lease (excluding the payment of Fixed Rent and Additional Rent). If Tenant shall fail to vacate and deliver the First Floor Data Center to Landlord in accordance with the terms of the Lease and this Amendment on or before the First Floor Data Center Relocation Deadline, and or the Boardroom on or before the Boardroom Relocation Deadline, Tenant shall be considered a holdover tenant with respect to such First Floor Data Center/Boardroom (as applicable), thereby entitling Landlord to exercise all rights and remedies available to Landlord under the Lease or now or hereafter existing at law or in equity. For the avoidance of doubt, in connection with the surrender and yield-up of the First Floor Data Center, Tenant shall not be required to remove any of the infrastructure (e.g. Liebert units and related chilled water piping) that existed in the First Floor Data Center prior to Tenant’s occupancy.
2
4. Following the First Floor Premises Termination Date, Tenant shall continue to lease the remaining portion of the Premises other than the First Floor Premises (i.e., the Second Floor Premises). Provided that Tenant has satisfied the conditions precedent set forth in paragraph 1 above, effective as of the First Floor Premises Termination Date, the Lease shall be amended to reflect the reduction in the Premises by the deletion of the First Floor Premises as follows:
| (a) | The Premises shall consist of the Second Floor Premises, alone. |
| (b) | The Annual Fixed Rent Rate and Monthly Fixed Rent Rate shall be as follows: |
| Period: |
Annual Fixed Rent Rate: |
Monthly Fixed Rent Rate: |
||||||
| First Floor Premises Termination Date – March 31, 2016: |
$ | 1,559,495.20 | $ | 129,957.94 | ||||
| (c) | Tenant’s Percentage shall be 33.85%. |
| (d) | Base Taxes shall be the Taxes for the 2016 fiscal tax year (i.e. July 1, 2015 – June 30, 2016) |
| (e) | Base Operating Costs shall be the Operating Costs for the 2015 calendar year. |
5. The term of the Lease is hereby extended for a term of seven (7) years (the “First Extended Term”), such First Extended Term commencing on April 1, 2016 (the “First Extended Term Commencement Date”) and ending on March 31, 2023. In implementation of the foregoing, the definition of “Expiration Date” set forth in Section 1.1, is hereby changed to “March 31, 2023.” Except as otherwise set forth herein, all of the terms, covenants and provisions of the Lease shall apply to the First Extended Term.
6. Commencing on the First Extended Term Commencement Date, the Annual Fixed Rent Rate and the Monthly Fixed Rent Rate under the Lease shall be as follows:
| Period: |
Annual Fixed Rent Rate: |
Monthly Fixed Rent Rate: |
||||||
| April 1, 2016 – March 31, 2017 |
$ | 1,537,374.75 | $ | 128,114.56 | ||||
| April 1, 2017 – March 31, 2018 |
$ | 1,581,615.75 | $ | 131,801.31 | ||||
| April 1, 2018 – March 31, 2019 |
$ | 1,625,856.75 | $ | 135,488.06 | ||||
| April 1, 2019 – March 31, 2020 |
$ | 1,670,097.75 | $ | 139,174.81 | ||||
| April 1, 2020 – March 31, 2021 |
$ | 1,714,338.75 | $ | 142,861.56 | ||||
| April 1, 2021 – March 31, 2022 |
$ | 1,758,579.75 | $ | 146,548.31 | ||||
| April 1, 2022 – March 31, 2023 |
$ | 1,802,820.75 | $ | 150,235.06 | ||||
3
7. During the First Extended Term, in connection with Additional Rent, the following terms and conditions shall be applicable:
| (a) | Base Taxes shall be the Taxes for the 2016 fiscal tax year (i.e. July 1, 2015 – June 30, 2016) |
| (b) | Base Operating Costs shall be the Operating Costs for the 2015 calendar year. |
| (c) | Tenant’s Percentage shall be 33.85%. |
8. As part of the FIS Agreement, FIS is required to deliver to Landlord a security deposit in the amount of $28,946.50 (the “FIS Security”). Until such time as Landlord received the FIS Security, then notwithstanding anything to the contrary contained herein, (a) the Letter of Credit Amount as set forth in the Lease shall not be altered, and (b) Tenant shall not be relieved, in any way, of its obligations with regard to the surrender and yield-up of the Subleased Premises. Subject to the foregoing, effective as of the First Floor Premises Termination Date, provided that Landlord has received the FIS Security and Tenant is not in default under the Lease, the Letter of Credit Amount specified in Section 1.1 of the Lease shall be reduced to $352,232.00. Tenant shall be responsible for amending the existing Letter of Credit or delivering a replacement to Landlord to effect the aforesaid reduction. Any replacement letter of credit issued in the reduced amount shall satisfy the requirements for the Original Letter of Credit under Section 4.4.1 of the Lease and shall be deemed a “Substitute Letter of Credit” for all purposes under Section 4.4 of the Lease.
9. The Premises (as reduced herein) shall continue to be leased to Tenant in “as-is” condition, without any obligation on the part of Landlord to prepare the Premises for Tenant’s use, and without any representations or warranties by Landlord as to the condition or suitability of the Premises. Notwithstanding the foregoing, Landlord shall perform certain mutually agreed upon work derived from mutually agreed upon space plans that will be conceptually consistent with those certain Level 2 Test Fit plans dated July 30, 2015 prepared by SGA Architects (the “Renovation Work”). The parties shall collaborate together to facilitate such Renovation Work, it being Landlord’s intent, subject to Section 10.5 of the Lease and delays caused by Tenant, to have the Renovation Work substantially completed prior to December 31, 2015, and in any event no later than March 31, 2016. The Renovation Work shall occur while Tenant is in occupancy of the Premises, and Tenant agrees that Landlord shall be permitted to enter the Premises and perform the Renovation Work both during normal business hours and after normal business hours (as the scope of such work dictates). Tenant shall cooperate with Landlord’s reasonable requirements to facilitate such Renovation Work (including but not limited to relocating employees from certain portions of the Premises being worked on to other areas of the Premises), and otherwise use diligent and good faith efforts to help facilitate Landlord’s timely completion of the Renovation Work, and Tenant shall not be entitled to any compensation or abatement or diminution of Rent as a result of such activities. Landlord shall cause the Renovation Work to be performed using Building-standard materials at no additional cost to Tenant up to the amount of $1,681,158.00 (such amount the “Allowance”). The Allowance will be used to pay for all hard and soft costs incurred by Landlord in connection with the Renovation Work, including architectural, engineering and construction management costs. Tenant shall be solely responsible for and shall pay to Landlord a sum equal to the amount by which the costs,
4
including architectural, engineering and construction management costs, incurred by Landlord in performing the Renovation Work exceed the Allowance (the “Excess”), with such Excess to be paid as follows: (a) an amount equal to forty (40%) percent of the anticipated cost of the Excess upon the commencement of the Renovation Work, (b) forty (40%) percent of such anticipated cost of the Excess on the date that Landlord informs Tenant that the Renovation Work is fifty percent (50%) complete, and (c) the balance of the Excess upon Landlord’s submission of the final bill to Tenant. Landlord shall provide reasonable back-up documentation to Tenant to substantiate any Excess to be paid by Tenant, upon request of Tenant. If, following the initial pricing of the Renovation Work, there is a projected Excess, Tenant shall have a period of seven (7) days following notice from Landlord of such Excess to collaborate with Landlord to create mutually acceptable modifications to the plans for the Renovation Work so as to reduce (or, if reasonably possible, eliminate) such Excess. Subject to the terms below, to the extent that the Renovation Work costs less than the Allowance (such difference, the “Unused Allowance”), then Tenant may elect to use (a) up to fifteen percent (15%) of the Unused Allowance (such amount not to exceed $252,173.70) towards third party soft costs incurred by Tenant in connection with the renovations to the Premises, including but not limited to telephone/data cabling, and audio/visual costs, but specifically excluding the cost of furniture (the “Soft Cost Allowance”), and (b) up to twenty-five percent (25%) of the Unused Allowance (such amount not to exceed $420,289.50, and hereinafter the “Furniture Allowance”) for purchasing furniture for use in the Premises and/or removing the current furniture in the Premises that Tenant has the right to use pursuant to Section 2.1 of the Lease (it being agreed that Tenant is solely responsible at its expense for removing such furniture it is using pursuant to Section 2.1 of the Lease). Tenant shall contract directly with the providers of such soft costs associated with the Renovation Work, and shall purchase any such furniture directly from the seller thereof (it being agreed that any furniture purchased with the Furniture Allowance shall be Tenant’s property). All work undertaken by Tenant shall be done in accordance with the terms and conditions of the Lease, including but not limited to rule 19 of the Rules and Regulations regarding insurance. No work undertaken by Tenant shall prevent Landlord from obtaining a certificate of occupancy upon Landlord’s substantial completion of the Renovation Work. To the extent that Tenant installs any new cabling, Tenant must first remove the existing cabling. Should Tenant elect to use all or any portion of the Soft Cost Allowance and/or the Furniture Allowance, Tenant shall submit to Landlord copies of paid invoices and any other reasonable documentation (including but not limited to lien waivers) requested by Landlord in connection with the Soft Cost Allowance and/or Furniture Allowance (as applicable). Provided that Tenant is not in default under the Lease and has supplied Landlord with the documentation required herein, the Soft Cost Allowance and/or Furniture Allowance (as applicable) shall be payable by Landlord to Tenant within thirty (30) days from the date Tenant has submitted its request for the same. Any portion of the Unused Allowance not properly claimed by Tenant on or before June 30, 2016 (subject to the terms above) shall accrue to Landlord.
10. Tenant hereby indemnifies Landlord against liability for any and all mechanic’s and other liens filed in connection with any work undertaken by Tenant, including but not limited to work being funded by the Soft Cost Allowance or furniture being purchased with the Furniture Allowance. Tenant, at its expense, shall procure the discharge of, or bond over, all such liens within ten (10) days after receipt of notice of the filing of any such lien against the Premises. If Tenant shall fail to cause any such lien to be discharged or bonded over within the period aforesaid, then, in addition to any other right or remedy, Landlord may, but shall not be
5
obligated to, discharge the same either by paying the amount claimed to be due or by deposit or bonding proceedings, and in any such event Landlord shall be entitled, if it elects, to compel the prosecution of an action for the foreclosure of such lien and to pay the amount of the judgment in favor of the lien or with interest, costs and allowances. Any amount so paid by Landlord, and all costs and expenses reasonably incurred by Landlord in connection therewith, shall constitute Additional Rent and, at Landlord’s election, shall be deducted from the Allowance or paid by Tenant to Landlord on demand.
11. The Building is equipped with a 600 kw standby generator (the “Building Generator”). As of the date of this Amendment, the Building Generator has available capacity for non-exclusive use by tenants of the Building. Tenant is currently allowed to use up to sixty-one (61) kw of that available capacity of the Building Generator in connection with the First Floor Data Center. Once Landlord substantially completes construction of the New Server Room as part of the Renovation Work and Tenant begins to utilize the same, Tenant shall be permitted to use up to 61 kw of that available capacity for the New Server Room. Tenant acknowledges and agrees that the life safety loads shall remain priority one in the Building Generator.
12. The parties confirm that the rights set forth in Section 2.3 of the Lease (Extension Option) remain and shall be applicable to the period of time following the expiration of the First Extended Term (subject to the terms of Section 2.3).
13. As of the date hereof, the following sections of the Lease are hereby deleted, and are no longer valid and applicable: Section 2.4 (First Expansion Option), Section 2.5 (Second Expansion Option), Section 2.6 (Third Expansion Option) and Section 2.7 (Right of First Offer).
14. Tenant represents to Landlord it has dealt with no broker in connection with this Amendment other than Jones Lang LaSalle (the “Broker”), and in the event of any claims for commissions against Landlord by any other brokers other than the Broker predicated upon prior dealings with Tenant, Tenant agrees to defend the same and indemnify and hold harmless Landlord against any such claims.
15. Tenant represents, warrants and covenants that, to the best of Tenant’s knowledge, Landlord and Tenant are not in default of any of their respective obligations under the Lease and no event has occurred which, with the passage of time or the giving of notice, or both, would constitute a default by either Landlord or Tenant thereunder.
16. This Amendment contains the entire agreement of the parties regarding the subject matter hereof. There are no promises, agreements, conditions, undertakings, warranties or representations, oral or written, express or implied, among them, relating to this subject matter, other than as set forth herein.
17. Landlord and Tenant each represent, as to itself, (a) that it is validly existing and in good standing in the state where it was organized; (b) that it has the authority and capacity to enter into this Amendment and perform all of its obligations hereunder; (c) that all necessary action has been taken in order to authorize it to enter into and perform all of its obligations hereunder; (d) that the person executing this Amendment on its behalf is duly authorized to do so.
6
18. This Amendment shall not be valid and binding until executed and delivered by Landlord, and may be executed in counterparts, each of which shall be deemed an original and all of which, when taken together, shall constitute one and the same instrument. Any facsimile or other electronic transmittal of original signature versions of this Amendment shall be considered to have the same legal effect as execution and delivery of the original document and shall be treated in all manner and respects as the original document.
19. All undefined capitalized terms used herein without definition shall have the meanings ascribed to them in the Lease. The recitals set forth above are incorporated into this Amendment.
20. As amended hereby, the Lease is ratified and confirmed in all respects and shall continue in full force and effect.
[REMAINDER OF PAGE INTENTIONALLY LEFT BLANK]
7
IN WITNESS WHEREOF, Landlord and Tenant have duly executed this Amendment under seal as of the date first written above.
| LANDLORD: |
||
| Network Drive Owner LLC, a Delaware Limited Liability Company | ||
| By: |
NWD NC LLC, its manager |
| By: Nordblom Development Company, its Manager | ||
| By: | /s/ Ogden Hunnewell | |
| Print Name: | Ogden Hunnewell | |
| Print Title: | Executive Vice President |
| TENANT: | ||
| Exa Corporation, a Delaware corporation | ||
| By: | /s/ Richard F. Gilbody | |
| Print Name: | Richard F. Gilbody |
| Print Title: | CFO | |
| Hereunto duly authorized | ||
8
EXHIBIT A
First Floor Premises
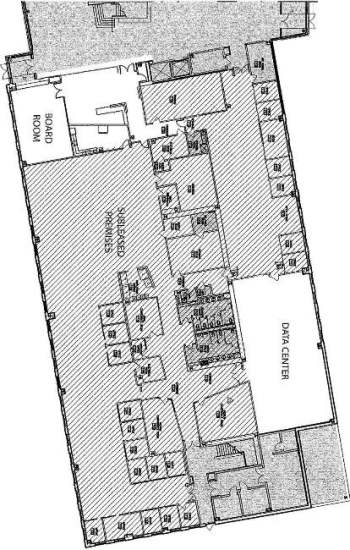
EXHIBIT B
Second Floor Premises
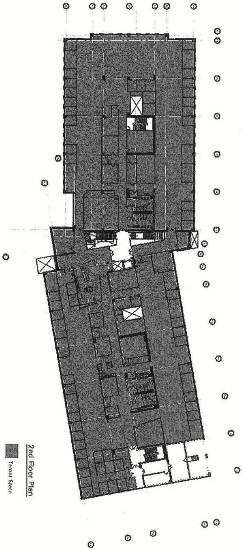
Exhibit 31.1
CERTIFICATION
I, Stephen A. Remondi, certify that:
| 1. | I have reviewed this Quarterly Report on Form 10-Q of Exa Corporation; |
| 2. | Based on my knowledge, this report does not contain any untrue statement of a material fact or omit to state a material fact necessary to make the statements made, in light of the circumstances under which such statements were made, not misleading with respect to the period covered by this report; |
| 3. | Based on my knowledge, the financial statements, and other financial information included in this report, fairly present in all material respects the financial condition, results of operations and cash flows of the registrant as of, and for, the periods presented in this report; |
| 4. | The registrant’s other certifying officer and I are responsible for establishing and maintaining disclosure controls and procedures (as defined in Exchange Act Rules 13a-15(e) and 15d-15(e)) and internal control over financial reporting (as defined in Exchange Act Rules 13a-15(f) and 15d-15(f)) for the registrant and have: |
| a. | Designed such disclosure controls and procedures, or caused such disclosure controls and procedures to be designed under our supervision, to ensure that material information relating to the registrant, including its consolidated subsidiaries, is made known to us by others within those entities, particularly during the period in which this report is being prepared; |
| b. | Designed such internal control over financial reporting, or caused such internal control over financial reporting to be designed under our supervision, to provide reasonable assurance regarding the reliability of financial reporting and the preparation of financial statements for external purposes in accordance with generally accepted accounting principles; |
| c. | Evaluated the effectiveness of the registrant’s disclosure controls and procedures and presented in this report our conclusions about the effectiveness of the disclosure controls and procedures, as of the end of the period covered by this report based on such evaluation; and |
| d. | Disclosed in this report any change in the registrant’s internal control over financial reporting that occurred during the registrant’s most recent fiscal quarter (the registrant’s fourth fiscal quarter in the case of an annual report) that has materially affected, or is reasonably likely to materially affect, the registrant’s internal control over financial reporting. |
| 5. | The registrant’s other certifying officer and I have disclosed, based on our most recent evaluation of internal control over financial reporting, to the registrant’s auditors and to the audit committee of the registrant’s board of directors (or persons performing the equivalent functions): |
| a. | All significant deficiencies and material weaknesses in the design or operation of internal control over financial reporting which are reasonably likely to adversely affect the registrant’s ability to record, process, summarize and report financial information; and |
| b. | Any fraud, whether or not material, that involves management or other employees who have a significant role in the registrant’s internal control over financial reporting. |
| By: | /s/ Stephen A. Remondi | |
| Stephen A. Remondi | ||
| President and Chief Executive Officer (Principal Executive Officer) | ||
| Date: | September 1, 2015 | |
Exhibit 31.2
CERTIFICATION
I, Richard F. Gilbody, certify that:
| 1. | I have reviewed this Quarterly Report on Form 10-Q of Exa Corporation; |
| 2. | Based on my knowledge, this report does not contain any untrue statement of a material fact or omit to state a material fact necessary to make the statements made, in light of the circumstances under which such statements were made, not misleading with respect to the period covered by this report; |
| 3. | Based on my knowledge, the financial statements, and other financial information included in this report, fairly present in all material respects the financial condition, results of operations and cash flows of the registrant as of, and for, the periods presented in this report; |
| 4. | The registrant’s other certifying officer and I are responsible for establishing and maintaining disclosure controls and procedures (as defined in Exchange Act Rules 13a-15(e) and 15d-15(e)) and internal control over financial reporting (as defined in Exchange Act Rules 13a-15(f) and 15d-15(f)) for the registrant and have: |
| a. | Designed such disclosure controls and procedures, or caused such disclosure controls and procedures to be designed under our supervision, to ensure that material information relating to the registrant, including its consolidated subsidiaries, is made known to us by others within those entities, particularly during the period in which this report is being prepared; |
| b. | Designed such internal control over financial reporting, or caused such internal control over financial reporting to be designed under our supervision, to provide reasonable assurance regarding the reliability of financial reporting and the preparation of financial statements for external purposes in accordance with generally accepted accounting principles; |
| c. | Evaluated the effectiveness of the registrant’s disclosure controls and procedures and presented in this report our conclusions about the effectiveness of the disclosure controls and procedures, as of the end of the period covered by this report based on such evaluation; and |
| d. | Disclosed in this report any change in the registrant’s internal control over financial reporting that occurred during the registrant’s most recent fiscal quarter (the registrant’s fourth fiscal quarter in the case of an annual report) that has materially affected, or is reasonably likely to materially affect, the registrant’s internal control over financial reporting. |
| 5. | The registrant’s other certifying officer and I have disclosed, based on our most recent evaluation of internal control over financial reporting, to the registrant’s auditors and to the audit committee of the registrant’s board of directors (or persons performing the equivalent functions): |
| a. | All significant deficiencies and material weaknesses in the design or operation of internal control over financial reporting which are reasonably likely to adversely affect the registrant’s ability to record, process, summarize and report financial information; and |
| b. | Any fraud, whether or not material, that involves management or other employees who have a significant role in the registrant’s internal control over financial reporting. |
| By: | /s/ Richard F. Gilbody | |
| Richard F. Gilbody | ||
| Chief Financial Officer (Principal Financial Officer) | ||
| Date: | September 1, 2015 | |
Exhibit 32.1
STATEMENT REQUIRED BY 18 U.S.C. SECTION 1350, AS ADOPTED PURSUANT TO
SECTION 906 OF THE SARBANES-OXLEY ACT OF 2002
This certificate is being delivered pursuant to the requirements of Section 1350 of Chapter 63 (Mail Fraud) of Title 18 (Crimes and Criminal Procedures) of the United States Code and shall not be relied on by any person for any other purpose.
In connection with the Quarterly Report on Form 10-Q of Exa Corporation (the “Company”) for the period ended July 31, 2015, as filed with the Securities and Exchange Commission on the date hereof (the “Report”), the undersigned, Stephen A. Remondi, President, Chief Executive Officer and Director of the Company, certifies that:
| • | the Report fully complies with the requirements of section 13(a) or 15(d) of the Securities Exchange Act of 1934; and |
| • | the information contained in the Report fairly presents, in all material respects, the financial condition and results of operations of the Company. |
Date: September 1, 2015
| /s/ Stephen A. Remondi |
| Stephen A. Remondi |
| President and Chief Executive Officer |
| (Principal Executive Officer) |
The foregoing certification is being furnished with the Company’s Quarterly Report on Form 10-Q for the period ended July 31, 2015, pursuant to 18 U.S.C. Section 1350. It is not being filed for purposes of Section 18 of the Securities Exchange Act of 1934, as amended, and it is not to be incorporated by reference into any filing of the Company, whether made before or after the date hereof, regardless of any general information language in such filing.
Exhibit 32.2
STATEMENT REQUIRED BY 18 U.S.C. SECTION 1350, AS ADOPTED PURSUANT TO
SECTION 906 OF THE SARBANES-OXLEY ACT OF 2002
This certificate is being delivered pursuant to the requirements of Section 1350 of Chapter 63 (Mail Fraud) of Title 18 (Crimes and Criminal Procedures) of the United States Code and shall not be relied on by any person for any other purpose.
In connection with the Quarterly Report on Form 10-Q of Exa Corporation (the “Company”) for the period ended July 31, 2015, as filed with the Securities and Exchange Commission on the date hereof (the “Report”), the undersigned, Richard F. Gilbody, Chief Financial Officer of the Company, certifies that:
| • | the Report fully complies with the requirements of section 13(a) or 15(d) of the Securities Exchange Act of 1934; and |
| • | the information contained in the Report fairly presents, in all material respects, the financial condition and results of operations of the Company. |
Date: September 1, 2015
| /s/ Richard F. Gilbody |
| Richard F. Gilbody |
| Chief Financial Officer |
| (Principal Financial Officer) |
The foregoing certification is being furnished with the Company’s Quarterly Report on Form 10-Q for the period ended July 31, 2015, pursuant to 18 U.S.C. Section 1350. It is not being filed for purposes of Section 18 of the Securities Exchange Act of 1934, as amended, and it is not to be incorporated by reference into any filing of the Company, whether made before or after the date hereof, regardless of any general information language in such filing.
Serious News for Serious Traders! Try StreetInsider.com Premium Free!
You May Also Be Interested In
- House of Streams, Presented by SHRIMP.co (Stream House Media Productions Ltd.), Premieres as an Original Reality Series in Spring 2024
- NILIT Announces Strategic Expansions, Including a Joint Venture with Shenma in China
- CO280 and Aker Carbon Capture collaborate with Microsoft to scale-up permanent, affordable carbon removal in US and Canada
Create E-mail Alert Related Categories
SEC FilingsSign up for StreetInsider Free!
Receive full access to all new and archived articles, unlimited portfolio tracking, e-mail alerts, custom newswires and RSS feeds - and more!
