

Form 10-Q CYS Investments, Inc. For: Mar 31
 Tweet
Tweet Share
ShareUNITED STATES
SECURITIES AND EXCHANGE COMMISSION
Washington, D.C. 20549
__________________________________
FORM 10-Q
__________________________________
x | QUARTERLY REPORT PURSUANT TO SECTION 13 OR 15(d) OF THE SECURITIES EXCHANGE ACT OF 1934 |
For the quarterly period ended March 31, 2015
OR
¨ | TRANSITION REPORT PURSUANT TO SECTION 13 OR 15(d) OF THE SECURITIES EXCHANGE ACT OF 1934 |
For the transition period from to .
Commission file number 001-33740
__________________________________

CYS Investments, Inc.
(Exact name of registrant as specified in its charter)
__________________________________
Maryland | 20-4072657 |
(State or other jurisdiction of incorporation or organization) | (IRS Employer Identification No.) |
890 Winter Street, Suite 200, Waltham, Massachusetts | 02451 |
(Address of principal executive offices) | (Zip Code) |
(617) 639-0440
(Registrant’s telephone number, including area code)
__________________________________
Indicate by check mark whether the registrant (1) has filed all reports required to be filed by Section 13 or 15(d) of the Securities Exchange Act of 1934 during the preceding 12 months (or for such shorter period that the registrant was required to file such reports), and (2) has been subject to such filing requirements for the past 90 days. Yes x No ¨
Indicate by check mark whether the registrant has submitted electronically and posted on its corporate Web site, if any, every Interactive Data File required to be submitted and posted pursuant to Rule 405 of Regulation S-T during the preceding 12 months (or for such shorter period that the registrant was required to submit and post such files). Yes x No ¨
Indicate by check mark whether the registrant is a large accelerated filer, an accelerated filer, a non-accelerated filer, or a smaller reporting company. See the definitions of “large accelerated filer,” “accelerated filer” and “smaller reporting company” in Rule 12b-2 of the Exchange Act. Check one:
Large accelerated filer | x | Accelerated filer | ¨ |
Non-accelerated filer | ¨ (Do not check if a smaller reporting company) | Smaller reporting company | ¨ |
Indicate by check mark whether the registrant is a shell company (as defined in Rule 12b-2 of the Exchange Act). Yes ¨ No x
Indicate the number of shares outstanding of each of the issuer’s classes of common stock, as of the latest practicable date.
Class | April 24, 2015 |
Common Stock ($0.01 par value) | 158,135,786 |
__________________________________
Table of Contents
Page | ||
PART I. Financial Information
Item 1. Financial Statements
CYS INVESTMENTS, INC.
CONSOLIDATED BALANCE SHEETS (UNAUDITED)
(In thousands, except per share numbers) | March 31, 2015 | December 31, 2014* | |||||
Assets: | |||||||
Investments in securities, at fair value (including pledged assets of $11,309,980 and $11,908,922, respectively) | $ | 15,065,303 | $ | 14,609,532 | |||
Derivative assets, at fair value | 91,604 | 148,284 | |||||
Cash | 7,170 | 4,323 | |||||
Receivable for securities sold and principal repayments | 345,006 | 83,643 | |||||
Interest receivable | 37,314 | 37,894 | |||||
Receivable for cash pledged as collateral | 37,216 | 11,104 | |||||
Other assets | 11,408 | 1,083 | |||||
Total assets | $ | 15,595,021 | $ | 14,895,863 | |||
Liabilities and stockholders' equity: | |||||||
Liabilities: | |||||||
Repurchase agreements | $ | 10,204,901 | $ | 11,289,559 | |||
FHLB advances | 510,000 | — | |||||
Derivative liabilities, at fair value | 38,502 | 16,007 | |||||
Payable for securities purchased | 2,767,042 | 1,505,481 | |||||
Payable for cash received as collateral | 48,229 | 72,771 | |||||
Distribution payable | 51,844 | 4,410 | |||||
Accrued interest payable (including accrued interest on repurchase agreements and FHLB advances of $3,574 and $5,334, respectively) | 31,422 | 27,208 | |||||
Accrued expenses and other liabilities | 2,445 | 5,259 | |||||
Total liabilities | $ | 13,654,385 | $ | 12,920,695 | |||
Stockholders' equity: | |||||||
Preferred Stock, $25.00 par value, 50,000 shares authorized: | |||||||
7.75% Series A Cumulative Redeemable Preferred Stock, (3,000 shares issued and outstanding, respectively, $75,000 in aggregate liquidation preference) | $ | 72,369 | $ | 72,369 | |||
7.50% Series B Cumulative Redeemable Preferred Stock, (8,000 shares issued and outstanding, respectively, $200,000 in aggregate liquidation preference) | 193,531 | 193,531 | |||||
Common Stock, $0.01 par value, 500,000 shares authorized (158,114 and 161,850 shares issued and outstanding, respectively) | 1,581 | 1,618 | |||||
Additional paid in capital | 2,012,697 | 2,049,152 | |||||
Accumulated deficit | (339,542 | ) | (341,502 | ) | |||
Total stockholders' equity | $ | 1,940,636 | $ | 1,975,168 | |||
Total liabilities and stockholders' equity | $ | 15,595,021 | $ | 14,895,863 | |||
__________________
* Derived from audited financial statements.
See Notes to interim consolidated financial statements.
1
CYS INVESTMENTS, INC.
CONSOLIDATED STATEMENTS OF OPERATIONS (UNAUDITED)
Three Months Ended March 31, | |||||||
(In thousands, except per share numbers) | 2015 | 2014 | |||||
Interest income: | |||||||
Interest income from Agency RMBS | $ | 80,060 | $ | 80,186 | |||
Other interest income | 790 | 4,181 | |||||
Total interest income | 80,850 | 84,367 | |||||
Interest expense: | |||||||
Repurchase agreement and FHLB advances interest expense | 9,642 | 9,423 | |||||
Swap and cap interest expense | 27,468 | 18,923 | |||||
Total interest expense | 37,110 | 28,346 | |||||
Net interest income | 43,740 | 56,021 | |||||
Other income (loss): | |||||||
Net realized gain (loss) on investments | 18,253 | 16,670 | |||||
Net unrealized gain (loss) on investments | 75,689 | 89,234 | |||||
Net realized gain (loss) on termination of swap and cap contracts | (2,568 | ) | (9,323 | ) | |||
Net unrealized gain (loss) on swap and cap contracts | (74,800 | ) | (16,240 | ) | |||
Other income | 40 | 119 | |||||
Total other income (loss) | 16,614 | 80,460 | |||||
Expenses: | |||||||
Compensation and benefits | 3,554 | 3,629 | |||||
General, administrative and other | 2,203 | 2,165 | |||||
Total expenses | 5,757 | 5,794 | |||||
Net income (loss) | $ | 54,597 | $ | 130,687 | |||
Dividends on preferred stock | (5,203 | ) | (5,203 | ) | |||
Net income (loss) available to common stockholders | $ | 49,394 | $ | 125,484 | |||
Net income (loss) per common share basic & diluted | $ | 0.31 | $ | 0.78 | |||
Dividends declared per common share | $ | 0.30 | $ | 0.32 | |||
____________
See Notes to interim consolidated financial statements.
2
CYS INVESTMENTS, INC.
CONSOLIDATED STATEMENT OF CHANGES IN STOCKHOLDERS' EQUITY (UNAUDITED)
Cumulative Redeemable Preferred Stock | ||||||||||||||||||||||||
(in thousands) | Series A | Series B | Common Stock Par Value | Additional Paid-in Capital | Accumulated Deficit | Total | ||||||||||||||||||
Balance, December 31, 2014 | $ | 72,369 | $ | 193,531 | $ | 1,618 | $ | 2,049,152 | $ | (341,502 | ) | $ | 1,975,168 | |||||||||||
Net income (loss) | — | — | — | — | 54,597 | 54,597 | ||||||||||||||||||
Issuance of common stock | — | — | 4 | (4 | ) | — | — | |||||||||||||||||
Amortization of share based compensation | — | — | — | 954 | — | 954 | ||||||||||||||||||
Repurchase and cancellation of common stock | — | — | (41 | ) | (37,405 | ) | — | (37,446 | ) | |||||||||||||||
Preferred dividends | — | — | — | — | (5,203 | ) | (5,203 | ) | ||||||||||||||||
Common dividends | — | — | — | — | (47,434 | ) | (47,434 | ) | ||||||||||||||||
Balance, March 31, 2015 | $ | 72,369 | $ | 193,531 | $ | 1,581 | $ | 2,012,697 | $ | (339,542 | ) | $ | 1,940,636 | |||||||||||
__________________
See Notes to interim consolidated financial statements.
3
CYS INVESTMENTS, INC.
CONSOLIDATED STATEMENTS OF CASH FLOWS (UNAUDITED)
Three Months Ended March 31, | |||||||
(In thousands) | 2015 | 2014 | |||||
Cash flows from operating activities: | |||||||
Net income (loss) | $ | 54,597 | $ | 130,687 | |||
Adjustments to reconcile net income (loss) to net cash provided by (used in) operating activities: | |||||||
Amortization of share based compensation | 954 | 1,115 | |||||
Amortization of premiums and discounts on investment securities | 21,450 | 10,303 | |||||
Amortization of premiums on interest rate cap contracts | 4,375 | 6,254 | |||||
Net realized (gain) loss on investments | (18,253 | ) | (16,670 | ) | |||
Net unrealized (gain) loss on investments | (75,689 | ) | (89,234 | ) | |||
Net unrealized (gain) loss on swap and cap contracts | 74,800 | 16,240 | |||||
Change in assets and liabilities: | |||||||
Interest receivable | 580 | 2,747 | |||||
Other assets | (10,325 | ) | 274 | ||||
Accrued interest payable | 4,214 | (9,631 | ) | ||||
Accrued expenses and other liabilities | (2,814 | ) | (2,602 | ) | |||
Net cash provided by (used in) operating activities | 53,889 | 49,483 | |||||
Cash flows from investing activities: | |||||||
Purchase of investment securities | (6,863,933 | ) | (7,421,216 | ) | |||
Proceeds from disposition of investment securities | 6,018,216 | 7,788,084 | |||||
Proceeds from paydowns of investment securities | 462,438 | 279,846 | |||||
Change in assets and liabilities: | |||||||
Receivable for securities sold and principal repayments | (261,363 | ) | 425,651 | ||||
Payable for securities purchased | 1,261,561 | 84,777 | |||||
Receivable for cash pledged as collateral | (26,112 | ) | — | ||||
Payable for cash received as collateral | (24,542 | ) | 18 | ||||
Net cash provided by (used in) investing activities | 566,265 | 1,157,160 | |||||
Cash flows from financing activities: | |||||||
Proceeds from repurchase agreements | 23,743,739 | 21,193,497 | |||||
Repayments of repurchase agreements | (24,828,397 | ) | (22,386,399 | ) | |||
Proceeds from FHLB advances | 1,010,000 | — | |||||
Repayments of FHLB advances | (500,000 | ) | — | ||||
Net payments from repurchase of common stock | (37,446 | ) | (133 | ) | |||
Distributions paid | (5,203 | ) | (5,204 | ) | |||
Net cash used in financing activities | (617,307 | ) | (1,198,239 | ) | |||
Net increase (decrease) in cash | 2,847 | 8,404 | |||||
Cash - Beginning of period | 4,323 | 4,992 | |||||
Cash - End of period | $ | 7,170 | $ | 13,396 | |||
Supplemental disclosures of cash flow information: | |||||||
Interest paid | $ | 28,522 | $ | 41,220 | |||
Supplemental disclosures of non-cash flow information: | |||||||
Distributions declared, not yet paid | $ | 51,844 | $ | 56,258 | |||
__________________
See Notes to interim consolidated financial statements.
4
CYS INVESTMENTS, INC.
NOTES TO CONDOLIDATED FINANCIAL STATEMENTS (UNAUDITED)
March 31, 2015
These footnotes to our accompanying financial statements in this interim report should be read in conjunction with the footnotes to our Annual Report on Form 10-K, filed with the SEC on February 17, 2015 (the "2014 Annual Report").
1. ORGANIZATION
CYS Investments, Inc. (the "Company" "we", "us", and "our,") was formed as a Maryland corporation on January 3, 2006, and commenced operations on February 10, 2006. The Company has elected to be taxed and intends to continue to qualify as a real estate investment trust ("REIT") and is required to comply with the provisions of the Internal Revenue Code of 1986, as amended (the "Code"), with respect thereto. The Company has primarily purchased residential mortgage-backed securities that are issued and the principal and interest of which are guaranteed by a federally chartered corporation ("Agency RMBS"), such as the Federal National Mortgage Association ("Fannie Mae") or the Federal Home Loan Mortgage Corporation ("Freddie Mac"), or an agency of the U.S. government such as the Government National Mortgage Association ("Ginnie Mae"), and debt securities issued by the United States Department of Treasury ("U.S. Treasuries"). The Company may also purchase collateralized mortgage obligations issued by a government agency or government-sponsored entity that are collateralized by Agency RMBS ("CMOs"), or securities issued by a government sponsored entity that are not backed by collateral but, in the case of government agencies, are backed by the full faith and credit of the U.S. government, and, in the case of government sponsored entities, are backed by the integrity and creditworthiness of the issuer ("U.S. Agency Debentures").
The Company’s common stock, Series A Cumulative Redeemable Preferred Stock, $25.00 liquidation preference (the "Series A Preferred Stock"), and Series B Cumulative Redeemable Preferred Stock, $25.00 liquidation preference (the "Series B Preferred Stock"), trade on the New York Stock Exchange under the symbols "CYS," "CYS PrA" and "CYS PrB," respectively.
In March 2015, our wholly-owned captive insurance subsidiary, CYS Insurance Services, LLC ("CYS Insurance"), was granted membership in the Federal Home Loan Bank ("FHLB") of Cincinnati. The 12 regional FHLBs provide long-term and short-term secured loans, called “advances,” to their members. FHLB members may use a variety of real estate related assets, including residential mortgage loans and Agency RMBS, as collateral for advances. Membership in the FHLB permits CYS Insurance to access a variety of products and services offered by the FHLB and obligates CYS Insurance to purchase membership stock and activity stock, the latter being a percentage of the advances it obtains from the FHLB. We intend for CYS Insurance to seek advances of both short- and long-term indebtedness from the FHLB of Cincinnati.
2. SIGNIFICANT ACCOUNTING POLICIES
Basis of Presentation
The accompanying interim consolidated financial statements have been prepared in conformity with accounting principles generally accepted in the United States of America (“U.S. GAAP”) and the instructions to Securities and Exchange Commission ("SEC") Form 10-Q and Article 10, Rule 10-01 of Regulation S-X. Accordingly, the financial statements do not include all of the information and footnotes required by U.S. GAAP for complete financial statements. In the opinion of management, all adjustments (consisting of normal recurring accruals) considered necessary for a fair presentation have been included. The interim consolidated financial statements should be read in conjunction with the Company’s audited financial statements as of and for the year ended December 31, 2014, included in its 2014 Annual Report. The results for interim periods are not necessarily indicative of the results to be expected for the fiscal year.
The interim consolidated financial statements include the accounts of the Company and all of its subsidiaries. All intercompany balances and transactions have been eliminated. The interim consolidated financial statements of the Company have been prepared on the accrual basis of accounting in accordance with U.S. GAAP. The preparation of financial statements in conformity with U.S. GAAP requires management to make a number of estimates and assumptions that affect the amounts reported in the interim consolidated financial statements and accompanying footnotes. Actual results could differ from these estimates and the differences may be material.
Investments in Securities
The Company's investment securities are accounted for in accordance with Accounting Standards Codification ("ASC") 320—Investments in Debt and Equity Securities. The Company has chosen to make a fair value election pursuant to ASC 825—Financial Instruments for its securities and, therefore, our investment securities are recorded at fair market value on the consolidated balance sheets. The periodic changes in fair market value are recorded in current period earnings on the consolidated statements of operations as a component of net unrealized gain (loss) on investments. These investments generally meet the requirements to be classified as available-for-sale under ASC 320, which requires the securities to be carried at fair value on the balance sheet. Electing the fair value option permits the Company to record changes in fair value of our
5
investments in the consolidated statements of operations, which in management’s view, more appropriately reflects the results of operations for a particular reporting period as all securities activities will be recorded in a similar manner.
The Company records its transactions in securities on a trade date basis. We record realized gains and losses on securities transactions on an identified cost basis.
The Company accounts for its investment in FHLB stock as a cost method investment in "Other Assets".
Agency RMBS
The Company’s investments in Agency RMBS consist of pass-through certificates backed by fixed-rate, monthly-reset adjustable-rate loans (“ARMs”) and hybrid ARMs, the principal and interest of which are guaranteed by Fannie Mae, Freddie Mac or Ginnie Mae. Hybrid ARMs have interest rates that have an initial fixed period (typically three, five, seven or ten years) and thereafter reset at regular intervals in a manner similar to ARMs.
Forward Settling Transactions
The Company engages in forward settling transactions to purchase certain securities. The Company records forward settling transactions on the trade date, and maintains security positions such that sufficient liquid assets will be available to make payment on the settlement date for the securities purchased. The Agency RMBS purchased at the forward settlement date are typically priced at a discount to securities for settlement in the current month. Securities purchased on a forward settling basis are carried at fair value and begin earning interest on the settlement date. Gains or losses may occur on these transactions due to changes in market conditions or the failure of counterparties to perform under the contract. Along with other forward settling transactions, the Company transacts in to-be-announced (“TBA”) securities. As with other forward settling transactions, a seller agrees to issue TBAs at a future date; however, the seller does not specify the particular securities to be delivered. Instead, the Company agrees to accept any security that meets specified terms such as issuer, interest rate and terms of underlying mortgages. The Company records TBAs on the trade date utilizing information associated with the specified terms of the transaction as opposed to the specific mortgages. TBAs are carried at fair value and begin earning interest on the settlement date. Gains or losses may occur due to the fact that the actual underlying mortgages received may be more or less favorable than those anticipated by the Company. See Note 7, Pledged Assets, for disclosure regarding the fair value of collateral pledged or received on forward settling transactions.
At times, the Company may enter into TBA contracts as a means of investing in and financing Agency RMBS via “dollar roll” transactions. TBA dollar roll transactions involve moving the settlement of a TBA contract out to a later date by entering into an offsetting short position (referred to as a “pair off”), net settling the paired off positions for cash, and simultaneously purchasing a similar TBA contract for a later settlement date. The Company records such pair offs on a gross basis such that there is a sale of the original TBA and a subsequent purchase of a new TBA.
Investment Valuation
The Company has a pricing committee responsible for establishing valuation policies and procedures, as well as reviewing and approving valuations at a monthly pricing meeting. The pricing committee is composed of individuals from the accounting team, the investment team and senior management.
Agency RMBS, Agency Debentures and U.S. Treasuries are generally valued based on prices provided by third-party services, as derived from such services’ pricing models. Inputs to the models may include, but are not limited to, reported trades, executable bid and ask prices, broker quotations, prices or yields of securities with similar characteristics, benchmark curves or information pertaining to the issuer, as well as industry and economic events. The pricing services may also use a matrix approach, which considers information regarding securities with similar characteristics to determine the valuation for a security.
We generally value interest rate swaps and caps using prices provided by broker quotations. Such broker quotations are based on the present value of fixed and projected floating rate cash flows over the term of the swap contract. Future cash flows are discounted to their present value using swap rates provided by electronic data services or by brokers. No credit valuation adjustments were made in determining the fair value of the Company's interest rate swaps and caps.
Fair values of long-lived assets, including real estate, are primarily derived internally, and are based on inputs observed from sales transactions of similar assets. For real estate, fair values are also based on comparable contemporaneous sales transactions and/or discounted cash flow estimates which reflect current and projected lease profiles and available industry information about capitalization rates and expected trends in rents and occupancy.
6
All valuations from third-party pricing services or broker quotes are non-binding. We review all prices during our pricing process. To date, the Company has not adjusted any of the prices received from third-party pricing services or brokers. Our pricing review includes comparisons of similar market transactions, alternative third-party pricing services and broker quotes, or comparisons to a pricing model. To ensure the proper fair value hierarchy, the Company reviews the third-party pricing services methodology periodically to understand whether observable or unobservable inputs are being used. See Note 8, Fair Value Measurements, for a discussion of how the Company values its assets.
Interest Income
We record interest income and expense on an accrual basis. We accrue interest income based on the outstanding principal amount of the securities and their contractual terms. We amortize premium and discount using the effective interest method, and this net amortization is either accretive to or a reduction of interest income from Agency RMBS in the Company's consolidated statements of operations. The Company does not estimate prepayments when calculating the yield to maturity on Agency RMBS. We record the amount of premium or discount associated with a prepayment through interest income from Agency RMBS on our consolidated statements of operations as it occurs.
Other Assets -- Investment in FHLB Stock
The Company's subsidiary, CYS Insurance, is a member of, and owns capital stock in, the FHLB of Cincinnati. The FHLB provides CYS Insurance with credit capacity and authorizes advances based on the security of pledged Agency RMBS, provided the Company meets certain creditworthiness standards. FHLB advances, included in the "FHLB advances" line item, is a funding source for the Company of both short- and long-term indebtedness. As a condition of its membership in the FHLB, CYS Insurance is required to maintain a FHLB stock investment, both for membership and for the level of advances from the FHLB to the Company. The Company accounts for its investment in FHLB stock as a cost method investment in "Other Assets".
Repurchase Agreements and FHLB Advances
Borrowings under repurchase agreements ("repo borrowings") and FHLB advances are collateralized by the Company’s Agency RMBS and U.S. Treasuries (collectively, "Debt Securities") and carried at their amortized cost, which approximates their fair value due to their short-term nature (generally 30-90 days). The Company’s repurchase agreement counterparties are institutional dealers in fixed income securities and large financial institutions, and in the case of FHLB advances, the FHLB of Cincinnati. Collateral under repurchase agreements and FHLB advances are valued daily and counterparties may require additional collateral when the fair value of the collateral declines. Counterparties have the right to sell or repledge collateral pledged under repurchase agreements and the FHLB advances agreement. See Note 5, Repurchase Agreements.
We account for our repo borrowings and FHLB advances as short-term indebtedness under ASC 470—Debt; accordingly, these short-term instruments are accounted for in our financial statements at carrying value, or historic cost.
Interest Rate Swap and Cap Contracts
We account for our interest rate swap and cap contracts transactions under ASC 815—Derivatives and Hedging. The Company uses interest rate swaps and interest rate caps to hedge a portion of its exposure to market risks, including interest rate risk, credit risk and extension risk. The objective of our risk management strategy is to reduce fluctuations in stockholders’ equity over a range of interest rate scenarios. In particular, we attempt to manage the risk of the cost of our variable rate liabilities increasing during a period of rising interest rates.
During the term of an interest rate swap or cap, the Company makes or receives periodic payments and records unrealized gains or losses as a result of marking the swap or cap to their fair value. When the Company terminates a swap or cap, we record a realized gain or loss equal to the difference between the proceeds from (or cost of) the closing transaction and the Company's cost basis in the contract, if any. We report the periodic payments and amortization of premiums on cap contracts under interest expense in the consolidated statements of operations. Swaps involve a risk that interest rates will move contrary to the Company’s expectations, thereby increasing the Company’s payment obligation.
The Company's interest rate swap and cap contracts may be subject to a master netting arrangement ("MNA"). The Company is exposed to credit loss in the event of non-performance by the counterparty to the swap or cap limited to the fair value of collateral posted in excess of the fair value of the contract in a net liability position and the shortage of the fair value of collateral posted for the contract in a net asset position. As of March 31, 2015 and December 31, 2014, the Company did not anticipate non-performance by any counterparty. Should interest rates move unexpectedly, the Company may not achieve the anticipated benefits of the interest rate swap or cap and may realize a loss.
7
While the Company's derivative agreements generally permit for netting or setting off derivative assets and liabilities with the counterparty, the Company reports related assets and liabilities on a gross basis in our consolidated balance sheets. Derivative instruments in a gain position are reported as derivative assets at fair value and derivative instruments in a loss position are reported as derivative liabilities at fair value in our consolidated balance sheets. We record changes in fair value of our derivative instruments in net unrealized gain (loss) on swap and cap contracts in our consolidated statements of operations. Cash receipts and payments related to derivative instruments are classified in our consolidated statements of cash flows in accordance with U.S. GAAP in both the operating and investing activities sections in the Company’s consolidated statement of cash flows. See Note 4, Investments in Interest Rate Swap and Cap Contracts.
3. INVESTMENT IN SECURITIES
The available-for-sale portfolio consisted of the following as of March 31, 2015 and December 31, 2014 (in thousands):
March 31, 2015 | ||||||||||||||||
Asset Type | Amortized Cost | Gross Unrealized Loss | Gross Unrealized Gain | Fair Value | ||||||||||||
Fannie Mae Certificates | ||||||||||||||||
Fixed Rate | $ | 12,326,027 | $ | (281 | ) | $ | 201,906 | $ | 12,527,652 | |||||||
ARMs | 597,368 | (1 | ) | 8,959 | 606,326 | |||||||||||
Total Fannie Mae | 12,923,395 | (282 | ) | 210,865 | 13,133,978 | |||||||||||
Freddie Mac Certificates | ||||||||||||||||
Fixed Rate | 1,211,409 | (98 | ) | 26,432 | 1,237,743 | |||||||||||
ARMs | 119,673 | (221 | ) | 1,808 | 121,260 | |||||||||||
Total Freddie Mac | 1,331,082 | (319 | ) | 28,240 | 1,359,003 | |||||||||||
Ginnie Mae Certificates - ARMs | 61,298 | — | 1,665 | 62,963 | ||||||||||||
U.S. Treasuries | 497,553 | — | 3,781 | 501,334 | ||||||||||||
Other Investments | 6,945 | — | 1,080 | 8,025 | ||||||||||||
Total | $ | 14,820,273 | $ | (601 | ) | $ | 245,631 | $ | 15,065,303 | |||||||
December 31, 2014 | ||||||||||||||||
Fannie Mae Certificates | ||||||||||||||||
Fixed Rate | $ | 11,356,716 | $ | (2,984 | ) | $ | 158,571 | $ | 11,512,303 | |||||||
ARMs | 1,282,065 | (13,144 | ) | 4,449 | 1,273,370 | |||||||||||
Total Fannie Mae | 12,638,781 | (16,128 | ) | 163,020 | 12,785,673 | |||||||||||
Freddie Mac Certificates | ||||||||||||||||
Fixed Rate | 1,183,764 | — | 25,769 | 1,209,533 | ||||||||||||
ARMs | 394,726 | (6,753 | ) | 1,144 | 389,117 | |||||||||||
Total Freddie Mac | 1,578,490 | (6,753 | ) | 26,913 | 1,598,650 | |||||||||||
Ginnie Mae Certificates - ARMs | 66,390 | — | 1,743 | 68,133 | ||||||||||||
U.S. Treasuries | 149,585 | (534 | ) | — | 149,051 | |||||||||||
Other Investments | 6,945 | — | 1,080 | 8,025 | ||||||||||||
Total | $ | 14,440,191 | $ | (23,415 | ) | $ | 192,756 | $ | 14,609,532 | |||||||
The following table presents the gross unrealized loss and fair values of our available-for-sale Agency RMBS by length of time that such securities have been in a continuous unrealized loss position as of March 31, 2015 and December 31, 2014 (in thousands):
8
Unrealized loss positions for | ||||||||||||||||||||||||
Less than 12 Months | Greater than 12 months | Total | ||||||||||||||||||||||
As of | Fair value | Unrealized loss | Fair value | Unrealized loss | Fair value | Unrealized loss | ||||||||||||||||||
March 31, 2015 | $ | 258,991 | $ | (380 | ) | $ | 97,643 | $ | (221 | ) | $ | 356,634 | $ | (601 | ) | |||||||||
December 31, 2014 | 259,291 | (577 | ) | 1,494,884 | (22,838 | ) | 1,754,175 | (23,415 | ) | |||||||||||||||
The following table is a summary of our net realized gain (loss) from the sale of available-for-sale investments for the three months ended March 31, 2015 and 2014 (in thousands):
Three Months Ended March 31, | |||||||
2015 | 2014 | ||||||
Available-for-sale investments, at cost | $ | 5,999,963 | $ | 7,771,414 | |||
Proceeds from available-for-sale investments sold | 6,018,216 | 7,788,084 | |||||
Net gain on sale of available-for-sale investments | $ | 18,253 | $ | 16,670 | |||
Gross gain on sale of available-for-sale investments | $ | 33,979 | $ | 51,142 | |||
Gross loss on sale of available-for-sale investments | (15,726 | ) | (34,472 | ) | |||
Net gain on sale of available-for-sale investments | $ | 18,253 | $ | 16,670 | |||
The components of the carrying value of available-for-sale securities at March 31, 2015 and December 31, 2014 are presented below. The premium purchase price is due to the average coupon interest rates on these investments being higher than prevailing market rates, and conversely, the discount purchase price is due to the average coupon interest rates on these investments being lower than prevailing market rates.
(in thousands) | March 31, 2015 | December 31, 2014 | ||||||
Principal balance | $ | 14,244,501 | $ | 13,887,897 | ||||
Unamortized premium | 578,370 | 552,869 | ||||||
Unamortized discount | (2,598 | ) | (575 | ) | ||||
Gross unrealized gains | 245,631 | 192,756 | ||||||
Gross unrealized losses | (601 | ) | (23,415 | ) | ||||
Fair value | $ | 15,065,303 | $ | 14,609,532 | ||||
Our weighted-average coupon interest rate on the Company's Debt Securities as of March 31, 2015 and December 31, 2014 was 3.38% and 3.39%, respectively. Actual maturities of Agency RMBS are generally shorter than stated contractual maturities (which range up to 30 years), as they are affected by the contractual lives of the underlying mortgages, periodic payments and prepayments of principal.
As of March 31, 2015, the range of final contractual maturity of the Company’s Agency RMBS portfolio was between 2024 and 2045 and the final maturity of the Company's U.S. Treasuries was between 2018 and 2020. As of December 31, 2014, the range of final contractual maturity of the Company’s Agency RMBS portfolio was between 2024 and 2045 the final maturity of the Company's U.S. Treasuries was 2019.
Credit Risk
The Company believes it has minimal exposure to credit losses on its investment securities assets at March 31, 2015 and December 31, 2014 because it owns principally Debt Securities. Principal and interest payments on Agency RMBS are guaranteed by Freddie Mac and Fannie Mae, while principal and interest payments on Ginnie Mae RMBS and U.S. Treasuries are backed by the full faith and credit of the U.S. government. In September 2008, both Freddie Mac and Fannie Mae were placed in the conservatorship of the U.S. government. On August 5, 2011, Standard & Poor’s ("S&P") downgraded the U.S. government’s credit rating for the first time to AA+. Fitch Ratings Inc. ("Fitch") announced on October 15, 2013 that it had placed the U.S. government's credit rating on "negative watch". This negative watch was changed to "stable" on March 21, 2014.
9
As of March 31, 2015, S&P has maintained its AA+ rating, while Fitch and Moody's rated the U.S. government AAA and Aaa, respectively. Because Fannie Mae and Freddie Mac are still in U.S. government conservatorship, the implied credit ratings of Agency RMBS were similarly rated. While the conservatorship, ratings downgrade and ratings watch appear not to have had a significant impact on the fair value of the Agency RMBS or U.S. Treasuries in the Company’s portfolio, these developments increased the uncertainty regarding the credit risk of Debt Securities.
4. INVESTMENTS IN INTEREST RATE SWAP AND CAP CONTRACTS
With the intent of managing our interest rate exposure, the Company enters into interest rate swap and cap contracts. The Company had the following activity in interest rate swap and cap transactions during the three months ended March 31, 2015 and 2014 (in thousands):
Three Months Ended March 31, 2015 | Three Months Ended March 31, 2014 | |||||||||||||
Trade Date | Transaction | Notional | Trade Date | Transaction | Notional | |||||||||
January 2015 | Terminated | $ | (400,000 | ) | February 2014 | Terminated | $ | (500,000 | ) | |||||
January 2015 | Opened | 500,000 | Net Decrease | $ | (500,000 | ) | ||||||||
Net Increase | $ | 100,000 | ||||||||||||
As of March 31, 2015 and December 31, 2014, the Company had pledged Debt Securities with a fair value of $80.5 million and $60.9 million, respectively, as collateral on interest rate swap and cap contracts. As of March 31, 2015, the Company had Debt Securities of $34.6 million and cash of $47.7 million pledged to it as collateral for its interest rate swap and cap contracts. As of December 31, 2014, the Company had Debt Securities of $47.2 million and cash of $72.0 million pledged to it as collateral for its interest rate cap contracts. See Note 7, Pledged Assets. Below is a summary of our interest rate swap and cap contracts open as of March 31, 2015 and December 31, 2014 (in thousands):
Derivatives not designated as hedging instruments under ASC 815 | ||||||||||
Interest Rate Swap Contracts | Notional | Fair Value | Consolidated Balance Sheets | |||||||
March 31, 2015 | $ | 4,000,000 | $ | (38,502 | ) | Derivative liabilities, at fair value | ||||
March 31, 2015 | 3,750,000 | 11,333 | Derivative assets, at fair value | |||||||
December 31, 2014 | 2,600,000 | (16,007 | ) | Derivative liabilities, at fair value | ||||||
December 31, 2014 | 5,050,000 | 40,611 | Derivative assets, at fair value | |||||||
Interest Rate Cap Contracts | Notional | Fair Value | Consolidated Balance Sheets | |||||||
March 31, 2015 | $ | 2,500,000 | $ | 80,271 | Derivative assets, at fair value | |||||
December 31, 2014 | 2,500,000 | 107,673 | Derivative assets, at fair value | |||||||
The following table presents information about the net realized and unrealized gain and loss on swap and cap contracts for the three months ended March 31, 2015 and 2014 on the Company's interest rate swap and cap contracts not designated as hedging instruments under ASC 815 (in thousands):
Amount Recognized in Income on Derivatives | ||||||||||
Three Months Ended March 31, | ||||||||||
Derivative Type | Location of Gain or (Loss) Recognized in Income on Derivative | 2015 | 2014 | |||||||
Interest rate swaps and caps | Net realized gain (loss) on termination of swap and cap contracts | $ | (2,568 | ) | $ | (9,323 | ) | |||
Interest rate swaps and caps | Net unrealized gain (loss) on swap and cap contracts | (74,800 | ) | (16,240 | ) | |||||
Interest rate swaps and caps | Total recognized in income on derivatives | $ | (77,368 | ) | $ | (25,563 | ) | |||
We continue to reposition our hedges, and in January 2015 entered into a 7-year $500 million notional swap at a pay rate of 2.15%, cancelable in January 2016, and at the same time we terminated a 7-year $400 million notional interest rate swap at a pay rate of 2.416%, cancelable in June 2015.
10
5. REPURCHASE AGREEMENTS AND FHLB ADVANCES
The Company leverages its portfolio through repo borrowings and FHLB advances. Each of the Company's repo borrowings bear interest at a floating rate based on a spread above or below London Interbank Offered Rate ("LIBOR"). The interest rates for FHLB advances are set by the FHLB of Cincinnati. The fair value of repo borrowings and FHLB advances approximates their carrying amount due to the short-term nature of these financial instruments.
Certain information with respect to the Company’s repo borrowings and FHLB advances outstanding at the balance sheet date is summarized in the table below. Each of the repo borrowings and the FHLB advances are contractually due in one year or less.
(in thousands) | March 31, 2015 | December 31, 2014 | |||||
Outstanding repurchase agreements | $ | 10,204,901 | $ | 11,289,559 | |||
Outstanding FHLB advances | $ | 510,000 | $ | — | |||
Interest accrued thereon | $ | 3,574 | $ | 5,334 | |||
Weighted-average borrowing rate(1) | 0.34 | % | 0.35 | % | |||
Weighted-average remaining maturity (in days) | 43.6 | 28.2 | |||||
Fair value of the collateral(2) | $ | 11,212,170 | $ | 11,842,427 | |||
__________________
(1) | The weighted-average borrowing rate as of March 31, 2015 was determined as set forth in the table below. |
Collateral | Borrowing amount | Rate | ||||
Agency RMBS | $ | 10,243,805 | 0.36 | % | ||
U.S. Treasuries | 471,096 | (0.04 | )% | |||
Total / weighted-average borrowing rate | $ | 10,714,901 | 0.34 | % | ||
(2) | Collateral for repo borrowings and FHLB advances consisted of Agency RMBS and U.S. Treasuries. |
At March 31, 2015 and December 31, 2014, the Company had no repo borrowings or FHLB advances where the amount at risk with an individual counterparty exceeded 1.6% and 1.6% of stockholders' equity, respectively. In addition, we had no repo borrowings or FHLB advances with any counterparty that exceeded 4% of our total assets.
6. COMMITMENTS AND CONTINGENCIES
The Company enters into certain agreements that contain a variety of indemnifications, principally with broker dealers. As of March 31, 2015 and December 31, 2014, no claims have been asserted under these indemnification agreements. Accordingly, the Company has no liabilities recorded for these agreements as of March 31, 2015 and December 31, 2014.
7. PLEDGED ASSETS
Assets Pledged to Counterparties
The following tables summarize our assets pledged as collateral under our repo borrowings, FHLB advances, and derivative agreements by type, including securities pledged related to securities purchased or sold but not yet settled, as of March 31, 2015 and December 31, 2014 (in thousands):
March 31, 2015 | ||||||||||||||||
Assets Pledged to Counterparties | Repurchase Agreements | Derivative Instruments | Forward Settling Trades (TBAs) | Total | ||||||||||||
Agency RMBS - fair value | $ | 10,752,304 | $ | 56,339 | $ | 991 | $ | 10,809,634 | ||||||||
U.S. Treasuries - fair value | 476,142 | 24,204 | — | 500,346 | ||||||||||||
Accrued interest on pledged securities | 29,790 | 245 | 2 | 30,037 | ||||||||||||
Cash | — | 37,216 | — | 37,216 | ||||||||||||
Total | $ | 11,258,236 | $ | 118,004 | $ | 993 | $ | 11,377,233 | ||||||||
11
December 31, 2014 | ||||||||||||||||
Assets Pledged to Counterparties | Repurchase Agreements | Derivative Instruments | Forward Settling Trades (TBAs) | Total | ||||||||||||
Agency RMBS - fair value | $ | 11,697,532 | $ | 42,894 | $ | 1,453 | $ | 11,741,879 | ||||||||
U.S. Treasuries - fair value | 149,051 | 17,992 | — | 167,043 | ||||||||||||
Accrued interest on pledged securities | 31,475 | 168 | 3 | 31,646 | ||||||||||||
Cash | — | 11,104 | — | 11,104 | ||||||||||||
Total | $ | 11,878,058 | $ | 72,158 | $ | 1,456 | $ | 11,951,672 | ||||||||
Assets Pledged from Counterparties
As the estimated fair value of our investment securities pledged as collateral increases due to changes in interest rates or other factors, we may require counterparties to release collateral back to us, which may be in the form of identical securities, similar securities, or cash. As of March 31, 2015 and December 31, 2014, we also had assets pledged to us as collateral under our repurchase and derivative agreements summarized in the tables below (in thousands):
March 31, 2015 | ||||||||||||||||
Assets Pledged to CYS | Repurchase Agreements | Derivative Instruments | Forward Settling Trades (TBAs) | Total | ||||||||||||
Agency RMBS - fair value | $ | 5,154 | $ | 15,787 | $ | 646 | $ | 21,587 | ||||||||
U.S. Treasuries - fair value | 11,122 | 18,805 | — | 29,927 | ||||||||||||
Accrued interest on pledged securities | 82 | 85 | 2 | 169 | ||||||||||||
Cash | — | 47,670 | 559 | 48,229 | ||||||||||||
Total | $ | 16,358 | $ | 82,347 | $ | 1,207 | $ | 99,912 | ||||||||
December 31, 2014 | ||||||||||||||||
Assets Pledged to CYS | Repurchase Agreements | Derivative Instruments | Forward Settling Trades (TBAs) | Total | ||||||||||||
Agency RMBS - fair value | $ | 3,464 | $ | 22,112 | $ | 3,225 | $ | 28,801 | ||||||||
U.S. Treasuries - fair value | 692 | 25,115 | — | 25,807 | ||||||||||||
Accrued interest on pledged securities | 13 | 142 | 9 | 164 | ||||||||||||
Cash | — | 71,980 | 791 | 72,771 | ||||||||||||
Total | $ | 4,169 | $ | 119,349 | $ | 4,025 | $ | 127,543 | ||||||||
Cash collateral received is recognized in "Cash" with a corresponding amount recognized in "Payable for cash received as collateral" on the accompanying interim consolidated balance sheets. Securities collateral received from counterparties is disclosed as a component of our liquidity amount in Note 4, Investment in Interest Rate Swap and Cap Contracts.
Cash and Debt Securities we pledge as collateral under our derivatives agreements are included in "Cash" and "Investment in securities, at fair value" on our consolidated balance sheets.
Offsetting Assets and Liabilities
Certain of our repurchase agreements and derivative transactions are governed by underlying agreements that generally provide for a right of set-off under master netting arrangements (or similar agreements), including in the event of default or in the event of bankruptcy of either party to the transactions. Under U.S. GAAP, if the Company has a valid right of set-off, it may offset the related asset and liability and report the net amount. However, the Company reports amounts subject to its Master Repurchase Agreements (“MRA”s) and International Standard Derivative Association ("ISDA") Agreements in the consolidated balance sheets on a gross basis without regard to such rights of offset.
12
At March 31, 2015 and December 31, 2014, the Company's derivative assets and liabilities (by type) are as follows (in thousands):
March 31, 2015 | Assets | Liabilities | ||||||
Interest rate swap contracts | $ | 11,333 | $ | 38,502 | ||||
Interest rate cap contracts | 80,271 | — | ||||||
Total derivative assets and liabilities in the interim consolidated balance sheet | 91,604 | 38,502 | ||||||
Derivatives not subject to an MNA | 843 | 30,684 | ||||||
Total assets and liabilities subject to an MNA | $ | 90,761 | $ | 7,818 | ||||
December 31, 2014 | Assets | Liabilities | ||||||
Interest rate swap contracts | $ | 40,611 | $ | 16,007 | ||||
Interest rate cap contracts | 107,673 | — | ||||||
Total derivative assets and liabilities in the interim consolidated balance sheet | 148,284 | 16,007 | ||||||
Derivatives not subject to an MNA | 7,008 | 11,579 | ||||||
Total assets and liabilities subject to an MNA | $ | 141,276 | $ | 4,428 | ||||
Below is a summary of the Company's assets subject to offsetting provisions (in thousands):
Gross Amounts Not Offset in the Consolidated Balance Sheet | ||||||||||||||||||
As of | Description | Amounts of Assets Presented in the Consolidated Balance Sheet | Instruments Available for Offset | Collateral Received(1) | Net Amount(2) | |||||||||||||
March 31, 2015 | Derivative assets | $ | 90,761 | $ | 2,546 | $ | 79,995 | $ | 8,220 | |||||||||
December 31, 2014 | Derivative assets | 141,276 | 4,341 | 117,991 | 18,944 | |||||||||||||
_________________
(1) | Collateral consists of Agency RMBS, U.S. Treasuries and cash. Excess collateral received is not shown for financial reporting purposes. |
(2) | Net amount represents the net amount receivable from the counterparty in the event of default. |
Below is a summary of the Company's liabilities subject to offsetting provisions (in thousands):
Gross Amounts Not Offset in the Consolidated Balance Sheet | ||||||||||||||||||
As of | Description | Amounts of Liabilities Presented in the Consolidated Balance Sheet | Instruments Available for Offset | Collateral Pledged(1) | Net Amount(2) | |||||||||||||
March 31, 2015 | Derivative liabilities | $ | 7,818 | $ | 2,546 | $ | 5,272 | $ | — | |||||||||
March 31, 2015 | Repurchase agreements | 10,204,901 | — | 10,204,901 | — | |||||||||||||
December 31, 2014 | Derivative liabilities | $ | 4,428 | $ | 4,341 | $ | 87 | $ | — | |||||||||
December 31, 2014 | Repurchase agreements | 11,289,559 | — | 11,289,559 | — | |||||||||||||
_______________
(1) | Collateral consists of Agency RMBS, U.S. Treasuries and Cash. Excess collateral pledged is not shown for financial reporting purposes. |
(2) | Net amount represents the net amount payable to the counterparty in the event of default. |
13
8. FAIR VALUE MEASUREMENTS
The Company’s valuation techniques are based on observable and unobservable inputs. Observable inputs reflect readily obtainable data from independent sources, while unobservable inputs reflect the Company’s market assumptions. ASC 820—Fair Value Measurements. The following tables provide a summary of the Company’s assets and liabilities that are measured at fair value, and recorded and presented at fair value as of March 31, 2015 and December 31, 2014 (in thousands):
March 31, 2015 | Fair Value Measurements Using | ||||||||||||||
Level 1 | Level 2 | Level 3 | Total | ||||||||||||
Assets | |||||||||||||||
Agency RMBS | $ | — | $ | 14,555,943 | $ | — | $ | 14,555,943 | |||||||
U.S. Treasuries | 501,335 | — | — | 501,335 | |||||||||||
Other Investments | 8,025 | 8,025 | |||||||||||||
Derivative assets | — | 91,604 | — | 91,604 | |||||||||||
Total | $ | 501,335 | $ | 14,647,547 | $ | 8,025 | $ | 15,156,907 | |||||||
Liabilities | |||||||||||||||
Derivative liabilities | $ | — | $ | 38,502 | $ | — | $ | 38,502 | |||||||
December 31, 2014 | Fair Value Measurements Using | ||||||||||||||
Level 1 | Level 2 | Level 3 | Total | ||||||||||||
Assets | |||||||||||||||
Agency RMBS | $ | — | $ | 14,452,456 | $ | — | $ | 14,452,456 | |||||||
U.S. Treasuries | 149,051 | — | — | 149,051 | |||||||||||
Other investments | — | — | 8,025 | 8,025 | |||||||||||
Derivative assets | — | 148,284 | — | 148,284 | |||||||||||
Total | $ | 149,051 | $ | 14,600,740 | $ | 8,025 | $ | 14,757,816 | |||||||
Liabilities | |||||||||||||||
Derivative liabilities | $ | — | $ | 16,007 | $ | — | $ | 16,007 | |||||||
Other Investments is comprised of our investment in a real estate asset, which is a Level 3 asset. The table below presents a reconciliation of changes in other investments classified as Level 3 in the Company’s interim consolidated financial statements for the three months ended March 31, 2015 and 2014.
Fair values of real estate assets are valued based on comparable sales transactions and/or on discounted cash flow models. A discussion of the method of fair valuing these assets is included in Note 2, Significant Accounting Policies—Investments in Securities—Investment Valuation. The significant unobservable input used in the fair value measurement is capitalization rates, which the Company estimated to be between 3% and 6% at March 31, 2015 and December 31, 2014.
We account for our repo borrowings and FHLB advances under ASC ASC 470—Debt; accordingly, these short-term instruments are disclosed at carrying value, or historic cost.
Level 3 Fair Value Reconciliation
(In thousands) | Three Months Ended March 31, | ||||||
Other investments | 2015 | 2014 | |||||
Beginning balance Level 3 assets | $ | 8,025 | $ | 6,945 | |||
Cash payments recorded as a reduction of cost basis | — | — | |||||
Change in net unrealized gain (loss) | — | — | |||||
Gross purchases | — | — | |||||
Gross sales | — | — | |||||
Net gain (loss) on sales | — | — | |||||
Transfers into (out of) Level 3 | — | — | |||||
Ending balance Level 3 assets | $ | 8,025 | $ | 6,945 | |||
14
9. SHARE CAPITAL
The Company has authorized 500,000,000 shares of common stock having par value of $0.01 per share. As of March 31, 2015 and December 31, 2014, the Company had issued and outstanding 158,114,483 and 161,849,878 shares of common stock, respectively.
The Company has authorized 50,000,000 shares of preferred stock having a par value of $0.01 per share. As of March 31, 2015 and December 31, 2014, 3,000,000 shares of 7.75% Series A Preferred Stock ($25.00 liquidation preference) were issued and outstanding. As of March 31, 2015 and December 31, 2014, 8,000,000 shares of 7.50% Series B Preferred Stock ($25.00 liquidation preference) were issued and outstanding. The Series A Preferred Stock and Series B Preferred Stock will not be redeemable before August 3, 2017 and April 30, 2018, respectively, except under circumstances where it is necessary to preserve the Company's qualification as a REIT, for federal income tax purposes, or the occurrence of a change of control. On or after August 3, 2017 and April 30, 2018, the Company may, at its option, redeem any or all of the shares of the Series A Preferred Stock and Series B Preferred Stock, respectively, at $25.00 per share plus any accumulated and unpaid dividends to, but not including, the respective redemption date. The Series A Preferred Stock and Series B Preferred Stock have no stated maturity, and are not subject to any sinking fund requirement or mandatory redemption.
Equity Offerings
On May 23, 2014, the Company filed an automatically effective shelf registration statement on Form S-3 with the SEC. The Company may offer and sell, from time to time, shares of common stock, preferred stock and debt securities in one or more offerings pursuant to the prospectus that is a part of the registration statement. As of March 31, 2015, the Company had not issued any shares of common stock, preferred stock or debt securities under the prospectus.
Equity Placement Program (“EPP”)
Effective May 15, 2014, the Company terminated that certain Equity Distribution Agreement by and between the Company and JMP Securities LLC (“JMP”), dated as of June 7, 2011 (the “JMP Agreement”), in connection with the expiration of the Company’s prior shelf registration statement on Form S-3. Under the JMP Agreement, the Company could offer and sell, from time to time, up to 15.0 million shares of the Company’s common stock through an “at the market” offering program with JMP. For the three months ended March 31, 2015 and 2014, the Company did not sell any shares of common stock under the JMP Agreement.
Dividend Reinvestment and Direct Stock Purchase Plan (“DSPP”)
The Company sponsors a dividend reinvestment and direct stock purchase plan through which stockholders may purchase additional shares of common stock by reinvesting some or all cash dividends received on shares of common stock. Stockholders may also make optional cash purchases of shares of common stock subject to certain limitations detailed in the plan prospectus. For the three months ended March 31, 2015 and 2014 the Company did not issue any shares under the plan. As of March 31, 2015 and December 31, 2014, there were approximately 4.1 million shares available for issuance under the plan.
Share Repurchase Program
On November 15, 2012, the Company announced that its Board of Directors authorized the repurchase of shares of the Company’s common stock having an aggregate value of up to $250 million. Pursuant to this program, through July 20, 2014, the Company repurchased approximately $115.7 million in aggregate value of its shares of common stock on the open market. On July 21, 2014, the Company announced that its Board of Directors authorized the repurchase of shares of the Company's common stock having an aggregate value of up to $250 million, which included the approximately $134.3 million available for repurchase under the November 2012 authorization. Subsequently in 2014, we repurchased 172,549 shares for an aggregate of approximately $1.5 million. In the first quarter of 2015, we repurchased 4,149,571 shares at a weighted-average purchase price of $8.95, for an aggregate of approximately $37.2 million. Accordingly, the Company still had approximately $211.2 million authorized to repurchase shares of its common stock as of March 31, 2015.
Restricted Stock Awards
For the three months ended March 31, 2015 and 2014, the Company granted 438,617 and 389,880 shares of restricted stock, respectively, to certain of its directors, officers and employees.
15
10. EARNINGS PER SHARE
Components of the computation of basic and diluted earnings per share ("EPS") were as follows (in thousands except per share amounts):
Three Months Ended March 31, | |||||||
2015 | 2014 | ||||||
Net income (loss) | $ | 54,597 | $ | 130,687 | |||
Less preferred stock dividends | (5,203 | ) | (5,203 | ) | |||
Net income (loss) available to common stockholders | 49,394 | 125,484 | |||||
Less dividends paid: | |||||||
Common shares | (47,110 | ) | (51,515 | ) | |||
Unvested shares | (324 | ) | (334 | ) | |||
Undistributed earnings (loss) | 1,960 | 73,635 | |||||
Basic weighted-average shares outstanding: | |||||||
Common shares | 159,573 | 160,936 | |||||
Basic earnings (loss) per common share: | |||||||
Distributed earnings | $ | 0.30 | $ | 0.32 | |||
Undistributed earnings (loss) | 0.01 | 0.46 | |||||
Basic earnings (loss) per common share | $ | 0.31 | $ | 0.78 | |||
Diluted weighted-average shares outstanding: | |||||||
Common shares | 159,573 | 160,936 | |||||
Net effect of dilutive stock options (1) | — | — | |||||
159,573 | 160,936 | ||||||
Diluted earnings (loss) per common share: | |||||||
Distributed earnings | $ | 0.30 | $ | 0.32 | |||
Undistributed earnings (loss) | 0.01 | 0.46 | |||||
Diluted earnings (loss) per common share | $ | 0.31 | $ | 0.78 | |||
__________________
(1) | For the three months ended March 31, 2015 and 2014, the Company had an aggregate of 131,088 stock options outstanding with a weighted-average exercise price of $30.00 that were not included in the calculation of EPS, as their inclusion would have been anti-dilutive. These instruments may have a dilutive impact on future EPS. |
11. SUBSEQUENT EVENTS
On April 1, 2015, an aggregate of 21,303 shares of restricted common stock were granted to certain directors as a portion of their compensation for serving on the Company’s Board of Directors.
16
Item 2. Management’s Discussion and Analysis of Financial Condition and Results of Operations
CYS Investments, Inc. (the "Company", "we", "us", and "our") is a specialty finance company created with the objective of achieving consistent risk-adjusted investment income. Management’s Discussion and Analysis of Financial Condition and Results of Operations (“MD&A”) is intended to provide the reader of the Company’s unaudited interim consolidated financial statements and accompanying notes with a narrative of management's perspective on the business underlying those financial statements and its financial condition and results of operations during the periods presented. The Company’s MD&A is comprised of five sections:
• | Forward-Looking Statements, |
• | Executive Overview, |
• | Financial Condition, |
• | Results of Operations, and |
• | Liquidity and Capital Resources. |
The following discussion should be read in conjunction with our unaudited interim consolidated financial statements and accompanying notes included in Item 1 of this Quarterly Report on SEC Form 10-Q ("Quarterly Report"), as well as our Annual Report on Form 10-K for the fiscal year ended December 31, 2014, filed on February 17, 2015 (the "2014 Annual Report").
Forward Looking Statements
When used in this Quarterly Report, in future filings with the SEC or in press releases or other written or oral communications, statements which are not historical in nature, including those containing words such as "believe," "expect," "may," "will,” "anticipate," "estimate," "plan," "continue," "intend," "should,” or the negative of these words and similar expressions, are intended to identify “forward-looking statements” within the meaning of Section 27A of the Securities Act of 1933, as amended (the "Securities Act"), and Section 21E of the Securities Exchange Act of 1934, as amended (the "Exchange Act"), and, as such, may involve known and unknown risks, uncertainties and assumptions. The forward-looking statements we make in this Quarterly Report include, but are not limited to, statements about the following:
• the effect of movements in interest rates on our assets and liabilities (including our hedging instruments) and
our net income;
• our investment, financing and hedging strategies;
• the effect of U.S. government actions on interest rates and the housing and credit markets;
• the effect of actual or proposed actions of the U.S. Federal Reserve Bank (the "Fed"), the Fed Open Market Committee ("FOMC"), the Federal Home Finance Agency ("FHFA"), and the Federal Home Loan Bank ("FHLB") of Cincinnati;
• the supply of Agency residential mortgage backed securities ("RMBS") and U.S. Treasuries (collectively, "Debt Securities");
• the effect of increased prepayment rates on the value of our assets;
• our ability to convert our assets into cash or extend the financing terms related to our assets;
• the effect of widening credit spreads or shifts in the yield curve on the value of our assets and investment
strategy;
• the types of indebtedness we may incur;
• our ability to quantify risks based on historical experience;
• our ability to be taxed as a real estate investment trust (“REIT”) and to maintain an exemption from
registration under the Investment Company Act of 1940, as amended (the “Investment Company Act”);
• our assessment of counterparty risk and/or the rise of counterparty defaults;
• our ability to meet short-term liquidity requirements with our cash flow from operations and borrowings;
• the effect of rising interest rates on unemployment, inflation and mortgage supply and demand;
• our liquidity;
• our asset valuation policies, and
• our dividend distribution policy.
Forward-looking statements are based on our beliefs, assumptions and expectations of our future performance, taking
into account all information currently available to us. These beliefs, assumptions and expectations are subject to risks and
uncertainties and can change as a result of many possible events or factors, not all of which are known to us. If a change
occurs, our business, financial condition, liquidity and results of operations may vary materially from those expressed in our
17
forward-looking statements. The following factors could cause actual results to vary from our forward-looking statements:
• the factors referenced in this Quarterly Report, including those set forth under the section
captioned “Risk Factors”;
• changes in our investment, financing and hedging strategies;
• the adequacy of our cash flow from operations and borrowings to meet our short-term liquidity requirements;
• the liquidity of our portfolio;
• unanticipated changes in our industry, interest rates, the credit markets, the general economy or the real estate
market;
• changes in interest rates and the market value of our Agency RMBS;
• changes in the prepayment rates on the mortgage loans underlying our Agency RMBS;
• our ability to borrow to finance our assets;
• actions by the U.S. government, the Fed, the FOMC, the FHFA or the FHLB of Cincinnati that impact the value of our Agency RMBS or interest rates, or our access to borrowings at cost-effective rates;
• changes in government regulations affecting our business;
• changes in the U.S. government's credit rating or ability to pay its debts;
• our ability to maintain our qualification as a REIT for federal income tax purposes;
• our ability to maintain our exemption from registration under the Investment Company Act and the
availability of such exemption in the future; and
• risks associated with investing in real estate assets, including changes in business conditions and the general
economy.
These and other risks, uncertainties and factors, including those described elsewhere in this Quarterly Report, could cause our actual results to differ materially from those projected in any forward-looking statements we make. All forward-looking statements speak only as of the date on which they are made. New risks and uncertainties arise over time and it is not possible to predict those events or how they may affect us. Except as required by law, we are not obligated to, and do not intend to, update or revise any forward-looking statements, whether as a result of new information, future events or otherwise.
Executive Overview
We seek to achieve our objective of earning consistent risk-adjusted investment income by investing on a leveraged basis primarily in Agency RMBS. These investments consist of residential mortgage pass-through securities for which the principal and interest payments are guaranteed by a government-sponsored enterprise, such as the Federal National Mortgage Association ("Fannie Mae") and the Federal Home Loan Mortgage Corporation ("Freddie Mac"), or by a U.S. government agency, such as the Government National Mortgage Association ("Ginnie Mae") (collectively referred to as "GSE"s). We also may invest in debt securities issued by the United States Department of Treasury ("U.S. Treasuries") and, in addition, our investment guidelines permit investments in collateralized mortgage obligations issued by a government agency or GSE that are collateralized by Agency RMBS ("CMO"s), or securities issued by a GSE that are not backed by collateral but, in the case of government agencies, are backed by the full faith and credit of the U.S. government, and, in the case of GSEs, are backed by the integrity and creditworthiness of the issuer ("U.S. Agency Debentures").
We commenced operations in February 2006, and completed our initial public offering in June 2009. Our common stock, our 7.75% Series A Cumulative Redeemable Preferred Stock, $25.00 liquidation preference (the "Series A Preferred Stock"), and our 7.50% Series B Cumulative Redeemable Preferred Stock, $25.00 liquidation preference (the "Series B Preferred Stock"), trade on the New York Stock Exchange under the symbols "CYS," "CYS PrA" and "CYS PrB," respectively.
We earn income from our investment portfolio, which as of March 31, 2015, was comprised principally of Debt Securities. We fund our investments primarily through borrowings under repurchase agreements ("repo borrowings"), and advances from the FHLB of Cincinnati ("FHLB advances"). The 12 regional FHLBs provide long-term and short-term secured loans, called “advances,” to their members. FHLB members may use a variety of real estate related assets, including residential mortgage loans and Agency RMBS, as collateral for advances. We use leverage to seek to enhance our returns. Our net interest income is generated primarily from the net spread, or difference, between the interest income we earn on our investment portfolio and the cost of our borrowings and hedging activities. The amount of net interest income we earn on our investments depends in part on our ability to control our financing costs, which comprise a significant portion of our operating expenses. Although we leverage our portfolio investments in Debt Securities to seek to enhance our potential returns, leverage also may exacerbate losses.
While we use hedging to attempt to manage some of our interest rate risk, we do not hedge all of our exposure to changes in interest rates. Our investments vary in interest rate and maturity compared with the rates and duration of the hedges
18
we employ. As a result, it is not possible to insulate our portfolio from all potential negative consequences associated with changes in interest rates in a manner that will allow us to achieve attractive spreads on our portfolio. Consequently, changes in interest rates, particularly short-term interest rates, may significantly influence our net income.
In addition to investing in issued pools of Agency RMBS, we regularly utilize forward settling transactions, including forward settling purchases of Agency RMBS where the pool is "to-be-announced" ("TBA"). Pursuant to a TBA, we agree to purchase, for future delivery, Agency RMBS with certain principal and interest terms and certain types of underlying collateral, but the particular Agency RMBS to be delivered is not identified until shortly before the TBA settlement date. For our other forward settling transactions, we agree to purchase, for future delivery, Agency RMBS. However, unlike our TBAs, these forward settling transactions reference an identified Agency RMBS. Given the favorable terms available thus far in 2015 in the TBA dollar roll market and relative lower benefit of holding specific mortgage pools, we generally have continued to roll the purchases forward to a later settlement date.
In March 2015, our captive insurance subsidiary, CYS Insurance Services, LLC ("CYS Insurance"), was granted membership in the FHLB of Cincinnati, and commenced obtaining advances from the FHLB of Cincinnati in the form of secured borrowings. Membership in the FHLB permits CYS Insurance to access a variety of products and services offered by the FHLB, and obligates CYS Insurance to purchase membership stock and activity stock, the latter being a percentage of the advances it obtains from the FHLB. We intend for CYS Insurance to seek advances of both short- and long-term indebtedness from the FHLB of Cincinnati. As with our repo borrowings, if the value of assets pledged to FHLB as collateral for advances decreases, the FHLB could require posting of additional collateral to the amount of advances outstanding.
We have elected to be treated as a REIT for U.S. federal income tax purposes, and have complied with, and intend to continue to comply with, the provisions of the Internal Revenue Code of 1986, as amended (the "Internal Revenue Code"), with respect thereto. Accordingly, we generally do not expect to be subject to federal income tax on our REIT taxable income that we currently distribute to our stockholders if certain asset, income and ownership tests and recordkeeping requirements are fulfilled. Even if we maintain our qualification as a REIT, we may be subject to some federal, state and local taxes on our income.
Trends and Recent Market Activity
Overview
Agency RMBS prices ended the first quarter of 2015 (the "First Quarter") slightly higher than where they began. Interest rates generally ended the First Quarter slightly below where they began. This apparent stability masks the volatility these markets experienced during the quarter. For example, the yield on 10-year U.S. Treasuries began the year at 2.17%, but rallied briefly to 1.65% in the first few weeks of 2015. The rally was driven by growing sentiment that the U.S. economy was decelerating, being hampered by weakness in Europe and Asia and a developing harsh winter in North America. Indeed, back in December 2014, many prominent economists predicted U.S. Gross Domestic Product ("GDP") growth in the first quarter of 2015 above 3.5% and firming inflation. In actuality, GDP growth in the First Quarter will likely be around 1.5%, and inflation around 1.0%. While growth in payrolls appears to be relatively steady, there is scant wage growth, and commodity prices, notably oil, copper and lumber, have been quite soft. These indicators suggest continued sluggish economic growth globally, and that the U.S. cannot detach from the rest of the world’s economic deceleration.
The Fed continues to guide the capital markets to anticipate an interest rate hike in 2015. In the First Quarter, the yield on 10-year U.S. Treasuries fell 25 basis points ("bps"), continuing the trend of last year. The yield on 10-year U.S. Treasuries ended the First Quarter at 1.92%, suggesting that the bond market does not see accelerating growth or inflation in the U.S. Much of the volatility in rates during the First Quarter occurred in the longer portion of the U.S. yield curve, notably the 5-30 year portion. With continued signs of a sluggish global economy, strength in U.S. employment continues to be cited as support that the FOMC may begin to raise the Fed Funds Rate sometime in 2015. Market participants generally understand that the Fed would like to end the zero interest rate policy. However, with inflation risks low, and mixed signals in employment, the bond market anticipates that such a tightening will likely be at a very slow pace, with an end point much lower than a level economists would forecast in a "normalized" interest rate environment. Cautionary signals from inflation and employment data explain why the shorter portion of the yield curve has not experienced the volatility on the longer portion. The short end of the yield curve reflects expectations for a slow Fed tightening, while the long end of the yield curve reflects low long-term growth and inflation risks.
Foreign bond markets continue to reflect a different set of circumstances: given the economic deceleration in Europe, Asia, and emerging markets, government bond yields in developed markets such as Germany and Japan remain near zero. The European Central Bank announced in January 2015 an aggressive bond buying program to stimulate the European Zone economy. This program is expected to continue through September 2016, which is expected to keep European rates low for several quarters. If the Fed raises the Fed Funds Rate in 2015, we would expect our borrowing costs to rise, and therefore push down our net interest spread. While higher Fed Funds Rates could reduce the Company's earnings power, global economic conditions make it difficult to predict when and by how much the Fed will raise rates.
19
Macroeconomic Factors Driving Fed Policy
Inflation, employment and gross domestic product are the three factors that the Fed has cited most often as providing the data points that will drive its interest rate policy and directives. Set forth below is a chart containing inflation, unemployment and gross domestic product data points that are indicative as to why the Fed may be reluctant to raise interest rates:

--Inflation
While inflation, the first of the Fed's two mandates, has seen the core Personal Consumption Expenditures ("PCE") inflation index well below the Fed’s target rate of 2%, the PCE index rose in February 2015 by 0.2% for the first time since October 2014, which is the biggest increase since June 2014. Notwithstanding the February 2015 PCE index rise, the recent figures indicate that inflation is still subdued, reflecting sluggish demand for goods, services and housing, and flagging growth abroad. Many economists expect prices to remain weak in the coming months due to the strong U.S. dollar, which generally lowers the prices of imports, and low energy prices.
--Employment
Employment, the second of the Fed's two mandates, has been a problematic source of both good data and bad data for the Fed. Though the unemployment rate has fallen in the First Quarter through a combination of new jobs and falling participation, wage increases have lagged. While employers added an adjusted 264,000 jobs in February, only 126,000 jobs were added in March, and both January and February jobs numbers were revised down from what was previously reported, suggesting at least a pause in the strength in the U.S. labor market. During the First Quarter, adjusted job growth averaged 197,000 a month, down from an average of 324,000 in the fourth quarter of 2014. Through February 2015 the economy added at least 200,000 jobs for 12 straight months, the longest streak since 1995, but the March 2015 figure suggests that there is still a lot of slack in the labor market, much of which may not be fully reflected in the unemployment rate. Also, inflation-adjusted wages declined in February 2015: average hourly earnings adjusted for inflation fell 0.1% from January 2015, as the rise in consumer prices offset a 0.1% increase in average hourly pay.
--Gross Domestic Product
As in 2014, the U.S. economy's performance in 2015 to-date has been mixed. While the Fed has pointed to an improving labor market and resurgent consumers as data that might lead to an increase in interest rates, a number of signals in the First Quarter, including industrial production, retail sales and housing starts, point to sluggishness in the U.S. economy. These signals have led economists to downgrade forecasts for First Quarter growth. In early 2015, a Wall Street Journal survey of economists forecast inflation-adjusted GDP to grow 3% in 2015, better than the 2.6% rate estimated for 2014; as U.S. economic performance in the First Quarter has fallen short of expectations, more recent U.S. GDP projections are 1.5% for the First Quarter and 2.4% for the second quarter of 2015. The downbeat shift in economic data complicates matters for Fed policy makers, who have been surprised by faltering growth several times during the recovery and appear to want to be certain the economy is growing sustainably before raising interest rates. Additionally, the U.S. economy has faced challenges due to other factors, including the strengthening U.S. dollar, that could crimp U.S. exporters by making their goods more expensive, and the fall in oil prices that may be hurting U.S. energy producers and related industries.
20
Interest Rates and the Fed
--Interest Rates
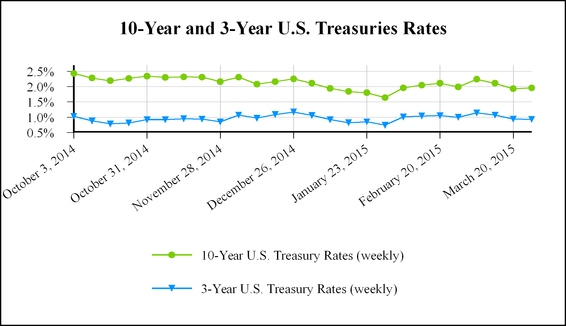
Following a relatively steady interest rate environment in 2014, when the yield curve steadily flattened over the year, interest rate markets were volatile in the First Quarter. While 10-year U.S. Treasuries began 2015 at 2.17%, they fell to 1.65% by the end of January, then rose to 2.24% in early March, only to fall again to 1.87% by mid-April, a decrease of 30 bps since the beginning of 2015. The shorter end of the yield curve, the 3-year U.S. Treasuries, has seen similar volatility at the same intervals, which we believe reflects uncertainty about the direction of the economy and the Fed’s projected actions in reaction to the economy.
Set forth below is the yield curve at March 31, June 30, September 30, and December 31, 2014 and March 31, 2015:

Set forth below is a chart of the 10-year U.S. Treasuries from the third quarter of 2014 to the end of the First Quarter:
Short-term interest rates generally remain low. The table below presents 30-Day London Interbank Offered Rate ("LIBOR"), 3-Month LIBOR and the Fed Funds Rate at the end of the respective quarter through the First Quarter. As the table illustrates, we have been able to benefit from a favorable financing environment.
21
Date | 30-Day LIBOR | 3-Month LIBOR | Fed Funds Rate | |||
March 31, 2015 | 0.176% | 0.271% | 0.25% | |||
December 31, 2014 | 0.171% | 0.256% | 0.25% | |||
September 30, 2014 | 0.157% | 0.235% | 0.25% | |||
June 30, 2014 | 0.155% | 0.231% | 0.25% | |||
March 31, 2014 | 0.152% | 0.231% | 0.25% | |||
December 31, 2013 | 0.168% | 0.246% | 0.25% | |||
September 30, 2013 | 0.179% | 0.249% | 0.25% | |||
June 30, 2013 | 0.195% | 0.273% | 0.25% | |||
March 31, 2013 | 0.204% | 0.283% | 0.25% | |||
December 31, 2012 | 0.209% | 0.306% | 0.25% | |||
The availability of repo borrowing financing was generally stable with interest rates between 0.32% and 0.46% for 30-90 day repo borrowings at March 31, 2015. Our weighted-average cost of funds was 0.35% for the First Quarter. Fed actions in the near-term could change this dynamic, which may impact our interest rate spreads and net interest margin. The table below shows the hypothetical net interest margins available to us in the current investment environment:
_______________________________________
As of March 31, 2015: | |||||
Net Interest Margin | 30 Yr. 3.5% | 15 Yr. 3.0% | |||
Asset Yield | 2.85 | % | 1.99 | % | |
Financing Rate | 0.35 | % | 0.35 | % | |
Hedge Cost (1) | 1.06 | % | 0.63 | % | |
Net interest margin | 1.44 | % | 1.01 | % | |
(1) Assumed 7-year and 5-year Swap Hedge Ratio of 70% for the 30-year 3.5% and 50% for the 15-year 3.0%.
--The Fed and the Global Economy
In 2015, we believe that low inflation, slow economic growth and an increasingly accommodative stance taken by foreign central banks might forestall actions to be taken by the Fed that could trigger a material steepening in the yield curve and an aggressive pace of interest rate tightening. As of March 31, 2015, the spread of 174 bps between 10-year U.S. Treasuries and 10-year German Bunds is above historic norms, and the spread of 153 bps between 10-year U.S. Treasury and 10-year Japanese Government Bonds is larger than it has been since 2011. These spreads reflect the recent flow of funds into U.S. Treasuries, which has resulted in the detrimental impact of a stronger U.S. dollar on the manufacturing sector and may prove to be a troubling circumstance for the Fed as it considers when and how much to raise rates.

--The Fed and Interest Rate Spreads
With the Fed signaling that it may raise rates in 2015, the prospect for higher funding costs is evident, which will in the longer-term lead to interest rate spread narrowing and lower yields on existing Agency RMBS. However, during the First Quarter, the spread between Agency RMBS and interest rate swaps widened slightly, with the spread between Fannie Mae 30-
22
year securities and 7-year interest rate swaps widening 7 bps, and Fannie Mae 15-year and 5-year interest rate swaps widening 11 bps. In general, spread widening will raise our asset values because the majority of our Agency RMBS cash flows are in the 3- to 6-year part of the curve, where the curve steepened during the First Quarter. If the Fed raises the Fed Funds rate, this is likely to narrow the interest rate spread between our borrowing rate and the weighted-average coupon rate in our investment portfolio, which would decrease our yield and our earnings power.

Investing and Reinvestment Environment
--U.S. Housing and Mortgage Markets
Home sales and new single-family home construction remain slow due to mortgage lending rules implemented under the Wall Street Reform and Consumer Protection Act ("Dodd-Frank") and bank conservatism in efforts to prevent future mortgage "put-backs", where the GSEs force the bank to take back problematic mortgages that have been sold to them. These factors have created a shortage of mortgage origination, resulting in low Agency RMBS issuance. The Fed’s purchases of Agency RMBS through reinvesting principal and interest payments it receives on its Agency RMBS portfolio have continued to dominate the Agency RMBS markets. The Fed purchases contributed to strong Agency RMBS demand and limited new investment opportunities to date in 2015. The Fed has not indicated when it will cease or reduce its Agency RMBS reinvestment purchases. The strength in the Agency RMBS market is illustrated below by the movement in prices of two securities commonly held in our portfolio:

-- Agency RMBS Supply and Demand
As the chart below illustrates, gross supply of Agency RMBS continues to be low in 2015 compared to historic norms. Net supply of Agency RMBS continues to be even lower due to continued Fed purchases in the First Quarter. This shortage of
23
Agency RMBS has been a factor in the attractive TBA market, as low financing rates and the inability of the GSEs to settle forward transactions has led to a continuing strong dollar roll market.

The Urban Institute recently estimated that four million fewer mortgage loans were made between 2009 and 2014 than otherwise would have been made due to tighter lending standards. Also, recent updates in data indicate that student loan debt continues to hinder recent college graduates from entering the housing market. According to a recent Fed report, the student loan debt burden has grown to $1.16 trillion in 2014, up 8% from 2013, about 65% of which is owed by borrowers under 40 years old. This has led to a greater percentage of residential renters compared to residential homeowners, as the chart below illustrates.

Other than Fed purchases, demand for Agency RMBS appears to be waning. While the Fed is still purchasing approximately $20-33 billion per month by reinvesting principal and interest payments it receives on its existing Agency RMBS portfolio, overseas and money manager holdings of Agency RMBS declined in 2014 and in the First Quarter. The supply-demand equation would appear to require more U.S. private purchases of Agency RMBS, as the Fed and domestic banks may be reducing their purchases during 2015. Banks have less incentive to purchase Agency RMBS issued by Freddie Mac and Fannie Mae because under the Basel III liquidity coverage ratio rules they receive lower quality liquid asset credit for these on their balance sheet than for cash, U.S. Treasuries and Agency RMBS issued by Ginnie Mae.
24
-- Agency RMBS and U.S. Treasuries Market Volatility Trends
To date in 2015, there has been volatility in the Agency RMBS and U.S. Treasuries markets. With the Fed connecting the start of rate increases to evidence of further improvement in the economy, data releases, led by the monthly jobs report and Agency RMBS prepayments, remain pivotal events. While the bond market has largely priced out the chances of the Fed raising interest rates in June, the performance of Agency RMBS and U.S. Treasuries rests on the tone of incoming data and whether the Fed looks beyond the recent strength of the U.S. dollar. Stronger data during the next few months will only underscore the Fed’s recent embrace of policy flexibility, which may stoke bond market volatility. We believe that data dependency and analysis of the Fed will continue to drive the direction and volatility of U.S. rates, and the uncertainty that this creates will further stoke volatility in the interest rate and fixed income markets.
One byproduct of this volatility is that mortgage refinancings and prepayments rose in the First Quarter. The charts below illustrate the increase in the constant prepayment rate ("CPR") and refinancing activity rates (for both 15- and 30-year mortgages) since the beginning of 2015.
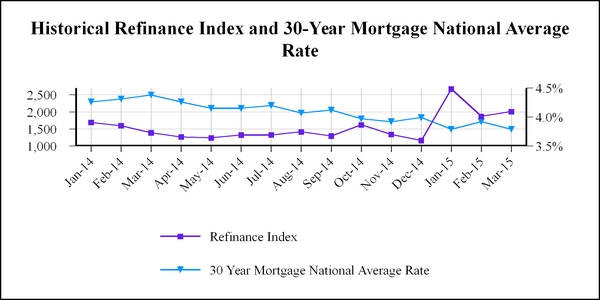
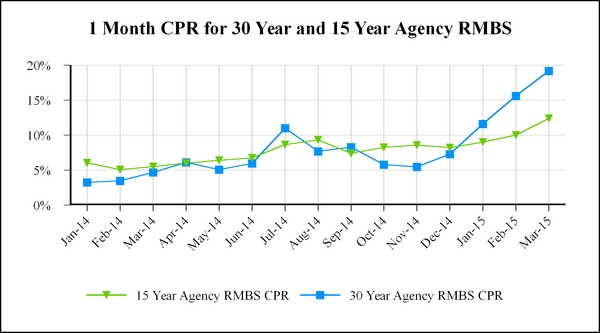
25
Government Activity
In March 2015, housing and mortgage financial reform legislation, H.R. 1491, was proposed by congressmen John Delaney (D-MD) and James A. Himes (D-CT), each of whom is a member of the House Financial Services Committee. The legislation seeks to establish an insurance program through Ginnie Mae and wind down Fannie Mae and Freddie Mac or allowing them to be sold and recapitalized. The bill is called The Partnership to Strengthen Homeownership Act, and is similar to one introduced by the same congressmen in the last Congress (H.R. 5055), which never made it out of committee. The bill is intended to "protect the fixed-rate 30-year mortgage" and shield American taxpayers from future bailouts by reforming the housing finance system and relying on the private sector's willingness to price risk with the federal government's ability to provide capacity. Under the proposed insurance program all government guaranteed single-family and multi-family mortgage-backed securities would be supported by a minimum of 5% private sector capital, which would stand in a first loss position. The remaining 95% of the risk would be shared between Ginnie Mae and a private reinsurer on a pari passu basis.
Under the bill, Freddie Mac and Fannie Mae would be wound down over a five-year period, and their multifamily businesses will be spun out as separate entities. Ginnie Mae would be required to create and implement a workable multifamily guarantee that utilizes private sector pricing consistent with the single family model. The GSEs' current multifamily businesses would continue to function within the new multifamily housing market as purely private organizations with an explicit government guarantee provided by Ginnie Mae and a private sector reinsurer. We expect debate and discussion on residential housing and mortgage reform to continue in 2015; however, we cannot be certain if H.R. 1491, or any housing- and/or mortgage-related bill will emerge from committee, or be approved by Congress, and if so what the effect will be.
Recent CYS Activity in Response To These Trends
In response to the conditions in and changes to the environments described above, we have repositioned our investment portfolio and our hedge positions and enhanced our access to financing. During the First Quarter, we repositioned the investment portfolio by purchasing 15-year 3.0% Agency RMBS, 30-year 3.5% Agency RMBS and U.S. Treasuries, and selling Hybrid ARMs. The Agency RMBS we purchased were the highest yielding Agency RMBS that we were able to source in the market and generally improved the longer term prepayment profile of our Debt Securities portfolio. The U.S. Treasuries we purchased have higher yields than the Hybrid ARMs we sold and also finance our repo borrowings at attractive rates. While interest rates remain low, investing in the Agency RMBS market is challenging as yields on new Agency RMBS are generally lower than on our existing Agency RMBS portfolio.
We continue to reposition our hedges. In the First Quarter, the Company added a 7-year $500 million notional swap cancelable in January 2016, and canceled a 7-year $400 million notional swap cancelable in June 2015. The Company seeks to manage its exposure to interest rate risk by expanding and/or lengthening its hedges, and reducing its pay rate, if possible, when doing so. This has helped to reduce our duration gap to 0.60 at March 31, 2015, compared to 0.66 at December 31, 2014. The cancelable feature in our newer swaps, while adding flexibility, has added slightly to swap interest expense. At March 31, 2015, $1.9 billion of our $7.75 billion in interest rate swaps are cancelable between July 2015 and January 2016.
We continue to manage our liquidity by expanding our sources of financing, including entering into a relationship with the FHLB of Cincinnati. In the First Quarter, our wholly-owned captive insurance subsidiary, CYS Insurance, joined the FHLB system, and we expect CYS Insurance to utilize its membership in the FHLB System to obtain short- and long-term secured financing at attractive interest rates.
Our leverage increased slightly at the end of the First Quarter to 6.77 to 1 from 6.44 to 1 at the end of the fourth quarter of 2014. We increased the size of our investment portfolio by approximately $450 million to $15,057 million in the First Quarter, and stockholders' equity declined as a result of our repurchasing 4,149,571 shares of our common stock at a weighted-average price of $8.95 per share for an aggregate amount of $37.2 million.
26
Financial Condition
The Agency RMBS in our portfolio were purchased at a net premium to their face value due to the average interest rates on these investments being higher than the market rates at the time of purchase. As of March 31, 2015 and December 31, 2014 we had approximately $578.4 million and $552.9 million, respectively, of unamortized premium included in the cost basis of our investments. Our Debt Securities portfolio consisted of the following assets:
Weighted-Average | |||||||||||||||||||||||
Coupon | Face Value (in 000's) | Fair Value (in 000's) | Amortized Cost Basis per Face Value (in 000's) | Loan Balance (in 000's)(1) | Loan Age (in months)(1) | 3 Month CPR(1)(2) | Duration(3) | ||||||||||||||||
March 31, 2015 | |||||||||||||||||||||||
15 Year Agency Mortgage Securities | |||||||||||||||||||||||
3.0% | $ | 4,732,332 | $ | 4,967,991 | $ | 103.16 | $ | 276 | 13 | 7.8 | % | 3.23 | |||||||||||
TBA 3.0% | 927,200 | 971,917 | 104.30 | n/a | n/a | n/a | 3.36 | ||||||||||||||||
3.5% | 1,400,050 | 1,488,990 | 103.46 | 234 | 30 | 10.3 | 2.71 | ||||||||||||||||
4.0% | 172,740 | 183,776 | 101.20 | 173 | 49 | 15.1 | 2.30 | ||||||||||||||||
4.5% | 25,157 | 26,974 | 102.66 | 250 | 62 | 21.4 | 1.67 | ||||||||||||||||
Subtotal | 7,257,479 | 7,639,648 | 103.32 | 263 | 18 | 8.7 | 3.12 | ||||||||||||||||
20 Year Agency Mortgage Securities | |||||||||||||||||||||||
4.5% | 63,673 | 69,978 | 102.92 | 217 | 56 | 18.8 | 1.34 | ||||||||||||||||
30 Year Agency Mortgage Securities | |||||||||||||||||||||||
3.5% | 379,605 | 399,101 | 104.66 | 345 | 3 | n/a | 3.92 | ||||||||||||||||
TBA 3.5% | 401,000 | 421,051 | 104.51 | n/a | n/a | n/a | 4.22 | ||||||||||||||||
4.0% | 3,884,445 | 4,164,986 | 105.43 | 291 | 9 | 11.4 | 3.13 | ||||||||||||||||
TBA 4.0% | 674,000 | 720,480 | 106.42 | n/a | n/a | n/a | 3.41 | ||||||||||||||||
4.5% | 320,319 | 350,152 | 107.68 | 279 | 31 | 16.8 | 1.48 | ||||||||||||||||
Subtotal | 5,659,369 | 6,055,770 | 105.56 | 295 | 10 | 11.9 | 3.20 | ||||||||||||||||
Agency Hybrid ARMs | |||||||||||||||||||||||
2.9%(4) | 757,035 | 790,548 | 102.81 | 318 | 31 | 12.3 | 2.30 | ||||||||||||||||
U.S. Treasuries | |||||||||||||||||||||||
1.2% | 500,000 | 501,334 | 99.51 | n/a | n/a | n/a | 3.71 | ||||||||||||||||
Total | $ | 14,237,556 | $ | 15,057,278 | $ | 104.04 | $ | 279 | 16 | 10.3 | % | 3.12 | |||||||||||
December 31, 2014 | |||||||||||||||||||||||
15-Year Agency Mortgage Securities | |||||||||||||||||||||||
3.0% | $ | 4,889,226 | $ | 5,089,402 | $ | 102.94 | $ | 272 | 13 | 7.7 | % | 3.74 | |||||||||||
TBA 3.0% | 299,000 | 310,785 | 103.73 | n/a | n/a | n/a | 3.80 | ||||||||||||||||
3.5% | 1,462,563 | 1,547,892 | 103.50 | 234 | 27 | 8.5 | 3.12 | ||||||||||||||||
TBA 3.5% | 125,000 | 132,051 | 105.52 | n/a | n/a | n/a | 3.04 | ||||||||||||||||
4.0% | 183,538 | 196,242 | 101.22 | 175 | 46 | 10.6 | 2.47 | ||||||||||||||||
4.5% | 27,359 | 29,549 | 102.73 | 249 | 59 | 8.9 | 1.73 | ||||||||||||||||
Subtotal | 6,986,686 | 7,305,921 | 103.09 | 261 | 17 | 8.0 | 3.56 | ||||||||||||||||
20-Year Agency Mortgage Securities | |||||||||||||||||||||||
4.5% | 67,839 | 74,216 | 102.94 | 220 | 53 | 15.5 | 1.58 | ||||||||||||||||
30-Year Agency Mortgage Securities | |||||||||||||||||||||||
4.0% | 3,679,782 | 3,936,261 | 105.24 | 287 | 8 | 5.0 | 3.88 | ||||||||||||||||
TBA 4.0% | 974,000 | 1,039,232 | 106.00 | n/a | n/a | n/a | 3.44 | ||||||||||||||||
4.5% | 336,961 | 366,206 | 107.72 | 280 | 28 | 11.9 | 2.08 | ||||||||||||||||
Subtotal | 4,990,743 | 5,341,699 | 105.56 | 286 | 9 | 5.4 | 3.67 | ||||||||||||||||
Hybrid ARMs | |||||||||||||||||||||||
2.6%(4) | 1,685,685 | 1,730,620 | 103.41 | 333 | 29 | 13.6 | 2.93 | ||||||||||||||||
U.S. Treasuries | |||||||||||||||||||||||
1.5% | 150,000 | 149,051 | 99.72 | n/a | n/a | n/a | 4.74 | ||||||||||||||||
Total | $ | 13,880,953 | $ | 14,601,507 | $ | 103.98 | $ | 279 | 16 | 8.1 | % | 3.52 | |||||||||||
27
__________________
(1) | TBAs are excluded from this calculation as they do not have a defined weighted-average loan balance or age until mortgages have been assigned to the pool. |
(2) | The CPR represents the 3-month CPR of the Company’s Agency RMBS held at March 31, 2015 and December 31, 2014. The CPR experienced by the Company during the period may differ. Securities with no prepayment history are excluded from this calculation. |
(3) | Duration essentially measures the market price volatility of financial instruments as interest rates change, using DV01 methodology. We generally calculate duration using various third-party financial models and empirical data. Different models and methodologies can produce different duration numbers for the same securities. Source: The Yield Book®. |
(4) | Coupon represents the weighted-average coupon of Agency Hybrid ARMs. |
In April 2015, the aggregate CPR of the Company's Debt Securities portfolio was 16.2%.
Hedging Instruments
The Company utilizes interest rate swap and cap contracts (a "swap" or "cap") to hedge the interest rate risk associated with the financing of our Debt Securities portfolio. As of March 31, 2015, the Company had entered into swaps with an aggregate notional of approximately $7.8 billion, a weighted-average fixed rate of 1.44%, and a weighted-average expiration of 4.0 years. The receive rate on the Company's swaps is LIBOR. At March 31, 2015, the Company had entered into caps with a notional of $2.5 billion, a weighted-average cap rate of 1.28%, and a weighted-average expiration of 4.8 years. Below is a summary of our interest rate swaps and caps as of March 31, 2015 and December 31, 2014:
Weighted-Average | |||||||||||||||||||
March 31, 2015 | Number of Contracts | Notional (000's) | Rate | Maturity | Duration | Fair Value (000's) | |||||||||||||
Interest Rate Swaps | 18 | $ | 7,750,000 | 1.44 | % | March 2019 | (2.98 | ) | $ | (27,169 | ) | ||||||||
Interest Rate Caps | 5 | 2,500,000 | 1.28 | % | January 2020 | (2.67 | ) | 80,271 | |||||||||||
23 | $ | 10,250,000 | 1.40 | % | May 2019 | (2.91 | ) | $ | 53,102 | ||||||||||
December 31, 2014 | |||||||||||||||||||
Interest Rate Swaps | 18 | $ | 7,650,000 | 1.44 | % | February 2019 | (3.33 | ) | $ | 24,604 | |||||||||
Interest Rate Caps | 5 | 2,500,000 | 1.28 | % | January 2020 | (2.99 | ) | 107,673 | |||||||||||
23 | $ | 10,150,000 | 1.40 | % | May 2019 | (3.25 | ) | $ | 132,277 | ||||||||||
We continue to reposition our hedges. In the First Quarter, the Company added a 7-year $500 million notional swap cancelable in January 2016, and canceled a 7-year $400 million notional swap cancelable in June 2015. The Company seeks to manage its exposure to interest rate risk by expanding and/or lengthening its hedges, and reducing its pay rate, if possible, when doing so. This has helped to reduce our duration gap to 0.60 at March 31, 2015, compared to 0.66 at December 31, 2014. The cancelable feature in our newer swaps, while adding flexibility, has added slightly to swap interest expense. At March 31, 2015, $1.9 billion of our $7.75 billion in interest rate swaps are cancelable between July 2015 and January 2016.
Liabilities
We finance a portion of our assets through repo borrowings and FHLB advances. Repo borrowings and FHLB advances are secured by our assets and bear interest at rates that have historically moved in close relationship to LIBOR. In March 2015, CYS Insurance commenced accessing FHLB advances. At March 31, 2015 and December 31, 2014, we had liabilities pursuant to repo borrowings and FHLB advances with 34 and 32 counterparties, respectively, which are summarized below:
28
March 31, 2015 | Weighted-Average | |||||||||||
Original Days to Maturity | Repo Borrowings and FHLB Advances Outstanding (000's) | Percentage of Total | Interest Rate | Remaining Days to Maturity | Original Days to Maturity | |||||||
Agency RMBS | ||||||||||||
≤ 30 Days | $ | 980,044 | 9% | 0.25% | 11 | 20 | ||||||
> 30 to ≤ 60 Days | 2,531,977 | 24% | 0.36% | 16 | 36 | |||||||
> 60 Days | 6,731,784 | 63% | 0.38% | 62 | 103 | |||||||
Subtotal | $ | 10,243,805 | 96% | 0.36% | 46 | 79 | ||||||
U.S. Treasuries | ||||||||||||
≤ 30 Days | $ | 471,096 | 4% | (0.04)% | 1 | 11 | ||||||
Total | $ | 10,714,901 | 100% | 0.34% | 44 | 76 | ||||||
December 31, 2014 | Weighted-Average | |||||||||||
Original Days to Maturity | Repo Borrowings Outstanding (000's) * | Percentage of Total | Interest Rate | Remaining Days to Maturity | Original Days to Maturity | |||||||
Agency RMBS | ||||||||||||
≤ 30 Days | $ | 1,608,723 | 14% | 0.35% | 17 | 19 | ||||||
> 30 to ≤ 60 Days | 1,638,946 | 15% | 0.36% | 20 | 38 | |||||||
> 60 Days | 7,893,810 | 70% | 0.36% | 33 | 96 | |||||||
Total | $ | 11,141,479 | 99% | 0.36% | 29 | 76 | ||||||
U.S. Treasuries | ||||||||||||
> 30 to ≤ 60 Days | $ | 148,080 | 1% | (0.27)% | 2 | 32 | ||||||
Total | $ | 11,289,559 | 100% | 0.35% | 28 | 75 | ||||||
__________________
* There were no FHLB advances for the period ended December 31, 2014.
In addition, as of March 31, 2015, we had payable for securities purchased, a portion of which will be or, in the case of December 31, 2014, was financed through repo borrowings and FHLB advances summarized below (in thousands).
March 31, 2015 | ||||||||
Settle Date | Face Value | Payable | ||||||
April 2015 | $ | 2,379,607 | $ | 2,506,179 | ||||
May 2015 | 225,000 | 240,090 | ||||||
June 2015 | 10,000 | 10,399 | ||||||
July 2015 | 10,000 | 10,374 | ||||||
$ | 2,624,607 | $ | 2,767,042 | |||||
December 31, 2014 | ||||||||
Settle Date | Face Value | Payable | ||||||
January 2015 | $ | 1,325,657 | $ | 1,399,441 | ||||
February 2015 | 100,000 | 106,040 | ||||||
$ | 1,425,657 | $ | 1,505,481 | |||||
29
Summary Financial Data
Three Months Ended March 31, | |||||||
(In thousands, except per share numbers) | 2015 | 2014 | |||||
Interest income: | |||||||
Interest income from Agency RMBS | $ | 80,060 | $ | 80,186 | |||
Other interest income | 790 | 4,181 | |||||
Total interest income | 80,850 | 84,367 | |||||
Interest expense: | |||||||
Repurchase agreement and FHLB advances interest expense | 9,642 | 9,423 | |||||
Swap and cap interest expense | 27,468 | 18,923 | |||||
Total interest expense | 37,110 | 28,346 | |||||
Net interest income | 43,740 | 56,021 | |||||
Other income (loss): | |||||||
Net realized gain (loss) on investments | 18,253 | 16,670 | |||||
Net unrealized gain (loss) on investments | 75,689 | 89,234 | |||||
Net realized gain (loss) on termination of swap and cap contracts | (2,568 | ) | (9,323 | ) | |||
Net unrealized gain (loss) on swap and cap contracts | (74,800 | ) | (16,240 | ) | |||
Other income | 40 | 119 | |||||
Total other income (loss) | 16,614 | 80,460 | |||||
Expenses: | |||||||
Compensation and benefits | 3,554 | 3,629 | |||||
General, administrative and other | 2,203 | 2,165 | |||||
Total expenses | 5,757 | 5,794 | |||||
Net income (loss) | $ | 54,597 | $ | 130,687 | |||
Dividend on preferred stock | (5,203 | ) | (5,203 | ) | |||
Net income (loss) available to common stockholders | $ | 49,394 | $ | 125,484 | |||
Net income (loss) per common share basic & diluted | $ | 0.31 | $ | 0.78 | |||
Distributions per common share | $ | 0.30 | $ | 0.32 | |||
Key Balance Sheet Metrics | |||||||
Average settled Debt Securities (1) | $ | 12,653,266 | $ | 12,472,238 | |||
Average total Debt Securities (2) | $ | 14,810,062 | $ | 13,454,972 | |||
Average repurchase agreements and FHLB advances (3) | $ | 10,954,377 | $ | 10,867,627 | |||
Average Debt Securities liabilities (4) | $ | 13,111,173 | $ | 11,850,361 | |||
Average stockholders' equity (5) | $ | 1,981,424 | $ | 1,861,121 | |||
Average common shares outstanding (6) | 160,523 | 161,831 | |||||
Leverage ratio (at period end) (7) | 6.77:1 | 6.32:1 | |||||
Key Performance Metrics* | |||||||
Average yield on settled Debt Securities (8) | 2.56 | % | 2.71 | % | |||
Average yield on total Debt Securities including drop income (9) | 2.57 | % | 2.85 | % | |||
Average cost of funds(10) | 0.35 | % | 0.35 | % | |||
Average cost of funds and hedge (11) | 1.36 | % | 1.04 | % | |||
Adjusted average cost of funds and hedge (12) | 1.13 | % | 0.96 | % | |||
30
Interest rate spread net of hedge (13) | 1.20 | % | 1.67 | % | |||
Interest rate spread net of hedge including drop income(14) | 1.44 | % | 1.89 | % | |||
Operating expense ratio (5) | 1.16 | % | 1.25 | % | |||
Total stockholder return on common equity(16) | 3.14 | % | 8.23 | % | |||
(1) | The average settled Debt Securities is calculated by averaging the month end cost basis of settled Debt Securities during the period. |
(2) | The average total Debt Securities is calculated by averaging the month end cost basis of total Debt Securities during the period. |
(3) | The average repurchase agreement borrowings and FHLB advances are calculated by averaging the month end repurchase agreements and FHLB advances balances during the period. |
(4) | The average Debt Securities liabilities are calculated by adding the average month end repurchase agreements and FHLB advances balances plus average unsettled Debt Securities during the period. |
(5) | The average stockholders' equity is calculated by averaging the month end stockholders' equity during the period. |
(6) | The average common shares outstanding are calculated by averaging the daily common shares outstanding during the period. |
(7) | The leverage ratio is calculated by dividing (i) the Company's repurchase agreements and FHLB advances balance plus payable for securities purchased minus receivable for securities sold by (ii) stockholders' equity. |
(8) | The average yield on Debt Securities for the period is calculated by dividing total interest income by average settled Debt Securities. |
(9) | The average yield on total Debt Securities including drop income for the period is calculated by dividing total interest income plus drop income by average total Debt Securities. Drop income was $14.1 million and $11.6 million for the three months ended March 31, 2015 and 2014, respectively. Drop income is a component of our net realized and unrealized gain (loss) on investments on our consolidated statements of operations. Drop income is the difference between the spot price and the forward settlement price for the same security on trade date. This difference is also the economic equivalent of the assumed net interest margin (yield minus financing costs) of the bond from trade date to settlement date. We derive drop income through utilization of forward settling transactions. |
(10) | The average cost of funds for the period is calculated by dividing repurchase agreement and FHLB advances interest expense by average repurchase agreements and FHLB advances for the period. |
(11) | The average cost of funds and hedge for the period is calculated by dividing interest expense by average repurchase agreements and FHLB advances. |
(12) | The adjusted average cost of funds and hedge for the period is calculated by dividing interest expense by average Debt Securities liabilities. |
(13) | The interest rate spread net of hedge for the period is calculated by subtracting average cost of funds and hedge from average yield on settled Debt Securities. |
(14) | The interest rate spread net of hedge including drop income for the period is calculated by subtracting adjusted average cost of funds and hedge from average yield on total Debt Securities including drop income. |
(15) | The operating expense ratio for the period is calculated by dividing operating expenses by average stockholders' equity. |
(16) | Calculated by change in book value plus dividend distributions on common stock. |
* | All percentages are annualized except total stockholder return on common equity. |
Core Earnings
"Core earnings" represents a non-U.S. GAAP financial measure and is defined as net income (loss) available to common stockholders excluding net realized and unrealized gain (loss) on investments, net realized gain (loss) on termination of swap and cap contracts and net unrealized gain (loss) on swap and cap contracts. Management uses core earnings to evaluate the effective yield of the portfolio after operating expenses. In addition, management utilizes core earnings as a key metric in conjunction with other portfolio and market factors to determine the appropriate leverage and hedging ratios, as well as the overall structure of the portfolio. The Company believes that providing users of the Company's financial information with such measures, in addition to the related GAAP measures, gives investors greater transparency and insight into the information used by the Company's management in its financial and operational decision-making.
The primary limitation associated with core earnings as a measure of our financial performance over any period is that it excludes the effects of net realized and unrealized gain (loss) on investments. In addition, our presentation of core earnings may not be comparable to similarly-titled measures of other companies, which may use different calculations. As a result, core earnings should not be considered as a substitute for our U.S. GAAP net income (loss) as a measure of our financial
31
performance or any measure of our liquidity under U.S. GAAP.
(In thousands) | Three Months Ended March 31, | ||||||
Non-U.S. GAAP Reconciliation: | 2015 | 2014 | |||||
Net income (loss) available to common stockholders | $ | 49,394 | $ | 125,484 | |||
Net realized (gain) loss on investments | (18,253 | ) | (16,670 | ) | |||
Net unrealized (gain) loss on investments | (75,689 | ) | (89,234 | ) | |||
Net realized (gain) loss on termination of swap and cap contracts | 2,568 | 9,323 | |||||
Net unrealized (gain) loss on swap and cap contracts | 74,800 | 16,240 | |||||
Core earnings | $ | 32,820 | $ | 45,143 | |||
Results of Operations
Three Months Ended March 31, 2015 Compared to the Three Months Ended March 31, 2014
Net Income
Net income available to common stockholders decreased $76.1 million to $49.4 million for the three months ended March 31, 2015, compared to $125.5 million for the three months ended March 31, 2014, primarily due to higher losses on our swaps and caps and higher swap and cap interest expense in the first quarter of 2015 compared to the first quarter of 2014. The major components of this decrease are detailed below.
Interest Income and Asset Yield
Our principal source of income is interest income that we earn on our investment securities portfolio. Interest income, which consists primarily of interest income on Debt Securities, decreased by $3.5 million to $80.9 million for the three months ended March 31, 2015, as compared to $84.4 million for the three months ended March 31, 2014. The most significant factors in this decrease are changes both in the size of our portfolio and yield on investments, as shown below (in thousands):
Change in Size | Change in Yield | Change in Size & Yield | |||||||||||
Change in average settled | $ | 181,028 | Change in average yield | (0.150 | )% | Change in average settled | $ | 181,028 | |||||
Q1 2014 average yield | 2.706 | % | Q1 2014 average settled | 12,472,238 | Change in average yield | (0.150 | )% | ||||||
Change | $ | 1,225 | Change | $ | (4,674 | ) | Change | $ | (68 | ) | |||
Total change | $ | (3,517 | ) | ||||||||||
Our average settled Debt Securities for the three months ended March 31, 2015 was $12.7 billion, compared to $12.5 billion for the three months ended March 31, 2014. Our annualized yield on average settled Debt Securities for the three months ended March 31, 2015 was 2.56%, as compared to 2.71% for the three months ended March 31, 2014. The yield on our assets is most directly affected by the coupon rate, and the rate of repayments on our Agency RMBS due to its impact on the amortization of premium on Agency RMBS. Our yield decrease was primarily a function of higher portfolio premium amortization expense in the current quarter than in the comparable period. Our weighted-average coupon as of March 31, 2015 was 3.38%, compared to 3.06% as of March 31, 2014. Our amortization expense was $21.5 million for the three months ended March 31, 2015, and $10.3 million for the three months ended March 31, 2014, primarily due to a higher cost basis in our Agency RMBS and higher paydown losses due to accelerated prepayments.
Interest Expense and Cost of Funds
Our interest expense for the three months ended March 31, 2015, which primarily consists of interest expense from repo borrowings, FHLB advances, and interest rate swap and cap contracts, increased $8.8 million to $37.1 million, as compared to $28.3 million for the three months ended March 31, 2014. Interest expense from repo borrowings and FHLB advances increased by $0.2 million to $9.6 million for the three months ended March 31, 2015, compared to $9.4 million for the three months ended March 31, 2014. Our average borrowings increased to $10,954.4 million for the three months ended March 31, 2015 from $10,867.6 million for the three months ended March 31, 2014, consistent with the larger portfolio that existed at March 31, 2015 as compared to the portfolio at March 31, 2014. As shown below, the change in interest expense from repo borrowings and FHLB advances was primarily the result of changes to the amount outstanding and rates on repo borrowings and FHLB advances during the three months ended March 31, 2015 and 2014 (in thousands):
32
Change in Size | Change in Rate | Change in Size & Yield | |||||||||||
Change in average outstanding | $ | 86,750 | Change in average rate | 0.005 | % | Change in average outstanding | $ | 86,750 | |||||
Q1 2014 average rate | 0.347 | % | Q1 2014 average outstanding | $ | 10,867,627 | Change in average rate | 0.005 | % | |||||
Change | $ | 75 | Change | $ | 143 | Change | $ | 1 | |||||
Total change | $ | 219 | |||||||||||
Swap and cap interest expense increased by $8.6 million, to $27.5 million in three months ended March 31, 2015 compared to $18.9 million in the three months ended March 31, 2014. The increase in the interest rate swap and cap expense was attributable primarily to the rise in the average aggregate swap and cap notional by $275 million to $10,225 million in the three months ended March 31, 2015 from $9,950 million in three months ended March 31, 2014 and also by the rise in the average swap and cap rate to 1.08% in three months ended March 31, 2015 from 0.76% in the three months ended March 31, 2014, as shown in the table below (in thousands):
Change in Size | Change in Rate | Change in Size & Rate | |||||||||||
Change in average notional outstanding | $ | 275,000 | Change in average rate | 0.314 | % | Change in average notional outstanding | $ | 275,000 | |||||
Q1 2014 average rate | 0.761 | % | Q1 2014 average notional outstanding | $ | 9,950,000 | Change in average rate | 0.314 | % | |||||
Change | $ | 523 | Change | $ | 7,806 | Change | $ | 216 | |||||
Total change | $ | 8,545 | |||||||||||
Our annualized weighted-average cost of funds including hedge was 1.36% for the three months ended March 31, 2015, as compared to 1.04% for the three months ended March 31, 2014. The components of our cost of funds are (i) rates on our repo borrowings, (ii) rates on our interest rate swaps and caps, (iii) the size of our repo borrowings and FHLB advances, and (iv) the total value of the interest rate swaps and caps.
Net Interest Income and Drop Income
Our net interest income for the three months ended March 31, 2015 was $43.7 million, and our interest rate spread, net of hedge, was 1.20%, compared to net interest income of $56.0 million and interest rate spread, net of hedge of 1.67% for the three months ended March 31, 2014. This decrease in our interest rate spread net of hedge was due to our decreased portfolio yield, which was a byproduct of lower coupon rates on our Debt Securities, higher paydown losses and higher amortization expense. While our net interest income is influenced significantly by the size of our portfolio and overall interest rate levels, we believe our interest rate spread net of hedge is an important indicator of our performance.
During the three months ended March 31, 2015 and 2014, we generated drop income of approximately $14.1 million and $11.6 million, respectively. The higher level of drop income was primarily due to continuing large volumes of forward settling transactions from which we derive drop income. Drop income is a component of our net realized and unrealized gain (loss) on investments on our consolidated statements of operations and therefore excluded from core earnings. Drop income is the difference between the spot price and the forward settlement price for the same security on the trade date. This difference is also the economic equivalent of the assumed interest rate spread net of hedge (yield minus financing costs) of the bond from trade date to settlement date.
Gain (Loss) on Investments
During the three months ended March 31, 2015, our net realized and unrealized gain (loss) on investments decreased by $12.0 million to a $93.9 million net gain, compared to a net gain of $105.9 million for the three months ended March 31, 2014. This change was driven in part by an increase in prices of Agency RMBS for the three months ended March 31, 2015, compared with even larger increases in prices of Agency RMBS for the three months ended March 31, 2014. For example, during the three months ended March 31, 2015, the price of a 30-year 4.0% Agency RMBS increased $0.18, and during the three months ended March 31, 2014, it increased $0.96.
Gain (Loss) on Derivatives
Our net realized and unrealized gain (loss) on swap and cap contracts increased by $51.8 million to a loss of $(77.4) million for the three months ended March 31, 2015, compared to a loss of $(25.6) million for the three months ended March 31, 2014. The realized and unrealized loss on swap and cap contracts in the three months ended March 31, 2015 was due principally to an overall environment of decreasing interest rates in which swap and cap values decreased. Our swaps are designed principally to protect us in an environment of increasing interest rates, but in the first quarter of 2015 there were declines in interest rates and significant volatility which caused our losses on swaps and caps to increase. These losses were
33
offset to some extent by the net realized and unrealized gains on our Agency RMBS. During the three months ended March 31, 2015 and 2014, our average interest rate swap and cap amount was $10,225.0 million and $9,950.0 million, respectively. During the three months ended March 31, 2015 and 2014, 7-year swap rates decreased by 25bps and 15bps, respectively.
Operating Expenses
Operating expenses remained unchanged at $5.8 million and $5.8 million for the three months ended March 31, 2015 and 2014, respectively.
Contractual Obligations and Commitments
The following table summarizes our contractual obligations for repo borrowings and FHLB advances, interest expense on repo borrowings and FHLB advances, and the office lease at March 31, 2015 and December 31, 2014 (in thousands):
March 31, 2015 | Within One Year | One to Three Years | Three to Five Years | Total | |||||||||||
Repurchase agreements and FHLB advances | $ | 10,714,901 | $ | — | $ | — | $ | 10,714,901 | |||||||
Interest expense on repurchase agreements and FHLB advances, based on rates at March 31, 2015 | 8,480 | — | — | 8,480 | |||||||||||
Long-term operating lease obligation | 262 | 66 | — | 328 | |||||||||||
Total | $ | 10,723,643 | $ | 66 | $ | — | $ | 10,723,709 | |||||||
December 31, 2014 | Within One Year | One to Three Years | Three to Five Years | Total | |||||||||||
Repurchase agreements and FHLB advances | $ | 11,289,559 | $ | — | $ | — | $ | 11,289,559 | |||||||
Interest expense on repurchase agreements and FHLB advances, based on rates at December 31, 2014 | 8,448 | — | — | 8,448 | |||||||||||
Long-term operating lease obligation | 262 | 131 | — | 393 | |||||||||||
Total | $ | 11,298,269 | $ | 131 | $ | — | $ | 11,298,400 | |||||||
At March 31, 2015 and December 31, 2014, we had the following interest rate swap and cap contracts (in thousands):
As of March 31, 2015
Interest Rate Swaps | Weighted-Average | Notional | Fair | |||||||
Expiration Year | Fixed Pay Rate | Amount | Value | |||||||
2017 | 0.87% | $ | 2,750,000 | $ | 5,443 | |||||
2018 | 1.16% | 2,000,000 | (2,841 | ) | ||||||
2019 | 1.75% | 800,000 | (12,073 | ) | ||||||
2021 | 2.33% | 1,700,000 | (17,253 | ) | ||||||
2022 | 2.15% | 500,000 | (446 | ) | ||||||
Total | 1.44% | $ | 7,750,000 | $ | (27,170 | ) | ||||
Interest Rate Caps | Weighted-Average | Notional | Fair | |||||||
Expiration Year | Cap Rate | Amount | Value | |||||||
2019 | 1.34% | $ | 800,000 | $ | 19,353 | |||||
2020 | 1.25% | 1,700,000 | 60,919 | |||||||
Total | 1.28% | $ | 2,500,000 | $ | 80,272 | |||||
34
As of December 31, 2014
Interest Rate Swaps | Weighted-Average | Notional | Fair | |||||||
Expiration Year | Fixed Pay Rate | Amount | Value | |||||||
2017 | 0.87% | $ | 2,750,000 | $ | 22,580 | |||||
2018 | 1.16% | 2,000,000 | 13,760 | |||||||
2019 | 1.75% | 800,000 | (3,232 | ) | ||||||
2021 | 2.35% | 2,100,000 | (8,505 | ) | ||||||
Total | 1.44% | $ | 7,650,000 | $ | 24,603 | |||||
Interest Rate Caps | Weighted-Average | Notional | Fair | |||||||
Expiration Year | Cap Rate | Amount | Value | |||||||
2019 | 1.34% | $ | 800,000 | $ | 26,996 | |||||
2020 | 1.25% | 1,700,000 | 80,678 | |||||||
Total | 1.28% | $ | 2,500,000 | $ | 107,674 | |||||
We enter into certain agreements that contain a variety of indemnification obligations, principally with our brokers and counterparties to interest rate swap contracts and repo borrowings. The maximum potential future payment amount we could be required to pay under these indemnification obligations is unlimited. We have not incurred any costs to defend lawsuits or settle claims related to these indemnification obligations. As a result, the estimated fair value of these agreements is minimal. Accordingly, we recorded no liabilities for these agreements as of March 31, 2015 and December 31, 2014. In addition, as of March 31, 2015 and December 31, 2014, we had $2,767.0 million and $1,505.5 million of payable for securities purchased, respectively, a portion of which either will be or was financed through repo borrowings. A summary of our payable for securities purchased as of March 31, 2015 and December 31, 2014 is included in the Financial Condition—Liabilities section.
Off-Balance Sheet Arrangements
As of March 31, 2015 and December 31, 2014, we did not maintain any relationships with unconsolidated entities or financial partnerships, such as entities often referred to as structured finance, special purpose or variable interest entities, established for the purpose of facilitating off-balance sheet arrangements or other contractually narrow or limited purposes. Further, as of March 31, 2015 and December 31, 2014, we had not guaranteed any obligations of unconsolidated entities or entered into any commitment or had any intent to provide funding to any such entities.
Liquidity and Capital Resources
Our primary sources of funds are repo borrowings, FHLB advances, equity offerings, asset sales and monthly principal and interest payments on our investment portfolio. Because the level of our borrowings can be adjusted on a daily basis, the level of cash carried on our balance sheet is significantly less important than the potential liquidity available under our borrowing arrangements. We currently believe that we have sufficient liquidity and capital resources available for the acquisition of additional investments, repayments on borrowings, maintenance of any margin requirements and the payment of cash dividends as required for our continued qualification as a REIT. To qualify as a REIT, we must distribute annually at least 90% of our net taxable income. To the extent that we annually distribute all of our net taxable income in a timely manner, we will generally not be subject to federal and state income taxes. We currently expect to distribute all or substantially all of our taxable income in a timely manner so that we are not subject to federal and state income taxation. This distribution requirement limits our ability to retain earnings and thereby replenish or increase capital from operations.
As of March 31, 2015 and December 31, 2014, we had approximately $1,380.6 million and $1,319.7 million, respectively, in Agency RMBS, U.S. Treasuries and cash available to satisfy future margin calls. To date, we have maintained sufficient liquidity to meet margin calls, and we have never been unable to satisfy a margin call, although no assurance can be given that we will be able to satisfy requests from our lenders to post additional collateral in the future. During the three months ended March 31, 2015, we maintained an average liquidity level of 62% and never less than 56% of stockholders' equity.
During the first quarters of 2015 and 2014, we had average repo borrowings and FHLB advances outstanding of $10,954.4 million and $10,867.6 million, respectively, with an average cost of funds of 0.35% and 0.35%, respectively. The availability of repo borrowing financing was generally stable with interest rates between 0.32% and 0.46% for 30-90 day repo borrowings at March 31, 2015. In March 2015, CYS Insurance began to access repo borrowing advances from the FHLB of Cincinnati. We expect CYS Insurance to access both short-term and long-terms advances from the FHLB.
35
To limit our exposure to counterparty credit risk, we diversify our funding across multiple counterparties and by counterparty region. As of March 31, 2015 and December 31, 2014, we had master repurchase agreements with 47 and 45 financial institutions, and access to 48 and 45 counterparties respectively, subject to certain conditions, located throughout North America, Europe and Asia. In the three months ended March 31, 2015, we added three new counterparties and entered into repo borrowings and FHLB advances with these counterparties. The table below includes a summary of our repo borrowing funding by number of repo borrowing counterparties and counterparty region as of March 31, 2015 and December 31, 2014:
March 31, 2015 | ||||||
Counterparty Region | Number of Counterparties | Percent of Borrowings and Advances | ||||
North America | 20 | 55.3 | % | |||
Europe | 9 | 29.8 | % | |||
Asia | 5 | 14.9 | % | |||
34 | 100.0 | % | ||||
December 31, 2014 | ||||||
Counterparty Region | Number of Counterparties | Percent of Borrowings and Advances | ||||
North America | 18 | 51.9 | % | |||
Europe | 9 | 30.2 | % | |||
Asia | 5 | 17.9 | % | |||
32 | 100.0 | % | ||||
Our repurchase agreements contain typical provisions and covenants as set forth in the standard master repurchase agreement published by the Securities Industry and Financial Markets Association. Our repurchase agreements generally require us to transfer additional securities to the counterparty in the event the value of the securities then held by the counterparty in the margin account falls below specified levels and contain events of default in cases where we or the counterparty breaches our respective obligations under the agreement.
We receive margin calls from our repo borrowings counterparties from time to time in the ordinary course of business similar to other entities in the specialty finance business. We receive two types of margin calls under our repurchase agreements. The first type, which are known as "factor calls", are margin calls that occur each month and relate to the timing difference between the reduction of principal balances of our Agency RMBS, due to monthly principal payments on the underlying mortgages, and the receipt of the corresponding cash. The second type of margin call we may receive is a “valuation call”, which occurs due to market and interest rate movements. Both factor and valuation margin calls occur if the total value of our assets pledged as collateral to our counterparty drops beyond a threshold level, typically between $100,000 and $500,000. Both types of margin calls require a dollar for dollar restoration of the margin shortfall. Conversely, we may initiate margin calls to our counterparties when the value of our assets pledged as collateral with a counterparty increases above the threshold level, thereby increasing our liquidity. All unrestricted cash plus any unpledged securities are available to satisfy margin calls.
Our collateral is generally valued on the basis of prices provided by recognized bond market sources agreed to by the parties. Inputs to the models used by pricing sources may include, but are not necessarily limited to, reported trades, executable bid and asked prices, broker quotations, prices or yields of securities with similar characteristics, benchmark curves or information pertaining to the issuer, as well as industry and economic events. Our master agreements for repurchase transactions contain mostly standard provisions for the valuation of collateral. These agreements typically provide that both the repurchase seller (the borrower) and the repurchase buyer (the lender) value the collateral on a daily basis. Each party uses prices that it obtains from generally recognized pricing sources, or the most recent closing bid quotation from such a source. If the buyer, or the seller, as the case may be, determines that additional collateral is required, it may call for the delivery of such collateral. Under certain of our repurchase agreements, in limited circumstances, such as when a pricing source is not available, our lenders have the right to determine the value of the collateral we have provided to secure our repurchase borrowings. In instances where we have agreed to permit our lenders to make a determination of the value of such collateral, such lenders are expected to act reasonably and in good faith in making such valuation determinations.
An event of default or termination event under the standard master repurchase agreement would give our counterparty the option to terminate all repurchase transactions existing with us and make any amount due by us to the counterparty immediately payable.
During the three months ended March 31, 2015 and 2014, we recorded $462.4 million and $279.8 million of principal repayments, respectively, and received $81.4 million and $87.1 million of interest payments, respectively. We held cash of $7.2
36
million and $4.3 million at March 31, 2015 and December 31, 2014, respectively. For the three months ended March 31, 2015 and 2014, net cash provided by operating activities was $53.9 million and $49.5 million, respectively.
Our investment portfolio is comprised principally of highly liquid Agency RMBS guaranteed by Freddie Mac or Fannie Mae, and Ginnie Mae RMBS, and U.S. Treasuries backed by the full faith and credit of the U.S. government. We regularly monitor the creditworthiness of the U.S. government. While the U.S. government has had its credit rating downgraded in recent years by one of the credit rating agencies, it remains one of the most secure creditors in the world as of March 31, 2015. See Note 3, Investments in Securities.
We may increase our capital resources by obtaining long-term credit facilities or making public or private offerings of equity or debt securities. Such financing will depend on market conditions for capital raises and for the investment of any proceeds. If we are unable to renew, replace or expand our sources of financing on substantially similar terms, it may have an adverse effect on our business and results of operations.
From time to time we raise capital through sale and issuance of our capital stock. On May 23, 2014, we filed an automatically effective shelf registration statement on Form S-3 with the SEC. We may offer and sell, from time to time, shares of common stock, preferred stock and debt securities in one or more offerings pursuant to the prospectus that is a part of the registration statement. As of March 31, 2015, we had not issued any shares of common stock, preferred stock or debt securities under the prospectus.
Another vehicle to raise capital is our Direct Share Purchase Program ("DSPP"), through which stockholders may purchase additional shares of common stock by reinvesting some or all of the cash dividends received on shares of common stock. Stockholders may also make optional cash purchases of shares of common stock subject to certain limitations detailed in the plan prospectus. We did not issue any shares under the plan during the three months ended March 31, 2015 and 2014. As of March 31, 2015 and December 31, 2014, there were approximately 4.1 million shares available for issuance under the DSPP.
Effective May 15, 2014, the Company terminated that certain Equity Distribution Agreement by and between the Company and JMP Securities LLC (“JMP”), dated as of June 7, 2011 (the “JMP Agreement”), in connection with the expiration of the Company’s prior shelf registration statement on Form S-3. Under the JMP Agreement, the Company could offer and sell, from time to time, up to 15.0 million shares of the Company’s common stock through an “at-the-market” offering program with JMP. The Company sold 11.9 million shares of common stock under the JMP Agreement. For the three months ended March 31, 2015 and 2014, the Company did not sell any shares of common stock under the JMP Agreement.
On November 15, 2012, the Company announced that its Board of Directors authorized the repurchase of shares of the Company’s common stock having an aggregate value of up to $250 million. Pursuant to this program, through July 20, 2014, the Company repurchased approximately $115.7 million in aggregate value of its shares of common stock on the open market. On July 21, 2014, the Company announced that its Board of Directors authorized the repurchase of shares of the Company's common stock having an aggregate value of up to $250 million, which included the approximately $134.3 million available for repurchase under the November 2012 authorization. Subsequently in 2014, we repurchased 172,549 shares for an aggregate of approximately $1.5 million. In the three months ended March 31, 2015, we repurchased 4,149,571 shares at a weighted-average purchase price of $8.95, for an aggregate of approximately $37.2 million. Accordingly, the Company still had approximately $211.2 million authorized to repurchase shares of its common stock as of March 31, 2015.
Quantitative and Qualitative Disclosures about Short-Term Borrowings
The following table discloses quantitative data about our repo borrowings and FHLB advances during the three months ended March 31, 2015 and 2014:
Three Months Ended March 31, | |||||||
(In millions) | 2015 | 2014 | |||||
Outstanding at period end | $ | 10,715 | $ | 10,014 | |||
Weighted-average rate at period end | 0.34 | % | 0.31 | % | |||
Average outstanding during period (1) | $ | 10,954 | $ | 10,868 | |||
Weighted-average rate during period | 0.35 | % | 0.35 | % | |||
Largest month end balance during period | $ | 11,198 | $ | 11,771 | |||
_______________
(1) | Calculated based on the average month end balance during the period. |
The Company's borrowing rates remained largely unchanged during each of the three months ended March 31, 2015 and 2014 due to a generally stable borrowing environment. In addition, we used more U.S. Treasuries as collateral for repo borrowings at March 31, 2015, which attract lower borrowing rates, and CYS Insurance now has access to advances from the
37
FHLB of Cincinnati, which in each case were not material from an aggregate interest expense standpoint, were at attractive financing rates relative to our other borrowings secured by Agency RMBS.
At March 31, 2015 and December 31, 2014, the Company had no repo borrowings or FHLB advance where the amount at risk with an individual counterparty exceeded 1.6% and 1.6% of stockholders' equity, respectively. In addition, we had no repo borrowings or FHLB advance with any counterparty that exceeded 4% of our total assets.
Inflation
Virtually all of our assets and liabilities are interest rate sensitive in nature. As a result, interest rates and other factors influence our performance more than inflation. Changes in interest rates do not necessarily correlate with inflation rates or changes in inflation rates. Our financial statements are prepared in accordance with U.S. GAAP and our distributions are determined by our Board of Directors based in part on our REIT taxable income as calculated according to the requirements of the Internal Revenue Code. In each case, our activities and balance sheet are measured with reference to fair value without considering inflation.
Item 3. Quantitative and Qualitative Disclosures about Market Risk
As of March 31, 2015 and December 31, 2014, the primary component of our market risk was interest rate risk, as described below. While we do not seek to avoid risk completely, we do believe that risk can be quantified from historical experience, and actively managed, to earn sufficient compensation to justify taking risks and to maintain capital levels consistent with the risks we undertake. Our Board of Directors exercises oversight of risk management in many ways, including overseeing our senior management’s risk-related responsibilities and reviewing management and investment policies and performance against these policies and related benchmarks. See “Business—Risk Management” in our 2014 Annual Report for a further discussion of our risk management practices.
Interest Rate Risk
We are subject to interest rate risk in connection with our investments in Agency RMBS collateralized by ARMs, hybrid ARMs and fixed rate mortgage loans and our related debt obligations, which are generally repo borrowings of limited duration that are periodically refinanced at current market rates. We seek to manage this risk through utilization of derivative contracts, primarily interest rate swap and cap contracts.
Effect on Net Interest Income. We fund our investments in long-term Agency RMBS collateralized by ARMs, hybrid ARMs and fixed rate mortgage loans with short-term repo borrowings and FHLB advances. During periods of rising interest rates, the borrowing costs associated with those Agency RMBS tend to increase while the income earned on such Agency RMBS (during the fixed rate component of such securities) may remain substantially unchanged. This results in a narrowing of the net interest spread between the related assets and borrowings and may even result in losses.
We are a party to the interest rate swap and cap contracts as of March 31, 2015 and December 31, 2014 described in detail under Item 2. “Management’s Discussion and Analysis of Financial Condition and Results of Operations—Contractual Obligations and Commitments” in this Quarterly Report on Form 10-Q.
Hedging techniques are partly based on assumed levels of prepayments of our Agency RMBS. If prepayments are slower or faster than assumed, the life of the Agency RMBS will be longer or shorter, which would reduce the effectiveness of any hedging strategies we may use and may cause losses on such transactions.
Effect on Fair Value. Another component of interest rate risk is the effect changes in interest rates will have on the fair value of our assets. We face the risk that the fair value of our assets will increase or decrease at different rates than that of our liabilities, including our hedging instruments.
We primarily assess our interest rate risk by estimating the duration of our assets and the duration of our liabilities. Duration essentially measures the market price volatility of financial instruments as interest rates change. We generally calculate duration using various third-party financial models and empirical data. Different models and methodologies can produce different duration numbers for the same securities.
Extension Risk. We invest in Agency RMBS collateralized by hybrid ARMs, which have interest rates that are fixed for the first few years of the loan (typically three, five, seven or ten years) and thereafter reset periodically on the same basis as Agency RMBS collateralized by ARMs. We compute the projected weighted-average life of our Agency RMBS collateralized by hybrid ARMs based on assumptions regarding the rate at which the borrowers will prepay the underlying mortgages. In general, when Agency RMBS collateralized by fixed rate or hybrid ARMs is acquired with borrowings, we may, but are not required to, enter into an interest rate swap contract or other hedging instrument that effectively fixes our borrowing costs for a period close to the anticipated weighted-average life of the fixed rate portion of the related Agency RMBS. This strategy is
38
designed to protect us from rising interest rates by fixing our borrowing costs for the duration of the fixed rate period of the collateral underlying the related Agency RMBS.
We have structured our swaps to expire in conjunction with the estimated weighted-average life of the fixed period of the mortgages underlying our Agency RMBS portfolio. However, in a rising interest rate environment, the weighted-average life of the fixed rate mortgages underlying our Agency RMBS could extend beyond the term of the swap agreement or other hedging instrument. This could have a negative impact on our results from operations, as borrowing costs would no longer be fixed after the term of the hedging instrument while the income earned on the remaining Agency RMBS would remain fixed for a period of time. This situation may also cause the market value of our Agency RMBS to decline with little or no offsetting gain from the related hedging transactions. In extreme situations, we may be forced to sell assets to maintain adequate liquidity, which could cause us to incur losses.
Interest Rate Cap Risk. Both the ARMs and hybrid ARMs that collateralize our Agency RMBS are typically subject to periodic and lifetime interest rate caps and floors, which limit the amount by which the security’s interest yield may change during any given period. However, our borrowing costs will not be subject to similar restrictions. Therefore, in a period of increasing interest rates, the interest costs on our borrowings could increase without limitation by caps while the interest rate yields on our Agency RMBS would effectively be limited by caps. This problem will be magnified to the extent that we acquire Agency RMBS that are collateralized by hybrid ARMs that are not fully indexed. In addition, the underlying mortgages may be subject to periodic payment caps that result in some portion of the interest being deferred and added to the principal outstanding. This could result in our receipt of less cash income on our Agency RMBS than we need in order to pay the interest cost on our related borrowings. These factors could lower our net interest income or cause a net loss during periods of rising interest rates, which would harm our financial condition, cash flows and results of operations.
Interest Rate Mismatch Risk. We intend to fund a substantial portion of our acquisitions of Agency RMBS with borrowings that, after the effect of hedging, have interest rates based on indices and repricing terms similar to, but of somewhat shorter maturities than, the interest rate indices and repricing terms of the Agency RMBS. Thus, we anticipate that in most cases the interest rate indices and repricing terms of our Agency RMBS and our funding sources will not be identical, thereby creating an interest rate mismatch between assets and liabilities. Therefore, our cost of funds would likely rise or fall more quickly than would our earnings rate on assets. During periods of changing interest rates, such interest rate mismatches could negatively impact our financial condition, cash flows and results of operations. To manage interest rate mismatches, we may utilize the hedging strategies discussed above.
Our analysis of risks is based on management’s experience, estimates, models and assumptions. These analyses rely on models which utilize estimates of fair value and interest rate sensitivity. Actual economic conditions or implementation of investment decisions by our management may produce results that differ significantly from the estimates and assumptions used in our models and the projected results reflected herein.
Prepayment Risk
Prepayments are the full or partial repayment of principal prior to the original contractual maturity of a mortgage loan, and typically occur due to refinancing of mortgage loans. Prepayment rates for existing Agency RMBS generally increase when prevailing mortgage interest rates fall, and vice-versa. In addition, prepayment rates on Agency RMBS collateralized by ARMs and hybrid ARMs generally increase when the difference between long-term and short-term interest rates declines or becomes negative, and vice-versa. Additionally, we own Agency RMBS that were purchased at a premium. The prepayment of such Agency RMBS at a rate faster than anticipated would result in a write-off of any remaining capitalized premium amount.
We seek to manage our prepayment risk by investing in Agency RMBS with (i) a variety of prepayment characteristics, (ii) prepayment prohibitions and penalties and (iii) prepayment protections, as well as by balancing Agency RMBS purchased at a premium with Agency RMBS purchased at a discount.
Effect on Fair Value and Net Income
Another component of interest rate risk is the effect changes in interest rates will have on the fair value of our assets and our net income exclusive of the effect on fair value. We face the risk that the fair value of our assets and net interest income will increase or decrease at different rates than that of our liabilities, including our hedging instruments.
We primarily assess our interest rate risk by estimating the duration of our assets and the duration of our liabilities. Duration essentially measures the market price volatility of financial instruments as interest rates change. We generally calculate duration using various financial models and empirical data. Different models and methodologies can produce different duration numbers for the same securities.
The following sensitivity analysis table shows the estimated impact of our interest rate-sensitive investments and repo borrowing liabilities on the fair value of our assets and our net income, exclusive of the effect of changes in fair value on our
39
net income, at March 31, 2015 and December 31, 2014, assuming a static portfolio and that rates instantaneously fall 25, 50 and 75 bps and rise 25, 50 and 75 bps:
March 31, 2015
Change in Interest Rates | Projected Change in Our Net Income | Projected Change in the Fair Value of Our Assets (including hedging instruments)(1) | Projected Change in Stockholders' Equity | ||||||
- 75 basis points | 7.90 | % | (1) | 0.11 | % | 0.89 | % | ||
- 50 basis points | 6.32 | % | (1) | 0.23 | % | 1.75 | % | ||
- 25 basis points | 3.16 | % | (1) | 0.20 | % | 1.58 | % | ||
No Change | — | % | — | % | — | % | |||
+ 25 basis points | (7.90 | )% | (0.29 | )% | (2.22 | )% | |||
+ 50 basis points | (15.81 | )% | (0.65 | )% | (5.07 | )% | |||
+ 75 basis points | (23.71 | )% | (1.12 | )% | (8.68 | )% | |||
December 31, 2014
Change in Interest Rates | Projected Change in Our Net Income | Projected Change in the Fair Value of Our Assets (including hedging instruments)(1) | Projected Change in Stockholders' Equity | ||||||
- 75 basis points | 6.88 | % | (1) | 0.13 | % | 1.09 | % | ||
- 50 basis points | 5.50 | % | (1) | 0.24 | % | 1.91 | % | ||
- 25 basis points | 2.75 | % | (1) | 0.22 | % | 1.71 | % | ||
No Change | — | % | — | % | — | % | |||
+ 25 basis points | (6.88 | )% | (0.31 | )% | (2.30 | )% | |||
+ 50 basis points | (13.75 | )% | (0.73 | )% | (5.47 | )% | |||
+ 75 basis points | (20.63 | )% | (1.22 | )% | (9.10 | )% | |||
_____________
* | Analytics provided by The Yield Book® Software. |
(1) | Given the low level of interest rates at March 31, 2015 and December 31, 2014, we reduced 3-month LIBOR by 10, 20 and 25 bps and our repo borrowing rates by 10, 20 and 25 bps for the down 25, 50 and 75 bps net income scenarios, respectively. All other interest rate sensitive instruments were calculated in accordance with the table. |
While the charts above reflect the estimated immediate impact of interest rate increases and decreases on a static portfolio, we rebalance our portfolio from time to time either to take advantage or minimize the impact of changes in interest rates. Generally, our interest rate swaps reset in the quarter following changes in interest rates. It is important to note that the impact of changing interest rates on fair value and net income can change significantly when interest rates change beyond 75 bps from current levels. Therefore, the volatility in the fair value of our assets could increase significantly when interest rates change beyond 75 bps. In addition, other factors impact the fair value of and net income from our interest rate-sensitive investments and hedging instruments, such as the shape of the yield curve, market expectations as to future interest rate changes and other market conditions. Accordingly, in the event of changes in actual interest rates, the change in the fair value of our assets and our net income would likely differ from that shown above, and such difference might be material and adverse to our stockholders.
Risk Management
Our Board of Directors exercises its oversight of risk management in many ways, including overseeing our senior management’s risk-related responsibilities, and reviewing management policies and performance.
As part of our risk management process, we actively manage the interest rate, liquidity, prepayment and counterparty risks associated with our Agency RMBS portfolio. We seek to manage our interest rate risk exposure by entering into various hedging instruments in order to minimize our exposure to potential interest rate mismatches between the interest we earn on our investments and our borrowing costs.
We seek to manage our liquidity risks by monitoring our liquidity position on a daily basis and maintaining a prudent level of leverage, which we currently consider to be between five and ten times the amount of stockholders' equity in our overall portfolio, based on current market conditions and various other factors, including the health of the financial institutions that lend to us under our repurchase agreements and the presence of special liquidity programs provided by domestic and foreign central banks, and by the FHLB of Cincinnati.
40
We seek to manage our prepayment risk by investing in Agency RMBS with a variety of prepayment characteristics as well as by balancing Agency RMBS purchased at a premium with Agency RMBS purchased at a discount.
We seek to manage our counterparty risk by (i) diversifying our exposure across a broad number of counterparties, (ii) limiting our exposure to any one counterparty, and (iii) monitoring the financial stability of our counterparties.
Item 4. Controls and Procedures
Evaluation of Disclosure Controls and Procedures
Our management, with the participation of our Chief Executive Officer and our Chief Financial Officer, evaluated the effectiveness of our disclosure controls and procedures as of March 31, 2015. The term “disclosure controls and procedures,” as defined in Rules 13a-15(e) and 15d-15(e) under the Securities Exchange Act of 1934, as amended (the “Exchange Act”), means controls and other procedures of a company that are designed to ensure that information required to be disclosed by a company in the reports that it files or submits under the Exchange Act is recorded, processed, summarized and reported, within the time periods specified in the SEC’s rules and forms. Disclosure controls and procedures include, without limitation, controls and procedures designed to ensure that information required to be disclosed by a company in the reports that it files or submits under the Exchange Act is accumulated and communicated to the company’s management, including its principal executive and principal financial officers, as appropriate to allow timely decisions regarding required disclosure. Management recognizes that any controls and procedures, no matter how well designed and operated, can provide only reasonable assurance of achieving their objectives and management necessarily applies its judgment in evaluating the cost-benefit relationship of possible controls and procedures. Based on the evaluation of our disclosure controls and procedures as of March 31, 2015, our Chief Executive Officer and Chief Financial Officer concluded that, as of such date, our disclosure controls and procedures were effective.
There have been no changes in our internal controls over financial reporting that occurred during the last fiscal quarter that have materially affected, or are reasonably likely to materially affect, our internal controls over financial reporting.
PART II. Other Information
Item 1. Legal Proceedings
The Company is not currently subject to any material legal proceedings.
Item 1A. Risk Factors
There were no material changes during the period covered by this Quarterly Report to the risk factors previously disclosed in our 2014 Annual Report, other than those disclosed below. Additional risks not presently known, or that we currently deem immaterial, also, may have a material adverse effect on our business, financial condition and results of operations.
Risks Related To Our Business
We leverage our portfolio investments in Debt Securities, which may adversely affect our return on our investments and may reduce cash available for distribution to our stockholders.
We leverage our portfolio investments in Debt Securities through repo borrowings and other secured forms of borrowing (including FHLB advances). Leverage can enhance our potential returns, but can also exacerbate losses. As of March 31, 2015, our leverage ratio (calculated by dividing our (i) repo borrowings balance plus payable for securities purchased minus receivable for securities sold by (ii) stockholders' equity) was approximately 6.77 to 1.
Our access to financing depends on a number of factors over which we have little or no control, including:
•general market conditions;
•the lender's view of the quality of our assets;
•the lender's perception of our growth potential;
•regulatory requirements of the FHFA or FHLB;
•our current and potential earnings and cash distributions; and
•the market prices for shares of our common stock.
Any weakness or volatility in the capital markets, the residential mortgage markets or the economy generally could adversely impact the factors listed above. In addition, such weakness or volatility could adversely affect one or more of our potential lenders, and could cause one or more of our potential lenders to be unwilling or unable to provide us with financing, or could cause the costs of such financing to increase.
41
Our return on investments and cash available for distribution to our stockholders may be reduced if market conditions cause the cost of our financing to increase relative to the income that can be derived from the assets acquired, which could adversely affect our net income, financial condition and results of operations, and the price of our common stock. In addition, our debt service payments will reduce cash flow available for distribution to stockholders. We may not be able to meet our debt service obligations. To the extent that we cannot meet our debt service obligations, we risk the loss of some or all of our assets to foreclosure or sale to satisfy our debt obligations.
The membership of our captive insurance company, CYS Insurance Services, LLC, in the FHLB of Cincinnati may be terminated, and any advances outstanding to CYS Insurance from the FHLB of Cincinnati would be immediately unwound, possibly at a loss.
In September 2014, the Federal Housing Financing Authority issued RIN 2590-AA39, Notice of Proposed Rulemaking and Request for Comments Involving Proposed Changes to Regulations Concerning Federal Home Loan Bank Membership Criteria (the "Proposed Rule"). The Proposed Rule, among other things, addresses membership terminations for captive insurance companies that became members of the FHLB systems after publication of the Proposed Rule, which would include CYS Insurance. Under the Proposed Rule, CYS Insurance would be ineligible to continue as a member of the FHLB of Cincinnati as of the effective date of the final rule, if adopted as proposed, and as a result would be required to immediately terminate such membership. If CYS Insurance's membership in the FHLB were terminated, the FHLB would have up to five years to redeem the FHLB stock that CYS Insurance purchased and owns as the result of its membership and level of FHLB activity. In addition, if such membership were terminated, CYS Insurance would be required to promptly unwind any outstanding debt advances from the FHLB. This could cause us to experience losses and may have a material adverse effect on our business.
Item 2. Unregistered Sales of Equity Securities and Use of Proceeds
Issuer Purchases of Equity Securities
The following table summarizes the Company's purchases of shares of its common stock during the three months ended March 31, 2015 (dollars in thousands except per share amounts):
Period | Total Number of Shares Purchased 1 | Average Price Paid Per Share 1 | Dollar Value of Shares That May Yet Be Purchased 1 | ||||||||
January 1, 2015 - January 31, 2015 | — | $ | — | $ | 248,465 | ||||||
February 1, 2015 - February 28, 2015 | 2,379,352 | 8.90 | 227,230 | ||||||||
March 1, 2015 - March 31, 2015 | 1,770,219 | 9.02 | 211,233 | ||||||||
Total | 4,149,571 | $ | 8.95 | ||||||||
____________
1 The Company repurchased shares of its common stock in open-market transactions pursuant to its share repurchase program, authorized by its Board of Directors and publicly announced on July 21, 2014. Pursuant to this authority, the Company may repurchase shares of its common stock up to $250 million in aggregate value. Between July 21, 2014 and December 31, 2014, the Company repurchased approximately $1.5 million in aggregate value of its common stock. As of March 31, 2015, the Company still had approximately $211.2 million remaining authorized to repurchase shares of its common stock.
Item 3. Defaults Upon Senior Securities
None.
Item 4. Mine Safety Disclosures
None.
Item 5. Other Information
None.
Item 6. Exhibits
(a) | Exhibits. |
42
Exhibit Number | Description of Exhibit | |
3.1(1) | Articles of Amendment and Restatement of CYS Investments, Inc. | |
3.2(2) | Articles of Amendment to the Articles of Amendment and Restatement | |
3.3(2) | Articles of Amendment to the Articles of Amendment and Restatement | |
3.4(3) | Articles of Amendment to the Articles of Amendment and Restatement | |
3.5(4) | Articles Supplementary of 7.75% Series A Cumulative Redeemable Preferred Stock | |
3.6(5) | Articles Supplementary of 7.50% Series B Cumulative Redeemable Preferred Stock | |
3.7(6) | Amended and Restated Bylaws of CYS Investments, Inc. | |
31.1* | Certification of Chief Executive Officer pursuant to Section 302 of the Sarbanes – Oxley Act of 2002 | |
31.2* | Certification of Chief Financial Officer pursuant to Section 302 of the Sarbanes – Oxley Act of 2002 | |
32.1** | Certification of Chief Executive Officer pursuant to 18 U.S.C. Section 1350, as adopted pursuant to Section 906 of the Sarbanes – Oxley Act of 2002 | |
32.2** | Certification of Chief Financial Officer pursuant to 18 U.S.C. Section 1350, as adopted pursuant to Section 906 of the Sarbanes – Oxley Act of 2002 | |
Exhibit 101.INS XBRL | Instance Document (7) | |
Exhibit 101.SCH XBRL | Taxonomy Extension Schema Document (7) | |
Exhibit 101.CAL XBRL | Taxonomy Extension Calculation Linkbase Document (7) | |
Exhibit 101.DEF XBRL | Additional Taxonomy Extension Definition Linkbase Document Created (7) | |
Exhibit 101.LAB XBRL | Taxonomy Extension Label Linkbase Document (7) | |
Exhibit 101.PRE XBRL | Taxonomy Extension Presentation Linkbase Document (7) | |
_________________
* Filed herewith.
** Furnished herewith.
(1) | Incorporated by reference to the Registrant’s Registration Statement on Form S-11 filed with the Securities and Exchange Commission (File No. 333-142236). |
(2) | Incorporated by reference from the Registrant’s Form 10-K filed with the Securities and Exchange Commission on February 10, 2010. |
(3) | Incorporated by reference from the Registrant’s Current Report on Form 8-K filed with the Securities and Exchange Commission on September 1, 2011. |
(4) | Incorporated by reference from the Registrant's Current Report on Form 8-K filed with the Securities and Exchange Commission on August 12, 2012. |
(5) | Incorporated by reference from the Registrant's Current Report on Form 8-K filed with the Securities and Exchange Commission on April 29, 2013. |
(6) | Incorporated by reference from the Registrant’s Form 10-K filed with the Securities and Exchange Commission on February 10, 2012. |
(7) | Submitted electronically herewith. Attached as Exhibit 101 to this report are the following documents formatted in XBRL (Extensible Business Reporting Language): (i) Consolidated Balance Sheets at March 31, 2015 (Unaudited) and December 31, 2014 (Derived from the audited balance sheet at December 31, 2014); (ii) Consolidated Statements of Operations (Unaudited) for the three months ended March 31, 2015 and 2014; (iii) Consolidated Statement of Changes in Stockholders' Equity (Unaudited) for the three months ended March 31, 2015; (iv) Consolidated Statements of Cash Flows (Unaudited) for the three months ended March 31, 2015 and 2014; and (v) Consolidated Notes to Financial Statements (Unaudited) for the three months ended March 31, 2015 and 2014. |
43
SIGNATURES
Pursuant to the requirements of the Securities Exchange Act of 1934, the registrant has duly caused this report to be signed on its behalf by the undersigned thereunto duly authorized.
CYS INVESTMENTS, INC.
Dated: April 24, 2015 | BY: /s/ FRANCES R. SPARK |
Frances R. Spark
Chief Financial Officer and Treasurer
(Principal Financial Officer)
44
EXHIBIT INDEX
Exhibit Number | Description | |
3.1(1) | Articles of Amendment and Restatement of CYS Investments, Inc. | |
3.2(2) | Articles of Amendment to the Articles of Amendment and Restatement | |
3.3(2) | Articles of Amendment to the Articles of Amendment and Restatement | |
3.4(3) | Articles of Amendment to the Articles of Amendment and Restatement | |
3.5(4) | Articles Supplementary of 7.75% Series A Cumulative Redeemable Preferred Stock | |
3.6(5) | Articles Supplementary of 7.50% Series B Cumulative Redeemable Preferred Stock | |
3.7(6) | Amended and Restated Bylaws of CYS Investments, Inc. | |
31.1* | Certification of Chief Executive Officer pursuant to Section 302 of the Sarbanes – Oxley Act of 2002 | |
31.2* | Certification of Chief Financial Officer pursuant to Section 302 of the Sarbanes – Oxley Act of 2002 | |
32.1** | Certification of Chief Executive Officer pursuant to 18 U.S.C. Section 1350, as adopted pursuant to Section 906 of the Sarbanes – Oxley Act of 2002 | |
32.2** | Certification of Chief Financial Officer pursuant to 18 U.S.C. Section 1350, as adopted pursuant to Section 906 of the Sarbanes – Oxley Act of 2002 | |
Exhibit 101.INS XBRL | Instance Document (7) | |
Exhibit 101.SCH XBRL | Taxonomy Extension Schema Document (7) | |
Exhibit 101.CAL XBRL | Taxonomy Extension Calculation Linkbase Document (7) | |
Exhibit 101.DEF XBRL | Additional Taxonomy Extension Definition Linkbase Document Created (7) | |
Exhibit 101.LAB XBRL | Taxonomy Extension Label Linkbase Document (7) | |
Exhibit 101.PRE XBRL | Taxonomy Extension Presentation Linkbase Document (7) | |
__________________
* Filed herewith.
** Furnished herewith.
(1) | Incorporated by reference to the Registrant’s Registration Statement on Form S-11 filed with the Securities and Exchange Commission (File No. 333-142236). |
(2) | Incorporated by reference from the Registrant’s Form 10-K filed with the Securities and Exchange Commission on February 10, 2010. |
(3) | Incorporated by reference from the Registrant’s Current Report on Form 8-K filed with the Securities and Exchange Commission on September 1, 2011. |
(4) | Incorporated by reference from the Registrant's Current Report on Form 8-K filed with the Securities and Exchange Commission on August 12, 2012. |
(5) | Incorporated by reference from the Registrant's Current Report on Form 8-K filed with the Securities and Exchange Commission on April 29, 2013. |
(6) | Incorporated by reference from the Registrant’s Form 10-K filed with the Securities and Exchange Commission on February 10, 2012. |
(7) | Submitted electronically herewith. Attached as Exhibit 101 to this report are the following documents formatted in XBRL (Extensible Business Reporting Language): (i) Consolidated Balance Sheets at March 31, 2015 (Unaudited) and December 31, 2014 (derived from the audited balance sheet at December 31, 2014); (ii) Consolidated Statements of Operations (Unaudited) for the three months ended March 31, 2015 and 2014; (iii) Consolidated Statement of Changes in Stockholders' Equity (Unaudited) for the three months ended March 31, 2015; (iv) Consolidated Statements of Cash Flows (Unaudited) for the three months ended March 31, 2015 and 2014; and (v) Consolidated Notes to Financial Statements (Unaudited) for the three months ended March 31, 2015 and 2014. |
45
Exhibit 31.1
Certification of Chief Executive Officer Pursuant to Section 302 of the Sarbanes-Oxley Act of 2002
I, Kevin E. Grant, certify that:
1. | I have reviewed this Quarterly Report on Form 10-Q of CYS Investments, Inc.; |
2. | Based on my knowledge, this report does not contain any untrue statement of a material fact or omit to state a material fact necessary to make the statements made, in light of the circumstances under which such statements were made, not misleading with respect to the period covered by this report; |
3. | Based on my knowledge, the financial statements, and other financial information included in this report, fairly present in all material respects the financial condition, results of operations and cash flows of the registrant as of, and for, the periods presented in this report; |
4. | The registrant’s other certifying officer(s) and I are responsible for establishing and maintaining disclosure controls and procedures (as defined in Exchange Act Rules 13a-15(e) and 15d-15(e)) and internal control over financial reporting (as defined in Exchange Act Rules 13a-15(f) and 15d-15(f)) for the registrant and have: |
(a) Designed such disclosure controls and procedures, or caused such disclosure controls and procedures to be designed under our supervision, to ensure that material information relating to the registrant, including its consolidated subsidiaries, is made known to us by others within those entities, particularly during the period in which this report is being prepared;
(b) Designed such internal control over financial reporting, or caused such internal control over financial reporting to be designed under our supervision, to provide reasonable assurance regarding the reliability of financial reporting and the preparation of financial statements for external purposes in accordance with generally accepted accounting principles;
(c) Evaluated the effectiveness of the registrant’s disclosure controls and procedures and presented in this report our conclusions about the effectiveness of the disclosure controls and procedures, as of the end of the period covered by this report based on such evaluation; and
(d) Disclosed in this report any change in the registrant’s internal control over financial reporting that occurred during the registrant’s most recent fiscal quarter (the registrant’s fourth fiscal quarter in the case of an annual report) that has materially affected, or is reasonably likely to materially affect, the registrant’s internal control over financial reporting; and
5. | The registrant’s other certifying officer(s) and I have disclosed, based on our most recent evaluation of internal control over financial reporting, to the registrant’s auditors and the audit committee of the registrant’s board of directors (or persons performing the equivalent functions): |
(a) All significant deficiencies and material weaknesses in the design or operation of internal control over financial reporting which are reasonably likely to adversely affect the registrant’s ability to record, process, summarize and report financial information; and
(b) Any fraud, whether or not material, that involves management or other employees who have a significant role in the registrant’s internal control over financial reporting.
Dated: April 24, 2015
/s/ KEVIN E. GRANT | |
Kevin E. Grant | |
Chairman of the Board and Chief Executive Officer | |
Exhibit 31.2
Certification of Chief Financial Officer Pursuant to Section 302 of the Sarbanes-Oxley Act of 2002
I, Frances R. Spark, certify that:
1. | I have reviewed this Quarterly Report on Form 10-Q of CYS Investments, Inc.; |
2. | Based on my knowledge, this report does not contain any untrue statement of a material fact or omit to state a material fact necessary to make the statements made, in light of the circumstances under which such statements were made, not misleading with respect to the period covered by this report; |
3. | Based on my knowledge, the financial statements, and other financial information included in this report, fairly present in all material respects the financial condition, results of operations and cash flows of the registrant as of, and for, the periods presented in this report; |
4. | The registrant’s other certifying officer(s) and I are responsible for establishing and maintaining disclosure controls and procedures (as defined in Exchange Act Rules 13a-15(e) and 15d-15(e)) and internal control over financial reporting (as defined in Exchange Act Rules 13a-15(f) and 15d-15(f)) for the registrant and have: |
(a) Designed such disclosure controls and procedures, or caused such disclosure controls and procedures to be designed under our supervision, to ensure that material information relating to the registrant, including its consolidated subsidiaries, is made known to us by others within those entities, particularly during the period in which this report is being prepared;
(b) Designed such internal control over financial reporting, or caused such internal control over financial reporting to be designed under our supervision, to provide reasonable assurance regarding the reliability of financial reporting and the preparation of financial statements for external purposes in accordance with generally accepted accounting principles;
(c) Evaluated the effectiveness of the registrant’s disclosure controls and procedures and presented in this report our conclusions about the effectiveness of the disclosure controls and procedures, as of the end of the period covered by this report based on such evaluation; and
(d) Disclosed in this report any change in the registrant’s internal control over financial reporting that occurred during the registrant’s most recent fiscal quarter (the registrant’s fourth fiscal quarter in the case of an annual report) that has materially affected, or is reasonably likely to materially affect, the registrant’s internal control over financial reporting; and
5. | The registrant’s other certifying officer(s) and I have disclosed, based on our most recent evaluation of internal control over financial reporting, to the registrant’s auditors and the audit committee of the registrant’s board of directors (or persons performing the equivalent functions): |
(a) All significant deficiencies and material weaknesses in the design or operation of internal control over financial reporting which are reasonably likely to adversely affect the registrant’s ability to record, process, summarize and report financial information; and
(b) Any fraud, whether or not material, that involves management or other employees who have a significant role in the registrant’s internal control over financial reporting.
Dated: April 24, 2015
/s/ FRANCES R. SPARK | |
Frances R. Spark | |
Chief Financial Officer and Treasurer | |
Exhibit 32.1
Certification Pursuant To
18 U.S.C. Section 1350,
as Adopted Pursuant to
Section 906 of The Sarbanes-Oxley Act of 2002
In connection with the Quarterly Report of CYS Investments, Inc. (the “Company”) on Form 10-Q for the period ended March 31, 2015 as filed with the Securities and Exchange Commission on the date hereof (the “Report”), I, Kevin E. Grant, Chairman of the Board and Chief Executive Officer of the Company, certify, pursuant to 18 U.S.C. Section 1350, as adopted pursuant to Section 906 of the Sarbanes-Oxley Act of 2002, that:
(1) | the Report fully complies with the requirements of Section 13(a) or 15(d) of the Securities Exchange Act of 1934, as amended; and |
(2) | the information contained in the Report fairly presents, in all material respects, the financial condition and results of operations of the Company. |
Dated: April 24, 2015
/s/ KEVIN E. GRANT | |
Kevin E. Grant | |
Chairman of the Board and Chief Executive Officer | |
Exhibit 32.2
Certification Pursuant To
18 U.S.C. Section 1350,
as Adopted Pursuant to
Section 906 of The Sarbanes-Oxley Act of 2002
In connection with the Quarterly Report of CYS Investments, Inc. (the “Company”) on Form 10-Q for the period ended March 31, 2015 as filed with the Securities and Exchange Commission on the date hereof (the “Report”), I, Frances R. Spark, Chief Financial Officer and Treasurer of the Company, certify, pursuant to 18 U.S.C. Section 1350, as adopted pursuant to Section 906 of the Sarbanes-Oxley Act of 2002, that:
(1) | the Report fully complies with the requirements of Section 13(a) or 15(d) of the Securities Exchange Act of 1934, as amended; and |
(2) | the information contained in the Report fairly presents, in all material respects, the financial condition and results of operations of the Company. |
Dated: April 24, 2015
/s/ FRANCES R. SPARK | |
Frances R. Spark | |
Chief Financial Officer and Treasurer | |
Serious News for Serious Traders! Try StreetInsider.com Premium Free!
You May Also Be Interested In
- Zyxel Networks Partners with BlueStar to Expand Business in Canada
- EVgo to Report First Quarter 2024 Results on May 7, 2024
- HASI Announces First Quarter 2024 Earnings Release Date and Conference Call
Create E-mail Alert Related Categories
SEC FilingsSign up for StreetInsider Free!
Receive full access to all new and archived articles, unlimited portfolio tracking, e-mail alerts, custom newswires and RSS feeds - and more!
