

Form 10-Q Blackstone Group L.P. For: Sep 30
 Tweet
Tweet Share
ShareTable of Contents
�
�
UNITED STATES
SECURITIES AND EXCHANGE COMMISSION
WASHINGTON, D.C. 20549
FORM 10-Q
(Mark One)
| x | QUARTERLY REPORT PURSUANT TO SECTION 13 OR 15(d) OF THE SECURITIES EXCHANGE ACT OF 1934 FOR THE QUARTERLY PERIOD ENDED SEPTEMBER�30, 2014 |
OR
�
| � | TRANSITION REPORT PURSUANT TO SECTION 13 OR 15(d) OF THE SECURITIES EXCHANGE ACT OF 1934 FOR THE TRANSITION PERIOD FROM������������ TO������������ |
Commission File Number: 001-33551
�
�

The Blackstone Group L.P.
(Exact name of Registrant as specified in its charter)
�
| Delaware | � | 20-8875684 |
| (State or other jurisdiction of incorporation or organization) |
� | (I.R.S. Employer Identification No.) |
345 Park Avenue
New York, New York 10154
(Address of principal executive offices)(Zip Code)
(212) 583-5000
(Registrant�s telephone number, including area code)
�
�
Indicate by check mark whether the Registrant (1)�has filed all reports required to be filed by Section�13 or 15(d) of the Securities Exchange Act of 1934 during the preceding 12 months (or for such shorter period that the Registrant was required to file such reports), and (2)�has been subject to such filing requirements for the past 90 days.����Yes��x����No���
Indicate by check mark whether the registrant has submitted electronically and posted on its corporate Web site, if any, every Interactive Data File required to be submitted and posted pursuant to Rule 405 of Regulation S-T (�232.405 of this chapter) during the preceding 12 months (or for such shorter period that the registrant was required to submit and post such files).����Yes��x����No���
Indicate by check mark whether the Registrant is a large accelerated filer, an accelerated filer, a non-accelerated filer or a smaller reporting company. See the definitions of �large accelerated filer�, �accelerated filer� and �smaller reporting company� in Rule 12b-2 of the Exchange Act.
�
| Large accelerated filer��x |
�� | Accelerated filer��� |
| Non-accelerated filer��� |
�� | Smaller reporting company��� |
| (Do not check if a smaller reporting company) |
�� |
Indicate by check mark whether the Registrant is a shell company (as defined in Rule 12b-2 of the Exchange Act).����Yes�������No��x
The number of the Registrant�s voting common units representing limited partner interests outstanding as of October�31, 2014 was 520,453,987. The number of the Registrant�s non-voting common units representing limited partner interests outstanding as of October�31, 2014 was 69,083,468.
�
�
�
Table of Contents
�
| � | �� | � | �� | Page | � | |
| PART�I. | �� | �� | ||||
| ITEM�1. | �� | FINANCIAL STATEMENTS |
�� | � | 5 | �� |
| �� | Unaudited Condensed Consolidated Financial Statements � September�30, 2014 and 2013: |
�� | ||||
| �� | �� | � | 5 | �� | ||
| �� | �� | � | 7 | �� | ||
| �� | �� | � | 8 | �� | ||
| �� | �� | � | 9 | �� | ||
| �� | �� | � | 11 | �� | ||
| �� | �� | � | 13 | �� | ||
| ITEM�1A. | �� | UNAUDITED SUPPLEMENTAL PRESENTATION OF STATEMENTS OF FINANCIAL CONDITION |
�� | � | 60 | �� |
| ITEM 2. | �� | MANAGEMENT�S DISCUSSION AND ANALYSIS OF FINANCIAL CONDITION AND RESULTS OF OPERATIONS |
�� | � | 62 | �� |
| ITEM 3. | �� | �� | � | 127 | �� | |
| ITEM 4. | �� | �� | � | 130 | �� | |
| PART II. | �� | OTHER INFORMATION |
�� | |||
| ITEM 1. | �� | �� | � | 131 | �� | |
| ITEM 1A. | �� | �� | � | 131 | �� | |
| ITEM 2. | �� | �� | � | 131 | �� | |
| ITEM 3. | �� | �� | � | 132 | �� | |
| ITEM 4. | �� | �� | � | 132 | �� | |
| ITEM 5. | �� | �� | � | 132 | �� | |
| ITEM 6. | �� | �� | � | 133 | �� | |
| �� | � | 134 | �� | |||
�
1
Table of Contents
Forward-Looking Statements
This report may contain forward-looking statements within the meaning of Section�27A of the Securities Act of 1933 and Section�21E of the Securities Exchange Act of 1934 which reflect our current views with respect to, among other things, our operations and financial performance. You can identify these forward-looking statements by the use of words such as �outlook,� �indicator,� �believes,� �expects,� �potential,� �continues,� �may,� �will,� �should,� �seeks,� �approximately,� �predicts,� �intends,� �plans,� �estimates,� �anticipates� or the negative version of these words or other comparable words. Such forward-looking statements are subject to various risks and uncertainties. Accordingly, there are or will be important factors that could cause actual outcomes or results to differ materially from those indicated in these statements. We believe these factors include but are not limited to those described under the section entitled �Risk Factors� in our annual report on Form 10-K for the year ended December�31, 2013 and in this report, as such factors may be updated from time to time in our periodic filings with the United States Securities and Exchange Commission (�SEC�), which are accessible on the SEC�s website at www.sec.gov. These factors should not be construed as exhaustive and should be read in conjunction with the other cautionary statements that are included in this report and in our other periodic filings. The forward-looking statements speak only as of the date of this report, and we undertake no obligation to publicly update or review any forward-looking statement, whether as a result of new information, future developments or otherwise.
Website and Social Media Disclosure
We use our website (www.blackstone.com), our corporate Facebook page (www.facebook.com/blackstone) and our corporate Twitter (@Blackstone), LinkedIn (www.linkedin.com/company/the-blackstone-group), Facebook (www.facebook.com/Blackstone), Instagram (instagram.com/Blackstone) and YouTube (www.youtube.com/user/blackstonegroup) accounts as channels of distribution of company information. The information we post through these channels may be deemed material. Accordingly, investors should monitor these channels, in addition to following our press releases, SEC filings and public conference calls and webcasts. In addition, you may automatically receive e-mail alerts and other information about Blackstone when you enroll your e-mail address by visiting the �Email Alerts� section of our website at http://ir.blackstone.com. The contents of our website and social media channels are not, however, a part of this report.
�
�
In this report, references to �Blackstone,� the �Partnership�, �we,� �us� or �our� refer to The Blackstone Group L.P. and its consolidated subsidiaries. Unless the context otherwise requires, references in this report to the ownership of Mr.�Stephen�A. Schwarzman, our founder, and other Blackstone personnel include the ownership of personal planning vehicles and family members of these individuals.
�Blackstone Funds,� �our funds� and �our investment funds� refer to the private equity funds, real estate funds, funds of hedge funds, credit-focused funds, collateralized loan obligation (�CLO�) and collateralized debt obligation (�CDO�) vehicles, real estate investment trusts and registered investment companies that are managed by Blackstone. �Our carry funds� refer to the private equity funds, real estate funds and certain of the credit-focused funds (with multi-year drawdown, commitment-based structures that only pay carry on the realization of an investment) that are managed by Blackstone. Blackstone�s Private Equity segment comprises its management of corporate private equity funds (including our sector and regional focused funds), which we refer to collectively as our Blackstone Capital Partners (�BCP�) funds, certain multi-asset class investment funds which we collectively refer to as our Blackstone Tactical Opportunities Accounts (�Tactical Opportunities�), and Strategic Partners Fund Solutions (�Strategic Partners�), a secondary private fund of funds business. We refer to our real estate opportunistic funds as our Blackstone Real Estate Partners (�BREP�) funds and our real estate debt investment funds as our Blackstone Real Estate Debt Strategies (�BREDS�) funds. We refer to our real estate funds which invest with a more modest risk profile and lower leverage as Core+. We refer to our listed real estate investment trusts as �REITs�. �Our hedge funds� refer to our funds of hedge funds, certain of our real estate debt investment funds and certain other credit-focused funds which are managed by Blackstone.
�
2
Table of Contents
�Assets under management� refers to the assets we manage. Our Assets Under Management equals the sum of:
�
| � | (a) | the fair value of the investments held by our carry funds and our side-by-side and co-investment entities managed by us, plus the capital that we are entitled to call from investors in those funds and entities pursuant to the terms of their respective capital commitments, including capital commitments to funds that have yet to commence their investment periods, |
�
| � | (b) | the net asset value of our funds of hedge funds, hedge funds and certain registered investment companies, |
�
| � | (c) | the invested capital or fair value of assets we manage pursuant to separately managed accounts, |
�
| � | (d) | the amount of debt and equity outstanding for our CLOs and CDOs during the reinvestment period, |
�
| � | (e) | the aggregate par amount of collateral assets, including principal cash, for our CLOs and CDOs after the reinvestment period, |
�
| � | (f) | the gross amount of assets (including leverage) for certain of our credit-focused registered investment companies, and |
�
| � | (g) | the fair value of common stock, preferred stock, convertible debt, or similar instruments issued by our public REIT. |
Our carry funds are commitment-based drawdown structured funds that do not permit investors to redeem their interests at their election. Our funds of hedge funds and hedge funds generally have structures that afford an investor the right to withdraw or redeem their interests on a periodic basis (for example, annually or quarterly), in most cases upon advance written notice, with the majority of our funds requiring from 60 days up to 95 days� notice, depending on the fund and the liquidity profile of the underlying assets. Investment advisory agreements related to separately managed accounts may generally be terminated by an investor on 30 to 90 days� notice.
�Fee-earning assets under management� refers to the assets we manage on which we derive management and/or performance fees. Our Fee-Earning Assets Under Management equals the sum of:
�
| � | (a) | for our Private Equity segment funds and Real Estate segment carry funds including certain real estate debt investment funds and certain of our Hedge Fund Solutions funds, the amount of capital commitments, remaining invested capital, fair value or par value of assets held, depending on the fee terms of the fund, |
�
| � | (b) | for our credit-focused carry funds, the amount of remaining invested capital (which may include leverage) or net asset value, depending on the fee terms of the fund, |
�
| � | (c) | the remaining invested capital of co-investments managed by us on which we receive fees, |
�
| � | (d) | the net asset value of our funds of hedge funds, hedge funds and certain registered investment companies, |
�
| � | (e) | the invested capital or fair value of assets we manage pursuant to separately managed accounts, |
�
| � | (f) | the net proceeds received from equity offerings and accumulated core earnings of our REITs, subject to certain adjustments, |
�
| � | (g) | the aggregate par amount of collateral assets, including principal cash, of our CLOs and CDOs, and |
�
| � | (h) | the gross amount of assets (including leverage) for certain of our credit-focused registered investment companies. |
Our calculations of assets under management and fee-earning assets under management may differ from the calculations of other asset managers, and as a result this measure may not be comparable to similar measures presented by other asset managers. In addition, our calculation of assets under management includes commitments to, and the fair value of, invested capital in our funds from Blackstone and our personnel, regardless of whether such commitments or invested capital are subject to fees. Our definitions of assets under management or fee-earning assets under management are not based on any definition of assets under management or fee-earning assets under management that is set forth in the agreements governing the investment funds that we manage.
�
3
Table of Contents
For our carry funds, total assets under management includes the fair value of the investments held, whereas fee-earning assets under management includes the amount of capital commitments, the remaining amount of invested capital at cost depending on whether the investment period has or has not expired or the fee terms of the fund. As such, fee-earning assets under management may be greater than total assets under management when the aggregate fair value of the remaining investments is less than the cost of those investments.
This report does not constitute an offer of any Blackstone Fund.
�
4
Table of Contents
�
| ITEM�1. | FINANCIAL STATEMENTS |
Condensed Consolidated Statements of Financial Condition (Unaudited)
(Dollars in Thousands, Except Unit Data)
�
| � | �� | September�30, 2014 |
� | � | December�31, 2013 |
� | ||
| Assets |
�� | � | ||||||
| Cash and Cash Equivalents |
�� | $ | 943,519 | �� | � | $ | 831,998 | �� |
| Cash Held by Blackstone Funds and Other |
�� | � | 1,517,951 | �� | � | � | 1,045,882 | �� |
| Investments (including assets pledged of $141,151 and $316,564 at September�30, 2014 and December�31, 2013, respectively) |
�� | � | 22,121,153 | �� | � | � | 21,729,523 | �� |
| Accounts Receivable |
�� | � | 936,548 | �� | � | � | 888,356 | �� |
| Reverse Repurchase Agreements |
�� | � | 93,538 | �� | � | � | 148,984 | �� |
| Due from Affiliates |
�� | � | 1,047,473 | �� | � | � | 1,192,044 | �� |
| Intangible Assets, Net |
�� | � | 483,839 | �� | � | � | 560,748 | �� |
| Goodwill |
�� | � | 1,787,392 | �� | � | � | 1,787,392 | �� |
| Other Assets |
�� | � | 360,936 | �� | � | � | 284,472 | �� |
| Deferred Tax Assets |
�� | � | 1,221,507 | �� | � | � | 1,209,207 | �� |
| �� | � |
� |
� | � | � |
� |
� | |
| Total Assets |
�� | $ | 30,513,856 | �� | � | $ | 29,678,606 | �� |
| �� | � |
� |
� | � | � |
� |
� | |
| Liabilities and Partners� Capital |
�� | � | ||||||
| Loans Payable |
�� | $ | 7,814,377 | �� | � | $ | 10,466,504 | �� |
| Due to Affiliates |
�� | � | 1,327,231 | �� | � | � | 1,436,859 | �� |
| Accrued Compensation and Benefits |
�� | � | 2,621,595 | �� | � | � | 2,132,939 | �� |
| Securities Sold, Not Yet Purchased |
�� | � | 188,363 | �� | � | � | 76,195 | �� |
| Repurchase Agreements |
�� | � | 122,349 | �� | � | � | 316,352 | �� |
| Accounts Payable, Accrued Expenses and Other Liabilities |
�� | � | 2,048,754 | �� | � | � | 872,086 | �� |
| �� | � |
� |
� | � | � |
� |
� | |
| Total Liabilities |
�� | � | 14,122,669 | �� | � | � | 15,300,935 | �� |
| �� | � |
� |
� | � | � |
� |
� | |
| Commitments and Contingencies |
�� | � | ||||||
| Redeemable Non-Controlling Interests in Consolidated Entities |
�� | � | 2,443,479 | �� | � | � | 1,950,442 | �� |
| �� | � |
� |
� | � | � |
� |
� | |
| Partners� Capital |
�� | � | ||||||
| Partners� Capital (common units: 591,756,937 issued and outstanding as of September�30, 2014; 572,592,279 issued and outstanding as of December�31, 2013) |
�� | � | 6,588,059 | �� | � | � | 6,002,592 | �� |
| Appropriated Partners� Capital |
�� | � | 124,078 | �� | � | � | 300,708 | �� |
| Accumulated Other Comprehensive Income (Loss) |
�� | � | (9,407 | )� | � | � | 3,466 | �� |
| Non-Controlling Interests in Consolidated Entities |
�� | � | 3,158,183 | �� | � | � | 2,464,047 | �� |
| Non-Controlling Interests in Blackstone Holdings |
�� | � | 4,086,795 | �� | � | � | 3,656,416 | �� |
| �� | � |
� |
� | � | � |
� |
� | |
| Total Partners� Capital |
�� | � | 13,947,708 | �� | � | � | 12,427,229 | �� |
| �� | � |
� |
� | � | � |
� |
� | |
| Total Liabilities and Partners� Capital |
�� | $ | 30,513,856 | �� | � | $ | 29,678,606 | �� |
| �� | � |
� |
� | � | � |
� |
� | |
�
continued�
See notes to condensed consolidated financial statements.
�
5
Table of Contents
THE BLACKSTONE GROUP L.P.
Condensed Consolidated Statements of Financial Condition (Unaudited)
(Dollars in Thousands)
�
The following presents the portion of the consolidated balances presented above attributable to consolidated Blackstone Funds which are variable interest entities. The following assets may only be used to settle obligations of these consolidated Blackstone Funds and these liabilities are only the obligations of these consolidated Blackstone Funds and they do not have recourse to the general credit of Blackstone.
�
| � | �� | September�30, 2014 |
� | �� | December�31, 2013 |
� | ||
| Assets |
�� | �� | ||||||
| Cash Held by Blackstone Funds and Other |
�� | $ | 1,086,854 | �� | �� | $ | 618,881 | �� |
| Investments |
�� | � | 7,398,785 | �� | �� | � | 9,700,804 | �� |
| Accounts Receivable |
�� | � | 398,563 | �� | �� | � | 231,052 | �� |
| Due from Affiliates |
�� | � | 16,081 | �� | �� | � | 27,022 | �� |
| Other Assets |
�� | � | 29,214 | �� | �� | � | 29,755 | �� |
| �� | � |
� |
� | �� | � |
� |
� | |
| Total Assets |
�� | $ | 8,929,497 | �� | �� | $ | 10,607,514 | �� |
| �� | � |
� |
� | �� | � |
� |
� | |
| Liabilities |
�� | �� | ||||||
| Loans Payable |
�� | $ | 5,662,158 | �� | �� | $ | 8,802,155 | �� |
| Due to Affiliates |
�� | � | 10,201 | �� | �� | � | 143,444 | �� |
| Accounts Payable, Accrued Expenses and Other |
�� | � | 1,482,626 | �� | �� | � | 284,818 | �� |
| �� | � |
� |
� | �� | � |
� |
� | |
| Total Liabilities |
�� | $ | 7,154,985 | �� | �� | $ | 9,230,417 | �� |
| �� | � |
� |
� | �� | � |
� |
� | |
See notes to condensed consolidated financial statements.
�
6
Table of Contents
Condensed Consolidated Statements of Operations (Unaudited)
(Dollars in Thousands, Except Unit and Per Unit Data)
�
| � | � | Three Months Ended September�30, |
� | � | Nine Months
Ended September�30, |
� | ||||||||||
| � | � | 2014 | � | � | 2013 | � | � | 2014 | � | � | 2013 | � | ||||
| Revenues |
� | � | � | � | ||||||||||||
| Management and Advisory Fees, Net |
� | $ | 640,949 | �� | � | $ | 531,095 | �� | � | $ | 1,833,632 | �� | � | $ | 1,591,951 | �� |
| � | � |
� |
� | � | � |
� |
� | � | � |
� |
� | � | � |
� |
� | |
| Performance Fees |
� | � | � | � | ||||||||||||
| Realized |
� | � | � | � | ||||||||||||
| Carried Interest |
� | � | 638,676 | �� | � | � | 182,654 | �� | � | � | 1,613,958 | �� | � | � | 660,112 | �� |
| Incentive Fees |
� | � | 35,445 | �� | � | � | 30,884 | �� | � | � | 118,743 | �� | � | � | 130,729 | �� |
| Unrealized |
� | � | � | � | ||||||||||||
| Carried Interest |
� | � | 222,105 | �� | � | � | 290,052 | �� | � | � | 1,213,181 | �� | � | � | 924,105 | �� |
| Incentive Fees |
� | � | (6,163 | )� | � | � | 37,713 | �� | � | � | 112,709 | �� | � | � | 144,449 | �� |
| � | � |
� |
� | � | � |
� |
� | � | � |
� |
� | � | � |
� |
� | |
| Total Performance Fees |
� | � | 890,063 | �� | � | � | 541,303 | �� | � | � | 3,058,591 | �� | � | � | 1,859,395 | �� |
| � | � |
� |
� | � | � |
� |
� | � | � |
� |
� | � | � |
� |
� | |
| Investment Income |
� | � | � | � | ||||||||||||
| Realized |
� | � | 91,142 | �� | � | � | 19,507 | �� | � | � | 459,878 | �� | � | � | 137,350 | �� |
| Unrealized |
� | � | 38,445 | �� | � | � | 100,341 | �� | � | � | 62,754 | �� | � | � | 263,141 | �� |
| � | � |
� |
� | � | � |
� |
� | � | � |
� |
� | � | � |
� |
� | |
| Total Investment Income |
� | � | 129,587 | �� | � | � | 119,848 | �� | � | � | 522,632 | �� | � | � | 400,491 | �� |
| � | � |
� |
� | � | � |
� |
� | � | � |
� |
� | � | � |
� |
� | |
| Interest and Dividend Revenue |
� | � | 18,107 | �� | � | � | 19,892 | �� | � | � | 47,516 | �� | � | � | 46,263 | �� |
| Other |
� | � | 720 | �� | � | � | 4,707 | �� | � | � | 1,583 | �� | � | � | 5,688 | �� |
| � | � |
� |
� | � | � |
� |
� | � | � |
� |
� | � | � |
� |
� | |
| Total Revenues |
� | � | 1,679,426 | �� | � | � | 1,216,845 | �� | � | � | 5,463,954 | �� | � | � | 3,903,788 | �� |
| � | � |
� |
� | � | � |
� |
� | � | � |
� |
� | � | � |
� |
� | |
| Expenses |
� | � | � | � | ||||||||||||
| Compensation and Benefits |
� | � | � | � | ||||||||||||
| Compensation |
� | � | 525,093 | �� | � | � | 465,631 | �� | � | � | 1,511,085 | �� | � | � | 1,396,042 | �� |
| Performance Fee Compensation |
� | � | � | � | ||||||||||||
| Realized |
� | � | � | � | ||||||||||||
| Carried Interest |
� | � | 186,003 | �� | � | � | 60,369 | �� | � | � | 595,702 | �� | � | � | 225,716 | �� |
| Incentive Fees |
� | � | 19,029 | �� | � | � | 14,599 | �� | � | � | 61,173 | �� | � | � | 60,121 | �� |
| Unrealized |
� | � | � | � | ||||||||||||
| Carried Interest |
� | � | 164,132 | �� | � | � | 82,341 | �� | � | � | 319,158 | �� | � | � | 350,637 | �� |
| Incentive Fees |
� | � | (9,002 | )� | � | � | 11,084 | �� | � | � | 39,221 | �� | � | � | 58,646 | �� |
| � | � |
� |
� | � | � |
� |
� | � | � |
� |
� | � | � |
� |
� | |
| Total Compensation and Benefits |
� | � | 885,255 | �� | � | � | 634,024 | �� | � | � | 2,526,339 | �� | � | � | 2,091,162 | �� |
| General, Administrative and Other |
� | � | 128,015 | �� | � | � | 119,435 | �� | � | � | 400,061 | �� | � | � | 346,106 | �� |
| Interest Expense |
� | � | 31,615 | �� | � | � | 26,268 | �� | � | � | 86,129 | �� | � | � | 80,286 | �� |
| Fund Expenses |
� | � | 10,253 | �� | � | � | 6,678 | �� | � | � | 20,241 | �� | � | � | 18,714 | �� |
| � | � |
� |
� | � | � |
� |
� | � | � |
� |
� | � | � |
� |
� | |
| Total Expenses |
� | � | 1,055,138 | �� | � | � | 786,405 | �� | � | � | 3,032,770 | �� | � | � | 2,536,268 | �� |
| � | � |
� |
� | � | � |
� |
� | � | � |
� |
� | � | � |
� |
� | |
| Other Income |
� | � | � | � | ||||||||||||
| Net Gains from Fund Investment Activities |
� | � | 8,682 | �� | � | � | 87,952 | �� | � | � | 217,422 | �� | � | � | 196,128 | �� |
| � | � |
� |
� | � | � |
� |
� | � | � |
� |
� | � | � |
� |
� | |
| Income Before Provision for Taxes |
� | � | 632,970 | �� | � | � | 518,392 | �� | � | � | 2,648,606 | �� | � | � | 1,563,648 | �� |
| Provision for Taxes |
� | � | 79,108 | �� | � | � | 57,477 | �� | � | � | 216,487 | �� | � | � | 164,552 | �� |
| � | � |
� |
� | � | � |
� |
� | � | � |
� |
� | � | � |
� |
� | |
| Net Income |
� | � | 553,862 | �� | � | � | 460,915 | �� | � | � | 2,432,119 | �� | � | � | 1,399,096 | �� |
| Net Income (Loss) Attributable to Redeemable |
� | � | � | � | ||||||||||||
| Non-Controlling Interests in Consolidated Entities |
� | � | (23,328 | )� | � | � | 51,188 | �� | � | � | 44,950 | �� | � | � | 135,870 | �� |
| Net Income Attributable to Non-Controlling Interests in Consolidated Entities |
� | � | 55,491 | �� | � | � | 30,231 | �� | � | � | 239,513 | �� | � | � | 48,723 | �� |
| Net Income Attributable to Non-Controlling Interests in Blackstone Holdings |
� | � | 271,194 | �� | � | � | 208,332 | �� | � | � | 1,114,518 | �� | � | � | 664,556 | �� |
| � | � |
� |
� | � | � |
� |
� | � | � |
� |
� | � | � |
� |
� | |
| Net Income Attributable to The Blackstone Group L.P. |
� | $ | 250,505 | �� | � | $ | 171,164 | �� | � | $ | 1,033,138 | �� | � | $ | 549,947 | �� |
| � | � |
� |
� | � | � |
� |
� | � | � |
� |
� | � | � |
� |
� | |
| Distributions Declared Per Common Unit |
� | $ | 0.55 | �� | � | $ | 0.23 | �� | � | $ | 1.48 | �� | � | $ | 0.95 | �� |
| � | � |
� |
� | � | � |
� |
� | � | � |
� |
� | � | � |
� |
� | |
| Net Income Per Common Unit |
� | � | � | � | ||||||||||||
| Common Units, Basic |
� | $ | 0.41 | �� | � | $ | 0.29 | �� | � | $ | 1.70 | �� | � | $ | 0.94 | �� |
| � | � |
� |
� | � | � |
� |
� | � | � |
� |
� | � | � |
� |
� | |
| Common Units, Diluted |
� | $ | 0.41 | �� | � | $ | 0.29 | �� | � | $ | 1.69 | �� | � | $ | 0.93 | �� |
| � | � |
� |
� | � | � |
� |
� | � | � |
� |
� | � | � |
� |
� | |
| Weighted-Average Common Units Outstanding |
� | � | � | � | ||||||||||||
| Common Units, Basic |
� | � | 611,684,213 | �� | � | � | 589,643,844 | �� | � | � | 606,671,289 | �� | � | � | 585,296,526 | �� |
| � | � |
� |
� | � | � |
� |
� | � | � |
� |
� | � | � |
� |
� | |
| Common Units, Diluted |
� | � | 614,978,870 | �� | � | � | 592,920,795 | �� | � | � | 610,221,301 | �� | � | � | 588,488,068 | �� |
| � | � |
� |
� | � | � |
� |
� | � | � |
� |
� | � | � |
� |
� | |
| Revenues Earned from Affiliates |
� | � | � | � | ||||||||||||
| Management and Advisory Fees, Net |
� | $ | 107,615 | �� | � | $ | 48,906 | �� | � | $ | 262,990 | �� | � | $ | 169,029 | �� |
| � | � |
� |
� | � | � |
� |
� | � | � |
� |
� | � | � |
� |
� | |
See notes to condensed consolidated financial statements.
�
7
Table of Contents
Condensed Consolidated Statements of Comprehensive Income (Unaudited)
(Dollars in Thousands)
�
| � | �� | Three Months Ended September�30, |
� | �� | Nine Months Ended September�30, |
� | ||||||||||
| � | �� | 2014 | � | � | 2013 | � | �� | 2014 | � | � | 2013 | � | ||||
| Net Income |
�� | $ | 553,862 | �� | � | $ | 460,915 | �� | �� | $ | 2,432,119 | �� | � | $ | 1,399,096 | �� |
| Other Comprehensive Income (Loss), Net of Tax � Currency Translation Adjustment |
�� | � | (21,663 | )� | � | � | 6,420 | �� | �� | � | (23,393 | )� | � | � | 4,488 | �� |
| �� | � |
� |
� | � | � |
� |
� | �� | � |
� |
� | � | � |
� |
� | |
| Comprehensive Income |
�� | � | 532,199 | �� | � | � | 467,335 | �� | �� | � | 2,408,726 | �� | � | � | 1,403,584 | �� |
| Less |
�� | � | �� | � | ||||||||||||
| Comprehensive Income (Loss) Attributable to Redeemable Non-Controlling Interests in Consolidated Entities |
�� | � | (23,328 | )� | � | � | 51,188 | �� | �� | � | 44,950 | �� | � | � | 135,870 | �� |
| Comprehensive Income Attributable to Non-Controlling Interests in Consolidated Entities |
�� | � | 48,984 | �� | � | � | 36,171 | �� | �� | � | 228,993 | �� | � | � | 53,747 | �� |
| Comprehensive Income Attributable to Non-Controlling Interests in Blackstone Holdings |
�� | � | 271,194 | �� | � | � | 208,332 | �� | �� | � | 1,114,518 | �� | � | � | 664,556 | �� |
| �� | � |
� |
� | � | � |
� |
� | �� | � |
� |
� | � | � |
� |
� | |
| Comprehensive Income Attributable to The Blackstone Group�L.P. |
�� | $ | 235,349 | �� | � | $ | 171,644 | �� | �� | $ | 1,020,265 | �� | � | $ | 549,411 | �� |
| �� | � |
� |
� | � | � |
� |
� | �� | � |
� |
� | � | � |
� |
� | |
See notes to condensed consolidated financial statements.
�
8
Table of Contents
Condensed Consolidated Statements of Changes in Partners� Capital (Unaudited)
(Dollars in Thousands, Except Unit Data)
�
| � | � | � | � | � | The Blackstone Group L.P. | � | � | � | � | � | � | � | � | � | � | � | � | � | ||||||||||||||
| � | � | Common Units |
� | � | Partners� Capital |
� | � | Appro- priated Partners� Capital |
� | � | Accumulated Other Compre- hensive Income (Loss) |
� | � | Non- Controlling Interests in Consolidated Entities |
� | � | Non- Controlling Interests in Blackstone Holdings |
� | � | Total Partners� Capital |
� | � | Redeemable Non- Controlling Interests in Consolidated Entities |
� | ||||||||
| Balance at December�31, 2013 |
� | � | 572,592,279 | �� | � | $ | 6,002,592 | �� | � | $ | 300,708 | �� | � | $ | 3,466 | �� | � | $ | 2,464,047 | �� | � | $ | 3,656,416 | �� | � | $ | 12,427,229 | �� | � | $ | 1,950,442 | �� |
| Transition and Acquisition Adjustments Relating to Consolidation of CLO Entities |
� | � | ��� | �� | � | � | ��� | �� | � | � | 8,398 | �� | � | � | ��� | �� | � | � | ��� | �� | � | � | ��� | �� | � | � | 8,398 | �� | � | � | ��� | �� |
| Consolidation of Fund Entity |
� | � | ��� | �� | � | � | ��� | �� | � | � | ��� | �� | � | � | ��� | �� | � | � | 323,158 | �� | � | � | ��� | �� | � | � | 323,158 | �� | � | � | 30,922 | �� |
| Net Income |
� | � | ��� | �� | � | � | 1,033,138 | �� | � | � | ��� | �� | � | � | ��� | �� | � | � | 239,513 | �� | � | � | 1,114,518 | �� | � | � | 2,387,169 | �� | � | � | 44,950 | �� |
| Allocation of Losses of Consolidated CLO Entities |
� | � | ��� | �� | � | � | ��� | �� | � | � | (92,020 | )� | � | � | ��� | �� | � | � | 92,020 | �� | � | � | ��� | �� | � | � | ��� | �� | � | � | ��� | �� |
| Currency Translation Adjustment |
� | � | ��� | �� | � | � | ��� | �� | � | � | ��� | �� | � | � | (12,873 | )� | � | � | (10,520 | )� | � | � | ��� | �� | � | � | (23,393 | )� | � | � | ��� | �� |
| Allocation of Currency Translation Adjustment of Consolidated CLO Entities |
� | � | ��� | �� | � | � | ��� | �� | � | � | (10,520 | )� | � | � | ��� | �� | � | � | 10,520 | �� | � | � | ��� | �� | � | � | ��� | �� | � | � | ��� | �� |
| Reclassification of Currency Translation Adjustment Due to Deconsolidation of CLO Entities |
� | � | ��� | �� | � | � | 611 | �� | � | � | ��� | �� | � | � | ��� | �� | � | � | ��� | �� | � | � | ��� | �� | � | � | 611 | �� | � | � | ��� | �� |
| Capital Contributions |
� | � | ��� | �� | � | � | ��� | �� | � | � | ��� | �� | � | � | ��� | �� | � | � | 400,602 | �� | � | � | ��� | �� | � | � | 400,602 | �� | � | � | 769,548 | �� |
| Capital Distributions |
� | � | ��� | �� | � | � | (881,651 | )� | � | � | ��� | �� | � | � | ��� | �� | � | � | (357,610 | )� | � | � | (898,716 | )� | � | � | (2,137,977 | )� | � | � | (352,383 | )� |
| Transfer of Non-Controlling Interests in Consolidated Entities |
� | � | ��� | �� | � | � | ��� | �� | � | � | ��� | �� | � | � | ��� | �� | � | � | (3,465 | )� | � | � | ��� | �� | � | � | (3,465 | )� | � | � | ��� | �� |
| Purchase of Interests from Certain Non-Controlling Interest Holders |
� | � | ��� | �� | � | � | (6 | )� | � | � | ��� | �� | � | � | ��� | �� | � | � | ��� | �� | � | � | ��� | �� | � | � | (6 | )� | � | � | ��� | �� |
| Deferred Tax Effects Resulting from Acquisition of Ownership Interests from Non-Controlling Interest Holders |
� | � | ��� | �� | � | � | 19,310 | �� | � | � | ��� | �� | � | � | ��� | �� | � | � | ��� | �� | � | � | ��� | �� | � | � | 19,310 | �� | � | � | ��� | �� |
| Equity-Based Compensation |
� | � | ��� | �� | � | � | 333,656 | �� | � | � | ��� | �� | � | � | ��� | �� | � | � | ��� | �� | � | � | 307,474 | �� | � | � | 641,130 | �� | � | � | ��� | �� |
| Relinquished with Deconsolidation and Liquidation of Partnership |
� | � | ��� | �� | � | � | ��� | �� | � | � | (82,488 | )� | � | � | ��� | �� | � | � | (82 | )� | � | � | ��� | �� | � | � | (82,570 | )� | � | � | ��� | �� |
| Net Delivery of Vested Blackstone Holdings Partnership Units and Blackstone Common Units |
� | � | 6,353,748 | �� | � | � | (33,076 | )� | � | � | ��� | �� | � | � | ��� | �� | � | � | ��� | �� | � | � | (783 | )� | � | � | (33,859 | )� | � | � | ��� | �� |
| Excess Tax Benefits Related to Equity-Based Compensation, Net |
� | � | ��� | �� | � | � | 21,371 | �� | � | � | ��� | �� | � | � | ��� | �� | � | � | ��� | �� | � | � | ��� | �� | � | � | 21,371 | �� | � | � | ��� | �� |
| Change in The Blackstone Group L.P.�s Ownership Interest |
� | � | ��� | �� | � | � | 3,168 | �� | � | � | ��� | �� | � | � | ��� | �� | � | � | ��� | �� | � | � | (3,168 | )� | � | � | ��� | �� | � | � | ��� | �� |
| Conversion of Blackstone Holdings Partnership Units to Blackstone Common Units |
� | � | 12,810,910 | �� | � | � | 88,946 | �� | � | � | ��� | �� | � | � | ��� | �� | � | � | ��� | �� | � | � | (88,946 | )� | � | � | ��� | �� | � | � | ��� | �� |
| � | � |
� |
� | � | � |
� |
� | � | � |
� |
� | � | � |
� |
� | � | � |
� |
� | � | � |
� |
� | � | � |
� |
� | � | � |
� |
� | |
| Balance at September�30, 2014 |
� | � | 591,756,937 | �� | � | $ | 6,588,059 | �� | � | $ | 124,078 | �� | � | $ | (9,407 | )� | � | $ | 3,158,183 | �� | � | $ | 4,086,795 | �� | � | $ | 13,947,708 | �� | � | $ | 2,443,479 | �� |
| � | � |
� |
� | � | � |
� |
� | � | � |
� |
� | � | � |
� |
� | � | � |
� |
� | � | � |
� |
� | � | � |
� |
� | � | � |
� |
� | |
�
continued�
See notes to condensed consolidated financial statements.
�
9
Table of Contents
THE BLACKSTONE GROUP L.P.
Condensed Consolidated Statements of Changes in Partners� Capital (Unaudited)
(Dollars in Thousands, Except Unit Data)
�
| � | � | � | � | � | The Blackstone Group L.P. | � | � | � | � | � | � | � | � | � | � | � | Redeemable Non- Controlling Interests in Consolidated Entities |
� | ||||||||||||||
| � | � | Common Units |
� | � | Partners� Capital |
� | � | Appro- priated Partners� Capital |
� | � | Accumulated Other Compre- hensive Income |
� | � | Non- Controlling Interests in Consolidated Entities |
� | � | Non- Controlling Interests in Blackstone Holdings |
� | � | Total Partners� Capital |
� | � | ||||||||||
| Balance at December�31, 2012 |
� | � | 556,354,387 | �� | � | $ | 4,955,649 | �� | � | $ | 509,028 | �� | � | $ | 2,170 | �� | � | $ | 1,443,559 | �� | � | $ | 2,748,356 | �� | � | $ | 9,658,762 | �� | � | $ | 1,556,185 | �� |
| Net Income |
� | � | ��� | �� | � | � | 549,947 | �� | � | � | ��� | �� | � | � | ��� | �� | � | � | 48,723 | �� | � | � | 664,556 | �� | � | � | 1,263,226 | �� | � | � | 135,870 | �� |
| Allocation of Losses of Consolidated CLO Entities |
� | � | ��� | �� | � | � | ��� | �� | � | � | (187,011 | )� | � | � | ��� | �� | � | � | 187,011 | �� | � | � | ��� | �� | � | � | ��� | �� | � | � | ��� | �� |
| Currency Translation Adjustment |
� | � | ��� | �� | � | � | ��� | �� | � | � | ��� | �� | � | � | (536 | )� | � | � | 5,024 | �� | � | � | ��� | �� | � | � | 4,488 | �� | � | � | ��� | �� |
| Allocation of Currency Translation Adjustment of Consolidated CLO Entities |
� | � | ��� | �� | � | � | ��� | �� | � | � | 5,024 | �� | � | � | ��� | �� | � | � | (5,024 | )� | � | � | ��� | �� | � | � | ��� | �� | � | � | ��� | �� |
| Capital Contributions |
� | � | ��� | �� | � | � | ��� | �� | � | � | ��� | �� | � | � | ��� | �� | � | � | 182,273 | �� | � | � | 153 | �� | � | � | 182,426 | �� | � | � | 763,387 | �� |
| Capital Distributions |
� | � | ��� | �� | � | � | (545,259 | )� | � | � | ��� | �� | � | � | ��� | �� | � | � | (184,004 | )� | � | � | (647,533 | )� | � | � | (1,376,796 | )� | � | � | (337,890 | )� |
| Transfer of Non-Controlling Interests in Consolidated Entities |
� | � | ��� | �� | � | � | ��� | �� | � | � | ��� | �� | � | � | ��� | �� | � | � | (1,010 | )� | � | � | ��� | �� | � | � | (1,010 | )� | � | � | ��� | �� |
| Purchase of Interests from Certain Non-Controlling Interest Holders |
� | � | ��� | �� | � | � | (33 | )� | � | � | ��� | �� | � | � | ��� | �� | � | � | ��� | �� | � | � | ��� | �� | � | � | (33 | )� | � | � | ��� | �� |
| Deferred Tax Effects Resulting from Acquisition of Ownership Interests from Non-Controlling Interest Holders |
� | � | ��� | �� | � | � | 88,132 | �� | � | � | ��� | �� | � | � | ��� | �� | � | � | ��� | �� | � | � | ��� | �� | � | � | 88,132 | �� | � | � | ��� | �� |
| Equity-Based Compensation |
� | � | ��� | �� | � | � | 312,797 | �� | � | � | ��� | �� | � | � | ��� | �� | � | � | ��� | �� | � | � | 306,199 | �� | � | � | 618,996 | �� | � | � | ��� | �� |
| Relinquished with Deconsolidation and Liquidation of Partnership |
� | � | ��� | �� | � | � | ��� | �� | � | � | (30,737 | )� | � | � | ��� | �� | � | � | ��� | �� | � | � | ��� | �� | � | � | (30,737 | )� | � | � | 50 | �� |
| Net Delivery of Vested Common Units |
� | � | 6,251,348 | �� | � | � | (20,051 | )� | � | � | ��� | �� | � | � | ��� | �� | � | � | ��� | �� | � | � | (481 | )� | � | � | (20,532 | )� | � | � | ��� | �� |
| Change in The Blackstone Group L.P.�s Ownership Interest |
� | � | ��� | �� | � | � | (1,798 | )� | � | � | ��� | �� | � | � | ��� | �� | � | � | ��� | �� | � | � | 1,798 | �� | � | � | ��� | �� | � | � | ��� | �� |
| Conversion of Blackstone Holdings Partnership Units to Blackstone Common Units |
� | � | 6,600,275 | �� | � | � | 34,242 | �� | � | � | ��� | �� | � | � | ��� | �� | � | � | ��� | �� | � | � | (34,242 | )� | � | � | ��� | �� | � | � | ��� | �� |
| � | � |
� |
� | � | � |
� |
� | � | � |
� |
� | � | � |
� |
� | � | � |
� |
� | � | � |
� |
� | � | � |
� |
� | � | � |
� |
� | |
| Balance at September�30, 2013 |
� | � | 569,206,010 | �� | � | $ | 5,373,626 | �� | � | $ | 296,304 | �� | � | $ | 1,634 | �� | � | $ | 1,676,552 | �� | � | $ | 3,038,806 | �� | � | $ | 10,386,922 | �� | � | $ | 2,117,602 | �� |
| � | � |
� |
� | � | � |
� |
� | � | � |
� |
� | � | � |
� |
� | � | � |
� |
� | � | � |
� |
� | � | � |
� |
� | � | � |
� |
� | |
See notes to condensed consolidated financial statements.
�
10
Table of Contents
Condensed Consolidated Statements of Cash Flows (Unaudited)
(Dollars in Thousands)
�
| � | �� | Nine Months Ended September�30, |
� | |||||
| � | �� | 2014 | � | � | 2013 | � | ||
| Operating Activities |
�� | � | ||||||
| Net Income |
�� | $ | 2,432,119 | �� | � | $ | 1,399,096 | �� |
| Adjustments to Reconcile Net Income to Net Cash Provided by Operating Activities |
�� | � | ||||||
| Blackstone Funds Related |
�� | � | ||||||
| Unrealized Appreciation on Investments Allocable to Non-Controlling Interests in Consolidated Entities |
�� | � | (434,899 | )� | � | � | (452,478 | )� |
| Net Realized Gains on Investments |
�� | � | (2,241,242 | )� | � | � | (1,017,481 | )� |
| Changes in Unrealized (Gains) Losses on Investments Allocable to The Blackstone Group L.P. |
�� | � | 12,765 | �� | � | � | (253,445 | )� |
| Non-Cash Performance Fees |
�� | � | (936,097 | )� | � | � | (588,894 | )� |
| Non-Cash Performance Fee Compensation |
�� | � | 1,015,254 | �� | � | � | 695,120 | �� |
| Equity-Based Compensation Expense |
�� | � | 584,353 | �� | � | � | 572,134 | �� |
| Excess Tax Benefits Related to Equity-Based Compensation |
�� | � | (19,320 | )� | � | � | ��� | �� |
| Amortization of Intangibles |
�� | � | 76,909 | �� | � | � | 69,275 | �� |
| Other Non-Cash Amounts Included in Net Income |
�� | � | 125,602 | �� | � | � | 148,748 | �� |
| Cash Flows Due to Changes in Operating Assets and Liabilities |
�� | � | ||||||
| Cash Held by Blackstone Funds and Other |
�� | � | (108,284 | )� | � | � | 292,510 | �� |
| Cash Relinquished in Deconsolidation and Liquidation of Partnership |
�� | � | (470,523 | )� | � | � | (136,524 | )� |
| Accounts Receivable |
�� | � | 100,161 | �� | � | � | (95,491 | )� |
| Reverse Repurchase Agreements |
�� | � | 55,446 | �� | � | � | 152,041 | �� |
| Due from Affiliates |
�� | � | 263,731 | �� | � | � | 182,372 | �� |
| Other Assets |
�� | � | (96,815 | )� | � | � | (4,624 | )� |
| Accrued Compensation and Benefits |
�� | � | (428,574 | )� | � | � | (165,771 | )� |
| Securities Sold, Not Yet Purchased |
�� | � | (38,793 | )� | � | � | (119,741 | )� |
| Accounts Payable, Accrued Expenses and Other Liabilities |
�� | � | (72,861 | )� | � | � | (231,459 | )� |
| Repurchase Agreements |
�� | � | (233,029 | )� | � | � | (73,761 | )� |
| Due to Affiliates |
�� | � | 11,403 | �� | � | � | (46,836 | )� |
| Treasury Cash Management Strategies |
�� | � | ||||||
| Investments Purchased |
�� | � | (2,700,900 | )� | � | � | (3,263,154 | )� |
| Cash Proceeds from Sale of Investments |
�� | � | 2,211,242 | �� | � | � | 3,630,030 | �� |
| Blackstone Funds Related |
�� | � | ||||||
| Investments Purchased |
�� | � | (5,236,260 | )� | � | � | (6,815,776 | )� |
| Cash Proceeds from Sale or Pay Down of Investments |
�� | � | 8,196,265 | �� | � | � | 8,856,814 | �� |
| �� | � |
� |
� | � | � |
� |
� | |
| Net Cash Provided by Operating Activities |
�� | � | 2,067,653 | �� | � | � | 2,732,705 | �� |
| �� | � |
� |
� | � | � |
� |
� | |
| Investing Activities |
�� | � | ||||||
| Purchase of Furniture, Equipment and Leasehold Improvements |
�� | � | (21,386 | )� | � | � | (18,574 | )� |
| Net Cash Paid for Acquisitions, Net of Cash Acquired |
�� | � | ��� | �� | � | � | (146,117 | )� |
| Changes in Restricted Cash |
�� | � | 5,845 | �� | � | � | 5,765 | �� |
| �� | � |
� |
� | � | � |
� |
� | |
| Net Cash Used in Investing Activities |
�� | � | (15,541 | )� | � | � | (158,926 | )� |
| �� | � |
� |
� | � | � |
� |
� | |
�
continued�
See notes to condensed consolidated financial statements.
�
11
Table of Contents
THE BLACKSTONE GROUP L.P.
Condensed Consolidated Statements of Cash Flows (Unaudited)
(Dollars in Thousands)
�
| � | �� | Nine Months Ended September�30, |
� | |||||
| � | �� | 2014 | � | � | 2013 | � | ||
| Financing Activities |
�� | � | ||||||
| Distributions to Non-Controlling Interest Holders in Consolidated Entities |
�� | $ | (656,034 | )� | � | $ | (521,894 | )� |
| Contributions from Non-Controlling Interest Holders in Consolidated Entities |
�� | � | 1,116,670 | �� | � | � | 880,530 | �� |
| Purchase of Interests from Certain Non-Controlling Interest Holders |
�� | � | (6 | )� | � | � | (33 | )� |
| Payments Under Tax Receivable Agreement |
�� | � | (86,733 | )� | � | � | ��� | �� |
| Net Settlement of Vested Common Units and Repurchase of Common and Blackstone Holdings Partnership Units |
�� | � | (33,858 | )� | � | � | (20,532 | )� |
| Excess Tax Benefits Related to Equity-Based Compensation |
�� | � | 19,320 | �� | � | � | ��� | �� |
| Proceeds from Loans Payable |
�� | � | 491,252 | �� | � | � | 4,087 | �� |
| Repayment and Repurchase of Loans Payable |
�� | � | (8,870 | )� | � | � | (4,576 | )� |
| Distributions to Unitholders |
�� | � | (1,780,367 | )� | � | � | (1,192,792 | )� |
| Blackstone Funds Related |
�� | � | ||||||
| Proceeds from Loans Payable |
�� | � | 567,635 | �� | � | � | 8,654 | �� |
| Repayment of Loans Payable |
�� | � | (1,569,528 | )� | � | � | (1,547,497 | )� |
| �� | � |
� |
� | � | � |
� |
� | |
| Net Cash Used in Financing Activities |
�� | � | (1,940,519 | )� | � | � | (2,394,053 | )� |
| �� | � |
� |
� | � | � |
� |
� | |
| Effect of Exchange Rate Changes on Cash and Cash Equivalents |
�� | � | (72 | )� | � | � | (290 | )� |
| �� | � |
� |
� | � | � |
� |
� | |
| Net Increase in Cash and Cash Equivalents |
�� | � | 111,521 | �� | � | � | 179,436 | �� |
| Cash and Cash Equivalents, Beginning of Period |
�� | � | 831,998 | �� | � | � | 709,502 | �� |
| �� | � |
� |
� | � | � |
� |
� | |
| Cash and Cash Equivalents, End of Period |
�� | $ | 943,519 | �� | � | $ | 888,938 | �� |
| �� | � |
� |
� | � | � |
� |
� | |
| Supplemental Disclosure of Cash Flows Information |
�� | � | ||||||
| Payments for Interest |
�� | $ | 98,931 | �� | � | $ | 109,911 | �� |
| �� | � |
� |
� | � | � |
� |
� | |
| Payments for Income Taxes |
�� | $ | 207,536 | �� | � | $ | 60,415 | �� |
| �� | � |
� |
� | � | � |
� |
� | |
| Supplemental Disclosure of Non-Cash Investing and Financing Activities |
�� | � | ||||||
| Non-Cash Contributions from Non-Controlling Interest Holders |
�� | $ | 50,183 | �� | � | $ | ��� | �� |
| �� | � |
� |
� | � | � |
� |
� | |
| Non-Cash Distributions to Non-Controlling Interest Holders |
�� | $ | (53,959 | )� | � | $ | ��� | �� |
| �� | � |
� |
� | � | � |
� |
� | |
| Net Activities Related to Capital Transactions of Consolidated Blackstone Funds |
�� | $ | 13,533 | �� | � | $ | (1,145 | )� |
| �� | � |
� |
� | � | � |
� |
� | |
| Net Assets Related to the Consolidation of CLO Vehicles |
�� | $ | 8,398 | �� | � | $ | ��� | �� |
| �� | � |
� |
� | � | � |
� |
� | |
| Net Assets Related to the Consolidation of Certain Fund Entities |
�� | $ | 354,080 | �� | � | $ | ��� | �� |
| �� | � |
� |
� | � | � |
� |
� | |
| In-kind Contribution of Capital |
�� | $ | ��� | �� | � | $ | 2,323 | �� |
| �� | � |
� |
� | � | � |
� |
� | |
| Notes Issuance Costs |
�� | $ | 4,375 | �� | � | $ | ��� | �� |
| �� | � |
� |
� | � | � |
� |
� | |
| Transfer of Interests to Non-Controlling Interest Holders |
�� | $ | (3,465 | )� | � | $ | (1,010 | )� |
| �� | � |
� |
� | � | � |
� |
� | |
| Change in The Blackstone Group L.P.�s Ownership Interest |
�� | $ | 3,168 | �� | � | $ | (1,798 | )� |
| �� | � |
� |
� | � | � |
� |
� | |
| Net Settlement of Vested Common Units |
�� | $ | 64,295 | �� | � | $ | 60,732 | �� |
| �� | � |
� |
� | � | � |
� |
� | |
| Conversion of Blackstone Holdings Partnership Units to Common Units |
�� | $ | 88,946 | �� | � | $ | 34,242 | �� |
| �� | � |
� |
� | � | � |
� |
� | |
| Acquisition of Ownership Interests from Non-Controlling Interest Holders |
�� | � | ||||||
| Deferred Tax Asset |
�� | $ | (88,479 | )� | � | $ | (113,040 | )� |
| �� | � |
� |
� | � | � |
� |
� | |
| Due to Affiliates |
�� | $ | 69,169 | �� | � | $ | 24,908 | �� |
| �� | � |
� |
� | � | � |
� |
� | |
| Partners� Capital |
�� | $ | 19,310 | �� | � | $ | 88,132 | �� |
| �� | � |
� |
� | � | � |
� |
� | |
See notes to condensed consolidated financial statements.
�
12
Table of Contents
Notes to Condensed Consolidated Financial Statements
(All Dollars Are in Thousands, Except Unit and Per Unit Data, Except Where Noted)
�
| 1. | ORGANIZATION |
The Blackstone Group L.P., together with its subsidiaries (�Blackstone� or the �Partnership�), is a leading global manager of private capital and provider of financial advisory services. The alternative asset management business includes the management of private equity funds, real estate funds, real estate investment trusts (�REITs�), funds of hedge funds, credit-focused funds, collateralized loan obligation (�CLO�) vehicles, collateralized debt obligation (�CDO�) vehicles, separately managed accounts and registered investment companies (collectively referred to as the �Blackstone Funds�). Blackstone also provides various financial advisory services, including financial and strategic advisory, restructuring and reorganization advisory, capital markets and fund placement services. Blackstone�s business is organized into five segments: private equity, real estate, hedge fund solutions, credit and financial advisory.
The Partnership was formed as a Delaware limited partnership on March�12, 2007. The Partnership is managed and operated by its general partner, Blackstone Group Management L.L.C., which is in turn wholly owned and controlled by one of Blackstone�s founders, Stephen A. Schwarzman (the �Founder�), and Blackstone�s other senior managing directors. The activities of the Partnership are conducted through its holding partnerships: Blackstone Holdings�I�L.P., Blackstone Holdings II L.P., Blackstone Holdings III L.P. and Blackstone Holdings IV L.P. (collectively, �Blackstone Holdings�, �Blackstone Holdings Partnerships� or the �Holding Partnerships�). The Partnership, through its wholly owned subsidiaries, is the sole general partner in each of these Holding Partnerships.
Generally, holders of the limited partner interests in the four Holding Partnerships may, four times each year, exchange their limited partnership interests (�Partnership Units�) for Blackstone common units, on a one-to-one basis, exchanging one Partnership Unit in each of the four Holding Partnerships for one Blackstone common unit.
�
| 2. | SUMMARY OF SIGNIFICANT ACCOUNTING POLICIES |
Basis of Presentation
The accompanying unaudited condensed consolidated financial statements of the Partnership have been prepared in accordance with accounting principles generally accepted in the United States of America (�GAAP�) for interim financial information and the instructions to Form 10-Q. The condensed consolidated financial statements, including these notes, are unaudited and exclude some of the disclosures required in audited financial statements. Management believes it has made all necessary adjustments (consisting of only normal recurring items) so that the condensed consolidated financial statements are presented fairly and that estimates made in preparing its condensed consolidated financial statements are reasonable and prudent. The operating results presented for interim periods are not necessarily indicative of the results that may be expected for any other interim period or for the entire year. These condensed consolidated financial statements should be read in conjunction with the audited consolidated financial statements included in the Partnership�s Annual Report on Form 10-K for the year ended December�31, 2013 filed with the Securities and Exchange Commission.
The condensed consolidated financial statements include the accounts of the Partnership, its wholly owned or majority-owned subsidiaries, the consolidated entities which are considered to be variable interest entities and for which the Partnership is considered the primary beneficiary, and certain partnerships or similar entities which are not considered variable interest entities but in which the general partner is presumed to have control.
All intercompany balances and transactions have been eliminated in consolidation.
Restructurings within consolidated CLOs are treated as investment purchases or sales, as applicable, in the Condensed Consolidated Statements of Cash Flows.
�
13
Table of Contents
THE BLACKSTONE GROUP L.P.
Notes to Condensed Consolidated Financial Statements�Continued
(All Dollars Are in Thousands, Except Unit and Per Unit Data, Except Where Noted)
�
Consolidation
The Partnership consolidates all entities that it controls through a majority voting interest or otherwise, including those Blackstone Funds in which the general partner is presumed to have control. Although the Partnership has a non-controlling interest in Blackstone Holdings, the limited partners do not have the right to dissolve the partnerships or have substantive kick out rights or participating rights that would overcome the presumption of control by the Partnership. Accordingly, the Partnership consolidates Blackstone Holdings and records non-controlling interests to reflect the economic interests of the limited partners of Blackstone Holdings.
In addition, the Partnership consolidates all variable interest entities (�VIE�) in which it is the primary beneficiary. An enterprise is determined to be the primary beneficiary if it holds a controlling financial interest. A controlling financial interest is defined as (a)�the power to direct the activities of a VIE that most significantly impact the entity�s economic performance and (b)�the obligation to absorb losses of the entity or the right to receive benefits from the entity that could potentially be significant to the VIE. The consolidation guidance requires an analysis to determine (a)�whether an entity in which the Partnership holds a variable interest is a VIE and (b)�whether the Partnership�s involvement, through holding interests directly or indirectly in the entity or contractually through other variable interests (for example, management and performance related fees), would give it a controlling financial interest. Performance of that analysis requires the exercise of judgment. VIEs qualify for the deferral of the consolidation guidance if all of the following conditions have been met:
�
| � | (a) | The entity has all of the attributes of an investment company as defined in the American Institute of Certified Public Accountants Accounting and Auditing Guide, Investment Companies (�Investment Company Guide�), or does not have all the attributes of an investment company but it is an entity for which it is acceptable based on industry practice to apply measurement principles that are consistent with the Investment Company Guide, |
�
| � | (b) | The reporting entity does not have explicit or implicit obligations to fund any losses of the entity that could potentially be significant to the entity, and |
�
| � | (c) | The entity is not a securitization or asset-backed financing entity or an entity that was formerly considered a qualifying special purpose entity. |
Where the VIEs have qualified for the deferral of the current consolidation guidance, the analysis is based on previous consolidation guidance. This guidance requires an analysis to determine (a)�whether an entity in which the Partnership holds a variable interest is a variable interest entity and (b)�whether the Partnership�s involvement, through holding interests directly or indirectly in the entity or contractually through other variable interests (for example, management and performance related fees), would be expected to absorb a majority of the variability of the entity. Under both guidelines, the Partnership determines whether it is the primary beneficiary of a VIE at the time it becomes involved with a variable interest entity and reconsiders that conclusion continually. In evaluating whether the Partnership is the primary beneficiary, Blackstone evaluates its economic interests in the entity held either directly by the Partnership and its affiliates or indirectly through employees. The consolidation analysis can generally be performed qualitatively; however, if it is not readily apparent that the Partnership is not the primary beneficiary, a quantitative analysis may also be performed. Investments and redemptions (either by the Partnership, affiliates of the Partnership or third parties) or amendments to the governing documents of the respective Blackstone Funds could affect an entity�s status as a VIE or the determination of the primary beneficiary. At each reporting date, the Partnership assesses whether it is the primary beneficiary and will consolidate or deconsolidate accordingly.
�
14
Table of Contents
THE BLACKSTONE GROUP L.P.
Notes to Condensed Consolidated Financial Statements�Continued
(All Dollars Are in Thousands, Except Unit and Per Unit Data, Except Where Noted)
�
Assets of consolidated variable interest entities that can only be used to settle obligations of the consolidated VIE and liabilities of a consolidated VIE for which creditors (or beneficial interest holders) do not have recourse to the general credit of Blackstone are presented in a separate section in the Condensed Consolidated Statements of Financial Condition.
Blackstone�s other disclosures regarding VIEs are discussed in Note�9. �Variable Interest Entities�.
Fair Value of Financial Instruments
GAAP establishes a hierarchical disclosure framework which prioritizes and ranks the level of market price observability used in measuring financial instruments at fair value. Market price observability is affected by a number of factors, including the type of financial instrument, the characteristics specific to the financial instrument and the state of the marketplace, including the existence and transparency of transactions between market participants. Financial instruments with readily available quoted prices in active markets generally will have a higher degree of market price observability and a lesser degree of judgment used in measuring fair value.
Financial instruments measured and reported at fair value are classified and disclosed based on the observability of inputs used in the determination of fair values, as follows:
�
| � | � | � | Level I � Quoted prices are available in active markets for identical financial instruments as of the reporting date. The type of financial instruments in Level I include listed equities, listed derivatives and mutual funds with quoted prices. The Partnership does not adjust the quoted price for these investments, even in situations where Blackstone holds a large position and a sale could reasonably impact the quoted price. |
�
| � | � | � | Level II � Pricing inputs are other than quoted prices in active markets, which are either directly or indirectly observable as of the reporting date, and fair value is determined through the use of models or other valuation methodologies. Financial instruments which are generally included in this category include corporate bonds and loans, government and agency securities, less liquid and restricted equity securities, certain over-the-counter derivatives where the fair value is based on observable inputs, and certain funds of hedge funds and proprietary investments in which Blackstone has the ability to redeem its investment at net asset value at, or within three months of, the reporting date. |
�
| � | � | � | Level III � Pricing inputs are unobservable for the financial instruments and includes situations where there is little, if any, market activity for the financial instrument. The inputs into the determination of fair value require significant management judgment or estimation. Financial instruments that are included in this category generally include general and limited partnership interests in private equity and real estate funds, credit-focused funds, distressed debt and non-investment grade residual interests in securitizations, certain corporate bonds and loans held within CLO vehicles, certain over-the-counter derivatives where the fair value is based on unobservable inputs and certain funds of hedge funds that use net asset value per share to determine fair value in which Blackstone may not have the ability to redeem its investment at net asset value at, or within three months of, the reporting date. Blackstone may not have the ability to redeem its investment at net asset value at, or within three months of, the reporting date if an investee fund manager has the ability to limit the amount of redemptions, and/or the ability to side pocket investments, irrespective of whether such ability has been exercised. Senior and subordinate notes issued by CLO vehicles are classified within Level III of the fair value hierarchy. |
In certain cases, the inputs used to measure fair value may fall into different levels of the fair value hierarchy. In such cases, the determination of which category within the fair value hierarchy is appropriate for any given
�
15
Table of Contents
THE BLACKSTONE GROUP L.P.
Notes to Condensed Consolidated Financial Statements�Continued
(All Dollars Are in Thousands, Except Unit and Per Unit Data, Except Where Noted)
�
financial instrument is based on the lowest level of input that is significant to the fair value measurement. The Partnership�s assessment of the significance of a particular input to the fair value measurement in its entirety requires judgment and considers factors specific to the financial instrument.
Transfers between levels of the fair value hierarchy are recognized at the beginning of the reporting period.
Level II Valuation Techniques
Financial instruments classified within Level II of the fair value hierarchy comprise debt instruments, including corporate loans and bonds held by Blackstone�s consolidated CLO vehicles, those held within Blackstone�s Treasury Cash Management Strategies and debt securities sold, not yet purchased and interests in investment funds. Certain equity securities and derivative instruments valued using observable inputs are also classified as Level II.
The valuation techniques used to value financial instruments classified within Level II of the fair value hierarchy are as follows:
�
| � | � | � | Debt Instruments and Equity Securities are valued on the basis of prices from an orderly transaction between market participants provided by reputable dealers or pricing services. In determining the value of a particular investment, pricing services may use certain information with respect to transactions in such investments, quotations from dealers, pricing matrices and market transactions in comparable investments and various relationships between investments. The valuation of certain equity securities is based on an observable price for an identical security adjusted for the effect of a restriction. |
�
| � | � | � | Investment Funds held by the consolidated Blackstone Funds are valued using net asset value per share as described in Level III Valuation Techniques � Funds of Hedge Funds. Certain investments in investment funds are classified within Level II of the fair value hierarchy as the investment can be redeemed at, or within three months of, the reporting date. |
�
| � | � | � | Freestanding Derivatives and Derivative Instruments Designated as Fair Value Hedges are valued using contractual cash flows and observable inputs comprising yield curves, foreign currency rates and credit spreads. |
Level III Valuation Techniques
In the absence of observable market prices, Blackstone values its investments using valuation methodologies applied on a consistent basis. For some investments little market activity may exist; management�s determination of fair value is then based on the best information available in the circumstances, and may incorporate management�s own assumptions and involves a significant degree of judgment, taking into consideration a combination of internal and external factors, including the appropriate risk adjustments for non-performance and liquidity risks. Investments for which market prices are not observable include private investments in the equity of operating companies, real estate properties, certain funds of hedge funds and credit-focused investments.
Private Equity Investments � The fair values of private equity investments are determined by reference to projected net earnings, earnings before interest, taxes, depreciation and amortization (�EBITDA�), the discounted cash flow method, public market or private transactions, valuations for comparable companies and other measures which, in many cases, are unaudited at the time received. Valuations may be derived by reference to observable valuation measures for comparable companies or transactions (for example, multiplying a key performance metric of the investee company such as EBITDA by a relevant valuation multiple observed in the range of comparable companies or transactions), adjusted by management for differences between the investment and the referenced comparables, and in some instances by reference to option pricing models or other similar methods. Where a discounted cash flow method is used, a terminal value is derived by reference to EBITDA or price/earnings exit multiples.
�
16
Table of Contents
THE BLACKSTONE GROUP L.P.
Notes to Condensed Consolidated Financial Statements�Continued
(All Dollars Are in Thousands, Except Unit and Per Unit Data, Except Where Noted)
�
Real Estate Investments � The fair values of real estate investments are determined by considering projected operating cash flows, sales of comparable assets, if any, and replacement costs, among other measures. The methods used to estimate the fair value of real estate investments include the discounted cash flow method and/or capitalization rates (�cap rates�) analysis. Valuations may be derived by reference to observable valuation measures for comparable companies or assets (for example, multiplying a key performance metric of the investee company or asset, such as EBITDA, by a relevant valuation multiple observed in the range of comparable companies or transactions), adjusted by management for differences between the investment and the referenced comparables, and in some instances by reference to option pricing models or other similar methods. Where a discounted cash flow method is used, a terminal value is derived by reference to an exit EBITDA multiple or capitalization rate. Additionally, where applicable, projected distributable cash flow through debt maturity will be considered in support of the investment�s fair value.
Funds of Hedge Funds � The investments of consolidated Blackstone Funds in funds of hedge funds (�Investee Funds�) are valued at net asset value (�NAV�) per share of the Investee Fund. In limited circumstances, the Partnership may determine, based on its own due diligence and investment procedures, that NAV per share does not represent fair value. In such circumstances, the Partnership will estimate the fair value in good faith and in a manner that it reasonably chooses, in accordance with the requirements of GAAP.
Certain investments of Blackstone and of the consolidated Blackstone funds of hedge funds and credit-focused funds measure their investments in underlying funds at fair value using NAV per share without adjustment. The terms of the investee�s investment generally provide for minimum holding periods or lock-ups, the institution of gates on redemptions or the suspension of redemptions or an ability to side pocket investments, at the discretion of the investee�s fund manager, and as a result, investments may not be redeemable at, or within three months of, the reporting date. A side pocket is used by hedge funds and funds of hedge funds to separate investments that may lack a readily ascertainable value, are illiquid or are subject to liquidity restriction. Redemptions are generally not permitted until the investments within a side pocket are liquidated or it is deemed that the conditions existing at the time that required the investment to be included in the side pocket no longer exist. As the timing of either of these events is uncertain, the timing at which the Partnership may redeem an investment held in a side pocket cannot be estimated. Investments for which fair value is measured using NAV per share are reflected within the fair value hierarchy based on the existence of redemption restrictions, if any, as described above. Further disclosure on instruments for which fair value is measured using NAV per share is presented in Note�5. �Net Asset Value as Fair Value�.
Credit-Focused Investments � The fair values of credit-focused investments are generally determined on the basis of prices between market participants provided by reputable dealers or pricing services. In some instances, Blackstone may utilize other valuation techniques, including the discounted cash flow method or a market approach.
Credit-Focused Liabilities � Credit-focused liabilities comprise senior and subordinate loans issued by Blackstone�s consolidated CLO vehicles. Such liabilities are valued using a discounted cash flow method.
Level III Valuation Process
Investments classified within Level III of the fair value hierarchy are valued on a quarterly basis, taking into consideration any changes in Blackstone�s weighted-average cost of capital assumptions, discounted cash flow projections and exit multiple assumptions, as well as any changes in economic and other relevant conditions, and valuation models are updated accordingly. The valuation process also includes a review by an independent valuation party, at least annually for all investments, and quarterly for certain investments, to corroborate the values determined by management. The valuations of Blackstone�s investments are reviewed quarterly by a valuation
�
17
Table of Contents
THE BLACKSTONE GROUP L.P.
Notes to Condensed Consolidated Financial Statements�Continued
(All Dollars Are in Thousands, Except Unit and Per Unit Data, Except Where Noted)
�
committee which is chaired by Blackstone�s Vice Chairman and includes senior heads of each of Blackstone�s businesses, as well as representatives of legal and finance. Each quarter, the valuations of Blackstone�s investments are also reviewed by the Audit Committee in a meeting attended by the chairman of the valuation committee. The valuations are further tested by comparison to actual sales prices obtained on disposition of the investments.
Investments, at Fair Value
The Blackstone Funds are accounted for as investment companies under the Investment Company Guide, and reflect their investments, including majority-owned and controlled investments (the �Portfolio Companies�), at fair value. Blackstone has retained the specialized accounting for the consolidated Blackstone Funds. Thus, such consolidated funds� investments are reflected in Investments on the Condensed Consolidated Statements of Financial Condition at fair value, with unrealized gains and losses resulting from changes in fair value reflected as a component of Net Gains (Losses) from Fund Investment Activities in the Condensed Consolidated Statements of Operations. Fair value is the amount that would be received to sell an asset or paid to transfer a liability, in an orderly transaction between market participants at the measurement date (i.e., the exit price).
Blackstone�s principal investments are presented at fair value with unrealized appreciation or depreciation and realized gains and losses recognized in the Condensed Consolidated Statements of Operations within Investment Income (Loss).
For certain instruments, the Partnership has elected the fair value option. Such election is irrevocable and is applied on an investment by investment basis at initial recognition. The Partnership has applied the fair value option for certain loans and receivables that otherwise would not have been carried at fair value with gains and losses recorded in net income. Accounting for these financial instruments at fair value is consistent with how the Partnership accounts for its other principal investments. Loans extended to third parties are recorded within Accounts Receivable within the Condensed Consolidated Statements of Financial Condition. Debt securities for which the fair value option has been elected are recorded within Investments. The methodology for measuring the fair value of such investments is consistent with the methodology applied to private equity, real estate, credit-focused and funds of hedge funds investments. Changes in the fair value of such instruments are recognized in Investment Income (Loss) in the Condensed Consolidated Statements of Operations. Interest income on interest bearing loans and receivables on which the fair value option has been elected is based on stated coupon rates adjusted for the accretion of purchase discounts and the amortization of purchase premiums. This interest income is recorded within Interest and Dividend Revenue.
In addition, the Partnership has elected the fair value option for the assets and liabilities of CLO vehicles that are consolidated as of January�1, 2010, as a result of the initial adoption of variable interest entity consolidation guidance. The Partnership has also elected the fair value option for CLO vehicles consolidated as a result of the acquisitions of CLO management contracts or the acquisition of the share capital of CLO managers. The adjustment resulting from the difference between the fair value of assets and liabilities for each of these events is presented as a transition and acquisition adjustment to Appropriated Partners� Capital. Assets of the consolidated CLOs are presented within Investments within the Condensed Consolidated Statements of Financial Condition and Liabilities within Loans Payable for the amounts due to unaffiliated third parties and Due to Affiliates for the amounts held by non-consolidated affiliates. The methodology for measuring the fair value of such assets and liabilities is consistent with the methodology applied to private equity, real estate and credit-focused investments. Changes in the fair value of consolidated CLO assets and liabilities and related interest, dividend and other income subsequent to adoption and acquisition are presented within Net Gains (Losses) from Fund Investment Activities. Expenses of consolidated CLO vehicles are presented in Fund Expenses. Amounts attributable to Non-Controlling Interests in Consolidated Entities have a corresponding adjustment to Appropriated Partners� Capital.
�
18
Table of Contents
THE BLACKSTONE GROUP L.P.
Notes to Condensed Consolidated Financial Statements�Continued
(All Dollars Are in Thousands, Except Unit and Per Unit Data, Except Where Noted)
�
The Partnership has elected the fair value option for certain proprietary investments that would otherwise have been accounted for using the equity method of accounting. The fair value of such investments is based on quoted prices in an active market or using the discounted cash flow method. Changes in fair value are recognized in Investment Income (Loss) in the Condensed Consolidated Statements of Operations.
Further disclosure on instruments for which the fair value option has been elected is presented in Note�7. �Fair Value Option� to the Condensed Consolidated Financial Statements.
Security and loan transactions are recorded on a trade date basis.
Equity Method Investments
Investments in which the Partnership is deemed to exert significant influence, but not control, are accounted for using the equity method of accounting. Under the equity method of accounting, the Partnership�s share of earnings (losses) from equity method investments is included in Investment Income (Loss) in the Condensed Consolidated Statements of Operations. The carrying amounts of equity method investments are reflected in Investments in the Condensed Consolidated Statements of Financial Condition. As the underlying investments of the Partnership�s equity method investments in Blackstone Funds are reported at fair value, the carrying value of the Partnership�s equity method investments approximates fair value.
Repurchase and Reverse Repurchase Agreements
Securities purchased under agreements to resell (�reverse repurchase agreements�) and securities sold under agreements to repurchase (�repurchase agreements�), comprised primarily of U.S. and non-U.S. government and agency securities, asset-backed securities and corporate debt, represent collateralized financing transactions. Such transactions are recorded in the Condensed Consolidated Statements of Financial Condition at their contractual amounts and include accrued interest. The carrying value of repurchase and reverse repurchase agreements approximates fair value.
The Partnership manages credit exposure arising from repurchase agreements and reverse repurchase agreements by, in appropriate circumstances, entering into master netting agreements and collateral arrangements with counterparties that provide the Partnership, in the event of a counterparty default, the right to liquidate collateral and the right to offset a counterparty�s rights and obligations.
The Partnership takes possession of securities purchased under reverse repurchase agreements and is permitted to repledge, deliver or otherwise use such securities. The Partnership also pledges its financial instruments to counterparties to collateralize repurchase agreements. Financial instruments pledged that can be repledged, delivered or otherwise used by the counterparty are recorded in Investments in the Condensed Consolidated Statements of Financial Condition.
Blackstone does not offset assets and liabilities relating to reverse repurchase agreements and repurchase agreements in its Condensed Consolidated Statements of Financial Condition. Additional disclosures relating to offsetting are discussed in Note�11. �Offsetting of Assets and Liabilities�.
Securities Sold, Not Yet Purchased
Securities Sold, Not Yet Purchased consist of equity and debt securities that the Partnership has borrowed and sold. The Partnership is required to �cover� its short sale in the future by purchasing the security at prevailing
�
19
Table of Contents
THE BLACKSTONE GROUP L.P.
Notes to Condensed Consolidated Financial Statements�Continued
(All Dollars Are in Thousands, Except Unit and Per Unit Data, Except Where Noted)
�
market prices and delivering it to the counterparty from which it borrowed the security. The Partnership is exposed to loss in the event that the price at which a security may have to be purchased to cover a short sale exceeds the price at which the borrowed security was sold short.
Securities Sold, Not Yet Purchased are recorded at fair value in the Condensed Consolidated Statements of Financial Condition.
Derivative Instruments
The Partnership recognizes all derivatives as assets or liabilities on its Condensed Consolidated Statements of Financial Condition at fair value. On the date the Partnership enters into a derivative contract, it designates and documents each derivative contract as one of the following: (a)�a hedge of a recognized asset or liability (�fair value hedge�), (b)�a hedge of a forecasted transaction or of the variability of cash flows to be received or paid related to a recognized asset or liability (�cash flow hedge�), (c)�a hedge of a net investment in a foreign operation, or (d)�a derivative instrument not designated as a hedging instrument (�freestanding derivative�). For a fair value hedge, Blackstone records changes in the fair value of the derivative and, to the extent that it is highly effective, changes in the fair value of the hedged asset or liability attributable to the hedged risk, in current period earnings in General, Administrative and Other in the Condensed Consolidated Statements of Operations. Changes in the fair value of derivatives designated as hedging instruments caused by factors other than changes in the risk being hedged, which are excluded from the assessment of hedge effectiveness, are recognized in current period earnings.
The Partnership formally documents at inception its hedge relationships, including identification of the hedging instruments and the hedged items, its risk management objectives, strategy for undertaking the hedge transaction and the Partnership�s evaluation of effectiveness of its hedged transaction. At least monthly, the Partnership also formally assesses whether the derivative it designated in each hedging relationship is expected to be, and has been, highly effective in offsetting changes in estimated fair values or cash flows of the hedged items using either the regression analysis or the dollar offset method. If it is determined that a derivative is not highly effective at hedging the designated exposure, hedge accounting is discontinued. The Partnership may also at any time remove a designation of a fair value hedge. The fair value of the derivative instrument is reflected within Other Assets in the Condensed Consolidated Statements of Financial Condition.
For freestanding derivative contracts, the Partnership presents changes in fair value in current period earnings. Changes in the fair value of derivative instruments held by consolidated Blackstone Funds are reflected in Net Gains (Losses) from Fund Investment Activities or, where derivative instruments are held by the Partnership, within Investment Income (Loss) in the Condensed Consolidated Statements of Operations. The fair value of freestanding derivative assets are recorded within Investments and freestanding derivative liabilities are recorded within Accounts Payable, Accrued Expenses and Other Liabilities in the Condensed Consolidated Statements of Financial Condition.
The Partnership has elected to not offset derivative assets and liabilities or financial assets in its Condensed Consolidated Statements of Financial Condition, including cash and securities, that may be received or paid as part of collateral arrangements, even when an enforceable master netting agreement is in place that provides the Partnership, in the event of counterparty default, the right to liquidate collateral and the right to offset a counterparty�s rights and obligations.
Blackstone�s other disclosures regarding derivative financial instruments are discussed in Note�6. �Derivative Financial Instruments�.
Blackstone�s disclosures regarding offsetting are discussed in Note�11. �Offsetting of Assets and Liabilities�.
�
20
Table of Contents
THE BLACKSTONE GROUP L.P.
Notes to Condensed Consolidated Financial Statements�Continued
(All Dollars Are in Thousands, Except Unit and Per Unit Data, Except Where Noted)
�
Affiliates
Blackstone considers its Founder, senior managing directors, employees, the Blackstone Funds and the Portfolio Companies to be affiliates.
Distributions
Distributions are reflected in the condensed consolidated financial statements when declared.
Recent Accounting Developments
In February 2013, the Financial Accounting Standards Board (�FASB�) issued guidance on the reporting of amounts reclassified out of accumulated other comprehensive income. The guidance did not change the requirement for reporting net income or other comprehensive income in financial statements. However, the amendments required an entity to provide information about the amounts reclassified out of accumulated other comprehensive income by component. In addition, an entity is required to present, either on the face of the statement where net income is presented or in the notes to the financial statements, significant amounts reclassified out of accumulated other comprehensive income by the respective line items of net income but only if the amount reclassified is required under GAAP to be reclassified to net income in its entirety in the same reporting period. For other amounts that are not required under GAAP to be reclassified in their entirety to net income, an entity is required to cross-reference to other disclosures required under GAAP that provide additional detail about those amounts.
The guidance was effective prospectively for periods beginning after December�15, 2012. Adoption had no impact on the Partnership�s financial statements.
In December 2011, the FASB issued guidance to enhance disclosures about financial instruments and derivative instruments that are either (a)�offset or (b)�subject to an enforceable master netting arrangement or similar agreement, irrespective of whether they are offset. Under the amended guidance, an entity is required to disclose quantitative information relating to recognized assets and liabilities that are offset or subject to an enforceable master netting arrangement or similar agreement, including (a)�the gross amounts of those recognized assets and liabilities, (b)�the amounts offset to determine the net amount presented in the statement of financial position, and (c)�the net amount presented in the statement of financial position. With respect to amounts subject to an enforceable master netting arrangement or similar agreement which are not offset, disclosure is required of (a)�the amounts related to recognized financial instruments and other derivative instruments, (b)�the amount related to financial collateral (including cash collateral), and (c)�the overall net amount after considering amounts that have not been offset. The guidance was effective for annual reporting periods beginning on or after January�1, 2013 and interim periods within those annual periods and retrospective application is required. As the amendments were limited to disclosure only, adoption did not have a material impact on the Partnership�s financial statements.
In January 2013, the FASB issued guidance to clarify the scope of disclosures about offsetting assets and liabilities. The amendments clarified that the scope of guidance issued in December 2011 to enhance disclosures around financial instruments and derivative instruments that are either (a)�offset, or (b)�subject to a master netting agreement or similar agreement, irrespective of whether they are offset, applies to derivatives, including bifurcated embedded derivatives, repurchase agreements and reverse repurchase agreements, and securities borrowing and securities lending transactions that are either offset or subject to an enforceable master netting arrangement or similar agreement. The amendments were effective for interim and annual periods beginning on or after January�1, 2013. Adoption did not have a material impact on the Partnership�s financial statements.
�
21
Table of Contents
THE BLACKSTONE GROUP L.P.
Notes to Condensed Consolidated Financial Statements�Continued
(All Dollars Are in Thousands, Except Unit and Per Unit Data, Except Where Noted)
�
In February 2013, the FASB issued guidance on the measurement of joint and several liability arrangements in which the total amount of the obligation is fixed at the reporting date. The guidance requires entities to measure obligations from joint and several liability arrangements for which the total amount of the obligation within the scope of the guidance is fixed at the reporting date as the sum of (a)�the amount the reporting entity agreed to pay on the basis of its arrangement among its co-obligors and (b)�any additional amount the reporting entity expects to pay on behalf of its co-obligors. The guidance also requires an entity to disclose the nature and amount of the obligation as well as other information about those obligations. The guidance is effective for fiscal years, and interim periods within those years, beginning after December�15, 2013. Adoption did not have a material impact on the Partnership�s financial statements.
In March 2013, the FASB issued guidance on a parent entity�s accounting for cumulative translation adjustment upon derecognition of certain subsidiaries or groups of assets within a foreign entity or of an investment in a foreign entity. When a parent entity ceases to have a controlling financial interest in a subsidiary or a group of assets that is a business within a foreign entity, any related portion of the total cumulative translation adjustment should be released into net income if the sale or transfer results in the complete or substantially complete liquidation of the foreign entity in which the subsidiary or group of assets had resided. For an equity method investment that is a foreign entity, partial sale guidance applies. As such, a pro rata portion of the cumulative translation adjustment should be released into net income upon a partial sale of such an equity method investment. For an equity method investment that is not a foreign entity, the cumulative translation adjustment is released into net income only if the partial sale represents a complete or substantially complete liquidation of the foreign entity that contains the equity method investment. Additionally, the guidance clarifies that the sale of an investment in a foreign entity includes both (a)�events that result in the loss of a controlling financial interest in a foreign entity (that is, irrespective of any retained investment) and (b)�events that result in an acquirer obtaining control of an acquiree in which it held an equity interest immediately before the acquisition date (sometimes also referred to as a step acquisition). Accordingly, the cumulative translation adjustment should be released into net income upon the occurrence of those events. The guidance shall be applied on a prospective basis for fiscal years, and interim periods within those years, beginning after December�15, 2013. The guidance should be applied to derecognition events occurring after the effective date. Prior periods should not be adjusted. Early adoption is permitted. Adoption did not have a material impact on the Partnership�s financial statements.
In April 2013, the FASB issued guidance on when and how an entity should prepare its financial statements using the liquidation basis of accounting. The guidance requires an entity to prepare its financial statements using the liquidation basis of accounting when liquidation is imminent. Financial statements prepared using the liquidation basis of accounting shall measure and present assets at the amount of the expected cash proceeds from liquidation. The presentation of assets shall include any items that had not previously been recognized under GAAP but that it expects to either sell in liquidation or use in settling liabilities. Liabilities shall be recognized and measured in accordance with GAAP that otherwise applies to those liabilities. The guidance requires an entity to accrue and separately present the costs that it expects to incur and the income that it expects to earn during the expected duration of the liquidation, including any costs associated with sale or settlement of those assets and liabilities. The guidance requires disclosures about an entity�s plan for liquidation, the methods and significant assumptions used to measure assets and liabilities, the type and amount of costs and income accrued, and the expected duration of the liquidation process. The guidance is effective for entities that determine liquidation is imminent during annual reporting periods beginning after December�15, 2013 and interim periods therein. The guidance should be applied prospectively. Adoption did not have a material impact on the Partnership�s financial statements.
In June 2013, the FASB issued guidance to clarify the characteristics of an investment company and to provide guidance for assessing whether an entity is an investment company. Consistent with existing guidance for investment companies, all investments are to be measured at fair value including non-controlling ownership
�
22
Table of Contents
THE BLACKSTONE GROUP L.P.
Notes to Condensed Consolidated Financial Statements�Continued
(All Dollars Are in Thousands, Except Unit and Per Unit Data, Except Where Noted)
�
interests in other investment companies. There are no changes to the current requirements relating to the retention of specialized accounting in the consolidated financial statements of a non-investment company parent. The guidance is effective for interim and annual periods beginning after December�15, 2013 and early application is prohibited. Adoption did not have a material impact on the Partnership�s financial statements.
In June 2014, the FASB issued amended guidance on revenue from contracts with customers. The guidance requires that an entity should recognize revenue to depict the transfer of promised goods or services to customers in an amount that reflects the consideration to which the entity expects to be entitled in exchange for those goods or services. An entity is required to (a)�identify the contract(s) with a customer, (b)�identify the performance obligations in the contract, (c)�determine the transaction price, (d)�allocate the transaction price to the performance obligations in the contract, and (e)�recognize revenue when (or as) the entity satisfies a performance obligation. In determining the transaction price, an entity may include variable consideration only to the extent that it is probable that a significant reversal in the amount of cumulative revenue recognized would not occur when the uncertainty associated with the variable consideration is resolved.
The guidance introduces new qualitative and quantitative disclosure requirements about contracts with customers including revenue and impairments recognized, disaggregation of revenue and information about contract balances and performance obligations. Information is required about significant judgments and changes in judgments in determining the timing of satisfaction of performance obligations and determining the transaction price and amounts allocated to performance obligations. Additional disclosures are required about assets recognized from the costs to obtain or fulfill a contract.
The amended guidance is effective for annual periods beginning after December�15, 2016, including interim periods within that reporting period. The guidance may have a material impact on Blackstone�s consolidated financial statements if it is determined that both performance fees and carried interest are forms of variable consideration that may not be included in the transaction price. This may significantly delay the recognition of carried interest income and performance fees.
In June 2014, the FASB issued amended guidance on transfers and servicing. Under the amended guidance, repurchase transactions previously accounted for as sales should be accounted for as secured borrowings. There are additional disclosures relating to repurchase agreements, secured lending transactions and repurchase-to-maturity transactions that are accounted for as secured borrowings including a disaggregation of the gross obligations by the class of collateral pledged, the remaining contractual tenor of the agreements and a discussion of the potential risks associated with the agreements and the related collateral pledged.
The guidance is effective for the first interim or annual period beginning after December�15, 2014. Earlier application is prohibited. The amended guidance is not expected to have a material impact on Blackstone�s financial statements.
In August 2014, the FASB issued amended guidance on the measurement of financial assets and financial liabilities of a consolidated collateralized financing entity. Under the amended guidance, a reporting entity that consolidates a collateralized financing entity may elect to measure the financial assets and the financial liabilities using the more observable of the fair value of the financial assets and the fair value of the financial liabilities. When this measurement alternative is elected, a reporting entity�s consolidated net income (loss) should reflect the reporting entity�s own economic interest in the collateralized financing entity, including (a)�changes in the fair value of the beneficial interests retained by the reporting entity and (b)�beneficial interests that represent compensation for services. When this measurement alternative is not elected, the amendments clarify that the fair value of financial assets and financial liabilities should be measured in accordance with existing fair value guidance and any
�
23
Table of Contents
THE BLACKSTONE GROUP L.P.
Notes to Condensed Consolidated Financial Statements�Continued
(All Dollars Are in Thousands, Except Unit and Per Unit Data, Except Where Noted)
�
difference in the fair value of financial assets and financial liabilities should be reflected in earnings and attributed to the reporting entity in the consolidated statement of income (loss). The guidance is effective for annual periods, and interim periods within those annual periods, beginning after December�15, 2015. Early adoption is permitted as of the beginning of the annual period. The guidance is expected to impact the measurement of the financial assets or financial liabilities of Blackstone�s consolidated collateralized loan obligation vehicles and have a material impact on the recognition of appropriated partners� capital. However, the impact on net income attributable to The Blackstone Group L.P. is not expected to be material.
�
| 3. | INTANGIBLE ASSETS |
Intangible Assets, Net consists of the following:
�
| � | �� | September�30, 2014 |
� | � | December�31, 2013 |
� | ||
| Finite-Lived Intangible Assets/Contractual Rights |
�� | $ | 1,464,017 | �� | � | $ | 1,594,128 | �� |
| Accumulated Amortization |
�� | � | (980,178 | )� | � | � | (1,033,380 | )� |
| �� | � |
� |
� | � | � |
� |
� | |
| Intangible Assets, Net |
�� | $ | 483,839 | �� | � | $ | 560,748 | �� |
| �� | � |
� |
� | � | � |
� |
� | |
Amortization expense associated with Blackstone�s intangible assets was $25.1�million and $76.9�million for the three and nine month periods ended September�30,�2014, respectively, and $24.8�million and $69.3�million for the three and nine month periods ended September�30, 2013, respectively.
Amortization of Intangible Assets held at September�30,�2014 is expected to be $102.2�million, $95.9�million, $85.6�million, $46.5�million and $46.5�million for each of the years ending December�31, 2014, 2015, 2016, 2017 and 2018, respectively. Blackstone�s intangible assets as of September�30,�2014 are expected to amortize over a weighted-average period of 7.0�years.
�
| 4. | INVESTMENTS |
Investments consists of the following:
�
| � | �� | September�30, 2014 |
� | �� | December�31, 2013 |
� | ||
| Investments of Consolidated Blackstone Funds |
�� | $ | 10,733,353 | �� | �� | $ | 12,521,248 | �� |
| Equity Method Investments |
�� | � | 3,433,312 | �� | �� | � | 3,309,879 | �� |
| Blackstone�s Treasury Cash Management Strategies |
�� | � | 1,693,373 | �� | �� | � | 1,104,800 | �� |
| Performance Fees |
�� | � | 6,122,738 | �� | �� | � | 4,674,792 | �� |
| Other Investments |
�� | � | 138,377 | �� | �� | � | 118,804 | �� |
| �� | � |
� |
� | �� | � |
� |
� | |
| �� | $ | 22,121,153 | �� | �� | $ | 21,729,523 | �� | |
| �� | � |
� |
� | �� | � |
� |
� | |
Blackstone�s share of Investments of Consolidated Blackstone Funds totaled $671.9�million and $487.8�million at September�30,�2014 and December�31, 2013, respectively.
�
24
Table of Contents
THE BLACKSTONE GROUP L.P.
Notes to Condensed Consolidated Financial Statements�Continued
(All Dollars Are in Thousands, Except Unit and Per Unit Data, Except Where Noted)
�
Investments of Consolidated Blackstone Funds
The following table presents the Realized and Net Change in Unrealized Gains (Losses) on investments held by the consolidated Blackstone Funds and a reconciliation to Other Income�Net Gains from Fund Investment Activities in the Condensed Consolidated Statements of Operations:
�
| � | � | Three�Months�Ended�September�30, | � | � | Nine�Months�Ended�September�30, | � | ||||||||||
| � | � | ��������2014�������� | � | � | ��������2013�������� | � | � | ��������2014�������� | � | � | ��������2013�������� | � | ||||
| Realized Gains (Losses) |
� | $ | 32,427 | �� | � | $ | (2,932 | )� | � | $ | 66,366 | �� | � | $ | 95,403 | �� |
| Net Change in Unrealized Gains (Losses) |
� | � | (71,525 | )� | � | � | 46,872 | �� | � | � | (30,406 | )� | � | � | (36,855 | )� |
| � | � |
� |
� | � | � |
� |
� | � | � |
� |
� | � | � |
� |
� | |
| Realized and Net Change in Unrealized Gains (Losses) from Consolidated Blackstone Funds |
� | � | (39,098 | )� | � | � | 43,940 | �� | � | � | 35,960 | �� | � | � | 58,548 | �� |
| Interest and Dividend Revenue Attributable to Consolidated Blackstone Funds |
� | � | 47,780 | �� | � | � | 44,012 | �� | � | � | 181,462 | �� | � | � | 137,580 | �� |
| � | � |
� |
� | � | � |
� |
� | � | � |
� |
� | � | � |
� |
� | |
| Other Income � Net Gains from Fund Investment Activities |
� | $ | 8,682 | �� | � | $ | 87,952 | �� | � | $ | 217,422 | �� | � | $ | 196,128 | �� |
| � | � |
� |
� | � | � |
� |
� | � | � |
� |
� | � | � |
� |
� | |
Equity Method Investments
Blackstone�s equity method investments include its investments in private equity funds, real estate funds, funds of hedge funds and credit-focused funds and other proprietary investments, which are not consolidated but in which the Partnership exerts significant influence.
Blackstone evaluates each of its equity method investments to determine if any were significant as defined by guidance from the United States Securities and Exchange Commission. As of and for the three months ended September�30,�2014 and 2013, no individual equity method investment held by Blackstone met the significance criteria. As such, Blackstone is not required to present summarized financial information for any of its equity method investments.
The Partnership recognized net gains related to its equity method investments of $97.1�million and $71.3�million for the three months ended September�30, 2014 and 2013, respectively. The Partnership recognized net gains related to its equity method investments of $330.1�million and $282.6�million for the nine months ended September�30,�2014 and 2013, respectively.
Blackstone�s Treasury Cash Management Strategies
The portion of Blackstone�s Treasury Cash Management Strategies included in Investments represents the Partnership�s liquid investments in government, other investment and non-investment grade securities and other investments. These strategies are primarily managed by third party institutions. The following table presents the realized and net change in unrealized gains (losses) on investments held by Blackstone�s Treasury Cash Management Strategies:
�
| � | �� | Three�Months�Ended�September�30, | � | � | Nine�Months�Ended�September�30, | � | ||||||||||
| � | �� | ��������2014�������� | � | � | ��������2013�������� | � | � | ��������2014�������� | � | �� | ��������2013�������� | � | ||||
| Realized Gains (Losses) |
�� | $ | 2,142 | �� | � | $ | (6,587 | )� | � | $ | 6,307 | �� | �� | $ | (4,030 | )� |
| Net Change in Unrealized Gains (Losses) |
�� | � | (14,541 | )� | � | � | 10,126 | �� | � | � | 1,551 | �� | �� | � | (9,041 | )� |
| �� | � |
� |
� | � | � |
� |
� | � | � |
� |
� | �� | � |
� |
� | |
| �� | $ | (12,399 | )� | � | $ | 3,539 | �� | � | $ | 7,858 | �� | �� | $ | (13,071 | )� | |
| �� | � |
� |
� | � | � |
� |
� | � | � |
� |
� | �� | � |
� |
� | |
�
25
Table of Contents
THE BLACKSTONE GROUP L.P.
Notes to Condensed Consolidated Financial Statements�Continued
(All Dollars Are in Thousands, Except Unit and Per Unit Data, Except Where Noted)
�
Performance Fees
Performance Fees allocated to the general partner in respect of performance of certain Carry Funds, funds of hedge funds and credit-focused funds were as follows:
�
| � | �� | Private Equity |
� | � | Real Estate |
� | � | Hedge�Fund Solutions |
� | � | Credit | � | � | Total | � | |||||
| Performance Fees, December�31, 2013 |
�� | $ | 971,860 | �� | � | $ | 3,268,606 | �� | � | $ | 9,468 | �� | � | $ | 424,858 | �� | � | $ | 4,674,792 | �� |
| Performance Fees Allocated as a Result of Changes in Fund Fair Values |
�� | � | 1,222,677 | �� | � | � | 1,435,215 | �� | � | � | 40,181 | �� | � | � | 237,877 | �� | � | � | 2,935,950 | �� |
| Foreign Exchange Loss |
�� | � | ��� | �� | � | � | (22,975 | )� | � | � | ��� | �� | � | � | ��� | �� | � | � | (22,975 | )� |
| Fund Distributions |
�� | � | (416,492 | )� | � | � | (836,664 | )� | � | � | (18,443 | )� | � | � | (193,430 | )� | � | � | (1,465,029 | )� |
| �� | � |
� |
� | � | � |
� |
� | � | � |
� |
� | � | � |
� |
� | � | � |
� |
� | |
| Performance Fees, September�30, 2014 |
�� | $ | 1,778,045 | �� | � | $ | 3,844,182 | �� | � | $ | 31,206 | �� | � | $ | 469,305 | �� | � | $ | 6,122,738 | �� |
| �� | � |
� |
� | � | � |
� |
� | � | � |
� |
� | � | � |
� |
� | � | � |
� |
� | |
Other Investments
Other Investments consist primarily of proprietary investment securities held by Blackstone. The following table presents Blackstone�s realized and net change in unrealized gains (losses) in other investments:
�
| � | �� | Three�Months�Ended�September�30, | � | � | Nine�Months�Ended�September�30, | � | ||||||||||
| � | �� | ��������2014�������� | � | � | ��������2013�������� | � | � | ��������2014�������� | � | � | ��������2013�������� | � | ||||
| Realized Gains (Losses) |
�� | $ | (460 | )� | � | $ | (168 | )� | � | $ | 5,152 | �� | � | $ | 13,938 | �� |
| Net Change in Unrealized Gains (Losses) |
�� | � | 239 | �� | � | � | 1,331 | �� | � | � | (6,252 | )� | � | � | (11,170 | )� |
| �� | � |
� |
� | � | � |
� |
� | � | � |
� |
� | � | � |
� |
� | |
| �� | $ | (221 | )� | � | $ | 1,163 | �� | � | $ | (1,100 | )� | � | $ | 2,768 | �� | |
| �� | � |
� |
� | � | � |
� |
� | � | � |
� |
� | � | � |
� |
� | |
�
| 5. | NET ASSET VALUE AS FAIR VALUE |
A summary of fair value by strategy type alongside the remaining unfunded commitments and ability to redeem such investments as of September�30, 2014 is presented below:
�
| Strategy |
�� | Fair Value | � | �� | Unfunded Commitments |
� | �� | Redemption Frequency (if currently eligible) |
� | � | Redemption Notice Period |
� | ||||
| Diversified Instruments |
�� | $ | 185,841 | �� | �� | $ | 1,415 | �� | �� | � | (a | )� | � | � | (a | )� |
| Credit Driven |
�� | � | 336,773 | �� | �� | � | ��� | �� | �� | � | (b | )� | � | � | (b | )� |
| Event Driven |
�� | � | 187,665 | �� | �� | � | ��� | �� | �� | � | (c | )� | � | � | (c | )� |
| Equity |
�� | � | 360,613 | �� | �� | � | ��� | �� | �� | � | (d | )� | � | � | (d | )� |
| Commodities |
�� | � | 55,909 | �� | �� | � | ��� | �� | �� | � | (e | )� | � | � | (e | )� |
| Private Equity |
�� | � | 85,364 | �� | �� | � | ��� | �� | �� | � | (f | )� | � | � | (f | )� |
| �� | � |
� |
� | �� | � |
� |
� | �� | � | |||||||
| �� | $ | 1,212,165 | �� | �� | $ | 1,415 | �� | �� | � | |||||||
| �� | � |
� |
� | �� | � |
� |
� | �� | � | |||||||
�
| (a) | Diversified Instruments include investments in funds that invest across multiple strategies. Investments representing 79% of the fair value of the investments in this category may not be redeemed at, or within three months of, the reporting date. Investments representing 16% of the fair value of the investments in this category represent investments in hedge funds that are in the process of liquidating. Distributions from these funds will be received as underlying investments are liquidated. The time at which this redemption restriction |
�
26
Table of Contents
THE BLACKSTONE GROUP L.P.
Notes to Condensed Consolidated Financial Statements�Continued
(All Dollars Are in Thousands, Except Unit and Per Unit Data, Except Where Noted)
�
| � | may lapse cannot be estimated. The remaining 5% of investments in this category are redeemable as of the reporting date. As of the reporting date, the investee fund manager had elected to side pocket 10% of Blackstone�s investments in this category. |
| (b) | The Credit Driven category includes investments in hedge funds that invest primarily in domestic and international bonds. Investments representing 68% of the fair value of the investments in this category may not be redeemed at, or within three months of, the reporting date. Investments representing 30% of the fair value of the investments in this category are redeemable as of the reporting date. Investments representing 2% of the total fair value in the credit driven category are subject to redemption restrictions at the discretion of the investee fund manager who may choose (but may not have exercised such ability) to side pocket such investments. As of the reporting date, the investee fund manager had not elected to side pocket any of Blackstone�s investments in this category. |
| (c) | The Event Driven category includes investments in hedge funds whose primary investing strategy is to identify certain event-driven investments. Withdrawals are not permitted in this category. Distributions will be received as the underlying investments are liquidated. |
| (d) | The Equity category includes investments in hedge funds that invest primarily in domestic and international equity securities. Withdrawals are generally not permitted for investments in this category. Distributions will be received as the underlying investments are liquidated. |
| (e) | The Commodities category includes investments in commodities-focused funds that primarily invest in futures and physical-based commodity driven strategies. Withdrawals are not permitted for investments representing 95% of the fair value of investments in this category. Distributions will be received as the underlying investments are liquidated. The remaining 5% of the fair value of the investments in this category may not be redeemed at, or within three months of, the reporting date. |
| (f) | The Private Equity category includes investments in private equity funds that primarily invest in private equity, revenue interests and other private investments. Withdrawals are not permitted for investments in this category. |
�
| 6. | DERIVATIVE FINANCIAL INSTRUMENTS |
Blackstone and the Blackstone Funds enter into derivative contracts in the normal course of business to achieve certain risk management objectives and for general investment purposes. Additionally, Blackstone may enter into derivative contracts in order to hedge its interest rate risk exposure against the effects of interest rate changes. As a result of the use of derivative contracts, Blackstone and the consolidated Blackstone Funds are exposed to the risk that counterparties will fail to fulfill their contractual obligations. To mitigate such counterparty risk, Blackstone and the consolidated Blackstone Funds enter into contracts with certain major financial institutions, all of which have investment grade ratings. Counterparty credit risk is evaluated in determining the fair value of derivative instruments.
Freestanding Derivatives
Freestanding derivatives are instruments that Blackstone and certain of the consolidated Blackstone Funds have entered into as part of their overall risk management and investment strategies. These derivative contracts are not designated as hedging instruments for accounting purposes. Such contracts may include interest rate swaps, foreign exchange contracts, equity swaps, options, futures and other derivative contracts.
�
27
Table of Contents
THE BLACKSTONE GROUP L.P.
Notes to Condensed Consolidated Financial Statements�Continued
(All Dollars Are in Thousands, Except Unit and Per Unit Data, Except Where Noted)
�
The table below summarizes the aggregate notional amount and fair value of the derivative financial instruments. The notional amount represents the absolute value amount of all outstanding derivative contracts.
�
| � | � | September�30, 2014 | � | � | December�31, 2013 | � | ||||||||||||||||||||||||||
| � | � | Assets | � | � | Liabilities | � | � | Assets | � | � | Liabilities | � | ||||||||||||||||||||
| � | � | Notional | � | � | Fair Value |
� | � | Notional | � | � | Fair Value |
� | � | Notional | � | � | Fair Value |
� | � | Notional | � | � | Fair Value |
� | ||||||||
| Freestanding Derivatives |
� | � | � | � | � | � | � | � | ||||||||||||||||||||||||
| Blackstone � Other |
� | $ | 455,766 | �� | � | $ | 1,254 | �� | � | $ | 956,729 | �� | � | $ | 1,993 | �� | � | $ | 1,994,276 | �� | � | $ | 8,521 | �� | � | $ | 1,083,140 | �� | � | $ | 2,676 | �� |
| Foreign Currency Contracts |
� | � | 269,367 | �� | � | � | 5,200 | �� | � | � | 328,481 | �� | � | � | 831 | �� | � | � | 166,066 | �� | � | � | 1,480 | �� | � | � | 163,787 | �� | � | � | 1,015 | �� |
| Total Return Swaps |
� | � | ��� | �� | � | � | ��� | �� | � | � | ��� | �� | � | � | ��� | �� | � | � | 326,929 | �� | � | � | 342 | �� | � | � | ��� | �� | � | � | ��� | �� |
| Credit Default Swaps |
� | � | ��� | �� | � | � | ��� | �� | � | � | 66,500 | �� | � | � | 1,835 | �� | � | � | ��� | �� | � | � | ��� | �� | � | � | 10,000 | �� | � | � | 591 | �� |
| Investments of Consolidated |
� | � | 199,902 | �� | � | � | 11,921 | �� | � | � | 263,240 | �� | � | � | 22,620 | �� | � | � | 396,569 | �� | � | � | 30,830 | �� | � | � | 239,037 | �� | � | � | 10,018 | �� |
| Interest Rate Contracts |
� | � | 23,645 | �� | � | � | 2,772 | �� | � | � | ��� | �� | � | � | ��� | �� | � | � | 62,193 | �� | � | � | 3,726 | �� | � | � | ��� | �� | � | � | ��� | �� |
| Credit Default Swaps |
� | � | ��� | �� | � | � | ��� | �� | � | � | 110,688 | �� | � | � | 5,179 | �� | � | � | ��� | �� | � | � | ��� | �� | � | � | ��� | �� | � | � | ��� | �� |
| � | � |
� |
� | � | � |
� |
� | � | � |
� |
� | � | � |
� |
� | � | � |
� |
� | � | � |
� |
� | � | � |
� |
� | � | � |
� |
� | |
| Total |
� | $ | 948,680 | �� | � | $ | 21,147 | �� | � | $ | 1,725,638 | �� | � | $ | 32,458 | �� | � | $ | 2,946,033 | �� | � | $ | 44,899 | �� | � | $ | 1,495,964 | �� | � | $ | 14,300 | �� |
| � | � |
� |
� | � | � |
� |
� | � | � |
� |
� | � | � |
� |
� | � | � |
� |
� | � | � |
� |
� | � | � |
� |
� | � | � |
� |
� | |
The table below summarizes the impact to the Condensed Consolidated Statements of Operations from derivative financial instruments:
�
| � | �� | Three�Months�Ended�September�30, | � | � | Nine�Months�Ended�September�30, | � | ||||||||||
| � | �� | ��������2014�������� | � | � | ��������2013�������� | � | � | ��������2014�������� | � | � | ��������2013�������� | � | ||||
| Freestanding Derivatives |
�� | � | � | � | ||||||||||||
| Realized Gains (Losses) |
�� | � | � | � | ||||||||||||
| Interest Rate Contracts |
�� | $ | 2,482 | �� | � | $ | 359 | �� | � | $ | 1,079 | �� | � | $ | (596 | )� |
| Foreign Currency Contracts |
�� | � | 4,327 | �� | � | � | 11,847 | �� | � | � | 1,346 | �� | � | � | 8,084 | �� |
| Credit Default Swaps |
�� | � | 763 | �� | � | � | 92 | �� | � | � | 2,045 | �� | � | � | (81 | )� |
| �� | � |
� |
� | � | � |
� |
� | � | � |
� |
� | � | � |
� |
� | |
| Total |
�� | $ | 7,572 | �� | � | $ | 12,298 | �� | � | $ | 4,470 | �� | � | $ | 7,407 | �� |
| �� | � |
� |
� | � | � |
� |
� | � | � |
� |
� | � | � |
� |
� | |
| Net Change in Unrealized Gains (Losses) |
�� | � | � | � | ||||||||||||
| Interest Rate Contracts |
�� | $ | (111 | )� | � | $ | (2,512 | )� | � | $ | (4,384 | )� | � | $ | (12,005 | )� |
| Foreign Currency Contracts |
�� | � | (5,253 | )� | � | � | (11,553 | )� | � | � | (27,197 | )� | � | � | 1,083 | �� |
| Credit Default Swaps |
�� | � | (1,060 | )� | � | � | 211 | �� | � | � | 3,738 | �� | � | � | (89 | )� |
| �� | � |
� |
� | � | � |
� |
� | � | � |
� |
� | � | � |
� |
� | |
| Total |
�� | $ | (6,424 | )� | � | $ | (13,854 | )� | � | $ | (27,843 | )� | � | $ | (11,011 | )� |
| �� | � |
� |
� | � | � |
� |
� | � | � |
� |
� | � | � |
� |
� | |
As of September�30, 2014 and December�31, 2013, the Partnership had not designated any derivatives as cash flow hedges or hedges of net investments in foreign operations.
�
28
Table of Contents
THE BLACKSTONE GROUP L.P.
Notes to Condensed Consolidated Financial Statements�Continued
(All Dollars Are in Thousands, Except Unit and Per Unit Data, Except Where Noted)
�
| 7. | FAIR VALUE OPTION |
The following table summarizes the financial instruments for which the fair value option has been elected:
�
| � | �� | September�30, 2014 |
� | �� | December�31, 2013 |
� | ||
| Assets |
�� | �� | ||||||
| Loans and Receivables |
�� | $ | 69,794 | �� | �� | $ | 137,788 | �� |
| Equity and Preferred Securities |
�� | � | 83,404 | �� | �� | � | 88,568 | �� |
| Assets of Consolidated CLO Vehicles |
�� | �� | ||||||
| Corporate Loans |
�� | � | 5,870,633 | �� | �� | � | 8,466,889 | �� |
| Corporate Bonds |
�� | � | 196,703 | �� | �� | � | 161,382 | �� |
| Other |
�� | � | 49,456 | �� | �� | � | 41,061 | �� |
| �� | � |
� |
� | �� | � |
� |
� | |
| �� | $ | 6,269,990 | �� | �� | $ | 8,895,688 | �� | |
| �� | � |
� |
� | �� | � |
� |
� | |
| Liabilities |
�� | �� | ||||||
| Liabilities of Consolidated CLO Vehicles |
�� | �� | ||||||
| Senior Secured Notes |
�� | $ | 5,322,648 | �� | �� | $ | 8,302,572 | �� |
| Subordinated Notes |
�� | � | 360,272 | �� | �� | � | 610,435 | �� |
| �� | � |
� |
� | �� | � |
� |
� | |
| �� | $ | 5,682,920 | �� | �� | $ | 8,913,007 | �� | |
| �� | � |
� |
� | �� | � |
� |
� | |
The following table presents the realized and net change in unrealized gains (losses) on financial instruments on which the fair value option was elected:
�
| � | �� | Three Months Ended September�30, | � | |||||||||||||
| � | �� | 2014 | � | � | 2013 | � | ||||||||||
| � | �� | Realized Gains�(Losses) |
� | � | Net Change in�Unrealized Gains�(Losses) |
� | � | Realized Gains�(Losses) |
� | � | Net Change in�Unrealized Gains�(Losses) |
� | ||||
| Assets |
�� | � | � | � | ||||||||||||
| Loans and Receivables |
�� | $ | ��� | �� | � | $ | ��� | �� | � | $ | ��� | �� | � | $ | (897 | )� |
| Equity and Preferred Securities |
�� | � | (468 | )� | � | � | (5,870 | )� | � | � | (622 | )� | � | � | 1,206 | �� |
| Assets of Consolidated CLO Vehicles |
�� | � | � | � | ||||||||||||
| Corporate Loans |
�� | � | 384 | �� | � | � | (41,569 | )� | � | � | (14,533 | )� | � | � | 90,412 | �� |
| Corporate Bonds |
�� | � | 174 | �� | � | � | (4,069 | )� | � | � | 156 | �� | � | � | 1,262 | �� |
| Other |
�� | � | 7,620 | �� | � | � | (1,032 | )� | � | � | 280 | �� | � | � | (4,075 | )� |
| �� | � |
� |
� | � | � |
� |
� | � | � |
� |
� | � | � |
� |
� | |
| �� | $ | 7,710 | �� | � | $ | (52,540 | )� | � | $ | (14,719 | )� | � | $ | 87,908 | �� | |
| �� | � |
� |
� | � | � |
� |
� | � | � |
� |
� | � | � |
� |
� | |
| Liabilities |
�� | � | � | � | ||||||||||||
| Liabilities of Consolidated CLO Vehicles |
�� | � | � | � | ||||||||||||
| Senior Secured Notes |
�� | $ | (1,822 | )� | � | $ | (38,651 | )� | � | $ | (2,833 | )� | � | $ | (127,864 | )� |
| Subordinated Notes |
�� | � | ��� | �� | � | � | 22,731 | �� | � | � | ��� | �� | � | � | 19,158 | �� |
| �� | � |
� |
� | � | � |
� |
� | � | � |
� |
� | � | � |
� |
� | |
| �� | $ | (1,822 | )� | � | $ | (15,920 | )� | � | $ | (2,833 | )� | � | $ | (108,706 | )� | |
| �� | � |
� |
� | � | � |
� |
� | � | � |
� |
� | � | � |
� |
� | |
�
29
Table of Contents
THE BLACKSTONE GROUP L.P.
Notes to Condensed Consolidated Financial Statements�Continued
(All Dollars Are in Thousands, Except Unit and Per Unit Data, Except Where Noted)
�
| � | �� | Nine Months Ended September�30, | � | |||||||||||||
| � | �� | 2014 | � | � | 2013 | � | ||||||||||
| � | �� | Realized Gains�(Losses) |
� | � | Net Change in�Unrealized Gains�(Losses) |
� | � | Realized Gains�(Losses) |
� | � | Net Change in�Unrealized Gains�(Losses) |
� | ||||
| Assets |
�� | � | � | � | ||||||||||||
| Loans and Receivables |
�� | $ | ��� | �� | � | $ | ��� | �� | � | $ | 43 | �� | � | $ | (1,101 | )� |
| Equity and Preferred Securities |
�� | � | (1,791 | )� | � | � | 44 | �� | � | � | (2,020 | )� | � | � | 1,487 | �� |
| Assets of Consolidated CLO Vehicles |
�� | � | � | � | ||||||||||||
| Corporate Loans |
�� | � | (64,251 | )� | � | � | 7,388 | �� | � | � | 28,541 | �� | � | � | 125,284 | �� |
| Corporate Bonds |
�� | � | (2,012 | )� | � | � | (375 | )� | � | � | 3,809 | �� | � | � | (4,596 | )� |
| Other |
�� | � | 20,914 | �� | � | � | 18,523 | �� | � | � | 1,706 | �� | � | � | (2,963 | )� |
| �� | � |
� |
� | � | � |
� |
� | � | � |
� |
� | � | � |
� |
� | |
| �� | $ | (47,140 | )� | � | $ | 25,580 | �� | � | $ | 32,079 | �� | � | $ | 118,111 | �� | |
| �� | � |
� |
� | � | � |
� |
� | � | � |
� |
� | � | � |
� |
� | |
| Liabilities |
�� | � | � | � | ||||||||||||
| Liabilities of Consolidated CLO Vehicles |
�� | � | � | � | ||||||||||||
| Senior Secured Notes |
�� | $ | (5,914 | )� | � | $ | (134,289 | )� | � | $ | (2,833 | )� | � | $ | (419,817 | )� |
| Subordinated Notes |
�� | � | ��� | �� | � | � | 78,345 | �� | � | � | ��� | �� | � | � | 97,167 | �� |
| �� | � |
� |
� | � | � |
� |
� | � | � |
� |
� | � | � |
� |
� | |
| �� | $ | (5,914 | )� | � | $ | (55,944 | )� | � | $ | (2,833 | )� | � | $ | (322,650 | )� | |
| �� | � |
� |
� | � | � |
� |
� | � | � |
� |
� | � | � |
� |
� | |
The following table presents information for those financial instruments for which the fair value option was elected:
�
| � | �� | September�30, 2014 | � | |||||||||||||||||
| � | �� | � | � | � | For Financial Assets Past Due (a) |
� | � | For Financial
Assets with�Non-Accrual�Status |
� | |||||||||||
| � | �� | Excess (Deficiency) of Fair Value Over�Principal |
� | � | Fair Value |
� | �� | Excess (Deficiency) of Fair Value Over�Principal |
� | � | Fair Value |
� | �� | Excess (Deficiency) of Fair Value Over�Principal |
� | |||||
| Loans and Receivables |
�� | $ | (1,102 | )� | � | $ | ��� | �� | �� | $ | ��� | �� | � | $ | ��� | �� | �� | $ | (1,703 | )� |
| Assets of Consolidated CLO Vehicles |
�� | � | �� | � | �� | |||||||||||||||
| Corporate Loans |
�� | � | (166,803 | )� | � | � | 3,004 | �� | �� | � | (21,245 | )� | � | � | ��� | �� | �� | � | ��� | �� |
| Corporate Bonds |
�� | � | (596 | )� | � | � | ��� | �� | �� | � | ��� | �� | � | � | ��� | �� | �� | � | ��� | �� |
| �� | � |
� |
� | � | � |
� |
� | �� | � |
� |
� | � | � |
� |
� | �� | � |
� |
� | |
| �� | $ | (168,501 | )� | � | $ | 3,004 | �� | �� | $ | (21,245 | )� | � | $ | ��� | �� | �� | $ | (1,703 | )� | |
| �� | � |
� |
� | � | � |
� |
� | �� | � |
� |
� | � | � |
� |
� | �� | � |
� |
� | |
�
| � | �� | December�31, 2013 | � | |||||||||||||||||
| � | �� | � | � | � | For Financial Assets Past Due (a) |
� | � | For Financial
Assets with�Non-Accrual�Status |
� | |||||||||||
| � | �� | Excess (Deficiency) of�Fair�Value Over�Principal |
� | � | Fair Value |
� | �� | Excess (Deficiency) of�Fair�Value Over�Principal |
� | � | Fair Value |
� | �� | Excess (Deficiency) of�Fair�Value Over�Principal |
� | |||||
| Loans and Receivables |
�� | $ | (533 | )� | � | $ | ��� | �� | �� | $ | ��� | �� | � | $ | ��� | �� | �� | $ | ��� | �� |
| Assets of Consolidated CLO Vehicles |
�� | � | �� | � | �� | |||||||||||||||
| Corporate Loans |
�� | � | (281,254 | )� | � | � | 57,837 | �� | �� | � | (176,379 | )� | � | � | ��� | �� | �� | � | ��� | �� |
| Corporate Bonds |
�� | � | (1,789 | )� | � | � | ��� | �� | �� | � | ��� | �� | � | � | ��� | �� | �� | � | ��� | �� |
| �� | � |
� |
� | � | � |
� |
� | �� | � |
� |
� | � | � |
� |
� | �� | � |
� |
� | |
| �� | $ | (283,576 | )� | � | $ | 57,837 | �� | �� | $ | (176,379 | )� | � | $ | ��� | �� | �� | $ | ��� | �� | |
| �� | � |
� |
� | � | � |
� |
� | �� | � |
� |
� | � | � |
� |
� | �� | � |
� |
� | |
�
| (a) | Corporate Loans and Corporate Bonds within CLO assets are classified as past due if contractual payments are more than one day past due. |
�
30
Table of Contents
THE BLACKSTONE GROUP L.P.
Notes to Condensed Consolidated Financial Statements�Continued
(All Dollars Are in Thousands, Except Unit and Per Unit Data, Except Where Noted)
�
As of December�31, 2013, no Loans and Receivables for which the fair value option was elected were past due or in non-accrual status. As of September�30, 2014 and December�31, 2013, no Corporate Bonds included within the Assets of Consolidated CLO Vehicles for which the fair value option was elected were past due or in non-accrual status.
�
| 8. | FAIR VALUE MEASUREMENTS OF FINANCIAL INSTRUMENTS |
The following tables summarize the valuation of the Partnership�s financial assets and liabilities by the fair value hierarchy:
�
| � | � | September�30, 2014 | � | |||||||||||||
| � | � | Level I | � | � | Level II | � | � | Level III | � | � | Total | � | ||||
| Assets |
� | � | � | � | ||||||||||||
| Investments of Consolidated Blackstone Funds (a) |
� | � | � | � | ||||||||||||
| Investment Funds |
� | $ | ��� | �� | � | $ | ��� | �� | � | $ | 1,091,151 | �� | � | $ | 1,091,151 | �� |
| Equity Securities |
� | � | 94,774 | �� | � | � | 91,948 | �� | � | � | 179,807 | �� | � | � | 366,529 | �� |
| Partnership and LLC Interests |
� | � | ��� | �� | � | � | 222,488 | �� | � | � | 1,265,940 | �� | � | � | 1,488,428 | �� |
| Debt Instruments |
� | � | 1,614 | �� | � | � | 1,531,371 | �� | � | � | 122,775 | �� | � | � | 1,655,760 | �� |
| Assets of Consolidated CLO Vehicles |
� | � | � | � | ||||||||||||
| Corporate Loans |
� | � | ��� | �� | � | � | 5,332,759 | �� | � | � | 537,874 | �� | � | � | 5,870,633 | �� |
| Corporate Bonds |
� | � | ��� | �� | � | � | 196,703 | �� | � | � | ��� | �� | � | � | 196,703 | �� |
| Freestanding Derivatives � Foreign Currency Contracts |
� | � | ��� | �� | � | � | 11,921 | �� | � | � | ��� | �� | � | � | 11,921 | �� |
| Freestanding Derivatives � Interest Rate Contracts |
� | � | ��� | �� | � | � | 2,772 | �� | � | � | ��� | �� | � | � | 2,772 | �� |
| Other |
� | � | 14 | �� | � | � | 23,356 | �� | � | � | 26,086 | �� | � | � | 49,456 | �� |
| � | � |
� |
� | � | � |
� |
� | � | � |
� |
� | � | � |
� |
� | |
| Total Investments of Consolidated Blackstone Funds |
� | � | 96,402 | �� | � | � | 7,413,318 | �� | � | � | 3,223,633 | �� | � | � | 10,733,353 | �� |
| Blackstone�s Treasury Cash Management Strategies |
� | � | 338,131 | �� | � | � | 1,274,175 | �� | � | � | 81,067 | �� | � | � | 1,693,373 | �� |
| Money Market Funds |
� | � | 256,415 | �� | � | � | ��� | �� | � | � | ��� | �� | � | � | 256,415 | �� |
| Freestanding Derivatives |
� | � | � | � | ||||||||||||
| Interest Rate Contracts |
� | � | 394 | �� | � | � | 860 | �� | � | � | ��� | �� | � | � | 1,254 | �� |
| Foreign Currency Contracts |
� | � | ��� | �� | � | � | 5,200 | �� | � | � | ��� | �� | � | � | 5,200 | �� |
| Loans and Receivables |
� | � | ��� | �� | � | � | ��� | �� | � | � | 69,794 | �� | � | � | 69,794 | �� |
| Other Investments |
� | � | 17,044 | �� | � | � | 7,199 | �� | � | � | 114,134 | �� | � | � | 138,377 | �� |
| � | � |
� |
� | � | � |
� |
� | � | � |
� |
� | � | � |
� |
� | |
| � | $ | 708,386 | �� | � | $ | 8,700,752 | �� | � | $ | 3,488,628 | �� | � | $ | 12,897,766 | �� | |
| � | � |
� |
� | � | � |
� |
� | � | � |
� |
� | � | � |
� |
� | |
| Liabilities |
� | � | � | � | ||||||||||||
| Liabilities of Consolidated Blackstone Funds (a) |
� | � | � | � | ||||||||||||
| Freestanding Derivatives � Credit Default Swaps |
� | $ | ��� | �� | � | $ | 5,179 | �� | � | $ | ��� | �� | � | $ | 5,179 | �� |
| Liabilities of Consolidated CLO Vehicles |
� | � | � | � | ||||||||||||
| Senior Secured Notes |
� | � | ��� | �� | � | � | ��� | �� | � | � | 5,322,648 | �� | � | � | 5,322,648 | �� |
| Subordinated Notes |
� | � | ��� | �� | � | � | ��� | �� | � | � | 360,272 | �� | � | � | 360,272 | �� |
| Freestanding Derivatives � Foreign Currency Contracts |
� | � | ��� | �� | � | � | 22,620 | �� | � | � | ��� | �� | � | � | 22,620 | �� |
| � | � |
� |
� | � | � |
� |
� | � | � |
� |
� | � | � |
� |
� | |
| Total Liabilities of Consolidated Blackstone Funds |
� | � | ��� | �� | � | � | 27,799 | �� | � | � | 5,682,920 | �� | � | � | 5,710,719 | �� |
| Freestanding Derivatives |
� | � | � | � | ||||||||||||
| Interest Rate Contracts |
� | � | 1,184 | �� | � | � | 809 | �� | � | � | ��� | �� | � | � | 1,993 | �� |
| Foreign Currency Contracts |
� | � | ��� | �� | � | � | 831 | �� | � | � | ��� | �� | � | � | 831 | �� |
| Credit Default Swaps |
� | � | ��� | �� | � | � | 1,835 | �� | � | � | ��� | �� | � | � | 1,835 | �� |
| Securities Sold, Not Yet Purchased |
� | � | ��� | �� | � | � | 188,363 | �� | � | � | ��� | �� | � | � | 188,363 | �� |
| � | � |
� |
� | � | � |
� |
� | � | � |
� |
� | � | � |
� |
� | |
| � | $ | 1,184 | �� | � | $ | 219,637 | �� | � | $ | 5,682,920 | �� | � | $ | 5,903,741 | �� | |
| � | � |
� |
� | � | � |
� |
� | � | � |
� |
� | � | � |
� |
� | |
�
31
Table of Contents
THE BLACKSTONE GROUP L.P.
Notes to Condensed Consolidated Financial Statements�Continued
(All Dollars Are in Thousands, Except Unit and Per Unit Data, Except Where Noted)
�
| � | �� | December�31, 2013 | � | |||||||||||||
| � | �� | Level I | � | �� | Level II | � | �� | Level III | � | �� | Total | � | ||||
| Assets |
�� | �� | �� | �� | ||||||||||||
| Investments of Consolidated Blackstone Funds (a) |
�� | �� | �� | �� | ||||||||||||
| Investment Funds |
�� | $ | ��� | �� | �� | $ | ��� | �� | �� | $ | 897,843 | �� | �� | $ | 897,843 | �� |
| Equity Securities |
�� | � | 51,147 | �� | �� | � | 130,816 | �� | �� | � | 193,699 | �� | �� | � | 375,662 | �� |
| Partnership and LLC Interests |
�� | � | ��� | �� | �� | � | 88,555 | �� | �� | � | 1,254,903 | �� | �� | � | 1,343,458 | �� |
| Debt Instruments |
�� | � | ��� | �� | �� | � | 1,154,902 | �� | �� | � | 45,495 | �� | �� | � | 1,200,397 | �� |
| Assets of Consolidated CLO Vehicles |
�� | �� | �� | �� | ||||||||||||
| Corporate Loans |
�� | � | ��� | �� | �� | � | 7,537,661 | �� | �� | � | 929,228 | �� | �� | � | 8,466,889 | �� |
| Corporate Bonds |
�� | � | ��� | �� | �� | � | 161,382 | �� | �� | � | ��� | �� | �� | � | 161,382 | �� |
| Freestanding Derivatives � Foreign Currency Contracts |
�� | � | ��� | �� | �� | � | 30,830 | �� | �� | � | ��� | �� | �� | � | 30,830 | �� |
| Freestanding Derivatives � Interest Rate Contracts |
�� | � | ��� | �� | �� | � | 3,726 | �� | �� | � | ��� | �� | �� | � | 3,726 | �� |
| Other |
�� | � | 3,477 | �� | �� | � | ��� | �� | �� | � | 37,584 | �� | �� | � | 41,061 | �� |
| �� | � |
� |
� | �� | � |
� |
� | �� | � |
� |
� | �� | � |
� |
� | |
| Total Investments of Consolidated Blackstone Funds |
�� | � | 54,624 | �� | �� | � | 9,107,872 | �� | �� | � | 3,358,752 | �� | �� | � | 12,521,248 | �� |
| Blackstone�s Treasury Cash Management Strategies |
�� | � | 19,629 | �� | �� | � | 1,041,039 | �� | �� | � | 44,132 | �� | �� | � | 1,104,800 | �� |
| Money Market Funds |
�� | � | 173,781 | �� | �� | � | ��� | �� | �� | � | ��� | �� | �� | � | 173,781 | �� |
| Freestanding Derivatives |
�� | �� | �� | �� | ||||||||||||
| Interest Rate Contracts |
�� | � | 7,423 | �� | �� | � | 1,098 | �� | �� | � | ��� | �� | �� | � | 8,521 | �� |
| Foreign Currency Contracts |
�� | � | ��� | �� | �� | � | 1,480 | �� | �� | � | ��� | �� | �� | � | 1,480 | �� |
| Total Return Swaps |
�� | � | ��� | �� | �� | � | 342 | �� | �� | � | ��� | �� | �� | � | 342 | �� |
| Loans and Receivables |
�� | � | ��� | �� | �� | � | ��� | �� | �� | � | 137,788 | �� | �� | � | 137,788 | �� |
| Other Investments |
�� | � | 87,068 | �� | �� | � | 17,270 | �� | �� | � | 14,466 | �� | �� | � | 118,804 | �� |
| �� | � |
� |
� | �� | � |
� |
� | �� | � |
� |
� | �� | � |
� |
� | |
| �� | $ | 342,525 | �� | �� | $ | 10,169,101 | �� | �� | $ | 3,555,138 | �� | �� | $ | 14,066,764 | �� | |
| �� | � |
� |
� | �� | � |
� |
� | �� | � |
� |
� | �� | � |
� |
� | |
| Liabilities |
�� | �� | �� | �� | ||||||||||||
| Liabilities of Consolidated CLO Vehicles (a) |
�� | �� | �� | �� | ||||||||||||
| Senior Secured Notes |
�� | $ | ��� | �� | �� | $ | ��� | �� | �� | $ | 8,302,572 | �� | �� | $ | 8,302,572 | �� |
| Subordinated Notes |
�� | � | ��� | �� | �� | � | ��� | �� | �� | � | 610,435 | �� | �� | � | 610,435 | �� |
| Freestanding Derivatives � Foreign Currency Contracts |
�� | � | ��� | �� | �� | � | 10,018 | �� | �� | � | ��� | �� | �� | � | 10,018 | �� |
| Freestanding Derivatives |
�� | �� | �� | �� | ||||||||||||
| Interest Rate Contracts |
�� | � | 2,484 | �� | �� | � | 192 | �� | �� | � | ��� | �� | �� | � | 2,676 | �� |
| Foreign Currency Contracts |
�� | � | ��� | �� | �� | � | 1,015 | �� | �� | � | ��� | �� | �� | � | 1,015 | �� |
| Credit Default Swaps |
�� | � | ��� | �� | �� | � | 591 | �� | �� | � | ��� | �� | �� | � | 591 | �� |
| Securities Sold, Not Yet Purchased |
�� | � | ��� | �� | �� | � | 76,195 | �� | �� | � | ��� | �� | �� | � | 76,195 | �� |
| �� | � |
� |
� | �� | � |
� |
� | �� | � |
� |
� | �� | � |
� |
� | |
| �� | $ | 2,484 | �� | �� | $ | 88,011 | �� | �� | $ | 8,913,007 | �� | �� | $ | 9,003,502 | �� | |
| �� | � |
� |
� | �� | � |
� |
� | �� | � |
� |
� | �� | � |
� |
� | |
�
| (a) | Pursuant to GAAP consolidation guidance, the Partnership is required to consolidate all VIEs in which it has been identified as the primary beneficiary, including certain CLO vehicles, and other funds in which a consolidated entity of the Partnership, as the general partner of the fund, is presumed to have control. While the Partnership is required to consolidate certain funds, including CLO vehicles, for GAAP purposes, the Partnership has no ability to utilize the assets of these funds and there is no recourse to the Partnership for their liabilities since these are client assets and liabilities. |
�
32
Table of Contents
THE BLACKSTONE GROUP L.P.
Notes to Condensed Consolidated Financial Statements�Continued
(All Dollars Are in Thousands, Except Unit and Per Unit Data, Except Where Noted)
�
The following table summarizes the fair value transfers between Level I and Level II for positions that existed as of September�30, 2014 and 2013, respectively:
�
| � | �� | Three�Months�Ended�September�30, | � | �� | Nine�Months�Ended�September�30, | � | ||||||||||
| � | �� | ��������2014�������� | � | �� | ��������2013�������� | � | �� | ��������2014�������� | � | �� | ��������2013�������� | � | ||||
| Transfers from Level I into Level II (a) |
�� | $ | ��� | �� | �� | $ | ��� | �� | �� | $ | ��� | �� | �� | $ | 31 | �� |
| Transfers from Level II into Level I (b) |
�� | $ | ��� | �� | �� | $ | 41,155 | �� | �� | $ | 67,327 | �� | �� | $ | 1,308 | �� |
�
| (a) | Transfers out of Level I represent those financial instruments for which restrictions exist and adjustments were made to an otherwise observable price to reflect fair value at the reporting date. |
| (b) | Transfers into Level I represent those financial instruments for which an unadjusted quoted price in an active market became available for the identical asset. |
�
33
Table of Contents
THE BLACKSTONE GROUP L.P.
Notes to Condensed Consolidated Financial Statements�Continued
(All Dollars Are in Thousands, Except Unit and Per Unit Data, Except Where Noted)
�
The following table summarizes the quantitative inputs and assumptions used for items categorized in Level III of the fair value hierarchy as of September�30, 2014:
�
| � | � | Fair Value | � | � | Valuation Techniques |
� | Unobservable Inputs |
� | Ranges | � | Weighted- Average�(a) | |
| Financial Assets |
� | � | � | � | � | |||||||
| Investments of Consolidated Blackstone Funds |
� | � | � | � | � | |||||||
| Investment Funds |
� | $ | 1,091,151 | �� | � | NAV as Fair Value | � | N/A | � | N/A | � | N/A |
| Equity Securities |
� | � | 89,259 | �� | � | Discounted Cash Flows | � | Discount Rate | � | 7.1%�-�25.2% | � | 12.2% |
| � | � | � | Revenue CAGR | � | 1.9%�-�27.6% | � | 6.6% | |||||
| � | � | � | Exit Multiple�-�EBITDA | � | 5.0x�-�17.0x | � | 8.0x | |||||
| � | � | � | Exit Multiple�-�P/E | � | 9.5x�-�15.0x | � | 10.7x | |||||
| � | � | 85,955 | �� | � | Transaction Price | � | N/A | � | N/A | � | N/A | |
| � | � | 162 | �� | � | Market�Comparable�Companies | � | EBITDA Multiple | � | 6.5x�-�7.3x | � | 6.7x | |
| � | � | 48 | �� | � | Third Party Pricing | � | N/A | � | N/A | � | N/A | |
| � | � | 4,383 | �� | � | Other | � | N/A | � | N/A | � | N/A | |
| Partnership and LLC Interests |
� | � | 504,092 | �� | � | Discounted Cash Flows | � | Discount Rate | � | 5.0%�-�21.5% | � | 9.0% |
| � | � | � | Revenue CAGR | � | -18.8%�-�22.4% | � | 6.1% | |||||
| � | � | � | Exit Multiple�-�EBITDA | � | 0.0x�-�23.3x | � | 10.3x | |||||
| � | � | � | Exit Capitalization Rate | � | 4.0%�-�13.5% | � | 7.4% | |||||
| � | � | 740,513 | �� | � | Transaction Price | � | N/A | � | N/A | � | N/A | |
| � | � | 12,967 | �� | � | Third Party Pricing | � | N/A | � | N/A | � | N/A | |
| � | � | 8,368 | �� | � | Other | � | N/A | � | N/A | � | N/A | |
| Debt Instruments |
� | � | 18,627 | �� | � | Discounted Cash Flows | � | Discount Rate | � | 9.0%�-�23.0% | � | 17.6% |
| � | � | � | Revenue CAGR | � | 5.3%�-�6.5% | � | 5.3% | |||||
| � | � | � | Exit�Multiple�-�EBITDA | � | 5.7x�-�10.4x | � | 10.2x | |||||
| � | � | � | Exit Capitalization Rate | � | 1.0%�-�7.5% | � | 6.6% | |||||
| � | � | � | Default Rate | � | 2.0% | � | N/A | |||||
| � | � | � | Recovery Rate | � | 70.0% | � | N/A | |||||
| � | � | � | Recovery Lag | � | 12 months | � | N/A | |||||
| � | � | � | Pre-payment Rate | � | 20.0% | � | N/A | |||||
| � | � | � | Reinvestment Rate | � | LIBOR�+�400�bps | � | N/A | |||||
| � | � | 103,959 | �� | � | Third Party Pricing | � | N/A | � | N/A | � | N/A | |
| � | � | 189 | �� | � | Market Comparable Companies | � | EBITDA Multiple | � | 6.3x�-�7.8x | � | 6.3x | |
| Assets of Consolidated CLO Vehicles |
� | � | 275,167 | �� | � | Third Party Pricing | � | N/A | � | N/A | � | N/A |
| � | � | 284,848 | �� | � | Market Comparable Companies | � | EBITDA Multiple | � | 3.5x�-�15.0x | � | 6.9x | |
| � | � | 3,945 | �� | � | Discounted Cash Flows | � | Discount Rate | � | 8.5% | � | N/A | |
| � | � |
� |
� | � | � | � | � | |||||
| Total Investments of Consolidated Blackstone Funds |
� | � | 3,223,633 | �� | � | � | ||||||
�
continued �
�
34
Table of Contents
THE BLACKSTONE GROUP L.P.
Notes to Condensed Consolidated Financial Statements�Continued
(All Dollars Are in Thousands, Except Unit and Per Unit Data, Except Where Noted)
�
| � | � | Fair Value | � | � | Valuation Techniques |
� | Unobservable Inputs |
� | Ranges | � | Weighted- Average�(a) | |
| Blackstone�s Treasury Cash Management Strategies |
� | � | � | � | � | |||||||
| � | $ | 26,031 | �� | � | Discounted�Cash�Flows������������� | � | Default Rate | � | 2.0% | � | N/A | |
| � | � | � | Recovery Rate | � | 70.0% | � | N/A | |||||
| � | � | � | Recovery Lag | � | 12 months | � | N/A | |||||
| � | � | � | Pre-payment Rate | � | 20.0% | � | N/A | |||||
| � | � | � | Reinvestment Rate | � | LIBOR�+�400 bps | � | N/A | |||||
| � | � | � | Discount Rate | � | 5.9%�-�9.3% | � | 6.8% | |||||
| � | � | 44,087 | �� | � | Third Party Pricing | � | N/A | � | N/A | � | N/A | |
| � | � | 981 | �� | � | Transaction Price | � | N/A | � | N/A | � | N/A | |
| � | � | 9,968 | �� | � | NAV as Fair Value | � | N/A | � | N/A | � | N/A | |
| Loans and Receivables |
� | � | 69,794 | �� | � | Discounted Cash Flows | � | Discount Rate | � | 8.8%�-�12.9% | � | 10.8% |
| Other Investments |
� | � | 12,986 | �� | � | Transaction Price | � | N/A | � | N/A | � | N/A |
| � | � | 98,293 | �� | � | Discounted Cash Flows | � | Discount Rate | � | 1.4%�-�12.5% | � | 3.0% | |
| � | � | � | Default Rate | � | 2.0% | � | N/A | |||||
| � | � | � | Recovery Rate | � | 70.0% | � | N/A | |||||
| � | � | � | Recovery Lag | � | 12 months | � | N/A | |||||
| � | � | � | Pre-payment Rate | � | 20.0% | � | N/A | |||||
| � | � | � | Reinvestment�Rate��������� | � | LIBOR�+�400�bps�� | � | N/A | |||||
| � | � | 2,855 | �� | � | NAV as Fair Value | � | N/A | � | N/A | � | N/A | |
| � | � |
� |
� | � | � | � | � | |||||
| Total |
� | $ | 3,488,628 | �� | � | � | � | � | ||||
| � | � |
� |
� | � | � | � | � | |||||
| Financial Liabilities |
� | � | � | � | � | |||||||
| Liabilities of Consolidated CLO Vehicles |
� | $ | 5,682,920 | �� | � | Discounted Cash Flows | � | Default Rate | � | 2.0%�-�3.0% | � | 2.1% |
| � | � |
� |
� | � | � | � | � | |||||
| � | � | � | Recovery Rate | � | 70.0% | � | N/A | |||||
| � | � | � | Recovery Lag | � | 12 months | � | N/A | |||||
| � | � | � | Pre-payment Rate | � | 20.0% | � | N/A | |||||
| � | � | � | Discount Rate | � | 0.8%�-�26.7% | � | 2.5% | |||||
| � | � | � | Reinvestment Rate | � | LIBOR + 400 bps | � | N/A | |||||
�
35
Table of Contents
THE BLACKSTONE GROUP L.P.
Notes to Condensed Consolidated Financial Statements�Continued
(All Dollars Are in Thousands, Except Unit and Per Unit Data, Except Where Noted)
�
The following table summarizes the quantitative inputs and assumptions used for items categorized in Level III of the fair value hierarchy as of December�31, 2013:
�
| � | � | Fair Value | � | � | Valuation Techniques |
� | Unobservable Inputs |
� | Ranges | � | Weighted- Average�(a) | |
| Financial Assets |
� | � | � | � | � | |||||||
| Investments of Consolidated Blackstone Funds |
� | � | � | � | � | |||||||
| Investment Funds |
� | $ | 897,843 | �� | � | NAV as Fair Value | � | N/A | � | N/A | � | N/A |
| Equity Securities |
� | � | 112,117 | �� | � | Discounted Cash Flows | � | Discount Rate | � | 9.2% - 26.3% | � | 12.4% |
| � | � | � | Revenue CAGR | � | 0.9% - 46.2% | � | 6.8% | |||||
| � | � | � | Exit Multiple - EBITDA |
� | 5.0x - 14.0x | � | 8.9x | |||||
| � | � | � | Exit Multiple�-�P/E | � | 8.5x - 17.0x | � | 9.8x | |||||
| � | � | 78,154 | �� | � | Transaction Price | � | N/A | � | N/A | � | N/A | |
| � | � | 275 | �� | � | Market�Comparable�Companies | � | EBITDA Multiple | � | 6.3x - 7.5x | � | 6.9x | |
| � | � | 50 | �� | � | Third Party Pricing | � | N/A | � | N/A | � | N/A | |
| � | � | 3,103 | �� | � | Other | � | N/A | � | N/A | � | N/A | |
| Partnership and LLC Interests |
� | � | 557,534 | �� | � | Discounted Cash Flows | � | Discount Rate | � | 5.0% - 22.5% | � | 9.0% |
| � | � | � | Revenue CAGR | � | -0.7% - 17.7% | � | 5.5% | |||||
| � | � | � | Exit Multiple - EBITDA |
� | 3.0x - 23.3x | � | 9.4x | |||||
| � | � | � | Exit Capitalization Rate |
� | 4.3% - 10.5% | � | 7.0% | |||||
| � | � | 687,246 | �� | � | Transaction Price | � | N/A | � | N/A | � | N/A | |
| � | � | 9,181 | �� | � | Third Party Pricing | � | N/A | � | N/A | � | N/A | |
| � | � | 942 | �� | � | Other | � | N/A | � | N/A | � | N/A | |
| Debt Instruments |
� | � | 11,814 | �� | � | Discounted Cash Flows | � | Discount Rate | � | 10.7% - 21.0% | � | 19.2% |
| � | � | � | Revenue CAGR | � | 4.8% - 5.5% | � | 4.8% | |||||
| � | � | � | Exit�Multiple�- EBITDA |
� | 5.8x - 11.1x | � | 10.8x | |||||
| � | � | � | Exit�Capitalization Rate |
� | 6.4% - 7.5% | � | 6.7% | |||||
| � | � | � | Default Rate | � | 2.0% | � | N/A | |||||
| � | � | � | Recovery Rate | � | 67.0% | � | N/A | |||||
| � | � | � | Recovery Lag | � | 12 months | � | N/A | |||||
| � | � | � | Pre-payment Rate | � | 20.0% | � | N/A | |||||
| � | � | � | Reinvestment Rate | � | LIBOR�+�400�bps | � | N/A | |||||
| � | � | 31,675 | �� | � | Third Party Pricing | � | N/A | � | N/A | � | N/A | |
| � | � | 1,772 | �� | � | Transaction Price | � | N/A | � | N/A | � | N/A | |
| � | � | 234 | �� | � | Market Comparable Companies | � | EBITDA Multiple | � | 6.2x - 8.0x | � | 6.2x | |
| Assets of Consolidated CLO Vehicles |
� | � | 615,414 | �� | � | Third Party Pricing | � | N/A | � | N/A | � | N/A |
| � | � | 293,382 | �� | � | Market�Comparable�Companies | � | EBITDA Multiple | � | 3.5x - 11.3x | � | 7.3x | |
| � | � | 57,936 | �� | � | Discounted Cash Flows | � | Discount Rate | � | 7.0% - 14.0% | � | 7.8% | |
| � | � | � | Revenue CAGR | � | 4.2% | � | N/A | |||||
| � | � | � | Exit Multiple - EBITDA |
� | 8.0x | � | N/A | |||||
| � | � | 80 | �� | � | Transaction Price | � | N/A | � | N/A | � | N/A | |
| � | � |
� |
� | � | � | � | � | |||||
| Total Investments of Consolidated Blackstone Funds |
� | � | 3,358,752 | �� | � | � | � | � | ||||
�
continued �
�
36
Table of Contents
THE BLACKSTONE GROUP L.P.
Notes to Condensed Consolidated Financial Statements�Continued
(All Dollars Are in Thousands, Except Unit and Per Unit Data, Except Where Noted)
�
| � | � | Fair Value | � | � | Valuation Techniques |
� | Unobservable Inputs |
� | Ranges | � | Weighted- Average�(a) | |
| Blackstone�s Treasury Cash Management Strategies |
� | $ | 17,040 | �� | � | Discounted�Cash�Flows������������� | � | Default Rate | � | 2.0% | � | N/A |
| � | � | � | Recovery Rate | � | 30.0%�-�70.0% | � | 66.0% | |||||
| � | � | � | Recovery Lag | � | 12 months | � | N/A | |||||
| � | � | � | Pre-payment Rate | � | 20.0% | � | N/A | |||||
| � | � | � | Reinvestment�Rate | � | LIBOR�+�400�bps | � | N/A | |||||
| � | � | � | Discount Rate | � | 6.0% - 8.6% | � | 6.6% | |||||
| � | � | 16,993 | �� | � | Third Party Pricing | � | N/A | � | N/A | � | N/A | |
| � | � | 10,099 | �� | � | NAV as Fair Value | � | N/A | � | N/A | � | N/A | |
| Loans and Receivables |
� | � | 137,788 | �� | � | Discounted Cash Flows | � | Discount Rate | � | 11.0% - 14.8% | � | 12.6% |
| Other Investments |
� | � | 7,927 | �� | � | Transaction Price | � | N/A | � | N/A | � | N/A |
| � | � | 3,725 | �� | � | NAV as Fair Value | � | N/A | � | N/A | � | N/A | |
| � | � | 2,814 | �� | � | Discounted Cash Flows | � | Discount Rate | � | 12.5% | � | N/A | |
| � | � |
� |
� | � | � | � | � | |||||
| Total |
� | $ | 3,555,138 | �� | � | � | � | � | ||||
| � | � |
� |
� | � | � | � | � | |||||
| Financial Liabilities |
� | � | � | � | � | |||||||
| Liabilities of Consolidated CLO Vehicles |
� | $ | 8,913,007 | �� | � | Discounted Cash Flows | � | Default Rate | � | 2.0% - 3.0% | � | 2.1% |
| � | � |
� |
� | � | � | � | � | |||||
| � | � | � | Recovery Rate | � | 30.0% - 70.0% | � | 66.0% | |||||
| � | � | � | Recovery Lag | � | 12 months | � | N/A | |||||
| � | � | � | Pre-payment Rate | � | 5.0% - 20.0% | � | 18.0% | |||||
| � | � | � | Discount Rate | � | 0.4% - 24.2% | � | 2.6% | |||||
| � | � | � | Reinvestment Rate | � | LIBOR + 400 bps | � | N/A | |||||
�
| N/A | Not applicable. |
| CAGR | Compound annual growth rate. |
| EBITDA | Earnings before interest, taxes, depreciation and amortization. |
| Exit�Multiple | Ranges include the last twelve months EBITDA, forward EBITDA and price/earnings (�P/E�) exit multiples. |
| (a) | Unobservable inputs were weighted based on the fair value of the investments included in the range. |
The significant unobservable inputs used in the fair value measurement of the Blackstone�s Treasury Cash Management Strategies, debt instruments, other investments and liabilities of consolidated CLO vehicles are discount rates, default rates, recovery rates, recovery lag, pre-payment rates and reinvestment rates. Increases (decreases) in any of the discount rates, default rates, recovery lag and pre-payment rates in isolation would result in a lower (higher) fair value measurement. Increases (decreases) in any of the recovery rates and reinvestment rates in isolation would result in a higher (lower) fair value measurement. Generally, a change in the assumption used for default rates may be accompanied by a directionally similar change in the assumption used for recovery lag and a directionally opposite change in the assumption used for recovery rates and pre-payment rates.
The significant unobservable inputs used in the fair value measurement of equity securities, partnership and LLC interests, debt instruments, assets of consolidated CLO vehicles and loans and receivables are discount rates, exit capitalization rates, exit multiples, EBITDA multiples and revenue compound annual growth rates. Increases (decreases) in any of discount rates and exit capitalization rates in isolation can result in a lower (higher) fair value measurement. Increases (decreases) in any of exit multiples and revenue compound annual growth rates in isolation can result in a higher (lower) fair value measurement.
Since December�31, 2013, there have been no changes in valuation techniques within Level�II and Level�III that have had a material impact on the valuation of financial instruments.
�
37
Table of Contents
THE BLACKSTONE GROUP L.P.
Notes to Condensed Consolidated Financial Statements�Continued
(All Dollars Are in Thousands, Except Unit and Per Unit Data, Except Where Noted)
�
The following tables summarize the changes in financial assets and liabilities measured at fair value for which the Partnership has used Level III inputs to determine fair value and does not include gains or losses that were reported in Level III in prior years or for instruments that were transferred out of Level III prior to the end of the respective reporting period. Total realized and unrealized gains and losses recorded for Level III investments are reported in Investment Income and Net Gains from Fund Investment Activities in the Condensed Consolidated Statements of Operations.
�
| � | � | Level III Financial Assets at Fair Value Three Months Ended September�30, |
� | |||||||||||||||||||||||||||||
| � | � | 2014 | � | � | 2013 | � | ||||||||||||||||||||||||||
| � | � | Investments of Consolidated Funds |
� | � | Loans and Receivables |
� | � | Other Investments�(c) |
� | � | Total | � | � | Investments of Consolidated Funds |
� | � | Loans and Receivables |
� | � | Other Investments�(c) |
� | � | Total | � | ||||||||
| Balance, Beginning of Period |
� | $ | 3,245,040 | �� | � | $ | 42,725 | �� | � | $ | 180,657 | �� | � | $ | 3,468,422 | �� | � | $ | 2,890,319 | �� | � | $ | 107,731 | �� | � | $ | 47,914 | �� | � | $ | 3,045,964 | �� |
| Transfer Out Due to Deconsolidation |
� | � | (64,634 | )� | � | � | ��� | �� | � | � | ��� | �� | � | � | (64,634 | )� | � | � | (96 | )� | � | � | ��� | �� | � | � | ��� | �� | � | � | (96 | )� |
| Transfer In to Level III (b) |
� | � | 161,332 | �� | � | � | ��� | �� | � | � | 20,452 | �� | � | � | 181,784 | �� | � | � | 226,144 | �� | � | � | ��� | �� | � | � | 8,868 | �� | � | � | 235,012 | �� |
| Transfer Out of Level III (b) |
� | � | (212,108 | )� | � | � | ��� | �� | � | � | (9,913 | )� | � | � | (222,021 | )� | � | � | (270,059 | )� | � | � | ��� | �� | � | � | (3,180 | )� | � | � | (273,239 | )� |
| Purchases |
� | � | 303,044 | �� | � | � | 69,255 | �� | � | � | 19,914 | �� | � | � | 392,213 | �� | � | � | 349,209 | �� | � | � | 127,370 | �� | � | � | 23,225 | �� | � | � | 499,804 | �� |
| Sales |
� | � | (201,346 | )� | � | � | (42,261 | )� | � | � | (7,102 | )� | � | � | (250,709 | )� | � | � | (154,446 | )� | � | � | (138,937 | )� | � | � | (15,038 | )� | � | � | (308,421 | )� |
| Settlements |
� | � | ��� | �� | � | � | (526 | )� | � | � | (123 | )� | � | � | (649 | )� | � | � | ��� | �� | � | � | 2,293 | �� | � | � | (253 | )� | � | � | 2,040 | �� |
| Realized Gains (Losses), Net |
� | � | 21,344 | �� | � | � | ��� | �� | � | � | 5 | �� | � | � | 21,349 | �� | � | � | 13,861 | �� | � | � | ��� | �� | � | � | (157 | )� | � | � | 13,704 | �� |
| Changes in Unrealized Gains (Losses) Included in Earnings Related to Investments Still Held at the Reporting Date |
� | � | (29,039 | )� | � | � | 601 | �� | � | � | (8,689 | )� | � | � | (37,127 | )� | � | � | 67,127 | �� | � | � | (380 | )� | � | � | (56 | )� | � | � | 66,691 | �� |
| � | � |
� |
� | � | � |
� |
� | � | � |
� |
� | � | � |
� |
� | � | � |
� |
� | � | � |
� |
� | � | � |
� |
� | � | � |
� |
� | |
| Balance, End of Period |
� | $ | 3,223,633 | �� | � | $ | 69,794 | �� | � | $ | 195,201 | �� | � | $ | 3,488,628 | �� | � | $ | 3,122,059 | �� | � | $ | 98,077 | �� | � | $ | 61,323 | �� | � | $ | 3,281,459 | �� |
| � | � |
� |
� | � | � |
� |
� | � | � |
� |
� | � | � |
� |
� | � | � |
� |
� | � | � |
� |
� | � | � |
� |
� | � | � |
� |
� | |
�
38
Table of Contents
THE BLACKSTONE GROUP L.P.
Notes to Condensed Consolidated Financial Statements�Continued
(All Dollars Are in Thousands, Except Unit and Per Unit Data, Except Where Noted)
�
| � | � | Level III Financial Assets at Fair
Value Nine Months Ended September�30, |
� | |||||||||||||||||||||||||||||
| � | � | 2014 | � | � | 2013 | � | ||||||||||||||||||||||||||
| � | � | Investments of Consolidated Funds |
� | � | Loans and Receivables |
� | � | Other Investments�(c) |
� | � | Total | � | � | Investments of Consolidated Funds |
� | � | Loans and Receivables |
� | � | Other Investments�(c) |
� | � | Total | � | ||||||||
| Balance, Beginning of Period |
� | $ | 3,358,752 | �� | � | $ | 137,788 | �� | � | $ | 58,598 | �� | � | $ | 3,555,138 | �� | � | $ | 3,017,699 | �� | � | $ | 30,663 | �� | � | $ | 28,104 | �� | � | $ | 3,076,466 | �� |
| Transfer In Due to Consolidation and Acquisition (a) |
� | � | 276,806 | �� | � | � | ��� | �� | � | � | ��� | �� | � | � | 276,806 | �� | � | � | ��� | �� | � | � | ��� | �� | � | � | 11,960 | �� | � | � | 11,960 | �� |
| Transfer Out Due to Deconsolidation |
� | � | (335,357 | )� | � | � | ��� | �� | � | � | ��� | �� | � | � | (335,357 | )� | � | � | (152,823 | )� | � | � | ��� | �� | � | � | ��� | �� | � | � | (152,823 | )� |
| Transfer In to Level III (b) |
� | � | 273,934 | �� | � | � | ��� | �� | � | � | 28,424 | �� | � | � | 302,358 | �� | � | � | 684,621 | �� | � | � | ��� | �� | � | � | 8,868 | �� | � | � | 693,489 | �� |
| Transfer Out of Level III (b) |
� | � | (315,067 | )� | � | � | ��� | �� | � | � | (20,657 | )� | � | � | (335,724 | )� | � | � | (377,527 | )� | � | � | ��� | �� | � | � | (4,894 | )� | � | � | (382,421 | )� |
| Purchases |
� | � | 561,043 | �� | � | � | 162,899 | �� | � | � | 153,344 | �� | � | � | 877,286 | �� | � | � | 673,179 | �� | � | � | 233,890 | �� | � | � | 129,259 | �� | � | � | 1,036,328 | �� |
| Sales |
� | � | (700,970 | )� | � | � | (230,324 | )� | � | � | (15,340 | )� | � | � | (946,634 | )� | � | � | (959,115 | )� | � | � | (168,399 | )� | � | � | (110,767 | )� | � | � | (1,238,281 | )� |
| Settlements |
� | � | ��� | �� | � | � | (1,170 | )� | � | � | (424 | )� | � | � | (1,594 | )� | � | � | ��� | �� | � | � | 2,312 | �� | � | � | (1,822 | )� | � | � | 490 | �� |
| Realized Gains (Losses), Net |
� | � | 10,344 | �� | � | � | ��� | �� | � | � | (544 | )� | � | � | 9,800 | �� | � | � | (4,913 | )� | � | � | 43 | �� | � | � | 14,472 | �� | � | � | 9,602 | �� |
| Changes in Unrealized Gains (Losses) Included in Earnings Related to Investments Still Held at the Reporting Date |
� | � | 94,148 | �� | � | � | 601 | �� | � | � | (8,200 | )� | � | � | 86,549 | �� | � | � | 240,938 | �� | � | � | (432 | )� | � | � | (13,857 | )� | � | � | 226,649 | �� |
| � | � |
� |
� | � | � |
� |
� | � | � |
� |
� | � | � |
� |
� | � | � |
� |
� | � | � |
� |
� | � | � |
� |
� | � | � |
� |
� | |
| Balance, End of Period |
� | $ | 3,223,633 | �� | � | $ | 69,794 | �� | � | $ | 195,201 | �� | � | $ | 3,488,628 | �� | � | $ | 3,122,059 | �� | � | $ | 98,077 | �� | � | $ | 61,323 | �� | � | $ | 3,281,459 | �� |
| � | � |
� |
� | � | � |
� |
� | � | � |
� |
� | � | � |
� |
� | � | � |
� |
� | � | � |
� |
� | � | � |
� |
� | � | � |
� |
� | |
�
| � | �� | Level III Financial Liabilities at Fair Value Three Months Ended September�30, |
� | |||||||||||||||||||||
| � | �� | 2014 | � | � | 2013 | � | ||||||||||||||||||
| � | �� | Collateralized Loan Obligations Senior Notes |
� | � | Collateralized Loan Obligations Subordinated Notes |
� | � | Total | � | � | Collateralized Loan Obligations Senior Notes |
� | � | Collateralized Loan Obligations Subordinated Notes |
� | � | Total | � | ||||||
| Balance, Beginning of Period |
�� | $ | 6,407,838 | �� | � | $ | 474,757 | �� | � | $ | 6,882,595 | �� | � | $ | 9,189,948 | �� | � | $ | 618,682 | �� | � | $ | 9,808,630 | �� |
| Transfer In Due to Consolidation and Acquisition (a) |
�� | � | 495,610 | �� | � | � | 29,828 | �� | � | � | 525,438 | �� | � | � | ��� | �� | � | � | ��� | �� | � | � | ��� | �� |
| Transfer Out to Deconsolidation |
�� | � | (778,461 | )� | � | � | (104,049 | )� | � | � | (882,510 | )� | � | � | ��� | �� | � | � | ��� | �� | � | � | ��� | �� |
| Issuances |
�� | � | ��� | �� | � | � | ��� | �� | � | � | ��� | �� | � | � | 1,503 | �� | � | � | 922 | �� | � | � | 2,425 | �� |
| Settlements |
�� | � | (570,785 | )� | � | � | ��� | �� | � | � | (570,785 | )� | � | � | (787,918 | )� | � | � | (180 | )� | � | � | (788,098 | )� |
| Realized Losses, Net |
�� | � | 1,822 | �� | � | � | ��� | �� | � | � | 1,822 | �� | � | � | 2,833 | �� | � | � | ��� | �� | � | � | 2,833 | �� |
| Changes in Unrealized (Gains) Losses Included in Earnings Related to Liabilities Still Held at the Reporting Date |
�� | � | (233,376 | )� | � | � | (40,264 | )� | � | � | (273,640 | )� | � | � | 235,141 | �� | � | � | (14,044 | )� | � | � | 221,097 | �� |
| �� | � |
� |
� | � | � |
� |
� | � | � |
� |
� | � | � |
� |
� | � | � |
� |
� | � | � |
� |
� | |
| Balance, End of Period |
�� | $ | 5,322,648 | �� | � | $ | 360,272 | �� | � | $ | 5,682,920 | �� | � | $ | 8,641,507 | �� | � | $ | 605,380 | �� | � | $ | 9,246,887 | �� |
| �� | � |
� |
� | � | � |
� |
� | � | � |
� |
� | � | � |
� |
� | � | � |
� |
� | � | � |
� |
� | |
�
39
Table of Contents
THE BLACKSTONE GROUP L.P.
Notes to Condensed Consolidated Financial Statements�Continued
(All Dollars Are in Thousands, Except Unit and Per Unit Data, Except Where Noted)
�
| � | � | Level III Financial Liabilities at Fair Value Nine Months Ended September�30, |
� | |||||||||||||||||||||
| � | � | 2014 | � | � | 2013 | � | ||||||||||||||||||
| � | � | Collateralized Loan Obligations Senior Notes |
� | � | Collateralized Loan Obligations Subordinated Notes |
� | � | Total | � | � | Collateralized Loan Obligations Senior Notes |
� | � | Collateralized Loan Obligations Subordinated Notes |
� | � | Total | � | ||||||
| Balance, Beginning of Period |
� | $ | 8,302,572 | �� | � | $ | 610,435 | �� | � | $ | 8,913,007 | �� | � | $ | 10,695,136 | �� | � | $ | 846,471 | �� | � | $ | 11,541,607 | �� |
| Transfer In Due to Consolidation |
� | � | 967,629 | �� | � | � | 116,009 | �� | � | � | 1,083,638 | �� | � | � | ��� | �� | � | � | ��� | �� | � | � | ��� | �� |
| Transfer Out Due to Deconsolidation |
� | � | (2,231,853 | )� | � | � | (277,301 | )� | � | � | (2,509,154 | )� | � | � | (1,100,842 | )� | � | � | (150,925 | )� | � | � | (1,251,767 | )� |
| Issuances |
� | � | 32,197 | �� | � | � | 10,000 | �� | � | � | 42,197 | �� | � | � | 2,558 | �� | � | � | 1,697 | �� | � | � | 4,255 | �� |
| Settlements |
� | � | (1,569,416 | )� | � | � | (110 | )� | � | � | (1,569,526 | )� | � | � | (1,492,295 | )� | � | � | (526 | )� | � | � | (1,492,821 | )� |
| Realized Losses, Net |
� | � | 5,914 | �� | � | � | ��� | �� | � | � | 5,914 | �� | � | � | 2,833 | �� | � | � | ��� | �� | � | � | 2,833 | �� |
| Changes in Unrealized (Gains) Losses Included in Earnings Related to Liabilities Still Held at the Reporting Date |
� | � | (184,395 | )� | � | � | (98,761 | )� | � | � | (283,156 | )� | � | � | 534,117 | �� | � | � | (91,337 | )� | � | � | 442,780 | �� |
| � | � |
� |
� | � | � |
� |
� | � | � |
� |
� | � | � |
� |
� | � | � |
� |
� | � | � |
� |
� | |
| Balance, End of Period |
� | $ | 5,322,648 | �� | � | $ | 360,272 | �� | � | $ | 5,682,920 | �� | � | $ | 8,641,507 | �� | � | $ | 605,380 | �� | � | $ | 9,246,887 | �� |
| � | � |
� |
� | � | � |
� |
� | � | � |
� |
� | � | � |
� |
� | � | � |
� |
� | � | � |
� |
� | |
�
| (a) | Represents the transfer into Level III of financial assets and liabilities as a result of the consolidation of certain fund entities. |
| (b) | Transfers in and out of Level III financial assets and liabilities were due to changes in the observability of inputs used in the valuation of such assets and liabilities. |
| (c) | Represents Blackstone�s Treasury Cash Management Strategies and Other Investments. |
�
| 9. | VARIABLE INTEREST ENTITIES |
Pursuant to GAAP consolidation guidance, the Partnership consolidates certain VIEs in which it is determined that the Partnership is the primary beneficiary either directly or indirectly, through a consolidated entity or affiliate. VIEs include certain private equity, real estate, credit-focused or funds of hedge funds entities and CLO vehicles. The purpose of such VIEs is to provide strategy specific investment opportunities for investors in exchange for management and performance based fees. The investment strategies of the Blackstone Funds differ by product; however, the fundamental risks of the Blackstone Funds have similar characteristics, including loss of invested capital and loss of management fees and performance based fees. In Blackstone�s role as general partner, collateral manager or investment adviser, it generally considers itself the sponsor of the applicable Blackstone Fund. The Partnership does not provide performance guarantees and has no other financial obligation to provide funding to consolidated VIEs other than its own capital commitments.
The assets of consolidated variable interest entities may only be used to settle obligations of these consolidated Blackstone Funds. In addition, there is no recourse to the Partnership for the consolidated VIEs� liabilities including the liabilities of the consolidated CLO vehicles.
�
40
Table of Contents
THE BLACKSTONE GROUP L.P.
Notes to Condensed Consolidated Financial Statements�Continued
(All Dollars Are in Thousands, Except Unit and Per Unit Data, Except Where Noted)
�
The Partnership holds variable interests in certain VIEs which are not consolidated as it is determined that the Partnership is not the primary beneficiary. The Partnership�s involvement with such entities is in the form of direct equity interests and fee arrangements. The maximum exposure to loss represents the loss of assets recognized by Blackstone relating to non-consolidated entities, any amounts due to non-consolidated entities and any clawback obligation relating to previously distributed Carried Interest. The assets and liabilities recognized in the Partnership�s Condensed Consolidated Statements of Financial Condition related to the Partnership�s interest in these non-consolidated VIEs and the Partnership�s maximum exposure to loss relating to non-consolidated VIEs were as follows:
�
| � | �� | September�30,�2014 | � | �� | December�31,�2013 | � | ||
| Investments |
�� | $ | 947,054 | �� | �� | $ | 758,304 | �� |
| Accounts Receivable |
�� | � | 103,041 | �� | �� | � | 166,908 | �� |
| Due from Affiliates |
�� | � | 49,090 | �� | �� | � | 86,246 | �� |
| �� | � |
� |
� | �� | � |
� |
� | |
| Total VIE Assets |
�� | � | 1,099,185 | �� | �� | � | 1,011,458 | �� |
| Due to Affiliates |
�� | � | 113 | �� | �� | � | 397 | �� |
| Accounts Payable, Accrued Expenses and Other Liabilities |
�� | � | ��� | �� | �� | � | 2 | �� |
| Potential Clawback Obligation |
�� | � | 150,287 | �� | �� | � | 63,290 | �� |
| �� | � |
� |
� | �� | � |
� |
� | |
| Maximum Exposure to Loss |
�� | $ | 1,249,585 | �� | �� | $ | 1,075,147 | �� |
| �� | � |
� |
� | �� | � |
� |
� | |
�
| 10. | REVERSE REPURCHASE AND REPURCHASE AGREEMENTS |
At September�30, 2014, the Partnership received securities, primarily U.S. and non-U.S. government and agency securities, asset-backed securities and corporate debt, with a fair value of $93.0�million as collateral for reverse repurchase agreements that could be repledged, delivered or otherwise used. Securities with a fair value of $93.0�million and cash were used to cover Securities Sold, Not Yet Purchased. The Partnership also pledged securities with a carrying value of $140.2�million and cash to collateralize its repurchase agreements. Such securities can be repledged, delivered or otherwise used by the counterparty.
At December�31, 2013, the Partnership received securities, primarily U.S. and non-U.S. government and agency securities, asset-backed securities and corporate debt, with a fair value of $148.4�million and cash as collateral for reverse repurchase agreements that could be repledged, delivered or otherwise used. Securities with a fair value of $148.4�million were used to cover Securities Sold, Not Yet Purchased and Repurchase Agreements. The Partnership also pledged securities with a carrying value of $316.6�million and cash to collateralize its repurchase agreements. Such securities can be repledged, delivered or otherwise used by the counterparty.
�
| 11. | OFFSETTING OF ASSETS AND LIABILITIES |
The following tables present the offsetting of assets and liabilities as of September�30,�2014:
�
| � | �� | Gross�and�Net Amounts�of�Assets Presented in the Statement of Financial Condition |
� | �� | Gross Amounts Not Offset in the Statement of Financial Condition |
� | �� | Net�Amount | � | |||||||
| � | �� | �� | Financial Instruments |
� | �� | Cash�Collateral Received |
� | �� | ||||||||
| Assets |
�� | �� | �� | �� | ||||||||||||
| Freestanding Derivatives |
�� | $ | 6,454 | �� | �� | $ | 1,236 | �� | �� | $ | 540 | �� | �� | $ | 4,678 | �� |
| Reverse Repurchase Agreements |
�� | � | 93,538 | �� | �� | � | 92,968 | �� | �� | � | ��� | �� | �� | � | 570 | �� |
| �� | � |
� |
� | �� | � |
� |
� | �� | � |
� |
� | �� | � |
� |
� | |
| Total |
�� | $ | 99,992 | �� | �� | $ | 94,204 | �� | �� | $ | 540 | �� | �� | $ | 5,248 | �� |
| �� | � |
� |
� | �� | � |
� |
� | �� | � |
� |
� | �� | � |
� |
� | |
�
41
Table of Contents
THE BLACKSTONE GROUP L.P.
Notes to Condensed Consolidated Financial Statements�Continued
(All Dollars Are in Thousands, Except Unit and Per Unit Data, Except Where Noted)
�
| � | �� | Gross�and�Net Amounts�of Liabilities Presented�in� the Statement of Financial Condition |
� | �� | Gross Amounts Not Offset in the Statement of Financial Condition |
� | �� | Net�Amount | � | |||||||
| � | �� | �� | Financial Instruments |
� | �� | Cash�Collateral Pledged |
� | �� | ||||||||
| Liabilities |
�� | �� | �� | �� | ||||||||||||
| Freestanding Derivatives |
�� | $ | 9,838 | �� | �� | $ | 1,236 | �� | �� | $ | 8,571 | �� | �� | $ | 31 | �� |
| Repurchase Agreements |
�� | � | 122,349 | �� | �� | � | 121,880 | �� | �� | � | 469 | �� | �� | � | ��� | �� |
| �� | � |
� |
� | �� | � |
� |
� | �� | � |
� |
� | �� | � |
� |
� | |
| Total |
�� | $ | 132,187 | �� | �� | $ | 123,116 | �� | �� | $ | 9,040 | �� | �� | $ | 31 | �� |
| �� | � |
� |
� | �� | � |
� |
� | �� | � |
� |
� | �� | � |
� |
� | |
The following tables present the offsetting of assets and liabilities as of December�31, 2013:
�
| � | �� | Gross�and�Net Amounts�of�Assets Presented in the Statement of Financial Condition |
� | �� | Gross Amounts Not Offset in the Statement of Financial Condition |
� | �� | Net�Amount | � | |||||||
| � | �� | �� | Financial Instruments |
� | �� | Cash�Collateral Received |
� | �� | ||||||||
| Assets |
�� | �� | �� | �� | ||||||||||||
| Freestanding Derivatives |
�� | $ | 10,343 | �� | �� | $ | 3,025 | �� | �� | $ | 582 | �� | �� | $ | 6,736 | �� |
| Reverse Repurchase Agreements |
�� | � | 148,984 | �� | �� | � | 148,394 | �� | �� | � | ��� | �� | �� | � | 590 | �� |
| �� | � |
� |
� | �� | � |
� |
� | �� | � |
� |
� | �� | � |
� |
� | |
| Total |
�� | $ | 159,327 | �� | �� | $ | 151,419 | �� | �� | $ | 582 | �� | �� | $ | 7,326 | �� |
| �� | � |
� |
� | �� | � |
� |
� | �� | � |
� |
� | �� | � |
� |
� | |
�
| � | �� | Gross�and�Net Amounts�of Liabilities Presented�in� the Statement of Financial Condition |
� | �� | Gross Amounts Not Offset in the Statement of Financial Condition |
� | �� | Net�Amount | � | |||||||
| � | �� | �� | Financial Instruments |
� | �� | Cash�Collateral Pledged |
� | �� | ||||||||
| Liabilities |
�� | �� | �� | �� | ||||||||||||
| Freestanding Derivatives |
�� | $ | 4,282 | �� | �� | $ | 3,025 | �� | �� | $ | 1,257 | �� | �� | $ | ��� | �� |
| Repurchase Agreements |
�� | � | 316,352 | �� | �� | � | 316,352 | �� | �� | � | ��� | �� | �� | � | ��� | �� |
| �� | � |
� |
� | �� | � |
� |
� | �� | � |
� |
� | �� | � |
� |
� | |
| Total |
�� | $ | 320,634 | �� | �� | $ | 319,377 | �� | �� | $ | 1,257 | �� | �� | $ | ��� | �� |
| �� | � |
� |
� | �� | � |
� |
� | �� | � |
� |
� | �� | � |
� |
� | |
Reverse Repurchase Agreements and Repurchase Agreements are presented separately on the Condensed Consolidated Statements of Financial Condition. Freestanding Derivative assets are included in Other Assets in the Condensed Consolidated Statements of Financial Condition. The following table presents the components of Other Assets:
�
| � | �� | September�30,�2014 | � | �� | December�31,�2013 | � | ||
| Furniture, Equipment and Leasehold Improvements, Net |
�� | $ | 133,999 | �� | �� | $ | 137,088 | �� |
| Prepaid Expenses |
�� | � | 142,560 | �� | �� | � | 61,226 | �� |
| Other Assets |
�� | � | 77,923 | �� | �� | � | 75,815 | �� |
| Freestanding Derivatives |
�� | � | 6,454 | �� | �� | � | 10,343 | �� |
| �� | � |
� |
� | �� | � |
� |
� | |
| �� | $ | 360,936 | �� | �� | $ | 284,472 | �� | |
| �� | � |
� |
� | �� | � |
� |
� | |
Freestanding Derivative liabilities are included in Accounts Payable, Accrued Expenses and Other Liabilities in the Condensed Consolidated Statements of Financial Condition and are not a significant component thereof.
�
42
Table of Contents
THE BLACKSTONE GROUP L.P.
Notes to Condensed Consolidated Financial Statements�Continued
(All Dollars Are in Thousands, Except Unit and Per Unit Data, Except Where Noted)
�
Notional Pooling Arrangement
Blackstone has entered into a notional cash pooling arrangement with a financial institution for cash management purposes. This arrangement allows for cash withdrawals based upon aggregate cash balances on deposit at the same financial institution. Cash withdrawals cannot exceed aggregate cash balances on deposit. The net balance of cash on deposit and overdrafts is used as a basis for calculating net interest expense or income. As of September�30, 2014, the aggregate cash balance on deposit relating to the cash pooling arrangement was $1.2�billion, which was fully offset with an accompanying overdraft.
�
| 12. | BORROWINGS |
On April�7, 2014, Blackstone Holdings Finance Co. L.L.C. (the �Issuer�), an indirect subsidiary of the Partnership, issued $500�million aggregate principal amount of Senior Notes maturing June�15, 2044 (the �Notes�). The Notes have an interest rate of 5.000%�per annum, accruing from April�7, 2014. Interest is payable semiannually in arrears on June�15 and December�15 of each year, commencing December�15, 2014. The Notes are unsecured and unsubordinated obligations of the Issuer. The Notes are fully and unconditionally guaranteed, jointly and severally, by the Partnership, Blackstone Holdings I L.P., Blackstone Holdings II L.P., Blackstone Holdings III L.P. and Blackstone Holdings IV L.P. (the �Guarantors�). The guarantees are unsecured and unsubordinated obligations of the Guarantors. Transaction costs related to the issuance of the Notes have been capitalized and are being amortized over the life of the Notes.
On May�29, 2014, the Issuer entered into an amendment to the $1.1�billion revolving credit facility (the �Credit Facility�) with Citibank, N.A., as Administrative Agent. The amendment, among other things, extended the maturity date of the Credit Facility from July�13, 2017 to May�29, 2019. As of September�30, 2014, Blackstone had no outstanding borrowings under the Credit Facility.
The carrying value and fair value of the Blackstone issued notes, included in Loans Payable within the Condensed Consolidated Statements of Financial Condition, were:
�
| � | �� | September�30, 2014 | � | �� | December�31, 2013 | � | ||||||||||
| � | �� | Carrying Value |
� | �� | Fair Value� (a) |
� | �� | Carrying Value |
� | �� | Fair Value� (a) |
� | ||||
| Blackstone Issued 6.625%, $600 Million Par, Notes Due |
�� | $ | 627,081 | �� | �� | $ | 694,688 | �� | �� | $ | 632,823 | �� | �� | $ | 684,860 | �� |
| Blackstone Issued 5.875%, $400 Million Par, Notes Due 3/15/2021 |
�� | $ | 398,667 | �� | �� | $ | 464,680 | �� | �� | $ | 398,543 | �� | �� | $ | 447,120 | �� |
| Blackstone Issued 4.750%, $400 Million Par, Notes Due 2/15/2023 |
�� | $ | 393,651 | �� | �� | $ | 433,280 | �� | �� | $ | 393,202 | �� | �� | $ | 415,760 | �� |
| Blackstone Issued 6.250%, $250 Million Par, Notes Due 8/15/2042 |
�� | $ | 239,832 | �� | �� | $ | 307,725 | �� | �� | $ | 239,738 | �� | �� | $ | 278,550 | �� |
| Blackstone Issued 5.000%, $500 Million Par, Notes Due 6/15/2044 |
�� | $ | 492,988 | �� | �� | $ | 518,300 | �� | �� | $ | ��� | �� | �� | $ | ��� | �� |
�
| (a) | Fair value is determined by broker quote and these notes would be classified as Level II within the fair value hierarchy. |
| (b) | The carrying and fair values are determined using the original $600�million par amount less $15�million attributable to these notes which were acquired but not retired by Blackstone during 2012. |
�
43
Table of Contents
THE BLACKSTONE GROUP L.P.
Notes to Condensed Consolidated Financial Statements�Continued
(All Dollars Are in Thousands, Except Unit and Per Unit Data, Except Where Noted)
�
Included within Loans Payable and Due to Affiliates within the Condensed Consolidated Statements of Financial Condition are amounts due to holders of debt securities issued by Blackstone�s consolidated CLO vehicles. Borrowings through the consolidated CLO vehicles consisted of the following:
�
| � | �� | September�30, 2014 | � | �� | December�31, 2013 | � | ||||||||||||||||||
| � | �� | Borrowing Outstanding |
� | �� | Weighted- Average Interest Rate |
� | � | Weighted- Average Remaining Maturity�in Years |
� | �� | Borrowing Outstanding |
� | �� | Weighted- Average Interest Rate |
� | � | Weighted- Average Remaining Maturity�in Years |
� | ||||||
| Senior Secured Notes |
�� | $ | 5,460,411 | �� | �� | � | 1.03 | %� | � | � | 3.5 | �� | �� | $ | 8,605,553 | �� | �� | � | 1.09 | %� | � | � | 4.1 | �� |
| Subordinated Notes |
�� | � | 734,206 | �� | �� | � | (a | )� | � | � | N/A | �� | �� | � | 1,221,068 | �� | �� | � | (a | )� | � | � | N/A | �� |
| �� | � |
� |
� | �� | � | �� | � |
� |
� | �� | � | |||||||||||||
| �� | $ | 6,194,617 | �� | �� | � | �� | $ | 9,826,621 | �� | �� | � | |||||||||||||
| �� | � |
� |
� | �� | � | �� | � |
� |
� | �� | � | |||||||||||||
�
| (a) | The Subordinated Notes do not have contractual interest rates but instead receive distributions from the excess cash flows of the CLO vehicles. |
Senior Secured Notes and Subordinated Notes comprise the following amounts:
�
| � | �� | September�30, 2014 | � | �� | December�31, 2013 | � | ||||||||||||||||||
| � | �� | � | � | �� | Amounts Due to Non- Consolidated Affiliates |
� | �� | � | � | �� | Amounts Due to Non- Consolidated Affiliates |
� | ||||||||||||
| � | �� | Fair Value | � | �� | Borrowing Outstanding |
� | �� | Fair�Value | � | �� | Fair Value | � | �� | Borrowing Outstanding |
� | �� | Fair Value | � | ||||||
| Senior Secured Notes |
�� | $ | 5,322,648 | �� | �� | $ | 4,500 | �� | �� | $ | 4,367 | �� | �� | $ | 8,302,572 | �� | �� | $ | 14,500 | �� | �� | $ | 13,732 | �� |
| Subordinated Notes |
�� | $ | 360,272 | �� | �� | $ | 40,059 | �� | �� | $ | 23,218 | �� | �� | $ | 610,435 | �� | �� | $ | 224,444 | �� | �� | $ | 110,197 | �� |
The Loans Payable of the consolidated CLO vehicles are collateralized by assets held by each respective CLO vehicle and assets of one vehicle may not be used to satisfy the liabilities of another. As of September�30, 2014 and December�31, 2013, the fair value of the consolidated CLO assets was $7.5�billion and $9.5�billion, respectively. This collateral consisted of Cash, Corporate Loans, Corporate Bonds and other securities.
Scheduled principal payments for borrowings as of September�30, 2014 were as follows:
�
| � | �� | Operating Borrowings |
� | �� | Blackstone�Fund Facilities/CLO Vehicles |
� | �� | Total Borrowings |
� | |||
| 2014 |
�� | $ | ��� | �� | �� | $ | ��� | �� | �� | $ | ��� | �� |
| 2015 |
�� | � | ��� | �� | �� | � | 6,823 | �� | �� | � | 6,823 | �� |
| 2016 |
�� | � | ��� | �� | �� | � | ��� | �� | �� | � | ��� | �� |
| 2017 |
�� | � | ��� | �� | �� | � | ��� | �� | �� | � | ��� | �� |
| After 2018 |
�� | � | 2,135,000 | �� | �� | � | 6,194,617 | �� | �� | � | 8,329,617 | �� |
| �� | � |
� |
� | �� | � |
� |
� | �� | � |
� |
� | |
| Total |
�� | $ | 2,135,000 | �� | �� | $ | 6,201,440 | �� | �� | $ | 8,336,440 | �� |
| �� | � |
� |
� | �� | � |
� |
� | �� | � |
� |
� | |
�
| 13. | INCOME TAXES |
Blackstone�s effective tax rate was 12.5% and 11.1% for the three months ended September�30, 2014 and 2013, respectively, and 8.2% and 10.5% for the nine months ended September�30, 2014 and 2013, respectively.
�
44
Table of Contents
THE BLACKSTONE GROUP L.P.
Notes to Condensed Consolidated Financial Statements�Continued
(All Dollars Are in Thousands, Except Unit and Per Unit Data, Except Where Noted)
�
Blackstone�s income tax provision was $79.1�million and $57.5�million for the three months ended September�30, 2014 and 2013, respectively, and $216.5�million and $164.6�million for the nine months ended September�30, 2014 and 2013, respectively.
Blackstone�s effective tax rate for the three and nine months ended September�30, 2014 and 2013 was substantially due to the following: (a)�certain corporate subsidiaries are subject to federal, state, local and foreign income taxes as applicable and other subsidiaries are subject to New York City unincorporated business taxes, and (b)�a portion of compensation charges are not deductible for tax purposes.
�
| 14. | NET INCOME PER COMMON UNIT |
Basic and diluted net income per common unit for the three and nine months ended September�30, 2014 and September�30, 2013 was calculated as follows:
�
| � | �� | Three Months Ended September�30, |
� | �� | Nine Months
Ended September�30, |
� | ||||||||||
| � | �� | 2014 | � | �� | 2013 | � | �� | 2014 | � | �� | 2013 | � | ||||
| Net Income Attributable to The Blackstone Group L.P. |
�� | $ | 250,505 | �� | �� | $ | 171,164 | �� | �� | $ | 1,033,138 | �� | �� | $ | 549,947 | �� |
| �� | � |
� |
� | �� | � |
� |
� | �� | � |
� |
� | �� | � |
� |
� | |
| Basic Net Income Per Common Unit |
�� | �� | �� | �� | ||||||||||||
| Weighted-Average Common Units Outstanding |
�� | � | 611,684,213 | �� | �� | � | 589,643,844 | �� | �� | � | 606,671,289 | �� | �� | � | 585,296,526 | �� |
| �� | � |
� |
� | �� | � |
� |
� | �� | � |
� |
� | �� | � |
� |
� | |
| Basic Net Income Per Common Unit |
�� | $ | 0.41 | �� | �� | $ | 0.29 | �� | �� | $ | 1.70 | �� | �� | $ | 0.94 | �� |
| �� | � |
� |
� | �� | � |
� |
� | �� | � |
� |
� | �� | � |
� |
� | |
| Diluted Net Income Per Common Unit |
�� | �� | �� | �� | ||||||||||||
| Weighted-Average Common Units Outstanding |
�� | � | 611,684,213 | �� | �� | � | 589,643,844 | �� | �� | � | 606,671,289 | �� | �� | � | 585,296,526 | �� |
| Weighted-Average Unvested Deferred Restricted Common Units |
�� | � | 3,294,657 | �� | �� | � | 3,276,951 | �� | �� | � | 3,550,012 | �� | �� | � | 3,191,542 | �� |
| �� | � |
� |
� | �� | � |
� |
� | �� | � |
� |
� | �� | � |
� |
� | |
| Weighted-Average Diluted Common Units Outstanding |
�� | � | 614,978,870 | �� | �� | � | 592,920,795 | �� | �� | � | 610,221,301 | �� | �� | � | 588,488,068 | �� |
| �� | � |
� |
� | �� | � |
� |
� | �� | � |
� |
� | �� | � |
� |
� | |
| Diluted Net Income Per Common Unit |
�� | $ | 0.41 | �� | �� | $ | 0.29 | �� | �� | $ | 1.69 | �� | �� | $ | 0.93 | �� |
| �� | � |
� |
� | �� | � |
� |
� | �� | � |
� |
� | �� | � |
� |
� | |
The following table summarizes the anti-dilutive securities for the periods indicated:
�
| � | �� | Three Months Ended September�30, |
� | �� | Nine Months Ended September�30, |
� | ||||||||||
| � | �� | 2014 | � | �� | 2013 | � | �� | 2014 | � | �� | 2013 | � | ||||
| Weighted-Average Blackstone Holdings Partnership Units |
�� | � | 539,856,777 | �� | �� | � | 551,916,623 | �� | �� | � | 544,426,162 | �� | �� | � | 554,857,282 | �� |
Unit Repurchase Program
In January 2008, Blackstone announced that the Board of Directors of its general partner, Blackstone Group Management L.L.C., had authorized the repurchase by Blackstone of up to $500�million of Blackstone common units and Blackstone Holdings Partnership Units. Under this unit repurchase program, units may be repurchased
�
45
Table of Contents
THE BLACKSTONE GROUP L.P.
Notes to Condensed Consolidated Financial Statements�Continued
(All Dollars Are in Thousands, Except Unit and Per Unit Data, Except Where Noted)
�
from time to time in open market transactions, in privately negotiated transactions or otherwise. The timing and the actual number of Blackstone common units and Blackstone Holdings Partnership Units repurchased will depend on a variety of factors, including legal requirements, price and economic and market conditions. This unit repurchase program may be suspended or discontinued at any time and does not have a specified expiration date.
During the nine months ended September�30, 2014 and 2013, no units were repurchased. As of September�30, 2014, the amount remaining available for repurchases under this program was $335.8�million.
�
| 15. | EQUITY-BASED COMPENSATION |
The Partnership has granted equity-based compensation awards to Blackstone�s senior managing directors, non-partner professionals, non-professionals and selected external advisers under the Partnership�s 2007 Equity Incentive Plan (the �Equity Plan�), the majority of which to date were granted in connection with Blackstone�s initial public offering (�IPO�). The Equity Plan allows for the granting of options, unit appreciation rights or other unit-based awards (units, restricted units, restricted common units, deferred restricted common units, phantom restricted common units or other unit-based awards based in whole or in part on the fair value of the Blackstone common units or Blackstone Holdings Partnership Units) which may contain certain service or performance requirements. As of January�1, 2014, the Partnership had the ability to grant 164,224,426�units under the Equity Plan.
For the three and nine months ended September�30, 2014, the Partnership recorded compensation expense of $202.8�million and $584.4�million, respectively, in relation to its equity-based awards with corresponding tax benefits of $6.3�million and $19.9�million, respectively. For the three and nine months ended September�30, 2013, the Partnership recorded compensation expense of $193.6�million and $572.1�million, respectively, in relation to its equity-based awards with corresponding tax benefits of $4.3�million and $16.0�million, respectively. As of September�30, 2014, there was $788.4�million of estimated unrecognized compensation expense related to unvested awards. This cost is expected to be recognized over a weighted-average period of 1.8�years.
Total vested and unvested outstanding units, including Blackstone common units, Blackstone Holdings Partnership Units and deferred restricted common units, were 1,157,195,487 as of September�30, 2014. Total outstanding unvested phantom units were 74,414 as of September�30, 2014.
A summary of the status of the Partnership�s unvested equity-based awards as of September�30, 2014 and of changes during the period January�1, 2014 through September�30, 2014 is presented below:
�
| � | �� | Blackstone Holdings | � | �� | The Blackstone Group L.P. | � | ||||||||||||||||||
| � | �� | � | � | � | � | � | �� | Equity Settled Awards | � | �� | Cash Settled Awards | � | ||||||||||||
| Unvested Units |
�� | Partnership Units |
� | � | Weighted- Average Grant Date Fair Value |
� | �� | Deferred Restricted Common Units and Options |
� | � | Weighted- Average Grant Date Fair Value |
� | �� | Phantom Units |
� | � | Weighted- Average Grant Date Fair Value |
� | ||||||
| Balance, December 31, 2013 |
�� | � | 48,057,816 | �� | � | $ | 26.64 | �� | �� | � | 20,004,139 | �� | � | $ | 15.57 | �� | �� | � | 147,169 | �� | � | $ | 12.00 | �� |
| Granted |
�� | � | 4,395,112 | �� | � | � | 33.29 | �� | �� | � | 2,071,243 | �� | � | � | 30.90 | �� | �� | � | 461 | �� | � | � | 28.05 | �� |
| Vested |
�� | � | (17,547,906 | )� | � | � | 29.76 | �� | �� | � | (3,449,305 | )� | � | � | 18.64 | �� | �� | � | (72,646 | )� | � | � | 11.82 | �� |
| Forfeited |
�� | � | (324,557 | )� | � | � | 19.63 | �� | �� | � | (517,227 | )� | � | � | 13.73 | �� | �� | � | (570 | )� | � | � | 33.41 | �� |
| Cancelled |
�� | � | (1,068,250 | )� | � | � | 31.00 | �� | �� | � | ��� | �� | � | � | ��� | �� | �� | � | ��� | �� | � | � | ��� | �� |
| �� | � |
� |
� | � | �� | � |
� |
� | � | �� | � |
� |
� | � | ||||||||||
| Balance, September�30, 2014 |
�� | � | 33,512,215 | �� | � | $ | 25.81 | �� | �� | � | 18,108,850 | �� | � | $ | 16.80 | �� | �� | � | 74,414 | �� | � | $ | 12.27 | �� |
| �� | � |
� |
� | � | �� | � |
� |
� | � | �� | � |
� |
� | � | ||||||||||
�
46
Table of Contents
THE BLACKSTONE GROUP L.P.
Notes to Condensed Consolidated Financial Statements�Continued
(All Dollars Are in Thousands, Except Unit and Per Unit Data, Except Where Noted)
�
Units Expected to Vest
The following unvested units, after expected forfeitures, as of September�30, 2014, are expected to vest:
�
| � | �� | Units | � | �� | Weighted-Average Service Period in Years |
� | ||
| Blackstone Holdings Partnership Units |
�� | � | 31,290,689 | �� | �� | � | 1.7 | �� |
| Deferred Restricted Blackstone Common Units |
�� | � | 15,465,322 | �� | �� | � | 1.9 | �� |
| �� | � |
� |
� | �� | � |
� |
� | |
| Total Equity-Based Awards |
�� | � | 46,756,011 | �� | �� | � | 1.8 | �� |
| �� | � |
� |
� | �� | � |
� |
� | |
| Phantom Units |
�� | � | 76,412 | �� | �� | � | 0.04 | �� |
| �� | � |
� |
� | �� | � |
� |
� | |
Equity-Based Awards with Performance Conditions
The Partnership has also granted certain equity-based awards with performance requirements. These awards are based on the performance of certain businesses over a three to five year period beginning January 2012, relative to a predetermined threshold. Blackstone has determined that it is probable that the relevant performance thresholds will be exceeded in future periods and, therefore, has recorded compensation expense since the beginning of the performance period of $105.5�million.
�
| 16. | RELATED PARTY TRANSACTIONS |
Affiliate Receivables and Payables
Due from Affiliates and Due to Affiliates consisted of the following:
�
| � | �� | September�30, 2014 |
� | �� | December�31, 2013 |
� | ||
| Due from Affiliates |
�� | �� | ||||||
| Accrual for Potential Clawback of Previously Distributed Carried Interest |
�� | $ | 3,556 | �� | �� | $ | 1,561 | �� |
| Primarily Interest Bearing Advances Made on Behalf of Certain Non-Controlling Interest Holders and Blackstone Employees for Investments in Blackstone Funds |
�� | � | 188,392 | �� | �� | � | 151,493 | �� |
| Amounts Due from Portfolio Companies and Funds |
�� | � | 271,994 | �� | �� | � | 307,926 | �� |
| Investments Redeemed in Non-Consolidated Funds of Hedge Funds |
�� | � | 33,788 | �� | �� | � | 259,787 | �� |
| Management and Performance Fees Due from Non-Consolidated Funds |
�� | � | 349,814 | �� | �� | � | 325,389 | �� |
| Payments Made on Behalf of Non-Consolidated Entities |
�� | � | 176,656 | �� | �� | � | 133,790 | �� |
| Advances Made to Certain Non-Controlling Interest Holders and Blackstone Employees |
�� | � | 23,273 | �� | �� | � | 12,098 | �� |
| �� | � |
� |
� | �� | � |
� |
� | |
| �� | $ | 1,047,473 | �� | �� | $ | 1,192,044 | �� | |
| �� | � |
� |
� | �� | � |
� |
� | |
�
47
Table of Contents
THE BLACKSTONE GROUP L.P.
Notes to Condensed Consolidated Financial Statements�Continued
(All Dollars Are in Thousands, Except Unit and Per Unit Data, Except Where Noted)
�
| � | �� | September�30, 2014 |
� | �� | December�31, 2013 |
� | ||
| Due to Affiliates |
�� | �� | ||||||
| Due to Certain Non-Controlling Interest Holders in Connection with the Tax Receivable Agreements |
�� | $ | 1,220,417 | �� | �� | $ | 1,235,168 | �� |
| Accrual for Potential Repayment of Previously Received Performance Fees |
�� | � | 4,001 | �� | �� | � | 4,270 | �� |
| Due to Note Holders of Consolidated CLO Vehicles |
�� | � | 27,585 | �� | �� | � | 123,929 | �� |
| Distributions Received on Behalf of Certain Non-Controlling Interest Holders and Blackstone Employees |
�� | � | 13,122 | �� | �� | � | 11,293 | �� |
| Payable to Affiliates for Consolidated Funds |
�� | � | 23,123 | �� | �� | � | 29,803 | �� |
| Distributions Received on Behalf of Blackstone Entities |
�� | � | 24,975 | �� | �� | � | 22,815 | �� |
| Payments Made by Non-Consolidated Entities |
�� | � | 14,008 | �� | �� | � | 9,581 | �� |
| �� | � |
� |
� | �� | � |
� |
� | |
| �� | $ | 1,327,231 | �� | �� | $ | 1,436,859 | �� | |
| �� | � |
� |
� | �� | � |
� |
� | |
Interests of the Founder, Senior Managing Directors, Employees and Other Related Parties
The founder, senior managing directors, employees and certain other related parties invest on a discretionary basis in the consolidated Blackstone Funds both directly and through consolidated entities. These investments generally are subject to preferential management fee and performance fee arrangements. As of September�30, 2014 and December�31, 2013, such investments aggregated $1.1�billion and $1.0�billion, respectively. Their share of the Net Income Attributable to Redeemable Non-Controlling and Non-Controlling Interests in Consolidated Entities aggregated $40.0�million and $43.9�million for the three months ended September�30, 2014 and 2013, respectively, and $135.7�million and $144.5�million for the nine months ended September�30, 2014 and 2013, respectively.
Revenues Earned from Affiliates
Management and Advisory Fees, Net earned from affiliates totaled $107.6�million and $48.9�million for the three months ended September�30, 2014 and 2013, respectively. Management and Advisory Fees, Net earned from affiliates totaled $263.0�million and $169.0�million for the nine months ended September�30, 2014 and 2013, respectively. Fees relate primarily to transaction and monitoring fees which are negotiated in the ordinary course of fundraising and investment activities.
Loans to Affiliates
Loans to affiliates consist of interest bearing advances to certain Blackstone individuals to finance their investments in certain Blackstone Funds. These loans earn interest at Blackstone�s cost of borrowing and such interest totaled $1.0�million and $0.9�million for the three months ended September�30, 2014 and 2013, respectively, and $2.1�million and $2.7�million for the nine months ended September�30, 2014 and 2013, respectively.
Contingent Repayment Guarantee
Blackstone and its personnel who have received Carried Interest distributions have guaranteed payment on a several basis (subject to a cap) to the Carry Funds of any clawback obligation with respect to the excess Carried Interest allocated to the general partners of such funds and indirectly received thereby to the extent that either Blackstone or its personnel fails to fulfill its clawback obligation, if any. The Accrual for Potential Repayment of Previously Received Performance Fees represents amounts previously paid to Blackstone Holdings and non-controlling interest holders that would need to be repaid to the Blackstone Funds if the Carry Funds were to be
�
48
Table of Contents
THE BLACKSTONE GROUP L.P.
Notes to Condensed Consolidated Financial Statements�Continued
(All Dollars Are in Thousands, Except Unit and Per Unit Data, Except Where Noted)
�
liquidated based on the fair value of their underlying investments as of September�30, 2014. See Note 17. �Commitments and Contingencies � Contingencies � Contingent Obligations (Clawback)�.
Aircraft and Other Services
In the normal course of business, Blackstone personnel have made use of aircraft owned as personal assets by Stephen A. Schwarzman and an aircraft owned jointly as a personal asset by Hamilton E. James, Blackstone�s President and Chief Operating Officer, and Jonathan D. Gray, Blackstone�s Global Head of Real Estate and a Director of Blackstone (each such aircraft, �Personal Aircraft�). Mr.�Schwarzman paid for his purchases of his Personal Aircraft himself and bears all operating, personnel and maintenance costs associated with their operation. Each of Mr.�James and Mr.�Gray paid for his respective interest in their jointly owned Personal Aircraft himself and bears all operating, personnel and maintenance costs associated with its operation. Payment by Blackstone for the use of the Personal Aircraft by Blackstone employees is made at market rates.
In addition, on occasion, certain of Blackstone�s executive officers and their families may make use of an aircraft in which Blackstone owns a fractional interest, as well as other assets of Blackstone. Any such personal use of Blackstone assets is charged to the executive officer based on market rates and usage. Personal use of Blackstone resources is also reimbursed to Blackstone at market rates.
The transactions described herein are not material to the Condensed Consolidated Financial Statements.
Tax Receivable Agreements
Blackstone used a portion of the proceeds from the IPO and the sale of non-voting common units to Beijing Wonderful Investments to purchase interests in the predecessor businesses from the predecessor owners. In addition, holders of Blackstone Holdings Partnership Units may exchange their Blackstone Holdings Partnership Units for Blackstone common units on a one-for-one basis. The purchase and subsequent exchanges are expected to result in increases in the tax basis of the tangible and intangible assets of Blackstone Holdings and therefore reduce the amount of tax that Blackstone�s wholly owned subsidiaries would otherwise be required to pay in the future.
One of the subsidiaries of the Partnership which is a corporate taxpayer has entered into tax receivable agreements with each of the predecessor owners and additional tax receivable agreements have been executed, and will continue to be executed, with newly-admitted senior managing directors and others who acquire Blackstone Holdings Partnership Units. The agreements provide for the payment by the corporate taxpayer to such owners of 85% of the amount of cash savings, if any, in U.S. federal, state and local income tax that the corporate taxpayers actually realize as a result of the aforementioned increases in tax basis and of certain other tax benefits related to entering into these tax receivable agreements. For purposes of the tax receivable agreements, cash savings in income tax will be computed by comparing the actual income tax liability of the corporate taxpayers to the amount of such taxes that the corporate taxpayers would have been required to pay had there been no increase to the tax basis of the tangible and intangible assets of Blackstone Holdings as a result of the exchanges and had the corporate taxpayers not entered into the tax receivable agreements.
Assuming no material changes in the relevant tax law and that the corporate taxpayers earn sufficient taxable income to realize the full tax benefit of the increased amortization of the assets, the expected future payments under the tax receivable agreements (which are taxable to the recipients) will aggregate $1.2�billion over the next 15 years. The after-tax net present value of these estimated payments totals $388.1�million assuming a 15% discount rate and using Blackstone�s most recent projections relating to the estimated timing of the benefit to be received. Future
�
49
Table of Contents
THE BLACKSTONE GROUP L.P.
Notes to Condensed Consolidated Financial Statements�Continued
(All Dollars Are in Thousands, Except Unit and Per Unit Data, Except Where Noted)
�
payments under the tax receivable agreements in respect of subsequent exchanges would be in addition to these amounts. The payments under the tax receivable agreements are not conditioned upon continued ownership of Blackstone equity interests by the pre-IPO owners and the others mentioned above.
Amounts related to the deferred tax asset resulting from the increase in tax basis from the exchange of Blackstone Holdings Partnership Units to Blackstone common units, the resulting remeasurement of net deferred tax assets at the Blackstone ownership percentage at the balance sheet date, the due to affiliates for the future payments resulting from the tax receivable agreements and resulting adjustment to partners� capital are included as Acquisition of Ownership Interests from Non-Controlling Interest Holders in the Supplemental Disclosure of Non-Cash Investing and Financing Activities in the Condensed Consolidated Statements of Cash Flows.
Other
Blackstone does business with and on behalf of some of its Portfolio Companies; all such arrangements are on a negotiated basis.
�
| 17. | COMMITMENTS AND CONTINGENCIES |
Commitments
Investment Commitments
Blackstone had $1.4�billion of investment commitments as of September�30, 2014 representing general partner capital funding commitments to the Blackstone Funds, limited partner capital funding to other funds and Blackstone principal investment commitments. The consolidated Blackstone Funds had signed investment commitments of $52.5�million as of September�30, 2014 which includes $35.9�million of signed investment commitments for portfolio company acquisitions in the process of closing.
Contingencies
Guarantees
Certain of Blackstone�s consolidated real estate funds guarantee payments to third parties in connection with the on-going business activities and/or acquisitions of their Portfolio Companies. There is no direct recourse to the Partnership to fulfill such obligations. To the extent that underlying funds are required to fulfill guarantee obligations, the Partnership�s invested capital in such funds is at risk. Total investments at risk in respect of guarantees extended by consolidated real estate funds was $2.6�million as of September�30, 2014.
On March�28, 2012, the Blackstone Holdings Partnerships entered into a guaranty agreement with a lending institution in which the Holdings Partnerships guarantee certain loans held by employees for investment in Blackstone Funds. The amount guaranteed as of September�30, 2014 was $84.8�million.
Litigation
From time to time, Blackstone is named as a defendant in legal actions relating to transactions conducted in the ordinary course of business. Although there can be no assurance of the outcome of such legal actions, in the opinion of management, Blackstone does not have a potential liability related to any current legal proceeding or claim that would individually or in the aggregate materially affect its results of operations, financial position or cash flows.
�
50
Table of Contents
THE BLACKSTONE GROUP L.P.
Notes to Condensed Consolidated Financial Statements�Continued
(All Dollars Are in Thousands, Except Unit and Per Unit Data, Except Where Noted)
�
Contingent Obligations (Clawback)
Carried Interest is subject to clawback to the extent that the Carried Interest received to date with respect to a fund exceeds the amount due to Blackstone based on cumulative results of that fund. The actual clawback liability, however, generally does not become realized until the end of a fund�s life except for certain Blackstone real estate funds, multi-asset class investment funds and credit-focused funds, which may have an interim clawback liability. The lives of the carry funds with a potential clawback obligation, including available contemplated extensions, are currently anticipated to expire at various points through 2016. Further extensions of such terms may be implemented under given circumstances.
For financial reporting purposes, the general partners have recorded a liability for potential clawback obligations to the limited partners of some of the carry funds due to changes in the unrealized value of a fund�s remaining investments and where the fund�s general partner has previously received Carried Interest distributions with respect to such fund�s realized investments.
The following table presents the clawback obligations by segment:
�
| � | �� | September�30, 2014 | � | �� | December�31, 2013 | � | ||||||||||||||||||
| Segment |
�� | Blackstone Holdings |
� | �� | Current�and Former�Personnel |
� | �� | Total | � | �� | Blackstone Holdings |
� | � | Current�and Former�Personnel |
� | �� | Total | � | ||||||
| Private Equity |
�� | $ | ��� | �� | �� | $ | ��� | �� | �� | $ | ��� | �� | �� | $ | (5 | )� | � | $ | 151 | �� | �� | $ | 146 | �� |
| Real Estate |
�� | � | 445 | �� | �� | � | 1,440 | �� | �� | � | 1,885 | �� | �� | � | 1,501 | �� | � | � | 518 | �� | �� | � | 2,019 | �� |
| Credit |
�� | � | ��� | �� | �� | � | 2,116 | �� | �� | � | 2,116 | �� | �� | � | 1,213 | �� | � | � | 892 | �� | �� | � | 2,105 | �� |
| �� | � |
� |
� | �� | � |
� |
� | �� | � |
� |
� | �� | � |
� |
� | � | � |
� |
� | �� | � |
� |
� | |
| Total |
�� | $ | 445 | �� | �� | $ | 3,556 | �� | �� | $ | 4,001 | �� | �� | $ | 2,709 | �� | � | $ | 1,561 | �� | �� | $ | 4,270 | �� |
| �� | � |
� |
� | �� | � |
� |
� | �� | � |
� |
� | �� | � |
� |
� | � | � |
� |
� | �� | � |
� |
� | |
A portion of the Carried Interest paid to current and former Blackstone personnel is held in segregated accounts in the event of a cash clawback obligation. These segregated accounts are not included in the Condensed Consolidated Financial Statements of the Partnership, except to the extent a portion of the assets held in the segregated accounts may be allocated to a consolidated Blackstone fund of hedge funds. At September�30, 2014, $480.8�million was held in segregated accounts for the purpose of meeting any clawback obligations of current and former personnel if such payments are required.
�
| 18. | SEGMENT REPORTING |
Blackstone transacts its primary business in the United States and substantially all of its revenues are generated domestically.
Blackstone conducts its alternative asset management and financial advisory businesses through five segments:
�
| � | � | � | Private Equity � Blackstone�s Private Equity segment comprises its management of private equity funds, certain multi-asset class investment funds and secondary private funds of funds. |
�
| � | � | � | Real Estate � Blackstone�s Real Estate segment primarily comprises its management of global, European focused and Asian focused opportunistic real estate funds. In addition, the segment has debt investment funds and a publicly traded REIT targeting non-controlling real estate debt-related investment opportunities in the public and private markets, primarily in the United States and Europe. |
�
| � | � | � | Hedge Fund Solutions � Blackstone�s Hedge Fund Solutions segment is comprised principally of Blackstone Alternative Asset Management (�BAAM�), an institutional solutions provider utilizing hedge funds across a variety of strategies. |
�
51
Table of Contents
THE BLACKSTONE GROUP L.P.
Notes to Condensed Consolidated Financial Statements�Continued
(All Dollars Are in Thousands, Except Unit and Per Unit Data, Except Where Noted)
�
| � | � | � | Credit � Blackstone�s Credit segment, which principally includes GSO Capital Partners LP (�GSO�), manages credit-focused products within private debt and public market strategies. GSO�s products include senior credit-focused funds, distressed debt funds, mezzanine funds, general credit-focused funds, registered investment companies, separately managed accounts and CLO vehicles. |
�
| � | � | � | Financial Advisory � Blackstone�s Financial Advisory segment comprises its financial and strategic advisory services, restructuring and reorganization advisory services, capital markets services and Park Hill Group, which provides fund placement services for alternative investment funds. |
These business segments are differentiated by their various sources of income. The Private Equity, Real Estate, Hedge Fund Solutions and Credit segments primarily earn their income from management fees and investment returns on assets under management, while the Financial Advisory segment primarily earns its income from fees related to investment banking services and advice and fund placement services.
Blackstone uses Economic Income (�EI�) as a key measure of value creation, a benchmark of its performance and in making resource deployment and compensation decisions across its five segments. EI represents segment net income before taxes excluding transaction-related charges. Transaction-related charges arise from Blackstone�s IPO and long-term retention programs outside of annual deferred compensation and other corporate actions, including acquisitions. Transaction-related charges include equity-based compensation charges, the amortization of intangible assets and contingent consideration associated with acquisitions. EI presents revenues and expenses on a basis that deconsolidates the investment funds Blackstone manages. Economic Net Income (�ENI�) represents EI adjusted to include current period taxes. Taxes represent the current tax provision (benefit) calculated on Income (Loss) Before Provision for Taxes.
Management makes operating decisions and assesses the performance of each of Blackstone�s business segments based on financial and operating metrics and data that is presented without the consolidation of any of the Blackstone Funds that are consolidated into the Condensed Consolidated Financial Statements. Consequently, all segment data excludes the assets, liabilities and operating results related to the Blackstone Funds.
�
52
Table of Contents
THE BLACKSTONE GROUP L.P.
Notes to Condensed Consolidated Financial Statements�Continued
(All Dollars Are in Thousands, Except Unit and Per Unit Data, Except Where Noted)
�
The following table presents the financial data for Blackstone�s segments for the three months ended September�30, 2014 and 2013:
�
| � | � | Three Months Ended September�30, 2014 | � | |||||||||||||||||||||
| � | � | Private Equity |
� | � | Real�Estate | � | � | Hedge�Fund Solutions |
� | � | Credit | � | � | Financial Advisory |
� | � | Total Segments |
� | ||||||
| Segment Revenues |
� | � | � | � | � | � | ||||||||||||||||||
| Management and Advisory Fees, Net |
� | � | � | � | � | � | ||||||||||||||||||
| Base Management Fees |
� | $ | 108,236 | �� | � | $ | 155,089 | �� | � | $ | 121,484 | �� | � | $ | 120,684 | �� | � | $ | ��� | �� | � | $ | 505,493 | �� |
| Advisory Fees |
� | � | ��� | �� | � | � | ��� | �� | � | � | ��� | �� | � | � | ��� | �� | � | � | 84,131 | �� | � | � | 84,131 | �� |
| Transaction and Other Fees, Net |
� | � | 48,996 | �� | � | � | 38,312 | �� | � | � | 161 | �� | � | � | 3,025 | �� | � | � | 391 | �� | � | � | 90,885 | �� |
| Management Fee Offsets |
� | � | (5,837 | )� | � | � | (8,977 | )� | � | � | (1,099 | )� | � | � | (6,850 | )� | � | � | ��� | �� | � | � | (22,763 | )� |
| � | � |
� |
� | � | � |
� |
� | � | � |
� |
� | � | � |
� |
� | � | � |
� |
� | � | � |
� |
� | |
| Total Management and Advisory Fees, Net |
� | � | 151,395 | �� | � | � | 184,424 | �� | � | � | 120,546 | �� | � | � | 116,859 | �� | � | � | 84,522 | �� | � | � | 657,746 | �� |
| � | � |
� |
� | � | � |
� |
� | � | � |
� |
� | � | � |
� |
� | � | � |
� |
� | � | � |
� |
� | |
| Performance Fees |
� | � | � | � | � | � | ||||||||||||||||||
| Realized |
� | � | � | � | � | � | ||||||||||||||||||
| Carried Interest |
� | � | 124,913 | �� | � | � | 349,237 | �� | � | � | ��� | �� | � | � | 164,602 | �� | � | � | ��� | �� | � | � | 638,752 | �� |
| Incentive Fees |
� | � | ��� | �� | � | � | 1,159 | �� | � | � | 6,683 | �� | � | � | 28,998 | �� | � | � | ��� | �� | � | � | 36,840 | �� |
| Unrealized |
� | � | � | � | � | � | ||||||||||||||||||
| Carried Interest |
� | � | 96,455 | �� | � | � | 187,175 | �� | � | � | ��� | �� | � | � | (61,604 | )� | � | � | ��� | �� | � | � | 222,026 | �� |
| Incentive Fees |
� | � | ��� | �� | � | � | (374 | )� | � | � | 25,473 | �� | � | � | (31,630 | )� | � | � | ��� | �� | � | � | (6,531 | )� |
| � | � |
� |
� | � | � |
� |
� | � | � |
� |
� | � | � |
� |
� | � | � |
� |
� | � | � |
� |
� | |
| Total Performance Fees |
� | � | 221,368 | �� | � | � | 537,197 | �� | � | � | 32,156 | �� | � | � | 100,366 | �� | � | � | ��� | �� | � | � | 891,087 | �� |
| � | � |
� |
� | � | � |
� |
� | � | � |
� |
� | � | � |
� |
� | � | � |
� |
� | � | � |
� |
� | |
| Investment Income (Loss) |
� | � | � | � | � | � | ||||||||||||||||||
| Realized |
� | � | 20,421 | �� | � | � | 49,173 | �� | � | � | 2,693 | �� | � | � | 3,040 | �� | � | � | 505 | �� | � | � | 75,832 | �� |
| Unrealized |
� | � | (12,754 | )� | � | � | 14,492 | �� | � | � | (1,168 | )� | � | � | 4,892 | �� | � | � | (528 | )� | � | � | 4,934 | �� |
| � | � |
� |
� | � | � |
� |
� | � | � |
� |
� | � | � |
� |
� | � | � |
� |
� | � | � |
� |
� | |
| Total Investment Income (Loss) |
� | � | 7,667 | �� | � | � | 63,665 | �� | � | � | 1,525 | �� | � | � | 7,932 | �� | � | � | (23 | )� | � | � | 80,766 | �� |
| Interest and Dividend Revenue |
� | � | 5,346 | �� | � | � | 7,135 | �� | � | � | 2,724 | �� | � | � | 5,968 | �� | � | � | 2,412 | �� | � | � | 23,585 | �� |
| Other |
� | � | 2,150 | �� | � | � | 976 | �� | � | � | 740 | �� | � | � | (3,619 | )� | � | � | 472 | �� | � | � | 719 | �� |
| � | � |
� |
� | � | � |
� |
� | � | � |
� |
� | � | � |
� |
� | � | � |
� |
� | � | � |
� |
� | |
| Total Revenues |
� | � | 387,926 | �� | � | � | 793,397 | �� | � | � | 157,691 | �� | � | � | 227,506 | �� | � | � | 87,383 | �� | � | � | 1,653,903 | �� |
| � | � |
� |
� | � | � |
� |
� | � | � |
� |
� | � | � |
� |
� | � | � |
� |
� | � | � |
� |
� | |
| Expenses |
� | � | � | � | � | � | ||||||||||||||||||
| Compensation and Benefits |
� | � | � | � | � | � | ||||||||||||||||||
| Compensation |
� | � | 79,007 | �� | � | � | 90,586 | �� | � | � | 41,940 | �� | � | � | 54,877 | �� | � | � | 58,016 | �� | � | � | 324,426 | �� |
| Performance Fee Compensation |
� | � | � | � | � | � | ||||||||||||||||||
| Realized |
� | � | � | � | � | � | ||||||||||||||||||
| Carried Interest |
� | � | 30,944 | �� | � | � | 64,187 | �� | � | � | ��� | �� | � | � | 90,872 | �� | � | � | ��� | �� | � | � | 186,003 | �� |
| Incentive Fees |
� | � | ��� | �� | � | � | 592 | �� | � | � | 2,312 | �� | � | � | 16,125 | �� | � | � | ��� | �� | � | � | 19,029 | �� |
| Unrealized |
� | � | � | � | � | � | ||||||||||||||||||
| Carried Interest |
� | � | 93,434 | �� | � | � | 108,789 | �� | � | � | ��� | �� | � | � | (38,091 | )� | � | � | ��� | �� | � | � | 164,132 | �� |
| Incentive Fees |
� | � | ��� | �� | � | � | (123 | )� | � | � | 8,778 | �� | � | � | (17,657 | )� | � | � | ��� | �� | � | � | (9,002 | )� |
| � | � |
� |
� | � | � |
� |
� | � | � |
� |
� | � | � |
� |
� | � | � |
� |
� | � | � |
� |
� | |
| Total Compensation and Benefits |
� | � | 203,385 | �� | � | � | 264,031 | �� | � | � | 53,030 | �� | � | � | 106,126 | �� | � | � | 58,016 | �� | � | � | 684,588 | �� |
| Other Operating Expenses |
� | � | 34,109 | �� | � | � | 36,138 | �� | � | � | 20,480 | �� | � | � | 20,860 | �� | � | � | 19,853 | �� | � | � | 131,440 | �� |
| � | � |
� |
� | � | � |
� |
� | � | � |
� |
� | � | � |
� |
� | � | � |
� |
� | � | � |
� |
� | |
| Total Expenses |
� | � | 237,494 | �� | � | � | 300,169 | �� | � | � | 73,510 | �� | � | � | 126,986 | �� | � | � | 77,869 | �� | � | � | 816,028 | �� |
| � | � |
� |
� | � | � |
� |
� | � | � |
� |
� | � | � |
� |
� | � | � |
� |
� | � | � |
� |
� | |
| Economic Income |
� | $ | 150,432 | �� | � | $ | 493,228 | �� | � | $ | 84,181 | �� | � | $ | 100,520 | �� | � | $ | 9,514 | �� | � | $ | 837,875 | �� |
| � | � |
� |
� | � | � |
� |
� | � | � |
� |
� | � | � |
� |
� | � | � |
� |
� | � | � |
� |
� | |
�
53
Table of Contents
THE BLACKSTONE GROUP L.P.
Notes to Condensed Consolidated Financial Statements�Continued
(All Dollars Are in Thousands, Except Unit and Per Unit Data, Except Where Noted)
�
| � | �� | Three Months Ended September�30, 2013 | � | |||||||||||||||||||||
| � | �� | Private Equity |
� | � | Real�Estate | � | � | Hedge Fund Solutions |
� | � | Credit | � | � | Financial Advisory |
� | � | Total Segments |
� | ||||||
| Segment Revenues |
�� | � | � | � | � | � | ||||||||||||||||||
| Management and Advisory Fees, Net |
�� | � | � | � | � | � | ||||||||||||||||||
| Base Management Fees |
�� | $ | 95,281 | �� | � | $ | 136,721 | �� | � | $ | 103,392 | �� | � | $ | 101,900 | �� | � | $ | ��� | �� | � | $ | 437,294 | �� |
| Advisory Fees |
�� | � | ��� | �� | � | � | ��� | �� | � | � | ��� | �� | � | � | ��� | �� | � | � | 83,602 | �� | � | � | 83,602 | �� |
| Transaction and Other Fees, Net |
�� | � | 16,052 | �� | � | � | 19,205 | �� | � | � | 295 | �� | � | � | 7,058 | �� | � | � | 196 | �� | � | � | 42,806 | �� |
| Management Fee Offsets |
�� | � | (2,080 | )� | � | � | (2,385 | )� | � | � | (1,200 | )� | � | � | (2,606 | )� | � | � | ��� | �� | � | � | (8,271 | )� |
| �� | � |
� |
� | � | � |
� |
� | � | � |
� |
� | � | � |
� |
� | � | � |
� |
� | � | � |
� |
� | |
| Total Management and Advisory Fees, Net |
�� | � | 109,253 | �� | � | � | 153,541 | �� | � | � | 102,487 | �� | � | � | 106,352 | �� | � | � | 83,798 | �� | � | � | 555,431 | �� |
| �� | � |
� |
� | � | � |
� |
� | � | � |
� |
� | � | � |
� |
� | � | � |
� |
� | � | � |
� |
� | |
| Performance Fees |
�� | � | � | � | � | � | ||||||||||||||||||
| Realized |
�� | � | � | � | � | � | ||||||||||||||||||
| Carried Interest |
�� | � | 85,121 | �� | � | � | 93,878 | �� | � | � | ��� | �� | � | � | 3,655 | �� | � | � | ��� | �� | � | � | 182,654 | �� |
| Incentive Fees |
�� | � | ��� | �� | � | � | 3,737 | �� | � | � | 5,320 | �� | � | � | 22,181 | �� | � | � | ��� | �� | � | � | 31,238 | �� |
| Unrealized |
�� | � | � | � | � | � | ||||||||||||||||||
| Carried Interest |
�� | � | (86,300 | )� | � | � | 340,406 | �� | � | � | ��� | �� | � | � | 35,946 | �� | � | � | ��� | �� | � | � | 290,052 | �� |
| Incentive Fees |
�� | � | ��� | �� | � | � | 2,481 | �� | � | � | 29,208 | �� | � | � | 9,303 | �� | � | � | ��� | �� | � | � | 40,992 | �� |
| �� | � |
� |
� | � | � |
� |
� | � | � |
� |
� | � | � |
� |
� | � | � |
� |
� | � | � |
� |
� | |
| Total Performance Fees |
�� | � | (1,179 | )� | � | � | 440,502 | �� | � | � | 34,528 | �� | � | � | 71,085 | �� | � | � | ��� | �� | � | � | 544,936 | �� |
| �� | � |
� |
� | � | � |
� |
� | � | � |
� |
� | � | � |
� |
� | � | � |
� |
� | � | � |
� |
� | |
| Investment Income (Loss) |
�� | � | � | � | � | � | ||||||||||||||||||
| Realized |
�� | � | 11,495 | �� | � | � | 928 | �� | � | � | (598 | )� | � | � | 496 | �� | � | � | (829 | )� | � | � | 11,492 | �� |
| Unrealized |
�� | � | 23,621 | �� | � | � | 57,656 | �� | � | � | 6,439 | �� | � | � | (1,042 | )� | � | � | 1,006 | �� | � | � | 87,680 | �� |
| �� | � |
� |
� | � | � |
� |
� | � | � |
� |
� | � | � |
� |
� | � | � |
� |
� | � | � |
� |
� | |
| Total Investment Income (Loss) |
�� | � | 35,116 | �� | � | � | 58,584 | �� | � | � | 5,841 | �� | � | � | (546 | )� | � | � | 177 | �� | � | � | 99,172 | �� |
| Interest and Dividend Revenue |
�� | � | 5,231 | �� | � | � | 6,060 | �� | � | � | 2,523 | �� | � | � | 5,288 | �� | � | � | 2,437 | �� | � | � | 21,539 | �� |
| Other |
�� | � | 1,521 | �� | � | � | 2,113 | �� | � | � | 595 | �� | � | � | (357 | )� | � | � | 836 | �� | � | � | 4,708 | �� |
| �� | � |
� |
� | � | � |
� |
� | � | � |
� |
� | � | � |
� |
� | � | � |
� |
� | � | � |
� |
� | |
| Total Revenues |
�� | � | 149,942 | �� | � | � | 660,800 | �� | � | � | 145,974 | �� | � | � | 181,822 | �� | � | � | 87,248 | �� | � | � | 1,225,786 | �� |
| �� | � |
� |
� | � | � |
� |
� | � | � |
� |
� | � | � |
� |
� | � | � |
� |
� | � | � |
� |
� | |
| Expenses |
�� | � | � | � | � | � | ||||||||||||||||||
| Compensation and Benefits |
�� | � | � | � | � | � | ||||||||||||||||||
| Compensation |
�� | � | 55,800 | �� | � | � | 75,346 | �� | � | � | 37,611 | �� | � | � | 53,250 | �� | � | � | 57,491 | �� | � | � | 279,498 | �� |
| Performance Fee Compensation |
�� | � | � | � | � | � | ||||||||||||||||||
| Realized |
�� | � | � | � | � | � | ||||||||||||||||||
| Carried Interest |
�� | � | 19,824 | �� | � | � | 38,942 | �� | � | � | ��� | �� | � | � | 1,603 | �� | � | � | ��� | �� | � | � | 60,369 | �� |
| Incentive Fees |
�� | � | ��� | �� | � | � | 1,919 | �� | � | � | 1,954 | �� | � | � | 10,726 | �� | � | � | ��� | �� | � | � | 14,599 | �� |
| Unrealized |
�� | � | � | � | � | � | ||||||||||||||||||
| Carried Interest |
�� | � | (36,198 | )� | � | � | 99,323 | �� | � | � | ��� | �� | � | � | 19,216 | �� | � | � | ��� | �� | � | � | 82,341 | �� |
| Incentive Fees |
�� | � | ��� | �� | � | � | 615 | �� | � | � | 10,177 | �� | � | � | 292 | �� | � | � | ��� | �� | � | � | 11,084 | �� |
| �� | � |
� |
� | � | � |
� |
� | � | � |
� |
� | � | � |
� |
� | � | � |
� |
� | � | � |
� |
� | |
| Total Compensation and Benefits |
�� | � | 39,426 | �� | � | � | 216,145 | �� | � | � | 49,742 | �� | � | � | 85,087 | �� | � | � | 57,491 | �� | � | � | 447,891 | �� |
| Other Operating Expenses |
�� | � | 30,024 | �� | � | � | 30,614 | �� | � | � | 19,575 | �� | � | � | 23,451 | �� | � | � | 19,208 | �� | � | � | 122,872 | �� |
| �� | � |
� |
� | � | � |
� |
� | � | � |
� |
� | � | � |
� |
� | � | � |
� |
� | � | � |
� |
� | |
| Total Expenses |
�� | � | 69,450 | �� | � | � | 246,759 | �� | � | � | 69,317 | �� | � | � | 108,538 | �� | � | � | 76,699 | �� | � | � | 570,763 | �� |
| �� | � |
� |
� | � | � |
� |
� | � | � |
� |
� | � | � |
� |
� | � | � |
� |
� | � | � |
� |
� | |
| Economic Income |
�� | $ | 80,492 | �� | � | $ | 414,041 | �� | � | $ | 76,657 | �� | � | $ | 73,284 | �� | � | $ | 10,549 | �� | � | $ | 655,023 | �� |
| �� | � |
� |
� | � | � |
� |
� | � | � |
� |
� | � | � |
� |
� | � | � |
� |
� | � | � |
� |
� | |
�
54
Table of Contents
THE BLACKSTONE GROUP L.P.
Notes to Condensed Consolidated Financial Statements�Continued
(All Dollars Are in Thousands, Except Unit and Per Unit Data, Except Where Noted)
�
The following table reconciles the Total Segments to Blackstone�s Income Before Provision for Taxes for the three months ended September�30, 2014 and 2013:
�
| � | � | Three Months Ended September�30, 2014 | � | � | Three Months Ended September�30, 2013 | � | ||||||||||||||||||
| � | � | Total Segments |
� | � | Consolidation Adjustments and�Reconciling Items |
� | � | Blackstone Consolidated |
� | � | Total Segments |
� | � | Consolidation Adjustments and�Reconciling Items |
� | � | Blackstone Consolidated |
� | ||||||
| Revenues |
� | $ | 1,653,903 | �� | � | $ | 25,523 | (a)� | � | $ | 1,679,426 | �� | � | $ | 1,225,786 | �� | � | $ | (8,941 | )(a)� | � | $ | 1,216,845 | �� |
| Expenses |
� | $ | 816,028 | �� | � | $ | 239,110 | (b)� | � | $ | 1,055,138 | �� | � | $ | 570,763 | �� | � | $ | 215,642 | (b)� | � | $ | 786,405 | �� |
| Other Income |
� | $ | ��� | �� | � | $ | 8,682 | (c)� | � | $ | 8,682 | �� | � | $ | ��� | �� | � | $ | 87,952 | (c)� | � | $ | 87,952 | �� |
| Economic Income |
� | $ | 837,875 | �� | � | $ | (204,905 | )(d)� | � | $ | 632,970 | �� | � | $ | 655,023 | �� | � | $ | (136,631 | )(d)� | � | $ | 518,392 | �� |
�
| (a) | The Revenues adjustment represents management and performance fees earned from Blackstone Funds that were eliminated in consolidation to arrive at Blackstone consolidated revenues and non-segment related Investment Income, which is included in Blackstone consolidated revenues. |
| (b) | The Expenses adjustment represents the addition of expenses of the consolidated Blackstone Funds to the Blackstone unconsolidated expenses, amortization of intangibles and expenses related to transaction-related equity-based compensation to arrive at Blackstone consolidated expenses. |
| (c) | The Other Income adjustment results from the following: |
�
| � | �� | Three�Months�Ended�September�30, | � | |||||
| � | �� | ��������2014�������� | � | � | ��������2013�������� | � | ||
| Fund Management Fees and Performance Fees Eliminated in Consolidation and Transactional Investment Loss |
�� | $ | (25,613 | )� | � | $ | 6,321 | �� |
| Fund Expenses Added in Consolidation |
�� | � | 7,649 | �� | � | � | 7,679 | �� |
| Non-Controlling Interests in Income of Consolidated Entities |
�� | � | 32,163 | �� | � | � | 81,419 | �� |
| Transaction-Related Other Income |
�� | � | (5,517 | )� | � | � | (7,467 | )� |
| �� | � |
� |
� | � | � |
� |
� | |
| Total Consolidation Adjustments and Reconciling Items |
�� | $ | 8,682 | �� | � | $ | 87,952 | �� |
| �� | � |
� |
� | � | � |
� |
� | |
�
| (d) | The reconciliation of Economic Income to Income Before Provision for Taxes as reported in the Condensed Consolidated Statements of Operations consists of the following: |
�
| � | �� | Three�Months�Ended�September�30, | � | |||||
| � | �� | ��������2014�������� | � | � | ��������2013�������� | � | ||
| Economic Income |
�� | $ | 837,875 | �� | � | $ | 655,023 | �� |
| �� | � |
� |
� | � | � |
� |
� | |
| Adjustments |
�� | � | ||||||
| Amortization of Intangibles |
�� | � | (27,828 | )� | � | � | (27,525 | )� |
| IPO and Acquisition-Related Charges |
�� | � | (209,240 | )� | � | � | (190,525 | )� |
| Non-Controlling Interests in Income of Consolidated Entities |
�� | � | 32,163 | �� | � | � | 81,419 | �� |
| �� | � |
� |
� | � | � |
� |
� | |
| Total Consolidation Adjustments and Reconciling Items |
�� | � | (204,905 | )� | � | � | (136,631 | )� |
| �� | � |
� |
� | � | � |
� |
� | |
| Income Before Provision for Taxes |
�� | $ | 632,970 | �� | � | $ | 518,392 | �� |
| �� | � |
� |
� | � | � |
� |
� | |
�
55
Table of Contents
THE BLACKSTONE GROUP L.P.
Notes to Condensed Consolidated Financial Statements�Continued
(All Dollars Are in Thousands, Except Unit and Per Unit Data, Except Where Noted)
�
The following table presents the financial data for Blackstone�s segments as of and for the nine months ended September�30, 2014 and 2013:
�
| � | � | September�30, 2014 and the Nine Months Then Ended | � | |||||||||||||||||||||
| � | � | Private Equity |
� | � | Real Estate | � | � | Hedge�Fund Solutions |
� | � | Credit | � | � | Financial Advisory |
� | � | Total Segments |
� | ||||||
| Segment Revenues |
� | � | � | � | � | � | ||||||||||||||||||
| Management and Advisory Fees, Net |
� | � | � | � | � | � | ||||||||||||||||||
| Base Management Fees |
� | $ | 310,024 | �� | � | $ | 472,294 | �� | � | $ | 357,876 | �� | � | $ | 338,747 | �� | � | $ | ��� | �� | � | $ | 1,478,941 | �� |
| Advisory Fees |
� | � | ��� | �� | � | � | ��� | �� | � | � | ��� | �� | � | � | ��� | �� | � | � | 269,008 | �� | � | � | 269,008 | �� |
| Transaction and Other Fees, Net |
� | � | 119,459 | �� | � | � | 65,390 | �� | � | � | 380 | �� | � | � | 13,433 | �� | � | � | 1,329 | �� | � | � | 199,991 | �� |
| Management Fee Offsets |
� | � | (11,796 | )� | � | � | (25,903 | )� | � | � | (4,085 | )� | � | � | (17,841 | )� | � | � | ��� | �� | � | � | (59,625 | )� |
| � | � |
� |
� | � | � |
� |
� | � | � |
� |
� | � | � |
� |
� | � | � |
� |
� | � | � |
� |
� | |
| Total Management and Advisory Fees, Net |
� | � | 417,687 | �� | � | � | 511,781 | �� | � | � | 354,171 | �� | � | � | 334,339 | �� | � | � | 270,337 | �� | � | � | 1,888,315 | �� |
| � | � |
� |
� | � | � |
� |
� | � | � |
� |
� | � | � |
� |
� | � | � |
� |
� | � | � |
� |
� | |
| Performance Fees |
� | � | � | � | � | � | ||||||||||||||||||
| Realized |
� | � | � | � | � | � | ||||||||||||||||||
| Carried Interest |
� | � | 457,112 | �� | � | � | 961,721 | �� | � | � | ��� | �� | � | � | 195,201 | �� | � | � | ��� | �� | � | � | 1,614,034 | �� |
| Incentive Fees |
� | � | ��� | �� | � | � | 7,203 | �� | � | � | 54,501 | �� | � | � | 68,264 | �� | � | � | ��� | �� | � | � | 129,968 | �� |
| Unrealized |
� | � | � | � | � | � | ||||||||||||||||||
| Carried Interest |
� | � | 765,730 | �� | � | � | 446,873 | �� | � | � | ��� | �� | � | � | 423 | �� | � | � | ��� | �� | � | � | 1,213,026 | �� |
| Incentive Fees |
� | � | ��� | �� | � | � | (1,120 | )� | � | � | 74,114 | �� | � | � | 38,517 | �� | � | � | ��� | �� | � | � | 111,511 | �� |
| � | � |
� |
� | � | � |
� |
� | � | � |
� |
� | � | � |
� |
� | � | � |
� |
� | � | � |
� |
� | |
| Total Performance Fees |
� | � | 1,222,842 | �� | � | � | 1,414,677 | �� | � | � | 128,615 | �� | � | � | 302,405 | �� | � | � | ��� | �� | � | � | 3,068,539 | �� |
| � | � |
� |
� | � | � |
� |
� | � | � |
� |
� | � | � |
� |
� | � | � |
� |
� | � | � |
� |
� | |
| Investment Income (Loss) |
� | � | � | � | � | � | ||||||||||||||||||
| Realized |
� | � | 155,768 | �� | � | � | 203,194 | �� | � | � | 21,907 | �� | � | � | 8,334 | �� | � | � | 745 | �� | � | � | 389,948 | �� |
| Unrealized |
� | � | (4,125 | )� | � | � | (30,566 | )� | � | � | 4,320 | �� | � | � | 12,492 | �� | � | � | 1,135 | �� | � | � | (16,744 | )� |
| � | � |
� |
� | � | � |
� |
� | � | � |
� |
� | � | � |
� |
� | � | � |
� |
� | � | � |
� |
� | |
| Total Investment Income |
� | � | 151,643 | �� | � | � | 172,628 | �� | � | � | 26,227 | �� | � | � | 20,826 | �� | � | � | 1,880 | �� | � | � | 373,204 | �� |
| Interest and Dividend Revenue |
� | � | 15,240 | �� | � | � | 21,254 | �� | � | � | 7,725 | �� | � | � | 16,721 | �� | � | � | 7,101 | �� | � | � | 68,041 | �� |
| Other |
� | � | 3,578 | �� | � | � | 1,075 | �� | � | � | 659 | �� | � | � | (3,867 | )� | � | � | 137 | �� | � | � | 1,582 | �� |
| � | � |
� |
� | � | � |
� |
� | � | � |
� |
� | � | � |
� |
� | � | � |
� |
� | � | � |
� |
� | |
| Total Revenues |
� | � | 1,810,990 | �� | � | � | 2,121,415 | �� | � | � | 517,397 | �� | � | � | 670,424 | �� | � | � | 279,455 | �� | � | � | 5,399,681 | �� |
| � | � |
� |
� | � | � |
� |
� | � | � |
� |
� | � | � |
� |
� | � | � |
� |
� | � | � |
� |
� | |
| Expenses |
� | � | � | � | � | � | ||||||||||||||||||
| Compensation and Benefits |
� | � | � | � | � | � | ||||||||||||||||||
| Compensation |
� | � | 225,352 | �� | � | � | 256,401 | �� | � | � | 125,852 | �� | � | � | 156,939 | �� | � | � | 189,442 | �� | � | � | 953,986 | �� |
| Performance Fee Compensation |
� | � | � | � | � | � | ||||||||||||||||||
| Realized |
� | � | � | � | � | � | ||||||||||||||||||
| Carried Interest |
� | � | 229,435 | �� | � | � | 259,462 | �� | � | � | ��� | �� | � | � | 106,805 | �� | � | � | ��� | �� | � | � | 595,702 | �� |
| Incentive Fees |
� | � | ��� | �� | � | � | 3,657 | �� | � | � | 18,501 | �� | � | � | 39,015 | �� | � | � | ��� | �� | � | � | 61,173 | �� |
| Unrealized |
� | � | � | � | � | � | ||||||||||||||||||
| Carried Interest |
� | � | 132,480 | �� | � | � | 193,113 | �� | � | � | ��� | �� | � | � | (6,435 | )� | � | � | ��� | �� | � | � | 319,158 | �� |
| Incentive Fees |
� | � | ��� | �� | � | � | (524 | )� | � | � | 26,791 | �� | � | � | 12,954 | �� | � | � | ��� | �� | � | � | 39,221 | �� |
| � | � |
� |
� | � | � |
� |
� | � | � |
� |
� | � | � |
� |
� | � | � |
� |
� | � | � |
� |
� | |
| Total Compensation and Benefits |
� | � | 587,267 | �� | � | � | 712,109 | �� | � | � | 171,144 | �� | � | � | 309,278 | �� | � | � | 189,442 | �� | � | � | 1,969,240 | �� |
| Other Operating Expenses |
� | � | 106,308 | �� | � | � | 105,787 | �� | � | � | 65,061 | �� | � | � | 75,858 | �� | � | � | 63,311 | �� | � | � | 416,325 | �� |
| � | � |
� |
� | � | � |
� |
� | � | � |
� |
� | � | � |
� |
� | � | � |
� |
� | � | � |
� |
� | |
| Total Expenses |
� | � | 693,575 | �� | � | � | 817,896 | �� | � | � | 236,205 | �� | � | � | 385,136 | �� | � | � | 252,753 | �� | � | � | 2,385,565 | �� |
| � | � |
� |
� | � | � |
� |
� | � | � |
� |
� | � | � |
� |
� | � | � |
� |
� | � | � |
� |
� | |
| Economic Income |
� | $ | 1,117,415 | �� | � | $ | 1,303,519 | �� | � | $ | 281,192 | �� | � | $ | 285,288 | �� | � | $ | 26,702 | �� | � | $ | 3,014,116 | �� |
| � | � |
� |
� | � | � |
� |
� | � | � |
� |
� | � | � |
� |
� | � | � |
� |
� | � | � |
� |
� | |
| Segment Assets as of September�30, 2014 |
� | $ | 5,656,155 | �� | � | $ | 8,131,003 | �� | � | $ | 1,338,519 | �� | � | $ | 2,736,882 | �� | � | $ | 817,339 | �� | � | $ | 18,679,898 | �� |
| � | � |
� |
� | � | � |
� |
� | � | � |
� |
� | � | � |
� |
� | � | � |
� |
� | � | � |
� |
� | |
�
56
Table of Contents
THE BLACKSTONE GROUP L.P.
Notes to Condensed Consolidated Financial Statements�Continued
(All Dollars Are in Thousands, Except Unit and Per Unit Data, Except Where Noted)
�
| � | � | Nine Months Ended September�30, 2013 | � | |||||||||||||||||||||
| � | � | Private Equity |
� | � | Real Estate | � | � | Hedge�Fund Solutions |
� | � | Credit | � | � | Financial Advisory |
� | � | Total Segments |
� | ||||||
| Segment Revenues |
� | � | � | � | � | � | ||||||||||||||||||
| Management and Advisory Fees, Net |
� | � | � | � | � | � | ||||||||||||||||||
| Base Management Fees |
� | $ | 268,148 | �� | � | $ | 412,067 | �� | � | $ | 296,296 | �� | � | $ | 295,204 | �� | � | $ | ��� | �� | � | $ | 1,271,715 | �� |
| Advisory Fees |
� | � | ��� | �� | � | � | ��� | �� | � | � | ��� | �� | � | � | ��� | �� | � | � | 271,356 | �� | � | � | 271,356 | �� |
| Transaction and Other Fees, Net |
� | � | 78,853 | �� | � | � | 47,358 | �� | � | � | 360 | �� | � | � | 20,434 | �� | � | � | 239 | �� | � | � | 147,244 | �� |
| Management Fee Offsets |
� | � | (4,510 | )� | � | � | (15,983 | )� | � | � | (2,238 | )� | � | � | (5,737 | )� | � | � | ��� | �� | � | � | (28,468 | )� |
| � | � |
� |
� | � | � |
� |
� | � | � |
� |
� | � | � |
� |
� | � | � |
� |
� | � | � |
� |
� | |
| Total Management and Advisory Fees, Net |
� | � | 342,491 | �� | � | � | 443,442 | �� | � | � | 294,418 | �� | � | � | 309,901 | �� | � | � | 271,595 | �� | � | � | 1,661,847 | �� |
| � | � |
� |
� | � | � |
� |
� | � | � |
� |
� | � | � |
� |
� | � | � |
� |
� | � | � |
� |
� | |
| Performance Fees |
� | � | � | � | � | � | ||||||||||||||||||
| Realized |
� | � | � | � | � | � | ||||||||||||||||||
| Carried Interest |
� | � | 228,912 | �� | � | � | 306,132 | �� | � | � | ��� | �� | � | � | 125,068 | �� | � | � | ��� | �� | � | � | 660,112 | �� |
| Incentive Fees |
� | � | ��� | �� | � | � | 37,931 | �� | � | � | 32,874 | �� | � | � | 60,027 | �� | � | � | ��� | �� | � | � | 130,832 | �� |
| Unrealized |
� | � | � | � | � | � | ||||||||||||||||||
| Carried Interest |
� | � | 12,672 | �� | � | � | 880,454 | �� | � | � | ��� | �� | � | � | 30,979 | �� | � | � | ��� | �� | � | � | 924,105 | �� |
| Incentive Fees |
� | � | ��� | �� | � | � | (27,398 | )� | � | � | 105,698 | �� | � | � | 74,805 | �� | � | � | ��� | �� | � | � | 153,105 | �� |
| � | � |
� |
� | � | � |
� |
� | � | � |
� |
� | � | � |
� |
� | � | � |
� |
� | � | � |
� |
� | |
| Total Performance Fees |
� | � | 241,584 | �� | � | � | 1,197,119 | �� | � | � | 138,572 | �� | � | � | 290,879 | �� | � | � | ��� | �� | � | � | 1,868,154 | �� |
| � | � |
� |
� | � | � |
� |
� | � | � |
� |
� | � | � |
� |
� | � | � |
� |
� | � | � |
� |
� | |
| Investment Income (Loss) |
� | � | � | � | � | � | ||||||||||||||||||
| Realized |
� | � | 57,243 | �� | � | � | 29,039 | �� | � | � | 13,922 | �� | � | � | 4,725 | �� | � | � | (741 | )� | � | � | 104,188 | �� |
| Unrealized |
� | � | 76,420 | �� | � | � | 148,595 | �� | � | � | (1,702 | )� | � | � | 4,432 | �� | � | � | (871 | )� | � | � | 226,874 | �� |
| � | � |
� |
� | � | � |
� |
� | � | � |
� |
� | � | � |
� |
� | � | � |
� |
� | � | � |
� |
� | |
| Total Investment Income (Loss) |
� | � | 133,663 | �� | � | � | 177,634 | �� | � | � | 12,220 | �� | � | � | 9,157 | �� | � | � | (1,612 | )� | � | � | 331,062 | �� |
| Interest and Dividend Revenue |
� | � | 11,466 | �� | � | � | 14,754 | �� | � | � | 5,617 | �� | � | � | 13,906 | �� | � | � | 5,799 | �� | � | � | 51,542 | �� |
| Other |
� | � | 2,311 | �� | � | � | 1,706 | �� | � | � | 426 | �� | � | � | 408 | �� | � | � | 836 | �� | � | � | 5,687 | �� |
| � | � |
� |
� | � | � |
� |
� | � | � |
� |
� | � | � |
� |
� | � | � |
� |
� | � | � |
� |
� | |
| Total Revenues |
� | � | 731,515 | �� | � | � | 1,834,655 | �� | � | � | 451,253 | �� | � | � | 624,251 | �� | � | � | 276,618 | �� | � | � | 3,918,292 | �� |
| � | � |
� |
� | � | � |
� |
� | � | � |
� |
� | � | � |
� |
� | � | � |
� |
� | � | � |
� |
� | |
| Expenses |
� | � | � | � | � | � | ||||||||||||||||||
| Compensation and Benefits |
� | � | � | � | � | � | ||||||||||||||||||
| Compensation |
� | � | 179,750 | �� | � | � | 218,597 | �� | � | � | 108,323 | �� | � | � | 154,712 | �� | � | � | 191,570 | �� | � | � | 852,952 | �� |
| Performance Fee Compensation |
� | � | � | � | � | � | ||||||||||||||||||
| Realized |
� | � | � | � | � | � | ||||||||||||||||||
| Carried Interest |
� | � | 36,947 | �� | � | � | 119,810 | �� | � | � | ��� | �� | � | � | 68,959 | �� | � | � | ��� | �� | � | � | 225,716 | �� |
| Incentive Fees |
� | � | ��� | �� | � | � | 19,376 | �� | � | � | 12,092 | �� | � | � | 28,653 | �� | � | � | ��� | �� | � | � | 60,121 | �� |
| Unrealized |
� | � | � | � | � | � | ||||||||||||||||||
| Carried Interest |
� | � | 68,532 | �� | � | � | 266,984 | �� | � | � | ��� | �� | � | � | 15,121 | �� | � | � | ��� | �� | � | � | 350,637 | �� |
| Incentive Fees |
� | � | ��� | �� | � | � | (14,680 | )� | � | � | 37,679 | �� | � | � | 35,647 | �� | � | � | ��� | �� | � | � | 58,646 | �� |
| � | � |
� |
� | � | � |
� |
� | � | � |
� |
� | � | � |
� |
� | � | � |
� |
� | � | � |
� |
� | |
| Total Compensation and Benefits |
� | � | 285,229 | �� | � | � | 610,087 | �� | � | � | 158,094 | �� | � | � | 303,092 | �� | � | � | 191,570 | �� | � | � | 1,548,072 | �� |
| Other Operating Expenses |
� | � | 91,370 | �� | � | � | 86,693 | �� | � | � | 51,269 | �� | � | � | 67,374 | �� | � | � | 60,762 | �� | � | � | 357,468 | �� |
| � | � |
� |
� | � | � |
� |
� | � | � |
� |
� | � | � |
� |
� | � | � |
� |
� | � | � |
� |
� | |
| Total Expenses |
� | � | 376,599 | �� | � | � | 696,780 | �� | � | � | 209,363 | �� | � | � | 370,466 | �� | � | � | 252,332 | �� | � | � | 1,905,540 | �� |
| � | � |
� |
� | � | � |
� |
� | � | � |
� |
� | � | � |
� |
� | � | � |
� |
� | � | � |
� |
� | |
| Economic Income |
� | $ | 354,916 | �� | � | $ | 1,137,875 | �� | � | $ | 241,890 | �� | � | $ | 253,785 | �� | � | $ | 24,286 | �� | � | $ | 2,012,752 | �� |
| � | � |
� |
� | � | � |
� |
� | � | � |
� |
� | � | � |
� |
� | � | � |
� |
� | � | � |
� |
� | |
�
57
Table of Contents
THE BLACKSTONE GROUP L.P.
Notes to Condensed Consolidated Financial Statements�Continued
(All Dollars Are in Thousands, Except Unit and Per Unit Data, Except Where Noted)
�
The following table reconciles the Total Segments to Blackstone�s Income Before Provision for Taxes and Total Assets as of and for the nine months ended September�30, 2014 and 2013:
�
| � | � | September�30, 2014 and the Nine Months Then Ended |
� | � | Nine Months Ended September�30, 2013 | � | ||||||||||||||||||
| � | � | Total Segments |
� | � | Consolidation Adjustments and�Reconciling Items |
� | � | Blackstone Consolidated |
� | � | Total Segments |
� | � | Consolidation Adjustments and�Reconciling Items |
� | � | Blackstone Consolidated |
� | ||||||
| Revenues |
� | $ | 5,399,681 | �� | � | $ | 64,273 (a) | �� | � | $ | 5,463,954 | �� | � | $ | 3,918,292 | �� | � | $ | (14,504)(a) | �� | � | $ | 3,903,788 | �� |
| Expenses |
� | $ | 2,385,565 | �� | � | $ | 647,205 (b) | �� | � | $ | 3,032,770 | �� | � | $ | 1,905,540 | �� | � | $ | 630,728 (b) | �� | � | $ | 2,536,268 | �� |
| Other Income |
� | $ | ��� | �� | � | $ | 217,422 (c) | �� | � | $ | 217,422 | �� | � | $ | ��� | �� | � | $ | 196,128 (c) | �� | � | $ | 196,128 | �� |
| Economic Income |
� | $ | 3,014,116 | �� | � | $ | (365,510)(d) | �� | � | $ | 2,648,606 | �� | � | $ | 2,012,752 | �� | � | $ | (449,104)(d) | �� | � | $ | 1,563,648 | �� |
| Total Assets |
� | $ | 18,679,898 | �� | � | $ | 11,833,958(e) | �� | � | $ | 30,513,856 | �� | � | � | � | |||||||||
�
| (a) | The Revenues adjustment represents management and performance fees earned from Blackstone Funds that were eliminated in consolidation to arrive at Blackstone consolidated revenues and non-segment related Investment Income, which is included in Blackstone consolidated revenues. |
| (b) | The Expenses adjustment represents the addition of expenses of the consolidated Blackstone Funds to the Blackstone unconsolidated expenses, amortization of intangibles and expenses related to transaction-related equity-based compensation to arrive at Blackstone consolidated expenses. |
| (c) | The Other Income adjustment results from the following: |
�
| � | �� | Nine�Months�Ended�September�30, | � | |||||
| � | �� | ������2014������ | � | � | ������2013������ | � | ||
| Fund Management Fees and Performance Fees Eliminated in Consolidation and Transactional Investment Loss |
�� | $ | (64,531 | )� | � | $ | 11,455 | �� |
| Fund Expenses Added in Consolidation |
�� | � | 7,668 | �� | � | � | 21,703 | �� |
| Non-Controlling Interests in Income of Consolidated Entities |
�� | � | 284,463 | �� | � | � | 184,593 | �� |
| Transaction-Related Other Income |
�� | � | (10,178 | )� | � | � | (21,623 | )� |
| �� | � |
� |
� | � | � |
� |
� | |
| Total Consolidation Adjustments and Reconciling Items |
�� | $ | 217,422 | �� | � | $ | 196,128 | �� |
| �� | � |
� |
� | � | � |
� |
� | |
�
| (d) | The reconciliation of Economic Income to Income Before Provision for Taxes as reported in the Condensed Consolidated Statements of Operations consists of the following: |
�
| � | �� | Nine�Months�Ended�September�30, | � | |||||
| � | �� | ��������2014�������� | � | � | ��������2013�������� | � | ||
| Economic Income |
�� | $ | 3,014,116 | �� | � | $ | 2,012,752 | �� |
| �� | � |
� |
� | � | � |
� |
� | |
| Adjustments |
�� | � | ||||||
| Amortization of Intangibles |
�� | � | (85,141 | )� | � | � | (77,504 | )� |
| IPO and Acquisition-Related Charges |
�� | � | (564,832 | )� | � | � | (556,193 | )� |
| Non-Controlling Interests in Income of Consolidated Entities |
�� | � | 284,463 | �� | � | � | 184,593 | �� |
| �� | � |
� |
� | � | � |
� |
� | |
| Total Consolidation Adjustments and Reconciling Items |
�� | � | (365,510 | )� | � | � | (449,104 | )� |
| �� | � |
� |
� | � | � |
� |
� | |
| Income Before Provision for Taxes |
�� | $ | 2,648,606 | �� | � | $ | 1,563,648 | �� |
| �� | � |
� |
� | � | � |
� |
� | |
�
58
Table of Contents
THE BLACKSTONE GROUP L.P.
Notes to Condensed Consolidated Financial Statements�Continued
(All Dollars Are in Thousands, Except Unit and Per Unit Data, Except Where Noted)
�
| (e) | The Total Assets adjustment represents the addition of assets of the consolidated Blackstone Funds to the Blackstone unconsolidated assets to arrive at Blackstone consolidated assets. |
�
| 19. | SUBSEQUENT EVENTS |
There have been no events since September�30,�2014 that require recognition or disclosure in the Condensed Consolidated Financial Statements.
�
59
Table of Contents
| ITEM�1A. | UNAUDITED SUPPLEMENTAL PRESENTATION OF STATEMENTS OF FINANCIAL CONDITION |
THE BLACKSTONE GROUP L.P.
Unaudited Consolidating Statements of Financial Condition
(Dollars in Thousands)
�
| � | �� | September�30, 2014 | � | |||||||||||||
| � | �� | Consolidated Operating Partnerships |
� | � | Consolidated Blackstone Funds (a) |
� | �� | Reclasses and Eliminations |
� | � | Consolidated | � | ||||
| Assets |
�� | � | �� | � | ||||||||||||
| Cash and Cash Equivalents |
�� | $ | 943,519 | �� | � | $ | ��� | �� | �� | $ | ��� | �� | � | $ | 943,519 | �� |
| Cash Held by Blackstone Funds and Other |
�� | � | 226,080 | �� | � | � | 1,291,871 | �� | �� | � | ��� | �� | � | � | 1,517,951 | �� |
| Investments |
�� | � | 12,133,991 | �� | � | � | 11,078,729 | �� | �� | � | (1,091,567 | )� | � | � | 22,121,153 | �� |
| Accounts Receivable |
�� | � | 428,252 | �� | � | � | 508,296 | �� | �� | � | ��� | �� | � | � | 936,548 | �� |
| Reverse Repurchase Agreements |
�� | � | 93,538 | �� | � | � | ��� | �� | �� | � | ��� | �� | � | � | 93,538 | �� |
| Due from Affiliates |
�� | � | 1,030,854 | �� | � | � | 517,566 | �� | �� | � | (500,947 | )� | � | � | 1,047,473 | �� |
| Intangible Assets, Net |
�� | � | 483,839 | �� | � | � | ��� | �� | �� | � | ��� | �� | � | � | 483,839 | �� |
| Goodwill |
�� | � | 1,787,392 | �� | � | � | ��� | �� | �� | � | ��� | �� | � | � | 1,787,392 | �� |
| Other Assets |
�� | � | 330,926 | �� | � | � | 30,010 | �� | �� | � | ��� | �� | � | � | 360,936 | �� |
| Deferred Tax Assets |
�� | � | 1,221,507 | �� | � | � | ��� | �� | �� | � | ��� | �� | � | � | 1,221,507 | �� |
| �� | � |
� |
� | � | � |
� |
� | �� | � |
� |
� | � | � |
� |
� | |
| Total Assets |
�� | $ | 18,679,898 | �� | � | $ | 13,426,472 | �� | �� | $ | (1,592,514 | )� | � | $ | 30,513,856 | �� |
| �� | � |
� |
� | � | � |
� |
� | �� | � |
� |
� | � | � |
� |
� | |
| Liabilities and Partners� Capital |
�� | � | �� | � | ||||||||||||
| Loans Payable |
�� | $ | 2,152,219 | �� | � | $ | 5,662,158 | �� | �� | $ | ��� | �� | � | $ | 7,814,377 | �� |
| Due to Affiliates |
�� | � | 1,268,560 | �� | � | � | 936,179 | �� | �� | � | (877,508 | )� | � | � | 1,327,231 | �� |
| Accrued Compensation and Benefits |
�� | � | 2,621,595 | �� | � | � | ��� | �� | �� | � | ��� | �� | � | � | 2,621,595 | �� |
| Securities Sold, Not Yet Purchased |
�� | � | 92,967 | �� | � | � | 95,396 | �� | �� | � | ��� | �� | � | � | 188,363 | �� |
| Repurchase Agreements |
�� | � | 79,953 | �� | � | � | 42,396 | �� | �� | � | ��� | �� | � | � | 122,349 | �� |
| Accounts Payable, Accrued Expenses and Other Liabilities |
�� | � | 466,560 | �� | � | � | 1,582,194 | �� | �� | � | ��� | �� | � | � | 2,048,754 | �� |
| �� | � |
� |
� | � | � |
� |
� | �� | � |
� |
� | � | � |
� |
� | |
| Total Liabilities |
�� | � | 6,681,854 | �� | � | � | 8,318,323 | �� | �� | � | (877,508 | )� | � | � | 14,122,669 | �� |
| �� | � |
� |
� | � | � |
� |
� | �� | � |
� |
� | � | � |
� |
� | |
| Redeemable Non-Controlling Interests in Consolidated Entities |
�� | � | ��� | �� | � | � | 2,443,479 | �� | �� | � | ��� | �� | � | � | 2,443,479 | �� |
| �� | � |
� |
� | � | � |
� |
� | �� | � |
� |
� | � | � |
� |
� | |
| Partners� Capital |
�� | � | �� | � | ||||||||||||
| Partners� Capital |
�� | � | 6,588,059 | �� | � | � | 715,006 | �� | �� | � | (715,006 | )� | � | � | 6,588,059 | �� |
| Appropriated Partners� Capital |
�� | � | ��� | �� | � | � | 124,078 | �� | �� | � | ��� | �� | � | � | 124,078 | �� |
| Accumulated Other Comprehensive Income (Loss) |
�� | � | (10,880 | )� | � | � | 1,473 | �� | �� | � | ��� | �� | � | � | (9,407 | )� |
| Non-Controlling Interests in Consolidated Entities |
�� | � | 1,334,070 | �� | � | � | 1,824,113 | �� | �� | � | ��� | �� | � | � | 3,158,183 | �� |
| Non-Controlling Interests in Blackstone Holdings |
�� | � | 4,086,795 | �� | � | � | ��� | �� | �� | � | ��� | �� | � | � | 4,086,795 | �� |
| �� | � |
� |
� | � | � |
� |
� | �� | � |
� |
� | � | � |
� |
� | |
| Total Partners� Capital |
�� | � | 11,998,044 | �� | � | � | 2,664,670 | �� | �� | � | (715,006 | )� | � | � | 13,947,708 | �� |
| �� | � |
� |
� | � | � |
� |
� | �� | � |
� |
� | � | � |
� |
� | |
| Total Liabilities and Partners� Capital |
�� | $ | 18,679,898 | �� | � | $ | 13,426,472 | �� | �� | $ | (1,592,514 | )� | � | $ | 30,513,856 | �� |
| �� | � |
� |
� | � | � |
� |
� | �� | � |
� |
� | � | � |
� |
� | |
�
60
Table of Contents
THE BLACKSTONE GROUP L.P.
Unaudited Consolidating Statements of Financial Condition
(Dollars in Thousands)
�
| � | �� | December�31, 2013 | � | |||||||||||||
| � | �� | Consolidated Operating Partnerships |
� | �� | Consolidated Blackstone Funds (a) |
� | �� | Reclasses�and Eliminations |
� | � | Consolidated | � | ||||
| Assets |
�� | �� | �� | � | ||||||||||||
| Cash and Cash Equivalents |
�� | $ | 831,998 | �� | �� | $ | ��� | �� | �� | $ | ��� | �� | � | $ | 831,998 | �� |
| Cash Held by Blackstone Funds and Other |
�� | � | 251,554 | �� | �� | � | 794,328 | �� | �� | � | ��� | �� | � | � | 1,045,882 | �� |
| Investments |
�� | � | 9,739,140 | �� | �� | � | 12,493,961 | �� | �� | � | (503,578 | )� | � | � | 21,729,523 | �� |
| Accounts Receivable |
�� | � | 507,612 | �� | �� | � | 380,744 | �� | �� | � | ��� | �� | � | � | 888,356 | �� |
| Reverse Repurchase Agreements |
�� | � | 148,984 | �� | �� | � | ��� | �� | �� | � | ��� | �� | � | � | 148,984 | �� |
| Due from Affiliates |
�� | � | 1,138,002 | �� | �� | � | 108,131 | �� | �� | � | (54,089 | )� | � | � | 1,192,044 | �� |
| Intangible Assets, Net |
�� | � | 560,748 | �� | �� | � | ��� | �� | �� | � | ��� | �� | � | � | 560,748 | �� |
| Goodwill |
�� | � | 1,787,392 | �� | �� | � | ��� | �� | �� | � | ��� | �� | � | � | 1,787,392 | �� |
| Other Assets |
�� | � | 254,884 | �� | �� | � | 29,588 | �� | �� | � | ��� | �� | � | � | 284,472 | �� |
| Deferred Tax Assets |
�� | � | 1,209,207 | �� | �� | � | ��� | �� | �� | � | ��� | �� | � | � | 1,209,207 | �� |
| �� | � |
� |
� | �� | � |
� |
� | �� | � |
� |
� | � | � |
� |
� | |
| Total Assets |
�� | $ | 16,429,521 | �� | �� | $ | 13,806,752 | �� | �� | $ | (557,667 | )� | � | $ | 29,678,606 | �� |
| �� | � |
� |
� | �� | � |
� |
� | �� | � |
� |
� | � | � |
� |
� | |
| Liabilities and Partners� Capital |
�� | �� | �� | � | ||||||||||||
| Loans Payable |
�� | $ | 1,664,305 | �� | �� | $ | 8,802,199 | �� | �� | $ | ��� | �� | � | $ | 10,466,504 | �� |
| Due to Affiliates |
�� | � | 1,261,562 | �� | �� | � | 249,702 | �� | �� | � | (74,405 | )� | � | � | 1,436,859 | �� |
| Accrued Compensation and Benefits |
�� | � | 2,132,939 | �� | �� | � | ��� | �� | �� | � | ��� | �� | � | � | 2,132,939 | �� |
| Securities Sold, Not Yet Purchased |
�� | � | 76,195 | �� | �� | � | ��� | �� | �� | � | ��� | �� | � | � | 76,195 | �� |
| Repurchase Agreements |
�� | � | 316,352 | �� | �� | � | ��� | �� | �� | � | ��� | �� | � | � | 316,352 | �� |
| Accounts Payable, Accrued Expenses and Other Liabilities |
�� | � | 299,813 | �� | �� | � | 572,273 | �� | �� | � | ��� | �� | � | � | 872,086 | �� |
| �� | � |
� |
� | �� | � |
� |
� | �� | � |
� |
� | � | � |
� |
� | |
| Total Liabilities |
�� | � | 5,751,166 | �� | �� | � | 9,624,174 | �� | �� | � | (74,405 | )� | � | � | 15,300,935 | �� |
| �� | � |
� |
� | �� | � |
� |
� | �� | � |
� |
� | � | � |
� |
� | |
| Redeemable Non-Controlling Interests in Consolidated Entities |
�� | � | ��� | �� | �� | � | 1,950,442 | �� | �� | � | ��� | �� | � | � | 1,950,442 | �� |
| �� | � |
� |
� | �� | � |
� |
� | �� | � |
� |
� | � | � |
� |
� | |
| Partners� Capital |
�� | �� | �� | � | ||||||||||||
| Partners� Capital |
�� | � | 6,002,592 | �� | �� | � | 495,229 | �� | �� | � | (495,229 | )� | � | � | 6,002,592 | �� |
| Appropriated Partners� Capital |
�� | � | ��� | �� | �� | � | 300,708 | �� | �� | � | ��� | �� | � | � | 300,708 | �� |
| Accumulated Other Comprehensive Income |
�� | � | 1,230 | �� | �� | � | 2,236 | �� | �� | � | ��� | �� | � | � | 3,466 | �� |
| Non-Controlling Interests in Consolidated Entities |
�� | � | 1,018,117 | �� | �� | � | 1,433,963 | �� | �� | � | 11,967 | �� | � | � | 2,464,047 | �� |
| Non-Controlling Interests in Blackstone Holdings |
�� | � | 3,656,416 | �� | �� | � | ��� | �� | �� | � | ��� | �� | � | � | 3,656,416 | �� |
| �� | � |
� |
� | �� | � |
� |
� | �� | � |
� |
� | � | � |
� |
� | |
| Total Partners� Capital |
�� | � | 10,678,355 | �� | �� | � | 2,232,136 | �� | �� | � | (483,262 | )� | � | � | 12,427,229 | �� |
| �� | � |
� |
� | �� | � |
� |
� | �� | � |
� |
� | � | � |
� |
� | |
| Total Liabilities and Partners� Capital |
�� | $ | 16,429,521 | �� | �� | $ | 13,806,752 | �� | �� | $ | (557,667 | )� | � | $ | 29,678,606 | �� |
| �� | � |
� |
� | �� | � |
� |
� | �� | � |
� |
� | � | � |
� |
� | |
�
| (a) | The Consolidated Blackstone Funds consisted of the following: |
Blackstone Distressed Securities Fund L.P.
Blackstone Market Opportunities Fund L.P.
Blackstone Real Estate Partners VI.C � ESH L.P.*
Blackstone Real Estate Special Situations Fund L.P.*
Blackstone Real Estate Special Situations Offshore Fund Ltd.*
Blackstone Strategic Alliance Fund II L.P.
Blackstone Strategic Alliance Fund L.P.
Blackstone Strategic Capital Holdings B L.P.*
Blackstone Strategic Capital Holdings L.P.*
�
61
Table of Contents
Blackstone Strategic Equity Fund L.P.
Blackstone Value Recovery Fund L.P.
Blackstone/GSO Loan Financing Limited*
Blackstone/GSO Secured Trust Ltd.
BREP Edens Investment Partners L.P.
BSSF I AIV L.P.*
BTD CP Holdings, LP
GSO Legacy Associates II LLC
GSO Legacy Associates LLC
Shanghai Blackstone Equity Investment Partnership L.P.
Private equity side-by-side investment vehicles
Real estate side-by-side investment vehicles
Mezzanine side-by-side investment vehicles
Collateralized loan obligation vehicles
* Consolidated as of September�30,�2014 only.
�
| ITEM�2. | MANAGEMENT�S DISCUSSION AND ANALYSIS OF FINANCIAL CONDITION AND RESULTS OF OPERATIONS |
The following discussion and analysis should be read in conjunction with The Blackstone Group L.P.�s Condensed Consolidated Financial Statements and the related notes included in this Quarterly Report on Form 10-Q.
Our Business
Blackstone is one of the largest independent managers of private capital in the world. We also provide a wide range of financial advisory services, including financial advisory, restructuring and reorganization advisory and fund placement services.
Our business is organized into five business segments:
�
| � | � | � | Private Equity. We are a world leader in private equity investing, having managed six general private equity funds, as well as two sector focused funds, since we established this business in 1987. We refer to these managed corporate private equity funds collectively as our Blackstone Capital Partners (�BCP�) funds. We also manage the Blackstone Tactical Opportunities Accounts (�Tactical Opportunities�), which are multi-asset class investment accounts, and Strategic Partners Fund Solutions (�Strategic Partners�), a secondary private fund of funds business. Through our private equity funds we pursue transactions throughout the world, including leveraged buyout acquisitions of seasoned companies, transactions involving growth equity or start-up businesses in established industries, minority investments, corporate partnerships, distressed debt, structured securities and industry consolidations, in all cases in strictly friendly transactions. |
�
| � | � | � | Real Estate. We are a world leader in real estate investing since launching our first real estate fund in 1994. We have managed or continue to manage a number of global, European and Asian focused opportunistic real estate funds, several real estate debt investment funds, core plus real estate investments and a publicly traded real estate investment trust (�REIT�) (�BXMT�). Our real estate opportunity funds are diversified geographically and have made significant investments in lodging, major urban office buildings, shopping centers, residential and a variety of real estate operating companies. Our debt investment funds target high yield real estate debt related investment opportunities in the public and private markets, primarily in the United States and Europe. We refer to our real estate opportunistic funds as our Blackstone Real Estate Partners (�BREP�) funds and our real estate debt investment funds as our Blackstone Real Estate Debt Strategies (�BREDS�) funds. |
�
| � | � | � | Hedge Fund Solutions. Blackstone�s Hedge Fund Solutions segment is comprised principally of Blackstone Alternative Asset Management (�BAAM�). BAAM was organized in 1990 and has developed |
�
62
Table of Contents
| � | into a leading institutional solutions provider utilizing hedge funds across a wide variety of strategies. BAAM is the world�s largest discretionary allocator to hedge funds. |
�
| � | � | � | Credit. Our Credit segment is comprised principally of GSO Capital Partners LP (�GSO�), a global leader in managing credit-focused products within private debt and public market strategies. GSO�s products include senior credit-focused funds, distressed debt funds, mezzanine funds, general credit-focused funds, registered investment companies, separately managed accounts and collateralized loan obligation (�CLO�) vehicles. |
�
| � | � | � | Financial Advisory. Our Financial Advisory segment serves a diverse and global group of clients with financial and strategic advisory services, restructuring and reorganization advisory services, capital markets services and fund placement services for alternative investment funds. |
We generate revenue from fees earned pursuant to contractual arrangements with funds, fund investors and fund portfolio companies (including management, transaction and monitoring fees), and from financial and strategic advisory, restructuring and reorganization advisory, capital markets services and fund placement services for alternative investment funds. We invest in the funds we manage and, in most cases, receive a preferred allocation of income (i.e., a carried interest) or an incentive fee from an investment fund in the event that specified cumulative investment returns are achieved (generally collectively referred to as �Performance Fees�). The composition of our revenues will vary based on market conditions and the cyclicality of the different businesses in which we operate. Net investment gains and investment income generated by the Blackstone Funds, principally private equity and real estate funds, are driven by value created by our operating and strategic initiatives as well as overall market conditions. Fair values are affected by changes in the fundamentals of the portfolio company, the portfolio company�s industry, the overall economy and other market conditions.
Business Environment
Blackstone�s businesses are materially affected by conditions in the financial markets and economic conditions in the U.S., Europe, Asia and, to a lesser extent, elsewhere in the world.
Global equity and debt markets were generally mixed in the third quarter of 2014. The MSCI All Country Index declined 3.5%, although equity indices were quite mixed across regions, as well as both developed and emerging markets. In the U.S., the S&P 500 reached an all-time record high in September amid continued improvement in economic growth and employment data. However, volatility increased and markets declined late in the quarter as global growth concerns, heightened geopolitical risks and uncertainty over central bank monetary policy increasingly weighed on investor sentiment.
Credit indices were lower in the third quarter, with the high yield and leveraged loan index down 1.9% and 0.3%, respectively, and high yield spreads widening by approximately 80 basis points. The U.S. dollar strengthened against most major currencies. Capital markets activity was mixed with debt issuance weaker while equity activity increased compared to the prior year. Mergers and acquisitions activity continued to show strength, rising significantly in the quarter.
Real estate operating fundamentals remain positive, driven by the continued lack of new supply and growth in demand. In the U.S., overall vacancy levels have declined 100 basis points to 14.1% and 20 basis points to 10.3% within the office and retail sectors, respectively compared to the third quarter of 2013. In the U.S. hospitality sector, new construction remains significantly below historical levels and supply/demand fundamentals continue to support RevPAR (�Revenue per Available Room�) growth of 9.2% for the quarter. On a national level, home prices have increased 5.6% over the past twelve months through August 2014.
Significant Transaction
On October�10, 2014, Blackstone announced that its Board of Directors had approved a plan to spin off its financial and strategic advisory services, restructuring and reorganization advisory services, and its Park Hill fund
�
63
Table of Contents
placement businesses and combine these businesses with PJT Partners, an independent financial advisory firm founded by Paul J. Taubman. Blackstone�s capital markets business will not be part of the transaction, and will be retained by Blackstone. The parties expect the transaction to close in 2015. The new entity will be an independent, publicly traded company, which will be led by Mr.�Taubman as Chairman and Chief Executive Officer. The transaction is intended to be tax-free to Blackstone and Blackstone�s unitholders.
Organizational Structure
The simplified diagram below depicts our current organizational structure. The diagram does not depict all of our subsidiaries, including intermediate holding companies through which certain of the subsidiaries depicted are held.
�
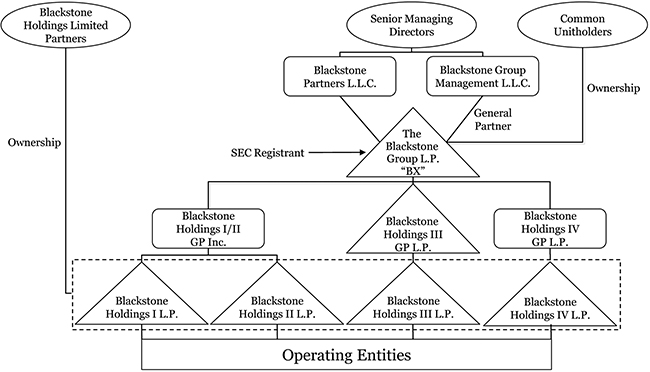
Key Financial Measures and Indicators
We manage our business using traditional financial measures and key operating metrics since we believe these metrics measure the productivity of our investment activities. Our key financial measures and indicators are discussed below.
Revenues
Revenues primarily consist of management and advisory fees, performance fees, investment income, interest and dividend revenue and other. Please refer to �Part I. Item�1. Business � Incentive Arrangements / Fee Structure� and �Part I. Item�7. Management�s Discussion and Analysis of Financial Condition and Results of Operations � Critical Accounting Policies � Revenue Recognition� in our 2013 Annual Report on Form 10-K for additional information regarding the manner in which Base Management Fees and Performance Fees are generated.
Management and Advisory Fees, Net � Management and Advisory Fees, Net are comprised of management fees, including base management fees, transaction and other fees, advisory fees and management fee reductions and offsets.
�
64
Table of Contents
The Partnership earns base management fees from limited partners of funds in each of its managed funds, at a fixed percentage of assets under management, net asset value, total assets, committed capital or invested capital, or in some cases, a fixed fee. Base management fees are recognized based on contractual terms specified in the underlying investment advisory agreements.
Transaction and other fees (including monitoring fees) are fees charged directly to managed funds and portfolio companies. The investment advisory agreements generally require that the investment adviser reduce the amount of management fees payable by the limited partners to the Partnership (�management fee reductions�) by an amount equal to a portion of the transaction and other fees directly paid to the Partnership by the portfolio companies. The amount of the reduction varies by fund, the type of fee paid by the portfolio company and the previously incurred expenses of the fund.
Management fee offsets are reductions to management fees payable by our limited partners, which are granted based on the amount they reimburse Blackstone for placement fees.
Advisory fees consist of advisory retainer and transaction-based fee arrangements related to financial and strategic advisory services, restructuring and reorganization advisory services, capital markets services and fund placement services for alternative investment funds. Advisory retainer fees are recognized when services for the transactions are complete, in accordance with terms set forth in individual agreements. Transaction-based fees are recognized when (a)�there is evidence of an arrangement with a client, (b)�agreed upon services have been provided, (c)�fees are fixed or determinable, and (d)�collection is reasonably assured. Fund placement fees are recognized as earned upon the acceptance by a fund of capital or capital commitments.
Accrued but unpaid Management and Advisory Fees, net of management fee reductions and management fee offsets, as of the reporting date, are included in Accounts Receivable or Due from Affiliates in the Condensed Consolidated Statements of Financial Condition. Management fees paid by limited partners to the Blackstone Funds and passed on to Blackstone are not considered affiliate revenues.
Performance Fees � Performance Fees earned on the performance of Blackstone�s hedge fund structures (�Incentive Fees�) are recognized based on fund performance during the period, subject to the achievement of minimum return levels, or high water marks, in accordance with the respective terms set out in each hedge fund�s governing agreements. Accrued but unpaid Incentive Fees charged directly to investors in Blackstone�s offshore hedge funds as of the reporting date are recorded within Due from Affiliates in the Condensed Consolidated Statements of Financial Condition. Accrued but unpaid Incentive Fees on onshore funds as of the reporting date are reflected in Investments in the Condensed Consolidated Statements of Financial Condition. Incentive Fees are realized at the end of a measurement period, typically annually. Once realized, such fees are not subject to clawback or reversal.
In certain fund structures, specifically in private equity, real estate and certain Hedge Fund Solutions and credit-focused funds (�Carry Funds�), performance fees (�Carried Interest�) are allocated to the general partner based on cumulative fund performance to date, subject to a preferred return to limited partners. At the end of each reporting period, the Partnership calculates the Carried Interest that would be due to the Partnership for each fund, pursuant to the fund agreements, as if the fair value of the underlying investments were realized as of such date, irrespective of whether such amounts have been realized. As the fair value of underlying investments varies between reporting periods, it is necessary to make adjustments to amounts recorded as Carried Interest to reflect either (a)�positive performance resulting in an increase in the Carried Interest allocated to the general partner or (b)�negative performance that would cause the amount due to the Partnership to be less than the amount previously recognized as revenue, resulting in a negative adjustment to Carried Interest allocated to the general partner. In each scenario, it is necessary to calculate the Carried Interest on cumulative results compared to the Carried Interest recorded to date and make the required positive or negative adjustments. The Partnership ceases to record negative Carried Interest allocations once previously recognized Carried Interest allocations for such fund have been fully
�
65
Table of Contents
reversed. The Partnership is not obligated to pay guaranteed returns or hurdles, and therefore, cannot have negative Carried Interest over the life of a fund. Accrued but unpaid Carried Interest as of the reporting date is reflected in Investments in the Condensed Consolidated Statements of Financial Condition.
Carried Interest is realized when an underlying investment is profitably disposed of and the fund�s cumulative returns are in excess of the preferred return or, in limited instances, after certain thresholds for return of capital are met. Carried Interest is subject to clawback to the extent that the Carried Interest received to date exceeds the amount due to Blackstone based on cumulative results. As such, the accrual for potential repayment of previously received Carried Interest, which is a component of Due to Affiliates, represents all amounts previously distributed to Blackstone Holdings and non-controlling interest holders that would need to be repaid to the Blackstone Funds if the Blackstone Carry Funds were to be liquidated based on the current fair value of the underlying funds� investments as of the reporting date. The actual clawback liability, however, generally does not become realized until the end of a fund�s life except for certain Blackstone real estate funds, multi-asset class investment funds and credit-focused funds, which may have an interim clawback liability.
Investment Income (Loss) � Investment Income (Loss) represents the unrealized and realized gains and losses on the Partnership�s principal investments, including its investments in Blackstone Funds that are not consolidated, its equity method investments and other principal investments. Investment Income (Loss) is realized when the Partnership redeems all or a portion of its investment or when the Partnership receives cash income, such as dividends or distributions. Unrealized Investment Income (Loss) results from changes in the fair value of the underlying investment as well as the reversal of unrealized gain (loss) at the time an investment is realized.
Interest and Dividend Revenue � Interest and Dividend Revenue comprises primarily interest and dividend income earned on principal investments held by Blackstone.
Other Revenue � Other Revenue consists of miscellaneous income and foreign exchange gains and losses arising on transactions denominated in currencies other than U.S. dollars.
Expenses
Compensation and Benefits � Compensation � Compensation and Benefits consists of (a)�employee compensation, comprising salary and bonus, and benefits paid and payable to employees and senior managing directors and (b)�equity-based compensation associated with the grants of equity-based awards to employees and senior managing directors. Compensation cost relating to the issuance of equity-based awards to senior managing directors and employees is measured at fair value at the grant date, taking into consideration expected forfeitures, and expensed over the vesting period on a straight-line basis. Equity-based awards that do not require future service are expensed immediately. Cash settled equity-based awards are classified as liabilities and are remeasured at the end of each reporting period.
Compensation and Benefits � Performance Fee � Performance Fee Compensation consists of Carried Interest and Incentive Fee allocations, and may in future periods also include allocations of investment income from Blackstone�s firm investments, to employees and senior managing directors participating in certain profit sharing initiatives. Such compensation expense is subject to both positive and negative adjustments. Unlike Carried Interest and Incentive Fees, compensation expense is based on the performance of individual investments held by a fund rather than on a fund by fund basis. Compensation received from advisory clients in the form of securities of such clients may also be allocated to employees and senior managing directors.
Other Operating Expenses � Other Operating Expenses represents general and administrative expenses including interest expense, occupancy and equipment expenses and other expenses, which consist principally of professional fees, public company costs, travel and related expenses, communications and information services and depreciation and amortization.
�
66
Table of Contents
Fund Expenses � The expenses of our consolidated Blackstone Funds consist primarily of interest expense, professional fees and other third party expenses.
Non-Controlling Interests in Consolidated Entities
Non-Controlling Interests in Consolidated Entities represent the component of Partners� Capital in consolidated Blackstone Funds held by third party investors and employees. The percentage interests held by third parties and employees is adjusted for general partner allocations and by subscriptions and redemptions in funds of hedge funds and certain credit-focused funds which occur during the reporting period. In addition, all non-controlling interests in consolidated Blackstone Funds are attributed a share of income (loss) arising from the respective funds and a share of other comprehensive income, if applicable. Income (Loss) is allocated to non-controlling interests in consolidated entities based on the relative ownership interests of third party investors and employees after considering any contractual arrangements that govern the allocation of income (loss) such as fees allocable to The Blackstone Group L.P.
Redeemable Non-Controlling Interests in Consolidated Entities
Non-controlling interests related to funds of hedge funds and certain other credit-focused funds are subject to annual, semi-annual or quarterly redemption by investors in these funds following the expiration of a specified period of time (typically between one and three years), or may be withdrawn subject to a redemption fee in the funds of hedge funds and certain credit-focused funds during the period when capital may not be withdrawn. As limited partners in these types of funds have been granted redemption rights, amounts relating to third party interests in such consolidated funds are presented as Redeemable Non-Controlling Interests in Consolidated Entities within the Condensed Consolidated Statements of Financial Condition. When redeemable amounts become legally payable to investors, they are classified as a liability and included in Accounts Payable, Accrued Expenses and Other Liabilities in the Condensed Consolidated Statements of Financial Condition. For all consolidated funds in which redemption rights have not been granted, non-controlling interests are presented within Partners� Capital in the Condensed Consolidated Statements of Financial Condition as Non-Controlling Interests in Consolidated Entities.
Non-Controlling Interests in Blackstone Holdings
Non-Controlling Interests in Blackstone Holdings represent the component of Partners� Capital in the consolidated Blackstone Holdings Partnerships held by Blackstone personnel and others who are limited partners of the Blackstone Holdings Partnerships.
Certain costs and expenses are borne directly by the Holdings Partnerships. Income (Loss), excluding those costs directly borne by and attributable to the Holdings Partnerships, is attributable to Non-Controlling Interests in Blackstone Holdings. This residual attribution is based on the year to date average percentage of Blackstone Holdings Partnership Units held by Blackstone personnel and others who are limited partners of the Blackstone Holdings Partnerships.
Income Taxes
The Blackstone Holdings Partnerships and certain of their subsidiaries operate in the U.S. as partnerships for U.S. federal income tax purposes and generally as corporate entities in non-U.S. jurisdictions. Accordingly, these entities in some cases are subject to New York City unincorporated business taxes or non-U.S. income taxes. In addition, certain of the wholly owned subsidiaries of the Partnership and the Blackstone Holdings Partnerships will be subject to federal, state and local corporate income taxes at the entity level and the related tax provision attributable to the Partnership�s share of this income tax is reflected in the Condensed Consolidated Financial Statements.
Income taxes are accounted for using the asset and liability method of accounting. Under this method, deferred tax assets and liabilities are recognized for the expected future tax consequences of differences between the carrying
�
67
Table of Contents
amounts of assets and liabilities and their respective tax basis, using tax rates in effect for the year in which the differences are expected to reverse. The effect on deferred assets and liabilities of a change in tax rates is recognized in income in the period when the change is enacted. Deferred tax assets are reduced by a valuation allowance when it is more likely than not that some portion or all of the deferred tax assets will not be realized. Current and deferred tax liabilities are recorded within Accounts Payable, Accrued Expenses and Other Liabilities in the Condensed Consolidated Statements of Financial Condition.
Blackstone uses the flow-through method to account for investment tax credits. Under this method, the investment tax credits are recognized as a reduction to income tax expense.
Blackstone analyzes its tax filing positions in all of the U.S. federal, state, local and foreign tax jurisdictions where it is required to file income tax returns, as well as for all open tax years in these jurisdictions. Blackstone records uncertain tax positions on the basis of a two-step process: (a)�determination is made whether it is more likely than not that the tax positions will be sustained based on the technical merits of the position and (b)�those tax positions that meet the more-likely-than-not threshold are recognized as the largest amount of tax benefit that is greater than 50 percent likely to be realized upon ultimate settlement with the related tax authority. Blackstone recognizes accrued interest and penalties related to uncertain tax positions in General, Administrative and Other expenses within the Condensed Consolidated Statements of Operations.
There remains some uncertainty regarding Blackstone�s future taxation levels. Over the past several years, a number of legislative and administrative proposals to change the taxation of Carried Interest have been introduced and, in certain cases, have been passed by the U.S. House of Representatives that would have, in general, treated income and gains, including gain on sale, attributable to an investment services partnership interest, or �ISPI�, as income subject to a new blended tax rate that is higher than the capital gains rate applicable to such income under current law, except to the extent such ISPI would have been considered under the legislation to be a qualified capital interest. Our common units and the interests that we hold in entities that are entitled to receive Carried Interest would likely have been classified as ISPIs for purposes of this legislation. It is unclear whether or when the U.S. Congress will pass such legislation or what provisions will be included in any final legislation if enacted.
The most recent legislative proposals provided that, for taxable years beginning ten years after the date of enactment, income derived with respect to an ISPI that is not a qualified capital interest and that is subject to the foregoing rules would not meet the qualifying income requirements under the publicly traded partnership rules. Therefore, if similar legislation were to be enacted, following such ten-year period, we would be precluded from qualifying as a partnership for U.S. federal income tax purposes or be required to hold all such ISPIs through corporations.
The Obama administration has proposed to Congress similar changes that would tax income and gain, including gain on sale, attributable to an ISPI at ordinary rates, with an exception for certain qualified capital interests. The proposals would also characterize certain income and gain in respect of ISPIs as non-qualifying income under the tax rules applicable to publicly traded partnerships after a ten-year transition period from the effective date, with an exception for certain qualified capital interests. In its published revenue proposals for 2015, as well as for prior years, the Obama administration proposed similar changes.
Earlier this year, Representative Dave Camp, Chairman of the House Ways and Means Committee, released a discussion draft of proposed legislation that would introduce major changes to the U.S. federal income tax system (the �2014 Camp Proposal�). It would, among other things (a)�generally treat publicly traded partnerships (other than those deriving 90 percent of their income from activities relating to mining and natural resources) as taxable corporations for tax years beginning after 2016 and (b)�recharacterize a portion of capital gain from certain partnership interests held in connection with the performance of services as ordinary income for tax years beginning after 2014.
States and other jurisdictions have also considered legislation to increase taxes with respect to Carried Interest. For example, in 2010, the New York State Assembly passed a bill, which could have caused a non-resident of New
�
68
Table of Contents
York who holds our common units to be subject to New York state income tax on carried interest earned by entities in which we hold an indirect interest, thereby requiring the non-resident to file a New York state income tax return reporting such carried interest income. This legislation would have been retroactive to January�1, 2010. It is unclear whether or when similar legislation will be enacted. Finally, several state and local jurisdictions are evaluating ways to subject partnerships to entity level taxation through the imposition of state or local income, franchise or other forms of taxation or to increase the amount of such taxation.
If we were taxed as a corporation or were forced to hold interests in entities earning income from Carried Interest through taxable subsidiary corporations, our effective tax rate could increase significantly. The federal statutory rate for corporations is currently 35%, and the state and local tax rates, net of the federal benefit, aggregate approximately 5%. If a variation of the above described legislation or any other change in the tax laws, rules, regulations or interpretations preclude us from qualifying for treatment as a partnership for U.S. federal income tax purposes under the publicly traded partnership rules or force us to hold interests in entities earning income from Carried Interest through taxable subsidiary corporations, this could materially increase our tax liability, and could well result in a reduction in the market price of our common units.
It is not possible at this time to meaningfully quantify the potential impact on Blackstone of this potential future legislation or any similar legislation. Multiple versions of legislation in this area have been proposed over the last few years that have included significantly different provisions regarding effective dates and the treatment of invested capital, tiered entities and cross-border operations, among other matters. Depending upon what version of the legislation, if any, were enacted, the potential impact on a public company such as Blackstone in a given year could differ dramatically and could be material. In addition, many of these legislative proposals would not themselves impose a tax on a publicly traded partnership such as Blackstone. Rather, they could force Blackstone and other publicly traded partnerships to restructure their operations so as to prevent disqualifying income from reaching the publicly traded partnership in amounts that would disqualify the partnership from treatment as a partnership for U.S. federal income tax purposes. Such a restructuring could result in more income being earned in corporate subsidiaries, thereby increasing corporate income tax liability indirectly borne by the publicly traded partnership. In addition, we, and our common unitholders, could be taxed on any such restructuring. The nature of any such restructuring would depend on the precise provisions of the legislation that was ultimately enacted, as well as the particular facts and circumstances of Blackstone�s operations at the time any such legislation were to take effect, making the task of predicting the amount of additional tax highly speculative.
The Obama administration has announced other proposals for potential reform to the U.S. federal income tax rules for businesses, including reducing the deductibility of interest for corporations, reducing the top marginal rate on corporations and subjecting entities currently treated as partnerships for tax purposes to an entity level income tax similar to the corporate income tax. Several proposals for reform if enacted could adversely affect us. It is unclear what any actual legislation would provide, when it would be proposed or what its prospects for enactment would be.
The 2014 Camp Proposal, in addition to the proposed changes discussed above relating to publicly traded partnerships and carried interest, includes proposed provisions for the migration of the United States from a �worldwide� system of taxation, pursuant to which U.S. corporations are taxed on their worldwide income, to a territorial system where U.S. corporations are taxed only on their U.S. source income (subject to certain exceptions for income derived in low-tax jurisdictions from the exploitation of tangible assets) at a top corporate tax rate that would be 25%. The 2014 Camp Proposal includes numerous revenue raisers to offset the reduction in the tax rate and base which may or may not be detrimental to us, including changes to the rules for depreciating or amortizing assets, including goodwill, and changes to rules affecting real estate investment trusts, partnerships and tax-exempt entities. Senator Baucus recently proposed a similar territorial U.S. tax system, but with more expansive U.S. taxation of the foreign profits of non-U.S. subsidiaries of U.S. corporations. The Baucus proposal would also eliminate the withholding tax exemption on portfolio interest debt obligations for investors residing in non-treaty jurisdictions. Whether these proposals will be enacted by the government and in what form is unknown, as are the ultimate consequences of the proposed legislation.
�
69
Table of Contents
Economic Income
Blackstone uses Economic Income (�EI�) as a key measure of value creation, a benchmark of its performance and in making resource deployment and compensation decisions across its five segments. EI represents segment net income before taxes excluding transaction-related charges. Transaction-related charges arise from Blackstone�s initial public offering (�IPO�) and long-term retention programs outside of annual deferred compensation and other corporate actions, including acquisitions. Transaction-related charges include equity-based compensation charges, the amortization of intangible assets and contingent consideration associated with acquisitions. EI presents revenues and expenses on a basis that deconsolidates the investment funds we manage. Economic Net Income (�ENI�) represents EI adjusted to include current period taxes. Taxes represent the current tax provision (benefit) calculated on Income (Loss) Before Provision for Taxes. EI, our principal segment measure, is derived from and reconciled to, but not equivalent to, its most directly comparable GAAP measure of Income (Loss) Before Provision for Taxes. (See Note 18. �Segment Reporting� in the �Notes to Condensed Consolidated Financial Statements� in Part I. Item�1. Financial Statements.)
Fee Related Earnings
Blackstone uses Fee Related Earnings (�FRE�), which is derived from EI, as a measure to highlight earnings from operations excluding: (a)�the income related to performance fees and related performance fee compensation costs, (b)�income earned from Blackstone�s investments in the Blackstone Funds, and (c)�realized and unrealized gains (losses) from other investments except for such gains (losses) from Blackstone�s Treasury Cash Management Strategies. Management uses FRE as a measure to assess whether recurring revenue from our businesses is sufficient to adequately cover all of our operating expenses and generate profits. FRE equals contractual fee revenues, investment income from Blackstone�s Treasury Cash Management Strategies and interest income, less (a)�compensation expenses (which includes amortization of non-IPO and non-acquisition-related equity-based awards, but excludes amortization of IPO and acquisition-related equity-based awards, Carried Interest and incentive fee compensation) and (b)�other operating expenses. See �� Liquidity and Capital Resources � Sources of Liquidity� below for our discussion of Fee Related Earnings.
Distributable Earnings
Distributable Earnings, which is derived from our segment reported results, is a supplemental measure to assess performance and amounts available for distributions to Blackstone unitholders, including Blackstone personnel and others who are limited partners of the Blackstone Holdings Partnerships. Distributable Earnings, which is a measure not prepared under accounting principles generally accepted in the United States of America (a �non-GAAP� measure), is intended to show the amount of net realized earnings without the effects of the consolidation of the Blackstone Funds. Distributable Earnings is derived from and reconciled to, but not equivalent to, its most directly comparable GAAP measure of Income (Loss) Before Provision for Taxes. See �� Liquidity and Capital Resources � Sources of Liquidity� below for our discussion of Distributable Earnings.
Distributable Earnings, which is a component of Economic Net Income, is the sum across all segments of: (a)�Total Management and Advisory Fees, (b)�Interest and Dividend Revenue, (c)�Other Revenue, (d)�Realized Performance Fees, and (e)�Realized Investment Income (Loss); less (a)�Compensation, excluding the expense of equity-based awards, (b)�Realized Performance Fee Compensation, (c)�Other Operating Expenses, and (d)�Taxes and Payables Under the Tax Receivable Agreement.
Adjusted Earnings Before Interest, Taxes and Depreciation and Amortization
Adjusted Earnings Before Interest, Taxes and Depreciation and Amortization (�Adjusted EBITDA�), is a supplemental non-GAAP measure derived from our segment reported results and may be used to assess our ability to service our borrowings. Adjusted EBITDA represents Distributable Earnings plus the addition of (a)�Interest Expense, (b)�Taxes and Related Payables Including Payable Under Tax Receivable Agreement, and (c)�Depreciation and Amortization. See �� Liquidity and Capital Resources � Sources of Liquidity� below for our calculation of Adjusted EBITDA.
�
70
Table of Contents
Summary Walkdown of GAAP to Non-GAAP Financial Metrics
The relationship of our GAAP to non-GAAP financial measures is presented in the summary walkdown below. The summary walkdown shows how each non-GAAP financial measure is related to the other non-GAAP financial measures. This presentation is not meant to be a detailed calculation of each measure, but to show the relationship between the measures. For the calculation of each of these non-GAAP financial measures and a full reconciliation of Income Before Provision for Taxes to Distributable Earnings, please see �� Liquidity and Capital Resources � Sources of Liquidity.�
�
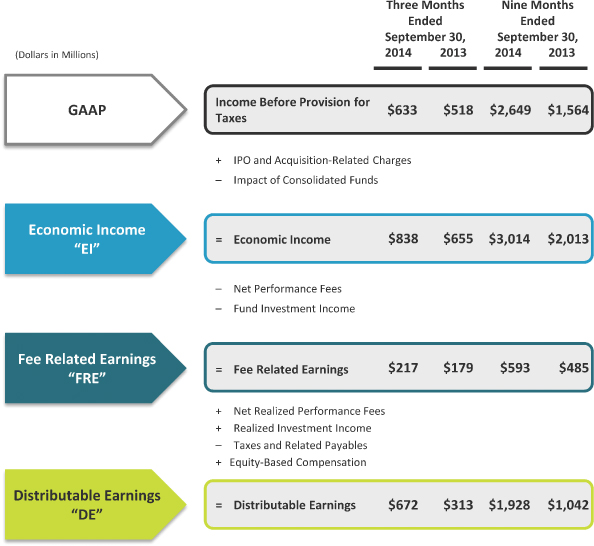
Operating Metrics
The alternative asset management business is a complex business that is primarily based on managing third party capital and does not require substantial capital investment to support rapid growth. However, there also can be volatility associated with its earnings and cash flows. Since our inception, we have developed and used various key operating metrics to assess and monitor the operating performance of our various alternative asset management businesses in order to monitor the effectiveness of our value creating strategies.
�
71
Table of Contents
Assets Under Management. Assets Under Management refers to the assets we manage. Our Assets Under Management equals the sum of:
�
| � | (a) | the fair value of the investments held by our carry funds and our side-by-side and co-investment entities managed by us, plus the capital that we are entitled to call from investors in those funds and entities pursuant to the terms of their respective capital commitments, including capital commitments to funds that have yet to commence their investment periods, |
�
| � | (b) | the net asset value of our funds of hedge funds, hedge funds and certain registered investment companies, |
�
| � | (c) | the invested capital or fair value of assets we manage pursuant to separately managed accounts, |
�
| � | (d) | the amount of debt and equity outstanding for our CLOs and collateralized debt obligations (�CDOs�) during the reinvestment period, |
�
| � | (e) | the aggregate par amount of collateral assets, including principal cash, for our CLOs and CDOs after the reinvestment period, |
�
| � | (f) | the gross amount of assets (including leverage) for certain of our credit-focused registered investment companies, and |
�
| � | (g) | the fair value of common stock, preferred stock, convertible debt, or similar instruments issued by our public REIT. |
Our carry funds are commitment-based drawdown structured funds that do not permit investors to redeem their interests at their election. Our funds of hedge funds and hedge funds generally have structures that afford an investor the right to withdraw or redeem their interests on a periodic basis (for example, annually or quarterly), in most cases upon advance written notice, with the majority of our funds requiring from 60 days up to 95 days� notice, depending on the fund and the liquidity profile of the underlying assets. Investment advisory agreements related to separately managed accounts may generally be terminated by an investor on 30 to 90 days� notice.
Fee-Earning Assets Under Management. Fee-Earning Assets Under Management refers to the assets we manage on which we derive management and/or performance fees. Our Fee-Earning Assets Under Management equals the sum�of:
�
| � | (a) | for our Private Equity segment funds and Real Estate segment carry funds including certain real estate debt investment funds and certain of our Hedge Fund Solutions funds, the amount of capital commitments, remaining invested capital, fair value or par value of assets held, depending on the fee terms of the fund, |
�
| � | (b) | for our credit-focused carry funds, the amount of remaining invested capital (which may include leverage) or net asset value, depending on the fee terms of the fund, |
�
| � | (c) | the remaining invested capital of co-investments managed by us on which we receive fees, |
�
| � | (d) | the net asset value of our funds of hedge funds, hedge funds and certain registered investment companies, |
�
| � | (e) | the invested capital or fair value of assets we manage pursuant to separately managed accounts, |
�
| � | (f) | the net proceeds received from equity offerings and accumulated core earnings of our REITs, subject to certain adjustments, |
�
| � | (g) | the aggregate par amount of collateral assets, including principal cash, of our CLOs and CDOs, and |
�
| � | (h) | the gross amount of assets (including leverage) for certain of our credit-focused registered investment companies. |
Our calculations of assets under management and fee-earning assets under management may differ from the calculations of other asset managers, and as a result this measure may not be comparable to similar measures presented by other asset managers. In addition, our calculation of assets under management includes commitments
�
72
Table of Contents
to, and the fair value of, invested capital in our funds from Blackstone and our personnel, regardless of whether such commitments or invested capital are subject to fees. Our definitions of assets under management or fee-earning assets under management are not based on any definition of assets under management or fee-earning assets under management that is set forth in the agreements governing the investment funds that we manage.
For our carry funds, total assets under management includes the fair value of the investments held, whereas fee-earning assets under management includes the amount of capital commitments, the remaining amount of invested capital at cost depending on whether the investment period has or has not expired or the fee terms of the fund. As such, fee-earning assets under management may be greater than total assets under management when the aggregate fair value of the remaining investments is less than the cost of those investments.
Limited Partner Capital Invested. Limited Partner Capital Invested represents the amount of Limited Partner capital commitments which were invested by our carry and drawdown funds during each period presented, plus the capital invested through co-investments arranged by us that were made by limited partners in investments of our carry funds on which we receive fees or a Carried Interest allocation or Incentive Fee.
The amount of committed undrawn capital available for investment, including general partner and employee commitments, is known as dry powder and is an indicator of the capital we have available for future investments.
Consolidated Results of Operations
Following is a discussion of our consolidated results of operations for the three and nine months ended September�30, 2014 and 2013. For a more detailed discussion of the factors that affected the results of our five business segments (which are presented on a basis that deconsolidates the investment funds we manage) in these periods, see �� Segment Analysis� below.
�
73
Table of Contents
The following tables set forth information regarding our consolidated results of operations and certain key operating metrics for the three and nine months ended September�30, 2014 and 2013:
�
| � | � | Three Months Ended September�30, |
� | � | 2014 vs. 2013 | � | � | Nine Months Ended September�30, |
� | � | 2014 vs. 2013 | � | ||||||||||||||||||||
| � | � | 2014 | � | � | 2013 | � | � | $ | � | � | % | � | � | 2014 | � | � | 2013 | � | � | $ | � | � | % | � | ||||||||
| � | � | (Dollars in Thousands) | � | |||||||||||||||||||||||||||||
| Revenues |
� | � | � | � | � | � | � | � | ||||||||||||||||||||||||
| Management and Advisory Fees, Net |
� | $ | 640,949 | �� | � | $ | 531,095 | �� | � | $ | 109,854 | �� | � | � | 21 | %� | � | $ | 1,833,632 | �� | � | $ | 1,591,951 | �� | � | $ | 241,681 | �� | � | � | 15 | %� |
| � | � |
� |
� | � | � |
� |
� | � | � |
� |
� | � | � |
� |
� | � | � |
� |
� | � | � |
� |
� | � | � |
� |
� | � | � |
� |
� | |
| Performance Fees |
� | � | � | � | � | � | � | � | ||||||||||||||||||||||||
| Realized |
� | � | � | � | � | � | � | � | ||||||||||||||||||||||||
| Carried Interest |
� | � | 638,676 | �� | � | � | 182,654 | �� | � | � | 456,022 | �� | � | � | 250 | %� | � | � | 1,613,958 | �� | � | � | 660,112 | �� | � | � | 953,846 | �� | � | � | 144 | %� |
| Incentive Fees |
� | � | 35,445 | �� | � | � | 30,884 | �� | � | � | 4,561 | �� | � | � | 15 | %� | � | � | 118,743 | �� | � | � | 130,729 | �� | � | � | (11,986 | )� | � | � | -9 | %� |
| Unrealized |
� | � | � | � | � | � | � | � | ||||||||||||||||||||||||
| Carried Interest |
� | � | 222,105 | �� | � | � | 290,052 | �� | � | � | (67,947 | )� | � | � | -23 | %� | � | � | 1,213,181 | �� | � | � | 924,105 | �� | � | � | 289,076 | �� | � | � | 31 | %� |
| Incentive Fees |
� | � | (6,163 | )� | � | � | 37,713 | �� | � | � | (43,876 | )� | � | � | N/M | �� | � | � | 112,709 | �� | � | � | 144,449 | �� | � | � | (31,740 | )� | � | � | -22 | %� |
| � | � |
� |
� | � | � |
� |
� | � | � |
� |
� | � | � |
� |
� | � | � |
� |
� | � | � |
� |
� | � | � |
� |
� | � | � |
� |
� | |
| Total Performance Fees |
� | � | 890,063 | �� | � | � | 541,303 | �� | � | � | 348,760 | �� | � | � | 64 | %� | � | � | 3,058,591 | �� | � | � | 1,859,395 | �� | � | � | 1,199,196 | �� | � | � | 64 | %� |
| � | � |
� |
� | � | � |
� |
� | � | � |
� |
� | � | � |
� |
� | � | � |
� |
� | � | � |
� |
� | � | � |
� |
� | � | � |
� |
� | |
| Investment Income |
� | � | � | � | � | � | � | � | ||||||||||||||||||||||||
| Realized |
� | � | 91,142 | �� | � | � | 19,507 | �� | � | � | 71,635 | �� | � | � | 367 | %� | � | � | 459,878 | �� | � | � | 137,350 | �� | � | � | 322,528 | �� | � | � | 235 | %� |
| Unrealized |
� | � | 38,445 | �� | � | � | 100,341 | �� | � | � | (61,896 | )� | � | � | -62 | %� | � | � | 62,754 | �� | � | � | 263,141 | �� | � | � | (200,387 | )� | � | � | -76 | %� |
| � | � |
� |
� | � | � |
� |
� | � | � |
� |
� | � | � |
� |
� | � | � |
� |
� | � | � |
� |
� | � | � |
� |
� | � | � |
� |
� | |
| Total Investment Income |
� | � | 129,587 | �� | � | � | 119,848 | �� | � | � | 9,739 | �� | � | � | 8 | %� | � | � | 522,632 | �� | � | � | 400,491 | �� | � | � | 122,141 | �� | � | � | 30 | %� |
| � | � |
� |
� | � | � |
� |
� | � | � |
� |
� | � | � |
� |
� | � | � |
� |
� | � | � |
� |
� | � | � |
� |
� | � | � |
� |
� | |
| Interest and Dividend Revenue |
� | � | 18,107 | �� | � | � | 19,892 | �� | � | � | (1,785 | )� | � | � | -9 | %� | � | � | 47,516 | �� | � | � | 46,263 | �� | � | � | 1,253 | �� | � | � | 3 | %� |
| Other |
� | � | 720 | �� | � | � | 4,707 | �� | � | � | (3,987 | )� | � | � | -85 | %� | � | � | 1,583 | �� | � | � | 5,688 | �� | � | � | (4,105 | )� | � | � | -72 | %� |
| � | � |
� |
� | � | � |
� |
� | � | � |
� |
� | � | � |
� |
� | � | � |
� |
� | � | � |
� |
� | � | � |
� |
� | � | � |
� |
� | |
| Total Revenues |
� | � | 1,679,426 | �� | � | � | 1,216,845 | �� | � | � | 462,581 | �� | � | � | 38 | %� | � | � | 5,463,954 | �� | � | � | 3,903,788 | �� | � | � | 1,560,166 | �� | � | � | 40 | %� |
| � | � |
� |
� | � | � |
� |
� | � | � |
� |
� | � | � |
� |
� | � | � |
� |
� | � | � |
� |
� | � | � |
� |
� | � | � |
� |
� | |
| Expenses |
� | � | � | � | � | � | � | � | ||||||||||||||||||||||||
| Compensation and Benefits Compensation |
� | � | 525,093 | �� | � | � | 465,631 | �� | � | � | 59,462 | �� | � | � | 13 | %� | � | � | 1,511,085 | �� | � | � | 1,396,042 | �� | � | � | 115,043 | �� | � | � | 8 | %� |
| Performance Fee Compensation |
� | � | � | � | � | � | � | � | ||||||||||||||||||||||||
| Realized |
� | � | � | � | � | � | � | � | ||||||||||||||||||||||||
| Carried Interest |
� | � | 186,003 | �� | � | � | 60,369 | �� | � | � | 125,634 | �� | � | � | 208 | %� | � | � | 595,702 | �� | � | � | 225,716 | �� | � | � | 369,986 | �� | � | � | 164 | %� |
| Incentive Fees |
� | � | 19,029 | �� | � | � | 14,599 | �� | � | � | 4,430 | �� | � | � | 30 | %� | � | � | 61,173 | �� | � | � | 60,121 | �� | � | � | 1,052 | �� | � | � | 2 | %� |
| Unrealized |
� | � | � | � | � | � | � | � | ||||||||||||||||||||||||
| Carried Interest |
� | � | 164,132 | �� | � | � | 82,341 | �� | � | � | 81,791 | �� | � | � | 99 | %� | � | � | 319,158 | �� | � | � | 350,637 | �� | � | � | (31,479 | )� | � | � | -9 | %� |
| Incentive Fees |
� | � | (9,002 | )� | � | � | 11,084 | �� | � | � | (20,086 | )� | � | � | N/M | �� | � | � | 39,221 | �� | � | � | 58,646 | �� | � | � | (19,425 | )� | � | � | -33 | %� |
| � | � |
� |
� | � | � |
� |
� | � | � |
� |
� | � | � |
� |
� | � | � |
� |
� | � | � |
� |
� | � | � |
� |
� | � | � |
� |
� | |
| Total Compensation and Benefits |
� | � | 885,255 | �� | � | � | 634,024 | �� | � | � | 251,231 | �� | � | � | 40 | %� | � | � | 2,526,339 | �� | � | � | 2,091,162 | �� | � | � | 435,177 | �� | � | � | 21 | %� |
| General, Administrative and Other |
� | � | 128,015 | �� | � | � | 119,435 | �� | � | � | 8,580 | �� | � | � | 7 | %� | � | � | 400,061 | �� | � | � | 346,106 | �� | � | � | 53,955 | �� | � | � | 16 | %� |
| Interest Expense |
� | � | 31,615 | �� | � | � | 26,268 | �� | � | � | 5,347 | �� | � | � | 20 | %� | � | � | 86,129 | �� | � | � | 80,286 | �� | � | � | 5,843 | �� | � | � | 7 | %� |
| Fund Expenses |
� | � | 10,253 | �� | � | � | 6,678 | �� | � | � | 3,575 | �� | � | � | 54 | %� | � | � | 20,241 | �� | � | � | 18,714 | �� | � | � | 1,527 | �� | � | � | 8 | %� |
| � | � |
� |
� | � | � |
� |
� | � | � |
� |
� | � | � |
� |
� | � | � |
� |
� | � | � |
� |
� | � | � |
� |
� | � | � |
� |
� | |
| Total Expenses |
� | � | 1,055,138 | �� | � | � | 786,405 | �� | � | � | 268,733 | �� | � | � | 34 | %� | � | � | 3,032,770 | �� | � | � | 2,536,268 | �� | � | � | 496,502 | �� | � | � | 20 | %� |
| � | � |
� |
� | � | � |
� |
� | � | � |
� |
� | � | � |
� |
� | � | � |
� |
� | � | � |
� |
� | � | � |
� |
� | � | � |
� |
� | |
| Other Income |
� | � | � | � | � | � | � | � | ||||||||||||||||||||||||
| Net Gains from Fund Investment Activities |
� | � | 8,682 | �� | � | � | 87,952 | �� | � | � | (79,270 | )� | � | � | -90 | %� | � | � | 217,422 | �� | � | � | 196,128 | �� | � | � | 21,294 | �� | � | � | 11 | %� |
| � | � |
� |
� | � | � |
� |
� | � | � |
� |
� | � | � |
� |
� | � | � |
� |
� | � | � |
� |
� | � | � |
� |
� | � | � |
� |
� | |
| Income Before Provision for Taxes |
� | � | 632,970 | �� | � | � | 518,392 | �� | � | � | 114,578 | �� | � | � | 22 | %� | � | � | 2,648,606 | �� | � | � | 1,563,648 | �� | � | � | 1,084,958 | �� | � | � | 69 | %� |
| Provision for Taxes |
� | � | 79,108 | �� | � | � | 57,477 | �� | � | � | 21,631 | �� | � | � | 38 | %� | � | � | 216,487 | �� | � | � | 164,552 | �� | � | � | 51,935 | �� | � | � | 32 | %� |
| � | � |
� |
� | � | � |
� |
� | � | � |
� |
� | � | � |
� |
� | � | � |
� |
� | � | � |
� |
� | � | � |
� |
� | � | � |
� |
� | |
| Net Income |
� | � | 553,862 | �� | � | � | 460,915 | �� | � | � | 92,947 | �� | � | � | 20 | %� | � | � | 2,432,119 | �� | � | � | 1,399,096 | �� | � | � | 1,033,023 | �� | � | � | 74 | %� |
| Net Income (Loss) Attributable to Redeemable Non-Controlling Interests in Consolidated Entities |
� | � | (23,328 | )� | � | � | 51,188 | �� | � | � | (74,516 | )� | � | � | N/M | �� | � | � | 44,950 | �� | � | � | 135,870 | �� | � | � | (90,920 | )� | � | � | -67 | %� |
| Net Income Attributable to Non-Controlling Interests in Consolidated Entities |
� | � | 55,491 | �� | � | � | 30,231 | �� | � | � | 25,260 | �� | � | � | 84 | %� | � | � | 239,513 | �� | � | � | 48,723 | �� | � | � | 190,790 | �� | � | � | 392 | %� |
| Net Income Attributable to Non-Controlling Interests in Blackstone Holdings |
� | � | 271,194 | �� | � | � | 208,332 | �� | � | � | 62,862 | �� | � | � | 30 | %� | � | � | 1,114,518 | �� | � | � | 664,556 | �� | � | � | 449,962 | �� | � | � | 68 | %� |
| � | � |
� |
� | � | � |
� |
� | � | � |
� |
� | � | � |
� |
� | � | � |
� |
� | � | � |
� |
� | � | � |
� |
� | � | � |
� |
� | |
| Net Income Attributable to The Blackstone Group L.P. |
� | $ | 250,505 | �� | � | $ | 171,164 | �� | � | $ | 79,341 | �� | � | � | 46 | %� | � | $ | 1,033,138 | �� | � | $ | 549,947 | �� | � | $ | 483,191 | �� | � | � | 88 | %� |
| � | � |
� |
� | � | � |
� |
� | � | � |
� |
� | � | � |
� |
� | � | � |
� |
� | � | � |
� |
� | � | � |
� |
� | � | � |
� |
� | |
�
| N/M����Not | meaningful. |
�
74
Table of Contents
Revenues
Total Revenues were $1.7�billion for the three months ended September�30, 2014, an increase of $462.6�million compared to Total Revenues for the three months ended September�30, 2013 of $1.2�billion. The increase in revenues was primarily attributable to increases in Performance Fees and Management and Advisory Fees, Net of $348.8�million and $109.9�million, respectively.
The increase in Performance Fees was primarily attributable to increases in our Private Equity and Real Estate segments. The increase in our Private Equity segment was primarily driven by BCP V and BCP VI, each generating net returns of 4%. These returns were driven mainly by the respective funds� public holdings, including the completion of initial public offerings in Catalent, Travelport and Vivint�s solar business, and private holdings in the services, retail/consumer and hospitality/leisure sectors. The increase in Performance Fees in our Real Estate segment was primarily due to the increase in the net appreciation of investments from our BREP carry funds. For the three months ended September�30, 2014, the carrying value of assets for Blackstone�s contributed Real Estate funds, including fee-paying co-investments, increased 6.2% driven by appreciation in the private portfolio (7.1%, $2.6 billion) from sustained strong operating fundamentals and public portfolio appreciation (4.3%, $802.2 million).
The increase in Management and Advisory Fees, Net was due to increases in our Private Equity, Real Estate and Hedge Fund Solutions segments. The increase in our Private Equity segment was primarily driven by an increase in Transaction and Other Fees as a result of several new portfolio investments that closed during the three months ended September�30, 2014 and an increase in Base Management Fees, primarily due to Strategic Partners secondary private fund of funds business and the increase in funds raised for our Tactical Opportunities investment vehicles. The increase in our Real Estate segment was principally due to fees generated from fundraising within BREP Europe IV, BREP Asia, Core+ and BREDS, partially offset by the expiration of BREP V and realizations across the portfolio, as well as an increase in one-time arrangement fees on completed transactions. The increase in our Hedge Fund Solutions segment was principally due to a 22% increase in Fee-Earning Assets Under Management from the prior year.
Total Revenues were $5.5�billion for the nine months ended September�30, 2014, an increase of $1.6�billion compared to Total Revenues for the nine months ended September�30, 2013 of $3.9�billion. The increase in revenues was primarily attributable to increases of $1.2�billion in Performance Fees, $241.7�million in Management and Advisory Fees, Net and $122.1�million in Investment Income.
The increase in Performance Fees was primarily attributable to increases in our Private Equity and Real Estate segments. The increase in our Private Equity segment was principally driven mainly by BCP V and BCP VI which generated net returns of 18% and 22%, respectively for the nine months ended September�30, 2014. BCP V crossed its preferred return threshold and is now fully generating performance fees. The performance of the funds was a result of the strong performance of both our public holdings, including the initial public offerings of Michaels Stores, Catalent, Travelport and Vivint�s solar business and private holdings in the services, healthcare and energy sectors. The increase in our Real Estate segment was primarily due to the increase in the net appreciation of investments from our BREP carry funds. For the nine months ended September�30, 2014, the carrying value of assets for Blackstone�s contributed Real Estate funds, including fee-paying co-investments, increased 15.3% driven by sustained strong operating fundamentals in the private portfolio (17.5%, $6.2�billion) and public portfolio appreciation (11.7%, $2.5�billion). Our BREDS drawdown and real estate hedge funds appreciated 5.8% and 6.7%, respectively.
The increase in Management and Advisory Fees, Net was principally due to increases in our Hedge Fund Solutions, Real Estate and Private Equity segments. The increase in our Hedge Fund Solutions segment was principally due to a 22% increase in Fee-Earning Assets Under Management from the prior year. The increase in our Real Estate segment was principally due to fees generated from fundraising within BREP Europe IV, BREP Asia, Core+ and BREDS, partially offset by the expiration of BREP V and realizations across the portfolio. The increase
�
75
Table of Contents
in our Private Equity segment was principally due to the addition of the Strategic Partners secondary private fund of funds business that closed during 2013, the increase in funds raised for our Tactical Opportunities investment vehicles and an increase in Transaction and Other Fees as a result of several new portfolio investments that closed during the nine months ended September�30, 2014.
The increase in Investment Income was primarily attributable to increases in our Private Equity, Hedge Fund Solutions and Credit segments. The increase in our Private Equity segment was principally due to the performance described above. The increase in our Hedge Fund Solutions segment was principally due to the year over year increase in the net appreciation of investments of which Blackstone owns a share. The increase in our Credit segment was principally due to a greater rate of appreciation in our significant drawdown funds and CLOs in which we hold an equity position.
Expenses
Expenses were $1.1�billion for the three months ended September�30, 2014, an increase of $268.7�million compared to $786.4�million for the three months ended September�30, 2013. The increase was primarily attributable to an increase of $251.2�million in Total Compensation and Benefits, which was comprised of an increase in Performance Fee Compensation of $191.8�million due to the increase in Performance Fees Revenue and an increase of $59.5�million in Compensation primarily due to an overall increase in revenue, on which a portion of compensation is based, as well as an increase in headcount to support the growth of the business.
Expenses were $3.0�billion for the nine months ended September�30, 2014, an increase of $496.5�million compared to $2.5�billion for the nine months ended September�30, 2013. The increase was primarily attributable to increases in Total Compensation and Benefits of $435.2�million and General, Administrative and Other of $54.0�million. The increase in Total Compensation and Benefits was comprised of a $320.1�million increase in Performance Fee Compensation due to the increase in Performance Fees Revenue and a $115.0�million increase in Compensation primarily due to an overall increase in revenue, on which a portion of compensation is based, as well as an increase in headcount to support the growth of the business. General, Administrative and Other expenses were $400.1�million for the nine months ended September�30, 2014, an increase of $54.0�million, driven primarily by a non-recurring placement fee expense in our Credit segment and overall increases in occupancy and professional expenses.
Other Income (Loss)
Other Income (Loss) � Net Gains (Losses) from Fund Investment Activities is attributable to the consolidated Blackstone Funds which are largely held by third party investors. As such, most of this Other Income (Loss) is eliminated from the results attributable to The Blackstone Group L.P. through the redeemable non-controlling interests and non-controlling interests items in the Condensed Consolidated Statements of Operations.
Other Income � Net Gains from Fund Investment Activities was $8.7�million for the three months ended September�30, 2014, a decrease of $79.3�million compared to $88.0�million for the three months ended September�30, 2013. The change was principally driven by a decrease in our Hedge Fund Solutions and Credit segments offset by an increase in our Real Estate segment.
Other Income � Net Gains from Fund Investment Activities was $217.4�million for the nine months ended September�30, 2014, an increase of $21.3�million compared to $196.1�million for the nine months ended September�30, 2013. The change was principally driven by increases in our Credit and Real Estate segments offset by a decrease in our Hedge Fund Solutions segment.
Provision for Taxes
Blackstone�s Provision for Taxes for the three months ended September�30, 2014 and 2013 was $79.1�million and $57.5�million, respectively. This resulted in an effective tax rate of 12.5% and 11.1%, respectively, based on our
�
76
Table of Contents
Income Before Provision for Taxes of $633.0�million and $518.4�million, respectively. Two factors contributed to the 1.4% increase in the effective tax rate for the three months ended September�30, 2014 compared to the three months ended September�30, 2013. First, pre-tax book income includes pre-tax income of $476�million and $461�million for three months ended September�30, 2014 and three months ended September�30, 2013, respectively, that was passed through to common unitholders and non-controlling interest holders and was not taxable to the Partnership and its subsidiaries. The change in these amounts resulted in a 4.8% increase in the effective tax rate between the respective three month periods.
Second, in both the three months ended September�30, 2014 and the three months ended September�30, 2013, book equity-based compensation expense exceeded the tax deductible equity-based compensation expense due to the issuance of units that were not tax deductible since they represented a value for value exchange for tax purposes. Although the amount of the excess book expense over the tax expense did not change significantly for the three months ended September�30, 2014 and the three months ended September�30, 2013, the effective tax rates increased by 1.0% and 2.9%, respectively. The change in these amounts resulted in a 1.9% decrease in the effective tax rate between the respective three month periods.
Blackstone�s Provision for Taxes for the nine months ended September�30, 2014 and 2013 was $216.5�million and $164.6�million, respectively. This resulted in an effective tax rate of 8.2% and 10.5%, respectively, based on our Income Before Provision for Taxes of $2.6�billion and $1.6�billion, respectively.
Two factors contributed to the 2.3% decrease in the effective tax rate for the nine months ended September�30, 2014 compared to the nine months ended September�30, 2013. First, pre-tax book income includes pre-tax income of $2.1�billion and $1.2�billion for nine months ended September�30, 2014 and nine months ended September�30, 2013, respectively, that was passed through to common unitholders and non-controlling interest holders and was not taxable to the Partnership and its subsidiaries. The change in these amounts resulted in a 0.7% decrease in the effective tax rate between the respective nine month periods.
Second, in both the nine months ended September�30, 2014 and the nine months ended September�30, 2013, book equity-based compensation expense exceeded the tax deductible equity-based compensation expense due to the issuance of units that were not tax deductible since they represented a value for value exchange for tax purposes. Although the amount of the excess book expense over the tax expense did not change significantly in the nine months ended September�30, 2014 compared to the nine months ended September�30, 2013, the effective tax rates increased by 1.0% and 2.3% in the nine months ended September�30, 2014 and the nine months ended September�30, 2013, respectively. The change in these amounts resulted in a 1.3% decrease in the effective tax rate between the respective nine month periods.
Non-Controlling Interests in Consolidated Entities
The Net Income Attributable to Redeemable Non-Controlling Interests in Consolidated Entities and Net Income (Loss) Attributable to Non-Controlling Interests in Consolidated Entities are attributable to the consolidated Blackstone Funds. The amounts of these items vary directly with the performance of the consolidated Blackstone Funds and largely eliminate the amount of Other Income (Loss) � Net Gains (Losses) from Fund Investment Activities from the Net Income Attributable to The Blackstone Group L.P.
Net Income Attributable to Non-Controlling Interests in Blackstone Holdings is derived from the Income Before Provision for Taxes, excluding the Net Gains (Losses) from Fund Investment Activities, and the percentage allocation of the income between Blackstone Holdings and The Blackstone Group L.P. after considering any contractual arrangements that govern the allocation of income (loss) such as fees allocable to The Blackstone Group�L.P.
For the three months ended September�30, 2014 and 2013, the net income before taxes allocated to Blackstone Holdings was 47.7% and 49.2%, respectively. For the nine months ended September�30, 2014 and 2013, the net
�
77
Table of Contents
income before taxes allocated to Blackstone Holdings was 48.0% and 49.5%, respectively. The decreases of 1.5% and 1.5%, respectively, were primarily due to conversions of Blackstone Holdings Partnership Units to Blackstone common units and the vesting of common units.
Operating Metrics
The following graph summarizes the Fee-Earning Assets Under Management by Segment and Total Assets Under Management by Segment, followed by a rollforward of activity for the three and nine months ended September�30, 2014 and 2013. For a description of how Assets Under Management and Fee-Earning Assets Under Management are determined, please see ���Key Financial Measures and Indicators � Operating Metrics � Assets Under Management and Fee-Earning Assets Under Management�:
�
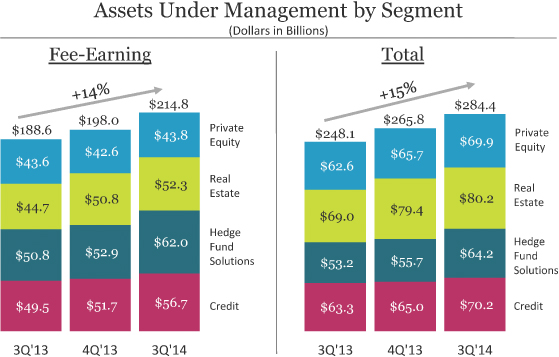
�
| Note:����Totals | in graph may not add due to rounding. |
�
78
Table of Contents
| � | � | Three Months Ended | � | |||||||||||||||||||||||||||||||||||||
| � | � | September�30, 2014 | � | � | September�30, 2013 | � | ||||||||||||||||||||||||||||||||||
| � | � | Private Equity |
� | � | Real�Estate | � | � | Hedge�Fund Solutions |
� | � | Credit | � | � | Total | � | � | Private Equity |
� | � | Real�Estate | � | � | Hedge�Fund Solutions |
� | � | Credit | � | � | Total | � | ||||||||||
| � | � | (Dollars in Thousands) | � | |||||||||||||||||||||||||||||||||||||
| Fee-Earning Assets Under Management |
� | � | � | � | � | � | � | � | � | � | ||||||||||||||||||||||||||||||
| Balance, Beginning of Period |
� | $ | 42,888,756 | �� | � | $ | 52,823,975 | �� | � | $ | 58,084,020 | �� | � | $ | 56,117,009 | �� | � | $ | 209,913,760 | �� | � | $ | 36,635,224 | �� | � | $ | 43,635,493 | �� | � | $ | 47,572,465 | �� | � | $ | 48,495,765 | �� | � | $ | 176,338,947 | �� |
| Inflows, including Commitments�(a) |
� | � | 1,740,674 | �� | � | � | 2,381,299 | �� | � | � | 4,304,025 | �� | � | � | 4,811,496 | �� | � | � | 13,237,494 | �� | � | � | 7,806,126 | �� | � | � | 2,645,417 | �� | � | � | 3,010,936 | �� | � | � | 3,406,274 | �� | � | � | 16,868,753 | �� |
| Outflows, including Distributions�(b) |
� | � | (177,153 | )� | � | � | (66,881 | )� | � | � | (617,630 | )� | � | � | (907,268 | )� | � | � | (1,768,932 | )� | � | � | (154,935 | )� | � | � | (984,250 | )� | � | � | (703,285 | )� | � | � | (702,919 | )� | � | � | (2,545,389 | )� |
| Realizations�(c) |
� | � | (546,051 | )� | � | � | (2,438,697 | )� | � | � | (104,853 | )� | � | � | (2,372,395 | )� | � | � | (5,461,996 | )� | � | � | (659,713 | )� | � | � | (540,819 | )� | � | � | (93,498 | )� | � | � | (2,381,486 | )� | � | � | (3,675,516 | )� |
| � | � |
� |
� | � | � |
� |
� | � | � |
� |
� | � | � |
� |
� | � | � |
� |
� | � | � |
� |
� | � | � |
� |
� | � | � |
� |
� | � | � |
� |
� | � | � |
� |
� | |
| Net Inflows (Outflows) |
� | � | 1,017,470 | �� | � | � | (124,279 | )� | � | � | 3,581,542 | �� | � | � | 1,531,833 | �� | � | � | 6,006,566 | �� | � | � | 6,991,478 | �� | � | � | 1,120,348 | �� | � | � | 2,214,153 | �� | � | � | 321,869 | �� | � | � | 10,647,848 | �� |
| Market Appreciation (Depreciation)�(d) |
� | � | (88,485 | )� | � | � | (391,521 | )� | � | � | 371,520 | �� | � | � | (992,240 | )� | � | � | (1,100,726 | )� | � | � | 18,404 | �� | � | � | (39,856 | )� | � | � | 1,043,116 | �� | � | � | 641,358 | �� | � | � | 1,663,022 | �� |
| � | � |
� |
� | � | � |
� |
� | � | � |
� |
� | � | � |
� |
� | � | � |
� |
� | � | � |
� |
� | � | � |
� |
� | � | � |
� |
� | � | � |
� |
� | � | � |
� |
� | |
| Balance, End of Period�(e) |
� | $ | 43,817,741 | �� | � | $ | 52,308,175 | �� | � | $ | 62,037,082 | �� | � | $ | 56,656,602 | �� | � | $ | 214,819,600 | �� | � | $ | 43,645,106 | �� | � | $ | 44,715,985 | �� | � | $ | 50,829,734 | �� | � | $ | 49,458,992 | �� | � | $ | 188,649,817 | �� |
| � | � |
� |
� | � | � |
� |
� | � | � |
� |
� | � | � |
� |
� | � | � |
� |
� | � | � |
� |
� | � | � |
� |
� | � | � |
� |
� | � | � |
� |
� | � | � |
� |
� | |
| Increase (Decrease) |
� | $ | 928,985 | �� | � | $ | (515,800 | )� | � | $ | 3,953,062 | �� | � | $ | 539,593 | �� | � | $ | 4,905,840 | �� | � | $ | 7,009,882 | �� | � | $ | 1,080,492 | �� | � | $ | 3,257,269 | �� | � | $ | 963,227 | �� | � | $ | 12,310,870 | �� |
| Increase (Decrease) |
� | � | 2 | %� | � | � | -1 | %� | � | � | 7 | %� | � | � | 1 | %� | � | � | 2 | %� | � | � | 19 | %� | � | � | 2 | %� | � | � | 7 | %� | � | � | 2 | %� | � | � | 7 | %� |
�
| � | � | Nine Months Ended | � | |||||||||||||||||||||||||||||||||||||
| � | � | September�30, 2014 | � | � | September�30, 2013 | � | ||||||||||||||||||||||||||||||||||
| � | � | Private Equity |
� | � | Real�Estate | � | � | Hedge�Fund Solutions |
� | � | Credit | � | � | Total | � | � | Private Equity |
� | � | Real�Estate | � | � | Hedge�Fund Solutions |
� | � | Credit | � | � | Total | � | ||||||||||
| � | � | (Dollars in Thousands) | � | |||||||||||||||||||||||||||||||||||||
| Fee-Earning Assets Under Management |
� | � | � | � | � | � | � | � | � | � | ||||||||||||||||||||||||||||||
| Balance, Beginning of Period |
� | $ | 42,600,515 | �� | � | $ | 50,792,803 | �� | � | $ | 52,865,837 | �� | � | $ | 51,722,584 | �� | � | $ | 197,981,739 | �� | � | $ | 37,050,167 | �� | � | $ | 41,931,339 | �� | � | $ | 43,478,791 | �� | � | $ | 45,420,143 | �� | � | $ | 167,880,440 | �� |
| Inflows, including Commitments�(a) |
� | � | 5,582,792 | �� | � | � | 8,074,976 | �� | � | � | 10,113,647 | �� | � | � | 13,950,322 | �� | � | � | 37,721,737 | �� | � | � | 9,081,365 | �� | � | � | 6,212,742 | �� | � | � | 6,932,613 | �� | � | � | 11,944,271 | �� | � | � | 34,170,991 | �� |
| Outflows, including Distributions�(b) |
� | � | (1,121,402 | )� | � | � | (225,722 | )� | � | � | (3,215,975 | )� | � | � | (2,609,400 | )� | � | � | (7,172,499 | )� | � | � | (154,935 | )� | � | � | (1,096,455 | )� | � | � | (2,085,906 | )� | � | � | (1,556,898 | )� | � | � | (4,894,194 | )� |
| Realizations�(c) |
� | � | (3,508,675 | )� | � | � | (5,982,663 | )� | � | � | (301,121 | )� | � | � | (6,106,615 | )� | � | � | (15,899,074 | )� | � | � | (2,329,967 | )� | � | � | (2,204,435 | )� | � | � | (163,320 | )� | � | � | (7,446,963 | )� | � | � | (12,144,685 | )� |
| � | � |
� |
� | � | � |
� |
� | � | � |
� |
� | � | � |
� |
� | � | � |
� |
� | � | � |
� |
� | � | � |
� |
� | � | � |
� |
� | � | � |
� |
� | � | � |
� |
� | |
| Net Inflows |
� | � | 952,715 | �� | � | � | 1,866,591 | �� | � | � | 6,596,551 | �� | � | � | 5,234,307 | �� | � | � | 14,650,164 | �� | � | � | 6,596,463 | �� | � | � | 2,911,852 | �� | � | � | 4,683,387 | �� | � | � | 2,940,410 | �� | � | � | 17,132,112 | �� |
| Market Appreciation (Depreciation)�(d) |
� | � | 264,511 | �� | � | � | (351,219 | )� | � | � | 2,574,694 | �� | � | � | (300,289 | )� | � | � | 2,187,697 | �� | � | � | (1,524 | )� | � | � | (127,206 | )� | � | � | 2,667,556 | �� | � | � | 1,098,439 | �� | � | � | 3,637,265 | �� |
| � | � |
� |
� | � | � |
� |
� | � | � |
� |
� | � | � |
� |
� | � | � |
� |
� | � | � |
� |
� | � | � |
� |
� | � | � |
� |
� | � | � |
� |
� | � | � |
� |
� | |
| Balance, End of Period�(e) |
� | $ | 43,817,741 | �� | � | $ | 52,308,175 | �� | � | $ | 62,037,082 | �� | � | $ | 56,656,602 | �� | � | $ | 214,819,600 | �� | � | $ | 43,645,106 | �� | � | $ | 44,715,985 | �� | � | $ | 50,829,734 | �� | � | $ | 49,458,992 | �� | � | $ | 188,649,817 | �� |
| � | � |
� |
� | � | � |
� |
� | � | � |
� |
� | � | � |
� |
� | � | � |
� |
� | � | � |
� |
� | � | � |
� |
� | � | � |
� |
� | � | � |
� |
� | � | � |
� |
� | |
| Increase |
� | $ | 1,217,226 | �� | � | $ | 1,515,372 | �� | � | $ | 9,171,245 | �� | � | $ | 4,934,018 | �� | � | $ | 16,837,861 | �� | � | $ | 6,594,939 | �� | � | $ | 2,784,646 | �� | � | $ | 7,350,943 | �� | � | $ | 4,038,849 | �� | � | $ | 20,769,377 | �� |
| Increase |
� | � | 3 | %� | � | � | 3 | %� | � | � | 17 | %� | � | � | 10 | %� | � | � | 9 | %� | � | � | 18 | %� | � | � | 7 | %� | � | � | 17 | %� | � | � | 9 | %� | � | � | 12 | %� |
�
79
Table of Contents
| � | � | Three Months Ended | � | |||||||||||||||||||||||||||||||||||||
| � | � | September�30, 2014 | � | � | September�30, 2013 | � | ||||||||||||||||||||||||||||||||||
| � | � | Private Equity |
� | � | Real�Estate | � | � | Hedge�Fund Solutions |
� | � | Credit | � | � | Total | � | � | Private Equity |
� | � | Real�Estate | � | � | Hedge�Fund Solutions |
� | � | Credit | � | � | Total | � | ||||||||||
| � | � | (Dollars in Thousands) | � | |||||||||||||||||||||||||||||||||||||
| Total Assets Under Management |
� | � | � | � | � | � | � | � | � | � | ||||||||||||||||||||||||||||||
| Balance, Beginning of Period |
� | $ | 68,294,162 | �� | � | $ | 80,410,988 | �� | � | $ | 60,672,759 | �� | � | $ | 69,539,804 | �� | � | $ | 278,917,713 | �� | � | $ | 53,287,294 | �� | � | $ | 63,919,906 | �� | � | $ | 50,128,028 | �� | � | $ | 62,236,513 | �� | � | $ | 229,571,741 | �� |
| Inflows, including Commitments�(a) |
� | � | 2,669,040 | �� | � | � | 1,718,999 | �� | � | � | 3,877,378 | �� | � | � | 4,831,193 | �� | � | � | 13,096,610 | �� | � | � | 10,450,621 | �� | � | � | 4,030,048 | �� | � | � | 2,780,140 | �� | � | � | 3,397,214 | �� | � | � | 20,658,023 | �� |
| Outflows, including Distributions�(b) |
� | � | (246,522 | )� | � | � | (33,866 | )� | � | � | (638,142 | )� | � | � | (959,005 | )� | � | � | (1,877,535 | )� | � | � | (177,018 | )� | � | � | (98,639 | )� | � | � | (711,558 | )� | � | � | (792,022 | )� | � | � | (1,779,237 | )� |
| Realizations�(c) |
� | � | (2,365,776 | )� | � | � | (4,617,150 | )� | � | � | (115,265 | )� | � | � | (2,878,482 | )� | � | � | (9,976,673 | )� | � | � | (2,485,012 | )� | � | � | (1,656,685 | )� | � | � | (119,938 | )� | � | � | (2,598,670 | )� | � | � | (6,860,305 | )� |
| � | � |
� |
� | � | � |
� |
� | � | � |
� |
� | � | � |
� |
� | � | � |
� |
� | � | � |
� |
� | � | � |
� |
� | � | � |
� |
� | � | � |
� |
� | � | � |
� |
� | |
| Net Inflows (Outflows) |
� | � | 56,742 | �� | � | � | (2,932,017 | )� | � | � | 3,123,971 | �� | � | � | 993,706 | �� | � | � | 1,242,402 | �� | � | � | 7,788,591 | �� | � | � | 2,274,724 | �� | � | � | 1,948,644 | �� | � | � | 6,522 | �� | � | � | 12,018,481 | �� |
| Market Appreciation (Depreciation)�(d) |
� | � | 1,539,463 | �� | � | � | 2,709,887 | �� | � | � | 387,133 | �� | � | � | (381,662 | )� | � | � | 4,254,821 | �� | � | � | 1,543,928 | �� | � | � | 2,769,825 | �� | � | � | 1,085,502 | �� | � | � | 1,075,411 | �� | � | � | 6,474,666 | �� |
| � | � |
� |
� | � | � |
� |
� | � | � |
� |
� | � | � |
� |
� | � | � |
� |
� | � | � |
� |
� | � | � |
� |
� | � | � |
� |
� | � | � |
� |
� | � | � |
� |
� | |
| Balance, End of Period�(e) |
� | $ | 69,890,367 | �� | � | $ | 80,188,858 | �� | � | $ | 64,183,863 | �� | � | $ | 70,151,848 | �� | � | $ | 284,414,936 | �� | � | $ | 62,619,813 | �� | � | $ | 68,964,455 | �� | � | $ | 53,162,174 | �� | � | $ | 63,318,446 | �� | � | $ | 248,064,888 | �� |
| � | � |
� |
� | � | � |
� |
� | � | � |
� |
� | � | � |
� |
� | � | � |
� |
� | � | � |
� |
� | � | � |
� |
� | � | � |
� |
� | � | � |
� |
� | � | � |
� |
� | |
| Increase (Decrease) |
� | $ | 1,596,205 | �� | � | $ | (222,130 | )� | � | $ | 3,511,104 | �� | � | $ | 612,044 | �� | � | $ | 5,497,223 | �� | � | $ | 9,332,519 | �� | � | $ | 5,044,549 | �� | � | $ | 3,034,146 | �� | � | $ | 1,081,933 | �� | � | $ | 18,493,147 | �� |
| Increase (Decrease) |
� | � | 2 | %� | � | � | -0 | %� | � | � | 6 | %� | � | � | 1 | %� | � | � | 2 | %� | � | � | 18 | %� | � | � | 8 | %� | � | � | 6 | %� | � | � | 2 | %� | � | � | 8 | %� |
�
| � | � | Nine Months Ended | � | |||||||||||||||||||||||||||||||||||||
| � | � | September�30, 2014 | � | � | September�30, 2013 | � | ||||||||||||||||||||||||||||||||||
| � | � | Private Equity |
� | � | Real�Estate | � | � | Hedge�Fund Solutions |
� | � | Credit | � | � | Total | � | � | Private Equity |
� | � | Real�Estate | � | � | Hedge�Fund Solutions |
� | � | Credit | � | � | Total | � | ||||||||||
| � | � | (Dollars in Thousands) | � | |||||||||||||||||||||||||||||||||||||
| Total Assets Under Management |
� | � | � | � | � | � | � | � | � | � | ||||||||||||||||||||||||||||||
| Balance, Beginning of Period |
� | $ | 65,675,031 | �� | � | $ | 79,410,788 | �� | � | $ | 55,657,463 | �� | � | $ | 65,014,348 | �� | � | $ | 265,757,630 | �� | � | $ | 51,002,973 | �� | � | $ | 56,695,645 | �� | � | $ | 46,092,505 | �� | � | $ | 56,428,837 | �� | � | $ | 210,219,960 | �� |
| Inflows, including Commitments�(a) |
� | � | 7,511,215 | �� | � | � | 6,603,445 | �� | � | � | 9,471,979 | �� | � | � | 14,242,919 | �� | � | � | 37,829,558 | �� | � | � | 11,958,460 | �� | � | � | 10,052,455 | �� | � | � | 6,639,376 | �� | � | � | 14,641,738 | �� | � | � | 43,292,029 | �� |
| Outflows, including Distributions�(b) |
� | � | (758,763 | )� | � | � | (710,979 | )� | � | � | (3,249,348 | )� | � | � | (2,747,585 | )� | � | � | (7,466,675 | )� | � | � | (586,429 | )� | � | � | (675,665 | )� | � | � | (2,193,883 | )� | � | � | (1,729,944 | )� | � | � | (5,185,921 | )� |
| Realizations�(c) |
� | � | (11,213,738 | )� | � | � | (13,590,373 | )� | � | � | (402,278 | )� | � | � | (7,427,332 | )� | � | � | (32,633,721 | )� | � | � | (6,094,321 | )� | � | � | (4,921,907 | )� | � | � | (211,058 | )� | � | � | (8,353,184 | )� | � | � | (19,580,470 | )� |
| � | � |
� |
� | � | � |
� |
� | � | � |
� |
� | � | � |
� |
� | � | � |
� |
� | � | � |
� |
� | � | � |
� |
� | � | � |
� |
� | � | � |
� |
� | � | � |
� |
� | |
| Net Inflows (Outflows) |
� | � | (4,461,286 | )� | � | � | (7,697,907 | )� | � | � | 5,820,353 | �� | � | � | 4,068,002 | �� | � | � | (2,270,838 | )� | � | � | 5,277,710 | �� | � | � | 4,454,883 | �� | � | � | 4,234,435 | �� | � | � | 4,558,610 | �� | � | � | 18,525,638 | �� |
| Market Appreciation�(d) |
� | � | 8,676,622 | �� | � | � | 8,475,977 | �� | � | � | 2,706,047 | �� | � | � | 1,069,498 | �� | � | � | 20,928,144 | �� | � | � | 6,339,130 | �� | � | � | 7,813,927 | �� | � | � | 2,835,234 | �� | � | � | 2,330,999 | �� | � | � | 19,319,290 | �� |
| � | � |
� |
� | � | � |
� |
� | � | � |
� |
� | � | � |
� |
� | � | � |
� |
� | � | � |
� |
� | � | � |
� |
� | � | � |
� |
� | � | � |
� |
� | � | � |
� |
� | |
| Balance, End of Period�(e) |
� | $ | 69,890,367 | �� | � | $ | 80,188,858 | �� | � | $ | 64,183,863 | �� | � | $ | 70,151,848 | �� | � | $ | 284,414,936 | �� | � | $ | 62,619,813 | �� | � | $ | 68,964,455 | �� | � | $ | 53,162,174 | �� | � | $ | 63,318,446 | �� | � | $ | 248,064,888 | �� |
| � | � |
� |
� | � | � |
� |
� | � | � |
� |
� | � | � |
� |
� | � | � |
� |
� | � | � |
� |
� | � | � |
� |
� | � | � |
� |
� | � | � |
� |
� | � | � |
� |
� | |
| Increase |
� | $ | 4,215,336 | �� | � | $ | 778,070 | �� | � | $ | 8,526,400 | �� | � | $ | 5,137,500 | �� | � | $ | 18,657,306 | �� | � | $ | 11,616,840 | �� | � | $ | 12,268,810 | �� | � | $ | 7,069,669 | �� | � | $ | 6,889,609 | �� | � | $ | 37,844,928 | �� |
| Increase |
� | � | 6 | %� | � | � | 1 | %� | � | � | 15 | %� | � | � | 8 | %� | � | � | 7 | %� | � | � | 23 | %� | � | � | 22 | %� | � | � | 15 | %� | � | � | 12 | %� | � | � | 18 | %� |
�
| (a) | Inflows represent contributions in our hedge funds and closed-end mutual funds, increases in available capital for our carry funds (capital raises, recallable capital and increased side-by-side commitments) and CLOs and increases in the capital we manage pursuant to separately managed account programs. |
| (b) | Outflows represent redemptions in our hedge funds and closed-end mutual funds, client withdrawals from our separately managed account programs and decreases in available capital for our carry funds (expired capital, expense drawdowns and decreased side-by-side commitments). Also included is the distribution of funds associated with the discontinuation of our proprietary single manager hedge funds. |
| (c) | Realizations represent realizations from the disposition of assets, capital returned to investors from CLOs and the effect of changes in the definition of Total Assets Under Management. |
| (d) | Market appreciation (depreciation) includes realized and unrealized gains (losses) on portfolio investments and the impact of foreign exchange rate fluctuations. |
| (e) | Fee-Earning Assets Under Management and Total Assets Under Management as of September�30, 2014 included $277.6�million and $359.9�million, respectively, from a joint venture in which we are the minority interest holder. |
�
80
Table of Contents
Fee-Earning Assets Under Management
Fee-Earning Assets Under Management were $214.8�billion at September�30, 2014, an increase of $4.9�billion, or 2%, compared to $209.9�billion at June�30, 2014. The net increase was due to:
�
| � | � | � | Inflows of $13.2�billion related to: |
�
| � | � | � | $4.8�billion in our Credit segment principally related to $1.2�billion raised due to two CLO launches (US fund of $615.6�million and European fund of $543.2�million), $1.0�billion of fee-earning inflows in our Hedge Fund Strategies funds, $961.7�million for our business development companies (�BDCs�), $346.4�million in our Mezzanine Funds and $268.0�million in our Rescue Lending Funds, |
�
| � | � | � | $4.3�billion in our Hedge Fund Solutions segment primarily related to $1.9�billion in customized solutions, $1.2�billion in commingled products, $668.6�million in specialized solutions and $505.2�million in individual investor solutions, |
�
| � | � | � | $2.4�billion in our Real Estate segment primarily related to $367.8�million for our Core+ funds, $209.0�million raised for BREP Asia and $1.0�billion raised and/or invested across our BREDS funds, and |
�
| � | � | � | $1.7�billion in our Private Equity segment primarily due to $1.1�billion of additional capital raised as part of the final close of Strategic Partners� sixth secondary fund of funds, the execution of a separately managed account for an infrastructure and real estate secondary fund of funds and the inclusion of additional fee generating assets for our Tactical Opportunities investment vehicles. |
Offsetting these increases were:
�
| � | � | � | Realizations of $5.5�billion primarily driven by: |
�
| � | � | � | $2.4�billion in our Real Estate segment primarily from the partial realizations in the BREP office portfolio and of Brixmor of $1.1�billion and realizations in our BREDS funds of $772.3�million, |
�
| � | � | � | $2.4�billion in our Credit segment primarily due to $1.7�billion of capital returned to CLO investors from CLOs that are post their re-investment periods and $438.3�million returned from our Mezzanine Funds and $201.9�million from our Rescue Lending funds, and |
�
| � | � | � | $546.1�million in our Private Equity segment primarily from dispositions in Strategic Partners, BCP�IV and BCP V. |
�
| � | � | � | Outflows of $1.8�billion primarily attributable to: |
�
| � | � | � | $907.3�million in our Credit segment primarily from our long-only platform and Hedge Fund Strategies funds, and |
�
| � | � | � | $617.6�million in our Hedge Fund Solutions segment reflecting liquidity needs of our limited partners primarily in commingled and customized products. |
�
| � | � | � | Net market depreciation of $1.1�billion primarily attributable to: |
�
| � | � | � | $992.2�million of market depreciation in our Credit segment primarily due to the impact of foreign exchange rate fluctuations on the conversion to the U.S. dollar of the European CLOs, |
�
| � | � | � | $391.5�million of market depreciation in our Real Estate segment due to the impact of foreign exchange rate fluctuations, and |
�
| � | � | � | $371.5�million of market appreciation in our Hedge Fund Solutions segment due to BAAM�s Principal Solutions Composite being up 1.3% net. |
BAAM had net inflows of $1.0 billion from October�1 through November�1, 2014.
�
81
Table of Contents
Fee-Earning Assets Under Management were $214.8�billion at September�30, 2014, an increase of $16.8 billion, or 9%, compared to $198.0�billion at December�31, 2013. The net increase was due to:
�
| � | � | � | Inflows of $37.7�billion related to: |
�
| � | � | � | $14.0�billion in our Credit segment principally related to $3.8�billion raised due to six CLO launches, $3.2�billion of capital raised for our BDCs, an increase of $2.9�billion in our Hedge Fund Strategies funds and $1.5�billion deployed in our carry funds, |
�
| � | � | � | $10.1�billion in our Hedge Fund Solutions segment mainly related to growth in its customized and commingled products and co-investment platform, additional closings on the general partner interests vehicle, and the launch of BAAM�s second alternative investment-focused mutual fund and first liquid alternative UCITS structure fund, |
�
| � | � | � | $8.1�billion in our Real Estate segment primarily related to $1.3�billion raised for BREP Europe IV, $3.2�billion raised and/or invested across our BREDS funds and $1.4�billion raised for our first Asia fund, and |
�
| � | � | � | $5.6�billion in our Private Equity segment primarily due to the commencement of the investment period of Strategic Partners� sixth secondary fund of funds with $4.2�billion of third party capital and the inclusion of additional fee generating assets for our Tactical Opportunities investment vehicles. |
�
| � | � | � | Net market appreciation of $2.2�billion primarily due to: |
�
| � | � | � | $2.6�billion in our Hedge Fund Solutions segment due to BAAM�s Principal Solutions Composite being up 5.5% net. |
Offsetting these increases were:
�
| � | � | � | Realizations of $15.9�billion primarily driven by: |
�
| � | � | � | $6.1�billion in our Credit segment primarily due to $4.5�billion of capital returned to CLO investors from CLOs that are post their re-investment periods and $1.6�billion returned across our significant Mezzanine and Rescue Lending funds, |
�
| � | � | � | $6.0�billion in our Real Estate segment primarily from sales of office assets in BREP and the partial sale of public market holdings (Hilton and Brixmor), and |
�
| � | � | � | $3.5�billion in our Private Equity segment primarily due to continued disposition activity across the segment. |
�
| � | � | � | Outflows of $7.2�billion primarily attributable to: |
�
| � | � | � | $3.2�billion in our Hedge Fund Solutions segment as a result of, in general, the liquidity needs of limited partners, |
�
| � | � | � | $2.6�billion in our Credit segment primarily from our long-only platform, and |
�
| � | � | � | $1.1�billion in our Private Equity segment primarily from the end of Strategic Partners V�s investment period. |
Total Assets Under Management
Total Assets Under Management were $284.4�billion at September�30, 2014, an increase of $5.5�billion, or 2%, compared to $278.9�billion at June�30, 2014. The net increase was due to:
�
| � | � | � | Inflows of $13.1�billion related to: |
�
| � | � | � | $4.8�billion in our Credit segment primarily due to the same reasons in Fee-Earning Assets Under Management above, |
�
82
Table of Contents
| � | � | � | $3.9�billion in our Hedge Fund Solutions segment, which primarily related to growth in its customized and commingled products and the launch of BAAM�s first liquid alternative UCITS structure fund, |
�
| � | � | � | $2.7�billion in our Private Equity segment primarily related to additional capital raised for Strategic Partners sixth secondary fund of funds, $521.3�million of recyclable capital from disposition activity, $404.0�million raised for a secondary funds infrastructure and real assets separately managed account and $306.0�million raised for our Tactical Opportunities investment vehicles, and |
�
| � | � | � | $1.7�billion in our Real Estate segment primarily due to the same reasons in Fee-Earning Assets Under Management above. |
�
| � | � | � | Net market appreciation of $4.3�billion due to: |
�
| � | � | � | $2.7�billion in our Real Estate segment due to a carrying value increase of 6.2% driven by appreciation in the private portfolio (7.1%, $2.6 billion) from sustained strong operating fundamentals, and public portfolio appreciation (4.3%, $802.2 million), and |
�
| � | � | � | $1.5�billion in our Private Equity segment primarily due to fund performance, with a 3.7% overall increase in carrying value, driven by private portfolio appreciation of 5.7% mainly in the services and hospitality/leisure sectors. |
Offsetting these increases were:
�
| � | � | � | Realizations of $10.0�billion primarily driven by: |
�
| � | � | � | $4.6�billion in our Real Estate segment primarily due to the same reasons in Fee-Earning Assets Under Management above, |
�
| � | � | � | $2.9�billion in our Credit segment primarily due to the same reasons in Fee-Earning Assets Under Management above, and |
�
| � | � | � | $2.4�billion in our Private Equity segment primarily due to continued disposition activity across the segment. |
�
| � | � | � | Outflows of $1.9�billion primarily attributable to: |
�
| � | � | � | $959.0�million in our Credit segment primarily due to the same reasons in Fee-Earning Assets Under Management above, and |
�
| � | � | � | $638.1�million in our Hedge Fund Solutions segment primarily related to the liquidity needs of limited partners. |
Total Assets Under Management were $284.4�billion at September�30, 2014, an increase of $18.7�billion, or 7%, compared to $265.8�billion at December�31, 2013. The net increase was due to:
�
| � | � | � | Inflows of $37.8�billion related to: |
�
| � | � | � | $14.2�billion in our Credit segment primarily due to the same reasons in Fee-Earning Assets Under Management above, |
�
| � | � | � | $9.5�billion in our Hedge Fund Solutions segment primarily due to the same reasons in Fee-Earning Assets Under Management above, |
�
| � | � | � | $7.5�billion in our Private Equity segment primarily related to $3.7�billion raised for Strategic Partners sixth secondary fund of funds and additional capital raised for our Tactical Opportunities investment vehicles, and |
�
| � | � | � | $6.6�billion in our Real Estate segment primarily due to $1.4�billion raised for BREP Europe IV, $1.2�billion for BREP Asia and $1.9�billion raised across our BREDS funds. |
�
83
Table of Contents
| � | � | � | Market appreciation of $20.9�billion due to: |
�
| � | � | � | $8.7�billion in our Private Equity segment primarily due to strong fund performance, with an 18.5% overall increase in carrying value, including 18.5% in BCP V, 29.7% in BCP VI and 21.4% in BEP, |
�
| � | � | � | $8.5�billion in our Real Estate segment due to a carrying value increase in our BREP funds of 15.3% driven by appreciation in the private portfolio (17.5%, $6.2�billion) from sustained strong operating fundamentals and public portfolio appreciation (11.7%, $2.5�billion), |
�
| � | � | � | $2.7�billion in our Hedge Fund Solutions segment due to BAAM�s Principal Solutions Composite being up 5.5% net, and |
�
| � | � | � | $1.1�billion in our Credit segment due to $379.0�million of appreciation in the Hedge Fund Strategies funds and $1.2�billion of appreciation in carry funds, offset by foreign exchange rate fluctuations on the conversion to U.S. dollars of the European CLOs. |
Offsetting these increases were:
�
| � | � | � | Realizations of $32.6�billion primarily driven by: |
�
| � | � | � | $13.6�billion in our Real Estate segment primarily due to the same reasons in Fee-Earning Assets Under Management above, |
�
| � | � | � | $11.2�billion in our Private Equity segment primarily due to continued disposition activity across the segment, mainly from our BCP V fund, and |
�
| � | � | � | $7.4�billion in our Credit segment primarily due to the same reasons in Fee-Earning Assets Under Management above. |
�
| � | � | � | Outflows of $7.5�billion primarily attributable to: |
�
| � | � | � | $3.2�billion in our Hedge Fund Solutions segment primarily related to the liquidity needs of limited partners, and |
�
| � | � | � | $2.7�billion in our Credit segment primarily due to the same reasons in Fee-Earning Assets Under Management above. |
�
84
Table of Contents
Limited Partner Capital Invested
The following presents the limited partner capital invested during the respective periods:
�
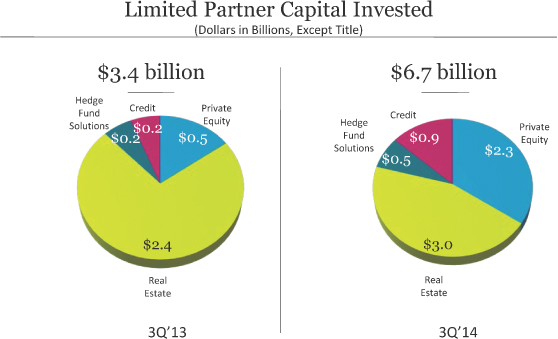
�
| Note: | Totals in graph may not add due to rounding. |
�
| � | � | Three Months Ended September�30, |
� | � | 2014 vs. 2013 | � | � | Nine Months Ended September�30, |
� | � | 2014 vs. 2013 | � | ||||||||||||||||||||
| � | � | 2013 | � | � | 2014 | � | � | $ | � | � | % | � | � | 2013 | � | � | 2014 | � | � | $ | � | � | % | � | ||||||||
| � | � | (Dollars in Thousands) | � | |||||||||||||||||||||||||||||
| Limited Partner Capital Invested |
� | � | � | � | � | � | � | � | ||||||||||||||||||||||||
| Private Equity |
� | $ | 524,320 | �� | � | $ | 2,277,861 | �� | � | $ | 1,753,541 | �� | � | � | 334 | %� | � | $ | 1,550,597 | �� | � | $ | 6,164,210 | �� | � | $ | 4,613,613 | �� | � | � | 298 | %� |
| Real Estate |
� | � | 2,365,224 | �� | � | � | 3,046,867 | �� | � | � | 681,643 | �� | � | � | 29 | %� | � | � | 5,754,667 | �� | � | � | 7,756,292 | �� | � | � | 2,001,625 | �� | � | � | 35 | %� |
| Hedge Fund Solutions |
� | � | 248,422 | �� | � | � | 473,233 | �� | � | � | 224,811 | �� | � | � | 90 | %� | � | � | 422,594 | �� | � | � | 828,639 | �� | � | � | 406,045 | �� | � | � | 96 | %� |
| Credit |
� | � | 240,101 | �� | � | � | 866,404 | �� | � | � | 626,303 | �� | � | � | 261 | %� | � | � | 1,069,076 | �� | � | � | 1,810,262 | �� | � | � | 741,186 | �� | � | � | 69 | %� |
| � | � |
� |
� | � | � |
� |
� | � | � |
� |
� | � | � |
� |
� | � | � |
� |
� | � | � |
� |
� | � | � |
� |
� | � | � |
� |
� | |
| Total |
� | $ | 3,378,067 | �� | � | $ | 6,664,365 | �� | � | $ | 3,286,298 | �� | � | � | 97 | %� | � | $ | 8,796,934 | �� | � | $ | 16,559,403 | �� | � | $ | 7,762,469 | �� | � | � | 88 | %� |
| � | � |
� |
� | � | � |
� |
� | � | � |
� |
� | � | � |
� |
� | � | � |
� |
� | � | � |
� |
� | � | � |
� |
� | � | � |
� |
� | |
Limited Partner Capital Invested was $6.7�billion for the three months ended September�30, 2014, an increase of $3.3�billion, or 97%, from $3.4�billion for the three months ended September�30, 2013. Limited Partner Capital Invested was $16.6�billion for the nine months ended September�30, 2014, an increase of $7.8�billion, or 88%, compared to $8.8�billion for the nine months ended September�30, 2013. The amount of Limited Partner Capital Invested is a function of finding opportunistic investments that fit our investment philosophy and strategy in each of our segments as well as the relative timing of investment closings within those segments. Our Private Equity and Real Estate segments deployed capital at a faster rate during the nine months ended September�30, 2014 than in the nine months ended September�30, 2013 due to the timing of investment closings. Our Hedge Fund Solutions segment is investing capital based on the relative investment opportunities from the hedge fund manager seeding platform and general partner interests vehicle. In our Credit segment, capital deployed for the nine months ended September�30, 2014 was higher compared to the nine months ended September�30, 2013 due to greater opportunities to deploy capital.
�
85
Table of Contents
The following presents the committed undrawn capital available for investment (�dry powder�) as of September�30, 2013 and 2014:
�
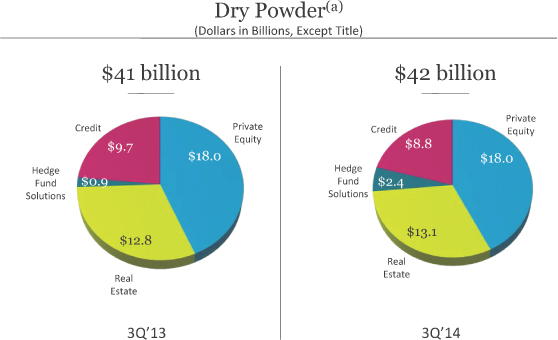
�
| Note: | Totals may not add due to rounding. Amounts are as of September�30, for each of the periods indicated. |
| (a) | Represents illiquid drawdown funds only; excludes marketable vehicles; includes both Fee-Earning (third party) capital and general partner and employee commitments that do not earn fees. Amounts are reduced by outstanding commitments to invest, but for which capital has not been called. |
�
86
Table of Contents
Net Accrued Performance Fees
The following table presents the accrued performance fees, net of performance fee compensation, of the Blackstone Funds as of September�30, 2014 and 2013. Net accrued performance fees presented do not include clawback amounts, if any, which are disclosed in Note 17. �Commitments and Contingencies � Contingencies � Contingent Obligations (Clawback)� in the �Notes to Condensed Consolidated Financial Statements� in �Part�I. Item�1.�Financial Statements� of this filing.
�
| � | �� | September�30, | � | |||||
| � | �� | 2014 | � | �� | 2013 | � | ||
| � | �� | (Dollars in Millions) | � | |||||
| Private Equity |
�� | �� | ||||||
| BCP IV Carried Interest |
�� | $ | 343 | �� | �� | $ | 506 | �� |
| BCP V Carried Interest |
�� | � | 572 | �� | �� | � | ��� | �� |
| BCP VI Carried Interest |
�� | � | 265 | �� | �� | � | 15 | �� |
| BEP Carried Interest |
�� | � | 79 | �� | �� | � | 62 | �� |
| Tactical Opportunities Carried Interest |
�� | � | 32 | �� | �� | � | 5 | �� |
| Strategic Partners V Carried Interest |
�� | � | 2 | �� | �� | � | 1 | �� |
| Korea Carried Interest |
�� | � | 1 | �� | �� | � | ��� | �� |
| �� | � |
� |
� | �� | � |
� |
� | |
| Total Private Equity (a) |
�� | � | 1,294 | �� | �� | � | 589 | �� |
| �� | � |
� |
� | �� | � |
� |
� | |
| Real Estate |
�� | �� | ||||||
| BREP IV Carried Interest |
�� | � | 4 | �� | �� | � | ��� | �� |
| BREP V Carried Interest |
�� | � | 679 | �� | �� | � | 616 | �� |
| BREP VI Carried Interest |
�� | � | 1,244 | �� | �� | � | 857 | �� |
| BREP VII Carried Interest |
�� | � | 545 | �� | �� | � | 248 | �� |
| BREP International I Carried Interest |
�� | � | ��� | �� | �� | � | 2 | �� |
| BREP Europe III Carried Interest |
�� | � | 187 | �� | �� | � | 128 | �� |
| BREP Europe IV Carried Interest |
�� | � | 25 | �� | �� | � | ��� | �� |
| BREP Asia Carried Interest |
�� | � | 12 | �� | �� | � | ��� | �� |
| Core+ Carried Interest |
�� | � | 8 | �� | �� | � | ��� | �� |
| BREDS Carried Interest |
�� | � | 16 | �� | �� | � | 21 | �� |
| BREDS Incentive Fees |
�� | � | 2 | �� | �� | � | 2 | �� |
| Asia Platform Incentive Fees |
�� | � | 8 | �� | �� | � | 16 | �� |
| �� | � |
� |
� | �� | � |
� |
� | |
| Total Real Estate (a) |
�� | � | 2,730 | �� | �� | � | 1,890 | �� |
| �� | � |
� |
� | �� | � |
� |
� | |
| Hedge Fund Solutions |
�� | �� | ||||||
| Incentive Fees |
�� | � | 70 | �� | �� | � | 75 | �� |
| �� | � |
� |
� | �� | � |
� |
� | |
| Total Hedge Fund Solutions |
�� | � | 70 | �� | �� | � | 75 | �� |
| �� | � |
� |
� | �� | � |
� |
� | |
| Credit |
�� | �� | ||||||
| Carried Interest |
�� | � | 186 | �� | �� | � | 143 | �� |
| Incentive Fees |
�� | � | 54 | �� | �� | � | 72 | �� |
| �� | � |
� |
� | �� | � |
� |
� | |
| Total Credit |
�� | � | 240 | �� | �� | � | 215 | �� |
| �� | � |
� |
� | �� | � |
� |
� | |
| Total Blackstone |
�� | �� | ||||||
| Carried Interest |
�� | � | 4,200 | �� | �� | � | 2,604 | �� |
| Incentive Fees |
�� | � | 134 | �� | �� | � | 165 | �� |
| �� | � |
� |
� | �� | � |
� |
� | |
| Net Accrued Performance Fees |
�� | $ | 4,334 | �� | �� | $ | 2,769 | �� |
| �� | � |
� |
� | �� | � |
� |
� | |
�
| (a) | Private Equity and Real Estate include Co-Investments, as applicable. |
�
87
Table of Contents
Performance Fee Eligible Assets Under Management
The following represents invested and to be invested capital, including closed commitments for funds whose investment period has not yet commenced, on which performance fees could be earned if certain hurdles are met:
�
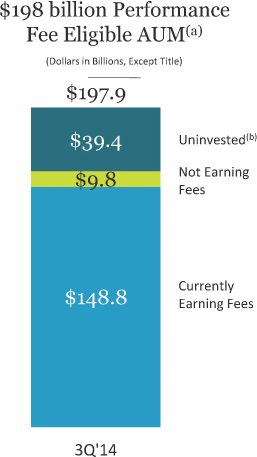
�
| Note: | Totals may not add due to rounding. Amounts are as of September�30, 2014. |
| (a) | Represents invested and to be invested capital at fair value, including closed commitments for funds whose investment period has not yet commenced, on which performance fees could be earned if certain hurdles are met. |
| (b) | Represents dry powder exclusive of non-fee earning general partner and employee commitments. |
Investment Record
Fund returns information for our significant funds is included throughout this discussion and analysis to facilitate an understanding of our results of operations for the periods presented. The fund returns information reflected in this discussion and analysis is not indicative of the financial performance of The Blackstone Group L.P. and is also not necessarily indicative of the future performance of any particular fund. An investment in The Blackstone Group L.P. is not an investment in any of our funds. There can be no assurance that any of our funds or our other existing and future funds will achieve similar returns.
�
88
Table of Contents
The following table presents the investment record of our significant drawdown funds from inception through September�30, 2014:
�
| � | � | � | � | � | � | � | � | Unrealized Investments | � | � | Realized Investments | � | � | Total Investments | � | � | Net IRR (c) | � | ||||||||||||||||||||||||||
| Fund (Investment Period) |
� | Committed Capital |
� | � | Available Capital (a) |
� | � | Value | � | � | MOIC�(b) | � | � | % Public |
� | � | Value | � | � | MOIC�(b) | � | � | Value | � | � | MOIC�(b) | � | � | Realized | � | � | Total | � | |||||||||||
| � | � | (Dollars in Thousands, Except Where Noted) | � | |||||||||||||||||||||||||||||||||||||||||
| Private Equity |
� | � | � | � | � | � | � | � | � | � | � | |||||||||||||||||||||||||||||||||
| BCP I (Oct 1987 / Oct 1993) |
� | $ | 859,081 | �� | � | $ | ��� | �� | � | $ | ��� | �� | � | � | N/A | �� | � | � | ��� | �� | � | $ | 1,741,738 | �� | � | � | 2.6x | �� | � | $ | 1,741,738 | �� | � | � | 2.6x | �� | � | � | 19 | %� | � | � | 19 | %� |
| BCP II (Oct 1993 / Aug 1997) |
� | � | 1,361,100 | �� | � | � | ��� | �� | � | � | ��� | �� | � | � | N/A | �� | � | � | ��� | �� | � | � | 3,256,819 | �� | � | � | 2.5x | �� | � | � | 3,256,819 | �� | � | � | 2.5x | �� | � | � | 32 | %� | � | � | 32 | %� |
| BCP III (Aug 1997 / Nov 2002) |
� | � | 3,967,422 | �� | � | � | ��� | �� | � | � | ��� | �� | � | � | N/A | �� | � | � | ��� | �� | � | � | 9,184,688 | �� | � | � | 2.3x | �� | � | � | 9,184,688 | �� | � | � | 2.3x | �� | � | � | 14 | %� | � | � | 14 | %� |
| BCOM (Jun 2000 / Jun 2006) |
� | � | 2,137,330 | �� | � | � | 199,298 | �� | � | � | 247,105 | �� | � | � | 1.2x | �� | � | � | ��� | �� | � | � | 2,619,040 | �� | � | � | 1.4x | �� | � | � | 2,866,145 | �� | � | � | 1.3x | �� | � | � | 7 | %� | � | � | 6 | %� |
| BCP IV (Nov 2002 / Dec 2005) |
� | � | 6,773,138 | �� | � | � | 227,215 | �� | � | � | 3,593,646 | �� | � | � | 1.9x | �� | � | � | 59 | %� | � | � | 17,661,391 | �� | � | � | 3.1x | �� | � | � | 21,255,037 | �� | � | � | 2.8x | �� | � | � | 45 | %� | � | � | 37 | %� |
| BCP V (Dec 2005 / Jan 2011) |
� | � | 21,032,374 | �� | � | � | 1,747,662 | �� | � | � | 19,030,489 | �� | � | � | 1.7x | �� | � | � | 56 | %� | � | � | 14,576,830 | �� | � | � | 1.7x | �� | � | � | 33,607,319 | �� | � | � | 1.7x | �� | � | � | 9 | %� | � | � | 8 | %� |
| BCP VI (Jan 2011 / Jan 2017) |
� | � | 15,177,339 | �� | � | � | 7,188,270 | �� | � | � | 10,338,093 | �� | � | � | 1.4x | �� | � | � | 14 | %� | � | � | 1,399,204 | �� | � | � | 1.8x | �� | � | � | 11,737,297 | �� | � | � | 1.4x | �� | � | � | 48 | %� | � | � | 19 | %� |
| BEP (Aug 2011 / Aug 2017) |
� | � | 2,432,161 | �� | � | � | 1,174,162 | �� | � | � | 2,038,876 | �� | � | � | 1.7x | �� | � | � | 35 | %� | � | � | 508,112 | �� | � | � | 2.0x | �� | � | � | 2,546,988 | �� | � | � | 1.8x | �� | � | � | 52 | %� | � | � | 44 | %� |
| � | � |
� |
� | � | � |
� |
� | � | � |
� |
� | � | � |
� |
� | � | � |
� |
� | � | � |
� |
� | � | � |
� |
� | � | � |
� |
� | � | � |
� |
� | � | � |
� |
� | � | � |
� |
� | |
| Total Corporate Private Equity |
� | � | 53,739,945 | �� | � | � | 10,536,607 | �� | � | � | 35,248,209 | �� | � | � | 1.6x | �� | � | � | 42 | %� | � | � | 50,947,822 | �� | � | � | 2.2x | �� | � | � | 86,196,031 | �� | � | � | 1.9x | �� | � | � | 20 | %� | � | � | 16 | %� |
| � | � |
� |
� | � | � |
� |
� | � | � |
� |
� | � | � |
� |
� | � | � |
� |
� | � | � |
� |
� | � | � |
� |
� | � | � |
� |
� | � | � |
� |
� | � | � |
� |
� | � | � |
� |
� | |
| Tactical Opportunities |
� | � | 5,728,538 | �� | � | � | 3,252,279 | �� | � | � | 2,934,886 | �� | � | � | 1.2x | �� | � | � | 3 | %� | � | � | 400,577 | �� | � | � | 1.1x | �� | � | � | 3,335,463 | �� | � | � | 1.2x | �� | � | � | 12 | %� | � | � | 18 | %� |
| Strategic Partners |
� | � | 17,008,267 | �� | � | � | 6,416,599 | �� | � | � | 5,968,412 | �� | � | � | 2.1x | �� | � | � | N/A | �� | � | � | 11,180,006 | �� | � | � | 1.3x | �� | � | � | 17,148,418 | �� | � | � | 1.5x | �� | � | � | N/A | �� | � | � | 15 | %� |
| Other Funds and Co-Invest (d) |
� | � | 1,276,598 | �� | � | � | 98,021 | �� | � | � | 648,978 | �� | � | � | 0.8x | �� | � | � | 48 | %� | � | � | 22,622 | �� | � | � | 1.0x | �� | � | � | 671,600 | �� | � | � | 0.8x | �� | � | � | N/M | �� | � | � | N/M | �� |
| � | � |
� |
� | � | � |
� |
� | � | � |
� |
� | � | � |
� |
� | � | � |
� |
� | � | � |
� |
� | � | � |
� |
� | � | � |
� |
� | � | � |
� |
� | � | � |
� |
� | � | � |
� |
� | |
| Total Private Equity |
� | $ | 77,753,348 | �� | � | $ | 20,303,506 | �� | � | $ | 44,800,485 | �� | � | � | 1.6x | �� | � | � | 34 | %� | � | $ | 62,551,027 | �� | � | � | 1.9x | �� | � | $ | 107,351,512 | �� | � | � | 1.8x | �� | � | � | 20 | %� | � | � | 16 | %� |
| � | � |
� |
� | � | � |
� |
� | � | � |
� |
� | � | � |
� |
� | � | � |
� |
� | � | � |
� |
� | � | � |
� |
� | � | � |
� |
� | � | � |
� |
� | � | � |
� |
� | � | � |
� |
� | |
| Real Estate |
� | � | � | � | � | � | � | � | � | � | � | |||||||||||||||||||||||||||||||||
| Dollar |
� | � | � | � | � | � | � | � | � | � | � | |||||||||||||||||||||||||||||||||
| Pre-BREP |
� | $ | 140,714 | �� | � | $ | ��� | �� | � | $ | ��� | �� | � | � | N/A | �� | � | � | ��� | �� | � | $ | 345,190 | �� | � | � | 2.5x | �� | � | $ | 345,190 | �� | � | � | 2.5x | �� | � | � | 33 | %� | � | � | 33 | %� |
| BREP I (Sep 1994 / Oct 1996) |
� | � | 380,708 | �� | � | � | ��� | �� | � | � | ��� | �� | � | � | N/A | �� | � | � | ��� | �� | � | � | 1,327,708 | �� | � | � | 2.8x | �� | � | � | 1,327,708 | �� | � | � | 2.8x | �� | � | � | 40 | %� | � | � | 40 | %� |
| BREP II (Oct 1996 / Mar 1999) |
� | � | 1,198,339 | �� | � | � | ��� | �� | � | � | ��� | �� | � | � | N/A | �� | � | � | ��� | �� | � | � | 2,531,613 | �� | � | � | 2.1x | �� | � | � | 2,531,613 | �� | � | � | 2.1x | �� | � | � | 19 | %� | � | � | 19 | %� |
| BREP III (Apr 1999 / Apr 2003) |
� | � | 1,522,708 | �� | � | � | ��� | �� | � | � | ��� | �� | � | � | N/A | �� | � | � | ��� | �� | � | � | 3,328,504 | �� | � | � | 2.4x | �� | � | � | 3,328,504 | �� | � | � | 2.4x | �� | � | � | 21 | %� | � | � | 21 | %� |
| BREP IV (Apr 2003 / Dec 2005) |
� | � | 2,198,694 | �� | � | � | ��� | �� | � | � | 1,404,550 | �� | � | � | 1.0x | �� | � | � | 27 | %� | � | � | 3,144,774 | �� | � | � | 2.3x | �� | � | � | 4,549,324 | �� | � | � | 1.7x | �� | � | � | 63 | %� | � | � | 14 | %� |
| BREP V (Dec 2005 / Feb 2007) |
� | � | 5,539,418 | �� | � | � | ��� | �� | � | � | 6,257,320 | �� | � | � | 1.9x | �� | � | � | 20 | %� | � | � | 5,323,220 | �� | � | � | 2.1x | �� | � | � | 11,580,540 | �� | � | � | 2.0x | �� | � | � | 18 | %� | � | � | 11 | %� |
| BREP VI (Feb 2007 / Aug 2011) |
� | � | 11,058,605 | �� | � | � | 614,440 | �� | � | � | 16,782,010 | �� | � | � | 2.2x | �� | � | � | 54 | %� | � | � | 7,694,626 | �� | � | � | 2.2x | �� | � | � | 24,476,636 | �� | � | � | 2.2x | �� | � | � | 16 | %� | � | � | 14 | %� |
| BREP VII (Aug 2011 / Feb 2017) |
� | � | 13,456,842 | �� | � | � | 4,083,122 | �� | � | � | 15,034,443 | �� | � | � | 1.5x | �� | � | � | 2 | %� | � | � | 2,077,623 | �� | � | � | 1.6x | �� | � | � | 17,112,066 | �� | � | � | 1.5x | �� | � | � | 38 | %� | � | � | 27 | %� |
| � | � |
� |
� | � | � |
� |
� | � | � |
� |
� | � | � |
� |
� | � | � |
� |
� | � | � |
� |
� | � | � |
� |
� | � | � |
� |
� | � | � |
� |
� | � | � |
� |
� | � | � |
� |
� | |
| Total Global Real Estate Funds |
� | $ | 35,496,028 | �� | � | $ | 4,697,562 | �� | � | $ | 39,478,323 | �� | � | � | 1.8x | �� | � | � | 28 | %� | � | $ | 25,773,258 | �� | � | � | 2.2x | �� | � | $ | 65,251,581 | �� | � | � | 1.9x | �� | � | � | 25 | %� | � | � | 17 | %� |
| � | � |
� |
� | � | � |
� |
� | � | � |
� |
� | � | � |
� |
� | � | � |
� |
� | � | � |
� |
� | � | � |
� |
� | � | � |
� |
� | � | � |
� |
� | � | � |
� |
� | � | � |
� |
� | |
| Euro |
� | � | � | � | � | � | � | � | � | � | � | |||||||||||||||||||||||||||||||||
| BREP Int�l (Jan 2001 / Sep 2005) |
� | � | 824,172 | �� | � | � | ��� | �� | � | � | 121,874 | �� | � | � | 1.5x | �� | � | � | ��� | �� | � | � | 1,238,480 | �� | � | � | 2.2x | �� | � | � | 1,360,354 | �� | � | � | 2.1x | �� | � | � | 25 | %� | � | � | 23 | %� |
| BREP Int�l II (Sep 2005 / Jun 2008) |
� | � | 1,629,748 | �� | � | � | 51,633 | �� | � | � | 1,554,087 | �� | � | � | 1.3x | �� | � | � | 39 | %� | � | � | 394,456 | �� | � | � | 1.6x | �� | � | � | 1,948,543 | �� | � | � | 1.4x | �� | � | � | 10 | %� | � | � | 4 | %� |
| BREP Europe III (Jun 2008 / Dec 2013) |
� | � | 3,204,714 | �� | � | � | 504,161 | �� | � | � | 4,038,495 | �� | � | � | 1.6x | �� | � | � | 7 | %� | � | � | 908,722 | �� | � | � | 2.5x | �� | � | � | 4,947,217 | �� | � | � | 1.7x | �� | � | � | 32 | %� | � | � | 20 | %� |
| BREP Europe IV (Sep 2013 / Mar 2019) |
� | � | 5,151,424 | �� | � | � | 3,248,760 | �� | � | � | 2,295,419 | �� | � | � | 1.1x | �� | � | � | ��� | �� | � | � | 115,111 | �� | � | � | 1.2x | �� | � | � | 2,410,530 | �� | � | � | 1.1x | �� | � | � | 73 | %� | � | � | 19 | %� |
| � | � |
� |
� | � | � |
� |
� | � | � |
� |
� | � | � |
� |
� | � | � |
� |
� | � | � |
� |
� | � | � |
� |
� | � | � |
� |
� | � | � |
� |
� | � | � |
� |
� | � | � |
� |
� | |
| Total Euro Real Estate Funds |
� | � | 10,810,058 | �� | � | � | 3,804,554 | �� | � | � | 8,009,875 | �� | � | � | 1.4x | �� | � | � | 11 | %� | � | � | 2,656,769 | �� | � | � | 2.1x | �� | � | � | 10,666,644 | �� | � | � | 1.5x | �� | � | � | 24 | %� | � | � | 13 | %� |
| � | � |
� |
� | � | � |
� |
� | � | � |
� |
� | � | � |
� |
� | � | � |
� |
� | � | � |
� |
� | � | � |
� |
� | � | � |
� |
� | � | � |
� |
� | � | � |
� |
� | � | � |
� |
� | |
| BREP Co-Investment (e) |
� | $ | 5,518,708 | �� | � | $ | ��� | �� | � | $ | 8,784,882 | �� | � | � | 1.9x | �� | � | � | 73 | %� | � | $ | 2,054,622 | �� | � | � | 2.0x | �� | � | $ | 10,839,504 | �� | � | � | 2.0x | �� | � | � | 14 | %� | � | � | 17 | %� |
| BREP Asia (Jun 2013 / Dec 2017) |
� | � | 4,653,087 | �� | � | � | 3,541,587 | �� | � | � | 1,358,049 | �� | � | � | 1.1x | �� | � | � | ��� | �� | � | � | 4,400 | �� | � | � | 1.0x | �� | � | � | 1,362,449 | �� | � | � | 1.1x | �� | � | � | N/A | �� | � | � | 14 | %� |
| � | � |
� |
� | � | � |
� |
� | � | � |
� |
� | � | � |
� |
� | � | � |
� |
� | � | � |
� |
� | � | � |
� |
� | � | � |
� |
� | � | � |
� |
� | � | � |
� |
� | � | � |
� |
� | |
| Total Real Estate |
� | $ | 59,814,925 | �� | � | $ | 13,120,011 | �� | � | $ | 60,365,671 | �� | � | � | 1.7x | �� | � | � | 31 | %� | � | $ | 31,343,587 | �� | � | � | 2.2x | �� | � | $ | 91,709,258 | �� | � | � | 1.8x | �� | � | � | 24 | %� | � | � | 17 | %� |
| � | � |
� |
� | � | � |
� |
� | � | � |
� |
� | � | � |
� |
� | � | � |
� |
� | � | � |
� |
� | � | � |
� |
� | � | � |
� |
� | � | � |
� |
� | � | � |
� |
� | � | � |
� |
� | |
| Core+ |
� | $ | 1,774,518 | �� | � | $ | 196,140 | �� | � | $ | 1,763,982 | �� | � | � | 1.1x | �� | � | � | ��� | �� | � | $ | ��� | �� | � | � | N/A | �� | � | $ | 1,763,982 | �� | � | � | 1.1x | �� | � | � | N/A | �� | � | � | N/A | �� |
| BREDS (f) |
� | $ | 6,744,553 | �� | � | $ | 2,207,654 | �� | � | $ | 2,637,612 | �� | � | � | 1.1x | �� | � | � | ��� | �� | � | $ | 3,410,839 | �� | � | � | 1.3x | �� | � | $ | 6,048,451 | �� | � | � | 1.2x | �� | � | � | 14 | %� | � | � | 12 | %� |
| Credit (g) |
� | � | � | � | � | � | � | � | � | � | � | |||||||||||||||||||||||||||||||||
| Mezzanine I (Jul 2007 / Jul 2012) |
� | $ | 2,000,000 | �� | � | $ | 139,685 | �� | � | $ | 965,641 | �� | � | � | 1.6x | �� | � | � | ��� | �� | � | $ | 3,836,547 | �� | � | � | 1.6x | �� | � | $ | 4,802,188 | �� | � | � | 1.6x | �� | � | � | N/A | �� | � | � | 18 | %� |
| Mezzanine II (Nov 2011 / Nov 2016) |
� | � | 4,120,000 | �� | � | � | 2,611,409 | �� | � | � | 2,053,592 | �� | � | � | 1.3x | �� | � | � | ��� | �� | � | � | 1,216,317 | �� | � | � | 1.5x | �� | � | � | 3,269,909 | �� | � | � | 1.4x | �� | � | � | N/A | �� | � | � | 28 | %� |
| Rescue Lending I (Sep 2009 / May 2013) |
� | � | 3,253,143 | �� | � | � | 501,159 | �� | � | � | 3,000,186 | �� | � | � | 1.5x | �� | � | � | ��� | �� | � | � | 2,921,620 | �� | � | � | 1.5x | �� | � | � | 5,921,806 | �� | � | � | 1.5x | �� | � | � | N/A | �� | � | � | 16 | %� |
| Rescue Lending II (Jun 2013 / Jun 2018) |
� | � | 5,125,000 | �� | � | � | 4,135,729 | �� | � | � | 1,343,697 | �� | � | � | 1.3x | �� | � | � | ��� | �� | � | � | 3,795 | �� | � | � | 1.0x | �� | � | � | 1,347,492 | �� | � | � | 1.3x | �� | � | � | N/A | �� | � | � | N/M | �� |
| � | � |
� |
� | � | � |
� |
� | � | � |
� |
� | � | � |
� |
� | � | � |
� |
� | � | � |
� |
� | � | � |
� |
� | � | � |
� |
� | � | � |
� |
� | � | � | |||||||
| Total Credit |
� | $ | 14,498,143 | �� | � | $ | 7,387,982 | �� | � | $ | 7,363,116 | �� | � | � | 1.4x | �� | � | � | ��� | �� | � | $ | 7,978,279 | �� | � | � | 1.5x | �� | � | $ | 15,341,395 | �� | � | � | 1.5x | �� | � | � | ||||||
| � | � |
� |
� | � | � |
� |
� | � | � |
� |
� | � | � |
� |
� | � | � |
� |
� | � | � |
� |
� | � | � |
� |
� | � | � |
� |
� | � | � |
� |
� | � | � | |||||||
The returns presented herein represent those of the applicable Blackstone Funds and not those of The Blackstone Group L.P.
�
89
Table of Contents
�
| N/M | Not meaningful. |
| N/A | Not applicable. |
| (a) | Available Capital represents total investable capital commitments, including side-by-side, adjusted for certain expenses and expired or recallable capital, less invested capital. This amount is not reduced by outstanding commitments to investments. |
| (b) | Multiple of Invested Capital (�MOIC�) represents carrying value, before management fees, expenses and Carried Interest, divided by invested capital. |
| (c) | Net Internal Rate of Return (�IRR�) represents the annualized inception to September�30, 2014 IRR on total invested capital based on realized proceeds and unrealized value, as applicable, after management fees, expenses and Carried Interest. Net IRRs for BREP Europe IV, BREP Asia and BREDS II are calculated from commencement of their respective investment periods which, being less than one year, are not annualized. |
| (d) | Returns for Other Funds and Co-Invest are not meaningful as these funds have limited transaction activity. |
| (e) | BREP Co-Investment represents co-investment capital raised for various BREP investments. The Net IRR reflected is calculated by aggregating each co-investment�s realized proceeds and unrealized value, as applicable, after management fees, expenses and Carried Interest. |
| (f) | Excludes Capital Trust drawdown funds. |
| (g) | The Total Investments MOIC for Mezzanine I, Mezzanine II, Rescue Lending I and Rescue Lending II Funds, excluding recycled capital during the investment period, was 2.0x, 1.8x, 1.7x and 1.3x, respectively. Funds presented represent the flagship credit drawdown funds only. |
Segment Analysis
Discussed below is our EI for each of our segments. This information is reflected in the manner utilized by our senior management to make operating decisions, assess performance and allocate resources. References to �our� sectors or investments may also refer to portfolio companies and investments of the underlying funds that we manage.
For segment reporting purposes, revenues and expenses are presented on a basis that deconsolidates the investment funds we manage. As a result, segment revenues are greater than those presented on a consolidated GAAP basis because fund management fees recognized in certain segments are received from the Blackstone Funds and eliminated in consolidation when presented on a consolidated GAAP basis. Furthermore, segment expenses are lower than related amounts presented on a consolidated GAAP basis due to the exclusion of fund expenses that are paid by Limited Partners and the elimination of non-controlling interests.
�
90
Table of Contents
Private Equity
The following table presents the results of operations for our Private Equity segment:
�
| � | � | Three Months Ended September�30, |
� | � | 2014 vs. 2013 | � | � | Nine Months Ended September�30, |
� | � | 2014 vs. 2013 | � | ||||||||||||||||||||
| � | � | 2014 | � | � | 2013 | � | � | $ | � | � | % | � | � | 2014 | � | � | 2013 | � | � | $ | � | � | % | � | ||||||||
| � | � | (Dollars in Thousands) | � | |||||||||||||||||||||||||||||
| Segment Revenues |
� | � | � | � | � | � | � | � | ||||||||||||||||||||||||
| Management Fees, Net |
� | � | � | � | � | � | � | � | ||||||||||||||||||||||||
| Base Management Fees |
� | $ | 108,236 | �� | � | $ | 95,281 | �� | � | $ | 12,955 | �� | � | � | 14 | %� | � | $ | 310,024 | �� | � | $ | 268,148 | �� | � | $ | 41,876 | �� | � | � | 16 | %� |
| Transaction and Other Fees, Net |
� | � | 48,996 | �� | � | � | 16,052 | �� | � | � | 32,944 | �� | � | � | 205 | %� | � | � | 119,459 | �� | � | � | 78,853 | �� | � | � | 40,606 | �� | � | � | 51 | %� |
| Management Fee Offsets |
� | � | (5,837 | )� | � | � | (2,080 | )� | � | � | (3,757 | )� | � | � | -181 | %� | � | � | (11,796 | )� | � | � | (4,510 | )� | � | � | (7,286 | )� | � | � | -162 | %� |
| � | � |
� |
� | � | � |
� |
� | � | � |
� |
� | � | � |
� |
� | � | � |
� |
� | � | � |
� |
� | � | � |
� |
� | � | � |
� |
� | |
| Total Management Fees, Net |
� | � | 151,395 | �� | � | � | 109,253 | �� | � | � | 42,142 | �� | � | � | 39 | %� | � | � | 417,687 | �� | � | � | 342,491 | �� | � | � | 75,196 | �� | � | � | 22 | %� |
| � | � |
� |
� | � | � |
� |
� | � | � |
� |
� | � | � |
� |
� | � | � |
� |
� | � | � |
� |
� | � | � |
� |
� | � | � |
� |
� | |
| Performance Fees |
� | � | � | � | � | � | � | � | ||||||||||||||||||||||||
| Realized |
� | � | � | � | � | � | � | � | ||||||||||||||||||||||||
| Carried Interest |
� | � | 124,913 | �� | � | � | 85,121 | �� | � | � | 39,792 | �� | � | � | 47 | %� | � | � | 457,112 | �� | � | � | 228,912 | �� | � | � | 228,200 | �� | � | � | 100 | %� |
| Unrealized |
� | � | � | � | � | � | � | � | ||||||||||||||||||||||||
| Carried Interest |
� | � | 96,455 | �� | � | � | (86,300 | )� | � | � | 182,755 | �� | � | � | N/M | �� | � | � | 765,730 | �� | � | � | 12,672 | �� | � | � | 753,058 | �� | � | � | N/M | �� |
| � | � |
� |
� | � | � |
� |
� | � | � |
� |
� | � | � |
� |
� | � | � |
� |
� | � | � |
� |
� | � | � |
� |
� | � | � |
� |
� | |
| Total Performance Fees |
� | � | 221,368 | �� | � | � | (1,179 | )� | � | � | 222,547 | �� | � | � | N/M | �� | � | � | 1,222,842 | �� | � | � | 241,584 | �� | � | � | 981,258 | �� | � | � | 406 | %� |
| � | � |
� |
� | � | � |
� |
� | � | � |
� |
� | � | � |
� |
� | � | � |
� |
� | � | � |
� |
� | � | � |
� |
� | � | � |
� |
� | |
| Investment Income (Loss) |
� | � | � | � | � | � | � | � | ||||||||||||||||||||||||
| Realized |
� | � | 20,421 | �� | � | � | 11,495 | �� | � | � | 8,926 | �� | � | � | 78 | %� | � | � | 155,768 | �� | � | � | 57,243 | �� | � | � | 98,525 | �� | � | � | 172 | %� |
| Unrealized |
� | � | (12,754 | )� | � | � | 23,621 | �� | � | � | (36,375 | )� | � | � | N/M | �� | � | � | (4,125 | )� | � | � | 76,420 | �� | � | � | (80,545 | )� | � | � | N/M | �� |
| � | � |
� |
� | � | � |
� |
� | � | � |
� |
� | � | � |
� |
� | � | � |
� |
� | � | � |
� |
� | � | � |
� |
� | � | � |
� |
� | |
| Total Investment Income |
� | � | 7,667 | �� | � | � | 35,116 | �� | � | � | (27,449 | )� | � | � | -78 | %� | � | � | 151,643 | �� | � | � | 133,663 | �� | � | � | 17,980 | �� | � | � | 13 | %� |
| Interest and Dividend Revenue |
� | � | 5,346 | �� | � | � | 5,231 | �� | � | � | 115 | �� | � | � | 2 | %� | � | � | 15,240 | �� | � | � | 11,466 | �� | � | � | 3,774 | �� | � | � | 33 | %� |
| Other |
� | � | 2,150 | �� | � | � | 1,521 | �� | � | � | 629 | �� | � | � | 41 | %� | � | � | 3,578 | �� | � | � | 2,311 | �� | � | � | 1,267 | �� | � | � | 55 | %� |
| � | � |
� |
� | � | � |
� |
� | � | � |
� |
� | � | � |
� |
� | � | � |
� |
� | � | � |
� |
� | � | � |
� |
� | � | � |
� |
� | |
| Total Revenues |
� | � | 387,926 | �� | � | � | 149,942 | �� | � | � | 237,984 | �� | � | � | 159 | %� | � | � | 1,810,990 | �� | � | � | 731,515 | �� | � | � | 1,079,475 | �� | � | � | 148 | %� |
| � | � |
� |
� | � | � |
� |
� | � | � |
� |
� | � | � |
� |
� | � | � |
� |
� | � | � |
� |
� | � | � |
� |
� | � | � |
� |
� | |
| Expenses |
� | � | � | � | � | � | � | � | ||||||||||||||||||||||||
| Compensation and Benefits |
� | � | � | � | � | � | � | � | ||||||||||||||||||||||||
| Compensation |
� | � | 79,007 | �� | � | � | 55,800 | �� | � | � | 23,207 | �� | � | � | 42 | %� | � | � | 225,352 | �� | � | � | 179,750 | �� | � | � | 45,602 | �� | � | � | 25 | %� |
| Performance Fee Compensation |
� | � | � | � | � | � | � | � | ||||||||||||||||||||||||
| Realized |
� | � | � | � | � | � | � | � | ||||||||||||||||||||||||
| Carried Interest |
� | � | 30,944 | �� | � | � | 19,824 | �� | � | � | 11,120 | �� | � | � | 56 | %� | � | � | 229,435 | �� | � | � | 36,947 | �� | � | � | 192,488 | �� | � | � | 521 | %� |
| Unrealized |
� | � | � | � | � | � | � | � | ||||||||||||||||||||||||
| Carried Interest |
� | � | 93,434 | �� | � | � | (36,198 | )� | � | � | 129,632 | �� | � | � | N/M | �� | � | � | 132,480 | �� | � | � | 68,532 | �� | � | � | 63,948 | �� | � | � | 93 | %� |
| � | � |
� |
� | � | � |
� |
� | � | � |
� |
� | � | � |
� |
� | � | � |
� |
� | � | � |
� |
� | � | � |
� |
� | � | � |
� |
� | |
| Total Compensation and Benefits |
� | � | 203,385 | �� | � | � | 39,426 | �� | � | � | 163,959 | �� | � | � | 416 | %� | � | � | 587,267 | �� | � | � | 285,229 | �� | � | � | 302,038 | �� | � | � | 106 | %� |
| Other Operating Expenses |
� | � | 34,109 | �� | � | � | 30,024 | �� | � | � | 4,085 | �� | � | � | 14 | %� | � | � | 106,308 | �� | � | � | 91,370 | �� | � | � | 14,938 | �� | � | � | 16 | %� |
| � | � |
� |
� | � | � |
� |
� | � | � |
� |
� | � | � |
� |
� | � | � |
� |
� | � | � |
� |
� | � | � |
� |
� | � | � |
� |
� | |
| Total Expenses |
� | � | 237,494 | �� | � | � | 69,450 | �� | � | � | 168,044 | �� | � | � | 242 | %� | � | � | 693,575 | �� | � | � | 376,599 | �� | � | � | 316,976 | �� | � | � | 84 | %� |
| � | � |
� |
� | � | � |
� |
� | � | � |
� |
� | � | � |
� |
� | � | � |
� |
� | � | � |
� |
� | � | � |
� |
� | � | � |
� |
� | |
| Economic Income |
� | $ | 150,432 | �� | � | $ | 80,492 | �� | � | $ | 69,940 | �� | � | � | 87 | %� | � | $ | 1,117,415 | �� | � | $ | 354,916 | �� | � | $ | 762,499 | �� | � | � | 215 | %� |
| � | � |
� |
� | � | � |
� |
� | � | � |
� |
� | � | � |
� |
� | � | � |
� |
� | � | � |
� |
� | � | � |
� |
� | � | � |
� |
� | |
�
N/M Not meaningful.
Revenues
Revenues were $387.9�million for the three months ended September�30,�2014, an increase of $238.0�million compared to $149.9�million for the three months ended September�30,�2013. The increase in revenues was primarily attributable to increases in Performance Fees and Total Management Fees of $222.5�million and $42.1�million, respectively, partially offset by a decrease in Investment Income of $27.4�million.
�
91
Table of Contents
Performance Fees, which are determined on a fund by fund basis, were $221.4�million for the three months ended September�30, 2014, an increase of $222.5�million compared to $(1.2)�million for the three months ended September�30, 2013, driven by BCP V and BCP VI, each generating net returns of 4%. These returns were driven mainly by the respective funds� public holdings, including the completion of initial public offerings of Catalent, Travelport and Vivint�s solar business, and private holdings in the services, retail/consumer and hospitality/leisure sectors.
Total Management Fees were $151.4�million for the three months ended September�30, 2014, an increase of $42.1�million compared to $109.3�million for the three months ended September�30, 2013, primarily driven by increases in Transaction and Other Fees and Base Management Fees. Transaction and Other Fees were $49.0�million for the three months ended September�30, 2014, an increase of $32.9�million compared to $16.1�million for the three months ended September�30, 2013, principally as a result of several new portfolio investments that closed during the three months ended September�30, 2014. Base Management Fees were $108.2�million for the three months ended September�30, 2014, an increase of $13.0�million compared to $95.3�million for the three months ended September�30, 2013, primarily due to Strategic Partners secondary private fund of funds business and the increase in funds raised for our Tactical Opportunities investment vehicles.
Investment Income was $7.7�million for the three months ended September�30, 2014, a decrease of $27.4�million compared to $35.1�million for the three months ended September�30, 2013, primarily due to valuation decreases in certain principal investments.
Revenues were $1.8�billion for the nine months ended September�30, 2014, an increase of $1.1�billion compared to $731.5�million for the nine months ended September�30, 2013. The increase in revenues was primarily attributable to increases in Performance Fees, Total Management Fees and Investment Income of $981.3�million, $75.2�million and $18.0�million, respectively.
Performance Fees, which are determined on a fund by fund basis, were $1.2�billion for the nine months ended September�30, 2014, an increase of $981.3�million, compared to $241.6�million for the nine months ended September�30, 2013, driven mainly by BCP V and BCP VI which generated net returns of 18% and 22%, respectively for the nine months ended September�30, 2014. BCP V crossed its preferred return threshold during the second quarter of 2014 and is now fully generating performance fees. The performance of the funds was a result of the strong performance of both our public holdings, including the initial public offerings of Michaels Stores, Catalent, Travelport and Vivint�s solar business and private holdings in the services, healthcare and energy sectors. Realized Performance Fees of $457.1�million during the nine months ended September�30, 2014 were driven by realizations in several investments across our energy portfolio including GeoSouthern, Cheniere, PBF Energy and Royal Resources, alongside other strategic and public exits in the remaining private equity portfolio.
Total Management Fees were $417.7�million for the nine months ended September�30, 2014, an increase of $75.2�million compared to $342.5�million for the nine months ended September�30, 2013, primarily driven by increases in Base Management Fees and Transaction and Other Fees. Base Management Fees were $310.0�million for the nine months ended September�30, 2014, an increase of $41.9�million compared to $268.1�million for the nine months ended September�30, 2013, primarily due to the addition of the Strategic Partners secondary private fund of funds business that closed during 2013 as well as the increase in funds raised for our Tactical Opportunities investment vehicles. Transaction and Other Fees were $119.5�million for the nine months ended September�30, 2014, an increase of $40.6�million compared to $78.9�million for the nine months ended September�30, 2013, principally as a result of several new portfolio investments that closed during the nine months ended September�30, 2014.
Investment Income was $151.6�million for the nine months ended September�30, 2014, an increase of $18.0�million, compared to $133.7�million for the nine months ended September�30, 2013, driven by performance described above.
�
92
Table of Contents
Expenses
Expenses were $237.5�million for the three months ended September�30, 2014, an increase of $168.0�million compared to $69.5�million for the three months ended September�30, 2013. The increase was primarily attributable to increases of $140.8�million in Performance Fee Compensation and $23.2�million in Compensation. Performance Fee Compensation increased as a result of the increase in Performance Fees Revenue. Compensation increased primarily due to the increase in revenue, on which a portion of compensation is based, acquisition of Strategic Partners as well as an increase in headcount to support the growth of the business.
Expenses were $693.6�million for the nine months ended September�30, 2014, an increase of $317.0�million compared to $376.6�million for the nine months ended September�30, 2013. The increase was attributable to increases of $256.4�million in Performance Fee Compensation, $45.6�million in Compensation and $14.9�million in Other Operating Expenses. Performance Fee Compensation increased as a result of the increase in Performance Fees Revenue. Compensation increased primarily due to the increase in revenue, on which a portion of compensation is based, acquisition of Strategic Partners as well as an increase in headcount to support the growth of the business. Other Operating Expenses increased mainly due to the acquisition of Strategic Partners as well as increases in interest expense allocated to the segment and business development expenses.
Fund Returns
Fund returns information for our significant funds is included throughout this discussion and analysis to facilitate an understanding of our results of operations for the periods presented. The fund returns information reflected in this discussion and analysis is not indicative of the financial performance of The Blackstone Group L.P. and is also not necessarily indicative of the future performance of any particular fund. An investment in The Blackstone Group L.P. is not an investment in any of our funds. There can be no assurance that any of our funds or our other existing and future funds will achieve similar returns.
The following table presents the internal rates of return of our significant private equity funds:
�
| � | �� | Three Months Ended September�30, |
� | � | Nine Months Ended September�30, |
� | � | September�30, 2014 Inception to Date |
� | |||||||||||||||||||||||||||||||||||||||
| � | �� | 2014 | � | � | 2013 (a) | � | � | 2014 | � | � | 2013 (a) | � | � | Realized | � | � | Total | � | ||||||||||||||||||||||||||||||
| Fund (b) |
�� | Gross | � | � | Net | � | � | Gross | � | � | Net | � | � | Gross | � | � | Net | � | � | Gross | � | � | Net | � | � | Gross | � | � | Net | � | � | Gross | � | � | Net | � | ||||||||||||
| BCP IV |
�� | � | -5 | %� | � | � | -5 | %� | � | � | 9 | %� | � | � | 7 | %� | � | � | -1 | %� | � | � | -1 | %� | � | � | 15 | %� | � | � | 12 | %� | � | � | 60 | %� | � | � | 45 | %� | � | � | 50 | %� | � | � | 37 | %� |
| BCP V |
�� | � | 4 | %� | � | � | 4 | %� | � | � | 5 | %� | � | � | 4 | %� | � | � | 22 | %� | � | � | 18 | %� | � | � | 22 | %� | � | � | 21 | %� | � | � | 11 | %� | � | � | 9 | %� | � | � | 10 | %� | � | � | 8 | %� |
| BCP VI |
�� | � | 5 | %� | � | � | 4 | %� | � | � | -1 | %� | � | � | -0 | %� | � | � | 30 | %� | � | � | 22 | %� | � | � | 9 | %� | � | � | 5 | %� | � | � | 84 | %� | � | � | 48 | %� | � | � | 30 | %� | � | � | 19 | %� |
| BEP |
�� | � | 0 | %� | � | � | -0 | %� | � | � | -4 | %� | � | � | -3 | %� | � | � | 23 | %� | � | � | 19 | %� | � | � | 36 | %� | � | � | 24 | %� | � | � | 94 | %� | � | � | 52 | %� | � | � | 53 | %� | � | � | 44 | %� |
| Tactical Opportunities |
�� | � | 7 | %� | � | � | 6 | %� | � | � | 3 | %� | � | � | 2 | %� | � | � | 19 | %� | � | � | 15 | %� | � | � | 13 | %� | � | � | 8 | %� | � | � | 15 | %� | � | � | 12 | %� | � | � | 24 | %� | � | � | 18 | %� |
| Strategic Partners |
�� | � | 6 | %� | � | � | 7 | %� | � | � | 4 | %� | � | � | 3 | %� | � | � | 19 | %� | � | � | 19 | %� | � | � | 5 | %� | � | � | 3 | %� | � | � | N/A | �� | � | � | N/A | �� | � | � | 18 | %� | � | � | 15 | %� |
The returns presented herein represent those of the applicable Blackstone Funds and not those of The Blackstone Group L.P.
�
N/A Not applicable.
| (a) | Changes in previous period returns are due to the repayment of fund level financing with capital drawn down from the respective fund�s general and limited partners. |
| (b) | Net returns are based on the change in carrying value (realized and unrealized) after management fees, expenses and Carried Interest allocations. |
The corporate private equity funds within the Private Equity segment have three contributed funds with closed investment periods: BCP�IV, BCP�V and BCOM. As of September�30, 2014, BCP IV was above its Carried Interest threshold (i.e., the preferred return payable to its limited partners before the general partner is eligible to receive Carried Interest) and would still be above its Carried Interest threshold even if all remaining investments were
�
93
Table of Contents
valued at zero. BCP V is comprised of two fund classes based on the timings of fund closings, the BCP V �main fund� and BCP V-AC fund. Within these fund classes, the general partner (�GP�) is subject to equalization such that (a)�the GP accrues Carried Interest when the total Carried Interest for the combined fund classes is positive and (b)�the GP realizes Carried Interest so long as clawback obligations, if any, for the combined fund classes are fully satisfied. During the quarter, both fund classes were above their respective Carried Interest thresholds. BCOM is currently above its Carried Interest threshold and has generated inception to date positive returns. We are entitled to retain previously realized Carried Interest up to 20% of BCOM�s net gains. As a result, Performance Fees are recognized from BCOM on current period gains and losses.
Real Estate
The following table presents the results of operations for our Real Estate segment:
�
| � | � | Three�Months�Ended September�30, |
� | � | 2014 vs. 2013 | � | � | Nine Months Ended September�30, |
� | � | 2014 vs. 2013 | � | ||||||||||||||||||||
| � | � | 2014 | � | � | 2013 | � | � | $ | � | � | % | � | � | 2014 | � | � | 2013 | � | � | $ | � | � | % | � | ||||||||
| � | � | (Dollars in Thousands) | � | |||||||||||||||||||||||||||||
| Segment Revenues |
� | � | � | � | � | � | � | � | ||||||||||||||||||||||||
| Management Fees, Net |
� | � | � | � | � | � | � | � | ||||||||||||||||||||||||
| Base Management Fees |
� | $ | 155,089 | �� | � | $ | 136,721 | �� | � | $ | 18,368 | �� | � | � | 13 | %� | � | $ | 472,294 | �� | � | $ | 412,067 | �� | � | $ | 60,227 | �� | � | � | 15 | %� |
| Transaction and Other Fees, Net |
� | � | 38,312 | �� | � | � | 19,205 | �� | � | � | 19,107 | �� | � | � | 99 | %� | � | � | 65,390 | �� | � | � | 47,358 | �� | � | � | 18,032 | �� | � | � | 38 | %� |
| Management Fee Offsets |
� | � | (8,977 | )� | � | � | (2,385 | )� | � | � | (6,592 | )� | � | � | -276 | %� | � | � | (25,903 | )� | � | � | (15,983 | )� | � | � | (9,920 | )� | � | � | -62 | %� |
| � | � |
� |
� | � | � |
� |
� | � | � |
� |
� | � | � |
� |
� | � | � |
� |
� | � | � |
� |
� | � | � |
� |
� | � | � |
� |
� | |
| Total Management Fees, Net |
� | � | 184,424 | �� | � | � | 153,541 | �� | � | � | 30,883 | �� | � | � | 20 | %� | � | � | 511,781 | �� | � | � | 443,442 | �� | � | � | 68,339 | �� | � | � | 15 | %� |
| � | � |
� |
� | � | � |
� |
� | � | � |
� |
� | � | � |
� |
� | � | � |
� |
� | � | � |
� |
� | � | � |
� |
� | � | � |
� |
� | |
| Performance Fees |
� | � | � | � | � | � | � | � | ||||||||||||||||||||||||
| Realized |
� | � | � | � | � | � | � | � | ||||||||||||||||||||||||
| Carried Interest |
� | � | 349,237 | �� | � | � | 93,878 | �� | � | � | 255,359 | �� | � | � | 272 | %� | � | � | 961,721 | �� | � | � | 306,132 | �� | � | � | 655,589 | �� | � | � | 214 | %� |
| Incentive Fees |
� | � | 1,159 | �� | � | � | 3,737 | �� | � | � | (2,578 | )� | � | � | -69 | %� | � | � | 7,203 | �� | � | � | 37,931 | �� | � | � | (30,728 | )� | � | � | -81 | %� |
| Unrealized |
� | � | � | � | � | � | � | � | ||||||||||||||||||||||||
| Carried Interest |
� | � | 187,175 | �� | � | � | 340,406 | �� | � | � | (153,231 | )� | � | � | -45 | %� | � | � | 446,873 | �� | � | � | 880,454 | �� | � | � | (433,581 | )� | � | � | -49 | %� |
| Incentive Fees |
� | � | (374 | )� | � | � | 2,481 | �� | � | � | (2,855 | )� | � | � | N/M | �� | � | � | (1,120 | )� | � | � | (27,398 | )� | � | � | 26,278 | �� | � | � | 96 | %� |
| � | � |
� |
� | � | � |
� |
� | � | � |
� |
� | � | � |
� |
� | � | � |
� |
� | � | � |
� |
� | � | � |
� |
� | � | � |
� |
� | |
| Total Performance Fees |
� | � | 537,197 | �� | � | � | 440,502 | �� | � | � | 96,695 | �� | � | � | 22 | %� | � | � | 1,414,677 | �� | � | � | 1,197,119 | �� | � | � | 217,558 | �� | � | � | 18 | %� |
| � | � |
� |
� | � | � |
� |
� | � | � |
� |
� | � | � |
� |
� | � | � |
� |
� | � | � |
� |
� | � | � |
� |
� | � | � |
� |
� | |
| Investment Income (Loss) |
� | � | � | � | � | � | � | � | ||||||||||||||||||||||||
| Realized |
� | � | 49,173 | �� | � | � | 928 | �� | � | � | 48,245 | �� | � | � | N/M | �� | � | � | 203,194 | �� | � | � | 29,039 | �� | � | � | 174,155 | �� | � | � | 600 | %� |
| Unrealized |
� | � | 14,492 | �� | � | � | 57,656 | �� | � | � | (43,164 | )� | � | � | -75 | %� | � | � | (30,566 | )� | � | � | 148,595 | �� | � | � | (179,161 | )� | � | � | N/M | �� |
| � | � |
� |
� | � | � |
� |
� | � | � |
� |
� | � | � |
� |
� | � | � |
� |
� | � | � |
� |
� | � | � |
� |
� | � | � |
� |
� | |
| Total Investment Income |
� | � | 63,665 | �� | � | � | 58,584 | �� | � | � | 5,081 | �� | � | � | 9 | %� | � | � | 172,628 | �� | � | � | 177,634 | �� | � | � | (5,006 | )� | � | � | -3 | %� |
| Interest and Dividend Revenue |
� | � | 7,135 | �� | � | � | 6,060 | �� | � | � | 1,075 | �� | � | � | 18 | %� | � | � | 21,254 | �� | � | � | 14,754 | �� | � | � | 6,500 | �� | � | � | 44 | %� |
| Other |
� | � | 976 | �� | � | � | 2,113 | �� | � | � | (1,137 | )� | � | � | -54 | %� | � | � | 1,075 | �� | � | � | 1,706 | �� | � | � | (631 | )� | � | � | -37 | %� |
| � | � |
� |
� | � | � |
� |
� | � | � |
� |
� | � | � |
� |
� | � | � |
� |
� | � | � |
� |
� | � | � |
� |
� | � | � |
� |
� | |
| Total Revenues |
� | � | 793,397 | �� | � | � | 660,800 | �� | � | � | 132,597 | �� | � | � | 20 | %� | � | � | 2,121,415 | �� | � | � | 1,834,655 | �� | � | � | 286,760 | �� | � | � | 16 | %� |
| � | � |
� |
� | � | � |
� |
� | � | � |
� |
� | � | � |
� |
� | � | � |
� |
� | � | � |
� |
� | � | � |
� |
� | � | � |
� |
� | |
| Expenses |
� | � | � | � | � | � | � | � | ||||||||||||||||||||||||
| Compensation and Benefits |
� | � | � | � | � | � | � | � | ||||||||||||||||||||||||
| Compensation |
� | � | 90,586 | �� | � | � | 75,346 | �� | � | � | 15,240 | �� | � | � | 20 | %� | � | � | 256,401 | �� | � | � | 218,597 | �� | � | � | 37,804 | �� | � | � | 17 | %� |
| Performance Fee Compensation |
� | � | � | � | � | � | � | � | ||||||||||||||||||||||||
| Realized |
� | � | � | � | � | � | � | � | ||||||||||||||||||||||||
| Carried Interest |
� | � | 64,187 | �� | � | � | 38,942 | �� | � | � | 25,245 | �� | � | � | 65 | %� | � | � | 259,462 | �� | � | � | 119,810 | �� | � | � | 139,652 | �� | � | � | 117 | %� |
| Incentive Fees |
� | � | 592 | �� | � | � | 1,919 | �� | � | � | (1,327 | )� | � | � | -69 | %� | � | � | 3,657 | �� | � | � | 19,376 | �� | � | � | (15,719 | )� | � | � | -81 | %� |
| Unrealized |
� | � | � | � | � | � | � | � | ||||||||||||||||||||||||
| Carried Interest |
� | � | 108,789 | �� | � | � | 99,323 | �� | � | � | 9,466 | �� | � | � | 10 | %� | � | � | 193,113 | �� | � | � | 266,984 | �� | � | � | (73,871 | )� | � | � | -28 | %� |
| Incentive Fees |
� | � | (123 | )� | � | � | 615 | �� | � | � | (738 | )� | � | � | N/M | �� | � | � | (524 | )� | � | � | (14,680 | )� | � | � | 14,156 | �� | � | � | 96 | %� |
| � | � |
� |
� | � | � |
� |
� | � | � |
� |
� | � | � |
� |
� | � | � |
� |
� | � | � |
� |
� | � | � |
� |
� | � | � |
� |
� | |
| Total Compensation and Benefits |
� | � | 264,031 | �� | � | � | 216,145 | �� | � | � | 47,886 | �� | � | � | 22 | %� | � | � | 712,109 | �� | � | � | 610,087 | �� | � | � | 102,022 | �� | � | � | 17 | %� |
| Other Operating Expenses |
� | � | 36,138 | �� | � | � | 30,614 | �� | � | � | 5,524 | �� | � | � | 18 | %� | � | � | 105,787 | �� | � | � | 86,693 | �� | � | � | 19,094 | �� | � | � | 22 | %� |
| � | � |
� |
� | � | � |
� |
� | � | � |
� |
� | � | � |
� |
� | � | � |
� |
� | � | � |
� |
� | � | � |
� |
� | � | � |
� |
� | |
| Total Expenses |
� | � | 300,169 | �� | � | � | 246,759 | �� | � | � | 53,410 | �� | � | � | 22 | %� | � | � | 817,896 | �� | � | � | 696,780 | �� | � | � | 121,116 | �� | � | � | 17 | %� |
| � | � |
� |
� | � | � |
� |
� | � | � |
� |
� | � | � |
� |
� | � | � |
� |
� | � | � |
� |
� | � | � |
� |
� | � | � |
� |
� | |
| Economic Income |
� | $ | 493,228 | �� | � | $ | 414,041 | �� | � | $ | 79,187 | �� | � | � | 19 | %� | � | $ | 1,303,519 | �� | � | $ | 1,137,875 | �� | � | $ | 165,644 | �� | � | � | 15 | %� |
| � | � |
� |
� | � | � |
� |
� | � | � |
� |
� | � | � |
� |
� | � | � |
� |
� | � | � |
� |
� | � | � |
� |
� | � | � |
� |
� | |
�
N/M Not meaningful.
�
94
Table of Contents
Revenues
Revenues were $793.4�million for the three months ended September�30, 2014, an increase of $132.6�million compared to $660.8�million for the three months ended September�30, 2013. The increase in revenues was primarily attributable to increases of $96.7�million in Performance Fees and $30.9�million in Total Management Fees.
Performance Fees, which are determined on a fund by fund basis, were $537.2�million for the three months ended September�30, 2014, an increase of $96.7�million compared to $440.5�million for the three months ended September�30, 2013. Performance Fees increased due to the increase in the net appreciation of investments from our BREP carry funds. For the three months ended September�30, 2014, the carrying value of assets for Blackstone�s contributed Real Estate funds, including fee-paying co-investments, increased 6.2% driven by appreciation in the private portfolio (7.1%, $2.6 billion) from improving fundamentals and public portfolio appreciation (4.3%, $802.2 million).
Total Management Fees were $184.4�million for the three months ended September�30, 2014, an increase of $30.9�million compared to $153.5�million for the three months ended September�30, 2013, primarily attributable to increases in Transaction and Other Fees and Base Management Fees. Transaction and Other Fees were $38.3�million for the three months ended September�30, 2014, an increase of $19.1�million compared to $19.2�million for the three months ended September�30, 2013. The increase in Transaction and Other Fees was primarily related to a one-time arrangement fee on a completed transaction. Base Management Fees were $155.1�million for the three months ended September�30, 2014, an increase of $18.4�million compared to $136.7�million for the three months ended September�30, 2013. The increase was primarily due to fees generated from fundraising within BREP Europe IV, BREP Asia, Core+ and BREDS, partially offset by the expiration of BREP V and realizations across the portfolio.
Revenues were $2.1�billion for the nine months ended September�30, 2014, an increase of $286.8�million compared to $1.8�billion for the nine months ended September�30, 2013. The increase in revenues was primarily attributable to increases of $217.6�million in Performance Fees and $68.3�million in Total Management Fees.
Performance Fees, which are determined on a fund by fund basis, were $1.4�billion for the nine months ended September�30, 2014, an increase of $217.6�million compared to $1.2�billion for the nine months ended September�30, 2013. Performance Fees increased due to the increase in the net appreciation of investments from our BREP carry funds. For the nine months ended September�30, 2014, the carrying value of assets for Blackstone�s contributed Real Estate funds, including fee-paying co-investments, increased 15.3% driven by sustained strong operating fundamentals in the private portfolio (17.5%, $6.2�billion) and public portfolio appreciation (11.7%, $2.5�billion). Our BREDS drawdown and real estate hedge funds appreciated 5.8% and 6.7%, respectively.
Total Management Fees were $511.8�million for the nine months ended September�30, 2014, an increase of $68.3�million compared to $443.4�million for the nine months ended September�30, 2013, primarily attributable to increases in Base Management Fees and Transaction and Other Fees. Base Management Fees were $472.3�million for the nine months ended September�30, 2014, an increase of $60.2�million compared to $412.1�million for the nine months ended September�30, 2013. The increase was primarily due to fees generated from fundraising within BREP Europe IV, BREP Asia, Core+ and BREDS, partially offset by the expiration of BREP V and realizations across the portfolio. Transaction and Other Fees were $65.4�million for the nine months ended September�30, 2014, an increase of $18.0�million compared to $47.4�million for the nine months ended September�30, 2013. The increase in Transaction and Other Fees was primarily related to one-time arrangement fees on completed transactions.
Expenses
Expenses were $300.2�million for the three months ended September�30, 2014, an increase of $53.4�million compared to $246.8�million for the three months ended September�30, 2013. The increase was primarily attributable to increases of $32.6�million in Performance Fee Compensation and $15.2�million in Compensation. The increase in Performance Fee Compensation was due to the increase in Performance Fees Revenue. The increase in
�
95
Table of Contents
Compensation was due to an overall increase in Total Management Fees, on which a portion of compensation is based, as well as an increase in headcount to support the growth of the business.
Expenses were $817.9�million for the nine months ended September�30, 2014, an increase of $121.1�million compared to $696.8�million for the nine months ended September�30, 2013. The increase was attributable to increases of $64.2�million in Performance Fee Compensation, $37.8�million in Compensation and $19.1�million in Other Operating Expenses. The increase in Performance Fee Compensation was due to the increase in Performance Fees Revenue. The increase in Compensation was due to due to an overall increase in Total Management Fees, on which a portion of compensation is based, as well as an increase in headcount to support the growth of the business. The increase in Other Operating Expenses was primarily due to interest expense allocated to the segment as well as increases in business development and professional fees.
Fund Returns
Fund return information for our significant funds is included throughout this discussion and analysis to facilitate an understanding of our results of operations for the periods presented. The fund returns information reflected in this discussion and analysis is not indicative of the financial performance of The Blackstone Group L.P. and is also not necessarily indicative of the future performance of any particular fund. An investment in The Blackstone Group L.P. is not an investment in any of our funds. There can be no assurance that any of our funds or our other existing and future funds will achieve similar returns.
The following table presents the internal rates of return of our significant real estate funds:
�
| � | �� | Three Months Ended September�30, |
� | � | Nine Months Ended September�30, |
� | � | September�30, 2014 Inception to Date |
� | |||||||||||||||||||||||||||||||||||||||
| � | �� | 2014 | � | � | 2013 | � | � | 2014 | � | � | 2013 | � | � | Realized | � | � | Total | � | ||||||||||||||||||||||||||||||
| Fund (a) |
�� | Gross | � | � | Net | � | � | Gross | � | � | Net | � | � | Gross | � | � | Net | � | � | Gross | � | � | Net | � | � | Gross | � | � | Net | � | � | Gross | � | � | Net | � | ||||||||||||
| BREP International (b) |
�� | � | 2 | %� | � | � | 2 | %� | � | � | ��� | �� | � | � | ��� | �� | � | � | 49 | %� | � | � | 40 | %� | � | � | ��� | �� | � | � | ��� | �� | � | � | 35 | %� | � | � | 25 | %� | � | � | 33 | %� | � | � | 23 | %� |
| BREP IV |
�� | � | 1 | %� | � | � | 1 | %� | � | � | 3 | %� | � | � | 2 | %� | � | � | 5 | %� | � | � | 4 | %� | � | � | 15 | %� | � | � | 11 | %� | � | � | 94 | %� | � | � | 63 | %� | � | � | 23 | %� | � | � | 14 | %� |
| BREP V |
�� | � | 5 | %� | � | � | 5 | %� | � | � | 5 | %� | � | � | 4 | %� | � | � | 15 | %� | � | � | 13 | %� | � | � | 14 | %� | � | � | 11 | %� | � | � | 22 | %� | � | � | 18 | %� | � | � | 14 | %� | � | � | 11 | %� |
| BREP International II (b) |
�� | � | 12 | %� | � | � | 12 | %� | � | � | 4 | %� | � | � | 3 | %� | � | � | 19 | %� | � | � | 18 | %� | � | � | 14 | %� | � | � | 13 | %� | � | � | 12 | %� | � | � | 10 | %� | � | � | 6 | %� | � | � | 4 | %� |
| BREP VI |
�� | � | 5 | %� | � | � | 4 | %� | � | � | 6 | %� | � | � | 5 | %� | � | � | 13 | %� | � | � | 11 | %� | � | � | 19 | %� | � | � | 15 | %� | � | � | 20 | %� | � | � | 16 | %� | � | � | 18 | %� | � | � | 14 | %� |
| BREP Europe III (b) |
�� | � | 11 | %� | � | � | 9 | %� | � | � | 5 | %� | � | � | 4 | %� | � | � | 24 | %� | � | � | 19 | %� | � | � | 16 | %� | � | � | 12 | %� | � | � | 44 | %� | � | � | 32 | %� | � | � | 32 | %� | � | � | 20 | %� |
| BREP VII |
�� | � | 8 | %� | � | � | 6 | %� | � | � | 8 | %� | � | � | 6 | %� | � | � | 23 | %� | � | � | 18 | %� | � | � | 30 | %� | � | � | 21 | %� | � | � | 56 | %� | � | � | 38 | %� | � | � | 39 | %� | � | � | 27 | %� |
| BREP Asia |
�� | � | 3 | %� | � | � | 1 | %� | � | � | N/M | �� | � | � | N/M | �� | � | � | 13 | %� | � | � | 6 | %� | � | � | N/M | �� | � | � | N/M | �� | � | � | N/A | �� | � | � | N/A | �� | � | � | 26 | %� | � | � | 14 | %� |
| BREP Europe IV (b) |
�� | � | 7 | %� | � | � | 5 | %� | � | � | N/A | �� | � | � | N/A | �� | � | � | 24 | %� | � | � | 14 | %� | � | � | N/A | �� | � | � | N/A | �� | � | � | 152 | %� | � | � | 73 | %� | � | � | 33 | %� | � | � | 19 | %� |
| BREDS |
�� | � | 5 | %� | � | � | 3 | %� | � | � | 3 | %� | � | � | 2 | %� | � | � | 12 | %� | � | � | 8 | %� | � | � | 11 | %� | � | � | 9 | %� | � | � | 19 | %� | � | � | 15 | %� | � | � | 17 | %� | � | � | 13 | %� |
| BSSF I |
�� | � | 1 | %� | � | � | 1 | %� | � | � | 3 | %� | � | � | 2 | %� | � | � | 11 | %� | � | � | 8 | %� | � | � | 9 | %� | � | � | 7 | %� | � | � | N/A | �� | � | � | N/A | �� | � | � | 15 | %� | � | � | 11 | %� |
| CMBS |
�� | � | 0 | %� | � | � | -1 | %� | � | � | 2 | %� | � | � | 2 | %� | � | � | 8 | %� | � | � | 5 | %� | � | � | 7 | %� | � | � | 4 | %� | � | � | N/A | �� | � | � | N/A | �� | � | � | 16 | %� | � | � | 11 | %� |
| BREP Co-Investment |
�� | � | 5 | %� | � | � | 2 | %� | � | � | 6 | %� | � | � | 6 | %� | � | � | 18 | %� | � | � | 16 | %� | � | � | 20 | %� | � | � | 19 | %� | � | � | 16 | %� | � | � | 14 | %� | � | � | 19 | %� | � | � | 17 | %� |
The returns presented herein represent those of the applicable Blackstone Funds and not those of The Blackstone Group L.P.
�
N/A Not applicable.
N/M Not meaningful.
| (a) | Net returns are based on the change in carrying value (realized and unrealized) after management fees, expenses and performance fee allocations. |
| (b) | Euro-based internal rates of return. |
�
96
Table of Contents
The following table presents the Carried Interest status of our real estate carry funds with expired investment periods which are currently not generating performance fees as of September�30, 2014:
�
| � | �� | Gain to Cross Carried Interest Threshold (a) | � | |||||||||
| Fully Invested Funds |
�� | Amount | � | �� | %�Change�in Total�Enterprise Value (b) |
� | � | %�Change�in Equity�Value |
� | |||
| � | �� | (Amounts�in�Millions) | � | �� | � | � | � | � | � | |||
| BREP Int�l II (Sep 2005 / Jun 2008) |
�� | � | 805 | �� | �� | � | 22 | %� | � | � | 57 | %� |
�
| (a) | The general partner of each fund is allocated Carried Interest when the annualized returns, net of management fees and expenses, exceed the preferred return as dictated by the fund agreements. The preferred return is calculated for each limited partner individually. The Gain to Cross Carried Interest Threshold represents the increase in equity at the fund level (excluding our side-by-side investments) that is required for the general partner to begin accruing Carried Interest, assuming the gain is earned pro rata across the fund�s investments and is achieved at the reporting date. |
| (b) | Total Enterprise Value is the respective fund�s pro rata ownership of the privately held portfolio companies� Enterprise Value. |
The Real Estate segment has six funds in their investment period, which were above their respective Carried Interest thresholds as of September�30, 2014: BREP�VII, BREP Asia, BREP Europe IV and three funds within BREDS�II.
�
97
Table of Contents
Hedge Fund Solutions
The following table presents the results of operations for our Hedge Fund Solutions segment:
�
| � | � | Three Months Ended September�30, |
� | � | 2014 vs. 2013 | � | � | Nine Months Ended September�30, |
� | � | 2014 vs. 2013 | � | ||||||||||||||||||||
| � | � | 2014 | � | � | 2013 | � | � | $ | � | � | % | � | � | 2014 | � | � | 2013 | � | � | $ | � | � | % | � | ||||||||
| � | � | (Dollars in Thousands) | � | |||||||||||||||||||||||||||||
| Segment Revenues |
� | � | � | � | � | � | � | � | ||||||||||||||||||||||||
| Management Fees, Net |
� | � | � | � | � | � | � | � | ||||||||||||||||||||||||
| Base Management Fees |
� | $ | 121,484 | �� | � | $ | 103,392 | �� | � | $ | 18,092 | �� | � | � | 17 | %� | � | $ | 357,876 | �� | � | $ | 296,296 | �� | � | $ | 61,580 | �� | � | � | 21 | %� |
| Transaction and Other Fees, Net |
� | � | 161 | �� | � | � | 295 | �� | � | � | (134 | )� | � | � | -45 | %� | � | � | 380 | �� | � | � | 360 | �� | � | � | 20 | �� | � | � | 6 | %� |
| Management Fee Offsets |
� | � | (1,099 | )� | � | � | (1,200 | )� | � | � | 101 | �� | � | � | 8 | %� | � | � | (4,085 | )� | � | � | (2,238 | )� | � | � | (1,847 | )� | � | � | -83 | %� |
| � | � |
� |
� | � | � |
� |
� | � | � |
� |
� | � | � |
� |
� | � | � |
� |
� | � | � |
� |
� | � | � |
� |
� | � | � |
� |
� | |
| Total Management Fees, Net |
� | � | 120,546 | �� | � | � | 102,487 | �� | � | � | 18,059 | �� | � | � | 18 | %� | � | � | 354,171 | �� | � | � | 294,418 | �� | � | � | 59,753 | �� | � | � | 20 | %� |
| � | � |
� |
� | � | � |
� |
� | � | � |
� |
� | � | � |
� |
� | � | � |
� |
� | � | � |
� |
� | � | � |
� |
� | � | � |
� |
� | |
| Performance Fees |
� | � | � | � | � | � | � | � | ||||||||||||||||||||||||
| Realized |
� | � | � | � | � | � | � | � | ||||||||||||||||||||||||
| Incentive Fees |
� | � | 6,683 | �� | � | � | 5,320 | �� | � | � | 1,363 | �� | � | � | 26 | %� | � | � | 54,501 | �� | � | � | 32,874 | �� | � | � | 21,627 | �� | � | � | 66 | %� |
| Unrealized |
� | � | � | � | � | � | � | � | ||||||||||||||||||||||||
| Incentive Fees |
� | � | 25,473 | �� | � | � | 29,208 | �� | � | � | (3,735 | )� | � | � | -13 | %� | � | � | 74,114 | �� | � | � | 105,698 | �� | � | � | (31,584 | )� | � | � | -30 | %� |
| � | � |
� |
� | � | � |
� |
� | � | � |
� |
� | � | � |
� |
� | � | � |
� |
� | � | � |
� |
� | � | � |
� |
� | � | � |
� |
� | |
| Total Performance Fees |
� | � | 32,156 | �� | � | � | 34,528 | �� | � | � | (2,372 | )� | � | � | -7 | %� | � | � | 128,615 | �� | � | � | 138,572 | �� | � | � | (9,957 | )� | � | � | -7 | %� |
| � | � |
� |
� | � | � |
� |
� | � | � |
� |
� | � | � |
� |
� | � | � |
� |
� | � | � |
� |
� | � | � |
� |
� | � | � |
� |
� | |
| Investment Income (Loss) |
� | � | � | � | � | � | � | � | ||||||||||||||||||||||||
| Realized |
� | � | 2,693 | �� | � | � | (598 | )� | � | � | 3,291 | �� | � | � | N/M | �� | � | � | 21,907 | �� | � | � | 13,922 | �� | � | � | 7,985 | �� | � | � | 57 | %� |
| Unrealized |
� | � | (1,168 | )� | � | � | 6,439 | �� | � | � | (7,607 | )� | � | � | N/M | �� | � | � | 4,320 | �� | � | � | (1,702 | )� | � | � | 6,022 | �� | � | � | N/M | �� |
| � | � |
� |
� | � | � |
� |
� | � | � |
� |
� | � | � |
� |
� | � | � |
� |
� | � | � |
� |
� | � | � |
� |
� | � | � |
� |
� | |
| Total Investment Income |
� | � | 1,525 | �� | � | � | 5,841 | �� | � | � | (4,316 | )� | � | � | -74 | %� | � | � | 26,227 | �� | � | � | 12,220 | �� | � | � | 14,007 | �� | � | � | 115 | %� |
| Interest and Dividend Revenue |
� | � | 2,724 | �� | � | � | 2,523 | �� | � | � | 201 | �� | � | � | 8 | %� | � | � | 7,725 | �� | � | � | 5,617 | �� | � | � | 2,108 | �� | � | � | 38 | %� |
| Other |
� | � | 740 | �� | � | � | 595 | �� | � | � | 145 | �� | � | � | 24 | %� | � | � | 659 | �� | � | � | 426 | �� | � | � | 233 | �� | � | � | 55 | %� |
| � | � |
� |
� | � | � |
� |
� | � | � |
� |
� | � | � |
� |
� | � | � |
� |
� | � | � |
� |
� | � | � |
� |
� | � | � |
� |
� | |
| Total Revenues |
� | � | 157,691 | �� | � | � | 145,974 | �� | � | � | 11,717 | �� | � | � | 8 | %� | � | � | 517,397 | �� | � | � | 451,253 | �� | � | � | 66,144 | �� | � | � | 15 | %� |
| � | � |
� |
� | � | � |
� |
� | � | � |
� |
� | � | � |
� |
� | � | � |
� |
� | � | � |
� |
� | � | � |
� |
� | � | � |
� |
� | |
| Expenses |
� | � | � | � | � | � | � | � | ||||||||||||||||||||||||
| Compensation and Benefits |
� | � | � | � | � | � | � | � | ||||||||||||||||||||||||
| Compensation |
� | � | 41,940 | �� | � | � | 37,611 | �� | � | � | 4,329 | �� | � | � | 12 | %� | � | � | 125,852 | �� | � | � | 108,323 | �� | � | � | 17,529 | �� | � | � | 16 | %� |
| Performance Fee Compensation |
� | � | � | � | � | � | � | � | ||||||||||||||||||||||||
| Realized |
� | � | � | � | � | � | � | � | ||||||||||||||||||||||||
| Incentive Fees |
� | � | 2,312 | �� | � | � | 1,954 | �� | � | � | 358 | �� | � | � | 18 | %� | � | � | 18,501 | �� | � | � | 12,092 | �� | � | � | 6,409 | �� | � | � | 53 | %� |
| Unrealized |
� | � | � | � | � | � | � | � | ||||||||||||||||||||||||
| Incentive Fees |
� | � | 8,778 | �� | � | � | 10,177 | �� | � | � | (1,399 | )� | � | � | -14 | %� | � | � | 26,791 | �� | � | � | 37,679 | �� | � | � | (10,888 | )� | � | � | -29 | %� |
| � | � |
� |
� | � | � |
� |
� | � | � |
� |
� | � | � |
� |
� | � | � |
� |
� | � | � |
� |
� | � | � |
� |
� | � | � |
� |
� | |
| Total Compensation and Benefits |
� | � | 53,030 | �� | � | � | 49,742 | �� | � | � | 3,288 | �� | � | � | 7 | %� | � | � | 171,144 | �� | � | � | 158,094 | �� | � | � | 13,050 | �� | � | � | 8 | %� |
| Other Operating Expenses |
� | � | 20,480 | �� | � | � | 19,575 | �� | � | � | 905 | �� | � | � | 5 | %� | � | � | 65,061 | �� | � | � | 51,269 | �� | � | � | 13,792 | �� | � | � | 27 | %� |
| � | � |
� |
� | � | � |
� |
� | � | � |
� |
� | � | � |
� |
� | � | � |
� |
� | � | � |
� |
� | � | � |
� |
� | � | � |
� |
� | |
| Total Expenses |
� | � | 73,510 | �� | � | � | 69,317 | �� | � | � | 4,193 | �� | � | � | 6 | %� | � | � | 236,205 | �� | � | � | 209,363 | �� | � | � | 26,842 | �� | � | � | 13 | %� |
| � | � |
� |
� | � | � |
� |
� | � | � |
� |
� | � | � |
� |
� | � | � |
� |
� | � | � |
� |
� | � | � |
� |
� | � | � |
� |
� | |
| Economic Income |
� | $ | 84,181 | �� | � | $ | 76,657 | �� | � | $ | 7,524 | �� | � | � | 10 | %� | � | $ | 281,192 | �� | � | $ | 241,890 | �� | � | $ | 39,302 | �� | � | � | 16 | %� |
| � | � |
� |
� | � | � |
� |
� | � | � |
� |
� | � | � |
� |
� | � | � |
� |
� | � | � |
� |
� | � | � |
� |
� | � | � |
� |
� | |
�
N/M Not meaningful.
Revenues
Revenues were $157.7�million for the three months ended September�30, 2014, an increase of $11.7�million compared to $146.0�million for the three months ended September�30, 2013. The increase in revenues was primarily attributable to an increase of $18.1�million in Total Management Fees, partially offset by decreases of $4.3�million in Investment Income and $2.4�million in Performance Fees.
�
98
Table of Contents
Total Management Fees were $120.5�million for the three months ended September�30, 2014, an increase of $18.1�million compared to $102.5�million for the three months ended September�30, 2013, primarily due to an increase in Base Management Fees. Base Management Fees were $121.5�million for the three months ended September�30, 2014, an increase of $18.1�million compared to $103.4�million for the three months ended September�30, 2013. This increase was driven by an increase in Fee-Earning Assets Under Management of 22% from the prior year period, which was from net inflows and market appreciation.
Investment Income was $1.5�million for the three months ended September�30, 2014, a decrease of $4.3�million compared to $5.8�million for the three months ended September�30, 2013. The decrease in Investment Income was primarily driven by the year over year net depreciation of investments of which Blackstone owns a share.
Performance Fees were $32.2�million for the three months ended September�30, 2014, a decrease of $2.4�million compared to $34.5�million for the three months ended September�30, 2013. This was primarily due to lower returns. The net returns of the underlying assets within BAAM�s Principal Solutions Composite funds were 1.3% during the three months ended September�30, 2014 compared to 1.7% during the three months ended September�30, 2013.
Revenues were $517.4�million for the nine months ended September�30, 2014, an increase of $66.1�million compared to $451.3�million for the nine months ended September�30, 2013. The increase in revenues was primarily attributable to increases of $59.8�million in Total Management Fees and $14.0�million in Investment Income, partially offset by a decrease of $10.0�million in Performance Fees.
Total Management Fees were $354.2�million for the nine months ended September�30, 2014, an increase of $59.8�million compared to $294.4�million for the nine months ended September�30, 2013, primarily due to an increase in Base Management Fees. Base Management Fees were $357.9�million for the nine months ended September�30, 2014, an increase of $61.6�million compared to $296.3�million for the nine months ended September�30, 2013. This was driven by an increase in Fee-Earning Assets Under Management of 22% from the prior year period, which was from net inflows and market appreciation.
Investment Income was $26.2�million for the nine months ended September�30, 2014, an increase of $14.0�million compared to $12.2�million for the nine months ended September�30, 2013. The increase was primarily driven by the year over year increase in the net appreciation of investments of which Blackstone owns a share.
Performance Fees were $128.6�million for the nine months ended September�30, 2014, a decrease of $10.0�million compared to $138.6�million for the nine months ended September�30, 2013. This was primarily due to lower returns. The net returns of the underlying assets within BAAM�s Principal Solutions Composite funds were 5.5% during the nine months ended September�30, 2014 compared to 7.4% during the nine months ended September�30, 2013.
Expenses
Expenses were $73.5�million for the three months ended September�30, 2014, an increase of $4.2�million compared to $69.3 million for the three months ended September�30, 2013. The increase in expenses was primarily attributable to an increase of $4.3�million in Compensation. The increase in Compensation was primarily due to an increase in headcount to support the growth of the business and an increase in Total Management Fees, on which a portion of compensation is based.
Expenses were $236.2�million for the nine months ended September�30, 2014, an increase of $26.8�million compared to $209.4 million for the nine months ended September�30, 2013. The increase in expenses was primarily attributable to a $17.5�million increase in Compensation and a $13.8�million increase in Other Operating Expenses, partially offset by a decrease of $4.5 million in Performance Fee Compensation. The increase in Compensation was
�
99
Table of Contents
primarily due to an increase in headcount to support the growth of the business and an increase in Total Management Fees, on which a portion of compensation is based. The increase in Other Operating Expenses resulted primarily from increases in interest expense allocated to the segment and professional fees. The decrease in Performance Fee Compensation was due to the decrease in Performance Fees Revenue.
Operating Metrics
The following table presents information regarding our Incentive Fee-Earning Assets Under Management:
�
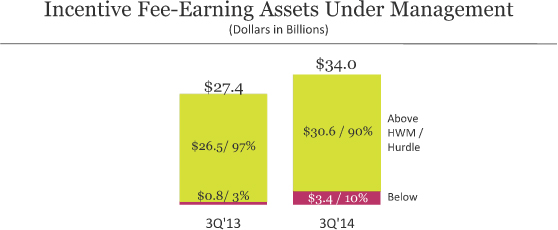
�
| � | �� | Fee-Earning Assets Under Management Eligible for Incentive Fees |
� | �� | Estimated�%�Above High Water Mark and/or Hurdle (a) |
� | ||||||||||
| � | �� | As of September�30, | � | �� | As of September�30, | � | ||||||||||
| � | �� | 2013 | � | �� | 2014 | � | �� | 2013 | � | � | 2014 | � | ||||
| � | �� | (Dollars in Thousands) | � | �� | � | � | � | � | � | |||||||
| BAAM Managed Funds (b) |
�� | $ | 27,365,773 | �� | �� | $ | 33,990,973 | �� | �� | � | 97 | %� | � | � | 90 | %� |
�
Note: Totals in graph may not add due to rounding.
| (a) | Estimated % Above High Water Mark and/or Hurdle represents the percentage of Fee-Earning Assets Under Management Eligible for Incentive Fees that as of the dates presented would earn incentive fees when the applicable BAAM managed fund has positive investment performance (relative to a hurdle, where applicable). Incremental positive performance in the applicable Blackstone Funds may cause additional assets to reach their respective High Water Mark and/or Hurdle, thereby resulting in an increase in Estimated % Above High Water Mark and/or Hurdle. |
| (b) | For the BAAM managed funds, at September�30, 2014 the incremental appreciation needed for the 10% of Fee-Earning Assets Under Management below their respective High Water Marks and/or Hurdle to reach their respective High Water Marks and/or Hurdle was $59.0�million, an increase of $21.6�million, or 58%, compared to $37.5�million at September�30, 2013. Of the Fee-Earning Assets Under Management below their respective High Water Marks and/or Hurdle as of September�30, 2014, 99.8% were within 5% of reaching their respective High Water Mark and/or Hurdle. |
Composite Returns
Composite returns information is included throughout this discussion and analysis to facilitate an understanding of our results of operations for the periods presented. The composite returns information reflected in this discussion and analysis is not indicative of the financial performance of The Blackstone Group L.P. and is also not necessarily indicative of the future results of any particular fund. An investment in The Blackstone Group L.P. is
�
100
Table of Contents
not an investment in any of our funds or composites. There can be no assurance that any of our funds or composites or our other existing and future funds or composites will achieve similar returns.
The following table presents the return information of the BAAM Managed Funds, BAAM Principal Solutions Composite:
�
| � | � | Three Months Ended September�30, |
� | � | Nine Months Ended September�30, |
� | � | Average Annual Returns (a) | � | |||||||||||||||||||||||||||||||||||||||||||||||||||||||
| � | � | � | � | Periods Ended September�30, 2014 |
� | |||||||||||||||||||||||||||||||||||||||||||||||||||||||||||
| � | � | 2014 | � | � | 2013 | � | � | 2014 | � | � | 2013 | � | � | One Year |
� | � | Three Year |
� | � | Five Year |
� | � | Historical | � | ||||||||||||||||||||||||||||||||||||||||
| Composite |
� | Gross | � | � | Net | � | � | Gross | � | � | Net | � | � | Gross | � | � | Net | � | � | Gross | � | � | Net | � | � | Gross | � | � | Net | � | � | Gross | � | � | Net | � | � | Gross | � | � | Net | � | � | Gross | � | � | Net | � | ||||||||||||||||
| BAAM Managed Funds, BAAM Principal Solutions Composite (b) |
� | � | 2 | %� | � | � | 1 | %� | � | � | 2 | %� | � | � | 2 | %� | � | � | 6 | %� | � | � | 5 | %� | � | � | 8 | %� | � | � | 7 | %� | � | � | 10 | %� | � | � | 9 | %� | � | � | 10 | %� | � | � | 9 | %� | � | � | 8 | %� | � | � | 7 | %� | � | � | 8 | %� | � | � | 7 | %� |
The returns presented represent those of the applicable Blackstone Funds and not those of The Blackstone Group L.P.
�
| (a) | Composite returns present a summarized asset-weighted return measure to evaluate the overall performance of the applicable class of Blackstone Funds. |
| (b) | BAAM�s Principal Solutions Composite covers the period from January 2000 to present, although BAAM�s inception date is September 1990. BAAM�s Principal Solutions Composite does not include BAAM�s long-only equity, long-biased commodities, seed, strategic opportunities (external investments) and advisory platforms. |
�
101
Table of Contents
Credit
The following table presents the results of operations for our Credit segment:
�
| � | � | Three Months Ended September�30, |
� | � | 2014 vs. 2013 | � | � | Nine Months Ended September�30, |
� | � | 2014 vs. 2013 | � | ||||||||||||||||||||
| � | � | 2014 | � | � | 2013 | � | � | $ | � | � | % | � | � | 2014 | � | � | 2013 | � | � | $ | � | � | % | � | ||||||||
| � | � | (Dollars in Thousands) | � | |||||||||||||||||||||||||||||
| Segment Revenues |
� | � | � | � | � | � | � | � | ||||||||||||||||||||||||
| Management Fees, Net |
� | � | � | � | � | � | � | � | ||||||||||||||||||||||||
| Base Management Fees |
� | $ | 120,684 | �� | � | $ | 101,900 | �� | � | $ | 18,784 | �� | � | � | 18 | %� | � | $ | 338,747 | �� | � | $ | 295,204 | �� | � | $ | 43,543 | �� | � | � | 15 | %� |
| Transaction and Other Fees, Net |
� | � | 3,025 | �� | � | � | 7,058 | �� | � | � | (4,033 | )� | � | � | -57 | %� | � | � | 13,433 | �� | � | � | 20,434 | �� | � | � | (7,001 | )� | � | � | -34 | %� |
| Management Fee Offsets |
� | � | (6,850 | )� | � | � | (2,606 | )� | � | � | (4,244 | )� | � | � | -163 | %� | � | � | (17,841 | )� | � | � | (5,737 | )� | � | � | (12,104 | )� | � | � | -211 | %� |
| � | � |
� |
� | � | � |
� |
� | � | � |
� |
� | � | � |
� |
� | � | � |
� |
� | � | � |
� |
� | � | � |
� |
� | � | � |
� |
� | |
| Total Management Fees, Net |
� | � | 116,859 | �� | � | � | 106,352 | �� | � | � | 10,507 | �� | � | � | 10 | %� | � | � | 334,339 | �� | � | � | 309,901 | �� | � | � | 24,438 | �� | � | � | 8 | %� |
| � | � |
� |
� | � | � |
� |
� | � | � |
� |
� | � | � |
� |
� | � | � |
� |
� | � | � |
� |
� | � | � |
� |
� | � | � |
� |
� | |
| Performance Fees |
� | � | � | � | � | � | � | � | ||||||||||||||||||||||||
| Realized |
� | � | � | � | � | � | � | � | ||||||||||||||||||||||||
| Carried Interest |
� | � | 164,602 | �� | � | � | 3,655 | �� | � | � | 160,947 | �� | � | � | N/M | �� | � | � | 195,201 | �� | � | � | 125,068 | �� | � | � | 70,133 | �� | � | � | 56 | %� |
| Incentive Fees |
� | � | 28,998 | �� | � | � | 22,181 | �� | � | � | 6,817 | �� | � | � | 31 | %� | � | � | 68,264 | �� | � | � | 60,027 | �� | � | � | 8,237 | �� | � | � | 14 | %� |
| Unrealized |
� | � | � | � | � | � | � | � | ||||||||||||||||||||||||
| Carried Interest |
� | � | (61,604 | )� | � | � | 35,946 | �� | � | � | (97,550 | )� | � | � | N/M | �� | � | � | 423 | �� | � | � | 30,979 | �� | � | � | (30,556 | )� | � | � | -99 | %� |
| Incentive Fees |
� | � | (31,630 | )� | � | � | 9,303 | �� | � | � | (40,933 | )� | � | � | N/M | �� | � | � | 38,517 | �� | � | � | 74,805 | �� | � | � | (36,288 | )� | � | � | -49 | %� |
| � | � |
� |
� | � | � |
� |
� | � | � |
� |
� | � | � |
� |
� | � | � |
� |
� | � | � |
� |
� | � | � |
� |
� | � | � |
� |
� | |
| Total Performance Fees |
� | � | 100,366 | �� | � | � | 71,085 | �� | � | � | 29,281 | �� | � | � | 41 | %� | � | � | 302,405 | �� | � | � | 290,879 | �� | � | � | 11,526 | �� | � | � | 4 | %� |
| � | � |
� |
� | � | � |
� |
� | � | � |
� |
� | � | � |
� |
� | � | � |
� |
� | � | � |
� |
� | � | � |
� |
� | � | � |
� |
� | |
| Investment Income (Loss) |
� | � | � | � | � | � | � | � | ||||||||||||||||||||||||
| Realized |
� | � | 3,040 | �� | � | � | 496 | �� | � | � | 2,544 | �� | � | � | 513 | %� | � | � | 8,334 | �� | � | � | 4,725 | �� | � | � | 3,609 | �� | � | � | 76 | %� |
| Unrealized |
� | � | 4,892 | �� | � | � | (1,042 | )� | � | � | 5,934 | �� | � | � | N/M | �� | � | � | 12,492 | �� | � | � | 4,432 | �� | � | � | 8,060 | �� | � | � | 182 | %� |
| � | � |
� |
� | � | � |
� |
� | � | � |
� |
� | � | � |
� |
� | � | � |
� |
� | � | � |
� |
� | � | � |
� |
� | � | � |
� |
� | |
| Total Investment Income (Loss) |
� | � | 7,932 | �� | � | � | (546 | )� | � | � | 8,478 | �� | � | � | N/M | �� | � | � | 20,826 | �� | � | � | 9,157 | �� | � | � | 11,669 | �� | � | � | 127 | %� |
| Interest and Dividend Revenue |
� | � | 5,968 | �� | � | � | 5,288 | �� | � | � | 680 | �� | � | � | 13 | %� | � | � | 16,721 | �� | � | � | 13,906 | �� | � | � | 2,815 | �� | � | � | 20 | %� |
| Other |
� | � | (3,619 | )� | � | � | (357 | )� | � | � | (3,262 | )� | � | � | -914 | %� | � | � | (3,867 | )� | � | � | 408 | �� | � | � | (4,275 | )� | � | � | N/M | �� |
| � | � |
� |
� | � | � |
� |
� | � | � |
� |
� | � | � |
� |
� | � | � |
� |
� | � | � |
� |
� | � | � |
� |
� | � | � |
� |
� | |
| Total Revenues |
� | � | 227,506 | �� | � | � | 181,822 | �� | � | � | 45,684 | �� | � | � | 25 | %� | � | � | 670,424 | �� | � | � | 624,251 | �� | � | � | 46,173 | �� | � | � | 7 | %� |
| � | � |
� |
� | � | � |
� |
� | � | � |
� |
� | � | � |
� |
� | � | � |
� |
� | � | � |
� |
� | � | � |
� |
� | � | � |
� |
� | |
| Expenses |
� | � | � | � | � | � | � | � | ||||||||||||||||||||||||
| Compensation and Benefits Compensation |
� | � | 54,877 | �� | � | � | 53,250 | �� | � | � | 1,627 | �� | � | � | 3 | %� | � | � | 156,939 | �� | � | � | 154,712 | �� | � | � | 2,227 | �� | � | � | 1 | %� |
| Performance Fee Compensation |
� | � | � | � | � | � | � | � | ||||||||||||||||||||||||
| Realized |
� | � | � | � | � | � | � | � | ||||||||||||||||||||||||
| Carried Interest |
� | � | 90,872 | �� | � | � | 1,603 | �� | � | � | 89,269 | �� | � | � | N/M | �� | � | � | 106,805 | �� | � | � | 68,959 | �� | � | � | 37,846 | �� | � | � | 55 | %� |
| Incentive Fees |
� | � | 16,125 | �� | � | � | 10,726 | �� | � | � | 5,399 | �� | � | � | 50 | %� | � | � | 39,015 | �� | � | � | 28,653 | �� | � | � | 10,362 | �� | � | � | 36 | %� |
| Unrealized |
� | � | � | � | � | � | � | � | ||||||||||||||||||||||||
| Carried Interest |
� | � | (38,091 | )� | � | � | 19,216 | �� | � | � | (57,307 | )� | � | � | N/M | �� | � | � | (6,435 | )� | � | � | 15,121 | �� | � | � | (21,556 | )� | � | � | N/M | �� |
| Incentive Fees |
� | � | (17,657 | )� | � | � | 292 | �� | � | � | (17,949 | )� | � | � | N/M | �� | � | � | 12,954 | �� | � | � | 35,647 | �� | � | � | (22,693 | )� | � | � | -64 | %� |
| � | � |
� |
� | � | � |
� |
� | � | � |
� |
� | � | � |
� |
� | � | � |
� |
� | � | � |
� |
� | � | � |
� |
� | � | � |
� |
� | |
| Total Compensation and Benefits |
� | � | 106,126 | �� | � | � | 85,087 | �� | � | � | 21,039 | �� | � | � | 25 | %� | � | � | 309,278 | �� | � | � | 303,092 | �� | � | � | 6,186 | �� | � | � | 2 | %� |
| Other Operating Expenses |
� | � | 20,860 | �� | � | � | 23,451 | �� | � | � | (2,591 | )� | � | � | -11 | %� | � | � | 75,858 | �� | � | � | 67,374 | �� | � | � | 8,484 | �� | � | � | 13 | %� |
| � | � |
� |
� | � | � |
� |
� | � | � |
� |
� | � | � |
� |
� | � | � |
� |
� | � | � |
� |
� | � | � |
� |
� | � | � |
� |
� | |
| Total Expenses |
� | � | 126,986 | �� | � | � | 108,538 | �� | � | � | 18,448 | �� | � | � | 17 | %� | � | � | 385,136 | �� | � | � | 370,466 | �� | � | � | 14,670 | �� | � | � | 4 | %� |
| � | � |
� |
� | � | � |
� |
� | � | � |
� |
� | � | � |
� |
� | � | � |
� |
� | � | � |
� |
� | � | � |
� |
� | � | � |
� |
� | |
| Economic Income |
� | $ | 100,520 | �� | � | $ | 73,284 | �� | � | $ | 27,236 | �� | � | � | 37 | %� | � | $ | 285,288 | �� | � | $ | 253,785 | �� | � | $ | 31,503 | �� | � | � | 12 | %� |
| � | � |
� |
� | � | � |
� |
� | � | � |
� |
� | � | � |
� |
� | � | � |
� |
� | � | � |
� |
� | � | � |
� |
� | � | � |
� |
� | |
�
| N/M | �Not meaningful. |
�
102
Table of Contents
Revenues
Revenues were $227.5�million for the three months ended September�30, 2014, an increase of $45.7�million compared to $181.8 million for the three months ended September�30, 2013. This change was primarily attributable to increases of $29.3�million in Performance Fees, $10.5�million in Total Management Fees and $8.5�million in Investment Income.
Performance Fees were $100.4�million for the three months ended September�30, 2014, an increase of $29.3�million compared to $71.1�million for the three months ended September�30, 2013. This change was primarily attributable to a greater rate of appreciation in our significant drawdown funds. The net returns of Blackstone�s significant Credit segment funds were -1.6% for the hedge funds, 12.2% for the mezzanine funds and 6.2% for the rescue lending funds for the three months ended September�30, 2014.
Total Management Fees were $116.9�million for the three months ended September�30, 2014, an increase of $10.5�million compared to $106.4�million for the three months ended September�30, 2013. This change was primarily attributable to an increase of $18.8�million in Base Management Fees resulting from the growth in our Fee-Earning Assets Under Management.
Total Investment Income (Loss) was $7.9�million for the three months ended September�30, 2014, an increase of $8.5�million compared to $(0.5)�million for the three months ended September�30, 2013. This change was primarily attributable to a greater rate of appreciation in our significant drawdown funds and CLOs in which we hold an equity position.
Revenues were $670.4�million for the nine months ended September�30, 2014, an increase of $46.2�million compared to $624.3�million for the nine months ended September�30, 2013. This change was primarily attributable to increases of $24.4�million in Total Management Fees, $11.7�million in Investment Income and $11.5�million in Performance Fees.
Total Management Fees were $334.3�million for the nine months ended September�30, 2014, an increase of $24.4�million compared to $309.9�million for the nine months ended September�30, 2013. This change was primarily attributable to an increase of $43.5�million in Base Management Fees resulting from the growth in our Fee-Earning Assets Under Management and partially offset by an increase of $12.1�million in Management Fee Offsets.
Total Investment Income was $20.8�million for the nine months ended September�30, 2014, an increase of $11.7�million compared to $9.2�million for the nine months ended September�30, 2013. This change was primarily attributable to a greater rate of appreciation in our significant drawdown funds and CLOs in which we hold an equity position.
Performance Fees were $302.4�million for the nine months ended September�30, 2014, an increase of $11.5�million compared to $290.9 million for the nine months ended September�30, 2013. This change was primarily attributable to a greater rate of appreciation in our significant drawdown funds and BDCs. The net returns of Blackstone�s significant Credit segment funds were 2.6% for the hedge funds, 19.2% for the mezzanine funds and 15.3% for the rescue lending funds for the nine months ended September�30, 2014.
Expenses
Expenses were $127.0�million for the three months ended September�30, 2014, an increase of $18.4�million compared to $108.5�million for the three months ended September�30, 2013. The increase in expenses was primarily attributable to an increase of $19.4�million in Performance Fee Compensation due to the increase in Performance Fees Revenue.
Expenses were $385.1�million for the nine months ended September�30, 2014, an increase of $14.7�million compared to $370.5�million for the nine months ended September�30, 2013. The increase in expenses was primarily
�
103
Table of Contents
attributable to an increase of $8.5�million in Other Operating Expenses and an increase of $4.0�million in Performance Fee Compensation. The increase in Other Operating Expenses was driven by a non-recurring fundraising expense in the first quarter of 2014. The increase in Performance Fee Compensation was due to the increase in Performance Fees Revenue.
Fund Returns
Fund return information for our significant businesses is included throughout this discussion and analysis to facilitate an understanding of our results of operations for the periods presented. The fund returns information reflected in this discussion and analysis is not indicative of the financial performance of The Blackstone Group L.P. and is also not necessarily indicative of the future results of any particular fund. An investment in The Blackstone Group�L.P. is not an investment in any of our funds. There can be no assurance that any of our funds or our other existing and future funds will achieve similar returns.
The following table presents the return information of the segment�s Flagship Hedge Funds:
�
| � | � | Three Months Ended September�30, |
� | � | Nine Months Ended September�30, |
� | � | Average Annual Returns (a) | � | |||||||||||||||||||||||||||||||||||||||||||||||||||||||
| � | � | � | � | Periods Ended September�30, 2014 |
� | |||||||||||||||||||||||||||||||||||||||||||||||||||||||||||
| � | � | 2014 | � | � | 2013 | � | � | 2014 | � | � | 2013 | � | � | One Year |
� | � | Three Year |
� | � | Five Year |
� | � | Historical | � | ||||||||||||||||||||||||||||||||||||||||
| Fund |
� | Gross | � | � | Net | � | � | Gross | � | � | Net | � | � | Gross | � | � | Net | � | � | Gross | � | � | Net | � | � | Gross | � | � | Net | � | � | Gross | � | � | Net | � | � | Gross | � | � | Net | � | � | Gross | � | � | Net | � | ||||||||||||||||
| Flagship Hedge Funds (b) |
� | � | -2 | %� | � | � | -2 | %� | � | � | 2 | %� | � | � | 1 | %� | � | � | 4 | %� | � | � | 3 | %� | � | � | 14 | %� | � | � | 11 | %� | � | � | 13 | %� | � | � | 10 | %� | � | � | 17 | %� | � | � | 12 | %� | � | � | 16 | %� | � | � | 12 | %� | � | � | 13 | %� | � | � | 9 | %� |
The returns presented represent those of the applicable Blackstone Funds and not those of The Blackstone Group L.P.
�
| (a) | Average annual returns present a summarized asset-weighted return measure to evaluate the overall performance of the applicable class of Blackstone Funds. |
| (b) | The Flagship Hedge Funds� returns represent the weighted-average return for U.S. domestic and offshore funds included in this return. The historical return is from August�1, 2005, which is before Blackstone�s acquisition of GSO in March 2008. |
The following table presents the internal rates of return of our significant Credit drawdown funds:
�
| � | �� | Three Months Ended September�30, |
� | � | Nine Months Ended September�30, |
� | � | September�30,�
2014 Inception to Date |
� | |||||||||||||||||||||||||||||||
| � | �� | 2014 | � | � | 2013 | � | � | 2014 | � | � | 2013 | � | � | |||||||||||||||||||||||||||
| Fund (a) |
�� | Gross | � | � | Net | � | � | Gross | � | � | Net | � | � | Gross | � | � | Net | � | � | Gross | � | � | Net | � | � | Gross | � | � | Net | � | ||||||||||
| Mezzanine Funds (b) |
�� | � | 15 | %� | � | � | 12 | %� | � | � | 3 | %� | � | � | 2 | %� | � | � | 25 | %� | � | � | 19 | %� | � | � | 20 | %� | � | � | 14 | %� | � | � | 27 | %� | � | � | 20 | %� |
| Rescue Lending Funds (c) |
�� | � | 8 | %� | � | � | 6 | %� | � | � | 6 | %� | � | � | 4 | %� | � | � | 19 | %� | � | � | 15 | %� | � | � | 17 | %� | � | � | 14 | %� | � | � | 25 | %� | � | � | 18 | %� |
The returns presented herein represent those of the applicable Blackstone Funds and not those of The Blackstone Group L.P.
�
| (a) | Net returns are based on the change in carrying value (realized and unrealized) after management fees, expenses and performance fee allocations, net of tax advances. |
| (b) | The Mezzanine Funds� returns represent the weighted-average return for the U.S. domestic and offshore funds, as applicable, for the significant mezzanine funds. The inception to date return is from July�16, 2007, which is before Blackstone�s acquisition of GSO in March 2008. |
| (c) | The Rescue Lending Funds� returns represent the weighted-average return for the U.S. domestic and offshore funds included in this return. The inception to date returns are from September�29, 2009, which is when the funds commenced investing. |
As of September�30, 2014, the significant Credit drawdown funds were above their respective Carried Interest thresholds.
�
104
Table of Contents
Financial Advisory
The following table presents the results of operations for our Financial Advisory segment:
�
| � | � | Three�Months�Ended September�30, |
� | � | 2014 vs. 2013 | � | � | Nine Months Ended September�30, |
� | � | 2014 vs. 2013 | � | ||||||||||||||||||||
| � | � | ����2014���� | � | � | ����2013���� | � | � | $ | � | � | % | � | � | 2014 | � | � | 2013 | � | � | $ | � | � | % | � | ||||||||
| � | � | (Dollars in Thousands) | � | |||||||||||||||||||||||||||||
| Segment Revenues |
� | � | � | � | � | � | � | � | ||||||||||||||||||||||||
| Advisory Fees |
� | $ | 84,131 | �� | � | $ | 83,602 | �� | � | $ | 529 | �� | � | � | 1 | %� | � | $ | 269,008 | �� | � | $ | 271,356 | �� | � | $ | (2,348 | )� | � | � | -1 | %� |
| Transaction and Other Fees, Net |
� | � | 391 | �� | � | � | 196 | �� | � | � | 195 | �� | � | � | 99 | %� | � | � | 1,329 | �� | � | � | 239 | �� | � | � | 1,090 | �� | � | � | 456 | %� |
| � | � |
� |
� | � | � |
� |
� | � | � |
� |
� | � | � |
� |
� | � | � |
� |
� | � | � |
� |
� | � | � |
� |
� | � | � |
� |
� | |
| Total Advisory and Transaction Fees |
� | � | 84,522 | �� | � | � | 83,798 | �� | � | � | 724 | �� | � | � | 1 | %� | � | � | 270,337 | �� | � | � | 271,595 | �� | � | � | (1,258 | )� | � | � | -0 | %� |
| � | � |
� |
� | � | � |
� |
� | � | � |
� |
� | � | � |
� |
� | � | � |
� |
� | � | � |
� |
� | � | � |
� |
� | � | � |
� |
� | |
| Investment Income (Loss) |
� | � | � | � | � | � | � | � | ||||||||||||||||||||||||
| Realized |
� | � | 505 | �� | � | � | (829 | )� | � | � | 1,334 | �� | � | � | N/M | �� | � | � | 745 | �� | � | � | (741 | )� | � | � | 1,486 | �� | � | � | N/M | �� |
| Unrealized |
� | � | (528 | )� | � | � | 1,006 | �� | � | � | (1,534 | )� | � | � | N/M | �� | � | � | 1,135 | �� | � | � | (871 | )� | � | � | 2,006 | �� | � | � | N/M | �� |
| � | � |
� |
� | � | � |
� |
� | � | � |
� |
� | � | � |
� |
� | � | � |
� |
� | � | � |
� |
� | � | � |
� |
� | � | � |
� |
� | |
| Total Investment Income (Loss) |
� | � | (23 | )� | � | � | 177 | �� | � | � | (200 | )� | � | � | N/M | �� | � | � | 1,880 | �� | � | � | (1,612 | )� | � | � | 3,492 | �� | � | � | N/M | �� |
| Interest and Dividend Revenue |
� | � | 2,412 | �� | � | � | 2,437 | �� | � | � | (25 | )� | � | � | -1 | %� | � | � | 7,101 | �� | � | � | 5,799 | �� | � | � | 1,302 | �� | � | � | 22 | %� |
| Other |
� | � | 472 | �� | � | � | 836 | �� | � | � | (364 | )� | � | � | -44 | %� | � | � | 137 | �� | � | � | 836 | �� | � | � | (699 | )� | � | � | -84 | %� |
| � | � |
� |
� | � | � |
� |
� | � | � |
� |
� | � | � |
� |
� | � | � |
� |
� | � | � |
� |
� | � | � |
� |
� | � | � |
� |
� | |
| Total Revenues |
� | � | 87,383 | �� | � | � | 87,248 | �� | � | � | 135 | �� | � | � | 0 | %� | � | � | 279,455 | �� | � | � | 276,618 | �� | � | � | 2,837 | �� | � | � | 1 | %� |
| � | � |
� |
� | � | � |
� |
� | � | � |
� |
� | � | � |
� |
� | � | � |
� |
� | � | � |
� |
� | � | � |
� |
� | � | � |
� |
� | |
| Expenses |
� | � | � | � | � | � | � | � | ||||||||||||||||||||||||
| Compensation and Benefits |
� | � | � | � | � | � | � | � | ||||||||||||||||||||||||
| Compensation |
� | � | 58,016 | �� | � | � | 57,491 | �� | � | � | 525 | �� | � | � | 1 | %� | � | � | 189,442 | �� | � | � | 191,570 | �� | � | � | (2,128 | )� | � | � | -1 | %� |
| Other Operating Expenses |
� | � | 19,853 | �� | � | � | 19,208 | �� | � | � | 645 | �� | � | � | 3 | %� | � | � | 63,311 | �� | � | � | 60,762 | �� | � | � | 2,549 | �� | � | � | 4 | %� |
| � | � |
� |
� | � | � |
� |
� | � | � |
� |
� | � | � |
� |
� | � | � |
� |
� | � | � |
� |
� | � | � |
� |
� | � | � |
� |
� | |
| Total Expenses |
� | � | 77,869 | �� | � | � | 76,699 | �� | � | � | 1,170 | �� | � | � | 2 | %� | � | � | 252,753 | �� | � | � | 252,332 | �� | � | � | 421 | �� | � | � | 0 | %� |
| � | � |
� |
� | � | � |
� |
� | � | � |
� |
� | � | � |
� |
� | � | � |
� |
� | � | � |
� |
� | � | � |
� |
� | � | � |
� |
� | |
| Economic Income |
� | $ | 9,514 | �� | � | $ | 10,549 | �� | � | $ | (1,035 | )� | � | � | -10 | %� | � | $ | 26,702 | �� | � | $ | 24,286 | �� | � | $ | 2,416 | �� | � | � | 10 | %� |
| � | � |
� |
� | � | � |
� |
� | � | � |
� |
� | � | � |
� |
� | � | � |
� |
� | � | � |
� |
� | � | � |
� |
� | � | � |
� |
� | |
�
| N/M | �Not meaningful. |
Revenues
Revenues were $87.4�million for the three months ended September�30, 2014, nearly flat compared to the three months ended September�30, 2013. The change in revenues was driven by increases in Restructuring and Reorganization and our capital markets business, partially offset by decreases in our fund placement and Blackstone Advisory Partners (�BAP�) businesses. The increase in Restructuring and Reorganization was driven by a higher amount of transaction fees recorded relative to the prior year period and the pipeline for Restructuring and Reorganization remains steady across a diverse group of industries. Our capital markets business increased due to a higher amount of transaction fees recorded relative to the prior year period. The decrease in fees earned by Blackstone�s fund placement business was due primarily to a decrease in the volume and size of the transactions that closed in the Real Estate business during the period. BAP�s business decreased slightly as fewer deals closed and the closing of certain deals was delayed.
Revenues were $279.5�million for the nine months ended September�30, 2014, an increase of $2.8�million compared to $276.6�million for the nine months ended September�30, 2013. The increase in revenues was driven by increases in our BAP and capital markets businesses, partially offset by decreases in our Restructuring and Reorganization and fund placement businesses. During the nine months ended September�30, 2014, the BAP business experienced an increase in revenues due to improving global mergers and acquisitions activity as well as a greater number of closed transactions. Our capital markets business increased due to a higher amount of transaction fees recorded relative to the prior year period. The decrease in Restructuring and Reorganization was primarily driven by a lower amount of transaction fees recorded relative to the prior year period. The decrease in fees earned by Blackstone�s fund placement business was due primarily to a decrease in the volume and size of transactions that closed in the Private Equity and Real Estate business while partially offset by an increase in the number of transactions that closed in the Secondary Advisory business during the period.
�
105
Table of Contents
Expenses
Expenses were $77.9�million for the three months ended September�30, 2014, relatively flat compared to the three months ended September�30, 2013.
Expenses were $252.8�million for the nine months ended September�30, 2014, relatively flat compared to the nine months ended September�30, 2013.
Liquidity and Capital Resources
General
Blackstone�s business model derives revenue primarily from third party assets under management and from advisory businesses. Blackstone is not a capital or balance sheet intensive business and targets operating expense levels such that total management and advisory fees exceed total operating expenses each period. As a result, we require limited capital resources to support the working capital or operating needs of our businesses. We draw primarily on the long-term committed capital of our limited partner investors to fund the investment requirements of the Blackstone Funds and use our own realizations and cash flows to invest in growth initiatives, make commitments to our own funds, where our minimum general partner commitments are generally less than 5% of the limited partner commitments of a fund, or pay distributions to unitholders.
Fluctuations in our statement of financial condition result primarily from activities of the Blackstone Funds which are consolidated as well as business transactions, such as the issuance of senior notes described below. The majority economic ownership interests of the Blackstone Funds are reflected as Redeemable Non-Controlling Interests in Consolidated Entities, Non-Controlling Interests in Consolidated Entities and Appropriated Partners� Capital in the Condensed Consolidated Financial Statements. The consolidation of these Blackstone Funds has no net effect on the Partnership�s Net Income or Partners� Capital. Additionally, fluctuations in our statement of financial condition also include appreciation or depreciation in Blackstone investments in the Blackstone Funds, additional investments and redemptions of such interests in the Blackstone Funds and the collection of receivables related to management and advisory fees.
Total assets were $30.5�billion as of September�30, 2014, an increase of $835.3 million from December�31, 2013. The increase in total assets was primarily attributable to increases of $472.1�million in Cash Held by Blackstone Funds and Other due to the fluctuation of cash balances held by the consolidated Blackstone funds and $391.6�million in Investments due to the consolidation of new entities.
Total liabilities were $14.1�billion as of September�30, 2014, a decrease of $1.2 billion from December�31, 2013. The decrease in total liabilities was primarily due to a decrease in Loans Payable of $2.7�billion resulting from the deconsolidation of certain CLO vehicles and loan repayments and partially offset by an increase in Accounts Payable, Accrued Expenses and Other Liabilities of $1.2�billion due to the consolidation of new entities.
For the three months ended September�30, 2014, we had Total Fee Related Revenues of $673.2�million and related expenses of $455.9�million, generating Fee Related Earnings of $217.3�million and Distributable Earnings of $672.1�million. For the nine months ended September�30, 2014, we had Total Fee Related Revenues of $2.0�billion and related expenses of $1.4�billion, generating Fee Related Earnings of $593.2�million and Distributable Earnings of $1.9�billion.
Sources of Liquidity
We have multiple sources of liquidity to meet our capital needs, including annual cash flows, accumulated earnings in the businesses, investments in our own Treasury and liquid funds and access to our debt capacity,
�
106
Table of Contents
including our $1.1�billion committed revolving credit facility and the proceeds from our issuances of senior notes. On May�29, 2014, Blackstone Holdings Finance Co. L.L.C., an indirect subsidiary of Blackstone, amended its revolving credit facility to, among other things, extend the maturity date of the credit facility from July�13, 2017 to May�29, 2019. As of September�30, 2014, we had $943.5�million in cash and cash equivalents, $1.8�billion invested in Blackstone�s Treasury Cash Management Strategies, $161.9�million invested in liquid Blackstone Funds, $2.5�billion invested in illiquid Blackstone Funds and $240.0�million invested in other investments, against $2.1�billion in borrowings from our bond issuances, and no borrowings outstanding under our revolving credit facility.
In addition to the cash we received in connection with our IPO, debt offerings and our borrowing facilities, we expect to receive (a)�cash generated from operating activities, (b)�Carried Interest and incentive income realizations, and (c)�realizations on the carry and hedge fund investments that we make. The amounts received from these three sources in particular may vary substantially from year to year and quarter to quarter depending on the frequency and size of realization events or net returns experienced by our investment funds. Our available capital could be adversely affected if there are prolonged periods of few substantial realizations from our investment funds accompanied by substantial capital calls for new investments from those investment funds. Therefore, Blackstone�s commitments to our funds are taken into consideration when managing our overall liquidity and cash position.
We use Distributable Earnings, which is derived from our segment reported results, as a supplemental non-GAAP measure to assess performance and amounts available for distributions to Blackstone unitholders, including Blackstone personnel and others who are limited partners of the Blackstone Holdings Partnerships. Distributable Earnings is intended to show the amount of net realized earnings without the effects of the consolidation of the Blackstone Funds. Distributable Earnings is derived from and reconciled to, but not equivalent to, its most directly comparable GAAP measure of Income (Loss) Before Provision for Taxes. Distributable Earnings, which is a component of Economic Net Income, is the sum across all segments of: (a)�Total Management and Advisory Fees, (b)�Interest and Dividend Revenue, (c)�Other Revenue, (d)�Realized Performance Fees, and (e)�Realized Investment Income (Loss); less (a)�Compensation, excluding the expense of equity-based awards, (b)�Realized Performance Fee Compensation, (c)�Other Operating Expenses, and (d)�Taxes and Related Payables including the Payable Under Tax Receivable Agreement.
�
107
Table of Contents
The following table calculates Blackstone�s Fee Related Earnings, Distributable Earnings and Economic Net Income:
�
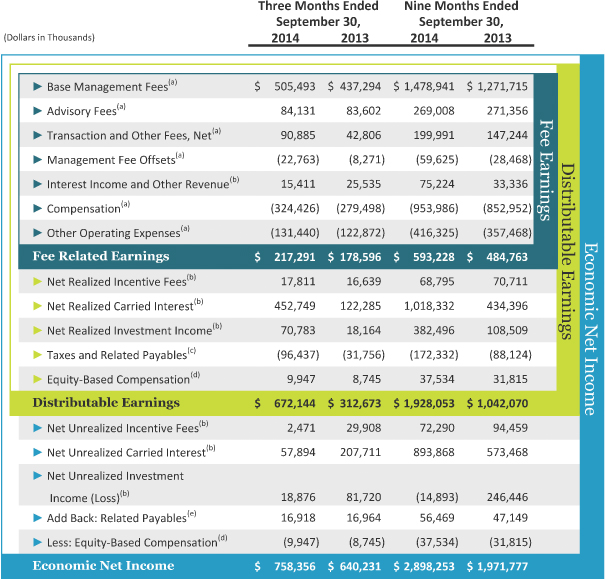
�
| (a) | Represents the total segment amounts of the respective captions. See Note 18. �Segment Reporting� in the �Notes to Condensed Consolidated Financial Statements� in �Part I. Item�1. Financial Statements� of this filing. |
| (b) | Detail on this amount is included in the table below. |
| (c) | Represents the current tax provision calculated on Income Before Provision for Taxes and the Payable Under Tax Receivable Agreement. |
| (d) | Represents equity-based award expense included in Economic Income. |
| (e) | Represents tax-related payables including the Payable Under Tax Receivable Agreement. |
�
108
Table of Contents
The following calculates the components of Fee Related Earnings, Distributable Earnings and Economic Net Income in the above table identified by note (b):
�
�
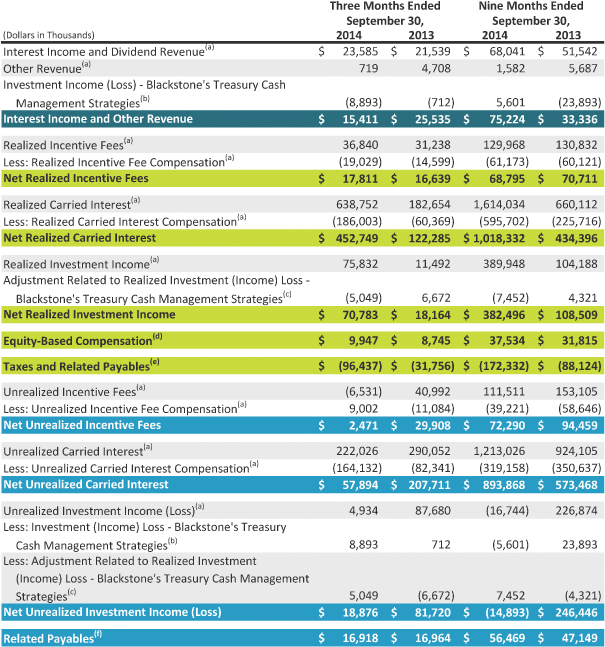
�
| (a) | Represents the total segment amounts of the respective captions. See Note 18. �Segment Reporting� in the �Notes to Condensed Consolidated Financial Statements� in �Part I. Item�1. Financial Statements� of this filing. |
| (b) | This adjustment represents the realized and unrealized gain on Blackstone�s Treasury Cash Management Strategies which are a component of Investment Income (Loss) but included in Fee Related Earnings. |
| (c) | Represents the elimination of Realized Investment Income (Loss) attributable to Blackstone�s Treasury Cash Management Strategies, which is a component of both Fee Related Earnings and Realized Investment Income (Loss). |
| (d) | Represents equity-based award expense included in Economic Income. |
�
109
Table of Contents
| (e) | Taxes and Related Payables Including Payable Under Tax Receivable Agreement represent the current tax provision (benefit) calculated on Income (Loss) Before Provision (Benefit) for Taxes and the Payable Under Tax Receivable Agreement. |
| (f) | Represents tax-related payables including the Payable Under Tax Receivable Agreement. |
The following table is a reconciliation of Net Income Attributable to The Blackstone Group L.P. to Economic Income, of Economic Income to Economic Net Income, of Economic Net Income to Fee Related Earnings, of Fee Related Earnings to Distributable Earnings and of Distributable Earnings to Adjusted Earnings Before Interest, Taxes and Depreciation and Amortization:
�
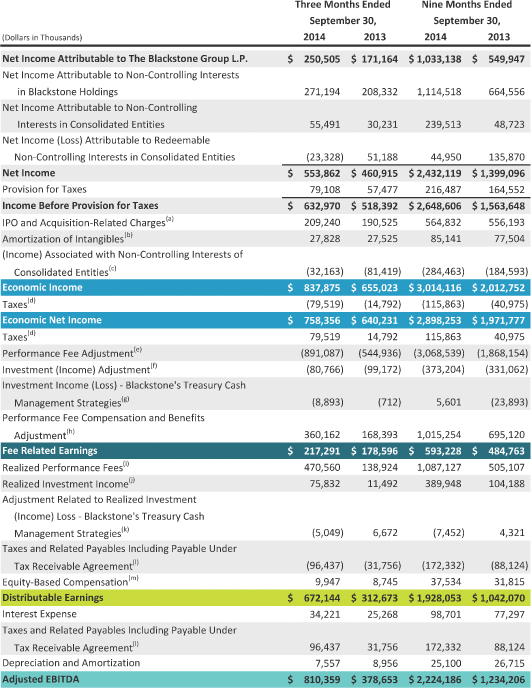
�
110
Table of Contents
�
| (a) | The adjustment adds back to Income Before Provision for Taxes amounts for Transaction-Related Charges which include principally equity-based compensation charges associated with Blackstone�s initial public offering and long-term retention programs outside of annual deferred compensation and other corporate actions. |
| (b) | This adjustment adds back to Income Before Provision for Taxes amounts for the Amortization of Intangibles which are associated with Blackstone�s initial public offering and other corporate actions. |
| (c) | This adjustment adds back to Income Before Provision for Taxes the amount of (Income) Loss Associated with Non-Controlling Interests in (Income) Loss of Consolidated Entities and includes the amount of Management Fee Revenues associated with Consolidated CLO Entities. |
| (d) | Taxes represent the current tax provision calculated on Income Before Provision for Taxes. |
| (e) | This adjustment removes from EI the total segment amount of Performance Fees. |
| (f) | This adjustment removes from EI the total segment amount of Investment Income (Loss). |
| (g) | This adjustment represents the realized and unrealized gain on Blackstone�s Treasury Cash Management Strategies which are a component of Investment Income (Loss) but included in Fee Related Earnings. |
| (h) | This adjustment removes from expenses the compensation and benefit amounts related to Blackstone�s profit sharing plans related to Performance Fees. |
| (i) | Represents the adjustment for realized Performance Fees net of corresponding actual amounts due under Blackstone�s profit sharing plans related thereto. |
| (j) | Represents the adjustment for Blackstone�s Investment Income � Realized. |
| (k) | Represents the elimination of Realized Investment Income (Loss) attributable to Blackstone�s Treasury Cash Management Strategies which is a component of both Fee Related Earnings and Realized Investment Income (Loss). |
| (l) | Taxes and Related Payables Including Payable Under Tax Receivable Agreement represent the current tax provision calculated on Income Before Provision for Taxes and the Payable Under Tax Receivable Agreement. |
| (m) | Represents equity-based award expense included in Economic Income. |
�
111
Table of Contents
Liquidity Needs
We expect that our primary liquidity needs will be cash to (a)�provide capital to facilitate the growth of our existing businesses which principally includes funding our general partner and co-investment commitments to our funds, (b)�provide capital to facilitate our expansion into new businesses that are complementary, (c)�pay operating expenses, including cash compensation to our employees and other obligations as they arise, (d)�fund modest capital expenditures, (e)�repay borrowings and related interest costs, (f)�pay income taxes, and (g)�make distributions to our unitholders and the holders of Blackstone Holdings Partnership Units. Our own capital commitments to our funds, the funds we invest in and our investment strategies as of September�30, 2014 consisted of the following:
�
| � | �� | Blackstone and General Partner |
� | �� | Senior Managing Directors and Certain Other Professionals (a) |
� | ||||||||||
| Fund |
�� | Original Commitment |
� | �� | Remaining Commitment |
� | �� | Original Commitment |
� | �� | Remaining Commitment |
� | ||||
| � | �� | (Dollars in Thousands) | � | |||||||||||||
| Private Equity |
�� | �� | �� | �� | ||||||||||||
| BCP VI |
�� | $ | 719,718 | �� | �� | $ | 353,908 | �� | �� | $ | 250,000 | �� | �� | $ | 122,933 | �� |
| BCP V |
�� | � | 629,356 | �� | �� | � | 69,740 | �� | �� | � | ��� | �� | �� | � | ��� | �� |
| BEP |
�� | � | 50,000 | �� | �� | � | 24,652 | �� | �� | � | ��� | �� | �� | � | ��� | �� |
| Tactical Opportunities |
�� | � | 112,931 | �� | �� | � | 62,890 | �� | �� | � | 24,952 | �� | �� | � | 13,895 | �� |
| Strategic Partners |
�� | � | 131,609 | �� | �� | � | 124,264 | �� | �� | � | 20,294 | �� | �� | � | 19,148 | �� |
| Other (b) |
�� | � | 203,604 | �� | �� | � | 12,968 | �� | �� | � | ��� | �� | �� | � | ��� | �� |
| Real Estate |
�� | �� | �� | �� | ||||||||||||
| BREP VII |
�� | � | 300,000 | �� | �� | � | 89,055 | �� | �� | � | 100,000 | �� | �� | � | 29,685 | �� |
| BREP VI |
�� | � | 750,000 | �� | �� | � | 41,177 | �� | �� | � | 150,000 | �� | �� | � | 8,235 | �� |
| BREP Europe III |
�� | � | 100,000 | �� | �� | � | 14,652 | �� | �� | � | 35,000 | �� | �� | � | 5,128 | �� |
| BREP Europe IV |
�� | � | 100,000 | �� | �� | � | 60,594 | �� | �� | � | 33,333 | �� | �� | � | 20,198 | �� |
| BREP Asia |
�� | � | 50,000 | �� | �� | � | 33,933 | �� | �� | � | 16,667 | �� | �� | � | 11,311 | �� |
| BREDS II |
�� | � | 50,000 | �� | �� | � | 28,168 | �� | �� | � | 16,667 | �� | �� | � | 9,389 | �� |
| CT Opportunity Partners I |
�� | � | 25,000 | �� | �� | � | 22,912 | �� | �� | � | ��� | �� | �� | � | ��� | �� |
| Other (b) |
�� | � | 107,951 | �� | �� | � | 12,923 | �� | �� | � | ��� | �� | �� | � | ��� | �� |
| Hedge Fund Solutions |
�� | �� | �� | �� | ||||||||||||
| Strategic Alliance II |
�� | � | 50,000 | �� | �� | � | 2,862 | �� | �� | � | ��� | �� | �� | � | ��� | �� |
| Strategic Alliance |
�� | � | 50,000 | �� | �� | � | 2,033 | �� | �� | � | ��� | �� | �� | � | ��� | �� |
| BAAM Strategic Holdings LP |
�� | � | 50,000 | �� | �� | � | 46,657 | �� | �� | � | ��� | �� | �� | � | ��� | �� |
| Other (b) |
�� | � | 300 | �� | �� | � | 179 | �� | �� | � | ��� | �� | �� | � | ��� | �� |
| Credit |
�� | �� | �� | �� | ||||||||||||
| Capital Opportunities Fund II L.P. |
�� | � | 120,000 | �� | �� | � | 82,016 | �� | �� | � | 110,011 | �� | �� | � | 75,189 | �� |
| GSO Capital Solutions II |
�� | � | 125,000 | �� | �� | � | 116,383 | �� | �� | � | 94,555 | �� | �� | � | 88,067 | �� |
| Blackstone/GSO Capital Solutions |
�� | � | 50,000 | �� | �� | � | 9,647 | �� | �� | � | 27,666 | �� | �� | � | 5,338 | �� |
| Blackstone Credit Liquidity Partners |
�� | � | 32,244 | �� | �� | � | 1,612 | �� | �� | � | ��� | �� | �� | � | ��� | �� |
| BMezz II |
�� | � | 17,692 | �� | �� | � | 3,085 | �� | �� | � | ��� | �� | �� | � | ��� | �� |
| Other (b) |
�� | � | 60,041 | �� | �� | � | 35,622 | �� | �� | � | 2,909 | �� | �� | � | 1,719 | �� |
| Other |
�� | �� | �� | �� | ||||||||||||
| Treasury |
�� | � | 150,264 | �� | �� | � | 142,094 | �� | �� | � | ��� | �� | �� | � | ��� | �� |
| �� | � |
� |
� | �� | � |
� |
� | �� | � |
� |
� | �� | � |
� |
� | |
| Total |
�� | $ | 4,035,710 | �� | �� | $ | 1,394,026 | �� | �� | $ | 882,054 | �� | �� | $ | 410,235 | �� |
| �� | � |
� |
� | �� | � |
� |
� | �� | � |
� |
� | �� | � |
� |
� | |
�
| (a) | For some of the general partner commitments shown in the table above, we require our senior managing directors and certain other professionals to fund a portion of the commitment even though the ultimate obligation to fund the aggregate commitment is ours pursuant to the governing agreements of the respective funds. The amounts of the aggregate applicable general partner original and remaining commitment are shown in the table above. In addition, certain senior managing directors and other professionals are required to fund a |
�
112
Table of Contents
| � | de minimis amount of the commitment in the other private equity, real estate and credit-focused carry funds. We expect our commitments to be drawn down over time and to be funded by available cash and cash generated from operations and realizations. Taking into account prevailing market conditions and both the liquidity and cash or liquid investment balances, we believe that the sources of liquidity described above will be more than sufficient to fund our working capital requirements. |
| (b) | Represents capital commitments to a number of other funds in each respective segment. |
Blackstone, through indirect subsidiaries, has a $1.1�billion unsecured revolving credit facility (the �Credit Facility�) with Citibank, N.A., as Administrative Agent with a maturity date of May�29, 2019. Borrowings may also be made in U.K. sterling, euros, Swiss francs or Japanese yen, in each case subject to certain sub-limits. The Credit Facility contains customary representations, covenants and events of default. Financial covenants consist of a maximum net leverage ratio and a requirement to keep a minimum amount of fee-earning assets under management, each tested quarterly.
In August 2009, Blackstone Holdings Finance Co. L.L.C. issued $600�million in aggregate principal amount of 6.625% Senior Notes which will mature on August�15, 2019, unless earlier redeemed or repurchased. In September 2010, Blackstone Holdings Finance Co. L.L.C. issued $400 million in aggregate principal amount of 5.875% Senior Notes which will mature on March�15, 2021, unless earlier redeemed or repurchased. In August 2012, Blackstone Holdings Finance Co. L.L.C. issued $400 million in aggregate principal amount of 4.75% Senior Notes which will mature on February�15, 2023 and $250 million in aggregate principal amount of 6.25% Senior Notes which will mature on August�15, 2042. In April 2014, Blackstone Holdings Finance Co. L.L.C. issued $500�million in aggregate principal amount of 5.000% Senior Notes which will mature on June�15, 2044, unless earlier redeemed or repurchased. (These issuances of Senior Notes are collectively referred to as the �Notes�.) The Notes are unsecured and unsubordinated obligations of Blackstone Holdings Finance Co. L.L.C. and are fully and unconditionally guaranteed, jointly and severally, by The Blackstone Group L.P. and each of the Blackstone Holdings Partnerships. The Notes contain customary covenants and financial restrictions that, among other things, limit Blackstone Holdings Finance Co. L.L.C. and the guarantors� ability, subject to certain exceptions, to incur indebtedness secured by liens on voting stock or profit participating equity interests of their subsidiaries or merge, consolidate or sell, transfer or lease assets. The Notes also contain customary events of default. All or a portion of the Notes may be redeemed at our option, in whole or in part, at any time and from time to time, prior to their stated maturity, at the make-whole redemption price set forth in the Notes. If a change of control repurchase event occurs, the Notes are subject to repurchase at the repurchase price as set forth in the Notes.
In January 2008, the Board of Directors of our general partner, Blackstone Group Management L.L.C., authorized the repurchase of up to $500�million of our common units and Blackstone Holdings Partnership Units. Under this unit repurchase program, units may be repurchased from time to time in open market transactions, in privately negotiated transactions or otherwise. The timing and the actual number of Blackstone common units and Blackstone Holdings Partnership Units repurchased will depend on a variety of factors, including legal requirements, price and economic and market conditions. This unit repurchase program may be suspended or discontinued at any time and does not have a specified expiration date. During the three months ended September�30, 2014, no units were repurchased. As of September�30, 2014, the amount remaining under this program available for repurchases was $335.8�million.
Distributions
Distributable Earnings, which is derived from Blackstone�s segment reported results, is a supplemental measure to assess performance and amounts available for distributions to Blackstone unitholders, including Blackstone personnel and others who are limited partners of the Blackstone Holdings Partnerships. Distributable Earnings is intended to show the amount of net realized earnings without the effects of the consolidation of the Blackstone Funds. Distributable Earnings, which is a component of Economic Net Income, is the sum across all segments of: (a)�Total Management and Advisory Fees, (b)�Interest and Dividend Revenue, (c)�Other Revenue, (d)�Realized Performance Fees, and (e)�Realized Investment Income (Loss); less (a)�Compensation, excluding the expense of equity-based awards, (b)�Realized Performance Fee Compensation, (c)�Other Operating Expenses, and (d)�Taxes and Related Payables Including the Payable Under Tax Receivable Agreement.
�
113
Table of Contents
Our current intention is to distribute to common unitholders each quarter substantially all of our Net Cash Available for Distribution to Common Unitholders, subject to a base quarterly distribution of $0.12 per unit. Net Cash Available for Distribution to Common Unitholders is The Blackstone Group L.P.�s share of Distributable Earnings, less realized investment gains and returns of capital from investments and acquisitions, in excess of amounts determined by Blackstone�s general partner to be necessary or appropriate to provide for the conduct of its business, to make appropriate investments in its business and funds, to comply with applicable law, any of its debt instruments or other agreements, or to provide for future cash requirements such as tax-related payments, clawback obligations and distributions to unitholders for any ensuing quarter. The amount to be distributed could also be adjusted upward in any one quarter, taking into account both the extent of realized investment gains and returns of capital from investments and acquisitions, and the amounts determined by Blackstone�s general partner to be necessary or appropriate as described in the preceding sentence.
In circumstances in which the Net Cash Available for Distribution to Common Unitholders for a quarter falls short of the amount necessary to support the base distribution of $0.12 per unit, Blackstone intends to correspondingly reduce subsequent quarterly distributions below the amounts supported by the Net Cash Available for Distribution to Common Unitholders by the amount of the shortfall, but not below $0.12 per unit.
All of the foregoing is subject to the qualification that the declaration and payment of any distributions are at the sole discretion of our general partner and our general partner may change our distribution policy at any time, including, without limitation, to reduce the quarterly distribution payable to our common unitholders to less than $0.12 per unit or even to eliminate such distributions entirely.
Because the subsidiaries of The Blackstone Group L.P. must pay taxes and make payments under the tax receivable agreements, the amounts ultimately distributed by The Blackstone Group L.P. to its common unitholders in respect of each fiscal year are expected to be less, on a per unit basis, than the amounts distributed by the Blackstone Holdings Partnerships to the Blackstone personnel and others who are limited partners of the Blackstone Holdings Partnerships in respect of their Blackstone Holdings Partnership Units.
The following chart shows fiscal quarterly and annual per common unitholder distributions for 2013 and 2014. Distributions are declared and paid in the quarter subsequent to the quarter in which they are earned.
�
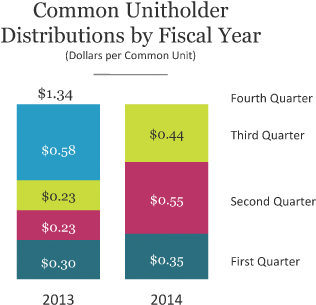
�
114
Table of Contents
With respect to fiscal year 2014, we have paid to common unitholders a distribution of $0.44 in respect of the third quarter, aggregating $1.34 per common unit in respect of the nine months ended September�30, 2014. With respect to fiscal year 2013, we paid aggregate common unitholder distributions of $1.34 per common unit.
Leverage
We may under certain circumstances use leverage opportunistically and over time to create the most efficient capital structure for Blackstone and our public common unitholders. In addition to the borrowings from our bond issuances and our revolving credit facility, our Treasury Cash Management Strategies may use reverse repurchase agreements, repurchase agreements and securities sold, not yet purchased. All of these positions are held in a separately managed portfolio. Reverse repurchase agreements are entered into primarily to take advantage of opportunistic yields otherwise absent in the overnight markets and also to use the collateral received to cover securities sold, not yet purchased. Repurchase agreements are entered into primarily to opportunistically yield higher spreads on purchased securities. The balances held in these financial instruments fluctuate based on Blackstone�s liquidity needs, market conditions and investment risk profiles.
Generally our private equity funds, real estate funds, funds of hedge funds and credit-focused funds have not utilized substantial leverage at the fund level other than for (a)�short-term borrowings between the date of an investment and the receipt of capital from the investing fund�s investors, and (b)�long-term borrowings for certain investments in aggregate amounts which are generally 2% to 20% of the capital commitments of the respective fund. Our carry funds make direct or indirect investments in companies that utilize leverage in their capital structure. The degree of leverage employed varies among portfolio companies.
Certain of our Real Estate debt hedge funds, Hedge Fund Solutions and Credit funds use leverage in order to obtain additional market exposure, enhance returns on invested capital and/or to bridge short-term cash needs. The forms of leverage primarily employed by these funds include purchasing securities on margin, utilizing collateralized financing and using derivative instruments.
The following table presents information regarding these financial instruments in our Condensed Consolidated Statements of Financial Condition:
�
| � | �� | Reverse Repurchase Agreements |
� | �� | Repurchase Agreements�(a) |
� | �� | Securities Sold, Not Yet Purchased�(a) |
� | |||
| � | �� | (Dollars in Millions) | � | |||||||||
| Balance, September�30, 2014 |
�� | $ | 93.5 | �� | �� | $ | 122.4 | �� | �� | $ | 188.4 | �� |
| Balance, December�31, 2013 |
�� | $ | 149.0 | �� | �� | $ | 316.3 | �� | �� | $ | 76.2 | �� |
| Nine Months Ended September�30, 2014 |
�� | �� | �� | |||||||||
| Average Daily Balance |
�� | $ | 77.8 | �� | �� | $ | 135.0 | �� | �� | $ | 146.8 | �� |
| Maximum Daily Balance |
�� | $ | 197.0 | �� | �� | $ | 375.0 | �� | �� | $ | 296.4 | �� |
�
| (a) | The balances presented as of September�30, 2014 include the consolidation of certain Blackstone Funds that occurred on March�31, 2014. |
�
115
Table of Contents
Contractual Obligations, Commitments and Contingencies
The following table sets forth information relating to our contractual obligations as of September�30, 2014 on a consolidated basis and on a basis deconsolidating the Blackstone Funds:
�
| Contractual Obligations |
� | October�1,�2014�to December�31,�2014 |
� | � | 2015�2016 | � | � | 2017�2018 | � | � | Thereafter | � | � | Total | � | |||||
| � | � | (Dollars in Thousands) | � | |||||||||||||||||
| Operating Lease Obligations (a) |
� | $ | 18,189 | �� | � | $ | 134,601 | �� | � | $ | 113,662 | �� | � | $ | 550,114 | �� | � | $ | 816,566 | �� |
| Purchase Obligations |
� | � | 7,301 | �� | � | � | 17,312 | �� | � | � | 844 | �� | � | � | ��� | �� | � | � | 25,457 | �� |
| Blackstone Issued Notes and Revolving Credit Facility (b) |
� | � | ��� | �� | � | � | ��� | �� | � | � | ��� | �� | � | � | 2,135,000 | �� | � | � | 2,135,000 | �� |
| Interest on Blackstone Issued Notes and Revolving Credit Facility (c) |
� | � | 30,472 | �� | � | � | 243,762 | �� | � | � | 243,762 | �� | � | � | 1,160,092 | �� | � | � | 1,678,088 | �� |
| Blackstone Funds and CLO Vehicles Debt Obligations Payable (d) |
� | � | ��� | �� | � | � | 6,823 | �� | � | � | ��� | �� | � | � | 6,194,617 | �� | � | � | 6,201,440 | �� |
| Interest on Blackstone Funds and CLO Vehicles Debt Obligations Payable (e) |
� | � | 16,039 | �� | � | � | 128,096 | �� | � | � | 127,972 | �� | � | � | 270,019 | �� | � | � | 542,126 | �� |
| Blackstone Funds Capital Commitments to Investee Funds (f) |
� | � | 52,542 | �� | � | � | ��� | �� | � | � | ��� | �� | � | � | ��� | �� | � | � | 52,542 | �� |
| Due to Certain Non-Controlling Interest Holders in Connection with Tax Receivable Agreements (g) |
� | � | ��� | �� | � | � | 151,596 | �� | � | � | 149,623 | �� | � | � | 950,112 | �� | � | � | 1,251,331 | �� |
| Unrecognized Tax Benefits, Including Interest and Penalties (h) |
� | � | 223 | �� | � | � | 519 | �� | � | � | ��� | �� | � | � | ��� | �� | � | � | 742 | �� |
| Blackstone Operating Entities Capital Commitments to Blackstone Funds and Other�(i) |
� | � | 1,394,026 | �� | � | � | ��� | �� | � | � | ��� | �� | � | � | ��� | �� | � | � | 1,394,026 | �� |
| � | � |
� |
� | � | � |
� |
� | � | � |
� |
� | � | � |
� |
� | � | � |
� |
� | |
| Consolidated Contractual Obligations |
� | � | 1,518,792 | �� | � | � | 682,709 | �� | � | � | 635,863 | �� | � | � | 11,259,954 | �� | � | � | 14,097,318 | �� |
| Blackstone Funds and CLO Vehicles Debt Obligations Payable (d) |
� | � | ��� | �� | � | � | (6,823 | )� | � | � | ��� | �� | � | � | (6,194,617 | )� | � | � | (6,201,440 | )� |
| Interest on Blackstone Funds and CLO Vehicles Debt Obligations Payable (e) |
� | � | (16,039 | )� | � | � | (128,096 | )� | � | � | (127,972 | )� | � | � | (270,019 | )� | � | � | (542,126 | )� |
| Blackstone Funds Capital Commitments to Investee Funds (f) |
� | � | (52,542 | )� | � | � | ��� | �� | � | � | ��� | �� | � | � | ��� | �� | � | � | (52,542 | )� |
| � | � |
� |
� | � | � |
� |
� | � | � |
� |
� | � | � |
� |
� | � | � |
� |
� | |
| Blackstone Operating Entities Contractual Obligations |
� | $ | 1,450,211 | �� | � | $ | 547,790 | �� | � | $ | 507,891 | �� | � | $ | 4,795,318 | �� | � | $ | 7,301,210 | �� |
| � | � |
� |
� | � | � |
� |
� | � | � |
� |
� | � | � |
� |
� | � | � |
� |
� | |
�
| (a) | We lease our primary office space under agreements that expire through 2032. In connection with certain lease agreements, we are responsible for escalation payments. The contractual obligation table above includes only guaranteed minimum lease payments for such leases and does not project potential escalation or other lease-related payments. These leases are classified as operating leases for financial statement purposes and as such are not recorded as liabilities on the Condensed Consolidated Statements of Financial Condition. The amounts are presented net of contractual sublease commitments. |
| (b) | Represents the principal amount due on the senior notes we issued. As of September�30, 2014, we had no outstanding borrowings under our revolver. |
| (c) | Represents interest to be paid over the maturity of our senior notes and borrowings under our revolving credit facility which has been calculated assuming no pre-payments will be made and debt will be held until its final maturity date. These amounts exclude commitment fees for unutilized borrowings under our revolver. |
| (d) | These obligations are those of the Blackstone Funds including the consolidated CLO vehicles. |
| (e) | Represents interest to be paid over the maturity of the related consolidated Blackstone Funds� and CLO vehicles� debt obligations which has been calculated assuming no pre-payments will be made and debt will be held until its final maturity date. The future interest payments are calculated using variable rates in effect as of September�30, 2014, at spreads to market rates pursuant to the financing agreements, and range from 0.30% to |
�
116
Table of Contents
| � | 10.78%. The majority of the borrowings are due on demand and for purposes of this schedule are assumed to mature within one year. Interest on the majority of these borrowings rolls over into the principal balance at each reset date. |
| (f) | These obligations represent commitments of the consolidated Blackstone Funds to make capital contributions to investee funds and portfolio companies. These amounts are generally due on demand and are therefore presented in the less than one year category. |
| (g) | Represents obligations by the Partnership�s corporate subsidiary to make payments under the Tax Receivable Agreements to certain non-controlling interest holders for the tax savings realized from the taxable purchases of their interests in connection with the reorganization at the time of Blackstone�s initial public offering in 2007 and subsequent purchases. The obligation represents the amount of the payments currently expected to be made, which are dependent on the tax savings actually realized as determined annually without discounting for the timing of the payments. As required by GAAP, the amount of the obligation included in the Condensed Consolidated Financial Statements and shown in Note�16. �Related Party Transactions� (see �Part�I. Item�1. Financial Statements�) differs to reflect the net present value of the payments due to certain non-controlling interest holders. |
| (h) | The total represents gross unrecognized tax benefits of $0.3�million and interest and penalties of $0.4�million. In addition, Blackstone is not able to make a reasonably reliable estimate of the timing of payments in individual years in connection with gross unrecognized benefits of $19.3�million and interest of $6.5�million; therefore, such amounts are not included in the above contractual obligations table. |
| (i) | These obligations represent commitments by us to provide general partner capital funding to the Blackstone Funds, limited partner capital funding to other funds and Blackstone principal investment commitments. These amounts are generally due on demand and are therefore presented in the less than one year category; however, a substantial amount of the capital commitments are expected to be called over the next three years. We expect to continue to make these general partner capital commitments as we raise additional amounts for our investment funds over time. |
Guarantees
Blackstone and certain of its consolidated funds provide financial guarantees. The amounts and nature of these guarantees are described in Note 17. �Commitments and Contingencies � Contingencies � Guarantees� in the �Notes to Condensed Consolidated Financial Statements� in �Part�I. Item�1. Financial Statements� of this filing.
Indemnifications
In many of its service contracts, Blackstone agrees to indemnify the third party service provider under certain circumstances. The terms of the indemnities vary from contract to contract and the amount of indemnification liability, if any, cannot be determined and has not been included in the table above or recorded in our Condensed Consolidated Financial Statements as of September�30, 2014.
Clawback Obligations
Carried Interest is subject to clawback to the extent that the Carried Interest received to date with respect to a fund exceeds the amount due to Blackstone based on cumulative results of that fund. The actual clawback liability, however, generally does not become realized until the end of a fund�s life except for certain Blackstone real estate funds, multi-asset class investment funds and credit-focused funds, which may have an interim clawback liability. The lives of the carry funds with a potential clawback obligation, including available contemplated extensions, are currently anticipated to expire at various points through 2016. Further extensions of such terms may be implemented under given circumstances.
For financial reporting purposes, the general partners have recorded a liability for potential clawback obligations to the limited partners of some of the carry funds due to changes in the unrealized value of a fund�s remaining investments and where the fund�s general partner has previously received Carried Interest distributions with respect to such fund�s realized investments.
�
117
Table of Contents
As of September�30, 2014, the total clawback obligations were $4.0�million, of which $0.4�million related to Blackstone Holdings and $3.6�million related to current and former Blackstone personnel. (See Note�16. �Related Party Transactions� and Note 17. �Commitments and Contingencies� in the �Notes to Condensed Consolidated Financial Statements� in �Part�I. Item�1. Financial Statements� of this filing.)
Critical Accounting Policies
We prepare our Condensed Consolidated Financial Statements in accordance with GAAP. In applying many of these accounting principles, we need to make assumptions, estimates and/or judgments that affect the reported amounts of assets, liabilities, revenues and expenses in our condensed consolidated financial statements. We base our estimates and judgments on historical experience and other assumptions that we believe are reasonable under the circumstances. These assumptions, estimates and/or judgments, however, are often subjective. Actual results may be affected negatively based on changing circumstances. If actual amounts are ultimately different from our estimates, the revisions are included in our results of operations for the period in which the actual amounts become known. We believe the following critical accounting policies could potentially produce materially different results if we were to change underlying assumptions, estimates and/or judgments. (See Note�2. �Summary of Significant Accounting Policies� in the �Notes to Condensed Consolidated Financial Statements� in �Part�I. Item�1. Financial Statements� of this filing.)
Principles of Consolidation
The Partnership consolidates all entities that it controls through a majority voting interest or otherwise, including those Blackstone Funds in which the general partner is presumed to have control. Although the Partnership has a non-controlling interest in the Blackstone Holdings Partnerships, the limited partners do not have the right to dissolve the partnerships or have substantive kick out rights or participating rights that would overcome the presumption of control by the Partnership. Accordingly, the Partnership consolidates Blackstone Holdings and records non-controlling interests to reflect the economic interests of the limited partners of Blackstone Holdings.
In addition, the Partnership consolidates all variable interest entities (�VIE�) in which it is the primary beneficiary. An enterprise is determined to be the primary beneficiary if it holds a controlling financial interest. A controlling financial interest is defined as (a)�the power to direct the activities of a VIE that most significantly impact the entity�s economic performance, and (b)�the obligation to absorb losses of the entity or the right to receive benefits from the entity that could potentially be significant to the VIE. The consolidation guidance requires an analysis to determine (a)�whether an entity in which the Partnership holds a variable interest is a VIE, and (b)�whether the Partnership�s involvement, through holding interests directly or indirectly in the entity or contractually through other variable interests (for example, management and performance related fees), would give it a controlling financial interest. Performance of that analysis requires the exercise of judgment. VIEs qualify for the deferral of the consolidation guidance if all of the following conditions have been met:
�
| � | � | � | The entity has all of the attributes of an investment company as defined in the American Institute of Certified Public Accountants Accounting and Auditing Guide, Investment Companies (�Investment Company Guide�), or does not have all the attributes of an investment company but it is an entity for which it is acceptable based on industry practice to apply measurement principles that are consistent with the Investment Company Guide, |
�
| � | � | � | The reporting entity does not have explicit or implicit obligations to fund any losses of the entity that could potentially be significant to the entity, and |
�
| � | � | � | The entity is not a securitization or asset-backed financing entity or an entity that was formerly considered a qualifying special purpose entity. |
Where the VIEs have qualified for the deferral of the current consolidation guidance as discussed in Note�2. �Summary of Significant Accounting Policies� in the �Notes to Condensed Consolidated Financial Statements� in �Part�I. Item�1. Financial Statements�, the analysis is based on previous consolidation guidance. This guidance
�
118
Table of Contents
requires an analysis to determine (a)�whether an entity in which the Partnership holds a variable interest is a variable interest entity and (b)�whether the Partnership�s involvement, through holding interests directly or indirectly in the entity or contractually through other variable interests (for example, management and performance related fees), would be expected to absorb a majority of the variability of the entity. Under both guidelines, the Partnership determines whether it is the primary beneficiary of a VIE at the time it becomes involved with a variable interest entity and reconsiders that conclusion continually. In evaluating whether the Partnership is the primary beneficiary, Blackstone evaluates its economic interests in the entity held either directly by the Partnership and its affiliates or indirectly through employees. The consolidation analysis can generally be performed qualitatively; however, if it is not readily apparent that the Partnership is not the primary beneficiary, a quantitative analysis may also be performed. Investments and redemptions (either by the Partnership, affiliates of the Partnership or third parties) or amendments to the governing documents of the respective Blackstone Funds could affect an entity�s status as a VIE or the determination of the primary beneficiary. At each reporting date, the Partnership assesses whether it is the primary beneficiary and will consolidate or deconsolidate accordingly.
Assets of consolidated VIEs that can only be used to settle obligations of the consolidated VIE and liabilities of a consolidated VIE for which creditors (or beneficial interest holders) do not have recourse to the general credit of Blackstone are presented in a separate section in the Condensed Consolidated Statements of Financial Condition.
Revenue Recognition
Revenues primarily consist of management and advisory fees, performance fees, investment income, interest and dividend revenue and other. Please refer to �Part�I. Item�1. Business � Incentive Arrangements / Fee Structure� in our 2013 Annual Report on Form 10-K for additional information regarding the manner in which Base Management Fees and Performance Fees are generated.
Management and Advisory Fees, Net � Management and Advisory Fees, Net are comprised of management fees, including base management fees, transaction and other fees, advisory fees and management fee reductions and offsets.
The Partnership earns base management fees from limited partners of funds in each of its managed funds, at a fixed percentage of assets under management, net asset value, total assets, committed capital or invested capital, or in some cases, a fixed fee. Base management fees are recognized based on contractual terms specified in the underlying investment advisory agreements. The range of management fee rates and the calculation base from which they are earned, generally, are as follows:
On private equity, real estate, and certain credit-focused funds:
�
| � | � | � | 0.30% to 1.50% of committed capital or invested capital during the investment period, |
�
| � | � | � | 0.50% to 1.75% of invested capital or investment fair value subsequent to the investment period for private equity and real estate funds, and |
�
| � | � | � | 1.00% to 1.50% of invested capital or net asset value for certain credit-focused funds. |
On real estate and credit-focused funds structured like hedge funds:
�
| � | � | � | 1.50% to 2.00% of net asset value. |
On credit-focused separately managed accounts:
�
| � | � | � | 0.30% to 1.35% of net asset value. |
On real estate separately managed accounts:
�
| � | � | � | 0.75% to 2.00% of invested capital or net operating income. |
�
119
Table of Contents
On funds of hedge funds and separately managed accounts invested in hedge funds:
�
| � | � | � | 0.50% to 1.25% of net asset value. |
On CLO vehicles:
�
| � | � | � | 0.40% to 1.25% of total assets. |
On credit-focused registered and non-registered investment companies:
�
| � | � | � | 0.50% to 1.50% of fund assets or net asset value. |
The investment adviser of BXMT receives annual management fees based upon 1.5% of BXMT�s net proceeds received from equity offerings and accumulated �core earnings� (which is generally equal to its GAAP net income excluding certain non-cash and other items), subject to certain adjustments.
Transaction and other fees (including monitoring fees) are fees charged directly to managed funds and portfolio companies. The investment advisory agreements generally require that the investment adviser reduce the amount of management fees payable by the limited partners to the Partnership (�management fee reductions�) by an amount equal to a portion of the transaction and other fees directly paid to the Partnership by the portfolio companies. The amount of the reduction varies by fund, the type of fee paid by the portfolio company and the previously incurred expenses of the fund.
Management fee offsets are reductions to management fees payable by our limited partners, which are granted based on the amount they reimburse Blackstone for placement fees.
Advisory fees consist of advisory retainer and transaction-based fee arrangements related to financial and strategic advisory services, restructuring and reorganization advisory services, capital markets services and fund placement services for alternative investment funds. Advisory retainer fees are recognized when services for the transactions are complete, in accordance with terms set forth in individual agreements. Transaction-based fees are recognized when (a)�there is evidence of an arrangement with a client, (b)�agreed upon services have been provided, (c)�fees are fixed or determinable, and (d)�collection is reasonably assured. Fund placement fees are recognized as earned upon the acceptance by a fund of capital or capital commitments.
Accrued but unpaid Management and Advisory Fees, net of management fee reductions and management fee offsets, as of the reporting date are included in Accounts Receivable or Due from Affiliates in the Condensed Consolidated Statements of Financial Condition. Management fees paid by limited partners to the Blackstone Funds and passed on to Blackstone are not considered affiliate revenues.
Performance Fees � Performance Fees earned on the performance of Blackstone�s hedge fund structures (�Incentive Fees�) are recognized based on fund performance during the period, subject to the achievement of minimum return levels, or high water marks, in accordance with the respective terms set out in each hedge fund�s governing agreements. Accrued but unpaid Incentive Fees charged directly to investors in Blackstone�s offshore hedge funds as of the reporting date are recorded within Due from Affiliates in the Condensed Consolidated Statements of Financial Condition. Accrued but unpaid Incentive Fees on onshore funds as of the reporting date are reflected in Investments in the Condensed Consolidated Statements of Financial Condition. Incentive Fees are realized at the end of a measurement period, typically annually. Once realized, such fees are not subject to clawback or reversal.
In certain fund structures, specifically in private equity, real estate and certain Hedge Fund Solutions and credit-focused funds (�Carry Funds�), performance fees (�Carried Interest�) are allocated to the general partner based on cumulative fund performance to date, subject to a preferred return to limited partners. At the end of each reporting period, the Partnership calculates the Carried Interest that would be due to the Partnership for each fund, pursuant to the fund agreements, as if the fair value of the underlying investments were realized as of such date,
�
120
Table of Contents
irrespective of whether such amounts have been realized. As the fair value of underlying investments varies between reporting periods, it is necessary to make adjustments to amounts recorded as Carried Interest to reflect either (a)�positive performance resulting in an increase in the Carried Interest allocated to the general partner or (b)�negative performance that would cause the amount due to the Partnership to be less than the amount previously recognized as revenue, resulting in a negative adjustment to Carried Interest allocated to the general partner. In each scenario, it is necessary to calculate the Carried Interest on cumulative results compared to the Carried Interest recorded to date and make the required positive or negative adjustments. The Partnership ceases to record negative Carried Interest allocations once previously recognized Carried Interest allocations for such fund have been fully reversed. The Partnership is not obligated to pay guaranteed returns or hurdles, and therefore, cannot have negative Carried Interest over the life of a fund. Accrued but unpaid Carried Interest as of the reporting date is reflected in Investments in the Condensed Consolidated Statements of Financial Condition.
Carried Interest is realized when an underlying investment is profitably disposed of and the fund�s cumulative returns are in excess of the preferred return or, in limited instances, after certain thresholds for return of capital are met. Carried Interest is subject to clawback to the extent that the Carried Interest received to date exceeds the amount due to Blackstone based on cumulative results. As such, the accrual for potential repayment of previously received Carried Interest, which is a component of Due to Affiliates, represents all amounts previously distributed to Blackstone Holdings and non-controlling interest holders that would need to be repaid to the Blackstone Funds if the Blackstone Carry Funds were to be liquidated based on the current fair value of the underlying funds� investments as of the reporting date. The actual clawback liability, however, generally does not become realized until the end of a fund�s life except for certain Blackstone real estate funds, multi-asset class investment funds and credit-focused funds, which may have an interim clawback liability.
Investment Income (Loss) � Investment Income (Loss) represents the unrealized and realized gains and losses on the Partnership�s principal investments, including its investments in Blackstone Funds that are not consolidated, its equity method investments and other principal investments. Investment Income (Loss) is realized when the Partnership redeems all or a portion of its investment or when the Partnership receives cash income, such as dividends or distributions. Unrealized Investment Income (Loss) results from changes in the fair value of the underlying investment as well as the reversal of unrealized gain (loss) at the time an investment is realized.
Interest and Dividend Revenue � Interest and Dividend Revenue comprises primarily interest and dividend income earned on principal investments held by Blackstone.
Other Revenue � Other Revenue consists of miscellaneous income and foreign exchange gains and losses arising on transactions denominated in currencies other than U.S. dollars.
Expenses
Our expenses include compensation and benefits expense and general and administrative expenses. Our accounting policies related thereto are as follows:
Compensation and Benefits � Compensation � Compensation and Benefits consists of (a)�employee compensation, comprising salary and bonus, and benefits paid and payable to employees and senior managing directors and (b)�equity-based compensation associated with the grants of equity-based awards to employees and senior managing directors. Compensation cost relating to the issuance of equity-based awards to senior managing directors and employees is measured at fair value at the grant date, taking into consideration expected forfeitures, and expensed over the vesting period on a straight-line basis. Equity-based awards that do not require future service are expensed immediately. Cash settled equity-based awards are classified as liabilities and are remeasured at the end of each reporting period.
Compensation and Benefits � Performance Fee � Performance Fee Compensation consists of Carried Interest and Incentive Fee allocations, and may in future periods also include allocations of investment income from
�
121
Table of Contents
Blackstone�s firm investments, to employees and senior managing directors participating in certain profit sharing initiatives. Such compensation expense is subject to both positive and negative adjustments. Unlike Carried Interest and Incentive Fees, compensation expense is based on the performance of individual investments held by a fund rather than on a fund by fund basis. Compensation received from advisory clients in the form of securities of such clients may also be allocated to employees and senior managing directors.
Fair Value of Financial Instruments
GAAP establishes a hierarchical disclosure framework which prioritizes and ranks the level of market price observability used in measuring financial instruments at fair value. Market price observability is affected by a number of factors, including the type of financial instrument, the characteristics specific to the financial instrument and the state of the marketplace, including the existence and transparency of transactions between market participants. Financial instruments with readily available quoted prices in active markets generally will have a higher degree of market price observability and a lesser degree of judgment used in measuring fair value.
Financial instruments measured and reported at fair value are classified and disclosed based on the observability of inputs used in the determination of fair values, as follows:
�
| � | � | � | Level I � Quoted prices are available in active markets for identical financial instruments as of the reporting date. The type of financial instruments in Level I include listed equities, listed derivatives and mutual funds with quoted prices. The Partnership does not adjust the quoted price for these investments, even in situations where Blackstone holds a large position and a sale could reasonably impact the quoted price. |
�
| � | � | � | Level II � Pricing inputs are other than quoted prices in active markets, which are either directly or indirectly observable as of the reporting date, and fair value is determined through the use of models or other valuation methodologies. Financial instruments which are generally included in this category include corporate bonds and loans, government and agency securities, less liquid and restricted equity securities, certain over-the-counter derivatives where the fair value is based on observable inputs, and certain funds of hedge funds and proprietary investments in which Blackstone has the ability to redeem its investment at net asset value at, or within three months of, the reporting date. |
�
| � | � | � | Level III � Pricing inputs are unobservable for the financial instruments and includes situations where there is little, if any, market activity for the financial instrument. The inputs into the determination of fair value require significant management judgment or estimation. Financial instruments that are included in this category generally include general and limited partnership interests in private equity and real estate funds, credit-focused funds, distressed debt and non-investment grade residual interests in securitizations, certain corporate bonds and loans held within CLO vehicles, certain over-the-counter derivatives where the fair value is based on unobservable inputs and certain funds of hedge funds that use net asset value per share to determine fair value in which Blackstone may not have the ability to redeem its investment at net asset value at, or within three months of, the reporting date. Blackstone may not have the ability to redeem its investment at net asset value at, or within three months of, the reporting date if an investee fund manager has the ability to limit the amount of redemptions, and/or the ability to side pocket investments, irrespective of whether such ability has been exercised. Senior and subordinate notes issued by CLO vehicles are classified within Level III of the fair value hierarchy. |
In certain cases, the inputs used to measure fair value may fall into different levels of the fair value hierarchy. In such cases, the determination of which category within the fair value hierarchy is appropriate for any given financial instrument is based on the lowest level of input that is significant to the fair value measurement. The Partnership�s assessment of the significance of a particular input to the fair value measurement in its entirety requires judgment and considers factors specific to the financial instrument.
Transfers between levels of the fair value hierarchy are recognized at the beginning of the reporting period.
�
122
Table of Contents
Level II Valuation Techniques
Financial instruments classified within Level II of the fair value hierarchy comprise debt instruments, including corporate loans and bonds held by Blackstone�s consolidated CLO vehicles, those held within Blackstone�s Treasury Cash Management Strategies and debt securities sold, not yet purchased and interests in investment funds. Certain equity securities and derivative instruments valued using observable inputs are also classified as Level II.
The valuation techniques used to value financial instruments classified within Level II of the fair value hierarchy are as follows:
�
| � | � | � | Debt Instruments and Equity Securities are valued on the basis of prices from an orderly transaction between market participants provided by reputable dealers or pricing services. In determining the value of a particular investment, pricing services may use certain information with respect to transactions in such investments, quotations from dealers, pricing matrices and market transactions in comparable investments and various relationships between investments. The valuation of certain equity securities is based on an observable price for an identical security adjusted for the effect of a restriction. |
�
| � | � | � | Investment Funds held by the consolidated Blackstone Funds are valued using net asset value per share as described in Level III Valuation Techniques � Funds of Hedge Funds. Certain investments in investment funds are classified within Level II of the fair value hierarchy as the investment can be redeemed at, or within three months of, the reporting date. |
�
| � | � | � | Freestanding Derivatives and Derivative Instruments Used in Fair Value Hedging Strategies are valued using contractual cash flows and observable inputs comprising yield curves, foreign currency rates and credit spreads. |
Level III Valuation Techniques
In the absence of observable market prices, Blackstone values its investments using valuation methodologies applied on a consistent basis. For some investments little market activity may exist; management�s determination of fair value is then based on the best information available in the circumstances, and may incorporate management�s own assumptions and involves a significant degree of judgment, taking into consideration a combination of internal and external factors, including the appropriate risk adjustments for non-performance and liquidity risks. Investments for which market prices are not observable include private investments in the equity of operating companies, real estate properties, certain funds of hedge funds and credit-focused investments.
Private Equity Investments � The fair values of private equity investments are determined by reference to projected net earnings, earnings before interest, taxes, depreciation and amortization (�EBITDA�), the discounted cash flow method, public market or private transactions, valuations for comparable companies and other measures which, in many cases, are unaudited at the time received. Valuations may be derived by reference to observable valuation measures for comparable companies or transactions (for example, multiplying a key performance metric of the investee company such as EBITDA by a relevant valuation multiple observed in the range of comparable companies or transactions), adjusted by management for differences between the investment and the referenced comparables, and in some instances by reference to option pricing models or other similar methods. Where a discounted cash flow method is used, a terminal value is derived by reference to EBITDA or price/earnings exit multiples.
Real Estate Investments � The fair values of real estate investments are determined by considering projected operating cash flows, sales of comparable assets, if any, and replacement costs, among other measures. The methods used to estimate the fair value of real estate investments include the discounted cash flow method and/or capitalization rates (�cap rates�) analysis. Valuations may be derived by reference to observable valuation measures for comparable companies or assets (for example, multiplying a key performance metric of the investee company or asset, such as EBITDA, by a relevant valuation multiple observed in the range of comparable companies or transactions), adjusted by management for differences between the investment and the referenced comparables, and
�
123
Table of Contents
in some instances by reference to option pricing models or other similar methods. Where a discounted cash flow method is used, a terminal value is derived by reference to an exit EBITDA multiple or capitalization rate. Additionally, where applicable, projected distributable cash flow through debt maturity will be considered in support of the investment�s fair value.
Funds of Hedge Funds � The investments of consolidated Blackstone Funds in funds of hedge funds (�Investee Funds�) are valued at net asset value (�NAV�) per share of the Investee Fund. In limited circumstances, the Partnership may determine, based on its own due diligence and investment procedures, that NAV per share does not represent fair value. In such circumstances, the Partnership will estimate the fair value in good faith and in a manner that it reasonably chooses, in accordance with its valuation policies.
Certain investments of Blackstone and of the consolidated Blackstone funds of hedge funds and credit-focused funds measure their investments in underlying funds at fair value using NAV per share without adjustment. The terms of the investee�s investment generally provide for minimum holding periods or lock-ups, the institution of gates on redemptions or the suspension of redemptions or an ability to side pocket investments, at the discretion of the investee�s fund manager, and as a result, investments may not be redeemable at, or within three months of, the reporting date. A side pocket is used by hedge funds and funds of hedge funds to separate investments that may lack a readily ascertainable value, are illiquid or are subject to liquidity restriction. Redemptions are generally not permitted until the investments within a side pocket are liquidated or it is deemed that the conditions existing at the time that required the investment to be included in the side pocket no longer exist. As the timing of either of these events is uncertain, the timing at which the Partnership may redeem an investment held in a side pocket cannot be estimated. Investments for which fair value is measured using NAV per share are reflected within the fair value hierarchy based on the existence of redemption restrictions, if any, as described above. Further disclosure on instruments for which fair value is measured using NAV per share is presented in Note�5. �Net Asset Value as Fair Value� in the �Notes to Condensed Consolidated Financial Statements� in �Part�I. Item�1. Financial Statements� of this filing.
Credit-Focused Investments � The fair values of credit-focused investments are generally determined on the basis of prices between market participants provided by reputable dealers or pricing services. In some instances, Blackstone may utilize other valuation techniques, including the discounted cash flow method or a market approach.
Credit-Focused Liabilities � Credit-focused liabilities comprise senior and subordinate loans issued by Blackstone�s consolidated CLO vehicles. Such liabilities are valued using a discounted cash flow method.
Level III Valuation Process
Investments classified within Level III of the fair value hierarchy are valued on a quarterly basis, taking into consideration any changes in Blackstone�s weighted-average cost of capital assumptions, discounted cash flow projections and exit multiple assumptions, as well as any changes in economic and other relevant conditions, and valuation models are updated accordingly. The valuation process also includes a review by an independent valuation party, at least annually for all investments, and quarterly for certain investments, to corroborate the values determined by management. The valuations of Blackstone�s investments are reviewed quarterly by a valuation committee which is chaired by Blackstone�s Vice Chairman and includes senior heads of each of Blackstone�s businesses, as well as representatives of legal and finance. Each quarter, the valuations of Blackstone�s investments are also reviewed by the Audit Committee in a meeting attended by the chairman of the valuation committee. The valuations are further tested by comparison to actual sales prices obtained on disposition of the investments.
Investments, at Fair Value
The Blackstone Funds are accounted for as investment companies under the Investment Company Guide, and reflect their investments, including majority-owned and controlled investments (the �Portfolio Companies�), at fair value. Blackstone has retained the specialized accounting for the consolidated Blackstone Funds. Thus, such
�
124
Table of Contents
consolidated funds� investments are reflected in Investments on the Condensed Consolidated Statements of Financial Condition at fair value, with unrealized gains and losses resulting from changes in fair value reflected as a component of Net Gains (Losses) from Fund Investment Activities in the Condensed Consolidated Statements of Operations. Fair value is the amount that would be received to sell an asset or paid to transfer a liability, in an orderly transaction between market participants at the measurement date (i.e., the exit price).
Blackstone�s principal investments are presented at fair value with unrealized appreciation or depreciation and realized gains and losses recognized in the Condensed Consolidated Statements of Operations within Investment Income (Loss).
For certain instruments, the Partnership has elected the fair value option. Such election is irrevocable and is applied on an investment by investment basis at initial recognition. The Partnership has applied the fair value option for certain loans and receivables that otherwise would not have been carried at fair value with gains and losses recorded in net income. Accounting for these financial instruments at fair value is consistent with how the Partnership accounts for its other principal investments. Loans extended to third parties are recorded within Accounts Receivable within the Condensed Consolidated Statements of Financial Condition. Debt securities for which the fair value option has been elected are recorded within Investments. The methodology for measuring the fair value of such investments is consistent with the methodology applied to private equity, real estate, credit-focused and funds of hedge funds investments. Changes in the fair value of such instruments are recognized in Investment Income (Loss) in the Condensed Consolidated Statements of Operations. Interest income on interest bearing loans and receivables on which the fair value option has been elected is based on stated coupon rates adjusted for the accretion of purchase discounts and the amortization of purchase premiums. This interest income is recorded within Interest and Dividend Revenue.
In addition, the Partnership has elected the fair value option for the assets and liabilities of CLO vehicles that are consolidated as of January�1, 2010, as a result of the initial adoption of variable interest entity consolidation guidance. The Partnership has also elected the fair value option for CLO vehicles consolidated as a result of the acquisitions of CLO management contracts or the acquisition of the share capital of CLO managers. The adjustment resulting from the difference between the fair value of assets and liabilities for each of these events is presented as a transition and acquisition adjustment to Appropriated Partners� Capital. Assets of the consolidated CLOs are presented within Investments within the Condensed Consolidated Statements of Financial Condition and Liabilities within Loans Payable for the amounts due to unaffiliated third parties and Due to Affiliates for the amounts held by non-consolidated affiliates. The methodology for measuring the fair value of such assets and liabilities is consistent with the methodology applied to private equity, real estate and credit-focused investments. Changes in the fair value of consolidated CLO assets and liabilities and related interest, dividend and other income subsequent to adoption and acquisition are presented within Net Gains (Losses) from Fund Investment Activities. Expenses of consolidated CLO vehicles are presented in Fund Expenses. Amounts attributable to Non-Controlling Interests in Consolidated Entities have a corresponding adjustment to Appropriated Partners� Capital.
The Partnership has elected the fair value option for certain proprietary investments that would otherwise have been accounted for using the equity method of accounting. The fair value of such investments is based on quoted prices in an active market or using the discounted cash flow method. Changes in fair value are recognized in Investment Income (Loss) in the Condensed Consolidated Statements of Operations.
Further disclosure on instruments for which the fair value option has been elected is presented in Note�7. �Fair Value Option� in the �Notes to Condensed Consolidated Financial Statements� in �Part�I. Item�1. Financial Statements� of this filing.
Intangibles and Goodwill
Blackstone�s intangible assets consist of contractual rights to earn future fee income, including management and advisory fees, Incentive Fees and Carried Interest. Identifiable finite-lived intangible assets are amortized on a straight-line basis over their estimated useful lives, ranging from 3 to 20 years, reflecting the contractual lives of
�
125
Table of Contents
such assets. Amortization expense is included within General, Administrative and Other in the accompanying Condensed Consolidated Statements of Operations. The Partnership does not hold any indefinite-lived intangible assets. Intangible assets are reviewed for impairment when events or changes in circumstances indicate that the carrying amount may not be recoverable.
Goodwill comprises goodwill arising from the contribution and reorganization of the Partnership�s predecessor entities in 2007 immediately prior to its IPO, the acquisition of GSO in 2008 and the acquisition of Strategic Partners in 2013.
The carrying value of goodwill was $1.8�billion as of September�30, 2014 and December�31, 2013. Goodwill is reviewed for impairment at least annually, and more frequently if circumstances indicate impairment may have occurred. As of September�30, 2014 and December�31, 2013, we evaluated that it was not more likely than not that the fair value of the Partnership�s operating segments was less than their respective carrying values.
We test goodwill for impairment at the operating segment level (the same as our segments). Management has organized the firm into five operating segments. All of the components in each segment have similar economic characteristics and management makes key operating decisions based on the performance of each segment. Therefore, we believe that operating segment is the appropriate reporting level for testing the impairment of goodwill. Blackstone performed a qualitative assessment as of September�30, 2014 and December�31, 2013 to determine if it was more likely than not that the fair value of its operating segments was less than their respective carrying values.
Off-Balance Sheet Arrangements
In the normal course of business, we enter into various off-balance sheet arrangements including sponsoring and owning limited or general partner interests in consolidated and non-consolidated funds, entering into derivative transactions, entering into operating leases and entering into guarantee arrangements. We also have ongoing capital commitment arrangements with certain of our consolidated and non-consolidated drawdown funds. We do not have any off-balance sheet arrangements that would require us to fund losses or guarantee target returns to investors in our funds.
Further disclosure on our off-balance sheet arrangements is presented in the �Notes to Condensed Consolidated Financial Statements� in �Part�I. Item�1. Financial Statements� of this filing as follows:
�
| � | � | � | Note�6. �Derivative Financial Instruments�, |
�
| � | � | � | Note�9. �Variable Interest Entities�, and |
�
| � | � | � | Note�17. �Commitments and Contingencies � Commitments � Investment Commitments� and ���Contingencies � Guarantees�. |
Recent Accounting Developments
Information regarding recent accounting developments and their impact on Blackstone can be found in Note�2. �Summary of Significant Accounting Policies� in the �Notes to Condensed Consolidated Financial Statements� in �Part�I. Item�1. Financial Statements� of this filing.
�
126
Table of Contents
| ITEM�3. | QUANTITATIVE AND QUALITATIVE DISCLOSURES ABOUT MARKET RISK |
Our predominant exposure to market risk is related to our role as general partner or investment adviser to the Blackstone Funds and the sensitivities to movements in the fair value of their investments, including the effect on management fees, performance fees and investment income.
Although the Blackstone Funds share many common themes, each of our alternative asset management operations runs its own investment and risk management processes, subject to our overall risk tolerance and philosophy:
�
| � | � | � | The investment process of our carry funds involves a detailed analysis of potential investments, and asset management teams are assigned to oversee the operations, strategic development, financing and capital deployment decisions of each portfolio investment. Key investment decisions are subject to approval by the applicable investment committee, which is comprised of Blackstone senior managing directors and senior management. |
�
| � | � | � | In our capacity as adviser to certain funds in our Hedge Fund Solutions and Credit segments, we continuously monitor a variety of markets for attractive trading opportunities, applying a number of traditional and customized risk management metrics to analyze risk related to specific assets or portfolios. In addition, we perform extensive credit and cash flow analyses of borrowers, credit-based assets and underlying hedge fund managers, and have extensive asset management teams that monitor covenant compliance by, and relevant financial data of, borrowers and other obligors, asset pool performance statistics, tracking of cash payments relating to investments and ongoing analysis of the credit status of investments. |
Effect on Fund Management Fees
Our management fees are based on (a)�third parties� capital commitments to a Blackstone Fund, (b)�third parties� capital invested in a Blackstone Fund or (c)�the net asset value, or NAV, of a Blackstone Fund, as described in our Condensed Consolidated Financial Statements. Management fees will only be directly affected by short-term changes in market conditions to the extent they are based on NAV or represent permanent impairments of value. These management fees will be increased (or reduced) in direct proportion to the effect of changes in the fair value of our investments in the related funds. The proportion of our management fees that are based on NAV is dependent on the number and types of Blackstone Funds in existence and the current stage of each fund�s life cycle. For the nine months ended September�30, 2014 and September�30, 2013, the approximate percentages of our fund management fees based on the NAV of the applicable funds or separately managed accounts, were as follows:
�
| � | �� | Nine�Months�Ended September�30, |
� | |||||
| � | �� | ����2014���� | � | � | ����2013���� | � | ||
| Fund Management Fees Based on the NAV of the Applicable Funds or Separately Managed Accounts |
�� | � | 35 | %� | � | � | 30 | %� |
�
127
Table of Contents
Market Risk
The Blackstone Funds hold investments which are reported at fair value. Based on the fair value as of September�30, 2014 and September�30, 2013, we estimate that a 10% decline in fair value of the investments would result in the following declines in Management Fees, Performance Fees, Net of Related Compensation Expense and Investment Income:
�
| � | �� | September�30, | � | |||||||||||||||||||||
| � | �� | 2014 | � | �� | 2013 | � | ||||||||||||||||||
| � | �� | Management Fees (a) |
� | �� | Performance Fees, Net of Related Compensation Expense (b) |
� | �� | Investment Income (b) |
� | �� | Management Fees (a) |
� | �� | Performance Fees, Net of Related Compensation Expense (b) |
� | �� | Investment Income (b) |
� | ||||||
| � | �� | (Dollars in Thousands) | � | |||||||||||||||||||||
| 10% Decline in Fair Value of the Investments |
�� | $ | 86,241 | �� | �� | $ | 1,237,030 | �� | �� | $ | 290,556 | �� | �� | $ | 65,099 | �� | �� | $ | 861,713 | �� | �� | $ | 284,991 | �� |
�
| (a) | Represents the annualized effect of the 10% decline. |
| (b) | Represents the reporting date effect of the 10% decline. |
Total Assets Under Management, excluding undrawn capital commitments and the amount of capital raised for our CLOs, by segment, and the percentage amount classified as Level III investments as defined within the fair value standards of GAAP, are as follows:
�
| � | �� | September�30, 2014 | � | |||||
| � | �� | Total�Assets�Under�Management, Excluding Undrawn Capital Commitments�and�the�Amount�of Capital Raised for CLOs |
� | �� | Percentage�Amount Classified�as�Level�III Investments |
� | ||
| � | �� | (Dollars in Thousands) | � | �� | � | � | ||
| Private Equity |
�� | $ | 47,411,119 | �� | �� | � | 67 | %� |
| Real Estate |
�� | $ | 64,773,460 | �� | �� | � | 68 | %� |
| Hedge Fund Solutions |
�� | $ | 63,595,318 | �� | �� | � | 63 | %� |
| Credit |
�� | $ | 41,041,907 | �� | �� | � | 43 | %� |
The fair value of our investments and securities can vary significantly based on a number of factors that take into consideration the diversity of the Blackstone Funds� investment portfolio and on a number of factors and inputs such as similar transactions, financial metrics, and industry comparatives, among others. (See �Part�I. Item�1A. Risk Factors� in our 2013 Annual Report on Form 10-K. Also see �Part�I. Item�2. Management�s Discussion and Analysis of Financial Condition and Results of Operations � Critical Accounting Policies � Investments, at Fair Value.�) We believe these fair value amounts should be utilized with caution as our intent and strategy is to hold investments and securities until prevailing market conditions are beneficial for investment sales.
Investors in all of our carry funds (and certain of our credit-focused funds and funds of hedge funds) make capital commitments to those funds that we are entitled to call from those investors at any time during prescribed periods. We depend on investors fulfilling their commitments when we call capital from them in order for those funds to consummate investments and otherwise pay their related obligations when due, including management fees. We have not had investors fail to honor capital calls to any meaningful extent and any investor that did not fund a capital call would be subject to having a significant amount of its existing investment forfeited in that fund; however, if investors were to fail to satisfy a significant amount of capital calls for any particular fund or funds, those funds could be materially and adversely affected.
Exchange Rate Risk
The Blackstone Funds hold investments that are denominated in non-U.S. dollar currencies that may be affected by movements in the rate of exchange between the U.S. dollar and non-U.S. dollar currencies. Additionally,
�
128
Table of Contents
a portion of our management fees are denominated in non-U.S. dollar currencies. We estimate that as of September�30, 2014 and September�30, 2013, a 10% decline in the rate of exchange of all foreign currencies against the U.S. dollar would result in the following declines in Management Fees, Performance Fees, Net of Related Compensation Expense and Investment Income:
�
| � | �� | September�30, | � | |||||||||||||||||||||
| � | �� | 2014 | � | �� | 2013 | � | ||||||||||||||||||
| � | �� | Management Fees (a) |
� | �� | Performance Fees, Net of Related Compensation Expense (b) |
� | �� | Investment Income (b) |
� | �� | Management Fees (a) |
� | �� | Performance Fees, Net of Related Compensation Expense (b) |
� | �� | Investment Income (b) |
� | ||||||
| � | �� | (Dollars in Thousands) | � | |||||||||||||||||||||
| 10% Decline in the Rate of Exchange of All Foreign Currencies Against the U.S. Dollar |
�� | $ | 21,848 | �� | �� | $ | 279,198 | �� | �� | $ | 40,602 | �� | �� | $ | 14,911 | �� | �� | $ | 156,000 | �� | �� | $ | 36,514 | �� |
�
| (a) | Represents the annualized effect of the 10% decline. |
| (b) | Represents the reporting date effect of the 10% decline. |
Interest Rate Risk
Blackstone has debt obligations payable that accrue interest at variable rates. Interest rate changes may therefore affect the amount of our interest payments, future earnings and cash flows. Based on our debt obligations payable as of September�30, 2014 and September�30, 2013, we estimate that interest expense relating to variable rates would increase on an annual basis, in the event interest rates were to increase by one percentage point, as follows:
�
| � | �� | September�30, | � | |||||
| � | �� | 2014 | � | �� | 2013 | � | ||
| � | �� | (Dollars�in�Thousands) | � | |||||
| Annualized Increase in Interest Expense Due to a One Percentage Point Increase in Interest Rates |
�� | $ | �68 | �� | �� | $ | �192 | �� |
Blackstone�s Treasury Cash Management Strategies consists of a diversified portfolio of liquid assets to meet the liquidity needs of various businesses (the �Treasury Liquidity Portfolio�). This portfolio includes cash, open-ended money market mutual funds, open-ended bond mutual funds, marketable investment securities, freestanding derivative contracts, repurchase and reverse repurchase agreements and other investments. If interest rates were to increase by one percentage point, we estimate that our annualized investment income would decrease, offset by an estimated increase in interest income on an annual basis from interest on floating rate assets, as follows:
�
| � | �� | September�30, | � | |||||||||||||
| � | �� | 2014 | � | �� | 2013 | � | ||||||||||
| � | �� | Annualized Decrease�in Investment Income |
� | � | Annualized Increase in Interest�Income from Floating Rate Assets |
� | �� | Annualized Decrease�in Investment Income |
� | � | Annualized Increase in Interest�Income from Floating Rate Assets |
� | ||||
| � | �� | (Dollars in Thousands) | � | |||||||||||||
| One Percentage Point Increase in Interest Rates |
�� | $ | 16,276 | (a)� | � | $ | 10,425 | �� | �� | $ | 10,493 | (a)� | � | $ | 6,263 | �� |
�
| (a) | As of September�30,�2014 and 2013, this represents 0.6% and 0.5% of the Treasury Liquidity Portfolio, respectively. |
�
129
Table of Contents
Credit Risk
Certain Blackstone Funds and the Investee Funds are subject to certain inherent risks through their investments.
The Treasury Liquidity Portfolio contains certain credit risks including, but not limited to, exposure to uninsured deposits with financial institutions, unsecured corporate bonds and mortgage-backed securities. These exposures are actively monitored on a continuous basis and positions are reallocated based on changes in risk profile, market or economic conditions.
We estimate that our annualized investment income would decrease, if credit spreads were to increase by one percentage point, as follows:
�
| � | �� | September�30, | � | |||||
| � | �� | 2014 | � | �� | 2013 | � | ||
| � | �� | (Dollars�in�Thousands) | � | |||||
| Decrease in Annualized Investment Income Due to a One Percentage Point Increase in Credit Spreads (a) |
�� | $ | 49,544 | �� | �� | $ | 25,369 | �� |
�
| (a) | As of September�30,�2014 and 2013, this represents 1.8% and 1.2% of the Treasury Liquidity Portfolio, respectively. |
Certain of our entities hold derivative instruments that contain an element of risk in the event that the counterparties may be unable to meet the terms of such agreements. We minimize our risk exposure by limiting the counterparties with which we enter into contracts to banks and investment banks who meet established credit and capital guidelines. We do not expect any counterparty to default on its obligations and therefore do not expect to incur any loss due to counterparty default.
�
| ITEM�4. | CONTROLS AND PROCEDURES |
We maintain �disclosure controls and procedures,� as such term is defined in Rules 13a-15(e) and 15d-15(e) under the Securities Exchange Act of 1934 (the �Exchange Act�), that are designed to ensure that information required to be disclosed by us in reports that we file or submit under the Exchange Act is recorded, processed, summarized and reported within the time periods specified in Securities and Exchange Commission rules and forms, and that such information is accumulated and communicated to our management, including our Chief Executive Officer and Chief Financial Officer, as appropriate, to allow timely decisions regarding required disclosure. In designing disclosure controls and procedures, our management necessarily was required to apply its judgment in evaluating the cost-benefit relationship of possible disclosure controls and procedures. The design of any disclosure controls and procedures also is based in part upon certain assumptions about the likelihood of future events, and there can be no assurance that any design will succeed in achieving its stated goals under all potential future conditions. Any controls and procedures, no matter how well designed and operated, can provide only reasonable assurance of achieving the desired objectives.
Our management, including our Chief Executive Officer and Chief Financial Officer, evaluated the effectiveness of our disclosure controls and procedures pursuant to Rule 13a-15 under the Exchange Act as of the end of the period covered by this report. Based on that evaluation, our Chief Executive Officer and Chief Financial Officer have concluded that, as of the end of the period covered by this report, our disclosure controls and procedures (as defined in Rule 13a-15(e) under the Exchange Act) are effective at the reasonable assurance level to accomplish their objectives of ensuring that information we are required to disclose in reports that we file or submit under the Exchange Act is recorded, processed, summarized and reported within the time periods specified in Securities and Exchange Commission rules and forms, and that such information is accumulated and communicated to our management, including our Chief Executive Officer and Chief Financial Officer, as appropriate, to allow timely decisions regarding required disclosure.
No change in our internal control over financial reporting (as such term is defined in Rules 13a�15(f) and 15d�15(f) under the Exchange Act) occurred during our most recent quarter, that has materially affected, or is reasonably likely to materially affect, our internal control over financial reporting.
�
130
Table of Contents
PART II. OTHER INFORMATION
�
| ITEM�1. | LEGAL PROCEEDINGS |
We may from time to time be involved in litigation and claims incidental to the conduct of our business. Our businesses are also subject to extensive regulation, which may result in regulatory proceedings against us. See �Part�I. Item�1A. Risk Factors� in our 2013 Annual Report on Form 10-K. We are not currently subject to any pending judicial, administrative or arbitration proceedings that we expect to have a material impact on our consolidated financial statements. However, given the inherent unpredictability of these types of proceedings and the potentially large and/or indeterminate amounts that could be sought, it is possible that an adverse outcome in certain matters could have a material effect on Blackstone�s financial results in any particular period.
In December 2007, a purported class of shareholders in public companies acquired by one or more private equity firms filed a lawsuit against a number of private equity firms and investment banks, including The Blackstone Group L.P., in the United States District Court in Massachusetts (Kirk Dahl, et al. v. Bain Capital Partners, LLC, et al.). The suit alleges that, from mid-2003 through 2007, eleven defendants violated the antitrust laws by allegedly conspiring to rig bids, restrict the supply of private equity financing, fix the prices for target companies at artificially low levels, and divide up an alleged market for private equity services for leveraged buyouts. On July�28, 2014, Blackstone entered into a settlement agreement to resolve all of plaintiffs� claims without any admission of wrongdoing. On August�7, 2014, plaintiffs filed a motion for preliminary approval of the settlement agreement, and the agreement was preliminarily approved by the court on September�29, 2014. The settlement agreement provides for a settlement payment to the class that was substantially covered by insurance and did not have a material effect on our financial condition or results of operations. The settlement agreement is subject to final approval by the court and the court has scheduled a final settlement approval hearing for February�11, 2015.
�
| ITEM�1A. | RISK FACTORS |
For a discussion of our potential risks and uncertainties, see the information under the heading �Risk Factors� in our Annual Report on Form 10-K for the year ended December�31, 2013 and in our subsequently filed Quarterly Reports on Form 10-Q, all of which are accessible on the Securities and Exchange Commission�s website at www.sec.gov.
See �Part I. Item�2. Management�s Discussion and Analysis of Financial Condition and Results of Operations���Business Environment� in this report for a discussion of the conditions in the financial markets and economic conditions affecting our businesses. This discussion updates, and should be read together with, the risk factor entitled �Difficult market conditions can adversely affect our business in many ways, including by reducing the value or performance of the investments made by our investment funds, reducing the ability of our investment funds to raise or deploy capital and reducing the volume of the transactions involving our financial advisory business, each of which could materially reduce our revenue and cash flow and adversely affect our financial condition� in our Annual Report on Form 10-K for the year ended December�31, 2013.
The risks described in our Form 10-K and in our subsequently filed Quarterly Reports on Form 10-Q are not the only risks facing us. Additional risks and uncertainties not currently known to us or that we currently deem to be immaterial also may materially adversely affect our business, financial condition and/or operating results.
�
| ITEM�2. | UNREGISTERED SALES OF EQUITY SECURITIES AND USE OF PROCEEDS |
In January 2008, the Board of Directors of our general partner, Blackstone Group Management L.L.C., authorized the repurchase of up to $500 million of Blackstone common units and Blackstone Holdings Partnership Units. Under this unit repurchase program, units may be repurchased from time to time in open market transactions, in privately negotiated transactions or otherwise. The timing and the actual number of Blackstone common units and Blackstone Holdings Partnership Units repurchased will depend on a variety of factors, including legal requirements, price and economic and market conditions. The unit repurchase program may be suspended or
�
131
Table of Contents
discontinued at any time and does not have a specified expiration date. During the three months ended September�30, 2014, no units were repurchased. As of September�30, 2014, the amount remaining available for repurchases was $335.8�million under this program. See �Part I. Item�1. Financial Statements � Notes to Condensed Consolidated Financial Statements � Note�14. Net Income Per Common Unit� and �Part I.�Item�2. Management�s Discussion and Analysis of Financial Condition and Results of Operations � Liquidity and Capital Resources � Liquidity Needs� for further information regarding this unit repurchase program.
As permitted by our policies and procedures governing transactions in our securities by our directors, executive officers and other employees, from time to time some of these persons may establish plans or arrangements complying with Rule 10b5-1 under the Exchange Act, and similar plans and arrangements relating to our common units and Blackstone Holdings Partnership Units.
�
| ITEM�3. | DEFAULTS UPON SENIOR SECURITIES |
Not applicable.
�
| ITEM�4. | MINE SAFETY DISCLOSURES |
Not applicable.
�
| ITEM�5. | OTHER INFORMATION |
Pursuant to Section�219 of the Iran Threat Reduction and Syria Human Rights Act of 2012 (�ITRA�), which added Section�13(r) of the Exchange Act, Blackstone hereby incorporates by reference herein Exhibit 99.1 of this report, which includes disclosures publicly filed and/or provided to us by Travelport Limited, which may be considered our affiliate.
�
132
Table of Contents
| ITEM�6. | EXHIBITS |
�
| Exhibit |
�� | Exhibit Description |
| �10.1 | �� | The Blackstone Group L.P. Amended and Restated 2007 Equity Incentive Plan (incorporated herein by reference to Exhibit 10.1 to the Registrant�s Current Report on Form 8-K (File No. 001-33551) filed with the SEC on July�9, 2014). |
| �31.1 | �� | Certification of the Chief Executive Officer pursuant to Rule 13a-14(a). |
| �31.2 | �� | Certification of the Chief Financial Officer pursuant to Rule 13a-14(a). |
| �32.1 | �� | Certification of the Chief Executive Officer pursuant to 18 U.S.C. Section 1350, as adopted pursuant to Section 906 of the Sarbanes-Oxley Act of 2002 (furnished herewith). |
| �32.2 | �� | Certification of the Chief Financial Officer pursuant to 18 U.S.C. Section 1350, as adopted pursuant to Section 906 of the Sarbanes-Oxley Act of 2002 (furnished herewith). |
| �99.1 | �� | Section 13(r) Disclosure. |
| 101.INS | �� | XBRL Instance Document. |
| 101.SCH | �� | XBRL Taxonomy Extension Schema Document. |
| 101.CAL | �� | XBRL Taxonomy Extension Calculation Linkbase Document. |
| 101.DEF | �� | XBRL Taxonomy Extension Definition Linkbase Document. |
| 101.LAB | �� | XBRL Taxonomy Extension Label Linkbase Document. |
| 101.PRE | �� | XBRL Taxonomy Extension Presentation Linkbase Document. |
The agreements and other documents filed as exhibits to this report are not intended to provide factual information or other disclosure other than with respect to the terms of the agreements or other documents themselves, and you should not rely on them for that purpose. In particular, any representations and warranties made by us in these agreements or other documents were made solely within the specific context of the relevant agreement or document and may not describe the actual state of affairs as of the date they were made or at any other time.
�
133
Table of Contents
Pursuant to the requirements of Section�13 or 15(d) of the Securities Exchange Act of 1934, the Registrant has duly caused this report to be signed on its behalf by the undersigned thereunto duly authorized.
Date: November�6, 2014
�
| The Blackstone Group L.P. | ||
| By: |
� | Blackstone Group Management L.L.C., |
| � | its General Partner | |
| � | /s/ Laurence A. Tosi | |
| Name: | � | Laurence A. Tosi |
| Title: | � | Chief Financial Officer |
| � | (Principal Financial Officer and Authorized Signatory) | |
�
134
Exhibit 31.1
CHIEF EXECUTIVE OFFICER CERTIFICATION
I, Stephen A. Schwarzman, certify that:
�
| 1. | I have reviewed this Quarterly Report on Form 10-Q for the quarter ended September�30, 2014 of The Blackstone Group L.P.; |
�
| 2. | Based on my knowledge, this report does not contain any untrue statement of a material fact or omit to state a material fact necessary to make the statements made, in light of the circumstances under which such statements were made, not misleading with respect to the period covered by this report; |
�
| 3. | Based on my knowledge, the financial statements, and other financial information included in this report, fairly present in all material respects the financial condition, results of operations and cash flows of the Registrant as of, and for, the periods presented in this report; |
�
| 4. | The Registrant�s other certifying officer and I are responsible for establishing and maintaining disclosure controls and procedures (as defined in Exchange Act Rules 13a-15(e) and 15d-15(e)) and internal control over financial reporting (as defined in Exchange Act Rules 13a-15(f) and 15d-15(f)) for the Registrant and have: |
�
| � | a) | Designed such disclosure controls and procedures, or caused such disclosure controls and procedures to be designed under our supervision, to ensure that material information relating to the Registrant, including its consolidated subsidiaries, is made known to us by others within those entities, particularly during the period in which this report is being prepared; |
�
| � | b) | Designed such internal control over financial reporting, or caused such internal control over financial reporting to be designed under our supervision, to provide reasonable assurance regarding the reliability of financial reporting and the preparation of financial statements for external purposes in accordance with generally accepted accounting principles; |
�
| � | c) | Evaluated the effectiveness of the Registrant�s disclosure controls and procedures and presented in this report our conclusions about the effectiveness of the disclosure controls and procedures, as of the end of the period covered by this report based on such evaluation; and |
�
| � | d) | Disclosed in this report any change in the Registrant�s internal control over financial reporting that occurred during the Registrant�s most recent fiscal quarter (the Registrant�s fourth fiscal quarter in the case of an annual report) that has materially affected, or is reasonably likely to materially affect, the Registrant�s internal control over financial reporting; and |
�
| 5. | The Registrant�s other certifying officer and I have disclosed, based on our most recent evaluation of internal control over financial reporting, to the Registrant�s auditors and the audit committee of the Registrant�s board of directors (or persons performing the equivalent functions): |
�
| � | a) | All significant deficiencies and material weaknesses in the design or operation of internal control over financial reporting which are reasonably likely to adversely affect the Registrant�s ability to record, process, summarize and report financial information; and |
�
| � | b) | Any fraud, whether or not material, that involves management or other employees who have a significant role in the Registrant�s internal control over financial reporting. |
Date: November�6, 2014
�
| /s/ Stephen A. Schwarzman |
| Stephen A. Schwarzman |
| Chief Executive Officer of Blackstone Group Management L.L.C. |
Exhibit 31.2
CHIEF FINANCIAL OFFICER CERTIFICATION
I, Laurence A. Tosi, certify that:
�
| 1. | I have reviewed this Quarterly Report on Form 10-Q for the quarter ended September�30, 2014 of The Blackstone Group L.P.; |
�
| 2. | Based on my knowledge, this report does not contain any untrue statement of a material fact or omit to state a material fact necessary to make the statements made, in light of the circumstances under which such statements were made, not misleading with respect to the period covered by this report; |
�
| 3. | Based on my knowledge, the financial statements, and other financial information included in this report, fairly present in all material respects the financial condition, results of operations and cash flows of the Registrant as of, and for, the periods presented in this report; |
�
| 4. | The Registrant�s other certifying officer and I are responsible for establishing and maintaining disclosure controls and procedures (as defined in Exchange Act Rules 13a-15(e) and 15d-15(e)) and internal control over financial reporting (as defined in Exchange Act Rules 13a-15(f) and 15d-15(f)) for the Registrant and have: |
�
| � | a) | Designed such disclosure controls and procedures, or caused such disclosure controls and procedures to be designed under our supervision, to ensure that material information relating to the Registrant, including its consolidated subsidiaries, is made known to us by others within those entities, particularly during the period in which this report is being prepared; |
�
| � | b) | Designed such internal control over financial reporting, or caused such internal control over financial reporting to be designed under our supervision, to provide reasonable assurance regarding the reliability of financial reporting and the preparation of financial statements for external purposes in accordance with generally accepted accounting principles; |
�
| � | c) | Evaluated the effectiveness of the Registrant�s disclosure controls and procedures and presented in this report our conclusions about the effectiveness of the disclosure controls and procedures, as of the end of the period covered by this report based on such evaluation; and |
�
| � | d) | Disclosed in this report any change in the Registrant�s internal control over financial reporting that occurred during the Registrant�s most recent fiscal quarter (the Registrant�s fourth fiscal quarter in the case of an annual report) that has materially affected, or is reasonably likely to materially affect, the Registrant�s internal control over financial reporting; and |
�
| 5. | The Registrant�s other certifying officer and I have disclosed, based on our most recent evaluation of internal control over financial reporting, to the Registrant�s auditors and the audit committee of the Registrant�s board of directors (or persons performing the equivalent functions): |
�
| � | a) | All significant deficiencies and material weaknesses in the design or operation of internal control over financial reporting which are reasonably likely to adversely affect the Registrant�s ability to record, process, summarize and report financial information; and |
�
| � | b) | Any fraud, whether or not material, that involves management or other employees who have a significant role in the Registrant�s internal control over financial reporting. |
Date: November�6, 2014
�
| /s/ Laurence A. Tosi |
| Laurence A. Tosi |
| Chief Financial Officer of Blackstone Group Management L.L.C. |
Exhibit 32.1
Certification of the Chief Executive Officer
Pursuant to 18 U.S.C. Section�1350,
As Adopted Pursuant to Section�906 of the Sarbanes-Oxley Act of 2002
In connection with the Quarterly Report of The Blackstone Group L.P. (the �Partnership�) on Form 10-Q for the quarter ended September�30, 2014 as filed with the Securities and Exchange Commission on the date hereof (the �Report�), I, Stephen A. Schwarzman, Chief Executive Officer of Blackstone Group Management L.L.C., the general partner of the Partnership, certify, pursuant to 18 U.S.C. Section � 1350, as adopted pursuant to Section�906 of the Sarbanes-Oxley Act of 2002, that, to my knowledge:
�
| (1) | The Report fully complies with the requirements of Section�13(a) or 15(d) of the Securities Exchange Act of 1934; and |
�
| (2) | The information contained in the Report fairly presents, in all material respects, the financial condition and results of operations of the Partnership. |
Date: November�6, 2014
�
| /s/ Stephen A. Schwarzman |
| Stephen A. Schwarzman |
| Chief Executive Officer of Blackstone Group Management L.L.C. |
�
| * | The foregoing certification is being furnished solely pursuant to 18 U.S.C. Section�1350 and is not being filed as part of the Report or as a separate disclosure document. |
Exhibit 32.2
Certification of the Chief Financial Officer
Pursuant to 18 U.S.C. Section�1350,
As Adopted Pursuant to Section�906 of the Sarbanes-Oxley Act of 2002
In connection with the Quarterly Report of The Blackstone Group L.P. (the �Partnership�) on Form 10-Q for the quarter ended September�30, 2014 as filed with the Securities and Exchange Commission on the date hereof (the �Report�), I, Laurence A. Tosi, Chief Financial Officer of Blackstone Group Management L.L.C., the general partner of the Partnership, certify, pursuant to 18 U.S.C. Section � 1350, as adopted pursuant to Section�906 of the Sarbanes-Oxley Act of 2002, that to my knowledge:
�
| (1) | The Report fully complies with the requirements of Section�13(a) or 15(d) of the Securities Exchange Act of 1934; and |
�
| (2) | The information contained in the Report fairly presents, in all material respects, the financial condition and results of operations of the Partnership. |
Date: November�6, 2014
�
| /s/ Laurence A. Tosi |
| Laurence A. Tosi |
| Chief Financial Officer of Blackstone Group Management L.L.C. |
�
| * | The foregoing certification is being furnished solely pursuant to 18 U.S.C. Section�1350 and is not being filed as part of the Report or as a separate disclosure document. |
Exhibit 99.1
SECTION 13(r) DISCLOSURE
Travelport Limited, which may be considered our affiliate, provided the disclosure reproduced below in connection with activities during the quarter September�30, 2014. We have not independently verified or participated in the preparation of this disclosure.
�As part of our global business in the travel industry, we provide certain passenger travel-related GDS and Technology Services to Iran Air. We also provide certain airline Technology Services to Iran Air Tours. All of these services are either exempt from applicable sanctions prohibitions pursuant to a statutory exemption permitting transactions ordinarily incident to travel or, to the extent not otherwise exempt, specifically licensed by the U.S. Office of Foreign Assets Control. Subject to any changes in the exempt/licensed status of such activities, we intend to continue these business activities, which are directly related to and promote the arrangement of travel for individuals.�
Travelport has not provided us with gross revenues and net profits attributable to the activities described above.
Serious News for Serious Traders! Try StreetInsider.com Premium Free!
You May Also Be Interested In
- Midday movers: Tesla, Blackstone, Las Vegas Sands fall; DR Horton rises
- Atlantic Coast Recycling Unveils State-of-the-Art Recycling Facility; Capital Investment Led by B. Riley Financial
- NOTICE TO DISREGARD -- InFlux Technologies Ltd.
Create E-mail Alert Related Categories
SEC FilingsSign up for StreetInsider Free!
Receive full access to all new and archived articles, unlimited portfolio tracking, e-mail alerts, custom newswires and RSS feeds - and more!
