

Form 10-K NEWPARK RESOURCES INC For: Dec 31
 Tweet
Tweet Share
ShareUNITED STATES
SECURITIES AND EXCHANGE COMMISSION
Washington, D.C. 20549
FORM 10-K
[X] annual report pursuant to section 13 or 15(d) OF THE SECURITIES EXCHANGE ACT OF 1934
For the fiscal year ended December 31, 2014
OR
[ ] TranSITION REPORT PURSUANT TO SECTION 13 OR 15(d) OF THE SECURITIES EXCHANGE ACT OF 1934
For the Transition Period From to
Commission File Number 1-2960
Newpark Resources, Inc.
(Exact name of registrant as specified in its charter)
|
Delaware |
72-1123385 |
|
(State or other jurisdiction of |
(I.R.S. Employer |
|
incorporation or organization) |
Identification No.) |
|
|
|
|
9320 Lakeside Blvd., Suite 100 |
|
|
The Woodlands, Texas |
77381 |
|
(Address of principal executive offices) |
(Zip Code) |
Registrant’s telephone number, including area code (281) 362-6800
Securities registered pursuant to Section 12(b) of the Act:
|
|
Name of each exchange |
|
Title of each class |
on which registered |
|
Common Stock, $0.01 par value |
New York Stock Exchange |
Securities registered pursuant to Section 12(g) of the Act: None
Indicate by check mark if the registrant is a well-known seasoned issuer, as defined in Rule 405 of the Securities Act.
Yes No √
Indicate by check mark if the registrant is not required to file reports pursuant to Section 13 or Section 15(d) of the Act.
Yes No √
Indicate by check mark whether the registrant (1) has filed all reports required to be filed by Section 13 or 15(d) of the Securities Exchange Act of 1934 during the preceding 12 months (or for such shorter period that the registrant was required to file such reports), and (2) has been subject to such filing requirements for the past 90 days.
Yes √ No
Indicate by check mark whether the registrant has submitted electronically and posted on its corporate Web site, if any, every Interactive Data File required to be submitted and posted pursuant to Rule 405 of Regulation S-T (§ 232.405 of this chapter) during the preceding 12 months (or for such shorter period that the registrant was required to submit and post such files).
Yes √ No
Indicate by check mark if disclosure of delinquent filers pursuant to Item 405 of Regulations S-K is not contained herein, and will not be contained, to the best of registrant’s knowledge, in definitive proxy or information statements incorporated by reference in Part III of this Form 10-K or any amendment to this Form 10-K
Indicate by check mark whether the registrant is a large accelerated filer, an accelerated filer, a non-accelerated filer or a smaller reporting company. See definitions of “large accelerated filer”, “accelerated filer” and “small reporting company” in Rule 12b-2 of the Exchange Act.
Large accelerated filer √ Accelerated filer
Non-accelerated filer (Do not check if a smaller reporting company) Smaller Reporting Company
Indicate by check mark whether the registrant is a shell company (as defined in Rule 12b-2 of the Exchange Act.
Yes No √
The aggregate market value of the voting and non-voting common equity held by non-affiliates of the registrant, computed by reference to the price at which the common equity was last sold as of June 30, 2014, was $1,019.1 million. The aggregate market value has been computed by reference to the closing sales price on such date, as reported by The New York Stock Exchange.
As of February 19, 2015, a total of 84,069,387 shares of Common Stock, $0.01 par value per share, were outstanding.
Documents Incorporated by Reference
Pursuant to General Instruction G(3) to this Form 10-K, the information required by Items 10, 11, 12, 13 and 14 of Part III hereof is incorporated by reference from the registrant’s definitive Proxy Statement for its 2013 Annual Meeting of Stockholders.
NEWPARK RESOURCES, INC.
INDEX TO ANNUAL REPORT ON FORM 10-K
FOR THE YEAR ENDED DECEMBER 31, 2014
|
PART I |
|
3 |
|
|
|
|
|
ITEM 1. |
Business |
3 |
|
ITEM 1A |
Risk Factors |
6 |
|
ITEM 1B. |
Unresolved Staff Comments |
12 |
|
ITEM 2. |
Properties |
12 |
|
ITEM 3. |
Legal Proceedings |
12 |
|
ITEM 4. |
Mine Safety Disclosures |
13 |
|
|
|
|
|
PART II |
|
13 |
|
|
|
|
|
ITEM 5. |
Market for the Registrant’s Common Equity, Related Stockholder Matters and Issuer Purchases of Equity Securities |
13 |
|
ITEM 6. |
Selected Financial Data |
15 |
|
ITEM 7. |
Management’s Discussion and Analysis of Financial Condition and Results of Operations |
16 |
|
ITEM 7A. |
Quantitative and Qualitative Disclosures about Market Risk |
31 |
|
ITEM 8. |
Financial Statements and Supplementary Data |
32 |
|
ITEM 9. |
Changes in and Disagreements with Accountants on Accounting and Financial Disclosure |
63 |
|
ITEM 9A. |
Controls and Procedures |
63 |
|
ITEM 9B. |
Other Information |
66 |
|
|
|
|
|
PART III |
|
66 |
|
|
|
|
|
ITEM 10. |
Directors, Executive Officers and Corporate Governance |
66 |
|
ITEM 11. |
Executive Compensation |
66 |
|
ITEM 12. |
Security Ownership of Certain Beneficial Owners and Management and Related Stockholder Matters |
66 |
|
ITEM 13. |
Certain Relationships and Related Transactions, and Director Independence |
66 |
|
ITEM 14. |
Principal Accounting Fees and Services |
66 |
|
|
|
|
|
PART IV |
|
67 |
|
|
|
|
|
ITEM 15. |
Exhibits and Financial Statement Schedules |
67 |
| Signatures | 73 |
CAUTIONARY STATEMENT CONCERNING FORWARD-LOOKING STATEMENTS
This Annual Report on Form 10-K contains “forward-looking statements” within the meaning of Section 27A of the Securities Act of 1933, as amended, Section 21E of the Securities Exchange Act of 1934, as amended, and the Private Securities Litigation Reform Act of 1995, as amended. We also may provide oral or written forward-looking information in other materials we release to the public. Words such as “will”, “may”, “could”, “would”, “anticipates”, “believes”, “estimates”, “expects”, “plans”, “intends”, and similar expressions are intended to identify these forward-looking statements but are not the exclusive means of identifying them. These forward-looking statements reflect the current views of our management; however, various risks, uncertainties, contingencies and other factors, some of which are beyond our control, are difficult to predict and could cause our actual results, performance or achievements to differ materially from those expressed in, or implied by, these statements, including the success or failure of our efforts to implement our business strategy.
We assume no obligation to update, amend or clarify publicly any forward-looking statements, whether as a result of new information, future events or otherwise, except as required by securities laws. In light of these risks, uncertainties and assumptions, the forward-looking events discussed in this Annual Report might not occur.
For further information regarding these and other factors, risks and uncertainties affecting us, we refer you to the risk factors set forth in Item 1A of this Annual Report on Form 10-K.
PART I
|
ITEM 1. |
Business |
General
Newpark Resources, Inc. was organized in 1932 as a Nevada corporation. In 1991, we changed our state of incorporation to Delaware. We are a diversified oil and gas industry supplier providing products and services primarily to the oil and gas exploration (“E&P”) industry. We operate our business through two reportable segments: Fluids Systems and Mats and Integrated Services. Our Fluids Systems segment provides customized drilling fluids solutions to E&P customers globally, operating through four geographic regions: North America, Europe, the Middle East and Africa (“EMEA”), Latin America, and Asia Pacific. Our Mats and Integrated Services segment provides composite mat rentals, well site construction and related site services to oil and gas customers at well, production, transportation and refinery locations in the U.S. In addition, mat rental activity is expanding into applications in other industries, including petrochemicals, utilities, and pipeline. We also sell composite mats to E&P customers outside of the U.S., and to domestic customers outside of the oil and gas industry. In March 2014, we completed the sale of our Environmental Services business, which was historically reported as a third operating segment. For a detailed discussion of this matter, see “Note 2-Discontinued Operations” to our Notes to Consolidated Financial Statements included in Item 8. Financial Statements and Supplementary Data.
Our principal executive offices are located at 9320 Lakeside Blvd., Suite 100, The Woodlands, Texas 77381. Our telephone number is (281) 362-6800. You can find more information about us at our website located at www.newpark.com. Our Annual Report on Form 10-K, our Quarterly Reports on Form 10-Q, our Current Reports on Form 8-K and any amendments to those reports are available free of charge through our website. These reports are available as soon as reasonably practicable after we electronically file these materials with, or furnish them to, the Securities and Exchange Commission (“SEC”). Our Code of Ethics, our Corporate Governance Guidelines, our Audit Committee Charter, our Compensation Committee Charter and our Nominating and Corporate Governance Committee Charter are also posted to the corporate governance section of our website. We make our website content available for informational purposes only. It should not be relied upon for investment purposes, nor is it incorporated by reference in this Form 10-K. Information filed with the SEC may be read or copied at the SEC’s Public Reference Room at 100 F Street, N.E., Washington, D.C., 20549. Information on operation of the Public Reference Room may be obtained by calling the SEC at 1-800-SEC-0330. The SEC also maintains a website at www.sec.gov that contains reports, proxy and information statements, and other information regarding issuers that file electronically with the SEC, including us.
When referring to “Newpark” and using phrases such as “we”, “us” and “our”, our intent is to refer to Newpark Resources, Inc. and its subsidiaries as a whole or on a segment basis, depending on the context in which the statements are made.
Industry Fundamentals
Historically, several factors have driven demand for our products and services, including the supply, demand and pricing of oil and gas commodities, which drive E&P drilling and development activity. Demand for most of our products and services is related to the level, type, depth and complexity of oil and gas drilling. Historically, drilling activity levels in the U.S. have been volatile, primarily driven by the price of oil and natural gas. The most widely accepted measure of activity for our North American operations is the Baker Hughes Rotary Rig Count. The average North America rig count was 2,241 in 2014, compared to 2,114 in 2013, and 2,283 in 2012. Outside of North America, drilling activity is generally more stable, as drilling activity in many countries is based upon longer term economic projections and multiple year drilling programs, which tend to minimize the impact of short term changes in commodity prices on overall drilling activity.
In our core North American markets, we have seen significant growth in drilling activity in deep shales and other hard rock formations with limited permeability in recent years. These formations are being exploited with advanced fracture stimulation technology, which facilitates production of oil and natural gas from these formations and drives higher drilling activities. During the fourth quarter of 2014 and early 2015, the price for oil declined dramatically from the price levels in recent years. Following this decline, North American drilling activity has declined significantly, and activity levels are expected to remain below prior year levels for the foreseeable future. As of February 20, 2015 the North American rig count was at 1,670. The lower activity levels will reduce the demand for our services and negatively impact customer pricing in our North American operations in 2015. During these periods of rapid decline, the lower customer demand and elevated costs associated with workforce reductions negatively impact our profitability. Further, due to the fact that our business contains high levels of fixed costs, including significant facility and personnel expenses, North American operating margins in both operating segments are negatively impacted by the lower customer demand.
Internationally, we have seen continued growth in drilling activity, although certain international markets in which we operate, including Tunisia and Libya, have experienced political unrest in recent years and at various times our operations in these countries have been interrupted or suspended. Despite these interruptions, our international activities have continued to grow in recent years, driven by geographical expansion into new markets.
Reportable Segments
Fluids Systems
Our Fluids Systems business, offers customized solutions, including highly technical drilling projects involving complex subsurface conditions such as horizontal, directional, geologically deep or deep water drilling. These projects require increased monitoring and critical engineering support of the fluids system during the drilling process. We provide drilling fluids products and technical services to markets in North America, EMEA, Latin America, and the Asia Pacific regions. We also have industrial mineral grinding operations for barite, a critical raw material in drilling fluids products, which serve to support our activity in the drilling fluids market. We grind barite and other industrial minerals at facilities in Houston and Corpus Christi, Texas, New Iberia, Louisiana and Dyersburg, Tennessee. We use the resulting products in our drilling fluids business, and also sell them to third party users, including other drilling fluids companies. We also sell a variety of other minerals, principally to third party industrial (non oil and gas) markets, from our main plant in Houston, Texas and from the plant in Dyersburg, Tennessee. Our Fluids Systems business also historically included a completion services and equipment rental business; however, during the fourth quarter of 2013, we completed the sale of substantially all of the assets of this business.
Raw Materials — We believe that our sources of supply for materials and equipment used in our drilling fluids business are adequate for our needs, however, we have experienced periods of short-term scarcity of barite ore, which have resulted in significant cost increases. Our specialty milling operation is our primary supplier of barite used in our drilling fluids business. Our mills obtain raw barite ore under supply agreements from foreign sources, primarily China and India. We obtain other materials used in the drilling fluids business from various third party suppliers. We have encountered no serious shortages or delays in obtaining these raw materials.
Technology — We seek patents and licenses on new developments whenever we believe it creates a competitive advantage in the marketplace. We own the patent rights to a family of high-performance water-based fluids systems, which we market as Evolution®, DeepDrill® and FlexDrill™ systems, which are designed to enhance drilling performance and provide environmental benefits. Proprietary technology and systems is an important aspect of our business strategy. We also rely on a variety of unpatented proprietary technologies and know-how in many of our applications. We believe that our reputation in the industry, the range of services we offer, ongoing technical development and know-how, responsiveness to customers and understanding of regulatory requirements are of equal or greater competitive significance than our existing proprietary rights.
Competition — We face competition from larger companies, including Schlumberger, Halliburton and Baker Hughes, which compete vigorously on fluids performance and/or price. In addition, these companies have broad product and service offerings in addition to their drilling fluids. We also have smaller regional competitors competing with us mainly on price and local relationships. We believe that the principal competitive factors in our businesses include a combination of price, reputation, technical proficiency, reliability, quality, breadth of services offered and experience. We believe that our competitive position is enhanced by our proprietary products and services.
Customers — Our customers are principally major integrated and independent oil and gas E&P companies operating in the markets that we serve. During 2014, approximately 44% of segment revenues were derived from the 20 largest segment customers, and 63% of segment revenues were generated domestically. Typically, we perform services either under short-term standard contracts or under “master” service agreements. As most agreements with our customers can be terminated upon short notice, our backlog is not significant. We do not derive a significant portion of our revenues from government contracts. See “Note 13- Segment and Related Information” in Item 8. Financial Statements and Supplementary Data for additional information on financial and geographic data.
Mats and Integrated Services
We manufacture our DURA-BASE® Advanced Composite Mats for use in our rental operations as well as for third party sales. Our mats provide environmental protection and ensure all-weather access to sites with unstable soil conditions. We sell composite mats direct to customers in areas around the world where we do not maintain an infrastructure for our mat rental activities. In addition, we provide mat rentals to E&P customers in the Northeast U.S., onshore U.S. Gulf Coast, and Rocky Mountain Regions, and to non-E&P customers in the U.S., Canada and the United Kingdom. We also offer location construction and related well site services to E&P customers in the Gulf Coast Region.
Historically, our marketing efforts for the sale of composite mats remained focused in principal oil and gas industry markets outside the U.S., including the Asia Pacific, Latin America and EMEA regions, as well as markets outside the E&P sector in the U.S. and Europe. We believe these mats have worldwide applications outside our traditional oilfield market, primarily in infrastructure construction, maintenance and upgrades of pipelines and electric utility transmission lines, and as temporary roads for movement of oversized or unusually heavy loads. In late 2013, we announced plans to significantly expand our manufacturing facility, in order to support our efforts to expand our markets, globally. This project is expected to be substantially completed in March 2015, and will nearly double our current manufacturing capacity.
Raw Materials — We believe that our sources of supply for materials and equipment used in our business are adequate for our needs. We are not dependent upon any one supplier and we have encountered no serious shortages or delays in obtaining any raw materials. The resins, chemicals and other materials used to manufacture composite mats are widely available. Resin is the largest raw material component in the manufacturing of our composite mat products.
Technology — We have obtained patents related to the design, manufacturing and several of the components of our DURA-BASE mats as well as the design and manufacture of our composite mats. Using proprietary technology and systems is an important aspect of our business strategy. We believe that these products provide us with a distinct advantage over our competition. We believe that our reputation in the industry, the range of services we offer, ongoing technical development and know-how, responsiveness to customers and understanding of regulatory requirements also have competitive significance in the markets we serve.
Competition — Our market is fragmented and competitive, with many competitors providing various forms of site preparation products and services. We provide DURA-BASE mats to many customers, both domestic and international. The mat sales component of our business is not as fragmented as the oilfield services segment with only a few competitors providing various alternatives to our DURA-BASE mat products. This is due to many factors, including large capital start-up costs and proprietary technology associated with this product. We believe that the principal competitive factors in our businesses include product capabilities, price, reputation, and reliability. We also believe that our competitive position is enhanced by our proprietary products, services and experience.
Customers — Our customers are principally integrated and independent oil and gas E&P companies operating in the markets that we serve. During 2014, approximately 60% of our segment revenues were derived from the 20 largest segment customers, of which, the largest customer represented 18% of our segment revenues. Typically, we perform services either under short-term contracts or rental service agreements. As most agreements with our customers are cancelable upon short notice, our backlog is not significant. We do not derive a significant portion of our revenues from government contracts. See “Note 13- Segment and Related Information” in Item 8. Financial Statements and Supplementary Data for additional information on financial and geographic data.
Sale of Environmental Services Segment
In March 2014, we completed the sale of our Environmental Services business, which was historically reported as a third operating segment. For a detailed discussion of this matter, see “Note 2- Discontinued Operations” in our Notes to Consolidated Financial Statements included in Item 8. Financial Statements and Supplementary Data.
The Environmental Services business processed and disposed of waste generated by our oil and gas customers that was treated as exempt under the Resource Conservation and Recovery Act (“RCRA”). The Environmental Services business also processed E&P waste contaminated with naturally occurring radioactive material. In addition, the business received and disposed of non-hazardous industrial waste, principally from generators of such waste in the U.S. Gulf Coast market, which produced waste that was not regulated under RCRA.
Employees
At January 31, 2015, we employed 2,478 full and part-time personnel none of which are represented by unions. We consider our relations with our employees to be satisfactory.
Environmental Regulation
We seek to comply with all applicable legal requirements concerning environmental matters. Our business is affected by governmental regulations relating to the oil and gas industry in general, as well as environmental, health and safety regulations that have specific application to our business. Our activities are impacted by various federal and state regulatory agencies, and provincial pollution control, health and safety programs that are administered and enforced by regulatory agencies.
Additionally, our business exposes us to environmental risks. We have implemented various procedures designed to ensure compliance with applicable regulations and reduce the risk of damage or loss. These include specified handling procedures and guidelines for waste, ongoing employee training and monitoring and maintaining insurance coverage.
We also employ a corporate-wide web-based health, safety and environmental management system (“HSEMS”), which is ISO 14001:2004 compliant. The HSEMS is designed to capture information related to the planning, decision-making, and general operations of environmental regulatory activities within our operations. We also use the HSEMS to capture the information generated by regularly scheduled independent audits that are done to validate the findings of our internal monitoring and auditing procedures.
ITEM 1A. Risk Factors
The following summarizes the most significant risk factors to our business. Our success will depend, in part, on our ability to anticipate and effectively manage these and other risks. Any of these risk factors, either individually or in combination, could have significant adverse impacts to our results of operations and financial condition, or prevent us from meeting our profitability or growth objectives.
Risks Related to our Customer Concentration and Cyclical Nature of the E&P Industry
We derive a significant portion of our revenues from companies in the E&P industry, and our customer base is concentrated in major integrated and independent oil and gas E&P companies operating in the markets that we serve. In 2014, approximately 40% of our consolidated revenues were derived from our 20 largest customers, although no single customer accounted for more than 10% of our consolidated revenues.
The E&P industry is historically cyclical, with levels of activity generally affected by the following factors:
■ current oil and natural gas prices and expectations about future prices
■ the cost to explore for, produce and deliver oil and gas
■ the discovery rate for new oil and gas reserves
■ the ability of oil and gas companies to raise capital
■ domestic and international political, military, regulatory and economic conditions
■ government regulations regarding environmental protection, taxation, price controls and product allocation
Any of the factors above could have an adverse effect on our business, financial condition or results of operations. Specifically, during the fourth quarter of 2014 and early 2015, the price for oil has declined dramatically from the price levels in recent years and there are no assurances that the price for oil will not continue to decline. Following this decline, U.S. drilling activity has decreased, which will reduce the demand for our services and negatively impact customer pricing in our North American operations in 2015. Due to these expected changes, our quarterly and annual operating results may fluctuate in future periods. Because our business has high fixed costs, including significant facility and personnel expenses, downtime or low productivity due to reduced demand can have a significant adverse impact on our profitability.
Risks Related to Operating Hazards Present in the Oil and Natural Gas Industry
Our operations are subject to hazards present in the oil and natural gas industry, such as fire, explosion, blowouts, oil spills and leaks or spills of hazardous materials (both onshore and offshore). These incidents as well as accidents or problems in normal operations can cause personal injury or death and damage to property or the environment. The customer’s operations can also be interrupted and it is possible that such incidents can interrupt our ongoing operations and the ability to provide our services. From time to time, customers seek recovery for damage to their equipment or property that occurred during the course of our service obligations. Damage to the customer’s property and any related spills of hazardous materials could be extensive if a major problem occurred. We purchase insurance which may provide coverage for incidents such as those described above, however, the policies may not provide coverage or a sufficient amount of coverage for all types of damage claims that could be asserted against us. See the section entitled “Risks Related to the Inherent Limitations of Insurance Coverage” for additional information.
Risks Related to International Operations
We have significant operations outside of the United States, including certain areas of Canada, EMEA, Latin America, and Asia Pacific. In 2014, these international operations generated approximately 33% of our consolidated revenues. In addition, we may seek to expand to other areas outside the United States in the future. International operations are subject to a number of risks and uncertainties, including:
■ difficulties and cost associated with complying with a wide variety of complex foreign laws, treaties and regulations
■ uncertainties in or unexpected changes in regulatory environments or tax laws
■ legal uncertainties, timing delays and expenses associated with tariffs, export licenses and other trade barriers
■ difficulties enforcing agreements and collecting receivables through foreign legal systems
■ risks associated with the Foreign Corrupt Practices Act, export laws, and other similar U.S. laws applicable to our operations in international markets
■ exchange controls or other limitations on international currency movements
■ sanctions imposed by the U.S. government that prevent us from engaging in business in certain countries
■ inability to obtain or preserve certain intellectual property rights in the foreign countries in which we operate
■ our inexperience in new international markets
■ fluctuations in foreign currency exchange rates
■ political and economic instability
■ acts of terrorism
In addition, several North African markets in which we operate, including Tunisia, Egypt, Libya, and Algeria experienced social and political unrest in recent years, which negatively impacted our operating results, including the temporary suspension of our operations. More recently in Brazil, a significant number of senior executives at Petrobras resigned their positions in connection with a widely-publicized corruption investigation. We expect these developments to further disrupt Petrobras’ operations in the near term.
Risks Related to the Cost and Continued Availability of Borrowed Funds
We employ borrowed funds as an integral part of our long-term capital structure and our future success is dependent upon continued access to borrowed funds to support our operations. The availability of borrowed funds on reasonable terms is dependent on the condition of credit markets and financial institutions from which these funds are obtained. Adverse events in the financial markets may significantly reduce the availability of funds, which may have an adverse effect on our cost of borrowings and our ability to fund our business strategy. In addition, changes in commodity prices, such as the recent declines in the price of oil, may have an adverse effect on the availability of borrowed funds or the cost of borrowings to us and our customers. As many of our customers finance their drilling and production operations through borrowed funds, the reduced availability and increased cost of borrowing could cause our customers to reduce their spending on drilling programs, thereby reducing demand and potentially pricing for our products and services.
Our ability to meet our debt service requirements and the continued availability of funds under our existing or future credit agreements is dependent upon our ability to continue generating operating income and remain in compliance with the covenants in our credit agreements. This, in turn, is subject to the volatile nature of the E&P industry, and to competitive, economic, financial and other factors that are beyond our control.
Risks Related to Business Acquisitions and Capital Investments
Our ability to successfully execute our business strategy will depend, among other things, on our ability to make capital investments and acquisitions which provide us with financial benefits. In 2015, our capital expenditures are expected to be approximately $70 million to $90 million, including additional investments to complete our mat manufacturing expansion project and research and development facilities, the expansion of our chemical blending capabilities and field service infrastructure, additions to our composite mat rental fleet, as well as expansion of our field equipment. These investments are subject to a number of risks and uncertainties, including:
■ incorrect assumptions regarding the future benefits or results from our capital investments, acquired operations or assets
■ failure to complete a planned acquisition transaction or to successfully integrate the operations or management of any acquired businesses or assets in a timely manner
■ diversion of management's attention from existing operations or other priorities
■ unanticipated disruptions to our business associated with the implementation of our enterprise-wide operational and financial system
■ delays in completion and cost overruns associated with large construction projects, including those mentioned above
Any of the factors above could have an adverse effect on our business, financial condition or results of operations.
Risks Related to the Availability of Raw Materials and Skilled Personnel
Our ability to provide products and services to our customers is dependent upon our ability to obtain the raw materials and qualified personnel necessary to operate our business.
Barite is a naturally occurring mineral that constitutes a significant portion of our drilling fluids systems. We currently secure the majority of our barite ore from foreign sources, primarily China and India. The availability and cost of barite ore is dependent on factors beyond our control including transportation, political priorities and government imposed export fees in the exporting countries, as well as the impact of weather and natural disasters. The future supply of barite ore from existing sources could be inadequate to meet the market demand, particularly during periods of increasing world-wide demand, which could ultimately result in a reduction in industry activity, or our inability to meet customer’s needs.
Our mats business is highly dependent on the availability of high-density polyethylene (“HDPE”), which is the primary raw material used in the manufacture of the DURA-BASE mat. The cost of HDPE can vary significantly based on the energy costs of the producers of HDPE, demand for this material, and the capacity/operations of the plants used to make HDPE. Should our cost of HDPE increase, we may not be able to increase our customer pricing to cover our costs, which may result in a reduction in future profitability.
All of our businesses are also highly dependent on our ability to attract and retain highly-skilled engineers, technical sales and service personnel. The market for these employees is very competitive, and if we cannot attract and retain quality personnel, our ability to compete effectively and to grow our business will be severely limited. Also, a significant increase in the wages paid by competing employers could result in a reduction in our skilled labor force or an increase in our operating costs.
Risks Related to the Impact of Restrictions on Offshore Drilling Activity
Following the Deepwater Horizon event in 2010, the Department of Interior of the U.S. government took several actions aimed at restricting and temporarily prohibiting certain drilling activity in the Gulf of Mexico. Following the adoption of a number of new regulations impacting offshore drilling activities by a variety of regulatory authorities, drilling activity in the Gulf of Mexico has recovered. However, additional or renewed restrictions on exploration and production activities in the Gulf of Mexico and other offshore basins in the United States and globally in response to a similar event or perceptions of the risks of a similar event could have a significant impact on our business.
Risk Related to our Market Competition
We face competition in the Fluids Systems business from larger companies, which compete vigorously on fluids performance and/or price. In addition, these companies have broad product and service offerings in addition to their drilling fluids. At times, these larger companies attempt to compete by offering discounts to customers to use multiple products and services from our competitor, some of which we do not offer. We also have smaller regional competitors competing with us mainly on price and local relationships. Our competition in the Mats and Integrated Services business is fragmented, with many competitors providing various forms of mat products and services. More recently several competitors have begun marketing composite products to compete with our DURA-BASE mat system. While we believe the design and manufacture of our mat products provide a differentiated value to our customers, many of our competitors seek to compete on pricing.
Risks Related to Legal and Regulatory Matters, Including Environmental Regulations
We are responsible for complying with numerous federal, state and local laws, regulations and policies that govern environmental protection, zoning and other matters applicable to our current and past business activities, including the activities of our former subsidiaries. Failure to remain compliant with these laws and regulations may result in fines, penalties, costs of cleanup of contaminated sites and site closure obligations, or other expenditures. Further, any changes in the current legal and regulatory environment could impact industry activity and the demands for our products and services, the scope of products and services that we provide, or our cost structure required to provide our products and services, or the costs incurred by our customers.
The markets for our products and services are dependent on the continued exploration for and production of fossil fuels (predominantly oil and natural gas). Climate change is receiving increased attention worldwide. Many scientists, legislators and others attribute climate change to increased levels of greenhouse gases, including carbon dioxide, which has led to significant legislative and regulatory efforts to limit greenhouse gas emissions. The Environmental Protection Agency (the “EPA”) has adopted regulations that potentially limit greenhouse gas emissions and impose reporting obligations on large greenhouse gas emission sources. In addition, the EPA has adopted rules that could require the reduction of certain air emissions during exploration and production of oil and gas. To the extent that laws and regulations enacted as part of climate change legislation increase the costs of drilling for or producing such fossil fuels, or reduce the demand for fossil fuels, such legislation could have a material adverse impact on our operations and profitability.
Hydraulic fracturing is an increasingly common practice used by E&P operators to stimulate production of hydrocarbons, particularly from shale oil and gas formations in the United States. The process of hydraulic fracturing, which involves the injection of sand (or other forms of proppants) laden fluids into oil and gas bearing zones, has come under increasing scrutiny from a variety of regulatory agencies, including the EPA and various state authorities. Several states have adopted regulations requiring operators to identify the chemicals used in fracturing operations, others have adopted moratoriums on the use of fracturing, and the State of New York has banned the practice altogether. The EPA has commenced a study of the potential impact of hydraulic fracturing on drinking water including the disposal of waste fluid by underground injection. Further, the EPA has announced plans to develop effluent limitations associated with wastewater generated by hydraulic fracturing. Although we do not provide hydraulic fracturing services and our drilling fluids products are not used in such services, regulations which have the effect of limiting the use or availability of hydraulic fracturing could have a significant negative impact on the drilling activity levels of our customers, and, therefore, the demand for our products and services.
Risks Related to the Inherent Limitations of Insurance Coverage
While we maintain liability insurance, this insurance is subject to coverage limitations. Specific risks and limitations of our insurance coverage include the following:
■ self-insured retention limits on each claim, which are our responsibility
■ exclusions for certain types of liabilities and limitations on coverage for damages resulting from pollution
■ coverage limits of the policies, and the risk that claims will exceed policy limits
■ the financial strength and ability of our insurance carriers to meet their obligations under the policies
In addition, our ability to continue to obtain insurance coverage on commercially reasonable terms is dependent upon a variety of factors impacting the insurance industry in general, which are outside our control.
Any of the issues noted above, including insurance cost increases, uninsured or underinsured claims, or the inability of an insurance carrier to meet their financial obligations could have a material adverse effect on our profitability.
Risks Related to Potential Impairments of Long-lived Intangible Assets
As of December 31, 2014, our consolidated balance sheet includes $91.9 million in goodwill and $15.7 million of intangible assets, net. Goodwill and indefinite-lived intangible assets are tested for impairment annually, or more frequently as the circumstances require, using a combination of market multiple and discounted cash flow approaches. In completing this annual evaluation during the fourth quarter of 2014, we determined that no reporting unit had a fair value below its net carrying value, and therefore, no impairment was required. As a result of the significant declines in oil prices and decreases in U.S. drilling activities subsequent to our November 1, 2014 evaluation date, we updated our fair value estimates based on our current forecasts and market conditions and determined that each reporting unit’s fair value remains in excess of its net carrying value. However, if the financial performance or future projections for our operating segments deteriorate significantly from current levels, a future impairment of goodwill or indefinite-lived intangible assets may be required, which would negatively impact our financial results, in the period of impairment.
Risks Related to Technological Developments in our Industry
The market for our products and services is characterized by continual technological developments that generate substantial improvements in product functions and performance. If we are not successful in continuing to develop product enhancements or new products that are accepted in the marketplace or that comply with industry standards, we could lose market share to competitors, which would negatively impact our results of operations and financial condition.
We hold U.S. and foreign patents for certain of our drilling fluids components and our mat systems. However, these patents are not a guarantee that we will have a meaningful advantage over our competitors, and there is a risk that others may develop systems that are substantially equivalent to those covered by our patents. If that were to happen, we would face increased competition from both a service and a pricing standpoint. In addition, costly and time-consuming litigation could be necessary to enforce and determine the scope of our patents and proprietary rights. It is possible that future innovation could change the way companies drill for oil and gas which could reduce the competitive advantages we may derive from our patents and other proprietary technology.
Risks Related to Severe Weather, Particularly in the U.S. Gulf Coast
Approximately 19% of our consolidated revenue from continuing operations in 2014 was generated in market areas in the U.S. Gulf of Mexico and related near-shore areas, which are susceptible to hurricanes and other adverse weather events. These weather events can disrupt our operations and result in damage to our properties, as well as negatively impact the activity and financial condition of our customers. Our business may be adversely affected by these and other negative effects of future hurricanes or other adverse weather events in regions in which we operate.
Risks Related to Fluctuations in the Market Value of our Common Stock
The market price of our common stock may fluctuate due to a number of factors, including the general economy, stock market conditions, general trends in the E&P industry, announcements made by us or our competitors, and variations in our operating results. Investors may not be able to predict the timing or extent of these fluctuations.
|
ITEM 1B. |
Unresolved Staff Comments |
None.
|
ITEM 2. |
Properties |
We lease office space to support our operating segments as well as our corporate offices. All material domestic owned properties are subject to liens and security interests under our Second Amended and Restated Credit Agreement (“Credit Amendment”).
Fluids Systems. We own a facility containing approximately 102,685 square feet of office space on approximately 11 acres of land in Katy, Texas, which houses the divisional headquarters and technology center for this segment. Additionally, we own eight warehouse facilities and have 22 leased warehouses and 11 contract warehouses to support our customers and operations in the U.S. We own two warehouse facilities in Western Canada to support our Canadian operations. Additionally, we lease 20 warehouses and own one warehouse in the EMEA region, lease five warehouses in Brazil, and own one warehouse and lease ten warehouses in the Asia Pacific region to support our international operations. This leased space is located in several cities throughout Texas and Louisiana, Denver, Colorado, Calgary, Alberta, Rome, Italy and Rio de Janeiro, Brazil. We also own buildings providing office space in Oklahoma City, Oklahoma and office/warehouse space in Henderson, Australia. Some of these warehouses include blending facilities as well.
We operate four specialty product grinding facilities in the U.S. These facilities are located in Houston, Texas on approximately 18 acres of owned land, in New Iberia, Louisiana on 15.7 acres of leased land, in Corpus Christi, Texas on 6 acres of leased land, and in Dyersburg, Tennessee on 13.2 acres of owned land.
Mats and Integrated Services. We own a facility containing approximately 41,000 square feet of office and industrial space on approximately 34 acres of land in Carencro, Louisiana, which houses manufacturing facilities and divisional headquarters for this segment. We also lease five sites, throughout Texas, Louisiana, Colorado, and Pennsylvania which serve as bases for our well site service activities. Additionally, we own two facilities which are located in Louisiana and Texas to support field operations.
ITEM 3. Legal Proceedings
Davida v. Newpark Drilling Fluids LLC. On June 18, 2014, Jesse Davida, a former employee of Newpark Drilling Fluids LLC filed a purported class action lawsuit in the U.S. District Court for the Western District of Texas, San Antonio Division, alleging violations of the Fair Labor Standards Act (“FLSA”). The plaintiff seeks damages and penalties for the Company’s alleged failure to: properly classify its field service employees as “non-exempt” under the FLSA; and, pay them on an hourly basis (including overtime). The plaintiff seeks recovery on his own behalf, and seeks certification of a class of similarly situated employees. In the interim since the filing of the litigation, 18 additional former employees of the Company have joined the case. On January 6, 2015, the Court granted the plaintiff’s motion to “conditionally” certify the class of fluid service technicians that have worked for Newpark Drilling Fluids over the past three years (approximately 675 individuals), and on February 17, 2015, the Court approved the form of the notice to be sent to the class members. In order to participate in the litigation, these employees and former employees must “opt-in” to the case within sixty days of notification. Notwithstanding, the conditional certification of the class, we have a number of defenses we can assert against these claims; including a request to decertify the class and that these employee’s are properly classified as exempt employees. Until the number of plaintiffs joining the case has been determined and their individual work histories assessed, a determination of our potential liability exposure cannot be determined. We have retained counsel with experience in cases of this nature, and intend to vigorously defend this litigation.
Christiansen v. Newpark Drilling Fluids LLC. On November 11, 2014, Christiansen filed a purported class action lawsuit in the U.S. District Court for the Southern District of Texas, Houston Division, alleging violations of the Fair Labor Standards Act (“FLSA”). The plaintiff seeks damages and penalties for the Company’s alleged failure to: properly classify him as an employee rather than an independent contractor; properly classify its field service employees as “non-exempt” under the FLSA; and, pay them on an hourly basis (including overtime) and seeks damages and penalties for the Company’s alleged failure to pay him and the others in the proposed class on an hourly basis (including overtime). Since the filing of this lawsuit, five additional plaintiffs have joined the proceedings. The plaintiff seeks recovery on his own behalf, and seeks certification of a class of similarly situated individuals and on February 2, 2015, filed a motion to conditionally certify such a class. We have retained counsel with experience in cases of this nature, and intend to vigorously defend this litigation.
|
ITEM 4. |
Mine Safety Disclosures |
The information concerning mine safety violations and other regulatory matters required by section 1503 (a) of the Dodd-Frank Wall Street Reform and Consumer Protection Act and Item 104 of Regulation S-K is included in Exhibit 95.1 of this Annual Report on Form 10-K, which is incorporated by reference.
PART II
|
ITEM 5. |
Market for the Registrant’s Common Equity, Related Stockholder Matters and Issuer Purchases of Equity Securities |
Our common stock is traded on the New York Stock Exchange under the symbol “NR.”
The following table sets forth the range of the high and low sales prices for our common stock for the periods indicated:
|
Period |
High |
Low |
||||||
|
2014 |
||||||||
|
Fourth Quarter |
$ | 12.65 | $ | 8.23 | ||||
|
Third Quarter |
$ | 13.60 | $ | 11.50 | ||||
|
Second Quarter |
$ | 12.65 | $ | 10.90 | ||||
|
First Quarter |
$ | 12.56 | $ | 10.43 | ||||
|
2013 |
||||||||
|
Fourth Quarter |
$ | 13.64 | $ | 11.65 | ||||
|
Third Quarter |
$ | 12.88 | $ | 10.94 | ||||
|
Second Quarter |
$ | 11.78 | $ | 8.17 | ||||
|
First Quarter |
$ | 9.69 | $ | 7.70 | ||||
As of February 2, 2015, we had 1,470 stockholders of record as determined by our transfer agent.
In April 2013, our Board of Directors approved a share repurchase program that authorizes the Company to purchase up to $50.0 million of its outstanding shares of common stock. This authorization was subsequently increased to $100.0 million in February 2014. These purchases are funded with a combination of cash generated from operations, proceeds from the March 2014 sale of the Environmental Services business and borrowings under the Company’s revolving credit facility. The repurchase program has no specific term. The Company may repurchase shares in the open market or as otherwise determined by management, subject to market conditions, business opportunities and other factors. As part of the share repurchase program, the Company’s management has been authorized to establish trading plans under Rule 10b5-1 of the Securities Exchange Act of 1934.
During 2014, 4,317,278 shares were repurchased under the share repurchase program for an average price of approximately $11.72 per share, including commissions, leaving $42.7 million remaining under the program. During 2014, we also repurchased $2.5 million of shares surrendered in lieu of taxes under vesting of restricted stock awards. All of the shares repurchased are held as treasury stock.
We have not paid any dividends during the two recent fiscal years or any subsequent interim period, and we do not intend to pay any cash dividends in the foreseeable future. In addition, our credit facilities contain covenants which prohibit the payment of dividends on our common stock.
The following table details our repurchases of shares of our common stock for the three months ended December 31, 2014:
| Period |
Total Number of Shares Purchased |
Average Price per Share |
Total Number of Shares Purchased as Part of Publicly Announced Plans or Programs |
Maximum Approximate Dollar Value of Shares that May Yet be Purchased Under Plans or Programs | ||||||
|
October 1 - 31, 2014 |
10,210 | $ | 10.64 | - | $ | 42.7 | ||||
|
November 1 - 30, 2014 |
- | $ | - | - | $ | 42.7 | ||||
|
December 1 - 31, 2014 |
13,470 | 9.56 | - | $ | 42.7 | |||||
|
Total |
23,680 | $ | 10.03 | - |
|
(1) |
During the three months ended December 31, 2014, we purchased an aggregate of 23,680 shares surrendered in lieu of taxes under vesting of restricted stock awards. |
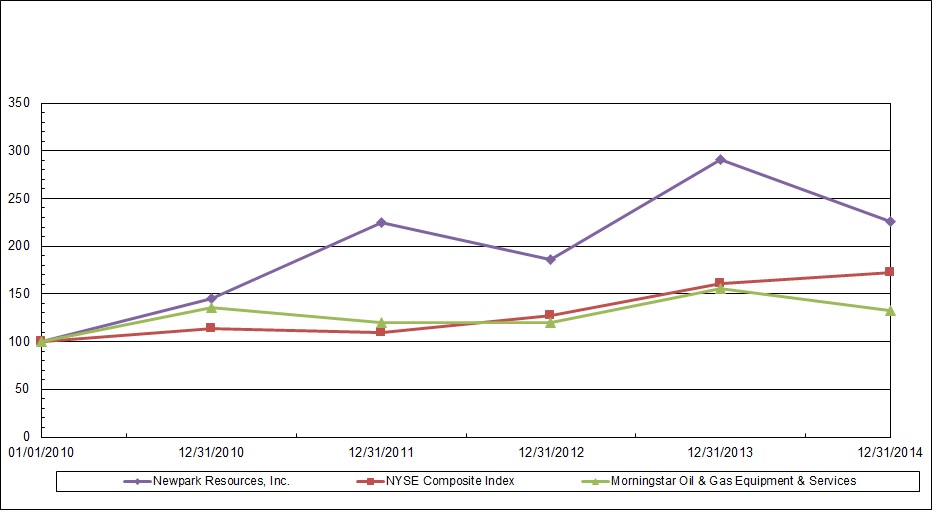
Performance Graph
The following graph reflects a comparison of the cumulative total stockholder return of our common stock from January 1, 2010 through December 31, 2014, with the New York Stock Exchange Market Value Index, a broad equity market index, and the Morningstar Oil & Gas Equipment & Services Index, an industry group index. The graph assumes the investment of $100 on January 1, 2010 in our common stock and each index and the reinvestment of all dividends, if any. This information shall be deemed furnished not filed, in this Form 10-K, and shall not be deemed incorporated by reference into any filing under the Securities Exchange Act of 1933, or the Securities Act of 1934, except to the extent we specifically incorporate it by reference.
 |
ITEM 6. Selected Financial Data
The selected consolidated historical financial data presented below for the five years ended December 31, 2014 is derived from our consolidated financial statements and is not necessarily indicative of results to be expected in the future.
The following data should be read in conjunction with the consolidated financial statements and notes thereto and with “Management’s Discussion and Analysis of Financial Condition and Results of Operations” in Items 7 and 8 below. In March of 2014, we completed the sale of our Environmental Services business. All assets, liabilities and results of operations for this business have been reclassified to discontinued operations for all periods presented below.
|
As of and for the Year Ended December 31, |
|||||||||||||||||||||
|
(In thousands, except share data) |
2014 |
2013 |
2012 |
2011 |
2010 |
||||||||||||||||
|
Consolidated Statements of Operations: |
|||||||||||||||||||||
|
Revenues |
$ | 1,118,416 | $ | 1,042,356 | $ | 983,953 | $ | 909,368 | $ | 667,192 | |||||||||||
|
Operating income |
130,596 | 94,445 | 92,275 | 120,855 | 64,557 | ||||||||||||||||
|
Interest expense, net |
10,431 | 11,279 | 9,727 | 9,226 | 10,233 | ||||||||||||||||
|
Income from continuing operations |
$ | 79,009 | $ | 52,622 | $ | 50,453 | $ | 71,233 | $ | 32,296 | |||||||||||
|
Income from discontinued operations, net of tax |
1,152 | 12,701 | 9,579 | 8,784 | 9,330 | ||||||||||||||||
|
Gain from disposal of discontinued operations, net of tax |
22,117 | - | - | - | - | ||||||||||||||||
|
Net income |
$ | 102,278 | $ | 65,323 | $ | 60,032 | $ | 80,017 | $ | 41,626 | |||||||||||
|
Net income from continuing operations per common share (basic): |
|||||||||||||||||||||
|
Income from continuing operations |
$ | 0.95 | $ | 0.62 |
|
$ | 0.58 | $ | 0.79 | $ | 0.36 | ||||||||||
|
Net income per common share |
$ | 1.23 | $ | 0.77 |
|
$ | 0.69 | $ | 0.89 | $ | 0.47 | ||||||||||
|
Net income from continuing operations per common share (diluted): |
|||||||||||||||||||||
|
Income from continuing operations |
$ | 0.84 | $ | 0.56 | $ | 0.53 | $ | 0.71 | $ | 0.36 | |||||||||||
|
Net income per common share |
$ | 1.07 | $ | 0.69 | $ | 0.62 | $ | 0.80 | $ | 0.46 | |||||||||||
|
Consolidated Balance Sheet Data: |
|||||||||||||||||||||
|
Working capital |
$ | 450,604 | $ | 405,689 | $ | 444,460 | $ | 406,976 | $ | 329,371 | |||||||||||
|
Total assets |
1,020,122 | 968,417 | 994,541 | 886,837 | 737,342 | ||||||||||||||||
|
Foreign bank lines of credit |
11,395 | 12,809 | 2,546 | 2,174 | 1,458 | ||||||||||||||||
|
Current maturities of long-term debt |
253 | 58 | 53 | 58 | 148 | ||||||||||||||||
|
Long-term debt, less current portion |
172,498 | 172,786 | 256,832 | 189,876 | 172,987 | ||||||||||||||||
|
Stockholders' equity |
625,458 | 581,054 | 513,578 | 497,846 | 417,347 | ||||||||||||||||
|
Consolidated Cash Flow Data: |
|||||||||||||||||||||
|
Net cash provided by (used in) operations |
$ | 89,173 | $ | 151,903 | $ | 110,245 | $ | (13,558 | ) | $ | 31,476 | ||||||||||
|
Net cash used in investing activities |
(14,002 | ) | (60,063 | ) | (96,167 | ) | (63,150 | ) | (10,549 | ) | |||||||||||
|
Net cash (used in) provided by financing activities |
(49,158 | ) | (72,528 | ) | 5,853 | 18,338 | 50,621 | ||||||||||||||
|
ITEM 7. |
Management’s Discussion and Analysis of Financial Condition and Results of Operations |
The following discussion of our financial condition, results of operations, liquidity and capital resources should be read together with our Consolidated Financial Statements and Notes to Consolidated Financial Statements included in Item 8 of this Annual Report.
Overview
We are a diversified oil and gas industry supplier providing products and services primarily to the oil and gas exploration and production (“E&P”) industry. We operate our business through two reportable segments: Fluids Systems and Mats and Integrated Services.
In March 2014, we completed the sale of our Environmental Services business, which was historically reported as a third operating segment, for $100 million in cash. The proceeds were used for general corporate purposes, including investments in our core drilling fluids and mats segments, along with share purchases under our share repurchase program. See “Note 2- Discontinued Operations” in our Notes to Consolidated Financial Statements included in Item 8. Financial Statements and Supplementary Data for additional information.
Our Fluids Systems segment, which generated 86% of consolidated revenues in 2014, provides customized drilling fluids solutions to E&P customers globally, operating through four geographic regions: North America, Europe, the Middle East and Africa (“EMEA”), Latin America, and Asia Pacific.
In December 2012, we completed the acquisition of substantially all assets and operations of Alliance Drilling Fluids, LLC (“Alliance”), a provider of drilling fluids, proppant distribution, and related services headquartered in Midland, Texas. Total cash consideration at closing was $53.1 million, which was funded through borrowings on our revolving credit facility. In the fourth quarter of 2013, we sold substantially all assets of the completion services and equipment rental business, generating total proceeds of $13.3 million and a gain on disposal of $2.7 million. For the full year 2013, this business generated $16.7 million of revenues and a $0.9 million operating income, including the gain on disposal.
International expansion is a key element of our corporate strategy. In 2014, we began work on several international contract awards within the EMEA region. We were awarded a contract to provide drilling fluids and related services for a series of wells to be drilled in the deepwater Black Sea. In addition, we were awarded two contracts to provide drilling fluids and related services for land operations, including a five year contract with the Kuwait Oil Company (“Kuwait”) and a four year contract with Cairn Energy in India. Total revenue generated under these contracts was approximately $23 million during 2014. In addition, we received two contract awards that are expected to begin in 2015. We were awarded a contract by ENI S.p.A. to provide drilling fluids and related services for a series of wells in offshore Libya with the work expected to begin in the first half of 2015. We were also awarded Lot 1 and Lot 3 of a restricted tender by Sonatrach to provide drilling fluids and related services in Algeria. The award remains subject to final approval by Sonatrach and the execution of contract documents. The maximum value of the two lots of the Sonatrach tender is approximately $350 million, covering a term of three years. Work under this contract is expected to ramp-up beginning in the second half of 2015. On an annualized basis, the maximum value of the award represents an increase of approximately 165% over our 2014 revenue level with Sonatrach, although we do not expect to reach this rate in 2015.
We are continuing to focus on the development and commercialization of new drilling fluids technologies, including Evolution®, our family of high performance water-based drilling fluid systems, which we believe provide superior performance and environmental benefits to our customers, as compared to traditional fluid systems used in the industry. Total revenues from wells using Evolution systems were approximately $251 million in 2014, including $32 million from international markets, compared to total revenues of $120 million in 2013.
We recently announced two capital investment projects within the Fluids Systems segment. We are investing approximately $30 million to significantly expand existing capacity and upgrade the drilling fluids blending, storage and transfer capabilities in Fourchon, Louisiana, which serves the Gulf of Mexico deepwater market. This project is expected to be completed in early 2016. In addition, we are investing approximately $20 million in a new fluid blending facility and distribution center located in Conroe, Texas, which will support the increasing demand for our proprietary fluid technologies, including our Evolution systems. This project is expected to be completed by the end of 2015.
Our Mats and Integrated Services segment, which generated 14% of consolidated revenues in 2014, provides composite mat rentals, well site construction and related site services primarily to oil and gas customers. In addition, mat rentals activity is expanding into applications in other industries, including petrochemicals, utilities, and pipeline. We also manufacture and sell composite mats to E&P customers outside of the U.S., and to domestic customers outside of the oil and gas industry.
Over the past two years, revenues from mat sales have been constrained by our manufacturing capacity limitations, along with our efforts to meet growing demand for mat rentals. During 2014, we allocated the majority of our composite mat production toward the expansion of our rental fleet, leaving fewer mats available for sale to customers. In order to address the manufacturing capacity limitations, we initiated a project in late 2013 to expand our mat manufacturing facility, located in Carencro, Louisiana, which is expected to be substantially complete in March of 2015, with production ramping up throughout 2015. Upon completion, the project will nearly double our production capacity and support expansion into new markets, both domestically and internationally. The expanded facility will also include a research and development center that is expected to be completed in the second half of 2015, intended to drive continued new product development efforts. Capital expenditures related to this project totaled $28.8 million in 2014 and $4.9 million in 2013.
In December 2013, we completed the acquisition of Terrafirma Roadways (“Terrafirma”), a provider of temporary roadways and worksites based in the United Kingdom, for total cash consideration of $6.8 million, net of cash acquired. Prior to the acquisition, Terrafirma had been operating as a partner to the Company since 2008, developing a rental business with DURA-BASE composite mats, primarily focused in the utility industry in the U.K.
Our operating results depend, to a large extent, on oil and gas drilling activity levels in the markets we serve, as well as the nature of the drilling operations (including the depth and whether the wells are drilled vertically or horizontally), which governs the revenue potential of each well. The drilling activity in turn, depends on oil and gas commodity pricing, inventory levels and demand, and regulatory actions, such as those affecting operations in the Gulf of Mexico in recent years.
Rig count data is the most widely accepted indicator of drilling activity. Average North American rig count data for the last three years ended December 31 is as follows:
|
Year ended December 31, |
2014 vs 2013 |
2013 vs 2012 |
||||||||||||||||||||||||||
|
2014 |
2013 |
2012 |
Count |
% |
Count |
% |
||||||||||||||||||||||
|
U.S. Rig Count |
1,862 | 1,761 | 1,919 | 101 | 6 | % | (158 | ) | (8% | ) | ||||||||||||||||||
|
Canadian Rig Count |
379 | 353 | 364 | 26 | 7 | % | (11 | ) | (3% | ) | ||||||||||||||||||
|
Total |
2,241 | 2,114 | 2,283 | 127 | 6 | % | (169 | ) | (7% | ) | ||||||||||||||||||
________________
Source: Baker Hughes Incorporated
The average North America rig count was 2,241 in 2014, compared to 2,114 in 2013, and 2,283 in 2012. During the fourth quarter of 2014 and early 2015, the price for oil declined dramatically from the price levels in recent years. Following this decline, North American drilling activity has decreased to 1,670 rigs as of February 20, 2015, and activity levels are expected to remain below prior year levels for the foreseeable future. The lower activity levels will reduce the demand for our services and negatively impact customer pricing in our North American operations in 2015. As a result of the lower customer demand, along with costs associated with anticipated workforce reductions, we expect profitability in our North America operations to be lower in 2015. Further, due to the fact that our business contains high levels of fixed costs, including significant facility and personnel expenses, we expect North American operating margins in both operating segments to be negatively impacted by the lower customer demand.
Drilling activity is generally more stable outside of North America, as drilling activity in many countries is based upon longer term economic projections and multiple year drilling programs, which tend to minimize the impact of short term changes of commodity prices on overall drilling activity. Further, we expect our EMEA region of Fluid Systems to benefit from new contract awards that are scheduled to begin in 2015.
Year Ended December 31, 2014 Compared to Year Ended December 31, 2013
Consolidated Results of Operations
Summarized results of operations for the year ended December 31, 2014 compared to the year ended December 31, 2013 are as follows:
|
Year Ended December 31, |
2014 vs 2013 |
|||||||||||||||
|
(In thousands) |
2014 |
2013 |
$ |
% |
||||||||||||
|
Revenues |
$ | 1,118,416 | $ | 1,042,356 | $ | 76,060 | 7 | % | ||||||||
|
Cost of revenues |
876,999 | 858,467 | 18,532 | 2 | % | |||||||||||
|
Selling, general and administrative expenses |
112,648 | 93,657 | 18,991 | 20 | % | |||||||||||
|
Other operating income, net |
(1,827 | ) | (4,213 | ) | 2,386 | (57 | %) | |||||||||
|
Operating income |
130,596 | 94,445 | 36,151 | 38 | % | |||||||||||
|
Foreign currency exchange loss |
108 | 1,819 | (1,711 | ) | (94 | %) | ||||||||||
|
Interest expense, net |
10,431 | 11,279 | (848 | ) | (8 | %) | ||||||||||
|
Income from continuing operations before income taxes |
120,057 | 81,347 | 38,710 | 48 | % | |||||||||||
|
Provision for income taxes |
41,048 | 28,725 | 12,323 | 43 | % | |||||||||||
|
Income from continuing operations |
79,009 | 52,622 | 26,387 | 50 | % | |||||||||||
|
Income from discontinued operations, net of tax |
1,152 | 12,701 | (11,549 | ) | (91 | %) | ||||||||||
|
Gain from disposal of discontinued operations, net of tax |
22,117 | - | 22,117 | - | ||||||||||||
|
Net income |
$ | 102,278 | $ | 65,323 | $ | 36,955 | 57 | % | ||||||||
Revenues
Revenues increased 7% to $1,118.4 million in 2014, compared to $1,042.4 million in 2013. This $76.1 million increase includes a $63.5 million (8%) increase in revenues in North America, including a $33.1 million increase in our Fluids Systems segment and a $30.4 million increase in our Mats and Integrated Services segment. Revenues from our international operations increased by $12.5 million (5%), primarily attributable to increases in the Fluids Systems EMEA region, partially offset by declines in the Asia Pacific and Latin America regions. International revenues in 2014 also include a $6.8 million increase resulting from the December 2013 acquisition of Terrafirma. Additional information regarding the change in revenues is provided within the operating segment results below.
Cost of Revenues
Cost of revenues increased 2% to $877.0 million in 2014, compared to $858.5 million in 2013. Despite a 7% increase in revenues, cost of revenues only increased 2% in 2014, benefitting from an improved sales mix, including continued growth in our higher margin family of Evolution drilling fluid systems and higher growth in the Mats and Integrated Services segment, which provides a stronger margin relative to the Fluids Systems segment. Additional information regarding the change in cost of revenues is provided within the operating segment results below.
Selling, General and Administrative Expenses
Selling, general and administrative expenses increased $19.0 million to $112.6 million in 2014 from $93.7 million in 2013. The increase is primarily attributable to increases in personnel and administrative costs associated with company growth, a $5.1 million increase in performance-based incentive compensation, a $3.1 million increase in stock-based compensation, and a $3.8 million increase in spending related to strategic planning projects, including the development of our deepwater market penetration strategy and other growth initiatives, offset partially by a $1.1 million decrease in spending related to acquisition and divesture activity.
Other Operating Income, net
Other operating income was $1.8 million in 2014 compared to $4.2 million in 2013. The 2014 fiscal year includes $1.2 million of gains recognized on the sale of two properties, while 2013 included the sale of the completion services and equipment rental business assets, which generated a gain of $2.7 million.
Foreign Currency Exchange
Foreign currency exchange was a $0.1 million loss in 2014, compared to a $1.8 million loss in 2013, and primarily reflects the impact of the fluctuating U.S. dollar on currency translations on assets and liabilities (including intercompany balances) held in our international operations that are denominated in currencies other than our functional currencies.
Interest expense, net
Interest expense, which primarily reflects the 4% interest associated with our $172.5 million in unsecured convertible notes (“Senior Notes”), totaled $10.4 million for 2014 compared to $11.3 million in 2013. The decrease in 2014 was primarily attributable to $0.8 million of interest capitalization associated with the mat manufacturing facility expansion project. The remaining decrease was attributable to lower average borrowings under our U.S. revolving credit facility, partially offset by higher average borrowings in our international subsidiaries.
Provision for income taxes
The provision for income taxes for 2014 was $41.0 million, reflecting an effective tax rate of 34.2%, compared to $28.7 million in 2013, reflecting an effective tax rate of 35.3%. The decrease in the effective tax rate is primarily related to increased tax credits and other benefits identified with the completion of U.S. and foreign tax filings, along with a reduced impact of nondeductible expenses partially offset by an increase in the provision for uncertain tax positions.
Discontinued operations
Income from our discontinued Environmental Services operations that was sold in March 2014 was $1.2 million in 2014 compared to $12.7 million in 2013. In addition, 2014 includes a $22.1 million gain from the March 2014 sale of the business as described above. See “Note 2- Discontinued Operations” in our Notes to Consolidated Financial Statements included in Item 8. Financial Statements and Supplementary Data for additional information.
Operating Segment Results
Summarized financial information for our reportable segments is shown in the following table (net of inter-segment transfers):
|
|
Year ended December 31, |
2014 vs 2013 |
||||||||||||||
|
(In thousands) |
2014 |
2013 |
$ |
% |
||||||||||||
|
Revenues |
||||||||||||||||
|
Fluids systems |
$ | 965,049 | $ | 926,392 | $ | 38,657 | 4 | % | ||||||||
|
Mats and integrated services |
153,367 | 115,964 | 37,403 | 32 | % | |||||||||||
|
Total revenues |
$ | 1,118,416 | $ | 1,042,356 | $ | 76,060 | 7 | % | ||||||||
|
Operating income (loss) |
||||||||||||||||
|
Fluids systems |
$ | 95,600 | $ | 72,604 | $ | 22,996 | ||||||||||
|
Mats and integrated services |
70,526 | 49,394 | 21,132 | |||||||||||||
|
Corporate office |
(35,530 | ) | (27,553 | ) | (7,977 | ) | ||||||||||
|
Operating income |
$ | 130,596 | $ | 94,445 | $ | 36,151 | ||||||||||
|
Segment operating margin |
||||||||||||||||
|
Fluids systems |
9.9 | % | 7.8 | % | ||||||||||||
|
Mats and integrated services |
46.0 | % | 42.6 | % | ||||||||||||
Fluids Systems
Revenues
Total revenues for this segment consisted of the following:
|
Year ended December 31, |
2014 vs 2013 |
|||||||||||||||
|
(In thousands) |
2014 |
2013 |
$ |
% |
||||||||||||
|
United States |
$ | 607,411 | $ | 606,261 | $ | 1,150 | - | |||||||||
|
Canada |
79,516 | 47,559 | 31,957 | 67 | % | |||||||||||
|
Total North America |
686,927 | 653,820 | 33,107 | 5 | % | |||||||||||
|
EMEA |
166,000 | 137,044 | 28,956 | 21 | % | |||||||||||
|
Latin America |
84,555 | 99,116 | (14,561 | ) | (15 | %) | ||||||||||
|
Asia Pacific |
27,567 | 36,412 | (8,845 | ) | (24 | %) | ||||||||||
|
Total |
$ | 965,049 | $ | 926,392 | $ | 38,657 | 4 | % | ||||||||
North American revenues increased 5% to $686.9 million in 2014, compared to $653.8 million in 2013. While the North American rig count improved by 6% over this period, the benefits of market share gains in Canada, strong demand for wholesale barite and increases in U.S. drilling activity were partially offset by market share losses in South Texas and reduced drilling activity of a key customer in the U.S. In addition, our U.S. completion services and equipment rental business, which was sold in December of 2013, contributed $16.7 million of revenue to 2013.
Internationally, revenues increased 2% to $278.1 million in 2014, as compared to $272.6 million in 2013 as increases in the EMEA region were partially offset by decreases in the Latin America and Asia Pacific regions. In 2014, international revenues were negatively impacted by approximately $11 million from the impact of currency exchange, primarily in Latin America and Asia Pacific. The increase in the EMEA region is primarily attributable to approximately $23 million in revenues from the new contracts described above, including in the Black Sea, India and Kuwait. The decline in the Asia Pacific region is primarily attributable to lower customer drilling activities under an offshore contract in Australia and lower land drilling revenues. The decrease in the Latin America region is primarily attributable to declines in Petrobras drilling activity and the impact of currency exchange.
Operating Income
Operating income increased $23.0 million in 2014, as compared to 2013, and included a $15.0 million increase from North American operations. While North American revenues increased 5% as described above, operating income in North America increased $15.0 million primarily attributable to improved sales mix, including approximately $109 million increase in revenues from our proprietary Evolution drilling fluid systems, which generate higher margins relative to our traditional product offering. North American operating income in 2014 also benefitted from the increased revenues in Canada and from the strong demand for wholesale barite.
Our international operating income increased by $8.0 million, primarily reflecting the benefit from the increased revenues in the EMEA region described above.
In recent years, the business environment in Brazil has become increasingly challenging, particularly as Petrobras, our primary customer in the region, has focused more efforts on well completions and less on drilling activities. Also, the lack of timely payment of Petrobras-related invoicing has caused periodic increases in invested working capital associated with participation in this market. More recently, a significant number of senior executives at Petrobras resigned their positions in connection with a widely-publicized corruption investigation. We expect these developments to further disrupt Petrobras’ operations in the near term. In response to these changes in the business environment, we have taken certain actions to reduce the cost structure of this operation and are continuing to evaluate further actions. While the Brazilian deepwater drilling market remains an important component of our long-term strategy, the profitability of our business in Brazil remains highly dependent on increasing levels of drilling activity by Petrobras and other E&P customers. In the absence of a longer-term increase in drilling activity, we may incur additional charges, including potential asset impairments, as we seek to reduce our cost structure in country, which may negatively impact our future operating results.
As described above, following the recent declines in oil prices, we expect drilling activity levels to remain below 2014 levels throughout 2015, reducing the demand for our services and negatively impacting customer pricing primarily in our North American operations. Further, while there are on-going actions being taken to reduce our workforce and cost structure, our business contains high levels of fixed costs, including significant facility and personnel expenses. Therefore, we expect profitability in our North American operations to be negatively impacted by the lower revenues, along with costs associated with workforce reductions. Also, during the second half of 2014 and early 2015, the U.S. Dollar strengthened against the functional currency of most of our foreign operations which will have a negative impact on our revenues and operating income in 2015 as compared to 2014. As a result of the above, segment revenue and operating income are expected to decline from the levels achieved in 2014.
Mats and Integrated Services
Revenues
Total revenues for this segment consisted of the following:
|
Year ended December 31, |
2014 vs 2013 |
|||||||||||||||
|
(In thousands) |
2014 |
2013 |
$ |
% |
||||||||||||
|
Mat rental and services |
$ | 125,861 | $ | 71,429 | $ | 54,432 | 76 | % | ||||||||
|
Mat sales |
27,506 | 44,535 | (17,029 | ) | (38 | %) | ||||||||||
|
Total |
$ | 153,367 | $ | 115,964 | $ | 37,403 | 32 | % | ||||||||
Mat rental and services revenues increased $54.4 million in 2014, compared to 2013, largely due to increasing demand for our composite mat products in the Northeast U.S. region, a large site preparation project in the Gulf Coast region and our ongoing expansion into the utility and pipeline markets. In addition, 2014 benefitted from a $6.8 million increase from the U.K. rental operation, following the December 2013 acquisition of Terrafirma described above. Mat sales decreased by $17.0 million in 2014, as we allocated the majority of our 2014 composite mat production toward the expansion of our rental fleet, leaving fewer mats available for sale to customers.
Operating Income
Segment operating income in 2014 increased by $21.1 million, as compared to 2013, attributable to the $37.4 million increase in revenues described above. The segment operating margin remains strong, driven by high utilization of mats in our rental fleet, and high utilization of our production facility, which continues to run at maximum production capacity levels.
As noted above, we expect the expansion of our mat manufacturing facility to be completed in March of 2015, significantly increasing our production capacity. While the expansion project is expected to relieve production capacity limitations that have negatively impacted our revenues from mat sales in 2014, the recent decline in oil prices is expected to result in lower drilling activity for our E&P customers, which in turn will reduce the demand for our services and negatively impact customer pricing in our North American operations in 2015. As a result of the lower customer demand and more competitive pricing environment, we expect profitability in our North American operations to be lower in 2015. Further, due to the fact that our business contains high levels of fixed costs, including significant facility and personnel expenses, we expect North American operating margins to be negatively impacted by the lower customer demand.
Corporate office
Corporate office expenses increased $8.0 million to $35.5 million in 2014, compared to $27.6 million in 2013. The increase is attributable to increases in personnel and administrative costs related to company growth, higher performance-based incentive compensation, higher stock-based compensation, and a $3.5 million increase in spending related to strategic planning projects, including the development of our deepwater market penetration strategy, international tax planning projects, and other growth initiatives, offset partially by a $1.1 million decrease in spending related to acquisition and divestiture activity. Corporate office expenses for 2014 also include $1.0 million in incremental costs associated with our corporate office relocation and employee separation costs.
Year Ended December 31, 2013 Compared to Year Ended December 31, 2012
Consolidated Results of Operations
Summarized results of operations for the year ended December 31, 2013 compared to the year ended December 31, 2012 were as follows:
|
Year Ended December 31, |
2013 vs 2012 |
|||||||||||||||
|
(In thousands) |
2013 |
2012 |
$ |
% |
||||||||||||
|
Revenues |
$ | 1,042,356 | $ | 983,953 | $ | 58,403 | 6 | % | ||||||||
|
Cost of revenues |
858,467 | 811,048 | 47,419 | 6 | % | |||||||||||
|
Selling, general and administrative expenses |
93,657 | 81,500 | 12,157 | 15 | % | |||||||||||
|
Other operating income, net |
(4,213 | ) | (870 | ) | (3,343 | ) | 384 | % | ||||||||
|
Operating income |
94,445 | 92,275 | 2,170 | 2 | % | |||||||||||
|
Foreign currency exchange loss |
1,819 | 749 | 1,070 | 143 | % | |||||||||||
|
Interest expense, net |
11,279 | 9,727 | 1,552 | 16 | % | |||||||||||
|
Income from continuing operations before income taxes |
81,347 | 81,799 | (452 | ) | (1 | %) | ||||||||||
|
Provision for income taxes |
28,725 | 31,346 | (2,621 | ) | (8 | %) | ||||||||||
|
Income from continuing operations |
52,622 | 50,453 | 2,169 | 4 | % | |||||||||||
|
Income from discontinued operations, net of tax |
12,701 | 9,579 | 3,122 | 33 | % | |||||||||||
|
Net income |
$ | 65,323 | $ | 60,032 | $ | 5,291 | 9 | % | ||||||||
Revenues
Revenues increased 6% to $1,042.4 million in 2013, compared to $984.0 million in 2012. The $58.4 million increase includes a $32.7 million (5%) increase in revenues in North America, largely driven by the December 2012 acquisition of Alliance. Revenues from our international operations increased by $25.7 million (10%), including gains in EMEA and Brazil. Additional information regarding the change in revenues is provided within the operating segment results below.
Cost of Revenues
Cost of revenues increased 6% to $858.5 million in 2013, compared to $811.0 million in 2012. The increase was primarily driven by the increase in revenues. Additional information regarding the change in cost of revenues is provided within the operating segment results below.
Selling, General and Administrative Expenses
Selling, general and administrative expenses increased $12.2 million to $93.7 million in 2013 from $81.5 million in 2012. The increase was primarily attributable to increases in personnel and administrative costs related to company growth as well as costs associated with strategic planning projects, including acquisition and divestiture activity.
Other Operating Income, Net
Other operating income increased $3.3 million to $4.2 million in 2013, compared to $0.9 million in 2012. The increase was primarily due to the sale of the completion services and equipment rental business assets, which generated a $2.7 million gain in 2013.
Foreign Currency Exchange
Foreign currency exchange was a $1.8 million loss in 2013, compared to a $0.7 million loss in 2012, and primarily reflected the impact of the fluctuating U.S. dollar on currency translations on assets and liabilities (including intercompany balances) held in our international operations that are denominated in currencies other than our functional currencies.
Interest Expense, Net
Interest expense, which primarily reflects the 4% interest associated with our $172.5 million in Senior Notes, totaled $11.3 million in 2013 compared to $9.7 million in 2012. The $1.6 million increase was primarily due to the impact of increased borrowings in our Brazil subsidiary along with increased borrowings under our revolving credit facility following the December 2012 Alliance acquisition.
Provision for Income Taxes
The provision for income taxes in 2013 was $28.7 million, reflecting an effective tax rate of 35.3%, compared to $31.3 million in 2012, reflecting an effective tax rate of 38.3%. The 2012 provision included a charge associated with a tax assessment in a foreign subsidiary, resulting in a higher effective tax rate.
Discontinued Operations
Income from discontinued operations was $12.7 million in 2013 as compared to $9.6 million in 2012. See “Note 2- Discontinued Operations” in our Notes to Consolidated Financial Statements included in Item 8. Financial Statements and Supplementary Data for additional information.
Operating Segment Results
Summarized financial information for our reportable segments is shown in the following table (net of inter-segment transfers):
|
Year ended December 31, |
2013 vs 2012 |
|||||||||||||||
|
(In thousands) |
2013 |
2012 |
$ |
% |
||||||||||||
|
Revenues |
||||||||||||||||
|
Fluids systems |
$ | 926,392 | $ | 861,670 | $ | 64,722 | 8 | % | ||||||||
|
Mats and integrated services |
115,964 | 122,283 | (6,319 | ) | (5 | %) | ||||||||||
|
Total revenues |
$ | 1,042,356 | $ | 983,953 | $ | 58,403 | 6 | % | ||||||||
|
Operating income (loss) |
||||||||||||||||
|
Fluids systems |
$ | 72,604 | $ | 59,987 | $ | 12,617 | ||||||||||
|
Mats and integrated services |
49,394 | 54,251 | (4,857 | ) | ||||||||||||
|
Corporate office |
(27,553 | ) | (21,963 | ) | (5,590 | ) | ||||||||||
|
Operating income |
$ | 94,445 | $ | 92,275 | $ | 2,170 | ||||||||||
|
Segment operating margin |
||||||||||||||||
|
Fluids systems |
7.8 | % | 7.0 | % | ||||||||||||
|
Mats and integrated services |
42.6 | % | 44.4 | % | ||||||||||||
Fluids Systems
Revenues
Total revenues for this segment consisted of the following:
|
Year ended December 31, |
2013 vs 2012 |
|||||||||||||||
|
(In thousands) |
2013 |
2012 |
$ |
% |
||||||||||||
|
United States |
$ | 606,261 | $ | 566,575 | $ | 39,686 | 7 | % | ||||||||
|
Canada |
47,559 | 48,643 | (1,084 | ) | (2 | %) | ||||||||||
|
Total North America |
653,820 | 615,218 | 38,602 | 6 | % | |||||||||||
|
EMEA |
137,044 | 117,360 | 19,684 | 17 | % | |||||||||||
|
Latin America |
99,116 | 87,173 | 11,943 | 14 | % | |||||||||||
|
Asia Pacific |
36,412 | 41,919 | (5,507 | ) | (13 | %) | ||||||||||
|
Total |
$ | 926,392 | $ | 861,670 | $ | 64,722 | 8 | % | ||||||||
North American revenues increased 6% to $653.8 million in 2013, compared to $615.2 million in 2012. While the North American rig count declined 7% over this period, the increase was largely attributable to market share gains in West Texas, benefitting from our December 2012 acquisition of Alliance, along with improved drilling efficiency, which resulted in an increased number of customer wells drilled per rig.
Internationally, revenues were up 11% to $272.6 million in 2013, as compared to $246.5 million in 2012. This increase was primarily attributable to continued market expansion in our EMEA region, along with an increase in product sales to Petrobras in Brazil.
Operating Income
Operating income increased $12.6 million in 2013, as compared to 2012, primarily due to the $64.7 million increase in revenues, along with improvements in our North American operations. Profitability in 2012 was negatively impacted by several factors, including declines in our completion services and equipment rental business, along with the significant regional shift in U.S. customer drilling activity, moving from dry gas regions to oil and liquid-rich regions. During this period of regional transition, operating expenses were elevated due to operating cost inefficiencies as we re-deployed personnel and assets among regions and modified our regional business unit infrastructures to meet the changing activity levels. Following this period of transition, we executed a series of cost reduction and other profit improvement initiatives, which contributed to the operating income improvement in 2013. In addition, 2013 included a $2.7 million gain on the sale of assets from our completion services and equipment rental business. These improvements were partially offset by an $8.3 million increase in depreciation and amortization expense, following the acquisition of Alliance.
Our international operating income decreased $8.8 million in 2013 compared to 2012, predominately due to declines in Brazil, including $1.8 million of charges for restructuring and value-added tax assessments.
Mats and Integrated Services
Revenues
Total revenues for this segment consisted of the following:
|
Year ended December 31, |
2013 vs 2012 |
|||||||||||||||
|
(In thousands) |
2013 |
2012 |
$ |
% |
||||||||||||
|
Mat rental and services |
$ | 71,429 | $ | 59,779 | $ | 11,650 | 19 | % | ||||||||
|
Mat sales |
44,535 | 62,504 | (17,969 | ) | (29 | %) | ||||||||||
|
Total |
$ | 115,964 | $ | 122,283 | $ | (6,319 | ) | (5 | %) | |||||||
Mat rental and services revenues increased $11.7 million as compared to 2012, primarily due to increased demand for our composite mat products, particularly in the Northeast U.S. region. Revenues from mat sales declined $18.0 million from the prior year. During the first half of 2013, we allocated the majority of our composite mat production toward the expansion of our rental fleet, leaving fewer mats available for sale to customers.
Operating Income
Operating income decreased by $4.9 million on the $6.3 million decrease in revenues. The decrease in operating income was primarily attributable to the decrease in mat sales in 2013, partially offset by higher income from rental activities.
Corporate office
Corporate office expenses increased $5.6 million to $27.6 million in 2013, compared to $22.0 million in 2012. The increase was primarily attributable to increases in personnel and administrative costs related to company growth, along with a $1.3 million increase in legal and professional expenses, largely associated with acquisitions, divestitures, and strategic planning projects.
Liquidity and Capital Resources
Net cash provided by operating activities during 2014 totaled $89.2 million compared to $151.9 million during 2013. This $62.7 million decrease in operating cash flow is primarily attributable to the increase in working capital to support revenue growth and the increase in tax payments, including taxes associated with the March 2014 sale of the Environmental Services business. Net income adjusted for non-cash items provided $118.9 million of cash in 2014, while changes in operating assets used $29.7 million of cash. Uses of cash included increases in accounts receivable of $53.5 million, primarily attributable to the higher revenue levels, and increases in inventories of $14.1 million, largely associated with the timing of receipts of barite ore purchased from China. These uses of cash were partially offset by a combined $38.4 million increase in accounts payable and accrued liabilities.
Net cash used in investing activities during 2014 was $14.0 million, consisting of $107.0 in capital expenditures, largely offset by $89.8 million of proceeds from the sale of the Environmental Services business. Capital expenditures for 2014 included $64.1 million in the Mats and Integrated Services segment, including $30.2 million related to the deployment of produced mats into the rental fleet and $28.8 million related to the manufacturing plant expansion project at our Carencro, Louisiana facility.
Net cash used in financing activities during 2014 was $49.2 million, primarily reflecting $53.1 million used for repurchases of our outstanding common stock.
We anticipate that our future working capital requirements for our operations will fluctuate directionally with revenues. In the first half of 2015, we anticipate that our working capital requirements will decrease as a result of anticipated declines in revenues following the recent drop in the price of oil. We expect total 2015 capital expenditures to range between $70 million to $90 million, with the majority of the investments focused on key strategic projects, including the completion of the expansion project at our mats manufacturing facility and infrastructure investments in our Fluids Systems segment described above, including the facility upgrade and expansion in Fourchon, Louisiana, and the investment in a new fluid blending facility and distribution center located in Conroe, Texas. As of December 31, 2014, we had cash on-hand of $85.1 million of which $58.8 million resides within our foreign subsidiaries that we intend to leave permanently reinvested abroad. We expect our subsidiary cash on-hand, as well as cash generated by operations and anticipated decreases in working capital levels, along with availability under our existing credit agreement to be adequate to fund our anticipated capital needs during the next 12 months. Our capitalization was as follows as of December 31:
|
(In thousands) |
2014 |
2013 |
||||||
|
Senior Notes |
$ | 172,498 | $ | 172,500 | ||||
|
Revolving credit facility |
- | - | ||||||
|
Other |
11,648 | 13,153 | ||||||
|
Total |
184,146 | 185,653 | ||||||
|
Stockholder's equity |
625,458 | 581,054 | ||||||
|
Total capitalization |
$ | 809,604 | $ | 766,707 | ||||
|
Total debt to capitalization |
22.7 | % | 24.2 | % | ||||
Our financing arrangements include $172.5 million of Senior Notes and a $125.0 million revolving credit facility. The Senior Notes bear interest at a rate of 4.0% per year, payable semi-annually in arrears on April 1 and October 1 of each year. Holders may convert the Senior Notes at their option at any time prior to the close of business on the business day immediately preceding the October 1, 2017 maturity date. The conversion rate is initially 90.8893 shares of our common stock per $1,000 principal amount of Senior Notes (equivalent to an initial conversion price of $11.00 per share of common stock), subject to adjustment in certain circumstances. Upon conversion, the Senior Notes will be settled in shares of our common stock. We may not redeem the Senior Notes prior to their maturity date.
The Credit Agreement provides a $125 million revolving loan facility available for borrowings and letters of credit and expires in November 2016. Under the terms of the Credit Agreement, we can elect to borrow at an interest rate either based on LIBOR plus a margin based on our consolidated leverage ratio, ranging from 175 to 300 basis points, or at an interest rate based on the greatest of: (a) prime rate, (b) the federal funds rate in effect plus 50 basis points, or (c) the Eurodollar rate for a Eurodollar Loan with a one-month interest period plus 100 basis points, in each case plus a margin ranging from 75 to 200 basis points. The applicable margin on LIBOR borrowings on December 31, 2014 was 200 basis points. In addition, we are required to pay a commitment fee on the unused portion of the Credit Agreement of 37.5 basis points. The Credit Agreement contains customary financial and operating covenants, including a consolidated leverage ratio, a senior secured leverage ratio and an interest coverage ratio, and also prohibits the payment of dividends on our common stock. We were in compliance with these covenants as of December 31, 2014.
At December 31, 2014, we had no outstanding borrowings and $22.5 million of letters of credit issued and outstanding under the Credit Agreement, leaving $102.5 million of availability at December 31, 2014. Additionally, our foreign operations had $11.6 million outstanding under lines of credit and other borrowings, as well as $0.1 million outstanding in letters of credit.
The Credit Agreement is a senior secured obligation, secured by first liens on all of our U.S. tangible and intangible assets, including our accounts receivable and inventory. Additionally, a portion of the capital stock of our non-U.S. subsidiaries has also been pledged as collateral.
Our foreign subsidiaries, primarily those in Italy, Brazil and India, maintain local credit arrangements consisting primarily of lines of credit with several banks, which are renewed on an annual basis. We utilize local financing arrangements in our foreign operations in order to provide short-term local liquidity needs, as well as to reduce the net investment in foreign operations subject to foreign currency risk. Advances under these short-term credit arrangements are typically based on a percentage of the subsidiary’s accounts receivable or firm contracts with certain customers. The weighted average interest rate under these arrangements was 15.1% and 14.1% on total outstanding balances of $11.4 million and $13.2 million at December 31, 2014 and 2013, respectively.
Off-Balance Sheet Arrangements
In conjunction with our insurance programs, we had established letters of credit in favor of certain insurance companies in the amount of $3.5 million and $4.0 million at December 31, 2014 and 2013, respectively. We also had $0.4 million and $9.9 million in guarantee obligations in connection with facility closure bonds and other performance bonds issued by insurance companies outstanding as of December 31, 2014 and 2013. The December 31, 2013 balance included $9.3 million in obligations related to our Environmental Services business that was sold in March 2014.
Other than normal operating leases for office and warehouse space, rolling stock and other pieces of operating equipment, we do not have any off-balance sheet financing arrangements or special purpose entities. As such, we are not materially exposed to any financing, liquidity, market or credit risk that could arise if we had engaged in such financing arrangements.
Contractual Obligations
A summary of our outstanding contractual and other obligations and commitments at December 31, 2014 is as follows:
|
(In thousands) |
2015 |
2016-2017 | 2018-2019 |
Thereafter |
Total |
|||||||||||||||
|
Current maturities of long term debt |
$ | 307 | $ | - | $ | - | $ | - | $ | 307 | ||||||||||
|
Long-term debt including capital leases |
- | 172,498 | - | - | 172,498 | |||||||||||||||
|
Interest on 4.0% Senior Notes |
6,900 | 12,133 | - | - | 19,033 | |||||||||||||||
|
Foreign bank lines of credit |
11,341 | - | - | - | 11,341 | |||||||||||||||
|
Operating leases |
8,441 | 11,034 | 6,597 | 10,499 | 36,571 | |||||||||||||||
|
Trade accounts payable and accrued liabilities (1) |
159,859 | - | - | - | 159,859 | |||||||||||||||
|
Purchase commitments, not accrued |
28,465 | - | - | - | 28,465 | |||||||||||||||
|
Other long-term liabilities (2) |
- | - | - | 11,240 | 11,240 | |||||||||||||||
|
Performance bond obligations |
354 | - | - | - | 354 | |||||||||||||||
|
Letter of credit commitments |
22,296 | 160 | - | - | 22,456 | |||||||||||||||
|
Total contractual obligations |
$ | 237,963 | $ | 195,825 | $ | 6,597 | $ | 21,739 | $ | 462,124 | ||||||||||
|
|
(1) |
Excludes accrued interest on the Senior Notes |
|
|
(2) |
Table does not allocate by year expected tax payments and uncertain tax positions due to the inability to make reasonably reliable estimates of the timing of future cash settlements with the respective taxing authorities. For additional discussion on uncertain tax positions, see “Note 9 - Income Taxes” in our Notes to Consolidated Financial Statements included in Item 8. Financial Statements and Supplementary Data in this report. |
We anticipate that the obligations and commitments listed above that are due in less than one year will be paid from operating cash flows, available cash on-hand, and availability under our existing Credit Agreement. The specific timing of settlement for certain long-term obligations cannot be reasonably estimated.
Critical Accounting Policies
Critical Accounting Estimates
Our consolidated financial statements are prepared in accordance with accounting principles generally accepted within the United States (“U.S. GAAP”), which requires us to make assumptions, estimates and judgments that affect the amounts and disclosures reported. Significant estimates used in preparing our consolidated financial statements include the following: allowances for product returns, allowances for doubtful accounts, reserves for self-insured retentions under insurance programs, estimated performance and values associated with employee incentive programs, fair values used for goodwill impairment testing, undiscounted cash flows used for impairment testing of long-lived assets and valuation allowances for deferred tax assets. See “Note 1- Summary of Significant Accounting Policies” in our Notes to Consolidated Financial Statements included in Item 8. Financial Statements and Supplementary Data for a discussion of the accounting policies governing each of these matters. Our estimates are based on historical experience and on our future expectations that are believed to be reasonable. The combination of these factors forms the basis for making judgments about the carrying values of assets and liabilities that are not readily apparent from other sources. Actual results may differ from our current estimates and those differences may be material.
We believe the critical accounting policies described below affect our more significant judgments and estimates used in preparing our consolidated financial statements.
Allowance for Doubtful Accounts
Reserves for uncollectible accounts receivable are determined on a specific identification basis when we believe that the required payment of specific amounts owed to us is not probable. The majority of our revenues are from mid-sized and international oil companies as well as government-owned or government-controlled oil companies, and we have receivables in several foreign jurisdictions. Changes in the financial condition of our customers or political changes in foreign jurisdictions could cause our customers to be unable to repay these receivables, resulting in additional allowances. For 2014, 2013 and 2012, provisions for uncollectible accounts receivable were $1.2 million, $0.3 million and $1.6 million, respectively.
Allowance for Product Returns
We maintain reserves for estimated customer returns of unused products in our Fluids Systems segment. The reserves are established based upon historical customer return levels and estimated gross profit levels attributable to product sales. Future customer return levels may differ from the historical return rate.
Impairments of Long-lived Assets
Goodwill and other indefinite-lived intangible assets are tested for impairment annually as of November 1, or more frequently, if an indication of impairment exists. The impairment test includes a comparison of the carrying value of net assets of our reporting units, including goodwill, with their estimated fair values, which we determine using a combination of a market multiple and discounted cash flow approach. If the carrying value exceeds the estimated fair value, an impairment charge is recorded in the period in which such review is performed. We identify our reporting units based on our analysis of several factors, including our operating segment structure, evaluation of the economic characteristics of our geographic regions within each of our operating segments, and the extent to which our business units share assets and other resources.
In completing our November 1, 2014 evaluation, we determined that each reporting unit’s fair value was in excess of its net carrying value and therefore, no impairment was required. As a result of the significant declines in oil prices and decreases in U.S. drilling activities subsequent to our November 1, 2014 evaluation date, we updated our fair value estimates based on our current forecasts and market conditions and determined that even though the estimated fair values have decreased, each reporting unit’s fair value remains in excess of its net carrying value. Based on this updated fair value estimate, the fair value for our Drilling Fluids reporting unit remains approximately 15% above the reporting unit’s carrying value. For our mats and integrated services reporting unit, our updated fair value estimate remains substantially in excess of that reporting unit’s carrying value. There are significant inherent uncertainties and management judgment in estimating the fair value of each reporting unit. While we believe we have made reasonable estimates and assumptions to estimate the fair value of our reporting units, it is possible that a material change could occur. If actual results are not consistent with our current estimates and assumptions, or if changes in macroeconomic conditions outside the control of management change such that it results in a significant negative impact on our estimated fair values, the fair value of a reporting unit may decrease below its net carrying value, which could result in a material impairment of our goodwill.
We review property, plant and equipment, finite-lived intangible assets and certain other assets for impairment whenever events or changes in circumstances indicate that the carrying amount may not be recoverable. We assess recoverability based on expected undiscounted future net cash flows. In estimating expected cash flows, we use a probability-weighted approach. Should the review indicate that the carrying value is not fully recoverable, the amount of impairment loss is determined by comparing the carrying value to the estimated fair value. Estimating future net cash flows requires us to make judgments regarding long-term forecasts of future revenue and costs related to the assets subject to review. These forecasts are uncertain in that they require assumptions about demand for our products and services, future market conditions and technological developments. If changes in these assumptions occur, our expectations regarding future net cash flows may change such that a material impairment could result.
Insurance
We maintain reserves for estimated future payments associated with our self-insured employee healthcare programs, as well as the self-insured retention exposures under our general liability, auto liability and workers compensation insurance policies. Our reserves are determined based on historical experience under these programs, including estimated development of known claims and estimated incurred-but-not-reported claims. Required reserves could change significantly based upon changes in insurance coverage, loss experience or inflationary impacts. As of December 31, 2014 and 2013, total insurance reserves were $4.2 million and $3.7 million, respectively.
Income Taxes
We had total deferred tax assets of $39.4 million and $35.9 million at December 31, 2014 and 2013, respectively. A valuation allowance must be established to offset a deferred tax asset if, based on available evidence, it is more likely than not that some or all of the deferred tax asset will not be realized. We have considered future taxable income and tax planning strategies in assessing the need for our valuation allowance. At December 31, 2014, a total valuation allowance of $15.4 million was recorded, which includes a valuation allowance on $13.3 million of net operating loss carryforwards for state and foreign tax purposes, including Brazil. Changes in the expected future generation of qualifying taxable income within these jurisdictions or in the realizability of other tax assets may result in an adjustment to the valuation allowance, which would be charged or credited to income in the period this determination was made. Specifically, we have a $4.8 million valuation allowance recorded on the net operating loss carryforward in Brazil which could be reversed in the future, depending on our ability to generate taxable income.
We file income tax returns in the United States and several non-U.S. jurisdictions and are subject to examination in the various jurisdictions in which we file. We are no longer subject to income tax examinations for U.S. federal and substantially all state jurisdictions for years prior to 2010 and for substantially all foreign jurisdictions for years prior to 2007. We are under examination by various United States federal and state tax authorities and tax authorities in other countries. We fully cooperate with all audits, but defend existing positions vigorously. These audits are in various stages of completion and certain foreign jurisdictions have challenged the amount of taxes due for certain tax periods. We evaluate the potential exposure associated with various filing positions and record a liability for tax contingencies as circumstances warrant. Although we believe all tax positions are reasonable and properly reported in accordance with applicable tax laws and regulations in effect during the periods involved, the final determination of tax audits and any related litigation could be materially different than that which is reflected in historical income tax provisions and tax contingency accruals.
New Accounting Standards
In April 2014, the Financial Accounting Standards Board (“FASB”) issued updated guidance that changes the criteria for reporting discontinued operations including enhanced disclosure requirements. Under the new guidance, only disposals representing a strategic shift in operations should be presented as discontinued operations. Those strategic shifts should have a major effect on the organization´s operations and financial results. The new guidance is effective for us in the first quarter of 2015; however, we do not expect the adoption to have a material effect on our consolidated financial statements.
In May 2014, the FASB amended the existing accounting standards for revenue recognition. The amendments are based on the principle that revenue should be recognized to depict the transfer of promised goods or services to customers in an amount that reflects the consideration to which the entity expects to be entitled in exchange for those goods or services. The new guidance is effective for us in the first quarter of 2017. Early adoption is not permitted. The amendments may be applied retrospectively to each prior period presented or retrospectively with the cumulative effect recognized as of the date of initial application. We are currently evaluating the impact of these amendments and the transition alternatives on our consolidated financial statements.
|
ITEM 7A. |
Quantitative and Qualitative Disclosures about Market Risk |
We are exposed to market risk from changes in interest rates and changes in foreign currency rates. A discussion of our primary market risk exposure in financial instruments is presented below.
Interest Rate Risk
At December 31, 2014, we had total debt outstanding of $184.1 million, including $172.5 million of borrowings under our Senior Notes, bearing interest at a fixed rate of 4.0%. Variable rate debt totaled $11.6 million which relates to our foreign operations under lines of credit and other borrowings. At the December 31, 2014 balance, a 200 basis point increase in market interest rates during 2014 would cause our annual interest expense to increase approximately $0.2 million.
Foreign Currency
Our principal foreign operations are conducted in certain areas of EMEA, Latin America, Asia Pacific, and Canada. We have foreign currency exchange risks associated with these operations, which are conducted principally in the foreign currency of the jurisdictions in which we operate including European euros, Algerian dinar, Romanian new leu, Canadian dollars, Australian dollars, British pound and Brazilian reais. Historically, we have not used off-balance sheet financial hedging instruments to manage foreign currency risks when we enter into a transaction denominated in a currency other than our local currencies.
Unremitted foreign earnings permanently reinvested abroad upon which deferred income taxes have not been provided aggregated approximately $133.3 million and $112.6 million at December 31, 2014 and 2013, respectively. It is not practicable to determine the amount of federal income taxes, if any, that might become due if such earnings are repatriated. We have the ability and intent to leave these foreign earnings permanently reinvested abroad.
|
ITEM 8. |
Financial Statements and Supplementary Data |
REPORT OF INDEPENDENT REGISTERED PUBLIC ACCOUNTING FIRM
To the Board of Directors and Stockholders of
Newpark Resources, Inc.
The Woodlands, Texas
We have audited the accompanying consolidated balance sheets of Newpark Resources, Inc. and subsidiaries (the “Company”) as of December 31, 2014 and 2013, and the related consolidated statements of income, comprehensive income, stockholders’ equity, and cash flows for each of the three years in the period ended December 31, 2014. These financial statements are the responsibility of the Company’s management. Our responsibility is to express an opinion on the financial statements based on our audits.
We conducted our audits in accordance with the standards of the Public Company Accounting Oversight Board (United States). Those standards require that we plan and perform the audit to obtain reasonable assurance about whether the financial statements are free of material misstatement. An audit includes examining, on a test basis, evidence supporting the amounts and disclosures in the financial statements. An audit also includes assessing the accounting principles used and significant estimates made by management, as well as evaluating the overall financial statement presentation. We believe that our audits provide a reasonable basis for our opinion.
In our opinion, such consolidated financial statements present fairly, in all material respects, the financial position of Newpark Resources, Inc. and subsidiaries as of December 31, 2014 and 2013, and the results of their operations and their cash flows for each of the three years in the period ended December 31, 2014, in conformity with accounting principles generally accepted in the United States of America.
We have also audited, in accordance with the standards of the Public Company Accounting Oversight Board (United States), the Company’s internal control over financial reporting as of December 31, 2014, based on the criteria established in Internal Control—Integrated Framework (2013) issued by the Committee of Sponsoring Organizations of the Treadway Commission and our report dated February 27, 2015 expressed an unqualified opinion on the Company’s internal control over financial reporting.
/s/ DELOITTE & TOUCHE LLP
Houston, Texas
February 27, 2015
Newpark Resources, Inc.
Consolidated Balance Sheets
December 31,
|
(In thousands, except share data) |
2014 |
2013 |
||||||
|
ASSETS |
||||||||
|
Cash and cash equivalents |
$ | 85,052 | $ | 65,840 | ||||
|
Receivables, net |
318,600 | 268,529 | ||||||
|
Inventories |
196,556 | 189,680 | ||||||
|
Deferred tax assets |
11,013 | 11,272 | ||||||
|
Prepaid expenses and other current assets |
12,615 | 11,016 | ||||||
|
Assets of discontinued operations |
- | 13,103 | ||||||
|
Total current assets |
623,836 | 559,440 | ||||||
|
Property, plant and equipment, net |
283,361 | 217,010 | ||||||
|
Goodwill |
91,893 | 94,064 | ||||||
|
Other intangible assets, net |
15,666 | 25,900 | ||||||
|
Other assets |
5,366 | 6,086 | ||||||
|
Assets of discontinued operations |
- | 65,917 | ||||||
|
Total assets |
$ | 1,020,122 | $ | 968,417 | ||||
|
LIABILITIES AND STOCKHOLDERS’ EQUITY |
||||||||
|
Short-term debt |
$ | 11,648 | $ | 12,867 | ||||
|
Accounts payable |
108,242 | 88,586 | ||||||
|
Accrued liabilities |
53,342 | 46,341 | ||||||
|
Liabilities of discontinued operations |
- | 5,957 | ||||||
|
Total current liabilities |
173,232 | 153,751 | ||||||
|
Long-term debt, less current portion |
172,498 | 172,786 | ||||||
|
Deferred tax liabilities |
37,694 | 27,060 | ||||||
|
Other noncurrent liabilities |
11,240 | 11,026 | ||||||
|
Liabilities of discontinued operations |
- | 22,740 | ||||||
|
Total liabilities |
394,664 | 387,363 | ||||||
|
Commitments and contingencies (Note 15) |
||||||||
|
Common stock, $0.01 par value, 200,000,000 shares authorized and 99,204,318 and 98,030,839 shares issued, respectively |
992 | 980 | ||||||
|
Paid-in capital |
521,228 | 504,675 | ||||||
|
Accumulated other comprehensive loss |
(31,992 | ) | (9,484 | ) | ||||
|
Retained earnings |
262,616 | 160,338 | ||||||
|
Treasury stock, at cost; 15,210,233 and 10,832,845 shares, respectively |
(127,386 | ) | (75,455 | ) | ||||
|
Total stockholders’ equity |
625,458 | 581,054 | ||||||
|
Total liabilities and stockholders' equity |
$ | 1,020,122 | $ | 968,417 | ||||
See Accompanying Notes to Consolidated Financial Statements
Newpark Resources, Inc.
Consolidated Statements of Operations
Years Ended December 31,
|
(In thousands, except per share data) |
2014 |
2013 |
2012 |
|||||||||
|
Revenues |
$ | 1,118,416 | $ | 1,042,356 | $ | 983,953 | ||||||
|
Cost of revenues |
876,999 | 858,467 | 811,048 | |||||||||
|
Selling, general and administrative expenses |
112,648 | 93,657 | 81,500 | |||||||||
|
Other operating income, net |
(1,827 | ) | (4,213 | ) | (870 | ) | ||||||
|
Operating income |
130,596 | 94,445 | 92,275 | |||||||||
|
Foreign currency exchange loss |
108 | 1,819 | 749 | |||||||||
|
Interest expense, net |
10,431 | 11,279 | 9,727 | |||||||||
|
Income from continuing operations before income taxes |
120,057 | 81,347 | 81,799 | |||||||||
|
Provision for income taxes |
41,048 | 28,725 | 31,346 | |||||||||
|
Income from continuing operations |
79,009 | 52,622 | 50,453 | |||||||||
|
Income from discontinued operations, net of tax |
1,152 | 12,701 | 9,579 | |||||||||
|
Gain from disposal of discontinued operations, net of tax |
22,117 | - | - | |||||||||
|
Net income |
$ | 102,278 | $ | 65,323 | $ | 60,032 | ||||||
|
Income per common share -basic: |
||||||||||||
|
Income from continuing operations |
$ | 0.95 | $ | 0.62 | $ | 0.58 | ||||||
|
Income from discontinued operations |
0.28 | 0.15 | 0.11 | |||||||||
|
Net income |
$ | 1.23 | $ | 0.77 | $ | 0.69 | ||||||
|
Income per common share -diluted: |
||||||||||||
|
Income from continuing operations |
$ | 0.84 | $ | 0.56 | $ | 0.53 | ||||||
|
Income from discontinued operations |
0.23 | 0.13 | 0.09 | |||||||||
|
Net income |
$ | 1.07 | $ | 0.69 | $ | 0.62 | ||||||
See Accompanying Notes to Consolidated Financial Statements
Newpark Resources, Inc.
Consolidated Statements of Comprehensive Income
Years Ended December 31,
|
(In thousands) |
2014 |
2013 |
2012 |
|||||||||
|
Net income |
$ | 102,278 | $ | 65,323 | $ | 60,032 | ||||||
|
Foreign currency translation adjustments |
(22,508 | ) | (8,750 | ) | (1,523 | ) | ||||||
|
Comprehensive income |
$ | 79,770 | $ | 56,573 | $ | 58,509 | ||||||
See Accompanying Notes to Consolidated Financial Statements
Newpark Resources, Inc.
Consolidated Statements of Stockholders’ Equity
|
Accumulated |
||||||||||||||||||||||||
|
Other |
||||||||||||||||||||||||
|
Compre- |
||||||||||||||||||||||||
|
hensive |
||||||||||||||||||||||||
|
Common |
Paid-In |
Income |
Retained |
Treasury |
||||||||||||||||||||
|
(In thousands) |
Stock |
Capital |
(Loss) |
Earnings |
Stock |
Total |
||||||||||||||||||
|
Balance at January 1, 2012 |
$ | 945 | $ | 477,204 | $ | 789 | $ | 34,983 | $ | (16,075 | ) | $ | 497,846 | |||||||||||
|
Net income |
- | - | - | 60,032 | - | 60,032 | ||||||||||||||||||
|
Employee stock options, restricted stock and employee stock purchase plan |
12 | 1,088 | - | - | (402 | ) | 698 | |||||||||||||||||
|
Stock-based compensation expense |
- | 7,103 | - | - | - | 7,103 | ||||||||||||||||||
|
Income tax effect, net, of employee stock related activity |
- | (433 | ) | - | - | - | (433 | ) | ||||||||||||||||
|
Treasury shares purchased at cost |
- | - | - | - | (50,145 | ) | (50,145 | ) | ||||||||||||||||
|
Foreign currency translation |
- | - | (1,523 | ) | - | - | (1,523 | ) | ||||||||||||||||
|
Balance at December 31, 2012 |
957 | 484,962 | (734 | ) | 95,015 | (66,622 | ) | 513,578 | ||||||||||||||||
|
Net income |
- | - | - | 65,323 | - | 65,323 | ||||||||||||||||||
|
Employee stock options, restricted stock and employee stock purchase plan |
23 | 8,284 | - | - | (2,120 | ) | 6,187 | |||||||||||||||||
|
Stock-based compensation expense |
- | 9,699 | - | - | - | 9,699 | ||||||||||||||||||
|
Income tax effect, net, of employee stock related activity |
- | 1,730 | - | - | - | 1,730 | ||||||||||||||||||
|
Treasury shares purchased at cost |
- | - | - | - | (6,713 | ) | (6,713 | ) | ||||||||||||||||
|
Foreign currency translation |
- | - | (8,750 | ) | - | - | (8,750 | ) | ||||||||||||||||
|
Balance at December 31, 2013 |
980 | 504,675 | (9,484 | ) | 160,338 | (75,455 | ) | 581,054 | ||||||||||||||||
|
Net income |
- | - | - | 102,278 | - | 102,278 | ||||||||||||||||||
|
Employee stock options, restricted stock and employee stock purchase plan |
12 | 2,970 | - | - | (1,335 | ) | 1,647 | |||||||||||||||||
|
Stock-based compensation expense |
- | 12,411 | - | - | - | 12,411 | ||||||||||||||||||
|
Income tax effect, net, of employee stock related activity |
- | 1,172 | - | - | - | 1,172 | ||||||||||||||||||
|
Treasury shares purchased at cost |
- | - | - | - | (50,596 | ) | (50,596 | ) | ||||||||||||||||
|
Foreign currency translation |
- | - | (22,508 | ) | - | - | (22,508 | ) | ||||||||||||||||
|
Balance at December 31, 2014 |
$ | 992 | $ | 521,228 | $ | (31,992 | ) | $ | 262,616 | $ | (127,386 | ) | $ | 625,458 | ||||||||||
See Accompanying Notes to Consolidated Financial Statements
Newpark Resources, Inc.
Consolidated Statements of Cash Flows
Years Ended December 31,
|
(In thousands) |
2014 |
2013 |
2012 |
|||||||||
|
Cash flows from operating activities: |
||||||||||||
|
Net income |
$ | 102,278 | $ | 65,323 | $ | 60,032 | ||||||
|
Adjustments to reconcile net income to net cash provided by operations: |
||||||||||||
|
Impairment charges |
- | 176 | 443 | |||||||||
|
Depreciation and amortization |
42,030 | 44,198 | 32,821 | |||||||||
|
Stock-based compensation expense |
12,304 | 9,699 | 7,103 | |||||||||
|
Provision for deferred income taxes |
(2,328 | ) | (7,832 | ) | 1,358 | |||||||
|
Net provision for doubtful accounts |
1,252 | 416 | 1,709 | |||||||||
|
Gain on sale of a business |
(33,974 | ) | - | - | ||||||||
|
(Gain) loss on sale of assets |
(1,369 | ) | (3,178 | ) | 724 | |||||||
|
Excess tax benefit from stock-based compensation |
(1,278 | ) | (2,146 | ) | - | |||||||
|
Change in assets and liabilities: |
||||||||||||
|
(Increase) decrease in receivables |
(53,494 | ) | 32,172 | 23,565 | ||||||||
|
(Increase) decrease in inventories |
(14,136 | ) | 16,431 | (28,758 | ) | |||||||
|
(Increase) decrease in other assets |
(546 | ) | 4,574 | (641 | ) | |||||||
|
Increase (decrease) in accounts payable |
23,606 | (17,733 | ) | 13,702 | ||||||||
|
Increase (decrease) in accrued liabilities and other |
14,828 | 9,803 | (1,813 | ) | ||||||||
|
Net cash provided by operating activities |
89,173 | 151,903 | 110,245 | |||||||||
|
Cash flows from investing activities: |
||||||||||||
|
Capital expenditures |
(106,973 | ) | (67,929 | ) | (43,955 | ) | ||||||
|
Proceeds from sale of property, plant and equipment |
3,205 | 1,313 | 863 | |||||||||
|
Proceeds from sale of a business |
89,766 | 13,329 | - | |||||||||
|
Business acquisitions, net of cash acquired |
- | (6,776 | ) | (53,075 | ) | |||||||
|
Net cash used in investing activities |
(14,002 | ) | (60,063 | ) | (96,167 | ) | ||||||
|
Cash flows from financing activities: |
||||||||||||
|
Borrowings on lines of credit |
62,164 | 254,390 | 364,426 | |||||||||
|
Payments on lines of credit |
(62,445 | ) | (328,086 | ) | (296,944 | ) | ||||||
|
Principal payments on notes payable and long-term debt |
(55 | ) | (25 | ) | (40 | ) | ||||||
|
Proceeds from employee stock plans |
3,442 | 8,328 | 1,059 | |||||||||
|
Post-closing payments for business acquisitions |
(412 | ) | - | (11,892 | ) | |||||||
|
Purchases of treasury stock |
(53,130 | ) | (9,281 | ) | (50,756 | ) | ||||||
|
Excess tax benefit from stock-based compensation |
1,278 | 2,146 | - | |||||||||
|
Net cash (used in) provided by financing activities |
(49,158 | ) | (72,528 | ) | 5,853 | |||||||
|
Effect of exchange rate changes on cash |
(6,801 | ) | (318 | ) | 1,668 | |||||||
|
Net increase in cash and cash equivalents |
19,212 | 18,994 | 21,599 | |||||||||
|
Cash and cash equivalents at beginning of year |
65,840 | 46,846 | 25,247 | |||||||||
|
Cash and cash equivalents at end of year |
$ | 85,052 | $ | 65,840 | $ | 46,846 | ||||||
|
Cash paid for: |
||||||||||||
|
Income taxes (net of refunds) |
$ | 56,568 | $ | 31,101 | $ | 24,508 | ||||||
|
Interest |
$ | 9,865 | $ | 10,189 | $ | 8,355 | ||||||
See Accompanying Notes to Consolidated Financial Statements
Note 1 — Summary of Significant Accounting Policies
Organization and Principles of Consolidation. Newpark Resources, Inc. was organized in 1932 as a Nevada corporation. In 1991, we changed our state of incorporation to Delaware. We are a diversified oil and gas industry supplier providing products and services primarily to the oil and gas exploration and production (“E&P”) industry serving customers in North America, Europe, the Middle East and Africa (“EMEA”), Latin America and Asia Pacific regions. The consolidated financial statements include our company and our wholly-owned subsidiaries (“we”, “our” or “us”). All intercompany transactions are eliminated in consolidation.
Use of Estimates and Market Risks. The preparation of financial statements in conformity with accounting principles generally accepted in the United States (“US GAAP”) requires management to make estimates and assumptions that affect the reported amounts of assets and liabilities, the disclosure of contingent assets and liabilities at the date of the financial statements and the reported amounts of revenues and expenses during the reporting period. Actual results could differ from those estimates. Estimates used in preparing our consolidated financial statements include, but are not limited to the following: allowances for product returns, allowances for doubtful accounts, reserves for self-insured retentions under insurance programs, estimated performance and values associated with employee incentive programs, fair values used for goodwill impairment testing, undiscounted future cash flows used for impairment testing of long-lived assets, depreciation using the unit-of-production method and valuation allowances for deferred tax assets.
Our operating results depend primarily on oil and gas drilling activity levels in the markets we serve. Drilling activity, in turn, depends on oil and gas commodity pricing, inventory levels, product demand and regulatory restrictions. Oil and gas prices and activity are cyclical and volatile. This market volatility has a significant impact on our operating results.
Cash Equivalents. All highly liquid investments with a remaining maturity of three months or less at the date of acquisition are classified as cash equivalents.
Allowance for Doubtful Accounts. Reserves for uncollectible accounts receivable are determined on a specific identification basis when we believe that the required payment of specific amounts owed to us is not probable.
The majority of our revenues are from mid-sized and international oil companies as well as government-owned or government-controlled oil companies, and we have receivables in several foreign jurisdictions. Changes in the financial condition of our customers or political changes in foreign jurisdictions could cause our customers to be unable to repay these receivables, resulting in additional allowances.
Allowance for Product Returns. We maintain reserves for estimated customer returns of unused products in our Fluids Systems segment. The reserves are established based upon historical customer return levels and estimated gross profit levels attributable to product sales.
Inventories. Inventories are stated at the lower of cost (principally average cost) or market. Certain conversion costs associated with the acquisition, production, blending and storage of inventory in our Fluids Systems segment as well as in the manufacturing operations in the Mats and Integrated Services segment are capitalized as a component of the carrying value of the inventory and expensed as a component of cost of revenues as the products are sold. Reserves for inventory obsolescence are determined based on the fair value of the inventory using factors such as our historical usage of inventory on-hand, future expectations related to our customers’ needs, market conditions and the development of new products.
Property, Plant and Equipment. Property, plant and equipment are recorded at cost. Additions and improvements that extend the useful life of the assets are capitalized. Maintenance and repairs are charged to expense as incurred. The cost of property, plant and equipment sold or otherwise disposed of and the accumulated depreciation thereon are eliminated from the property and related accumulated depreciation accounts, and any gain or loss is credited or charged to income.
NEWPARK RESOURCES, INC.
NOTES TO CONSOLIDATED FINANCIAL STATEMENTS - (Continued)
For financial reporting purposes, except as described below, depreciation is provided on property, plant and equipment, including assets held under capital leases, by utilizing the straight-line method over the following estimated useful service lives or lease term:
| Years | |||||
|
Computer hardware and office equipment |
3-5 | ||||
|
Computer software |
3-10 | ||||
|
Autos & light trucks |
5-7 | ||||
|
Furniture, fixtures & trailers |
7-10 | ||||
|
Composite mats (rental fleet) |
7-12 | ||||
|
Machinery and heavy equipment |
5-15 | ||||
|
Owned buildings |
20-39 | ||||
| Leasehold improvements | Lease term, including reasonably assured renewal periods | ||||
We compute the provision for depreciation on our barite grinding mills using the unit-of-production method. In applying this method, we have considered certain factors which affect the expected production units (lives) of these assets. These factors include periods of non-use for normal maintenance and economic slowdowns.
Goodwill and Other Intangible Assets. Goodwill represents the excess of the purchase price of acquisitions over the fair value of the net identifiable assets acquired. Goodwill and other intangible assets with indefinite lives are not amortized. Intangible assets with finite useful lives are amortized either on a straight-line basis over the asset’s estimated useful life or on a basis that reflects the pattern in which the economic benefits of the asset are realized. Any period costs of maintaining intangible assets are expensed as incurred.
Impairment of Long-Lived Assets. Goodwill and other indefinite-lived intangible assets are tested for impairment annually as of November 1, or more frequently, if an indication of impairment exists. The impairment test includes a comparison of the carrying value of net assets of our reporting units, including goodwill, with their estimated fair values, which we determine using a combination of a market multiple and discounted cash flow approach. If the carrying value exceeds the estimated fair value, an impairment charge is recorded in the period in which such review is performed. We identify our reporting units based on our analysis of several factors, including our operating segment structure, evaluation of the economic characteristics of our geographic regions within each of our operating segments, and the extent to which our business units share assets and other resources.
We review property, plant and equipment, finite-lived intangible assets and certain other assets for impairment whenever events or changes in circumstances indicate that the carrying amount may not be recoverable. We assess recoverability based on expected undiscounted future net cash flows. In estimating expected cash flows, we use a probability-weighted approach. Should the review indicate that the carrying value is not fully recoverable, the amount of impairment loss is determined by comparing the carrying value to the estimated fair value.
Insurance. We maintain reserves for estimated future payments associated with our self-insured employee healthcare programs, as well as the self-insured retention exposures under our general liability, auto liability and workers compensation insurance policies. Our reserves are determined based on historical experience under these programs, including estimated development of known claims and estimated incurred-but-not-reported claims.
Treasury Stock. Treasury stock is carried at cost, which includes the entire cost of the acquired stock.
Revenue Recognition. The Fluids Systems segment recognizes sack and bulk material additive revenues upon shipment of materials and passage of title. Formulated liquid systems revenues are recognized when utilized or lost downhole while drilling. An allowance for product returns is maintained, reflecting estimated future customer product returns. Engineering and related services are provided to customers as an integral component of the fluid system delivery, at agreed upon hourly or daily rates, and revenues are recognized when the services are performed.
NEWPARK RESOURCES, INC.
NOTES TO CONSOLIDATED FINANCIAL STATEMENTS - (Continued)
For the Mats and Integrated Services segment, revenues from the sale of mats are recognized when title passes to the customer, which is upon shipment or delivery, depending upon the terms of the underlying sales contract. Revenues for services and rentals provided by this segment are generated from both fixed-price and unit-priced contracts, which are short-term in duration. The activities under these contracts include site preparation, pit design, construction, drilling waste management, and the installation and rental of mat systems for a period of time generally not to exceed 60 days. Revenues from services provided under these contracts are recognized as the specified services are completed. Revenues from any subsequent extensions to the rental agreements are recognized over the extension period.
Shipping and handling costs are reflected in cost of revenues, and all reimbursements by customers of shipping and handling costs are included in revenues.
Income Taxes. We provide for deferred taxes using an asset and liability approach by measuring deferred tax assets and liabilities due to temporary differences existing at year end using currently enacted tax rates and laws that will be in effect when the differences are expected to reverse. We reduce deferred tax assets by a valuation allowance when, based on our estimates, it is more likely than not that a portion of those assets will not be realized in a future period. The estimates utilized in recognition of deferred tax assets are subject to revision, either up or down, in future periods based on new facts or circumstances. We evaluate uncertain tax positions and record a liability as circumstances warrant.
Stock-Based Compensation. All share-based payments to employees, including grants of employee stock options, are recognized in the income statement based on their fair values. We use the Black-Scholes option-pricing model for measuring the fair value of stock options granted and recognize stock-based compensation based on the grant date fair value, net of an estimated forfeiture rate, for all share-based awards, on a straight-line basis over the vesting term. Performance-based restricted stock units are valued at the date of grant using the Monte Carlo valuation model.
Foreign Currency Translation. The functional currency for substantially all international subsidiaries is their respective local currency. Financial statements for these international subsidiaries are translated into U.S. dollars using the exchange rate at each balance sheet date for assets and liabilities and the average exchange rates in effect during the respective period for revenues and expenses. Exchange rate adjustments resulting from translation of foreign currency financial statements are reflected in accumulated other comprehensive loss in stockholders’ equity whereas exchange rate adjustments resulting from foreign currency denominated transactions are recorded in income. At December 31, 2014 and 2013, accumulated other comprehensive loss related to foreign subsidiaries reflected in stockholders’ equity amounted to $32.0 million and $9.5 million, respectively.
Derivative Financial Instruments. We monitor our exposure to various business risks including interest rates and foreign currency exchange rates and occasionally use derivative financial instruments to manage the impact of certain of these risks. At the inception of a new derivative, we designate the derivative as a cash flow or fair value hedge or we determine the derivative to be undesignated as a hedging instrument based on the underlying facts. We do not enter into derivative instruments for trading purposes.
Reclassifications. Certain prior year amounts have been reclassified to conform to the current year presentation.
New Accounting Standards. In April 2014, the Financial Accounting Standards Board (“FASB”) issued updated guidance that changes the criteria for reporting discontinued operations including enhanced disclosure requirements. Under the new guidance, only disposals representing a strategic shift in operations should be presented as discontinued operations. Those strategic shifts should have a major effect on the organization´s operations and financial results. The new guidance is effective for us in the first quarter of 2015; however, we do not expect the adoption to have a material effect on our consolidated financial statements.
NEWPARK RESOURCES, INC.
NOTES TO CONSOLIDATED FINANCIAL STATEMENTS - (Continued)
In May 2014, the FASB amended the existing accounting standards for revenue recognition. The amendments are based on the principle that revenue should be recognized to depict the transfer of promised goods or services to customers in an amount that reflects the consideration to which the entity expects to be entitled in exchange for those goods or services. The new guidance is effective for us in the first quarter of 2017. Early adoption is not permitted. The amendments may be applied retrospectively to each prior period presented or retrospectively with the cumulative effect recognized as of the date of initial application. We are currently evaluating the impact of these amendments and the transition alternatives on our consolidated financial statements.
Note 2 — Discontinued Operations
In 2013, we initiated a process to sell our Environmental Services business, and in March of 2014 completed the sale of the business for $100 million in cash, subject to adjustment based on actual working capital conveyed at closing. Cash proceeds from the sale were $89.8 million in 2014, net of transaction related expenses, including the adjustment related to final working capital conveyed at closing. The agreement significantly limits our post-closing environmental obligations, including those related to the waste transfer and disposal facilities. In addition, $8 million of the sales price was withheld in escrow associated with transaction representations, warranties and indemnities, with $4 million scheduled to be released at each of the nine month and 18 month anniversary of the closing. In December 2014, the buyer made certain claims for indemnification under the terms of the agreement, which defers the release of the escrow funds until such claims are resolved. We believe the buyer’s claims are without merit and intend to vigorously pursue resolution. As a result of the sale transaction, we recorded a gain on the disposal of the business of $34.0 million ($22.1 million after-tax). All assets, liabilities and results of operations for this business have been classified as discontinued operations for all periods presented.
Summarized results of operations from discontinued operations are as follows:
|
Year-ended December 31, |
||||||||||||
|
(In thousands) |
2014 |
2013 |
2012 |
|||||||||
|
Revenues |
$ | 11,744 | $ | 65,002 | $ | 54,066 | ||||||
|
Income from discontinued operations before income taxes |
1,770 | 17,773 | 13,609 | |||||||||
|
Income from discontinued operations, net of tax |
1,152 | 12,701 | 9,579 | |||||||||
|
Gain from disposal of discontinued operations before income taxes |
33,974 | - | - | |||||||||
|
Gain from disposal of discontinued operations, net of tax |
22,117 | - | - | |||||||||
NEWPARK RESOURCES, INC.
NOTES TO CONSOLIDATED FINANCIAL STATEMENTS - (Continued)
Assets and liabilities of discontinued operations consisted of the following at December 31, 2013:
|
(In thousands) |
2013 |
|||
|
Receivables, net |
$ | 11,915 | ||
|
Prepaid expenses and other current assets |
1,188 | |||
|
Property, plant and equipment, net |
62,333 | |||
|
Other assets |
3,584 | |||
|
Assets of discontinued operations |
$ | 79,020 | ||
|
Accounts payable |
$ | 4,415 | ||
|
Accrued liabilities |
1,542 | |||
|
Deferred tax liabilities |
12,449 | |||
|
Other noncurrent liabilities |
10,291 | |||
|
Liabilities of discontinued operations |
$ | 28,697 | ||
Note 3 — Inventories
Inventories consisted of the following items at December 31:
|
(In thousands) |
2014 | 2013 | ||||||
|
Raw materials: |
||||||||
|
Drilling fluids |
$ | 152,076 | $ | 153,901 | ||||
|
Mats |
1,531 | 790 | ||||||
|
Total raw materials |
153,607 | 154,691 | ||||||
|
Blended drilling fluids components |
40,971 | 34,075 | ||||||
|
Finished goods- mats |
1,978 | 914 | ||||||
|
Total |
$ | 196,556 | $ | 189,680 |
Raw materials consist primarily of barite, chemicals, and other additives that are consumed in the production of our drilling fluid systems. Our blended drilling fluids components consist of base drilling fluid systems that have been either mixed internally at our mixing plants or purchased from third party vendors. These base systems require raw materials to be added, as required to meet specified customer requirements.
NEWPARK RESOURCES, INC.
NOTES TO CONSOLIDATED FINANCIAL STATEMENTS - (Continued)
Note 4 — Property, Plant and Equipment
Our investment in property, plant and equipment consisted of the following at December 31:
|
(In thousands) |
2014 |
2013 |
||||||
|
Land |
$ | 11,736 | $ | 10,085 | ||||
|
Buildings and improvements |
98,492 | 86,660 | ||||||
|
Machinery and equipment |
188,987 | 179,685 | ||||||
|
Computer hardware and software |
27,431 | 25,360 | ||||||
|
Furnitures and fixtures |
5,466 | 4,829 | ||||||
|
Construction in progress |
40,628 | 12,667 | ||||||
| 372,740 | 319,286 | |||||||
|
Less accumulated depreciation |
(146,860 | ) | (137,702 | ) | ||||
| 225,880 | 181,584 | |||||||
|
Composite mats (rental fleet) |
90,321 | 60,332 | ||||||
|
Less accumulated depreciation-mats |
(32,840 | ) | (24,906 | ) | ||||
| 57,481 | 35,426 | |||||||
|
Property, plant and equipment, net |
$ | 283,361 | $ | 217,010 | ||||
Depreciation expense was $33.2 million, $29.4 million and $25.7 million in 2014, 2013 and 2012, respectively.
In 2014, we incurred $28.8 million of capital expenditures to expand our mat manufacturing facility, located in Carencro, Louisiana. This expansion project is expected to be completed and placed into service in March of 2015. In addition, we recently announced two capital investment projects within the Fluids Systems segment. We are investing approximately $30 million to significantly expand existing capacity and upgrade the drilling fluids blending, storage and transfer capabilities in Fourchon, Louisiana, which serves the Gulf of Mexico deepwater market. This project is expected to be completed in early 2016. In addition, we are investing approximately $20 million in a new fluid blending facility and distribution center located in Conroe, Texas, which will support the increasing demand for our proprietary fluid technologies, including our Evolution systems. This project is expected to be completed by the end of 2015.
NEWPARK RESOURCES, INC.
NOTES TO CONSOLIDATED FINANCIAL STATEMENTS - (Continued)
Note 5 — Goodwill and Other Intangible Assets
Changes in the carrying amount of goodwill by reportable segment are as follows:
|
(In thousands) |
Fluids Systems |
Mats and Integrated Services |
Total |
|||||||||
|
Balance at December 31, 2012 |
$ | 72,459 | $ | 14,929 | $ | 87,388 | ||||||
|
Acquisition |
- | 4,544 | 4,544 | |||||||||
|
Purchase price adjustments |
2,692 | - | 2,692 | |||||||||
|
Effects of foreign currency |
(560 | ) | - | (560 | ) | |||||||
|
Balance at December 31, 2013 |
74,591 | 19,473 | 94,064 | |||||||||
|
Effects of foreign currency |
(1,907 | ) | (264 | ) | (2,171 | ) | ||||||
|
Balance at December 31, 2014 |
$ | 72,684 | $ | 19,209 | $ | 91,893 | ||||||
We have evaluated the carrying values of our goodwill and other indefinite-lived intangible assets as of November 1, 2014. We determine any impairment of goodwill by comparing the carrying amounts of our reporting units with fair values, which we estimate using a combination of a market multiple and discounted cash flow approach. In completing this evaluation, we determined that no reporting unit has a fair value below its net carrying value and therefore, no impairment was required. As a result of the significant declines in oil prices and decreases in U.S. drilling activities subsequent to our November 1, 2014 evaluation date, we updated our fair value estimates based on our current forecasts and market conditions and determined that each reporting unit’s fair value remains in excess of its net carrying value.
Other intangible assets consist of the following:
|
December 31, 2014 |
December 31, 2013 |
|||||||||||||||||||||||
|
(In thousands) |
Gross Carrying Amount |
Accumulated Amortization |
Intangible assets, net |
Gross Carrying Amount |
Accumulated Amortization |
Intangible assets, net |
||||||||||||||||||
|
Technology related |
$ | 5,087 | $ | (3,277 | ) | $ | 1,810 | $ | 5,318 | $ | (3,065 | ) | $ | 2,253 | ||||||||||
|
Customer related |
35,910 | (24,403 | ) | 11,507 | 38,684 | (17,892 | ) | 20,792 | ||||||||||||||||
|
Employment related |
1,625 | (650 | ) | 975 | 2,238 | (934 | ) | 1,304 | ||||||||||||||||
|
Total amortizing intangible assets |
42,622 | (28,330 | ) | 14,292 | 46,240 | (21,891 | ) | 24,349 | ||||||||||||||||
|
Permits and licenses |
549 | - | 549 | 622 | - | 622 | ||||||||||||||||||
|
Trademarks |
825 | - | 825 | 929 | - | 929 | ||||||||||||||||||
|
Total indefinite-lived intangible assets |
1,374 | - | 1,374 | 1,551 | - | 1,551 | ||||||||||||||||||
|
Total intangible assets |
$ | 43,996 | $ | (28,330 | ) | $ | 15,666 | $ | 47,791 | $ | (21,891 | ) | $ | 25,900 | ||||||||||
Total amortization expense in 2014, 2013 and 2012 related to other intangible assets was $8.0 million, $10.4 million and $3.3 million, respectively.
NEWPARK RESOURCES, INC.
NOTES TO CONSOLIDATED FINANCIAL STATEMENTS - (Continued)
Estimated future amortization expense for the years ended December 31 is as follows:
|
(In thousands) |
2015 |
2016 |
2017 |
2018 |
2019 |
Thereafter |
Total |
|||||||||||||||||||||
|
Technology related |
$ | 341 | $ | 341 | $ | 341 | $ | 341 | $ | 341 | $ | 105 | $ | 1,810 | ||||||||||||||
|
Customer related |
3,970 | 2,651 | 2,025 | 1,026 | 730 | 1,105 | 11,507 | |||||||||||||||||||||
|
Employment related |
325 | 325 | 325 | - | - | - | 975 | |||||||||||||||||||||
|
Total future amortization expense |
$ | 4,636 | $ | 3,317 | $ | 2,691 | $ | 1,367 | $ | 1,071 | $ | 1,210 | $ | 14,292 | ||||||||||||||
The weighted average amortization period for technology related, customer related and employment related intangible assets is 15 years, 9 years and 5 years, respectively.
Note 6 — Acquisitions
In December 2013, we completed the acquisition of Terrafirma Roadways (“Terrafirma”), a provider of temporary roadways and worksites based in the United Kingdom, for total cash consideration of $6.8 million, net of cash acquired. Additional consideration up to approximately $1.6 million may be payable based on the earnings of the business over the 18 month period following the acquisition. Prior to the acquisition, Terrafirma had been operating as a partner to the Company since 2008, developing a rental business with DURA-BASE® composite mats, primarily focused in the utility industry in the U.K.
The transaction has been recorded using the acquisition method of accounting and accordingly, assets acquired and liabilities assumed were recorded at their fair values as of the acquisition date. The excess of the total consideration, including projected additional consideration, was recorded as goodwill and includes the value of the assembled workforce. The following table summarizes the amounts recognized for assets acquired and liabilities assumed as of the December 2013 acquisition date, including final adjustments to the purchase price allocation:
|
(In thousands) |
||||
|
Receivables, net |
$ | 2,155 | ||
|
Property, plant and equipment, net |
2,160 | |||
|
Goodwill |
4,544 | |||
|
Other intangibles, net |
3,328 | |||
|
Total assets acquired |
$ | 12,187 | ||
|
Accounts payable |
$ | 3,350 | ||
|
Short-term debt |
284 | |||
|
Accrued liabilities |
285 | |||
|
Deferred tax liability |
1,092 | |||
|
Other noncurrent liabilities |
400 | |||
|
Total liabilities assumed |
$ | 5,411 | ||
|
Total cash conveyed at closing |
$ | 6,776 |
Pro forma results of operation for the acquired business have not been presented as the effect of this acquisition is not material to our consolidated financial statements.
NEWPARK RESOURCES, INC.
NOTES TO CONSOLIDATED FINANCIAL STATEMENTS - (Continued)
Note 7 — Financing arrangements
Financing arrangements consisted of the following at December 31, 2014 and 2013:
|
(In thousands) |
2014 |
2013 |
||||||
|
Senior Notes |
$ | 172,498 | $ | 172,500 | ||||
|
Revolving credit facility |
- | - | ||||||
|
Other |
11,648 | 13,153 | ||||||
|
Total debt |
$ | 184,146 | $ | 185,653 | ||||
|
Less: current portion |
(11,648 | ) | (12,867 | ) | ||||
|
Long-term portion |
$ | 172,498 | $ | 172,786 | ||||
Our financing arrangements include $172.5 million of unsecured convertible senior notes (“Senior Notes”) and a $125.0 million revolving credit facility (the “Credit Agreement”) which can be increased by $75.0 million for a maximum $200.0 million of capacity. The Senior Notes bear interest at a rate of 4.0% per year, payable semi-annually in arrears on April 1 and October 1 of each year. Holders may convert the Senior Notes at their option at any time prior to the close of business on the business day immediately preceding the October 1, 2017 maturity date. The conversion rate is initially 90.8893 shares of our common stock per $1,000 principal amount of Senior Notes (equivalent to an initial conversion price of $11.00 per share of common stock), subject to adjustment in certain circumstances. Upon conversion, the Senior Notes will be settled in shares of our common stock. In 2014, holders converted an insignificant amount of Senior Notes into shares of our common stock. We may not redeem the Senior Notes prior to their maturity date.
The Credit Agreement provides a $125.0 million revolving loan facility available for borrowings and letters of credit and expires in November 2016. Under the terms of the Credit Agreement, we can elect to borrow at an interest rate either based on LIBOR plus a margin based on our consolidated leverage ratio, ranging from 175 to 300 basis points, or at an interest rate based on the greatest of: (a) prime rate, (b) the federal funds rate in effect plus 50 basis points, or (c) the Eurodollar rate for a Eurodollar Loan with a one-month interest period plus 100 basis points, in each case plus a margin ranging from 75 to 200 basis points. The applicable margin on LIBOR borrowings on December 31, 2014 was 200 basis points. In addition, we are required to pay a commitment fee on the unused portion of the Credit Agreement of 37.5 basis points. The Credit Agreement contains customary financial and operating covenants, including a consolidated leverage ratio, a senior secured leverage ratio and an interest coverage ratio, and also prohibits the payment of dividends on our common stock. We were in compliance with these covenants as of December 31, 2014.
At December 31, 2014, we had no outstanding borrowings and $22.5 million of letters of credit issued and outstanding under the Credit Agreement, leaving $102.5 million of availability at December 31, 2014. Additionally, our foreign operations had $11.6 million outstanding under lines of credit and other borrowings, as well as $0.1 million outstanding in letters of credit.
The Credit Agreement is a senior secured obligation, secured by first liens on all of our U.S. tangible and intangible assets, including our accounts receivable and inventory. Additionally, a portion of the capital stock of our non-U.S. subsidiaries has also been pledged as collateral.
Our foreign subsidiaries, primarily those in Italy, Brazil and India maintain local credit arrangements consisting primarily of lines of credit with several banks, which are renewed on an annual basis. We utilize local financing arrangements in our foreign operations in order to provide short-term local liquidity needs, as well as to reduce the net investment in foreign operations subject to foreign currency risk. Advances under these short-term credit arrangements are typically based on a percentage of the subsidiary’s accounts receivable or firm contracts with certain customers. The weighted average interest rate under these arrangements was 15.1% and 14.1% on total outstanding balances of $11.4 million and $13.2 million at December 31, 2014 and 2013, respectively.
NEWPARK RESOURCES, INC.
NOTES TO CONSOLIDATED FINANCIAL STATEMENTS - (Continued)
We incurred net interest expense of $10.4 million, $11.3 million, and $9.7 million for the years ended December 31, 2014, 2013 and 2012, respectively. Capitalized interest was $0.8 million for the year-ended December 31, 2014. Scheduled repayments of all long-term debt as of December 31, 2014 are as follows (in thousands):
|
2016 |
$ | - | ||
|
2017 |
172,498 | |||
|
2018 |
- | |||
|
2019 |
- | |||
|
Thereafter |
- | |||
|
Total |
$ | 172,498 |
Note 8 — Fair Value of Financial Instruments and Concentrations of Credit Risk
Fair Value of Financial Instruments
Our financial instruments include cash and cash equivalents, receivables, payables and debt. We believe the carrying values of these instruments, with the exception of our Senior Notes, approximated their fair values at December 31, 2014 and December 31, 2013. The estimated fair value of our Senior Notes was $192.3 million at December 31, 2014 and $231.2 million at December 31, 2013, based on quoted market prices at these respective dates.
Concentrations of Credit Risk
Financial instruments that potentially subject us to significant concentrations of credit risk consist principally of cash, trade accounts and notes receivable. At December 31, 2014, substantially all of our cash deposits are held in accounts at numerous financial institutions across the various regions that we operate in. A majority of the cash is held in accounts that maintain deposit ratings of P-1 by Moody’s, A-1 by Standard and Poor’s, and F1 by Fitch. As part of our investment strategy, we perform periodic evaluations of the relative credit standing of these financial institutions.
Accounts Receivable
Accounts receivable at December 31, 2014 and 2013 include the following:
|
(In thousands) |
2014 | 2013 | ||||||
|
Gross trade receivables |
$ | 299,962 | $ | 252,168 | ||||
|
Allowance for doubtful accounts |
(5,458 | ) | (4,142 | ) | ||||
|
Net trade receivables |
294,504 | 248,026 | ||||||
|
Other receivables |
24,096 | 20,503 | ||||||
|
Total receivables, net |
$ | 318,600 | $ | 268,529 |
Other receivables include $14.5 million and $15.6 million for value added, goods and service taxes related to foreign jurisdictions and other tax related receivables as of December 31, 2014 and 2013, respectively. In addition, other receivables at December 31, 2014 include $8.0 million associated with the Environmental Services business proceeds held in escrow as described in Note 2 above.
NEWPARK RESOURCES, INC.
NOTES TO CONSOLIDATED FINANCIAL STATEMENTS - (Continued)
We derive a significant portion of our revenues from companies in the E&P industry, and our customer base is highly concentrated in major and independent oil and gas E&P companies operating in the markets that we serve. During the years ended December 31, 2014, 2013 and 2012, revenues from our 20 largest customers represented approximately 40%, 50% and 40%, respectively, of our consolidated revenues from continuing operations, although no single customer accounted for more than 10% of our consolidated revenues.
We maintain an allowance for losses based upon the expected collectability of accounts receivable. Changes in this allowance for 2014, 2013 and 2012 related to continuing operations, was as follows:
|
(In thousands) |
2014 | 2013 | 2012 | |||||||||
|
Balance at beginning of year |
$ | 4,142 | $ | 3,950 | $ | 3,149 | ||||||
|
Provision for uncollectible accounts |
1,246 | 309 | 1,614 | |||||||||
|
Write-offs, net of recoveries |
70 | (117 | ) | (813 | ) | |||||||
|
Balance at end of year |
$ | 5,458 | $ | 4,142 | $ | 3,950 |
The Consolidated Statements of Cash Flows included in this Item 8 of these Financial Statements and Supplementary Data also includes a provision for uncollectible accounts related to the Environmental Services business that is classified as discontinued operations in 2014, 2013 and 2012. However, these amounts were minimal for the periods presented.
Note 9 — Income Taxes
The provision for income taxes charged to continuing operations was as follows:
|
Year Ended December 31, |
||||||||||||
|
(In thousands) |
2014 |
2013 |
2012 |
|||||||||
|
Current tax expense (benefit): |
||||||||||||
|
U.S. Federal |
$ | 17,086 | $ | 24,275 | $ | 19,020 | ||||||
|
State |
2,170 | 1,595 | 1,602 | |||||||||
|
Foreign |
9,925 | 7,085 | 8,682 | |||||||||
|
Total current |
29,181 | 32,955 | 29,304 | |||||||||
|
Deferred tax expense (benefit): |
||||||||||||
|
U.S. Federal |
12,237 | (2,057 | ) | (1,082 | ) | |||||||
|
State |
(174 | ) | (598 | ) | (1,219 | ) | ||||||
|
Foreign |
(196 | ) | (1,575 | ) | 4,343 | |||||||
|
Total deferred |
11,867 | (4,230 | ) | 2,042 | ||||||||
|
Total provision |
$ | 41,048 | $ | 28,725 | $ | 31,346 | ||||||
NEWPARK RESOURCES, INC.
NOTES TO CONSOLIDATED FINANCIAL STATEMENTS - (Continued)
The total provision was allocated to the following components of income:
|
Year Ended December 31, |
||||||||||||
|
(In thousands) |
2014 |
2013 |
2012 |
|||||||||
|
Income from continuing operations |
$ | 41,048 | $ | 28,725 | $ | 31,346 | ||||||
|
Income from discontinued operations |
12,475 | 5,072 | 4,030 | |||||||||
|
Total provision |
$ | 53,523 | $ | 33,797 | $ | 35,376 | ||||||
Income from continuing operations before income taxes was as follows:
|
Year Ended December 31, |
||||||||||||
|
(In thousands) |
2014 |
2013 |
2012 |
|||||||||
|
U.S. |
$ | 88,964 | $ | 65,310 | $ | 54,603 | ||||||
|
Foreign |
31,093 | 16,037 | 27,196 | |||||||||
|
Income from continuing operations before income taxes |
$ | 120,057 | $ | 81,347 | $ | 81,799 | ||||||
The effective income tax rate is reconciled to the statutory federal income tax rate as follows:
|
Year Ended December 31, |
||||||||||||
|
2014 |
2013 |
2012 |
||||||||||
|
Income tax expense at federal statuatory rate |
35.0 | % | 35.0 | % | 35.0 | % | ||||||
|
Nondeductible expenses |
2.9 | % | 4.3 | % | 1.9 | % | ||||||
|
Manufacturing deduction |
(1.9 | %) | (2.5 | %) | (2.2 | %) | ||||||
|
Different rates on earnings of foreign operations |
(4.3 | %) | (4.6 | %) | (3.4 | %) | ||||||
|
Change in valuation allowance |
2.1 | % | 3.0 | % | (2.1 | %) | ||||||
|
Uncertain tax positions |
0.6 | % | (0.8 | %) | 1.9 | % | ||||||
|
Foreign tax withholdings |
0.4 | % | 0.2 | % | 5.2 | % | ||||||
|
State tax expense, net |
1.0 | % | 0.5 | % | 1.5 | % | ||||||
|
Other |
(1.6 | %) | 0.2 | % | 0.5 | % | ||||||
|
Total income tax expense |
34.2 | % | 35.3 | % | 38.3 | % | ||||||
The Company’s effective tax rate has been positively impacted by lower tax rates in certain foreign jurisdictions such as Romania and Algeria. The 2012 provision for income taxes included a $3.9 million charge associated with a tax assessment and related increase in tax rate for the period of 2006 through 2012 in a foreign subsidiary.
NEWPARK RESOURCES, INC.
NOTES TO CONSOLIDATED FINANCIAL STATEMENTS - (Continued)
Temporary differences and carryforwards which give rise to deferred tax assets and liabilities at December 31, 2014 and 2013 are as follows:
|
(In thousands) |
2014 |
2013 |
||||||
|
Deferred tax assets: |
||||||||
|
Net operating losses |
$ | 15,097 | $ | 16,064 | ||||
|
Accruals not currently deductible |
14,868 | 12,901 | ||||||
|
Unrealized foreign exchange |
3,145 | - | ||||||
|
Bad debts |
597 | 1,166 | ||||||
|
Foreign tax credits |
862 | 1,653 | ||||||
|
Capitalized inventory costs and other |
4,867 | 4,135 | ||||||
|
Total deferred tax assets |
39,436 | 35,919 | ||||||
|
Valuation allowance |
(15,353 | ) | (15,024 | ) | ||||
|
Total deferred tax assets, net of allowances |
24,083 | 20,895 | ||||||
|
Deferred tax liabilities: |
||||||||
|
Accelerated depreciation and amortization |
(40,308 | ) | (29,530 | ) | ||||
|
Tax on unremitted earnings |
(6,680 | ) | (6,169 | ) | ||||
|
Other |
(3,025 | ) | (1,607 | ) | ||||
|
Total deferred tax liabilities |
(50,013 | ) | (37,306 | ) | ||||
|
Total net deferred tax liabilities |
$ | (25,930 | ) | $ | (16,411 | ) | ||
|
Current portion of deferred tax assets |
$ | 11,013 | $ | 11,272 | ||||
|
Non current portion of deferred tax assets |
1,258 | 119 | ||||||
|
Current portion of deferred tax liabilities |
(507 | ) | (742 | ) | ||||
|
Non current portion of deferred tax liabilities |
(37,694 | ) | (27,060 | ) | ||||
|
Net deferred tax liabilities |
$ | (25,930 | ) | $ | (16,411 | ) | ||
For state income tax purposes, we have net operating loss carryforwards (“NOLs”) of approximately $186.4 million available to reduce future state taxable income. These NOLs expire in varying amounts beginning in year 2015 through 2030. Foreign NOLs of approximately $18.6 million are available to reduce future taxable income, some of which expire beginning in 2015.
The realization of our net deferred tax assets is dependent on our ability to generate taxable income in future periods. At December 31, 2014 and December 31, 2013, we have recorded a valuation allowance in the amount of $15.4 million and $15.0 million, respectively, related to state and foreign NOL carryforwards.
Unremitted foreign earnings permanently reinvested abroad upon which deferred income taxes have not been provided aggregated approximately $133.3 million and $112.6 million at December 31, 2014 and 2013, respectively. It is not practicable to determine the amount of federal income taxes, if any, that might become due if such earnings are repatriated. We have the ability and intent to leave these foreign earnings permanently reinvested abroad.
We file income tax returns in the United States and several non-U.S. jurisdictions and are subject to examination in the various jurisdictions in which we file. We are no longer subject to income tax examinations for U.S. federal and substantially all state jurisdictions for years prior to 2010 and for substantially all foreign jurisdictions for years prior to 2007. We are under examination by various United States federal and state tax authorities and tax authorities in other countries. We fully cooperate with all audits, but defend existing positions vigorously. These audits are in various stages of completion and certain foreign jurisdictions have challenged the amount of taxes due for certain tax periods. We evaluate the potential exposure associated with various filing positions and record a liability for tax contingencies as circumstances warrant. Although we believe all tax positions are reasonable and properly reported in accordance with applicable tax laws and regulations in effect during the periods involved, the final determination of tax audits and any related litigation could be materially different than that which is reflected in historical income tax provisions and tax contingency accruals.
NEWPARK RESOURCES, INC.
NOTES TO CONSOLIDATED FINANCIAL STATEMENTS - (Continued)
A reconciliation of the beginning and ending provision for uncertain tax positions is as follows:
|
(In thousands) |
2014 |
2013 |
2012 |
|||||||||
|
Balance at January 1 |
$ | 2,175 | $ | 2,753 | $ | 1,218 | ||||||
|
Additions (reductions) for tax positions of prior years |
1,604 | (650 | ) | 1,350 | ||||||||
|
Additions for tax positions of current year |
7 | 72 | 185 | |||||||||
|
Balance at December 31 |
$ | 3,786 | $ | 2,175 | $ | 2,753 | ||||||
Approximately $3.3 million of unrecognized tax benefits at December 31, 2014, if recognized, would favorably impact the effective tax rate, including $2.2 million for which the tax statutes are scheduled to expire during the next 12 months.
The Company recognizes accrued interest and penalties related to uncertain tax positions in operating expenses. During the year ended December 31, 2014 and 2012, the Company recognized approximately $0.2 million and $0.4 million, respectively in interest and penalties. In 2013, there was no interest and penalties recognized. The Company had approximately $0.4 million and $0.2 million for interest and penalties accrued at December 31, 2014 and 2013, respectively.
Note 10 — Capital Stock
Common stock
Changes in outstanding Common Stock for the years ended December 31, 2014, 2013 and 2012 were as follows:
|
(In thousands of shares) |
2014 |
2013 |
2012 |
|||||||||
|
Outstanding, beginning of year |
98,031 | 95,734 | 94,498 | |||||||||
|
Shares issued upon exercise of options |
540 | 1,386 | 286 | |||||||||
|
Shares issued for grants of time vested restricted stock (net of cancellations) |
633 | 911 | 950 | |||||||||
|
Outstanding, end of year |
99,204 | 98,031 | 95,734 | |||||||||
Preferred stock
We are authorized to issue up to 1,000,000 shares of Preferred Stock, $0.01 par value. There was no outstanding preferred stock at December 31, 2014, 2013 or 2012.
Treasury stock
During 2014, 2013 and 2012, we repurchased 215,760, 222,175 and 104,995 shares, respectively, for an aggregate price of $2.5 million, $2.6 million and $0.6 million, respectively, representing employee shares surrendered in lieu of taxes under vesting of restricted stock awards. All of the shares repurchased are held as treasury stock.
NEWPARK RESOURCES, INC.
NOTES TO CONSOLIDATED FINANCIAL STATEMENTS - (Continued)
During 2014, 155,650 shares of treasury stock were re-issued including 73,801 shares pursuant to our employee stock purchase plan and 81,849 shares issued to non-employee directors under the 2014 Non-Employee Directors’ Restricted Stock Plan. During 2013 and 2012, 67,622 and 34,724 shares of treasury stock were re-issued, respectively, pursuant to our employee stock purchase plan.
Share repurchase program
In February 2012, our Board of Directors approved a share repurchase program that authorized the repurchase of up to $50.0 million of the Company’s outstanding shares of common stock that was fully executed in 2012.
In April 2013, our Board of Directors approved a share repurchase program that authorizes the Company to purchase up to $50.0 million of its outstanding shares of common stock. This authorization was subsequently increased to $100.0 million in February 2014. These purchases are funded with a combination of cash generated from operations, proceeds from the March 2014 sale of the Environmental Services business and borrowings under the Company’s revolving credit facility. The repurchase program has no specific term. The Company may repurchase shares in the open market or as otherwise determined by management, subject to market conditions, business opportunities and other factors. As part of the share repurchase program, the Company’s management has been authorized to establish trading plans under Rule 10b5-1 of the Securities Exchange Act of 1934.
During the years ended December 31, 2014, 2013 and 2012, we repurchased shares of the Company’s common stock under these share repurchase programs totaling 4,317,278, 562,341 and 7,241,693 shares, respectively for an average price per share, including commissions, of $11.72, $11.94 and $6.92, respectively. As of December 31, 2014, we had $42.7 million remaining under the current authorization program.
NEWPARK RESOURCES, INC.
NOTES TO CONSOLIDATED FINANCIAL STATEMENTS - (Continued)
Note 11 — Earnings per Share
The following table presents the reconciliation of the numerator and denominator for calculating earnings per share from continuing operations:
|
Year Ended December 31, |
||||||||||||
|
(In thousands, except per share data) |
2014 |
2013 |
2012 |
|||||||||
|
Basic EPS: |
||||||||||||
|
Income from continuing operations |
$ | 79,009 | $ | 52,622 | $ | 50,453 | ||||||
|
Weighted average number of common shares outstanding |
82,999 | 85,095 | 87,522 | |||||||||
|
Basic income from continuing operations per common share |
$ | 0.95 | $ | 0.62 | $ | 0.58 | ||||||
|
Diluted EPS: |
||||||||||||
|
Income from continuing operations |
$ | 79,009 | $ | 52,622 | $ | 50,453 | ||||||
|
Assumed conversions of Senior Notes |
5,091 | 5,005 | 4,771 | |||||||||
|
Adjusted income from continuing operations |
$ | 84,100 | $ | 57,627 | $ | 55,224 | ||||||
|
Weighted average number of common shares outstanding-basic |
82,999 | 85,095 | 87,522 | |||||||||
|
Add: Dilutive effect of stock options and restricted stock awards |
1,733 | 1,767 | 876 | |||||||||
|
Dilutive effect of Senior Notes |
15,682 | 15,682 | 15,682 | |||||||||
|
Diluted weighted average number of common shares outstanding |
100,414 | 102,544 | 104,080 | |||||||||
|
Diluted income from continuing operations per common share |
$ | 0.84 | $ | 0.56 | $ | 0.53 | ||||||
|
Stock options and restricted stock excluded from calculation of diluted earnings per share because anti-dilutive for the period |
788 | 415 | 2,671 | |||||||||
Note 12 — Stock Based Compensation and Other Benefit Plans
The following describes stockholder approved plans utilized by the Company for the issuance of stock based awards.
2014 Non-Employee Directors’ Restricted Stock Plan
In May 2014, our stockholders approved the 2014 Non-Employee Directors’ Restricted Stock Plan (the “2014 Director Plan”) which authorizes grants of restricted stock to non-employee directors based on a pre-determined dollar amount on the date of each annual meeting of stockholders. The pre-determined dollar amount for determining the number of restricted shares granted is subject to change by the Board of Directors or its committee but is initially set at $150,000 for each non-employee director, except for the Chairman of the Board who will receive an annual grant of restricted shares equal to $170,000. Each restricted share granted to a non-employee director vests in full on the earlier of the day prior to the next annual meeting of stockholders following the grant date or the first anniversary of the grant. During 2014, non-employee directors received shares of restricted stock totaling 81,849 shares at a weighted average fair value on the date of grant of $11.24 per share.
NEWPARK RESOURCES, INC.
NOTES TO CONSOLIDATED FINANCIAL STATEMENTS - (Continued)
The maximum number of shares of common stock issuable under the 2014 Director Plan is 1,000,000 leaving 918,151 shares available for grant as of December 31, 2014. The 2014 Director Plan completely replaced the Amended and Restated Non-Employee Directors’ Restricted Stock Plan, which expired under its terms on March 9, 2014 with no further issuances being made under that plan after December 31, 2013.
2006 Equity Incentive Plan
In December 2006, our stockholders approved the 2006 Equity Incentive Plan ( “2006 Plan”), pursuant to which the Compensation Committee of our Board of Directors (“Compensation Committee”) may grant to key employees, including executive officers and other corporate and divisional officers, a variety of forms of equity-based compensation, including options to purchase shares of common stock, shares of restricted common stock, restricted stock units, stock appreciation rights, other stock-based awards, and performance-based awards. In 2013, the 2006 Plan was amended to increase the number of shares available for issuance to 12,250,000 shares. At December 31, 2014, 2,247,611 shares remained available for award under the 2006 Plan, as amended.
The Compensation Committee approves the granting of all stock based compensation to employees, utilizing shares available under the 2006 Plan. Activity under each of these programs is described below.
Stock Options & Cash-Settled Stock Appreciation Rights
Stock options granted by the Compensation Committee are generally granted with a three year vesting period and a term of ten years. During 2014, 554,641 options were granted with a three year vesting period and a ten year term. The exercise price of each stock option granted was equal to the fair market value on the date of grant.
The following table summarizes activity for our outstanding stock options for the year ended December 31, 2014:
|
Shares |
Weighted-Average Exercise Price |
Weighted-Average Remaining Contractual Life (Years) |
Aggregate Intrinsic Value |
|||||||||||||
|
Outstanding at beginning of period |
3,449,367 | $ | 6.94 | |||||||||||||
|
Granted |
554,641 | 11.20 | ||||||||||||||
|
Exercised |
(540,318 | ) | 6.37 | |||||||||||||
|
Expired or cancelled |
(121,675 | ) | 8.87 | |||||||||||||
|
Outstanding at end of period |
3,342,015 | $ | 7.67 | 6.49 | $ | 7,932,450 | ||||||||||
|
Vested or expected to vest at end of period |
3,293,925 | $ | 7.62 | 6.45 | $ | 7,920,816 | ||||||||||
|
Options exercisable at end of period |
2,135,599 | $ | 6.69 | 5.36 | $ | 6,361,350 | ||||||||||
NEWPARK RESOURCES, INC.
NOTES TO CONSOLIDATED FINANCIAL STATEMENTS - (Continued)
We estimated the fair value of options granted on the date of grant using the Black-Scholes option-pricing model, with the following weighted average assumptions:
|
Year Ended December 31, |
||||||||||||
|
2014 |
2013 |
2012 |
||||||||||
|
Risk-free interest rate |
1.53 | % | 1.02 | % | 0.68 | % | ||||||
|
Expected life of the option in years |
5.22 | 5.22 | 5.22 | |||||||||
|
Expected volatility |
48.6 | % | 53.7 | % | 60.3 | % | ||||||
|
Dividend yield |
- | - | - | |||||||||
The risk-free interest rate is based on the implied yield on a U.S. Treasury zero-coupon issue with a remaining term equal to the expected term of the option. The expected life of the option is based on observed historical patterns. The expected volatility is based on historical volatility of the price of our common stock. The dividend yield is based on the projected annual dividend payment per share divided by the stock price at the date of grant, which is zero because we have not paid dividends for several years and do not expect to pay dividends in the foreseeable future.
The following table summarizes information about the weighted-average exercise price and the weighted-average grant date fair value of stock options granted:
|
Year Ended December 31, |
||||||||||||
|
2014 |
2013 |
2012 |
||||||||||
|
Weighted-average exercise price of the stock on the date of grant |
$ | 11.20 | $ | 11.43 | $ | 5.57 | ||||||
|
Weighted-average grant date fair value on the date of grant |
$ | 4.97 | $ | 5.42 | $ | 2.89 | ||||||
All stock options granted for the years ended December 31, 2014, 2013 and 2012 reflected an exercise price equal to the market value of the stock on the date of grant.
The total intrinsic value of options exercised was $3.2 million, $6.1 million and $1.0 million for the years ended December 31, 2014, 2013 and 2012, while cash from option exercises totaled $3.4 million, $8.3 million and $1.1 million, respectively.
The following table summarizes activity for outstanding cash-settled stock appreciation rights for the year-ended December 31, 2014:
|
Rights |
||||
|
Outstanding at beginning of period |
134,833 | |||
|
Exercised |
(26,200 | ) | ||
|
Expired or cancelled |
(1,500 | ) | ||
|
Outstanding at end of period |
107,133 | |||
|
Exercisable at end of period |
107,133 | |||
During 2014, there were no additional grants of cash-settled stock appreciation rights. The remaining outstanding cash-settled stock appreciation rights, if exercised, will ultimately be settled in cash for the difference between market value of our outstanding shares at the date of exercise, and $7.89. As such, the projected cash settlement is adjusted each period based upon the ending fair market value of the underlying stock. At December 31, 2014, the fair market value of each cash-settled stock appreciation right was $2.62, resulting in a liability of $0.3 million.
NEWPARK RESOURCES, INC.
NOTES TO CONSOLIDATED FINANCIAL STATEMENTS - (Continued)
Total compensation cost recognized for stock options and cash-settled stock appreciation rights during the years ended December 31, 2014, 2013 and 2012 was $2.6 million, $3.3 million and $2.3 million, respectively. For the years ended December 31, 2014, 2013 and 2012, we recognized tax benefits resulting from the exercise of stock options totaling $1.0 million, $1.9 million and $0.3 million, respectively.
Performance-Based Restricted Stock Units & Cash-Settled Performance-Based Restricted Stock Units
The Compensation Committee may use various business criteria to set the performance objectives for awards of performance-based restricted stock units. During 2014 and 2013, performance-based awards were awarded to executive officers. The performance-based restricted stock units will be settled in shares of common stock and will be based on the relative ranking of the Company’s total shareholder return (“TSR”) as compared to the TSR of the Company’s designated peer group over a three year period. During 2014, a total of 110,497 performance-based restricted stock units at target were granted with the payout of shares for each executive ranging from 0%-150% of target. The performance period began June 1, 2014 and ends May 31, 2017, with the ending TSR price being equal to the average closing price of our shares over the 30-calendar days ending May 31, 2017. During 2013, a total of 149,532 performance-based restricted stock units were granted with the payout of shares for each executive ranging from 0%-150% of target. The performance period began May 3, 2013 and ends June 1, 2016, with the ending TSR price being equal to the average closing price of our shares over the 30-calendar days ending June 1, 2016. No performance-based awards were granted during 2012.
The following table summarizes activity for outstanding performance-based restricted stock units for the year-ended December 31, 2014:
|
Weighted-Average |
||||||||
|
Grant Date |
||||||||
|
Nonvested Shares (Performance-Based) |
Shares |
Fair Value |
||||||
|
Outstanding at beginning of period |
149,532 | $ | 13.11 | |||||
|
Granted |
110,497 | 12.55 | ||||||
|
Forfeited |
(61,581 | ) | 13.04 | |||||
|
Outstanding at the end of period |
198,448 | $ | 12.82 | |||||
|
Year Ended December 31, |
||||||||
|
2014 |
2013 |
|||||||
|
Estimated fair value at date of grant |
$ | 12.55 | $ | 13.11 | ||||
NEWPARK RESOURCES, INC.
NOTES TO CONSOLIDATED FINANCIAL STATEMENTS - (Continued)
We estimated the fair value of each restricted stock unit at the date of grant using the Monte Carlo valuation model, with the following weighted average assumptions:
|
Year Ended December 31, |
||||||
|
2014 |
2013 |
|||||
|
Risk-free interest rate |
0.81 | % | 0.52 | % | ||
|
Average closing price |
$ | 11.28 | (1) | $ | 11.33 | (2) |
|
Expected volatility |
44.5 | % | 53.6 | % | ||
|
Dividend yield |
- | - | ||||
(1) Average closing price of our shares over the 30-calendar days ending May 16, 2014.
(2) Average closing price of our shares over the 30-calendar days ending June 3, 2013.
During 2014 and 2013, $0.5 million and $0.4 million in compensation cost was recognized for performance-based restricted stock units, respectively, while no compensation cost was recognized during the year ended 2012.
Restricted Stock Awards and Units
Time-vested restricted stock awards and restricted stock units are periodically granted to key employees, including grants for employment inducements, as well as to members of our Board of Directors. Employee awards provide for vesting periods ranging from three to four years. Non-employee director grants vest in full on the earlier of the day prior to the next annual meeting of stockholders following the grant date or the first anniversary of the grant. Upon vesting of these grants, shares are issued to award recipients. The following tables summarize the activity for our outstanding time-vested restricted stock awards and restricted stock units for the year-ended December 31, 2014.
|
Weighted-Average |
||||||||
|
Grant Date |
||||||||
|
Nonvested Shares (Time-Vesting) |
Shares |
Fair Value |
||||||
|
Nonvested at January 1, 2014 |
1,772,854 | $ | 9.52 | |||||
|
Granted |
754,477 | 11.21 | ||||||
|
Vested |
(691,650 | ) | 8.71 | |||||
|
Forfeited |
(112,782 | ) | 9.79 | |||||
|
Nonvested at December 31, 2014 |
1,722,899 | $ | 10.58 | |||||
|
Weighted-Average |
||||||||
|
Grant Date |
||||||||
|
Nonvested Share Units (Time-Vesting) |
Shares |
Fair Value |
||||||
|
Nonvested at January 1, 2014 |
150,988 | $ | 7.84 | |||||
|
Granted |
89,737 | 11.20 | ||||||
|
Vested |
(73,135 | ) | 11.77 | |||||
|
Forfeited |
(8,712 | ) | 11.10 | |||||
|
Nonvested at December 31, 2014 |
158,878 | $ | 10.22 | |||||
Total compensation cost recognized for restricted stock awards and restricted stock units was $8.6 million, $6.7 million and $4.6 million for the years ended December 31, 2014, 2013 and 2012 respectively. Total unrecognized compensation cost at December 31, 2014 related to restricted stock awards and restricted stock units is approximately $13.3 million which is expected to be recognized over the next 2.1 years. During the years ended December 31, 2014, 2013 and 2012, the total fair value of shares vested was $9.0 million, $9.5 million and $2.5 million, respectively.
NEWPARK RESOURCES, INC.
NOTES TO CONSOLIDATED FINANCIAL STATEMENTS - (Continued)
For the years ended December 31, 2014, 2013 and 2012, we recognized tax benefits resulting from the vesting of restricted share awards totaling $2.8 million, $3.0 million and $0.9 million, respectively.
Defined Contribution Plan
Substantially all of our U.S. employees are covered by a defined contribution plan (“401(k) Plan”). Employees may voluntarily contribute up to 50% of compensation, as defined in the 401(k) Plan. Participants’ contributions, up to 3% of compensation, are matched 100% by us, and the participants’ contributions, from 3% to 6% of compensation, are matched 50% by us. Under the 401(k) Plan, our cash contributions were $3.6 million, $3.4 million and $3.3 million in 2014, 2013 and 2012, respectively.
Note 13 — Segment and Related Information
Our Company consists of two reportable segments, which offer different products and services to a relatively homogenous customer base. The reportable segments include: Fluids Systems and Mats and Integrated Services. In March of 2014, we completed the sale of our Environmental Services business, which was previously reported as a third operating segment and is now reflected as discontinued operations. All assets, liabilities and results of operations for this business have been classified as discontinued operations for all periods presented. Intersegment revenues are generally recorded at cost for items which are included in inventory of the purchasing segment, and at standard markups for items which are included in cost of revenues of the purchasing segment. All intersegment revenues and related profits have been eliminated.
Fluids Systems — Our Fluids Systems business offers customized solutions including highly technical drilling projects involving complex subsurface conditions, such as horizontal, directional, geologically deep or deep water drilling. These projects require increased monitoring and critical engineering support of the fluids system during the drilling process. We provide drilling fluids products and technical services to markets in North America, EMEA, Latin America, and the Asia Pacific regions.
We also have industrial mineral grinding operations for barite, a critical raw material in drilling fluids products, which serve to support our activity in the drilling fluids market. We grind barite and other industrial minerals at facilities in Houston and Corpus Christi, Texas, New Iberia, Louisiana and Dyersburg, Tennessee. We use the resulting products in our drilling fluids business, and also sell them to third party users, including other drilling fluids companies. We also sell a variety of other minerals, principally to third party industrial (non oil and gas) markets, from our main plant in Houston, Texas and from the plant in Dyersburg, Tennessee.
Mats and Integrated Services — We manufacture our DURA-BASE® Advanced Composite Mats for use in our rental operations as well as for third party sales. Our mats provide environmental protection and ensure all-weather access to sites with unstable soil conditions. We sell composite mats direct to customers in areas around the world where we do not maintain an infrastructure for our mat rental activities. In addition, we provide mat rentals to E&P customers in the Northeast U.S., onshore U.S. Gulf Coast, and Rocky Mountain Regions, and to non-E&P customers in the U.S., Canada and the United Kingdom. We also offer location construction and related well site services to E&P customers in the Gulf Coast Region.
Historically, our marketing efforts for the sale of composite mats remained focused in principal oil and gas industry markets outside the U.S., including the Asia Pacific, Latin America and EMEA regions, as well as markets outside the E&P sector in the U.S. and Europe. We believe these mats have worldwide applications outside our traditional oilfield market, primarily in infrastructure construction, maintenance and upgrades of pipelines and electric utility transmission lines, and as temporary roads for movement of oversized or unusually heavy loads. In late 2013, we announced plans to significantly expand our manufacturing facility, in order to support our efforts to expand our markets, globally. This project is expected to be substantially completed in March of 2015, and will nearly double our current manufacturing capacity.
NEWPARK RESOURCES, INC.
NOTES TO CONSOLIDATED FINANCIAL STATEMENTS - (Continued)
Summarized financial information concerning our reportable segments is shown in the following tables:
|
Year Ended December 31, |
||||||||||||
|
(In thousands) |
2014 |
2013 |
2012 |
|||||||||
|
Revenues |
||||||||||||
|
Fluids Systems |
$ | 965,049 | $ | 926,392 | $ | 861,670 | ||||||
|
Mats and Integrated Services |
153,367 | 115,964 | 122,283 | |||||||||
|
Total Revenues |
$ | 1,118,416 | $ | 1,042,356 | $ | 983,953 | ||||||
|
Depreciation and Amortization |
||||||||||||
|
Fluids Systems |
$ | 22,934 | $ | 26,679 | $ | 18,419 | ||||||
|
Mats and Integrated Services |
15,507 | 10,501 | 7,952 | |||||||||
|
Corporate Office |
2,734 | 2,584 | 2,575 | |||||||||
|
Total Depreciation and Amortization |
$ | 41,175 | $ | 39,764 | $ | 28,946 | ||||||
|
Operating Income (loss) |
||||||||||||
|
Fluids Systems |
$ | 95,600 | $ | 72,604 | $ | 59,987 | ||||||
|
Mats and Integrated Services |
70,526 | 49,394 | 54,251 | |||||||||
|
Corporate Office |
(35,530 | ) | (27,553 | ) | (21,963 | ) | ||||||
|
Operating Income |
$ | 130,596 | $ | 94,445 | $ | 92,275 | ||||||
|
Segment Assets |
||||||||||||
|
Fluids Systems |
$ | 778,148 | $ | 733,340 | $ | 790,147 | ||||||
|
Mats and Integrated Services |
175,318 | 112,619 | 81,252 | |||||||||
|
Assets of discontinued operations |
- | 79,020 | 79,276 | |||||||||
|
Corporate |
66,656 | 43,438 | 43,866 | |||||||||
|
Total Assets |
$ | 1,020,122 | $ | 968,417 | $ | 994,541 | ||||||
|
Capital Expenditures |
||||||||||||
|
Fluids Systems |
$ | 36,626 | $ | 39,316 | $ | 27,916 | ||||||
|
Mats and Integrated Services |
64,101 | 26,455 | 8,174 | |||||||||
|
Corporate |
5,215 | 464 | 6,307 | |||||||||
|
Total Capital Expenditures |
$ | 105,942 | $ | 66,235 | $ | 42,397 | ||||||
The Consolidated Statements of Cash Flows included in this Item 8 of these Financial Statements and Supplementary Data include $0.9 million, $4.4 million and $3.9 million in depreciation and amortization expense and capital expenditures of $1.0 million, $1.7 million and $1.6 million related to operations that are classified as discontinued operations as of December 31, 2014, 2013 and 2012, respectively.
The following table sets forth information about our operations by geographic area. Revenues by geographic location are determined based on the operating location from which services are rendered or products are sold.
NEWPARK RESOURCES, INC.
NOTES TO CONSOLIDATED FINANCIAL STATEMENTS - (Continued)
|
Year Ended December 31, |
||||||||||||
|
(In thousands) |
2014 |
2013 |
2012 |
|||||||||
|
Revenue |
||||||||||||
|
United States |
$ | 748,845 | $ | 717,263 | $ | 684,084 | ||||||
|
Canada |
79,516 | 47,559 | 48,643 | |||||||||
|
EMEA |
177,244 | 141,535 | 121,175 | |||||||||
|
Latin America and Mexico |
85,244 | 99,587 | 88,157 | |||||||||
|
Asia Pacific |
27,567 | 36,412 | 41,894 | |||||||||
|
Total Revenue |
$ | 1,118,416 | $ | 1,042,356 | $ | 983,953 | ||||||
|
Long-Lived Assets |
||||||||||||
|
United States |
$ | 296,799 | $ | 250,724 | $ | 237,751 | ||||||
|
Canada |
10,044 | 10,862 | 11,830 | |||||||||
|
EMEA |
55,560 | 44,262 | 30,729 | |||||||||
|
Latin America and Mexico |
6,635 | 9,852 | 11,158 | |||||||||
|
Asia Pacific |
25,991 | 27,241 | 31,539 | |||||||||
|
Total Long-Lived Assets |
$ | 395,029 | $ | 342,941 | $ | 323,007 | ||||||
No single customer accounted for more than 10% of our consolidated revenues for the years ended December 31, 2014, 2013 or 2012.
Note 14 — Supplemental Cash Flow and Other Information
Accounts payable and accrued liabilities at December 31, 2014, 2013, and 2012, included accruals for capital expenditures of $1.2 million, $1.5 million, and $1.0 million, respectively.
Accrued liabilities at December 31, 2014 and 2013 were $53.3 million and $46.3 million respectively. The balance at December 31, 2014 and December 31, 2013 included $25.9 million and $17.4 million for employee incentives and other compensation related expenses, respectively.
During the years ended December 31, 2014, 2013 and 2012, we did not finance the acquisition of property, plant and equipment with capital leases.
Note 15 — Commitments and Contingencies
In the ordinary course of conducting our business, we become involved in litigation and other claims from private party actions, as well as judicial and administrative proceedings involving governmental authorities at the federal, state and local levels. During the second quarter of 2014, a lawsuit was filed by Jesse Davida, a former employee, in Federal Court in Texas against Newpark Drilling Fluids LLC, alleging violations of the Fair Labor Standards Act (“FLSA”). The plaintiff seeks damages and penalties for the Company’s alleged failure to: properly classify its field service employees as “non-exempt” under the FLSA; and pay them on an hourly basis (including overtime). The plaintiff seeks recovery on his own behalf, and seeks certification of a class of similarly situated employees. The Court has conditionally certified a class of plaintiffs as those working as fluid service technicians for Newpark Drilling Fluids for the past 3 years. The form of the notice to be sent to the class has been approved by the court and the members of the class will be given the opportunity to “opt-in” to the litigation. A second case was filed by Josh Christensen in the fourth quarter of 2014, in Federal Court in Texas alleging that individuals treated as independent contractors should have been classified as employees and, as such, are entitled to assert claims for alleged violations of the FLSA (similar to the claims asserted in the Davida matter). Similar cases have been filed against other companies in the oil and gas services industry, including some of our competitors. We are monitoring developments in those cases as well. Because these cases remain in the early stages, we cannot predict with any degree of certainty the outcome of the litigation at this time and, as a result, cannot estimate any possible loss or range of loss. In the opinion of management, any liability in these matters should not have a material effect on our consolidated financial statements.
NEWPARK RESOURCES, INC.
NOTES TO CONSOLIDATED FINANCIAL STATEMENTS - (Continued)
Leases
We lease various manufacturing facilities, warehouses, office space, machinery and equipment, including transportation equipment, under operating leases with remaining terms ranging from one to eleven years, with various renewal options. Substantially all leases require payment of taxes, insurance and maintenance costs in addition to rental payments. Total rental expenses for all operating leases were approximately $25.5 million, $24.5 million and $21.3 million for the years ending 2014, 2013 and 2012, respectively.
Future minimum payments under non-cancelable operating leases, with initial or remaining terms in excess of one year are included in the table below. Future minimum payments under capital leases are not significant.
|
(In thousands) |
||||
|
2015 |
$ | 8,441 | ||
|
2016 |
6,147 | |||
|
2017 |
4,887 | |||
|
2018 |
3,663 | |||
|
2019 |
2,934 | |||
|
Thereafter |
10,499 | |||
| $ | 36,571 |
Other
In conjunction with our insurance programs, we had established letters of credit in favor of certain insurance companies in the amount of $3.5 million and $4.0 million at December 31, 2014 and 2013, respectively. We also had $0.4 million and $9.9 million in guarantee obligations in connection with facility closure bonds and other performance bonds issued by insurance companies outstanding as of December 31, 2014 and 2013. The December 31, 2013 balance included $9.3 million in guarantee obligations related to our Environmental Services business that was sold in March 2014.
Other than normal operating leases for office and warehouse space, rolling stock and other pieces of operating equipment, we do not have any off-balance sheet financing arrangements or special purpose entities. As such, we are not materially exposed to any financing, liquidity, market or credit risk that could arise if we had engaged in such financing arrangements.
We are self-insured for health claims, subject to certain “stop loss” insurance policies. Claims in excess of $225,000 per incident are insured by third-party insurers. We had accrued liabilities of $1.8 million and $1.2 million for unpaid claims incurred, based on historical experience at December 31, 2014 and 2013, respectively. Substantially all of these estimated claims are expected to be paid within six months of their occurrence.
We are self-insured for certain workers’ compensation, auto and general liability claims up to a certain policy limit. Claims in excess of $750,000 are insured by third-party reinsurers. At December 31, 2014 and 2013, we had accrued liabilities of $2.4 million and $2.5 million, respectively, for the uninsured portion of claims.
We maintain accrued liabilities for asset retirement obligations, which represent obligations associated with the retirement of tangible long-lived assets that result from the normal operation of the long-lived asset. Our asset retirement obligations primarily relate to required expenditures associated with owned and leased facilities. Upon settlement of the liability, a gain or loss for any difference between the settlement amount and the liability recorded is recognized. As of December 31, 2014 and 2013, we had accrued asset retirement obligations of $0.6 million and $3.3 million, respectively. The December 31, 2013 balance included $2.9 million in obligations reported related to our Environmental Services business that was sold in March 2014.
NEWPARK RESOURCES, INC.
NOTES TO CONSOLIDATED FINANCIAL STATEMENTS - (Continued)
Note 16 — Supplemental Selected Quarterly Financial Data (Unaudited)
|
Quarter Ended |
||||||||||||||||
|
(In thousands, except per share amounts) |
First Quarter |
Second Quarter |
Third Quarter |
Fourth Quarter |
||||||||||||
|
Fiscal Year 2014 |
||||||||||||||||
|
Revenues |
$ | 242,824 | $ | 272,466 | $ | 296,964 | $ | 306,162 | ||||||||
|
Operating income |
20,757 | 31,816 | 39,432 | 38,591 | ||||||||||||
|
Income from continuing operations |
11,742 | 20,329 | 23,492 | 23,446 | ||||||||||||
|
Net income |
35,011 | 20,329 | 23,492 | 23,446 | ||||||||||||
|
Income per common share -basic: |
||||||||||||||||
|
Income from continuing operations |
0.14 | 0.24 | 0.29 | 0.29 | ||||||||||||
|
Net income |
0.41 | 0.24 | 0.29 | 0.29 | ||||||||||||
|
Income per common share -diluted: |
||||||||||||||||
|
Income from continuing operations |
0.13 | 0.21 | 0.25 | 0.25 | ||||||||||||
|
Net income |
0.36 | 0.21 | 0.25 | 0.25 | ||||||||||||
|
Fiscal Year 2013 |
||||||||||||||||
|
Revenues |
$ | 267,923 | $ | 259,376 | $ | 268,132 | $ | 246,925 | ||||||||
|
Operating income |
24,861 | 21,596 | 25,645 | 22,343 | ||||||||||||
|
Income from continuing operations |
14,867 | 11,859 | 15,431 | 10,465 | ||||||||||||
|
Net income |
17,375 | 15,664 | 18,760 | 13,524 | ||||||||||||
|
Income per common share -basic: |
||||||||||||||||
|
Income from continuing operations |
0.18 | 0.14 | 0.18 | 0.12 | ||||||||||||
|
Net income |
0.21 | 0.19 | 0.22 | 0.16 | ||||||||||||
|
Income per common share -diluted: |
||||||||||||||||
|
Income from continuing operations |
0.16 | 0.13 | 0.16 | 0.11 | ||||||||||||
|
Net income |
0.18 | 0.17 | 0.20 | 0.14 | ||||||||||||
|
ITEM 9. |
Changes in and Disagreements with Accountants on Accounting and Financial Disclosure |
None.
|
ITEM 9A. |
Controls and Procedures |
Evaluation of disclosure controls and procedures
Based on their evaluation of the Company’s disclosure controls and procedures as of the end of the period covered by this report, the Chief Executive Officer and Chief Financial Officer of the Company have concluded that the Company’s disclosure controls and procedures are effective as of December 31, 2014.
Changes in internal control over financial reporting
During the quarter ended December 31, 2014, the Company implemented an operational and financial system for the U.S. business of our Mats and Integrated Services segment. This implementation was subject to various testing and review procedures prior to execution. The Company believes the conversion to and implementation of this new system further strengthened its existing internal control over financial reporting by enhancing certain business processes.
Other than the change described above, there has been no change in the Company’s internal control over financial reporting during the quarter ended December 31, 2014 that has materially affected, or is reasonably likely to materially affect, our internal control over financial reporting.
Management’s Report on Internal Control Over Financial Reporting
We are responsible for establishing and maintaining adequate internal control over financial reporting, as such term is defined in Securities and Exchange Act Rule 13(a)-15(f). Our internal control system over financial reporting is designed to provide reasonable assurance regarding the reliability of financial reporting and the preparation of financial statements for external purposes in accordance with generally accepted accounting principles.
Internal control over financial reporting has inherent limitations and may not prevent or detect misstatements. Therefore, even those systems determined to be effective can provide only reasonable assurance, not absolute assurance with respect to the financial statement preparation and presentation. Further, because of changes in conditions, the effectiveness of internal control over financial reporting may vary over time.
Under the supervision and with the participation of our Chief Executive Officer and Chief Financial Officer, we have evaluated the effectiveness of our internal control over financial reporting as of December 31, 2014 as required by the Securities and Exchange Act of 1934 Rule 13a-15(c). In making its assessment, we have utilized the criteria set forth by the Committee of Sponsoring Organizations of the Treadway Commission (COSO) in a report entitled “Internal Control — Integrated Framework (2013).” We concluded that based on our evaluation, our internal control over financial reporting was effective as of December 31, 2014.
The effectiveness of our internal control over financial reporting as of December 31, 2014 has been audited by Deloitte & Touche LLP, an independent registered public accounting firm, as stated in their report which is included herein.
/s/ Paul L. Howes
Paul L. Howes
President, Chief Executive Officer
/s/ Gregg S. Piontek
Gregg S. Piontek
Vice President and Chief Financial Officer
REPORT OF INDEPENDENT REGISTERED PUBLIC ACCOUNTING FIRM
To the Board of Directors and Stockholders of
Newpark Resources, Inc.
The Woodlands, Texas
We have audited the internal control over financial reporting of Newpark Resources, Inc. and subsidiaries (the "Company") as of December 31, 2014, based on criteria established in Internal Control — Integrated Framework (2013) issued by the Committee of Sponsoring Organizations of the Treadway Commission. The Company's management is responsible for maintaining effective internal control over financial reporting and for its assessment of the effectiveness of internal control over financial reporting, included in the accompanying management’s Report on Internal Control Over Financial Reporting. Our responsibility is to express an opinion on the Company's internal control over financial reporting based on our audit.
We conducted our audit in accordance with the standards of the Public Company Accounting Oversight Board (United States). Those standards require that we plan and perform the audit to obtain reasonable assurance about whether effective internal control over financial reporting was maintained in all material respects. Our audit included obtaining an understanding of internal control over financial reporting, assessing the risk that a material weakness exists, testing and evaluating the design and operating effectiveness of internal control based on the assessed risk, and performing such other procedures as we considered necessary in the circumstances. We believe that our audit provides a reasonable basis for our opinion.
A company's internal control over financial reporting is a process designed by, or under the supervision of, the company's principal executive and principal financial officers, or persons performing similar functions, and effected by the company's board of directors, management, and other personnel to provide reasonable assurance regarding the reliability of financial reporting and the preparation of financial statements for external purposes in accordance with generally accepted accounting principles. A company's internal control over financial reporting includes those policies and procedures that (1) pertain to the maintenance of records that, in reasonable detail, accurately and fairly reflect the transactions and dispositions of the assets of the company; (2) provide reasonable assurance that transactions are recorded as necessary to permit preparation of financial statements in accordance with generally accepted accounting principles, and that receipts and expenditures of the company are being made only in accordance with authorizations of management and directors of the company; and (3) provide reasonable assurance regarding prevention or timely detection of unauthorized acquisition, use, or disposition of the company's assets that could have a material effect on the financial statements.
Because of the inherent limitations of internal control over financial reporting, including the possibility of collusion or improper management override of controls, material misstatements due to error or fraud may not be prevented or detected on a timely basis. Also, projections of any evaluation of the effectiveness of the internal control over financial reporting to future periods are subject to the risk that the controls may become inadequate because of changes in conditions, or that the degree of compliance with the policies or procedures may deteriorate.
In our opinion, the Company maintained, in all material respects, effective internal control over financial reporting as of December 31, 2014, based on the criteria established in Internal Control — Integrated Framework (2013) issued by the Committee of Sponsoring Organizations of the Treadway Commission.
We have also audited, in accordance with the standards of the Public Company Accounting Oversight Board (United States), the consolidated financial statements as of and for the year ended December 31, 2014, of the Company and our report dated February 27, 2015 expressed an unqualified opinion on those financial statements.
/s/ DELOITTE & TOUCHE LLP
Houston, Texas
February 27, 2015
|
ITEM 9B. |
Other Information |
None.
PART III
|
ITEM 10. |
Directors, Executive Officers and Corporate Governance |
Executive Officers and Directors
The information required by this Item is incorporated by reference to the “Executive Officers” and “Election of Directors” sections of the definitive Proxy Statement relating to our 2015 Annual Meeting of Stockholders.
Compliance with Section 16(a) of the Exchange Act
The information required by this Item is incorporated by reference to the “Section 16(a) Beneficial Ownership Reporting Compliance” section of the definitive Proxy Statement relating to our 2015 Annual Meeting of Stockholders.
Code of Conduct and Ethics
We have adopted a Code of Ethics that applies to all of our directors and senior officers, and a Corporate Compliance and Business Ethics Manual (“Ethics Manual”) that applies to all officers and employees. The Code of Ethics and Ethics Manual are publicly available in the investor relations area of our website at www.newpark.com. This Code of Ethics is incorporated in this report by reference. Copies of our Code of Ethics may also be requested in print by writing to Newpark Resources, Inc., 9320 Lakeside Blvd., Suite 100, The Woodlands, Texas, 77381.
|
ITEM 11. |
Executive Compensation |
The information required by this Item is incorporated by reference to the “Executive Compensation” section of the definitive Proxy Statement relating to our 2015 Annual Meeting of Stockholders.
|
ITEM 12. |
Security Ownership of Certain Beneficial Owners and Management and Related Stockholder Matters |
The information required by this Item is incorporated by reference to the “Ownership of Common Stock” section of the definitive Proxy Statement relating to our 2015 Annual Meeting of Stockholders.
|
ITEM 13. |
Certain Relationships and Related Transactions, and Director Independence |
The information required by this Item is incorporated by reference to the “Related Person Transactions” and “Director Independence” sections of the definitive Proxy Statement relating to our 2015 Annual Meeting of Stockholders.
|
ITEM 14. |
Principal Accounting Fees and Services |
The information required by this Item is incorporated by reference to the “Independent Auditor” section of the definitive Proxy Statement relating to our 2015 Annual Meeting of Stockholders.
PART IV
|
ITEM 15. |
Exhibits and Financial Statement Schedules |
(a) List of documents filed as part of this report or incorporated herein by reference.
1. Financial Statements
The following financial statements of the Registrant as set forth under Part II, Item 8 of this report on Form 10-K on the pages indicated.
|
Page in this | |
|
Report of Independent Registered Public Accounting Firm |
32 |
|
Consolidated Balance Sheets as of December 31, 2014 and 2013 |
33 |
|
Consolidated Statements of Operations for the Years Ended December 31, 2014, 2013 and 2012 |
34 |
|
Consolidated Statements of Comprehensive Income for the Years Ended December 31, 2014, 2013 and 2012 |
35 |
|
Consolidated Statements of Stockholders’ Equity for the Years Ended December 31, 2014, 2013 and 2012 |
36 |
|
Consolidated Statements of Cash Flows for the Years Ended December 31, 2014, 2013 and 2012 |
37 |
|
Notes to Consolidated Financial Statements |
38 |
2. Financial Statement Schedules
All schedules for which provision is made in the applicable accounting regulations of the Securities and Exchange Commission are not required under the related instructions or are inapplicable and, therefore, have been omitted.
3. Exhibits
The exhibits listed are filed as part of, or incorporated by reference into, this Annual Report on Form 10-K.
|
3.1 |
Restated Certificate of Incorporation of Newpark Resources, Inc., incorporated by reference to Exhibit 3.1 to the Company’s Form 10-K405 for the year ended December 31, 1998 filed on March 31, 1999 (SEC File No. 001-02960). |
|
3.2 |
Certificate of Designation of Series A Cumulative Perpetual Preferred Stock of Newpark Resources, Inc. incorporated by reference to Exhibit 99.1 to the Company’s Current Report on Form 8-K filed on April 27, 1999 (SEC File No. 001-02960). |
|
3.3 |
Certificate of Designation of Series B Convertible Preferred Stock of Newpark Resources, Inc., incorporated by reference to Exhibit 4.1 to the Company’s Current Report on Form 8-K filed on June 7, 2000 (SEC File No. 001-02960). |
|
3.4 |
Certificate of Rights and Preferences of Series C Convertible Preferred Stock of Newpark Resources, Inc., incorporated by reference to Exhibit 4.1 to the Company’s Current Report on Form 8-K filed on January 4, 2001 (SEC File No. 001-02960). |
|
3.5 |
Certificate of Amendment to the Restated Certificate of Incorporation of Newpark Resources, Inc., incorporated by reference to Exhibit 3.1 to the Company’s Current Report on Form 8-K filed on November 4, 2009 (SEC File No. 001-02960). |
|
3.6 |
Amended and Restated Bylaws, incorporated by reference to Exhibit 3.1 to the Company’s Current Report on Form 8-K filed March 13, 2007 (SEC File No. 001-02960). |
|
4.1 |
Specimen form of common stock certificate of Newpark Resources, Inc., incorporated by reference to the exhibit filed with the Company’s Registration Statement on Form S-1 (SEC File No. 33-40716). |
|
4.2 |
Indenture, dated October 4, 2010, between Newpark Resources, Inc. and Wells Fargo Bank, National Association, as trustee, incorporated by reference to Exhibit 4.1 to the Company’s Current Report on Form 8-K filed on October 4, 2010 (SEC File No. 001-02960). |
|
4.3 |
First Supplemental Indenture, dated October 4, 2010, between Newpark Resources, Inc. and Wells Fargo Bank, National Association, as trustee, incorporated by reference to Exhibit 4.2 to the Company’s Current Report on Form 8-K filed on October 4, 2010 (SEC File No. 001-2960). |
|
4.4 |
Form of 4.00% Convertible Senior Note due 2017, incorporated by reference to Exhibit 4.3 to the Company’s Current Report on Form 8-K filed on October 4, 2010 (SEC File No. 001-2960). |
|
*10.1 |
Newpark Resources, Inc. 2003 Executive Incentive Compensation Plan, incorporated by reference to Exhibit 10.1 to the Company’s Quarterly Report on Form 10-Q for the period ended March 31, 2005 filed on May 3, 2005 (SEC File No. 001-02960). |
|
*10.2 |
Form of Award Agreement under 2003 Long-Term Incentive Plan, incorporated by reference to Exhibit 10.31 to the Company’s Form 10-K for the year ended December 31, 2004 filed on March 16, 2005 (SEC File No. 001-02960). |
|
*10.3 |
Newpark Resources, Inc. Amended and Restated Non-Employee Directors’ Restricted Stock Plan, incorporated by reference to Exhibit 10.9 to the Company’s Form 10-K filed on March 10, 2009 (SEC File No. 001-02960). |
|
*10.4 |
Form of Non-Employee Director Restricted Stock Agreement under the Newpark Resources, Inc. Amended and Restated Non-Employee Directors’ Restricted Stock Plan, incorporated by reference to Exhibit 10.10 to the Company’s Form 10-K filed on March 10, 2009 (SEC File No. 001-02960). |
|
*10.5 |
Amended and Restated Employment Agreement, dated as of December 31, 2008, between the registrant and Paul L. Howes, incorporated by reference to Exhibit 10.1 to the Company’s Quarterly Report on Form 10-Q filed on May 1, 2009 (SEC File No. 001-02960). |
|
*10.6 |
Indemnification Agreement, dated June 7, 2006, between the registrant and Paul L. Howes, incorporated by reference to Exhibit 10.1 to the Company’s Current Report on Form 8-K filed on June 13, 2006 (SEC File No. 001-02960). |
|
*10.7 |
Form of Indemnification Agreement, incorporated by reference to Exhibit 10.2 to the Company’s Current Report on Form 8-K filed on June 13, 2006 (SEC File No. 001-02960). |
|
*10.8 |
Employment Agreement, dated as of September 18, 2006, by and between Newpark Resources, Inc. and Mark J. Airola, incorporated by reference to Exhibit 10.2 to the Company’s Current Report on Form 8-K filed on September 20, 2006 (SEC File No. 001-02960). |
|
*10.9 |
Form of Non-Qualified Stock Option Agreement under the Newpark Resources, Inc. 2006 Equity Incentive Plan, incorporated by reference to Exhibit 4.4 to the Company’s Registration Statement on Form S-8 filed on March 26, 2007 (SEC File No. 333-0141577). |
|
*10.10 |
Employment Agreement between Newpark Resources, Inc. and Bruce Smith dated April 20, 2007, incorporated by reference to Exhibit 10.1 to the Company’s Quarterly Report on Form 10-Q for the period ended March 31, 2007 filed on May 8, 2007 (SEC File No. 001-02960). |
|
10.11 |
Amendment to the Indemnification Agreement between Newpark Resources, Inc. and Paul L. Howes dated September 11, 2007, incorporated by reference to Exhibit 10.1 to the Company’s Current Report on Form 8-K filed on September 14, 2007 (SEC File No. 001-02960). |
|
*10.12 |
First Amendment to the Newpark Resources, Inc. Amended and Restated Non-Employee Directors’ Restricted Stock Plan, incorporated by reference to Exhibit 10.25 to the Company’s Annual Report on Form 10-K filed on March 10, 2009 (SEC File No. 001-02960). |
|
*10.13 |
Newpark Resources, Inc., 2008 Employee Stock Purchase Plan, incorporated by reference to Exhibit 4.1 the Company’s Registration Statement on Form S-8 filed on December 9, 2008 (SEC File No. 333-156010). |
|
10.14 |
Form of Change of Control Agreement, incorporated by reference to Exhibit 10.3 to the Company’s Quarterly Report on Form 10-Q for the period ended March 31, 2008 filed on May 2, 2008 (SEC File No. 001-02960). |
|
*10.15 |
Amendment to Amended and Restated Employment Agreement between Newpark Resources, Inc. and Paul L. Howes dated April 20, 2009, incorporated by reference to Exhibit 10.1 to the Company’s Current Report on Form 8-K filed on April 23, 2009 (SEC File No. 001-02960). |
|
*10.16 |
Amendment to Employment Agreement between Newpark Resources, Inc. and Bruce C. Smith dated April 22, 2009, incorporated by reference to Exhibit 10.3 to the Company’s Current Report on Form 8-K filed on April 23, 2009 (SEC File No. 001-02960). |
|
*10.17 |
Amendment to Employment Agreement between Newpark Resources, Inc. and Mark J. Airola dated April 22, 2009, incorporated by reference to Exhibit 10.4 to the Company’s Current Report on Form 8-K filed on April 23, 2009 (SEC File No. 001-02960). |
|
*10.18 |
Extension Letter Amendment to Amended and Restated Employment Agreement between Newpark Resources, Inc. and Paul L. Howes dated November 30, 2009, incorporated by reference to Exhibit 10.1 to the Company’s Current Report on Form 8-K filed on December 7, 2009 (SEC File No. 001-02960). |
|
*10.19 |
Extension Letter Amendment to Employment Agreement between Newpark Resources, Inc. and Bruce C. Smith dated November 30, 2009, incorporated by reference to Exhibit 10.3 to the Company’s Current Report on Form 8-K filed on December 7, 2009 (SEC File No. 001-02960). |
|
*10.20 |
Extension Letter Amendment to Employment Agreement between Newpark Resources, Inc. and Mark J. Airola dated November 30, 2009, incorporated by reference to Exhibit 10.4 to the Company’s Current Report on Form 8-K filed on December 7, 2009 (SEC File No. 001-02960). |
|
*10.21 |
Employment Agreement, dated as of October 15, 2010, by and between Newpark Resources, Inc. and Jeffery L. Juergens, incorporated by reference to Exhibit 10.1 to the Company’s Current Report on Form 8-K filed on October 18, 2010 (SEC File No. 001-02960). |
|
10.22 |
Change in Control Agreement dated as of October 15, 2010, by and between Newpark Resources, Inc. and Jeffery L. Juergens, incorporated by reference to Exhibit 10.2 to the Company’s Current Report on Form 8-K filed on October 18, 2010 (SEC File No. 001-02960). |
|
*10.23 |
Newpark Resources, Inc. 2010 Annual Cash Incentive Plan, incorporated by reference to Exhibit 10.1 to the Company’s Current Report on Form 8-K filed on April 2, 2010 (SEC File No. 001-02960). |
|
†*10.24 |
Director Compensation Summary. |
|
*10.25 |
Newpark Resources, Inc. 2006 Equity Incentive Plan (As Amended and Restated Effective June 10, 2009), incorporated by reference to Exhibit 4.6 to the Company’s Registration Statement on Form S-8 filed on August 14, 2009 (SEC File No. 333-161378). |
|
*10.26 |
Amendment No. 1 to the Newpark Resources, Inc. 2006 Equity Incentive Plan (As Amended and Restated Effective June 10, 2009), incorporated by reference to Exhibit 4.8 to the Company’s Registration Statement on Form S-8 filed on June 9, 2011 (SEC File No. 333-174807). |
|
*10.27 |
Form of Non-Qualified Stock Option Agreement under the Newpark Resources, Inc. 2006 Equity Incentive Plan (As Amended and Restated Effective June 10, 2009) (as amended), incorporated by reference to Exhibit 4.9 to the Company’s Registration Statement on Form S-8 filed on June 9, 2011 (SEC File No. 333-174807). |
|
*10.28 |
Form of Non-Qualified Stock Option Agreement under the Newpark Resources, Inc. 2006 Equity Incentive Plan (As Amended and Restated Effective June 10, 2009) (as amended), incorporated by reference to Exhibit 4.10 to the Company’s Registration Statement on Form S-8 filed on June 9, 2011 (SEC File No. 333-174807). |
|
*10.29 |
Form of Restricted Stock Agreement under the Newpark Resources, Inc. 2006 Equity Incentive Plan (As Amended and Restated Effective June 10, 2009) (as amended), incorporated by reference to Exhibit 4.11 to the Company’s Registration Statement on Form S-8 filed on June 9, 2011 (SEC File No. 333-174807). |
|
*10.30 |
Form of Restricted Stock Agreement under the Newpark Resources, Inc. 2006 Equity Incentive Plan (As Amended and Restated Effective June 10, 2009) (as amended), incorporated by reference to Exhibit 4.12 to the Company’s Registration Statement on Form S-8 filed on June 9, 2011 (SEC File No. 333-174807). |
|
*10.31 |
Newpark Resources, Inc. 2003 Long Term Incentive Plan, Amended and Restated Effective March 8, 2011, incorporated by reference to Exhibit 10.1 to the Company’s Current Report on Form 8-K filed on June 15, 2011 (SEC File No. 001-02960). |
|
*10.32 |
Form of Restricted Stock Agreement under the 2003 Long Term Incentive Plan, Amended and Restated Effective March 8, 2011, incorporated by reference to Exhibit 10.2 to the Company’s Current Report on Form 8-K filed on June 15, 2011 (SEC File No. 001-02960). |
|
*10.33 |
Employment Agreement, dated October 18, 2011, by and between Newpark Resources, Inc. and Gregg Steven Piontek, incorporated by reference to the Company’s Current Report on Form 8-K filed on October 21, 2011 (SEC File No. 001-02960). |
|
*10.34 |
Indemnification Agreement, dated October 26, 2011, between Gregg S. Piontek and Newpark Resources, Inc., incorporated by reference to Exhibit 10.1 to the Company’s Current Report on Form 8-K filed on October 31, 2011 (SEC File No. 001-02960). |
|
10.35 |
Second Amended and Restated Credit Agreement among Newpark Resources, Inc., JPMorgan Chase Bank, N.A., as Administrative Agent, Bank of America, N.A., as Syndication Agent, and Wells Fargo Bank, National Association, as Documentation Agent, dated November 22, 2011, incorporated by reference to Exhibit 10.2 to the Company’s Current Report on Form 8-K filed on November 29, 2011 (SEC File No. 001-02960). |
|
*10.36 |
Employment Agreement, dated December 29, 2011, between Lee Ann Kendrick and Newpark Resources, Inc., incorporated by reference to Exhibit 10.1 to the Company’s Quarterly Report on Form 10-Q filed on May 2, 2012 (SEC File No. 001-02960). |
|
*10.37 |
Indemnification Agreement, dated May 23, 2012, between Lee Ann Kendrick and Newpark Resources, Inc., incorporated by reference to Exhibit 10.1 to the Company’s Quarterly Report on Form 10-Q filed on July 27, 2012 (SEC File No. 001-02960). |
|
*10.38 |
Form of Restricted Stock Unit for Participants Outside the United States under the 2006 Equity Incentive Plan (As Amended and Restated Effective June 10, 2009) (as amended), incorporated by reference to Exhibit 10.2 to the Company’s Quarterly Report on Form 10-Q filed on July 27, 2012 (SEC File No. 001-02960). |
|
*10.39 |
Form of Non-Qualified Stock Option Agreement for Participants Outside the United States under the 2006 Equity Incentive Plan (As Amended and Restated Effective June 10, 2009) (as amended), incorporated by reference to Exhibit 10.3 to the Company’s Quarterly Report on Form 10-Q filed on July 27, 2012 (SEC File No. 001-02960). |
|
*10.40 |
Second Amendment to the Newpark Resources, Inc. Amended and Restated Non-Employee Directors’ Restricted Stock Plan, incorporated by reference to Exhibit 10.4 to the Company’s Quarterly Report on Form 10-Q filed on July 27, 2012 (SEC File No. 001-02960). |
|
*10.41 |
Amendment to Employment Agreement, dated December 31, 2012, between Mark Airola and Newpark Resources, Inc., incorporated by reference to the Company’s Current Report on Form 8-K filed on January 4, 2013 (SEC File No. 001-02960). |
|
*10.42 |
Amendment to Employment Agreement, dated December 31, 2012, between Bruce Smith and Newpark Resources, Inc., incorporated by reference to the Company’s Current Report on Form 8-K filed on January 4, 2013 (SEC File No. 001-02960). |
|
10.43 |
Membership Interests Purchase Agreement, dated February 10, 2014, by and among Newpark Resources, Inc., Newpark Drilling Fluids LLC and ecoserv, LLC, incorporated by reference to the Company’s Quarterly Report on Form 10-Q filed on April 25, 2014 (SEC File No. 001-02960). |
|
10.44 |
First Amendment to the Second Amended and Restated Credit Agreement among Newpark Resources, Inc., JPMorgan Chase Bank, N.A., as Administrative Agent, Bank of America, N.A., as Syndication Agent and Wells Fargo Basnk, National Association, as Documentation Agent, dated October 10, 2012, incorporated by reference to Exhibit 10.52 to the Company’s Annual Report on Form 10-K filed on February 28, 2014 (SEC File No. 001-02960). |
|
10.45 |
Second Amendment to the Second Amended and Restated Credit Agreement among Newpark Resources, Inc., JPMorgan Chase Bank, N.A., as Administrative Agent, Bank of America, N.A., as Syndication Agent and Wells Fargo Basnk, National Association, as Documentation Agent, dated February 13, 2014, incorporated by reference to Exhibit 10.1 to the Company’s Current Report on Form 8-K filed on February 18, 2014 (SEC File No. 001-02960). |
|
*10.46 |
Newpark Resources, Inc. 2014 Non-Employee Directors’ Restricted Stock Plan, incorporated by reference to Exhibit 4.7 to the Company’s Registration Statement on Form S-8 filed on May 22, 2014 (SEC File No. 333-196164). |
|
*10.47 |
Form of Non-Employee Director Restricted Stock Agreement under the Newpark Resources, Inc. 2014 Non-Employee Directors’ Restricted Stock Plan, incorporated by reference to Exhibit 4.8 to the Company’s Registration Statement on Form S-8 filed on May 22, 2014 (SEC File No. 333-196164). |
|
*10.48 |
Form of Indemnification Agreement, incorporated by reference to Exhibit 4.1 to the Company’s Quarterly Report on Form 10-Q filed on July 25, 2014 (SEC File No. 001-02960). |
|
†21.1 |
Subsidiaries of the Registrant. |
|
†23.1 |
Consent of Independent Registered Public Accounting Firm. |
|
†31.1 |
Certification of Paul L. Howes pursuant to Rule 13a-14 or 15d-14 of the Securities Exchange Act of 1934, as adopted pursuant to Section 302 of the Sarbanes-Oxley Act of 2002. |
|
†31.2 |
Certification of Gregg S. Piontek pursuant to Rule 13a-14 or 15d-14 of the Securities Exchange Act of 1934, as adopted pursuant to Section 302 of the Sarbanes-Oxley Act of 2002. |
|
†32.1 |
Certification of Paul L. Howes pursuant to 18 U.S.C. Section 1350, as adopted pursuant to Section 906 of the Sarbanes-Oxley Act of 2002. |
|
†32.2 |
Certification of Gregg S. Piontek pursuant to 18 U.S.C. Section 1350, as adopted pursuant to Section 906 of the Sarbanes-Oxley Act of 2002. |
|
†95.1 |
Reporting requirements under the Mine Safety and Health Administration. |
|
†101.INS |
XBRL Instance Document |
|
†101.SCH |
XBRL Schema Document |
|
†101.CAL |
XBRL Calculation Linkbase Document |
|
†101.LAB |
XBRL Label Linkbase Document |
|
†101.PRE |
XBRL Presentation Linkbase Document |
|
†101.DEF |
XBRL Definition Linkbase Document |
_______
† Filed herewith.
* Management compensation plan or agreement
SIGNATURES
Pursuant to the requirements of Section 13 or 15(d) of the Securities Exchange Act of 1934, the registrant has duly caused this report to be signed on its behalf by the undersigned, thereunto duly authorized
|
|
NEWPARK RESOURCES, INC. |
| |
|
|
|
|
|
|
|
|
|
|
|
|
By: |
/s/ Paul L. Howes |
|
|
|
|
Paul L. Howes |
|
|
|
|
President and Chief Executive Officer |
|
Dated: February 27, 2015
Pursuant to the requirements of the Securities Exchange Act of 1934, this report has been signed by the following persons on behalf of the registrant in the capacities and on the dates indicated.
|
Signatures |
Title |
Date |
|||
|
/s/ Paul L. Howes |
President, Chief Executive Officer and Director |
February 27, 2015 |
|||
|
Paul L. Howes |
(Principal Executive Officer) | ||||
|
/s/ Gregg S. Piontek |
Vice President and Chief Financial Officer |
February 27, 2015 |
|||
|
Gregg S. Piontek |
(Principal Financial Officer) | ||||
|
/s/ Douglas L. White |
Corporate Controller and Chief Accounting Officer |
February 27, 2015 |
|||
|
Douglas L. White |
(Principal Accounting Officer) | ||||
|
|
|||||
|
/s/ David C. Anderson |
Chairman of the Board |
February 27, 2015 |
|||
|
David C. Anderson |
|||||
|
/s/ Anthony J. Best |
Director, Member of the Audit Committee |
February 27, 2015 |
|||
|
Anthony J. Best |
|||||
|
/s/ G. Stephen Finley |
Director, Member of the Audit Committee |
February 27, 2015 |
|||
|
G. Stephen Finley |
|||||
|
/s/ Roderick A. Larson |
Director, Member of the Audit Committee |
February 27, 2015 |
|||
|
Roderick A. Larson |
|||||
|
/s/ James W. McFarland |
Director, Member of the Audit Committee |
February 27, 2015 |
|||
|
James W. McFarland |
|||||
|
/s/ Gary L. Warren |
Director, Member of the Audit Committee |
February 27, 2015 |
|||
|
Gary L. Warren |
NEWPARK RESOURCES, INC
EXHIBIT INDEX
The exhibits listed are filed as part of, or incorporated by reference into, this Annual Report on Form 10-K.
|
3.1 |
Restated Certificate of Incorporation of Newpark Resources, Inc., incorporated by reference to Exhibit 3.1 to the Company’s Form 10-K405 for the year ended December 31, 1998 filed on March 31, 1999 (SEC File No. 001-02960). |
|
3.2 |
Certificate of Designation of Series A Cumulative Perpetual Preferred Stock of Newpark Resources, Inc. incorporated by reference to Exhibit 99.1 to the Company’s Current Report on Form 8-K filed on April 27, 1999 (SEC File No. 001-02960). |
|
3.3 |
Certificate of Designation of Series B Convertible Preferred Stock of Newpark Resources, Inc., incorporated by reference to Exhibit 4.1 to the Company’s Current Report on Form 8-K filed on June 7, 2000 (SEC File No. 001-02960). |
|
3.4 |
Certificate of Rights and Preferences of Series C Convertible Preferred Stock of Newpark Resources, Inc., incorporated by reference to Exhibit 4.1 to the Company’s Current Report on Form 8-K filed on January 4, 2001 (SEC File No. 001-02960). |
|
3.5 |
Certificate of Amendment to the Restated Certificate of Incorporation of Newpark Resources, Inc., incorporated by reference to Exhibit 3.1 to the Company’s Current Report on Form 8-K filed on November 4, 2009 (SEC File No. 001-02960). |
|
3.6 |
Amended and Restated Bylaws, incorporated by reference to Exhibit 3.1 to the Company’s Current Report on Form 8-K filed March 13, 2007 (SEC File No. 001-02960). |
|
4.1 |
Specimen form of common stock certificate of Newpark Resources, Inc., incorporated by reference to the exhibit filed with the Company’s Registration Statement on Form S-1 (SEC File No. 33-40716). |
|
4.2 |
Indenture, dated October 4, 2010, between Newpark Resources, Inc. and Wells Fargo Bank, National Association, as trustee, incorporated by reference to Exhibit 4.1 to the Company’s Current Report on Form 8-K filed on October 4, 2010 (SEC File No. 001-02960). |
|
4.3 |
First Supplemental Indenture, dated October 4, 2010, between Newpark Resources, Inc. and Wells Fargo Bank, National Association, as trustee, incorporated by reference to Exhibit 4.2 to the Company’s Current Report on Form 8-K filed on October 4, 2010 (SEC File No. 001-2960). |
|
4.4 |
Form of 4.00% Convertible Senior Note due 2017, incorporated by reference to Exhibit 4.3 to the Company’s Current Report on Form 8-K filed on October 4, 2010 (SEC File No. 001-2960). |
|
*10.1 |
Newpark Resources, Inc. 2003 Executive Incentive Compensation Plan, incorporated by reference to Exhibit 10.1 to the Company’s Quarterly Report on Form 10-Q for the period ended March 31, 2005 filed on May 3, 2005 (SEC File No. 001-02960). |
|
*10.2 |
Form of Award Agreement under 2003 Long-Term Incentive Plan, incorporated by reference to Exhibit 10.31 to the Company’s Form 10-K for the year ended December 31, 2004 filed on March 16, 2005 (SEC File No. 001-02960). |
|
*10.3 |
Newpark Resources, Inc. Amended and Restated Non-Employee Directors’ Restricted Stock Plan, incorporated by reference to Exhibit 10.9 to the Company’s Form 10-K filed on March 10, 2009 (SEC File No. 001-02960). |
|
*10.4 |
Form of Non-Employee Director Restricted Stock Agreement under the Newpark Resources, Inc. Amended and Restated Non-Employee Directors’ Restricted Stock Plan, incorporated by reference to Exhibit 10.10 to the Company’s Form 10-K filed on March 10, 2009 (SEC File No. 001-02960). |
|
*10.5 |
Amended and Restated Employment Agreement, dated as of December 31, 2008, between the registrant and Paul L. Howes, incorporated by reference to Exhibit 10.1 to the Company’s Quarterly Report on Form 10-Q filed on May 1, 2009 (SEC File No. 001-02960). |
|
*10.6 |
Indemnification Agreement, dated June 7, 2006, between the registrant and Paul L. Howes, incorporated by reference to Exhibit 10.1 to the Company’s Current Report on Form 8-K filed on June 13, 2006 (SEC File No. 001-02960). |
|
*10.7 |
Form of Indemnification Agreement, incorporated by reference to Exhibit 10.2 to the Company’s Current Report on Form 8-K filed on June 13, 2006 (SEC File No. 001-02960). |
|
*10.8 |
Employment Agreement, dated as of September 18, 2006, by and between Newpark Resources, Inc. and Mark J. Airola, incorporated by reference to Exhibit 10.2 to the Company’s Current Report on Form 8-K filed on September 20, 2006 (SEC File No. 001-02960). |
|
*10.9 |
Form of Non-Qualified Stock Option Agreement under the Newpark Resources, Inc. 2006 Equity Incentive Plan, incorporated by reference to Exhibit 4.4 to the Company’s Registration Statement on Form S-8 filed on March 26, 2007 (SEC File No. 333-0141577). |
|
*10.10 |
Employment Agreement between Newpark Resources, Inc. and Bruce Smith dated April 20, 2007, incorporated by reference to Exhibit 10.1 to the Company’s Quarterly Report on Form 10-Q for the period ended March 31, 2007 filed on May 8, 2007 (SEC File No. 001-02960). |
|
10.11 |
Amendment to the Indemnification Agreement between Newpark Resources, Inc. and Paul L. Howes dated September 11, 2007, incorporated by reference to Exhibit 10.1 to the Company’s Current Report on Form 8-K filed on September 14, 2007 (SEC File No. 001-02960). |
|
*10.12 |
First Amendment to the Newpark Resources, Inc. Amended and Restated Non-Employee Directors’ Restricted Stock Plan, incorporated by reference to Exhibit 10.25 to the Company’s Annual Report on Form 10-K filed on March 10, 2009 (SEC File No. 001-02960). |
|
*10.13 |
Newpark Resources, Inc., 2008 Employee Stock Purchase Plan, incorporated by reference to Exhibit 4.1 the Company’s Registration Statement on Form S-8 filed on December 9, 2008 (SEC File No. 333-156010). |
|
10.14 |
Form of Change of Control Agreement, incorporated by reference to Exhibit 10.3 to the Company’s Quarterly Report on Form 10-Q for the period ended March 31, 2008 filed on May 2, 2008 (SEC File No. 001-02960). |
|
*10.15 |
Amendment to Amended and Restated Employment Agreement between Newpark Resources, Inc. and Paul L. Howes dated April 20, 2009, incorporated by reference to Exhibit 10.1 to the Company’s Current Report on Form 8-K filed on April 23, 2009 (SEC File No. 001-02960). |
|
*10.16 |
Amendment to Employment Agreement between Newpark Resources, Inc. and Bruce C. Smith dated April 22, 2009, incorporated by reference to Exhibit 10.3 to the Company’s Current Report on Form 8-K filed on April 23, 2009 (SEC File No. 001-02960). |
|
*10.17 |
Amendment to Employment Agreement between Newpark Resources, Inc. and Mark J. Airola dated April 22, 2009, incorporated by reference to Exhibit 10.4 to the Company’s Current Report on Form 8-K filed on April 23, 2009 (SEC File No. 001-02960). |
|
*10.18 |
Extension Letter Amendment to Amended and Restated Employment Agreement between Newpark Resources, Inc. and Paul L. Howes dated November 30, 2009, incorporated by reference to Exhibit 10.1 to the Company’s Current Report on Form 8-K filed on December 7, 2009 (SEC File No. 001-02960). |
|
*10.19 |
Extension Letter Amendment to Employment Agreement between Newpark Resources, Inc. and Bruce C. Smith dated November 30, 2009, incorporated by reference to Exhibit 10.3 to the Company’s Current Report on Form 8-K filed on December 7, 2009 (SEC File No. 001-02960). |
|
*10.20 |
Extension Letter Amendment to Employment Agreement between Newpark Resources, Inc. and Mark J. Airola dated November 30, 2009, incorporated by reference to Exhibit 10.4 to the Company’s Current Report on Form 8-K filed on December 7, 2009 (SEC File No. 001-02960). |
|
*10.21 |
Employment Agreement, dated as of October 15, 2010, by and between Newpark Resources, Inc. and Jeffery L. Juergens, incorporated by reference to Exhibit 10.1 to the Company’s Current Report on Form 8-K filed on October 18, 2010 (SEC File No. 001-02960). |
|
10.22 |
Change in Control Agreement dated as of October 15, 2010, by and between Newpark Resources, Inc. and Jeffery L. Juergens, incorporated by reference to Exhibit 10.2 to the Company’s Current Report on Form 8-K filed on October 18, 2010 (SEC File No. 001-02960). |
|
*10.23 |
Newpark Resources, Inc. 2010 Annual Cash Incentive Plan, incorporated by reference to Exhibit 10.1 to the Company’s Current Report on Form 8-K filed on April 2, 2010 (SEC File No. 001-02960). |
|
†*10.24 |
Director Compensation Summary. |
|
*10.25 |
Newpark Resources, Inc. 2006 Equity Incentive Plan (As Amended and Restated Effective June 10, 2009), incorporated by reference to Exhibit 4.6 to the Company’s Registration Statement on Form S-8 filed on August 14, 2009 (SEC File No. 333-161378). |
|
*10.26 |
Amendment No. 1 to the Newpark Resources, Inc. 2006 Equity Incentive Plan (As Amended and Restated Effective June 10, 2009), incorporated by reference to Exhibit 4.8 to the Company’s Registration Statement on Form S-8 filed on June 9, 2011 (SEC File No. 333-174807). |
|
*10.27 |
Form of Non-Qualified Stock Option Agreement under the Newpark Resources, Inc. 2006 Equity Incentive Plan (As Amended and Restated Effective June 10, 2009) (as amended), incorporated by reference to Exhibit 4.9 to the Company’s Registration Statement on Form S-8 filed on June 9, 2011 (SEC File No. 333-174807). |
|
*10.28 |
Form of Non-Qualified Stock Option Agreement under the Newpark Resources, Inc. 2006 Equity Incentive Plan (As Amended and Restated Effective June 10, 2009) (as amended), incorporated by reference to Exhibit 4.10 to the Company’s Registration Statement on Form S-8 filed on June 9, 2011 (SEC File No. 333-174807). |
|
*10.29 |
Form of Restricted Stock Agreement under the Newpark Resources, Inc. 2006 Equity Incentive Plan (As Amended and Restated Effective June 10, 2009) (as amended), incorporated by reference to Exhibit 4.11 to the Company’s Registration Statement on Form S-8 filed on June 9, 2011 (SEC File No. 333-174807). |
|
*10.30 |
Form of Restricted Stock Agreement under the Newpark Resources, Inc. 2006 Equity Incentive Plan (As Amended and Restated Effective June 10, 2009) (as amended), incorporated by reference to Exhibit 4.12 to the Company’s Registration Statement on Form S-8 filed on June 9, 2011 (SEC File No. 333-174807). |
|
*10.31 |
Newpark Resources, Inc. 2003 Long Term Incentive Plan, Amended and Restated Effective March 8, 2011, incorporated by reference to Exhibit 10.1 to the Company’s Current Report on Form 8-K filed on June 15, 2011 (SEC File No. 001-02960). |
|
*10.32 |
Form of Restricted Stock Agreement under the 2003 Long Term Incentive Plan, Amended and Restated Effective March 8, 2011, incorporated by reference to Exhibit 10.2 to the Company’s Current Report on Form 8-K filed on June 15, 2011 (SEC File No. 001-02960). |
|
*10.33 |
Employment Agreement, dated October 18, 2011, by and between Newpark Resources, Inc. and Gregg Steven Piontek, incorporated by reference to the Company’s Current Report on Form 8-K filed on October 21, 2011 (SEC File No. 001-02960). |
|
*10.34 |
Indemnification Agreement, dated October 26, 2011, between Gregg S. Piontek and Newpark Resources, Inc., incorporated by reference to Exhibit 10.1 to the Company’s Current Report on Form 8-K filed on October 31, 2011 (SEC File No. 001-02960). |
|
10.35 |
Second Amended and Restated Credit Agreement among Newpark Resources, Inc., JPMorgan Chase Bank, N.A., as Administrative Agent, Bank of America, N.A., as Syndication Agent, and Wells Fargo Bank, National Association, as Documentation Agent, dated November 22, 2011, incorporated by reference to Exhibit 10.2 to the Company’s Current Report on Form 8-K filed on November 29, 2011 (SEC File No. 001-02960). |
|
*10.36 |
Employment Agreement, dated December 29, 2011, between Lee Ann Kendrick and Newpark Resources, Inc., incorporated by reference to Exhibit 10.1 to the Company’s Quarterly Report on Form 10-Q filed on May 2, 2012 (SEC File No. 001-02960). |
|
*10.37 |
Indemnification Agreement, dated May 23, 2012, between Lee Ann Kendrick and Newpark Resources, Inc., incorporated by reference to Exhibit 10.1 to the Company’s Quarterly Report on Form 10-Q filed on July 27, 2012 (SEC File No. 001-02960). |
|
*10.38 |
Form of Restricted Stock Unit for Participants Outside the United States under the 2006 Equity Incentive Plan (As Amended and Restated Effective June 10, 2009) (as amended), incorporated by reference to Exhibit 10.2 to the Company’s Quarterly Report on Form 10-Q filed on July 27, 2012 (SEC File No. 001-02960). |
|
*10.39 |
Form of Non-Qualified Stock Option Agreement for Participants Outside the United States under the 2006 Equity Incentive Plan (As Amended and Restated Effective June 10, 2009) (as amended), incorporated by reference to Exhibit 10.3 to the Company’s Quarterly Report on Form 10-Q filed on July 27, 2012 (SEC File No. 001-02960). |
|
*10.40 |
Second Amendment to the Newpark Resources, Inc. Amended and Restated Non-Employee Directors’ Restricted Stock Plan, incorporated by reference to Exhibit 10.4 to the Company’s Quarterly Report on Form 10-Q filed on July 27, 2012 (SEC File No. 001-02960). |
|
*10.41 |
Amendment to Employment Agreement, dated December 31, 2012, between Mark Airola and Newpark Resources, Inc., incorporated by reference to the Company’s Current Report on Form 8-K filed on January 4, 2013 (SEC File No. 001-02960). |
|
*10.42 |
Amendment to Employment Agreement, dated December 31, 2012, between Bruce Smith and Newpark Resources, Inc., incorporated by reference to the Company’s Current Report on Form 8-K filed on January 4, 2013 (SEC File No. 001-02960). |
|
10.43 |
Membership Interests Purchase Agreement, dated February 10, 2014, by and among Newpark Resources, Inc., Newpark Drilling Fluids LLC and ecoserv, LLC, incorporated by reference to the Company’s Quarterly Report on Form 10-Q filed on April 25, 2014 (SEC File No. 001-02960). |
|
10.44 |
First Amendment to the Second Amended and Restated Credit Agreement among Newpark Resources, Inc., JPMorgan Chase Bank, N.A., as Administrative Agent, Bank of America, N.A., as Syndication Agent and Wells Fargo Basnk, National Association, as Documentation Agent, dated October 10, 2012, incorporated by reference to Exhibit 10.52 to the Company’s Annual Report on Form 10-K filed on February 28, 2014 (SEC File No. 001-02960). |
|
10.45 |
Second Amendment to the Second Amended and Restated Credit Agreement among Newpark Resources, Inc., JPMorgan Chase Bank, N.A., as Administrative Agent, Bank of America, N.A., as Syndication Agent and Wells Fargo Basnk, National Association, as Documentation Agent, dated February 13, 2014, incorporated by reference to Exhibit 10.1 to the Company’s Current Report on Form 8-K filed on February 18, 2014 (SEC File No. 001-02960). |
|
*10.46 |
Newpark Resources, Inc. 2014 Non-Employee Directors’ Restricted Stock Plan, incorporated by reference to Exhibit 4.7 to the Company’s Registration Statement on Form S-8 filed on May 22, 2014 (SEC File No. 333-196164). |
|
*10.47 |
Form of Non-Employee Director Restricted Stock Agreement under the Newpark Resources, Inc. 2014 Non-Employee Directors’ Restricted Stock Plan, incorporated by reference to Exhibit 4.8 to the Company’s Registration Statement on Form S-8 filed on May 22, 2014 (SEC File No. 333-196164). |
|
*10.48 |
Form of Indemnification Agreement, incorporated by reference to Exhibit 4.1 to the Company’s Quarterly Report on Form 10-Q filed on July 25, 2014 (SEC File No. 001-02960). |
|
†21.1 |
Subsidiaries of the Registrant. |
|
†23.1 |
Consent of Independent Registered Public Accounting Firm. |
|
†31.1 |
Certification of Paul L. Howes pursuant to Rule 13a-14 or 15d-14 of the Securities Exchange Act of 1934, as adopted pursuant to Section 302 of the Sarbanes-Oxley Act of 2002. |
|
†31.2 |
Certification of Gregg S. Piontek pursuant to Rule 13a-14 or 15d-14 of the Securities Exchange Act of 1934, as adopted pursuant to Section 302 of the Sarbanes-Oxley Act of 2002. |
|
†32.1 |
Certification of Paul L. Howes pursuant to 18 U.S.C. Section 1350, as adopted pursuant to Section 906 of the Sarbanes-Oxley Act of 2002. |
|
†32.2 |
Certification of Gregg S. Piontek pursuant to 18 U.S.C. Section 1350, as adopted pursuant to Section 906 of the Sarbanes-Oxley Act of 2002. |
|
†95.1 |
Reporting requirements under the Mine Safety and Health Administration. |
|
†101.INS |
XBRL Instance Document |
|
†101.SCH |
XBRL Schema Document |
|
†101.CAL |
XBRL Calculation Linkbase Document |
|
†101.LAB |
XBRL Label Linkbase Document |
|
†101.PRE |
XBRL Presentation Linkbase Document |
|
†101.DEF |
XBRL Definition Linkbase Document |
_______
† Filed herewith.
* Management compensation plan or agreement
78
Exhibit 10.24
DIRECTOR COMPENSATION SUMMARY
Employee directors receive no additional compensation other than their normal salary for serving on the Board or its committees. The Chairman of the Board receives $130,000 annually. Each non-employee director (other than the Chairman of the Board) receives $55,000 annually. In addition, the Chairman of the Audit Committee receives a $30,000 annual retainer. The Chairmen of the Compensation and the Nominating and Corporate Governance Committees each receive an additional $20,000 annual retainer. Each Audit Committee member (other than the Chairman of the Committee) receives an additional $15,000 annual retainer. Each member of the Compensation and Nominating and Corporate Governance Committees (other than the Chairmen of those Committees) receives an additional $10,000 annual retainer. Outside directors also receive an initial grant, upon first election or appointment, and an annual grant of shares of restricted stock equal to $150,000, except the Chairman of the Board who receives an annual grant of shares of restricted stock equal to $170,000, which valuation is based on the price of Newpark stock on the date of the grant (appointment, election or re-election).
Exhibit 21.1
Subsidiaries
of
Newpark Resources, Inc.
December 31, 2014
|
1. |
NEWPARK MATS & INTEGRATED SERVICES LLC |
|
2. |
DURA-BASE DE MEXICO S.A. DE C.V. |
|
3. |
DURA-BASE NEVADA, INC. |
|
4. |
EXCALIBAR MINERALS LLC |
|
5. |
NEWPARK CANADA, INC. |
|
6. |
NEWPARK CANADA HOLDINGS LIMITED PARTNERSHIP |
|
7. |
NEWPARK CANADA INVESTMENTS LIMITED PARTNERSHIP |
|
8. |
NEWPARK DRILLING FLUIDS LLC |
|
9. |
NEWPARK ENVIRONMENTAL SERVICES MISSISSIPPI, L.P. |
|
10. |
NEWPARK ENVIRONMENTAL WATER SOLUTIONS LLC |
|
11. |
NEWPARK HOLDINGS NOVA SCOTIA CORP. |
|
12. |
NEWPARK INVESTMENTS NOVA SCOTIA CORP. |
|
13. |
NEWPARK TEXAS, L.L.C. |
|
14. |
AVA, S.P.A. |
|
15. |
AVA EASTERN EUROPE D.F.& S., S.R.L. |
|
16. |
AVA AFRICA S.A.R.L. |
|
17. |
AVA DEUTCHLAND GMBH |
|
18. |
AVA TUNISIE S.A.R.L. |
|
19. |
AVA INTERNATIONAL DRILLING FLUIDS LTD. |
|
20. |
AVA ALGERIE E.U.R.L. |
|
21. |
NEWPARK DRILLING FLUIDS do BRASIL TRATAMENTO de FLUIDOS LTDA. |
|
22. |
AVA PANNONIA |
|
23. |
DBM SERVICIOS, S.A. de C.V. |
|
24. |
Newpark Drilling Fluids International LLC |
|
25. |
Newpark Drilling Fluids Personnel Services LLC |
|
26. |
TECHNOLOGY AND ENGINEERING FOR DRILLING Fluids JSC |
|
27. |
NEWPARK LATIN AMERICA LLC |
|
28. |
NEWPARK PERU S.R.L. |
|
29. |
NEWPARK AUSTRALIA PTY LTD |
|
30. |
NEWPARK DRILLING FLUIDS (AUSTRALIA) LIMITED |
|
31. |
PT RHEOCHEM INDONESIA |
|
32. |
NEWPARK DRILLING FLUIDS INDIA PRIVATE LIMITED |
|
33. |
Newpark drilling fluids (new zealand) limited |
|
34. |
Newpark Chile Limitada |
|
35. |
Ava Ukraine, LLC |
|
36. |
terrafirma roadways limited |
|
37. |
NEWPARK DRILLING FLUIDS MIDDLE EAST LIMITED |
EXHIBIT 23.1
CONSENT OF INDEPENDENT REGISTERED PUBLIC ACCOUNTING FIRM
We consent to the incorporation by reference in Registration Statement Nos. 333-07225, 333-39948, 333-106394, 333-118140, 333-141577, 333-161378, 333-156010, 333-174807, 333-189127, and 333-196164 on Form S-8 and Registration Statement Nos. 333-156009 and 333-166776-09 on Form S-3 of our reports dated February 27, 2015 relating to the consolidated financial statements of Newpark Resources, Inc. and subsidiaries, and the effectiveness of Newpark Resources, Inc. and subsidiaries internal control over financial reporting, appearing in this Annual Report on Form 10-K of Newpark Resources, Inc. for the year ended December 31, 2014.
/s/ DELOITTE & TOUCHE LLP
Houston, Texas
February 27, 2015
EXHIBIT 31.1
Certification Pursuant to Section 302 of the Sarbanes-Oxley Act of 2002
I, Paul L. Howes, certify that:
|
1. |
I have reviewed this Annual Report on Form 10-K of Newpark Resources, Inc.; |
|
2. |
Based on my knowledge, this report does not contain any untrue statement of a material fact or omit to state a material fact necessary to make the statements made, in light of the circumstances under which such statements were made, not misleading with respect to the period covered by this report; |
|
3. |
Based on my knowledge, the financial statements, and other financial information included in this report, fairly present in all material respects the financial condition, results of operations and cash flows of the registrant as of, and for, the periods presented in this report; |
|
4. |
The registrant’s other certifying officer(s) and I are responsible for establishing and maintaining disclosure controls and procedures (as defined in Exchange Act Rules 13a-15(e) and 15d-15(e)) and internal control over financial reporting (as defined in Exchange Act Rules 13a-15(f) and 15d-15(f)) for the registrant and have: |
|
(a) |
Designed such disclosure controls and procedures, or caused such disclosure controls and procedures to be designed under our supervision, to ensure that material information relating to the registrant, including its consolidated subsidiaries, is made known to us by others within those entities, particularly during the period in which this report is being prepared; |
|
(b) |
Designed such internal control over financial reporting, or caused such internal control over financial reporting to be designed under our supervision, to provide reasonable assurance regarding the reliability of financial reporting and the preparation of financial statements for external purposes in accordance with generally accepted accounting principles; |
|
(c) |
Evaluated the effectiveness of the registrant’s disclosure controls and procedures and presented in this report our conclusions about the effectiveness of the disclosure controls and procedures, as of the end of the period covered by this report based on such evaluation; and |
|
(d) |
Disclosed in this report any change in the registrant’s internal control over financial reporting that occurred during the registrant’s most recent fiscal quarter (the registrant’s fourth fiscal quarter in the case of an annual report) that has materially affected, or is reasonably likely to materially affect, the registrant’s internal control over financial reporting; and |
|
5. |
The registrant’s other certifying officer(s) and I have disclosed, based on our most recent evaluation of internal control over financial reporting, to the registrant’s auditors and the audit committee of the registrant’s board of directors (or persons performing the equivalent functions): |
|
(a) |
All significant deficiencies and material weaknesses in the design or operation of internal control over financial reporting which are reasonably likely to adversely affect the registrant’s ability to record, process, summarize and report financial information; and |
|
(b) |
Any fraud, whether or not material, that involves management or other employees who have a significant role in the registrant’s internal control over financial reporting. |
|
|
|
| |
|
|
|
|
|
|
|
|
|
|
|
Date: February 27, 2015 |
|
/s/ Paul L. Howes |
|
|
|
|
Paul L. Howes, President and Chief Executive Officer |
|
|
|
|
|
|
EXHIBIT 31.2
Certification Pursuant to Section 302 of the Sarbanes-Oxley Act of 2002
I, Gregg S. Piontek, certify that:
|
1. |
I have reviewed this Annual Report on Form 10-K of Newpark Resources, Inc.; |
|
2. |
Based on my knowledge, this report does not contain any untrue statement of a material fact or omit to state a material fact necessary to make the statements made, in light of the circumstances under which such statements were made, not misleading with respect to the period covered by this report; |
|
3. |
Based on my knowledge, the financial statements, and other financial information included in this report, fairly present in all material respects the financial condition, results of operations and cash flows of the registrant as of, and for, the periods presented in this report; |
|
4. |
The registrant’s other certifying officer(s) and I are responsible for establishing and maintaining disclosure controls and procedures (as defined in Exchange Act Rules 13a-15(e) and 15d-15(e)) and internal control over financial reporting (as defined in Exchange Act Rules 13a-15(f) and 15d-15(f)) for the registrant and have: |
|
(a) |
Designed such disclosure controls and procedures, or caused such disclosure controls and procedures to be designed under our supervision, to ensure that material information relating to the registrant, including its consolidated subsidiaries, is made known to us by others within those entities, particularly during the period in which this report is being prepared; |
|
(b) |
Designed such internal control over financial reporting, or caused such internal control over financial reporting to be designed under our supervision, to provide reasonable assurance regarding the reliability of financial reporting and the preparation of financial statements for external purposes in accordance with generally accepted accounting principles; |
|
(c) |
Evaluated the effectiveness of the registrant’s disclosure controls and procedures and presented in this report our conclusions about the effectiveness of the disclosure controls and procedures, as of the end of the period covered by this report based on such evaluation; and |
|
(d) |
Disclosed in this report any change in the registrant’s internal control over financial reporting that occurred during the registrant’s most recent fiscal quarter (the registrant’s fourth fiscal quarter in the case of an annual report) that has materially affected, or is reasonably likely to materially affect, the registrant’s internal control over financial reporting; and |
|
5. |
The registrant’s other certifying officer(s) and I have disclosed, based on our most recent evaluation of internal control over financial reporting, to the registrant’s auditors and the audit committee of the registrant’s board of directors (or persons performing the equivalent functions): |
|
(a) |
All significant deficiencies and material weaknesses in the design or operation of internal control over financial reporting which are reasonably likely to adversely affect the registrant’s ability to record, process, summarize and report financial information; and |
|
(b) |
Any fraud, whether or not material, that involves management or other employees who have a significant role in the registrant’s internal control over financial reporting. |
|
|
|
| |
|
|
|
|
|
|
|
|
|
|
|
Date: February 27, 2015 |
|
/s/ Gregg S. Piontek |
|
|
|
|
Gregg S. Piontek, Vice President and Chief Financial Officer |
|
|
|
|
|
|
EXHIBIT 32.1
Certification
Pursuant to 18 U.S.C. Section 1350
As Adopted Pursuant to Section 906 of the Sarbanes-Oxley Act of 2002
In connection with the Annual Report on Form 10-K for the period ended December 31, 2014, of Newpark Resources, Inc. (the “Company”), as filed with the Securities and Exchange Commission on the date hereof (the “Report”), I, Paul L. Howes, President and Chief Executive Officer (Principal Executive Officer) of the Company, certify, pursuant to 18 U.S.C. Section 1350, as adopted pursuant to Section 906 of the Sarbanes-Oxley Act of 2002, that:
|
(1) |
The Report fully complies with the requirements of Section 13(a) or 15(d) of the Securities Exchange Act of 1934, as amended; and |
|
(2) |
The information contained in the Report fairly presents, in all material respects, the financial condition and results of operations of the Company. |
|
|
|
| |
|
|
|
|
|
|
Date: February 27, 2015 |
|
/s/ Paul L. Howes |
|
|
|
|
Paul L. Howes, President and Chief Executive Officer |
|
|
|
|
|
|
EXHIBIT 32.2
Certification
Pursuant to 18 U.S.C. Section 1350
As Adopted Pursuant to Section 906 of the Sarbanes-Oxley Act of 2002
In connection with the Annual Report on Form 10-K for the period ended December 31, 2014, of Newpark Resources, Inc. (the “Company”), as filed with the Securities and Exchange Commission on the date hereof (the “Report”), I, Gregg S. Piontek, Vice President and Chief Financial Officer (Principal Financial Officer) of the Company, certify, pursuant to 18 U.S.C. Section 1350, as adopted pursuant to Section 906 of the Sarbanes-Oxley Act of 2002, that:
|
(1) |
The Report fully complies with the requirements of Section 13(a) or 15(d) of the Securities Exchange Act of 1934, as amended; and |
|
(2) |
The information contained in the Report fairly presents, in all material respects, the financial condition and results of operations of the Company. |
|
|
|
|
|
|
|
|
|
|
|
Date: February 27, 2015 |
|
/s/ Gregg S. Piontek |
|
|
|
|
Gregg S. Piontek, Vice President and Chief Financial Officer |
|
|
|
|
|
|
Exhibit 95.1
Under the Dodd-Frank Wall Street Reform and Consumer Protection Act (the “Dodd-Frank Act”), each operator of a coal or other mine is required to include certain mine safety results in its periodic reports filed with the Securities and Exchange Commission (“SEC”). Our subsidiary, Excalibar Minerals LLC (“Excalibar”), engages in the processing of barite ore and is subject to the jurisdiction of the Mine Safety and Health Administration (“MSHA”). For that reason, we are providing below the required mine safety data for the four specialized barite and calcium carbonate grinding facilities operated by Excalibar that are subject to the regulation by MSHA under the Federal Mine Safety and Health Act of 1977 (the “Mine Act”).
As required by the reporting requirements regarding mine safety included in Section 1503 of the Dodd-Frank Act and the SEC’s final rules promulgated thereunder, the table below presents the following information for the twelve months ended December 31, 2014 for each of the specialized facilities operated by our subsidiaries:
|
(a) |
The total number of Mine Act Section 104 significant and substantial citations received, which are for alleged violations of a mining safety standard or regulation where there exists a reasonable likelihood that the hazard could result in an injury or illness of a reasonably serious nature; |
|
(b) |
The total number of Mine Act Section 104(b) orders received, which are for an alleged failure to totally abate the subject matter of a Mine Act Section 104(a) citation within the period specified in the citation; |
|
(c) |
The total number of Mine Act Section 104(d) citations and orders received, which are for an alleged unwarrantable failure to comply with a mining safety standard or regulation; |
|
(d) |
The total number of flagrant violations under Section 110(b)(2) of the Mine Act received; |
|
(e) |
The total number of imminent danger orders issued under Section 107(a) of the Mine Act; |
|
(f) |
The total dollar value of proposed assessments from MSHA under the Mine Act; |
|
(g) |
The total number of mining-related fatalities; |
|
(h) |
Mine Act Section 104(e) written notices for an alleged pattern of violations of mandatory health or safety standards that are of such nature as could have significantly and substantially contributed to the cause and effect of a coal mine health or safety hazard, or the potential to have such a pattern; and |
|
(i) |
The total number of pending legal actions before the Federal Mine Safety and Health Review Commission as required by Section 1503(a)(3) of the Dodd-Frank Act. The number of legal actions pending as of December 31, 2014 that are: |
|
(1) |
contests of citations and orders referenced in Subpart B of 29 CFR Part 2700: |
0 | |
|
|
|
|
|
|
|
(2) |
contests of proposed penalties referenced in Subpart C of 29 CFR Part 2700: |
0 |
|
|
|
|
|
|
|
(3) |
complaints for compensation referenced in Subpart D of 29 CFR Part 2700: |
0 |
|
|
|
|
|
|
|
(4) |
complaints of discharge, discrimination or interference referenced in Subpart E of 29 CFR Part 2700: |
0 |
| (5) | applications for temporary relief referenced in Subpart F of 29 CFR Part 2700 | 0 | |
| (6) | appeals of judges’ decisions or orders to the Federal Mine Safety and Health Review Commission referenced in Subpart H of 29 CFR Part 2700: | 0 |
For the Twelve Months Ended December 31, 2014
|
Mine or Operating Name/MSHA Identification Number |
(A) Citations (#) |
(B) Orders (#) |
(C) Citations and Orders (#) |
(D) Violations (#) |
(E) Orders (#) |
(F) Value of MSHA Assessments Proposed (#) |
(G) Total Number of Mining Related (#) |
(H) Received Notice of Pattern of Violations Under Section 104(e) (yes/no) |
(H) Received Notice of Potential to Have Pattern Under Section 104(e) (yes/no) |
(I) Legal (#) |
(I) Legal Actions Initiated During Period (#) |
(I) Legal Actions Resolved During Period (#) | ||||||
|
Houston Plant /41-04449 |
5 |
– |
– |
– |
– |
$ | 8,013.00 |
– |
No |
No |
– |
– |
– | |||||
|
Dyersburg Plant / 40-03183 |
3 |
– |
– |
– |
– |
$ | 2,838.00 |
– |
No |
No |
– |
– |
– | |||||
|
Excalibar Minerals (New Iberia Plant) / 16-01302 |
0 |
– |
– |
– |
– |
– |
– |
No |
No |
– |
– |
– | ||||||
|
Corpus Christi Plant / |
0 |
– |
– |
– |
– |
– |
– |
No |
No |
– |
– |
– | ||||||
In evaluating the above information regarding mine safety and health, investors should take into account factors such as (i) the number of citations and orders will vary depending on the size of the coal mine or facility, (ii) the number of citations issued will vary from inspector-to-inspector and mine-to-mine, and (iii) citations and orders can be contested and appealed, and in that process, may be reduced in severity and amount, and are sometimes dismissed.
Serious News for Serious Traders! Try StreetInsider.com Premium Free!
You May Also Be Interested In
- NEWPARK RESOURCES ANNOUNCES FIRST QUARTER 2024 RESULTS CONFERENCE CALL AND WEBCAST DATE
- Vaccinologists Keith Klugman and Shabir Madhi Awarded Sabin’s Prestigious Gold Medal; Infectious Diseases Epidemiologist Nicole Basta Receives Rising Star Award
- Alvotech signs U.S. agreement to expand access for newly approved high-concentration interchangeable biosimilar to Humira® (adalimumab)
Create E-mail Alert Related Categories
SEC FilingsSign up for StreetInsider Free!
Receive full access to all new and archived articles, unlimited portfolio tracking, e-mail alerts, custom newswires and RSS feeds - and more!
