

Form 10-K MUELLER INDUSTRIES INC For: Dec 27
 Tweet
Tweet Share
ShareUNITED STATES
SECURITIES AND EXCHANGE COMMISSION
Washington, D.C. 20549
FORM 10-K
ANNUAL REPORT PURSUANT TO SECTION 13 OR 15(d) OF
THE SECURITIES EXCHANGE ACT OF 1934
|
For the fiscal year ended December 27, 2014
|
Commission file number 1–6770
|
MUELLER INDUSTRIES, INC.
(Exact name of registrant as specified in its charter)
|
Delaware
|
25-0790410
|
|
(State or other jurisdiction
|
(I.R.S. Employer
|
|
of incorporation or organization)
|
Identification No.)
|
|
8285 Tournament Drive, Suite 150
|
|
|
Memphis, Tennessee
|
38125
|
|
(Address of principal executive offices)
|
(Zip Code)
|
Registrant’s telephone number, including area code: (901) 753-3200
Securities registered pursuant to Section 12(b) of the Act:
|
Title of each class
|
Name of each exchange on which registered
|
|
Common Stock, $0.01 Par Value
|
New York Stock Exchange
|
Securities registered pursuant to Section 12(g) of the Act: None
Indicate by check mark whether the Registrant is a well-known seasoned issuer, as defined in Rule 405 of the Securities Act. Yes S No £
Indicate by check mark if the Registrant is not required to file reports pursuant to Section 13 or Section 15(d) of the Act. Yes £ No S
Indicate by a check mark whether the Registrant (1) has filed all reports required to be filed by Section 13 or 15(d) of the Securities Exchange Act of 1934 during the preceding 12 months (or for such shorter period that the Registrant was required to file such reports), and (2) has been subject to such filing requirements for the past 90 days. Yes SNo £
Indicate by check mark whether the Registrant has submitted electronically and posted on its corporate Website, if any, every Interactive Data File required to be submitted and posted pursuant to Rule 405 of Regulation S-T (§232.405 of this chapter) during the preceding 12 months (or for such shorter period that the Registrant was required to submit and post such files). Yes SNo £
Indicate by check mark if disclosure of delinquent filers pursuant to Item 405 of Regulation S-K (Section 229.405 of this chapter) is not contained herein, and will not be contained, to the best of Registrant’s knowledge, in definitive proxy or information statements incorporated by reference in Part III of this Form 10-K or any amendment to this Form 10-K. S
Indicate by check mark whether the Registrant is a large accelerated filer, an accelerated filer, a non-accelerated filer, or a smaller reporting company. See the definitions of “large accelerated filer,” “accelerated filer” and “smaller reporting company” in Rule 12b-2 of the Exchange Act.
|
Large accelerated filer S
|
Accelerated filer £
|
|
Non-accelerated filer £
|
Smaller reporting company £
|
Indicate by check mark whether the Registrant is a shell company (as defined in Rule 12b-2 of the Act). Yes £ No S
The aggregate market value of the voting and non-voting common equity held by non-affiliates computed by reference to the price at which the common equity was last sold, or the average bid and asked price of such common equity, as of the last business day of the Registrant’s most recently completed second fiscal quarter was $1,619,095,888.
The number of shares of the Registrant’s common stock outstanding as of February 20, 2015 was 56,924,463 excluding 23,258,541 treasury shares.
DOCUMENTS INCORPORATED BY REFERENCE
Portions of the following document are incorporated by reference into this Report: Registrant’s Definitive Proxy Statement for the 2015 Annual Meeting of Stockholders, scheduled to be mailed on or about March 25, 2015 (Part III).
2
MUELLER INDUSTRIES, INC.
_____________________
As used in this report, the terms “we,” “us,” “our,” “Company,” “Mueller,” and “Registrant” mean Mueller Industries, Inc. and its consolidated subsidiaries taken as a whole, unless the context indicates otherwise.
____________________
|
Page
|
|||
|
4
|
|||
|
7
|
|||
|
10
|
|||
|
10
|
|||
|
13
|
|||
|
13
|
|||
|
13
|
|||
|
16
|
|||
|
16
|
|||
|
17
|
|||
|
17
|
|||
|
17
|
|||
|
17
|
|||
|
20
|
|||
|
20
|
|||
|
20
|
|||
|
21
|
|||
|
21
|
|||
|
21
|
|||
|
22
|
|||
|
25
|
|||
|
F-1
|
|||
3
|
BUSINESS
|
Introduction
Mueller Industries, Inc. (the Company) is a leading manufacturer of plumbing, heating, ventilation, and air-conditioning (HVAC), refrigeration, and industrial products. The range of these products is broad: copper tube and fittings; brass and copper alloy rod, bar, and shapes; aluminum and brass forgings; aluminum and copper impact extrusions; plastic fittings and valves; refrigeration valves and fittings; fabricated tubular products; and steel nipples. The Company also resells imported brass and plastic plumbing valves, malleable iron fittings, faucets and plumbing specialty products. Mueller’s operations are located throughout the United States and in Canada, Mexico, Great Britain, and China.
The Company’s businesses are aggregated into two reportable segments:
|
·
|
Plumbing & Refrigeration: The Plumbing & Refrigeration segment is composed of Standard Products (SPD), European Operations, and Mexican Operations. SPD manufactures and sells copper tube, copper and plastic fittings, line sets, and valves in North America and sources products for import distribution in North America. European Operations manufacture copper tube in the United Kingdom, which is sold throughout Europe. Mexican Operations consist of pipe nipple manufacturing and import distribution businesses including product lines of malleable iron fittings and other plumbing specialties. The Plumbing & Refrigeration segment sells products to wholesalers in the HVAC, plumbing, and refrigeration markets, to distributors to the manufactured housing and recreational vehicle industries, and to building material retailers.
|
|
·
|
Original Equipment Manufacturers (OEM): The OEM segment is composed of Industrial Products (IPD), Engineered Products (EPD), and Jiangsu Mueller–Xingrong Copper Industries Limited (Mueller-Xingrong), the Company’s Chinese joint venture. The OEM segment manufactures and sells brass and copper alloy rod, bar, and shapes; aluminum and brass forgings; aluminum and copper impact extrusions; refrigeration valves, fittings, and components; fabricated tubular products; and gas valves and assemblies. Mueller-Xingrong manufactures engineered copper tube primarily for air-conditioning applications; these products are sold primarily to OEMs located in China. The OEM segment sells its products primarily to original equipment manufacturers, many of which are in the HVAC, plumbing, and refrigeration markets.
|
Certain administrative expenses and expenses related primarily to retiree benefits at inactive operations are combined into the Corporate and Eliminations classification.
Financial information concerning segments and geographic information appears under “Note 15 - Industry Segments” in the Notes to Consolidated Financial Statements, which is incorporated herein by reference.
New housing starts and commercial construction are important determinants of the Company’s sales to the HVAC, refrigeration, and plumbing markets because the principal end use of a significant portion of our products is in the construction of single and multi-family housing and commercial buildings. Repairs and remodeling projects are also important drivers of underlying demand for these products.
Mueller was incorporated in Delaware on October 3, 1990.
Plumbing & Refrigeration Segment
The Plumbing & Refrigeration segment includes SPD, which manufactures a broad line of copper tube in sizes ranging from 1/8 inch to 8 inch diameter that is sold in various straight lengths and coils. We are a market leader in the air-conditioning and refrigeration service tube markets. Additionally, we supply a variety of water tube in straight lengths and coils used for plumbing applications in virtually every type of construction project. Lastly, SPD manufactures copper and plastic fittings, line sets, and related components for the plumbing and heating industry that are used in water distribution systems, heating systems, air-conditioning, and refrigeration applications, and drainage, waste, and vent systems. A major portion of SPD’s products are ultimately used in the domestic residential and commercial construction markets.
4
This segment also fabricates steel pipe nipples and resells imported brass and plastic plumbing valves, malleable iron fittings, faucets, and plumbing specialty products to plumbing wholesalers, distributors to the manufactured housing and recreational vehicle industries and building materials retailers.
On August 6, 2010, we expanded our existing line sets business by purchasing certain assets from Linesets, Inc., a manufacturer of assembled line sets with operations in Phoenix, Arizona and Atlanta, Georgia.
We acquired Howell Metal Company (Howell) on October 17, 2013 and Yorkshire Copper Tube (Yorkshire) on February 28, 2014. Howell manufactures copper tube and line sets for U.S. distribution while Yorkshire produces European standard copper distribution tubes. These acquisitions complement our existing copper tube businesses in the Plumbing & Refrigeration segment.
We disposed of Mueller Primaflow Limited (Primaflow), our U.K. based plumbing and heating systems import distribution business, on November 21, 2014. This business was part of the European Operations in the Plumbing & Refrigeration segment.
This segment markets primarily through its own sales and distribution organization, which maintains sales offices and distribution centers throughout the United States and in Canada, Mexico, and Europe. Additionally, products are sold and marketed through a complement of agents, which, when combined with our sales organization, provide the Company broad geographic market representation.
The total amount of order backlog for the Plumbing & Refrigeration segment as of December 27, 2014 was not significant.
We compete with various companies, depending on the product line. In the U.S. copper tube business, domestic competition includes Cerro Flow Products LLC, Cambridge-Lee Industries LLC (a subsidiary of Industrias Unidas S.A. de C.V.), and KobeWieland Copper Products LLC, as well as many actual and potential foreign competitors. In the European copper tube business, we compete with several European-based manufacturers of copper tube as well as other foreign-based manufacturers. In the copper fittings market, domestic competitors include Elkhart Products Company (a subsidiary of Aalberts Industries N.V.) and NIBCO, Inc., as well as several foreign manufacturers. Additionally, our copper tube and fittings businesses compete with a large number of manufacturers of substitute products made from other metals and plastic. The plastic fittings competitors include NIBCO, Inc., Charlotte Pipe & Foundry, and other companies. Management believes that no single competitor offers such a wide-ranging product line as Mueller and that this is a competitive advantage in some markets.
OEM Segment
The OEM segment includes IPD, which manufactures brass rod, nonferrous forgings, and impact extrusions that are sold primarily to OEMs in the plumbing, refrigeration, fluid power, and automotive industries, as well as to other manufacturers and distributors. We extrude brass, bronze, and copper alloy rod in sizes ranging from 3/8 inches to 4 inches in diameter. These alloys are used in applications that require a high degree of machinability, wear and corrosion resistance, as well as electrical conductivity. IPD also manufactures brass and aluminum forgings, which are used in a wide variety of products, including automotive components, brass fittings, industrial machinery, valve bodies, gear blanks, and computer hardware. Lastly, IPD serves the automotive, military ordnance, aerospace, and general manufacturing industries with cold-formed aluminum and copper impact extrusions. Typical applications for impacts are high strength ordnance, high-conductivity electrical components, builders’ hardware, hydraulic systems, automotive parts, and other uses where toughness must be combined with varying complexities of design and finish.
This segment also includes EPD, which manufactures and fabricates valves and custom OEM products for refrigeration and air-conditioning, gas appliance, and barbecue grill applications. Additionally, EPD manufactures shaped and formed tube produced to tight tolerances for baseboard heating, appliances, and medical instruments. The total amount of order backlog for the OEM segment as of December 27, 2014 was not significant.
On December 28, 2010, we purchased certain assets from Tube Forming, L.P. (TFI). TFI had operations in Carrolton, Texas, and Guadalupe, Mexico, where it produced precision copper return bends and crossovers, and custom-made tube components and brazed assemblies, including manifolds and headers.
5
On August 16, 2012, we acquired 100 percent of the outstanding stock of Westermeyer Industries, Inc. (Westermeyer), located in Bluffs, Illinois. Westermeyer designs, manufactures, and distributes high-pressure components and accessories for the air-conditioning and refrigeration markets. The acquisition of Westermeyer complements the Company’s existing refrigeration business.
IPD and EPD primarily sell directly to OEM customers. Competitors, primarily in the brass rod market, include Chase Brass and Copper Company, a subsidiary of Global Brass and Copper Holdings, Inc., and others, both domestic and foreign. Outside of North America, IPD and EPD sell products through various channels.
Labor Relations
At December 27, 2014, the Company employed approximately 3,850 employees, of which approximately 2,020 were represented by various unions. Those union contracts will expire as follows:
|
Location
|
Expiration Date
|
|
Port Huron, Michigan (Local 218 IAM)
|
May 1, 2016
|
|
Port Huron, Michigan (Local 44 UAW)
|
July 20, 2016
|
|
Port Huron, Michigan (Local 119 SPFPA)
|
April 1, 2016
|
|
Belding, Michigan
|
September 12, 2015
|
|
Brighton, Michigan
|
July 31, 2015
|
|
Wynne, Arkansas
|
June 28, 2015
|
|
Fulton, Mississippi
|
October 31, 2017
|
|
North Wales, Pennsylvania
|
July 31, 2015
|
|
Waynesboro, Tennessee
|
November 7, 2015
|
The union agreements at the Company’s U.K. and Mexico operations are renewed annually. The Company expects to renew its union contracts without material disruption of its operations.
Raw Material and Energy Availability
A substantial portion of our base metal requirements (primarily copper) is normally obtained through short-term supply contracts with competitive pricing provisions (for cathode) and the open market (for scrap). Other raw materials used in the production of brass, including brass scrap, zinc, tin, and lead are obtained from zinc and lead producers, open-market dealers, and customers with brass process scrap. Raw materials used in the fabrication of aluminum and plastic products are purchased in the open market from major producers.
Adequate supplies of raw material have historically been available to us from primary producers, metal brokers, and scrap dealers. Sufficient energy in the form of natural gas, fuel oils, and electricity is available to operate our production facilities. While temporary shortages of raw material and fuels may occur occasionally, to date they have not materially hampered our operations.
Our copper tube facilities can accommodate both refined copper and certain grades of copper scrap as the primary feedstock. The Company has commitments from refined copper producers for a portion of its metal requirements for 2015. Adequate quantities of copper are currently available. While we will continue to react to market developments, resulting pricing volatility or supply disruptions, if any, could nonetheless adversely affect the Company.
6
Environmental Proceedings
Compliance with environmental laws and regulations is a matter of high priority for the Company. Mueller’s provision for environmental matters related to all properties was $1.2 million for 2014, $1.0 million for 2013, and $3.1 million for 2012. The reserve for environmental matters was $22.7 million at December 27, 2014 and $23.6 million at December 28, 2013. Environmental costs related to non-operating properties are classified as a component of other income, net and costs related to operating properties are included in cost of goods sold. We do not anticipate that we will need to make material expenditures for compliance activities related to existing environmental matters during the 2015 fiscal year, or for the next two fiscal years.
For a description of material pending environmental proceedings, see “Note 8 – Commitments and Contingencies” in the Notes to Consolidated Financial Statements, which is incorporated herein by reference.
Other Business Factors
Our business is not materially dependent on patents, trademarks, licenses, franchises, or concessions held. In addition, expenditures for company-sponsored research and development activities were not material during 2014, 2013, or 2012. No material portion of our business involves governmental contracts. Seasonality of the Company’s sales is not significant.
SEC Filings
We make available through our internet website our Annual Report on Form 10-K, Quarterly Reports on Form 10-Q, Current Reports on Form 8-K, and amendments to those reports filed or furnished pursuant to Section 13(a) or 15(d) of the Exchange Act as soon as reasonably practicable after we electronically file such material with, or furnish it to, the Securities and Exchange Commission (SEC). To retrieve any of this information, you may access our internet home page at www.muellerindustries.com, select Investors, and then select SEC Filings.
Reports filed with the SEC may also be viewed or obtained at the SEC Public Reference Room at 100 F Street, N.E., Washington, D.C. 20549. Information on the operation of the SEC Public Reference Room may be obtained by calling the SEC at 1-800-SEC-0330. The SEC maintains a website that contains reports, proxy and information statements, and other information regarding issuers that file electronically with the SEC; the website address is www.sec.gov.
|
ITEM 1A.
|
RISK FACTORS
|
The Company is exposed to risk as it operates its businesses. To provide a framework to understand our operating environment, we are providing a brief explanation of the more significant risks associated with our businesses. Although we have tried to identify and discuss key risk factors, others could emerge in the future. These risk factors should be considered carefully when evaluating the Company and its businesses.
Increases in costs and the availability of energy and raw materials used in our products could impact our cost of goods sold and our distribution expenses, which could have a material adverse impact on our operating margins.
Both the costs of raw materials used in our manufactured products (copper, brass, zinc, aluminum, and PVC and ABS resins) and energy costs (electricity, natural gas and fuel) have been volatile during the last several years, which has resulted in changes in production and distribution costs. For example, recent and pending climate change regulation and initiatives on the state, regional, federal, and international levels that have focused on reducing greenhouse gas (GHG) emissions from the energy and utility sectors may affect energy availability and costs in the near future. While we typically attempt to pass costs through to our customers or to modify or adapt our activities to mitigate the impact of increases, we may not be able to do so successfully. Failure to fully pass increases to our customers or to modify or adapt our activities to mitigate the impact could have a material adverse impact on our operating margins. Additionally, if we are for any reason unable to obtain raw materials or energy, our ability to manufacture our products would be impacted, which could have a material adverse impact on our operating margins.
7
The unplanned departure of key personnel could disrupt our business.
We depend on the continued efforts of our senior management. The unplanned loss of key personnel, or the inability to hire and retain qualified executives, could negatively impact our ability to manage our business.
Economic conditions in the housing and commercial construction industries, as well as changes in interest rates, could have a material adverse impact on our business, financial condition, and results of operations.
Our business is sensitive to changes in general economic conditions, particularly in the housing and commercial construction industries. Prices for our products are affected by overall supply and demand in the market for our products and for our competitors’ products. In particular, market prices of building products historically have been volatile and cyclical, and we may be unable to control the timing and extent of pricing changes for our products. Prolonged periods of weak demand or excess supply in any of our businesses could negatively affect our revenues and margins and could result in a material adverse impact on our business, financial condition, and results of operations.
The markets that we serve, including, in particular, the housing and commercial construction industries, are significantly affected by movements in interest rates and the availability of credit. Significantly higher interest rates could have a material adverse effect on our business, financial condition, and results of operations. Our businesses are also affected by a variety of other factors beyond our control, including, but not limited to, employment levels, foreign currency exchange rates, unforeseen inflationary pressures, and consumer confidence. Since we operate in a variety of geographic areas, our businesses are subject to the economic conditions in each such area. General economic downturns or localized downturns in the regions where we have operations could have a material adverse effect on our business, financial condition, and results of operations.
Although conditions improved in 2012 and continued to improve in 2013 and 2014, the deterioration of the general economic environment has had a significant negative impact on businesses and consumers around the world since the crisis began in 2008. In addition, the impact of the economy on the operations or liquidity of any party with which we conduct our business, including our suppliers and customers, may adversely impact our business.
Competitive conditions, including the impact of imports and substitute products and technologies, could have a material adverse effect on the demand for our products as well as our margins and profitability.
The markets we serve are competitive across all product lines. Some consolidation of customers has occurred and may continue, which could shift buying power to customers. In some cases, customers have moved production to low-cost countries such as China, or sourced components from there, which has reduced demand in North America for some of the products we manufacture. These conditions could have a material adverse impact on our ability to maintain margins and profitability. The potential threat of imports and substitute products is based upon many factors, including raw material prices, distribution costs, foreign exchange rates, production costs, and the development of emerging technologies and applications. The end use of alternative import and/or substitute products could have a material adverse effect on our business, financial condition, and results of operations. Likewise, the development of new technologies and applications could result in lower demand for our products and have a material adverse effect on our business.
Our exposure to exchange rate fluctuations on cross border transactions and the translation of local currency results into U.S. dollars could have an adverse impact on our results of operations or financial position.
We conduct our business through subsidiaries in several different countries and export our products to many countries. Fluctuations in currency exchange rates could have a significant impact on the competitiveness of our products as well as the reported results of our operations, which are presented in U.S. dollars. A significant and growing portion of our products are manufactured in or acquired from suppliers located in lower cost regions. Cross border transactions, both with external parties and intercompany relationships, result in increased exposure to foreign exchange fluctuations. The strengthening of the U.S. dollar could expose our U.S. based businesses to competitive threats from lower cost producers in other countries such as China. Lastly, our sales are translated into U.S. dollars for reporting purposes. The strengthening of the U.S. dollar could result in unfavorable translation effects when the results of foreign operations are translated into U.S. dollars. Accordingly, significant changes in exchange rates, particularly the British pound sterling, Mexican peso, and the Chinese renminbi, could have an adverse impact on our results of operations or financial position.
8
We are subject to claims, litigation, and regulatory proceedings that could have a material adverse effect on us.
We are, from time-to-time, involved in various claims, litigation matters, and regulatory proceedings. These matters may include contract disputes, personal injury claims, environmental claims, OSHA inspections or proceedings, other tort claims, employment and tax matters and other litigation including class actions that arise in the ordinary course of our business. Although we intend to defend these matters vigorously, we cannot predict with certainty the outcome or effect of any claim or other litigation matter, and there can be no assurance as to the ultimate outcome of any litigation or regulatory proceeding. Litigation and regulatory proceedings may have a material adverse effect on us because of potential adverse outcomes, defense costs, the diversion of our management’s resources, availability of insurance coverage and other factors.
A strike, other work stoppage or business interruption, or our inability to renew collective bargaining agreements on favorable terms, could impact our cost structure and our ability to operate our facilities and produce our products, which could have an adverse effect on our results of operations.
As of December 27, 2014, approximately 2,020 of our 3,850 employees were covered by collective bargaining or similar agreements. If we are unable to negotiate acceptable new agreements with the unions representing our employees upon expiration of existing contracts, we could experience strikes or other work stoppages. Strikes or other work stoppages could cause a significant disruption of operations at our facilities, which could have an adverse impact on us. New or renewal agreements with unions representing our employees could call for higher wages or benefits paid to union members, which would increase our operating costs and could adversely affect our profitability. Higher costs and/or limitations on our ability to operate our facilities and manufacture our products resulting from increased labor costs, strikes or other work stoppages could have a material adverse effect on our results of operations.
In addition, unexpected interruptions in our operations or those of our customers or suppliers due to such causes as weather-related events or acts of God, such as earthquakes, could have an adverse effect on our results of operations. For example, the Environmental Protection Agency (EPA) has found that global climate change would be expected to increase the severity and possibly the frequency of severe weather patterns such as hurricanes. Although the financial impact of such future events is not reasonably estimable at this time, should they occur, our operations in certain coastal and flood-prone areas or operations of our customers and suppliers could be adversely affected. As a result of a fire at our Wynne, Arkansas, location, our copper tube casting operations were destroyed and consequently a significant portion of our redundant casting capacity is no longer available. If our remaining copper tube casting operations were to become inoperable, for any reason, our domestic copper tube production could be significantly impaired and have a material adverse effect on our results of operations.
We are subject to environmental, health, and safety laws and regulations and future compliance may have a material adverse effect on our results of operations, financial position, or cash flows.
The nature of our operations exposes us to the risk of liabilities and claims with respect to environmental, health, and safety matters. While we have established accruals intended to cover the cost of environmental remediation at contaminated sites, the actual cost is difficult to determine and may exceed our estimated reserves. Further, changes to, or more rigorous enforcement or stringent interpretation of environmental or health and safety laws could require significant incremental costs to maintain compliance. Recent and pending climate change regulation and initiatives on the state, regional, federal, and international levels may require certain of our facilities to reduce GHG emissions. While not reasonably estimable at this time, this could require capital expenditures for environmental control facilities and/or the purchase of GHG emissions credits in the coming years. In addition, with respect to environmental matters, future claims may be asserted against us for, among other things, past acts or omissions at locations operated by predecessor entities, or alleging damage or injury or seeking other relief in connection with environmental matters associated with our operations. Future liabilities, claims, and compliance costs may have a material adverse effect on us because of potential adverse outcomes, defense costs, diversion of our resources, availability of insurance coverage, and other factors. The overall impact of these requirements on our operations could increase our costs and diminish our ability to compete with products that are produced in countries without such rigorous standards; the long run impact could negatively impact our results and have a material adverse effect on our business.
9
|
ITEM 1B.
|
UNRESOLVED STAFF COMMENTS
|
None.
|
ITEM 2.
|
PROPERTIES
|
Information pertaining to our major operating facilities is included below. Except as noted, we own all of the principal properties. Our plants are in satisfactory condition and are suitable for the purpose for which they were designed and are now being used.
|
Location
|
Approximate Property Size
|
Description
|
||
|
Plumbing & Refrigeration Segment
|
||||
|
Fulton, MS
|
418,000 sq. ft.
52.37 acres
|
Copper tube mill. Facility includes extruding and finishing equipment to produce copper tube, including tube feedstock for the Company’s copper fittings plants, line sets, and Precision Tube factory.
|
||
|
Fulton, MS
|
103,000 sq. ft.
11.9 acres
|
Casting facility. Facility includes casting equipment to produce copper billets used in the adjoining copper tube mill.
|
||
|
Wynne, AR
|
400,000 sq. ft.
39.2 acres
|
(1)
|
Copper tube mill. Facility includes extrusion and finishing equipment to produce copper tube and line sets.
|
|
|
Fulton, MS
|
58,500 sq. ft.
15.53 acres
|
Packaging and bar coding facility for retail channel sales.
|
||
|
Fulton, MS
|
70,000 sq. ft.
7.68 acres
|
(2)
|
Copper fittings plant. High-volume facility that produces copper fittings using tube feedstock from the Company’s adjacent copper tube mill.
|
|
|
Covington, TN
|
159,500 sq. ft.
40.88 acres
|
Copper fittings plant. Facility produces copper fittings using tube feedstock from the Company’s copper tube mills.
|
||
|
Ontario, CA
|
211,000 sq. ft.
|
(3)
|
Plastics manufacturing plant and distribution center. Produces DWV fittings using injection molding equipment.
|
|
|
Monterrey, Mexico
|
152,000 sq. ft.
|
(3)
|
Pipe nipples plant. Produces pipe nipples, cut pipe and merchant couplings.
|
|
|
Bilston, England, United Kingdom
|
402,500 sq. ft.
14.95 acres
|
Copper tube mill. Facility includes casting, extruding, and finishing equipment to produce copper tube.
|
||
(continued)
|
ITEM 2.
|
PROPERTIES
|
|
(continued)
|
||||
|
Location
|
Approximate Property Size
|
Description
|
||
|
Phoenix, AZ
|
61,000 sq. ft.
|
(3)
|
Line sets plant. Produces standard and custom-made line sets for HVAC markets.
|
|
|
Atlanta, GA
|
56,000 sq. ft.
|
(3)
|
Line sets plant. Produces standard and custom-made line sets for HVAC markets.
|
|
|
New Market, VA
|
413,120 sq. ft.
36.15 acres
|
Copper Tube Mill. Facility includes casting, extruding, and finishing equipment to produce copper tube and line sets.
|
|
OEM Segment
|
||||
|
Port Huron, MI
|
322,500 sq. ft.
71.5 acres
|
Brass rod mill. Facility includes casting, extruding, and finishing equipment to produce brass rods and bars, in various shapes and sizes.
|
||
|
Belding, MI
|
293,068 sq. ft.
17.64 acres
|
Brass rod and copper busbar mill. Facility includes casting, extruding, and finishing equipment to produce brass rods and bars, in various shapes and sizes.
|
||
|
Port Huron, MI
|
127,500 sq. ft.
|
Forgings plant. Produces brass and aluminum forgings.
|
||
|
Marysville, MI
|
81,500 sq. ft.
6.72 acres
|
Aluminum and copper impacts plant. Produces made-to-order parts using cold impact processes.
|
||
|
Hartsville, TN
|
78,000 sq. ft.
4.51 acres
|
Refrigeration products plant. Produces products used in refrigeration applications such as ball valves, line valves, and compressor valves.
|
||
|
Carthage, TN
|
67,520 sq. ft.
10.98 acres
|
Fabrication facility. Produces precision tubular components and assemblies.
|
||
|
Gordonsville, TN
|
54,000 sq. ft.
|
(3)
|
Fabrication facility. Produces precision tubular components and assemblies.
|
|
|
Waynesboro, TN
|
57,000 sq. ft.
5.0 acres
|
(4)
|
Gas valve plant. Facility produces brass and aluminum valves and assemblies for the gas appliance industry.
|
|
|
North Wales, PA
|
174,000 sq. ft.
18.9 acres
|
Precision Tube factory. Facility fabricates copper tube, copper alloy tube, aluminum tube, and fabricated tubular products.
|
||
|
Brighton, MI
|
65,000 sq. ft.
|
(3)
|
Machining operation. Facility machines component parts for supply to automotive industry.
|
|
|
Middletown, OH
|
55,000 sq. ft.
2.0 acres
|
Fabricating facility. Produces burner systems and manifolds for the gas appliance industry.
|
(continued)
11
|
ITEM 2.
|
PROPERTIES
|
||||||
|
(continued)
|
||||
|
Location
|
Approximate Property Size
|
Description
|
||
|
Jintan City, Jiangsu Province, China
|
322,580 sq. ft.
33.0 acres
|
(5)
|
Copper tube mill. Facility includes casting, and finishing equipment to produce engineered copper tube primarily for OEMs.
|
|
|
Xinbei District, Changzhou, China
|
33,940 sq. ft.
|
(3)
|
Refrigeration products plant. Produces products used in refrigeration applications such as ball valves, line valves, and compressor valves.
|
|
|
Bluffs, IL
|
70,000 sq. ft.
10 acres
|
Fabrication facility. Produces products used in refrigeration applications such as oil separators, accumulators, and heat exchangers.
|
||
|
Guadalupe, MX
|
70,782 sq. ft.
|
(3)
|
Fabrication facility. Produces tubular components, assemblies, and return bends for refrigeration and HVAC markets.
|
|
|
Guadalupe, MX
|
59,331 sq. ft.
|
(3)
|
Gas valve plant. Facility produces brass and aluminum valves and assemblies for the gas appliance industry.
|
|
|
Farmers Branch, TX
|
54,000 sq. ft.
|
(3)
|
Fabrication facility. Produces tubular components, assemblies, and return bends for refrigeration and HVAC markets.
|
|
In addition, we own and/or lease other properties used as distribution centers and corporate offices.
|
|
(1) Facility, or some portion thereof, is located on land leased from a local municipality, with an option to purchase at nominal
cost.
|
|
|
(2) Facility is leased under a long-term lease agreement, with an option to purchase at nominal cost.
|
|
|
(3) Facility is leased under an operating lease.
|
|
|
(4) Facility is leased from a local municipality for a nominal amount.
|
|
|
(5) Facility is located on land that is under a long-term land use rights agreement.
|
12
|
ITEM 3.
|
LEGAL PROCEEDINGS
|
The Company is involved in certain litigation as a result of claims that arose in the ordinary course of business. Additionally, the Company may realize the benefit of certain legal claims and litigation in the future; these gain contingencies are not recognized in the Consolidated Financial Statements.
For a description of material pending legal proceedings, see “Note 8 – Commitments and Contingencies” in the Notes to Consolidated Financial Statements, which is incorporated herein by reference.
|
ITEM 4.
|
MINE SAFETY DISCLOSURES
|
Not applicable.
PART II
|
ITEM 5.
|
MARKET FOR REGISTRANT’S COMMON EQUITY, RELATED STOCKHOLDER MATTERS AND ISSUER PURCHASES OF EQUITY SECURITIES
|
Our common stock is listed on the New York Stock Exchange (NYSE) under the symbol “MLI.” As of February 20, 2015, the number of holders of record of Mueller’s common stock was approximately 855. The following table sets forth, for the periods indicated, the high and low sales prices as reported by the NYSE and the cash dividends paid per share of common stock.
On February 21, 2014, the Company effected a two-for-one stock split to shareholders of record as of March 14, 2014. All share and per share information has been retroactively adjusted to reflect the stock split.
|
Sales Prices
|
||||||||||||
|
High
|
Low
|
Dividend
|
||||||||||
|
2014
|
||||||||||||
|
Fourth quarter
|
$
|
34.39
|
$
|
27.10
|
$
|
0.0750
|
||||||
|
Third quarter
|
30.35
|
27.71
|
0.0750
|
|||||||||
|
Second quarter
|
30.99
|
27.47
|
0.0750
|
|||||||||
|
First quarter
|
32.13
|
27.38
|
0.0750
|
|||||||||
|
2013
|
||||||||||||
|
Fourth quarter
|
$
|
31.64
|
$
|
26.98
|
$
|
0.0625
|
||||||
|
Third quarter
|
29.08
|
25.17
|
0.0625
|
|||||||||
|
Second quarter
|
27.50
|
24.05
|
0.0625
|
|||||||||
|
First quarter
|
27.77
|
24.48
|
0.0625
|
|||||||||
Payment of dividends in the future is dependent upon the Company’s financial condition, cash flows, capital requirements, earnings, and other factors.
Issuer Purchases of Equity Securities
The Company’s Board of Directors has extended, until October 2015, the authorization to repurchase up to 20 million shares of the Company’s common stock through open market transactions or through privately negotiated transactions. The Company has no obligation to purchase any shares and may cancel, suspend, or extend the time period for the purchase of shares at any time. Any purchases will be funded primarily through existing cash and cash from operations. The Company may hold any shares purchased in treasury or use a portion of the repurchased shares for its stock-based compensation plans, as well as for other corporate purposes. From its initial authorization in 1999 through December 27, 2014, the Company had repurchased approximately 4.7 million shares under this authorization. Below is a summary of the Company’s stock repurchases for the quarter ended December 27, 2014.
|
(a)
|
(b)
|
(c)
|
(d)
|
||||||||
|
Total Number of Shares Purchased
|
Average Price Paid per Share
|
Total Number of Shares Purchased as Part of Publicly Announced Plans or Programs
|
Maximum Number of Shares That May Yet Be Purchased Under the Plans or Programs
|
||||||||
|
15,287,060
|
(1)
|
||||||||||
|
September 28 – October 25, 2014
|
359
|
(2)
|
$
|
29.45
|
—
|
||||||
|
October 26 – November 22, 2014
|
2,384
|
(2)
|
32.05
|
—
|
|||||||
|
November 23 – December 27, 2014
|
579
|
(2)
|
32.92
|
—
|
|||||||
|
(1)
|
Shares available to be purchased under the Company’s 20 million share repurchase authorization until October 2015. The extension of the authorization was announced on October 24, 2014.
|
||||||||||
|
(2)
|
Shares tendered to the Company by holders of stock based awards in payment of purchase price and/or withholding taxes upon exercise. In addition, includes restricted stock forfeitures.
|
||||||||||
14
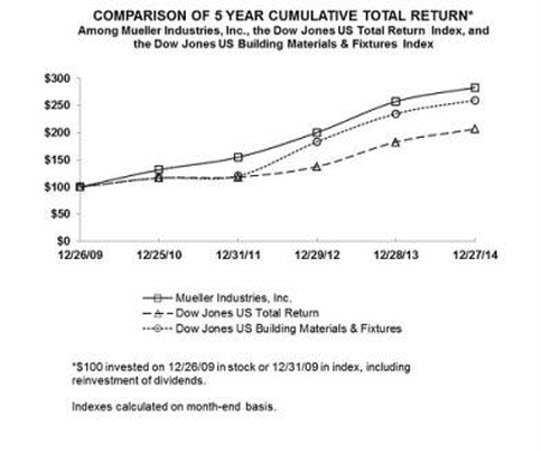
Company Stock Performance
The following graph compares total stockholder return since December 26, 2009 to the Dow Jones U.S. Total Market Index (Total Market Index) and the Dow Jones U.S. Building Materials & Fixtures Index (Building Materials Index). Total return values for the Total Market Index, the Building Materials Index and the Company were calculated based on cumulative total return values assuming reinvestment of dividends.
|
2009
|
2010
|
2011
|
2012
|
2013
|
2014
|
|||||||||||||||||||
|
Mueller Industries, Inc.
|
100.00
|
131.64
|
154.72
|
200.26
|
257.35
|
283.15
|
||||||||||||||||||
|
Dow Jones U.S. Total Return Index
|
100.00
|
116.65
|
118.22
|
137.52
|
182.86
|
206.53
|
||||||||||||||||||
|
Dow Jones U.S. Building Materials & Fixtures Index
|
100.00
|
116.70
|
120.39
|
183.24
|
234.92
|
259.74
|
||||||||||||||||||
15
|
ITEM 6.
|
SELECTED FINANCIAL DATA
|
|
(In thousands, except per share data)
|
2014
|
2013
|
2012
|
2011
|
2010
|
||||||||||||||
|
For the fiscal year: (1)
|
|||||||||||||||||||
|
Net sales
|
$
|
2,364,227
|
$
|
2,158,541
|
$
|
2,189,938
|
$
|
2,417,797
|
$
|
2,059,797
|
|||||||||
|
Operating income
|
153,996
|
270,937
|
(3)
|
126,705
|
(4)
|
139,802
|
(5)
|
136,147
|
(6)
|
||||||||||
|
|
|||||||||||||||||||
|
Net income attributable to Mueller Industries, Inc.
|
101,560
|
(2)
|
172,600
|
82,395
|
86,321
|
86,171
|
|||||||||||||
|
Diluted earnings per share (8)
|
1.79
|
3.06
|
1.16
|
(7)
|
1.13
|
1.14
|
|||||||||||||
|
Cash dividends per share (8)
|
0.30
|
0.25
|
0.2125
|
0.20
|
0.20
|
||||||||||||||
|
At year-end:
|
|||||||||||||||||||
|
Total assets
|
1,328,096
|
1,247,767
|
1,104,155
|
1,347,604
|
1,258,996
|
||||||||||||||
|
Long-term debt
|
205,250
|
206,250
|
207,300
|
156,476
|
158,226
|
||||||||||||||
|
(1)
|
Includes activity of acquired businesses from the following purchase dates: Yorkshire Copper Tube, February 28, 2014, Howell Metal Company, October 17, 2013, Westermeyer Industries, Inc., August 16, 2012, Tube Forming L.P., December 28, 2010, and Linesets, Inc., August 6, 2010.
|
|||
|
(2)
|
Includes $6.3 million pre-tax gain on sale of assets, reversal of valuation allowance of $5.7 million, and $7.3 million of pre-tax charges related to severance.
|
|||
|
(3)
|
Includes $106.3 million pre-tax gain from settlement of insurance claims, $39.8 million pre-tax gain from the sale of the Company’s Schedule 40 pressure plastic fittings business along with the sale of certain other plastic fittings manufacturing assets, and pre-tax impairment charges of $4.3 million primarily related to real property associated with the aforementioned plastics sale transaction.
|
|||
|
(4)
|
Includes deferred recognition of $8.0 million gain from liquidation of LIFO inventory layers, $4.1 million net gain from settlement of litigation, $1.5 million gain from settlement of insurance claims, and severance charges of $3.4 million.
|
|||
|
(5)
|
Includes $10.5 million gain from settlement of litigation.
|
|||
|
(6)
|
Includes $22.7 million gain from settlement of insurance claims.
|
|||
|
(7)
|
Includes the impact of 10.4 million shares repurchased from Leucadia National Corporation in September 2012.
|
|||
|
(8)
|
Adjusted retroactively to reflect the two-for-one stock split that occurred on March 14, 2014.
|
|
MANAGEMENT’S DISCUSSION AND ANALYSIS OF FINANCIAL CONDITION AND RESULTS OF OPERATIONS
|
Management’s discussion and analysis of financial condition and results of operations is contained under the caption “Financial Review” submitted as a separate section of this Annual Report on Form 10-K commencing on page F-2.
16
|
ITEM 7A.
|
QUANTITATIVE AND QUALITATIVE DISCLOSURES ABOUT MARKET RISK
|
Quantitative and qualitative disclosures about market risk are contained under the caption “Financial Review” submitted as a separate section of this Annual Report on Form 10-K commencing on page F-2.
|
FINANCIAL STATEMENTS AND SUPPLEMENTARY DATA
|
Financial Statements required by this item are contained in a separate section of this Annual Report on Form 10-K commencing on page F-15.
|
CHANGES IN AND DISAGREEMENTS WITH ACCOUNTANTS ON ACCOUNTING AND FINANCIAL DISCLOSURE
|
None.
|
CONTROLS AND PROCEDURES
|
Evaluation of Disclosure Controls and Procedures
The Company maintains disclosure controls and procedures designed to ensure information required to be disclosed in Company reports filed under the Securities Exchange Act of 1934, as amended (the Exchange Act), is recorded, processed, summarized, and reported within the time periods specified in the SEC’s rules and forms. Disclosure controls and procedures are designed to provide reasonable assurance that information required to be disclosed in Company reports filed under the Exchange Act is accumulated and communicated to management, including the Company’s Chief Executive Officer and Chief Financial Officer, as appropriate, to allow timely decisions regarding required disclosure.
The Company’s management, with the participation of the Company’s Chief Executive Officer and Chief Financial Officer, has evaluated the effectiveness of the Company’s disclosure controls and procedures pursuant to Rule 13a-15(e) of the Exchange Act as of December 27, 2014. Based on that evaluation, the Company’s Chief Executive Officer and Chief Financial Officer have concluded that the Company’s disclosure controls and procedures are effective as of December 27, 2014 to ensure that information required to be disclosed in Company reports filed under the Exchange Act is (i) recorded, processed, summarized and reported within the time periods specified in the SEC rules and forms and (ii) accumulated and communicated to management, including the Company’s principal executive officer and principal financial officer, as appropriate to allow timely decisions regarding required disclosure.
Management’s Report on Internal Control over Financial Reporting
The Company’s management is responsible for establishing and maintaining adequate internal control over financial reporting as defined in Rules 13a-15(f) under the Securities Exchange Act of 1934. Pursuant to the rules and regulations of the SEC, internal control over financial reporting is a process designed by, or under the supervision of, the Company’s principal executive and principal financial officers, and effected by the Company’s Board of Directors, management and other personnel, to provide reasonable assurance regarding the reliability of financial reporting and the preparation of financial statements for external purposes in accordance with accounting principles generally accepted in the United States and includes those policies and procedures that (i) pertain to the maintenance of records that in reasonable detail accurately and fairly reflect the transactions and dispositions of the Company’s assets; (ii) provide reasonable assurance that transactions are recorded as necessary to permit preparation of financial statements in accordance with generally accepted accounting principles, and that receipts and expenditures of the issuer are being made only in accordance with authorizations of the Company’s management and directors; and (iii) provide reasonable assurance regarding prevention or timely detection of unauthorized acquisition, use or disposition of the Company’s assets that could have a material effect on the financial statements. Due to inherent limitations, internal control over financial reporting may not prevent or detect misstatements. Further, because of changes in conditions, effectiveness of internal control over financial reporting may vary over time.
17
The Company acquired Yorkshire Copper Tube (Yorkshire) during February 2014, and has excluded that business from management’s assessment of internal controls. The total value of assets of Yorkshire at year-end was $41.4 million, which represents three percent of the Company’s consolidated total assets at December 27, 2014. Net sales of Yorkshire from the date of acquisition represent four percent of the consolidated net sales of the Company for 2014, and Yorkshire operated at a net loss for the year. Accordingly, this acquired business is not included in the scope of this report.
The Company’s management, with the participation of the Company’s Chief Executive Officer and Chief Financial Officer, has evaluated the effectiveness of the Company’s internal control over financial reporting as of December 27, 2014 based on the control criteria established in a report entitled Internal Control—Integrated Framework, (1992 Framework) issued by the Committee of Sponsoring Organizations of the Treadway Commission (COSO). Based on such evaluation, management has concluded that our internal control over financial reporting was effective as of December 27, 2014.
Ernst & Young LLP, the independent registered public accounting firm that audited the Company’s financial statements included in this Annual Report on Form 10-K, has issued an attestation report on the Company’s internal control over financial reporting, which is included herein.
Changes in Internal Control Over Financial Reporting
There were no changes in the Company’s internal control over financial reporting during the Company’s fiscal quarter ended December 27, 2014, that have materially affected, or are reasonably likely to materially affect, the Company’s internal control over financial reporting.
18
Report of Independent Registered Public Accounting Firm
The Board of Directors and Stockholders of Mueller Industries, Inc.
We have audited Mueller Industries, Inc.’s internal control over financial reporting as of December 27, 2014, based on criteria established in Internal Control—Integrated Framework issued by the Committee of Sponsoring Organizations of the Treadway Commission (1992 Framework) (the COSO criteria). Mueller Industries, Inc.’s management is responsible for maintaining effective internal control over financial reporting, and for its assessment of the effectiveness of internal control over financial reporting included in the accompanying Management’s Report on Internal Control over Financial Reporting. Our responsibility is to express an opinion on the company’s internal control over financial reporting based on our audit.
We conducted our audit in accordance with the standards of the Public Company Accounting Oversight Board (United States). Those standards require that we plan and perform the audit to obtain reasonable assurance about whether effective internal control over financial reporting was maintained in all material respects. Our audit included obtaining an understanding of internal control over financial reporting, assessing the risk that a material weakness exists, testing and evaluating the design and operating effectiveness of internal control based on the assessed risk, and performing such other procedures as we considered necessary in the circumstances. We believe that our audit provides a reasonable basis for our opinion.
A company’s internal control over financial reporting is a process designed to provide reasonable assurance regarding the reliability of financial reporting and the preparation of financial statements for external purposes in accordance with generally accepted accounting principles. A company’s internal control over financial reporting includes those policies and procedures that (1) pertain to the maintenance of records that, in reasonable detail, accurately and fairly reflect the transactions and dispositions of the assets of the company; (2) provide reasonable assurance that transactions are recorded as necessary to permit preparation of financial statements in accordance with generally accepted accounting principles, and that receipts and expenditures of the company are being made only in accordance with authorizations of management and directors of the company; and (3) provide reasonable assurance regarding prevention or timely detection of unauthorized acquisition, use, or disposition of the company’s assets that could have a material effect on the financial statements.
Because of its inherent limitations, internal control over financial reporting may not prevent or detect misstatements. Also, projections of any evaluation of effectiveness to future periods are subject to the risk that controls may become inadequate because of changes in conditions, or that the degree of compliance with the policies or procedures may deteriorate.
As indicated in the accompanying Management’s Report on Internal Control over Financial Reporting, management’s assessment of and conclusion on the effectiveness of internal control over financial reporting did not include the internal controls of Yorkshire Copper Tube, which is included in the 2014 consolidated financial statements of Mueller Industries, Inc. and constituted $41.4 million and $21.1 million of total and net assets, respectively, as of December 27, 2014, and $94.4 million and $5.9 million of net sales and net loss, respectively, for the year then ended. Our audit of internal control over financial reporting of Mueller Industries, Inc. also did not include an evaluation of the internal control over financial reporting of Yorkshire Copper Tube.
In our opinion, Mueller Industries, Inc. maintained, in all material respects, effective internal control over financial reporting as of December 27, 2014, based on the COSO criteria.
We also have audited, in accordance with the standards of the Public Company Accounting Oversight Board (United States), the consolidated balance sheets of Mueller Industries, Inc. as of December 27, 2014 and December 28, 2013, and the related consolidated statements of income, comprehensive income, changes in equity and cash flows for each of the three years in the period ended December 27, 2014 and our report dated February 24, 2015 expressed an unqualified opinion thereon.
/s/ Ernst & Young LLP
None.
PART III
|
ITEM 10.
|
DIRECTORS, EXECUTIVE OFFICERS, AND CORPORATE GOVERNANCE
|
The information required by Item 10 is contained under the captions “Ownership of Common Stock by Directors and Executive Officers and Information about Director Nominees,” “Corporate Governance,” “Report of the Audit Committee of the Board of Directors,” and “Section 16(a) Beneficial Ownership Compliance Reporting” in the Company’s Proxy Statement for its 2015 Annual Meeting of Stockholders to be filed with the SEC on or about March 25, 2015, which is incorporated herein by reference.
The Company has adopted a Code of Business Conduct and Ethics that applies to its chief executive officer, chief financial officer, and other financial executives. We have also made the Code of Business Conduct and Ethics available on the Company’s website at www.muellerindustries.com.
|
ITEM 11.
|
EXECUTIVE COMPENSATION
|
The information required by Item 11 is contained under the caption “Compensation Discussion and Analysis,” “Summary Compensation Table for 2014,” “2014 Grants of Plan Based Awards Table,” “Outstanding Equity Awards at Fiscal 2014 Year-End,” “2014 Option Exercises and Stock Vested,” “Potential Payments Upon Termination of Employment or Change in Control as of the End of 2014,” “2014 Director Compensation,” “Report of the Compensation Committee of the Board of Directors on Executive Compensation” and “Corporate Governance” in the Company’s Proxy Statement for its 2015 Annual Meeting of Stockholders to be filed with the SEC on or about March 25, 2015, which is incorporated herein by reference.
20
|
ITEM 12.
|
SECURITY OWNERSHIP OF CERTAIN BENEFICIAL OWNERS AND MANAGEMENT AND RELATED STOCKHOLDER MATTERS
|
Equity Compensation Plan Information
The following table discloses information regarding the securities to be issued and the securities remaining available for issuance under the Registrant’s stock-based incentive plans as of December 27, 2014 (shares in thousands):
|
(a)
|
(b)
|
(c)
|
||||||||||
|
Plan category
|
Number of securities to be issued upon exercise of outstanding options, warrants, and rights
|
Weighted average exercise price of outstanding options, warrants, and rights
|
Number of securities remaining available for future issuance under equity compensation plans (excluding securities reflected in column (a))
|
|||||||||
|
Equity compensation plans approved by security holders
|
1,127
|
$
|
17.38
|
1,558
|
(1)
|
|||||||
|
Equity compensation plans not approved by security holders
|
—
|
—
|
—
|
|||||||||
|
Total
|
1,127
|
$
|
17.38
|
1,558
|
||||||||
|
(1)
|
Of the 1.6 million securities remaining available for issuance under the equity compensation plans, 1.5 million are available under the Company’s 2009 and 2014 Stock Incentive Plans for issuance of restricted stock, stock appreciation rights, or stock options. The remaining securities are available for issuance of stock options to the Board of Directors only.
|
Other information required by Item 12 is contained under the captions “Principal Stockholders” and “Ownership of Common Stock by Directors and Executive Officers and Information about Director Nominees” in the Company’s Proxy Statement for its 2015 Annual Meeting of Stockholders to be filed with the SEC on or about March 25, 2015, which is incorporated herein by reference.
|
ITEM 13.
|
CERTAIN RELATIONSHIPS AND RELATED TRANSACTIONS, AND DIRECTOR INDEPENDENCE
|
The information required by Item 13 is contained under the caption “Corporate Governance” in the Company’s Proxy Statement for its 2015 Annual Meeting of Stockholders to be filed with the SEC on or about March 25, 2015, which is incorporated herein by reference.
|
ITEM 14.
|
PRINCIPAL ACCOUNTING FEES AND SERVICES
|
The information required by Item 14 is contained under the caption “Appointment of Independent Registered Public Accounting Firm” in the Company’s Proxy Statement for its 2015 Annual Meeting of Stockholders to be filed with the SEC on or about March 25, 2015, which is incorporated herein by reference.
21
PART IV
|
ITEM 15.
|
EXHIBITS, FINANCIAL STATEMENT SCHEDULES
|
|
(a)
|
The following documents are filed as part of this report:
|
||
|
1.
|
Financial Statements: the financial statements, notes, and report of independent registered public accounting firm described in Item 8 of this Annual Report on Form 10-K are contained in a separate section of this Annual Report on Form 10-K commencing on page F-1.
|
||
|
2.
|
Financial Statement Schedule: the financial statement schedule described in Item 8 of this report is contained in a separate section of this Annual Report on Form 10-K commencing on page F-1.
|
||
|
3.
|
Exhibits:
|
||
|
3.1
|
Restated Certificate of Incorporation of the Registrant dated February 8, 2007 (Incorporated herein by reference to Exhibit 3.1 of the Registrant’s Annual Report on Form 10-K, dated February 28, 2007, for the fiscal year ended December 30, 2006).
|
||
|
3.2
|
Amended and Restated By-laws of the Registrant, effective as of November 8, 2013 (Incorporated herein by reference to Exhibit 3.1 of the Registrant’s Current Report on Form 8-K, dated November 8, 2013).
|
||
|
4.1
|
Certain instruments with respect to long-term debt of the Registrant have not been filed as Exhibits to this Report since the total amount of securities authorized under any such instruments does not exceed 10 percent of the total assets of the Registrant and its subsidiaries on a consolidated basis. The Registrant agrees to furnish a copy of each such instrument upon request of the SEC.
|
||
|
10.1
|
Amended and Restated Consulting Agreement, dated October 25, 2007, by and between the Registrant and Harvey Karp (Incorporated herein by reference to Exhibit 10.2 of the Registrant’s Current Report on Form 8-K, dated October 25, 2007).
|
||
|
10.2
|
Amendment No. 1, dated December 2, 2008, to the Amended and Restated Consulting Agreement, dated October 25, 2007, by and between the Registrant and Harvey Karp (Incorporated herein by reference to Exhibit 10.7 of the Registrant’s Annual Report on Form 10-K, dated February 24, 2009, for the fiscal year ended December 27, 2008).
|
||
|
10.3
|
Letter Agreement with Harvey Karp, dated as of May 11, 2011 (Incorporated herein by reference to Exhibit 10.1 of the Registrant’s Current Report on Form 8-K, dated May 16, 2011).
|
||
|
10.4
|
Amended and Restated Employment Agreement, effective October 30, 2008, by and between the Registrant and Gregory L. Christopher (Incorporated herein by reference to Exhibit 10.1 of the Registrant’s Current Report on Form 8-K, dated December 26, 2008).
|
||
|
10.5
|
Amendment No. 1 to Amended and Restated Employment Agreement by and between the Registrant and Gregory L. Christopher, dated February 14, 2013 (Incorporated by reference to Exhibit 10.1 of the Registrant’s Current Report on Form 8-K, dated February 14, 2013).
|
||
|
10.6
|
Mueller Industries, Inc. 1994 Non-Employee Director Stock Option Plan, as amended (Incorporated herein by reference to Exhibit 10.12 of the Registrant’s Annual Report on Form 10-K, dated March 24, 2003, for the fiscal year ended December 28, 2002 and Exhibit 99.6 of the Registrant’s Current Report on Form 8-K, dated August 31, 2004).
|
||
|
10.7
|
Mueller Industries, Inc. 2002 Stock Option Plan Amended and Restated as of February 16, 2006 (Incorporated herein by reference to Exhibit 10.20 of the Registrant’s Annual Report on Form 10-K, dated February 28, 2007, for the fiscal year ended December 30, 2006).
|
||
22
|
10.8
|
Mueller Industries, Inc. 2009 Stock Incentive Plan (Incorporated by reference from Appendix I to the Company’s 2009 Definitive Proxy Statement with respect to the Company’s 2009 Annual Meeting of Stockholders, as filed with the Securities and Exchange Commission on March 26, 2009).
|
||
|
10.9
|
Mueller Industries, Inc. 2014 Stock Incentive Plan (Incorporated by reference from Appendix I to the Company’s 2014 Definitive Proxy Statement with respect to the Company’s 2014 Annual Meeting of Stockholders, as filed with the Securities and Exchange Commission on March 19, 2014).
|
||
|
10.10
|
Amendment to the Mueller Industries, Inc. 2002 Stock Option Plan, dated July 11, 2011 (Incorporated herein by reference to Exhibit 10.16 of the Registrant’s Annual Report on Form 10-K, dated February 28, 2012, for the fiscal year ended December 31, 2011).
|
||
|
10.11
|
Amendment to the Mueller Industries, Inc. 2009 Stock Incentive Plan, dated July 11, 2011 (Incorporated herein by reference to Exhibit 10.17 of the Registrant’s Annual Report on Form 10-K, dated February 28, 2012, for the fiscal year ended December 31, 2011).
|
||
|
10.12
|
Mueller Industries, Inc. 2011 Annual Bonus Plan (Incorporated herein by reference to Exhibit 10.18 of the Registrant’s Annual Report on Form 10-K, dated February 28, 2012, for the fiscal year ended December 31, 2011).
|
||
|
10.13
|
Summary description of the Registrant’s 2015 incentive plan for certain key employees.
|
||
|
10.14
|
Amended Credit Agreement, dated as of March 7, 2011, among the Registrant (as Borrower) and Bank of America, N.A. (as agent), and certain lenders named therein, following adoption of Amendment No. 2 dated December 11, 2012 (Incorporated herein by reference to Exhibit 10.20 of the Registrant’s Annual Report on Form 10-K, dated February 27, 2013, for the fiscal year ended December 29, 2012).
|
||
|
10.15
|
Amendment No. 1 to Credit Agreement among the Registrant (as borrower), Bank of America, N.A. (as agent), and certain lenders named therein dated August 12, 2011 (Incorporated herein by reference to Exhibit 10.1 of the Registrant’s Quarterly Report on Form 10-Q, for the Quarterly period ended October 1, 2011, dated October 27, 2011).
|
||
|
10.16
|
Amendment No. 2 to Credit Agreement among the Registrant (as borrower), Bank of America, N.A. (as agent), and certain lenders named therein dated December 11, 2012 (Incorporated herein by reference to Exhibit 10.22 of the Registrant’s Annual Report on Form 10-K, dated February 27, 2013, for the fiscal year ended December 29, 2012).
|
||
|
10.17
|
Share Purchase Agreement by and among Mueller Europe Limited and Travis Perkins PLC, dated November 21, 2014 (Incorporated herein by reference to Exhibit 10.1 of the Registrant’s Current Report on Form 8-K, dated November 24, 2014).
|
||
|
21.0
|
Subsidiaries of the Registrant.
|
||
|
23.0
|
Consent of Independent Registered Public Accounting Firm.
|
||
|
31.1
|
Certification of Chief Executive Officer pursuant to Rule 13a-14(a) and Rule 15d-14(a) of the Securities Exchange Act of 1934, as amended.
|
||
|
31.2
|
Certification of Chief Financial Officer pursuant to Rule 13a-14(a) and Rule 15d-14(a) of the Securities Exchange Act of 1934, as amended.
|
23
|
32.1
|
Certification of Chief Executive Officer pursuant to 18 U.S.C. 1350, as adopted pursuant to Section 906 of the Sarbanes-Oxley Act of 2002.
|
||
|
32.2
|
Certification of Chief Financial Officer pursuant to 18 U.S.C. 1350, as adopted pursuant to Section 906 of the Sarbanes-Oxley Act of 2002.
|
||
|
101.CAL
|
XBRL Taxonomy Extension Calculation Linkbase
|
||
|
101.DEF
|
XBRL Taxonomy Extension Definition Linkbase
|
||
|
101.INS
|
XBRL Instance Document
|
||
|
101.LAB
|
XBRL Taxonomy Extension Label Linkbase
|
||
|
101.PRE
|
XBRL Presentation Linkbase Document
|
||
|
101.SCH
|
XBRL Taxonomy Extension Schema
|
24
SIGNATURES
Pursuant to the requirements of Section 13 or 15(d) of the Securities Exchange Act of 1934, the Registrant has duly caused this report to be signed on its behalf by the undersigned, thereunto duly authorized, on February 24, 2015.
MUELLER INDUSTRIES, INC.
|
/s/ Gregory L. Christopher
|
||
|
Gregory L. Christopher, Chief Executive Officer
(Principal Executive Officer), and Director
|
Pursuant to the requirements of the Securities Exchange Act of 1934, this report has been signed below by the following persons on behalf of the Registrant and in the capacities and on the date indicated.
|
Signature
|
Title
|
Date
|
|
/s/ Gary S. Gladstein
|
Chairman of the Board, and Director
|
February 24, 2015
|
|
Gary S. Gladstein
|
||
|
/s/ Gregory L. Christopher
|
Chief Executive Officer
|
February 24, 2015
|
|
Gregory L. Christopher
|
(Principal Executive Officer), and Director
|
|
|
/s/ Paul J. Flaherty
|
Director
|
February 24, 2015
|
|
Paul J. Flaherty
|
||
|
/s/ Gennaro J. Fulvio
|
Director
|
February 24, 2015
|
|
Gennaro J. Fulvio
|
||
|
/s/ Scott J. Goldman
|
Director
|
February 24, 2015
|
|
Scott J. Goldman
|
||
|
/s/ John B. Hansen
|
Director
|
February 24, 2015
|
|
John B. Hansen
|
||
|
/s/ Terry Hermanson
|
Director
|
February 24, 2015
|
|
Terry Hermanson
|
||
Pursuant to the requirements of the Securities Exchange Act of 1934, this report has been signed below by the following persons on behalf of the Registrant and in the capacities and on the date indicated.
|
Signature and Title
|
Date
|
|
|
/s/ Jeffrey A. Martin
|
February 24, 2015
|
|
|
Jeffrey A. Martin
|
||
|
Chief Financial Officer and Treasurer
|
||
|
(Principal Financial and Accounting Officer)
|
||
|
/s/ Richard W. Corman
|
February 24, 2015
|
|
|
Richard W. Corman
|
||
|
Vice President – Controller
|
25
MUELLER INDUSTRIES, INC.
INDEX TO CONSOLIDATED FINANCIAL STATEMENTS
|
F- 2
|
|
|
for the years ended December 27, 2014, December 28, 2013, and December 29, 2012
|
F- 15
|
|
for the years ended December 27, 2014, December 28, 2013, and December 29, 2012
|
F- 16
|
|
as of December 27, 2014 and December 28, 2013
|
F- 17
|
|
for the years ended December 27, 2014, December 28, 2013, and December 29, 2012
|
F- 18
|
|
for the years ended December 27, 2014, December 28, 2013, and December 29, 2012
|
F- 19
|
|
F- 21
|
|
|
F- 55
|
|
FINANCIAL STATEMENT SCHEDULE
|
Schedule for the years ended December 27, 2014, December 28, 2013, and December 29, 2012
|
|
|
F- 56
|
|
F-1
FINANCIAL REVIEW
The Financial Review section of our Annual Report on Form 10-K consists of the following: Management’s Discussion and Analysis of Results of Operations and Financial Condition (MD&A), the Consolidated Financial Statements, and Other Financial Information, all of which include information about our significant accounting policies, practices, and the transactions that impact our financial results. The following MD&A describes the principal factors affecting the results of operations, liquidity and capital resources, contractual cash obligations and the critical accounting estimates of the Company. The discussion in the Financial Review section should be read in conjunction with the other sections of this Annual Report, particularly “Item 1: Business” and our other detailed discussion of risk factors included in this MD&A.
Overview
We are a leading manufacturer of plumbing, HVAC, refrigeration, and industrial products. The range of these products is broad: copper tube and fittings; brass and copper alloy rod, bar, and shapes; aluminum and brass forgings; aluminum and copper impact extrusions; plastic fittings and valves; refrigeration valves and fittings; fabricated tubular products; and steel nipples. We also resell imported brass and plastic plumbing valves, malleable iron fittings, faucets and plumbing specialty products. Mueller’s operations are located throughout the United States and in Canada, Mexico, Great Britain, and China.
The Company’s businesses are aggregated into two reportable segments:
|
●
|
Plumbing & Refrigeration: The Plumbing & Refrigeration segment is composed of SPD, European Operations, and Mexican Operations. SPD manufactures and sells copper tube, copper and plastic fittings, line sets, and valves in North America and sources products for import distribution in North America. European Operations manufacture copper tube in the United Kingdom, which is sold throughout Europe. Mexican Operations consist of pipe nipple manufacturing and import distribution businesses including product lines of malleable iron fittings and other plumbing specialties. The Plumbing & Refrigeration segment sells products to wholesalers in the HVAC, plumbing, and refrigeration markets, to distributors to the manufactured housing and recreational vehicle industries, and to building material retailers.
|
|
●
|
OEM: The OEM segment is composed of IPD, EPD, and Mueller-Xingrong, the Company’s Chinese joint venture. The OEM segment manufactures and sells brass and copper alloy rod, bar, and shapes; aluminum and brass forgings; aluminum and copper impact extrusions; refrigeration valves and fittings; fabricated tubular products; and gas valves and assemblies. Mueller-Xingrong manufactures engineered copper tube primarily for air-conditioning applications; these products are sold primarily to OEMs located in China. The OEM segment sells its products primarily to original equipment manufacturers, many of which are in the HVAC, plumbing, and refrigeration markets.
|
New housing starts and commercial construction are important determinants of the Company’s sales to the HVAC, refrigeration, and plumbing markets because the principal end use of a significant portion of our products is in the construction of single and multi-family housing and commercial buildings. Repairs and remodeling projects are also important drivers of underlying demand for these products.
Residential construction in 2014 and 2013 has shown improvement, but remains at levels below historical averages. Continued improvement is expected, but may be tempered by continuing low labor participation rates, the pace of household formations, higher interest rates, and tighter lending standards. Per the U.S. Census Bureau, actual housing starts in the U.S. were 1.0 million in 2014, which compares to 925 thousand in 2013 and 781 thousand in 2012. While mortgage rates have risen in 2014 and 2013, they remain at historically low levels, as the average 30-year fixed mortgage rate was approximately 4.17 percent in 2014 and 3.98 percent in 2013.
The private nonresidential construction sector, which includes offices, industrial, health care and retail projects, began showing modest improvement in 2014, 2013, and 2012 after declines in previous years. According to the U.S. Census Bureau, at December 2014, the seasonally adjusted annual rate of private nonresidential value of construction put in place was $349.0 billion compared to $331.4 billion at December 2013. The actual private nonresidential value of construction put in place was $337.0 billion in 2014, $304.9 billion in 2013, and $301.4 billion in 2012. The Company expects that most of these conditions will continue to gradually improve.
F-2
Profitability of certain of the Company’s product lines depends upon the “spreads” between the cost of raw material and the selling prices of its products. The open market prices for copper cathode and scrap, for example, influence the selling price of copper tube, a principal product manufactured by the Company. The Company attempts to minimize the effects on profitability from fluctuations in material costs by passing through these costs to its customers. The Company’s earnings and cash flow are dependent upon these spreads that fluctuate based upon market conditions.
Earnings and profitability are also impacted by unit volumes that are subject to market trends, such as substitute products, imports, technologies, and market share. In its core product lines, the Company intensively manages its pricing structure while attempting to maximize its profitability. From time-to-time, this practice results in lost sales opportunities and lower volume. For plumbing systems, plastics are the primary substitute product; these products represent an increasing share of consumption. U.S. consumption of copper tube is still predominantly supplied by U.S. manufacturers. For certain air-conditioning and refrigeration applications, aluminum based systems are the primary substitution threat. The Company cannot predict the acceptance or the rate of switching that may occur. In recent years, brass rod consumption in the U.S. has declined due to the outsourcing of many manufactured products from offshore regions.
Results of Operations
Consolidated Results
The following table compares summary operating results for 2014, 2013, and 2012:
|
Percent Change
|
|||||||||||||||||||||
|
(In thousands)
|
2014
|
2013
|
2012
|
2014 vs. 2013
|
2013 vs. 2012
|
||||||||||||||||
|
Net sales
|
$
|
2,364,227
|
$
|
2,158,541
|
$
|
2,189,938
|
9.5
|
%
|
(1.4
|
)%
|
|
||||||||||
|
Operating income
|
153,996
|
270,937
|
126,705
|
(43.2
|
)
|
113.8
|
|||||||||||||||
|
Net income
|
101,560
|
172,600
|
82,395
|
(41.2
|
)
|
109.5
|
|||||||||||||||
The increase in net sales in 2014 was primarily due to (i) incremental sales of $91.7 million contributed by Yorkshire, acquired in February 2014, (ii) $109.1 million of sales contributed by Howell, acquired in October 2013, (iii) an increase in unit sales in the Company’s other core product lines of $49.9 million, and (iv) an increase in net sales of $20.3 million from the Company’s non-core product lines. These increases were offset by lower selling prices of $65.4 million in the Company’s core products.
The decrease in net sales in 2013 was primarily due to lower net selling prices in the Company’s core product lines of $58.6 million and lower unit sales volume in the OEM segment of $12.7 million. This was partially offset by an increase in unit sales volume due to $14.3 million of sales recorded by Howell, and $11.1 million of sales recorded by Westermeyer, acquired in August 2012.
F-3
Net selling prices generally fluctuate with changes in raw material costs. Changes in raw material costs are generally passed through to customers by adjustments to selling prices. The following graph shows the Comex average copper price per pound by quarter for the most recent three-year period:
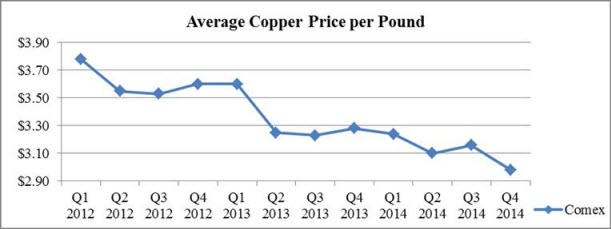
The following tables compare operating expenses as dollar amounts and as a percent of net sales for 2014, 2013, and 2012:
|
(In thousands)
|
2014
|
2013
|
2012
|
|||||||||
|
Cost of goods sold
|
$
|
2,043,719
|
$
|
1,862,089
|
$
|
1,904,463
|
||||||
|
Depreciation and amortization
|
33,735
|
32,394
|
31,495
|
|||||||||
|
Selling, general, and administrative expense
|
131,740
|
134,914
|
129,456
|
|||||||||
|
Insurance settlements
|
—
|
(106,332
|
)
|
(1,500
|
)
|
|||||||
|
Gain on sale of assets
|
(6,259
|
)
|
(39,765
|
)
|
—
|
|||||||
|
Impairment charges
|
—
|
4,304
|
—
|
|||||||||
|
Litigation settlements
|
—
|
—
|
(4,050
|
)
|
||||||||
|
Severance
|
7,296
|
—
|
3,369
|
|||||||||
|
Operating expenses
|
$
|
2,210,231
|
$
|
1,887,604
|
$
|
2,063,233
|
||||||
|
Percent of Net Sales
|
||||||||||||
|
2014
|
2013
|
2012
|
||||||||||
|
Cost of goods sold
|
86.4
|
%
|
86.3
|
%
|
87.0
|
%
|
||||||
|
Depreciation and amortization
|
1.4
|
1.5
|
1.4
|
|||||||||
|
Selling, general, and administrative expense
|
5.6
|
6.3
|
5.9
|
|||||||||
|
Insurance settlements
|
—
|
(4.9
|
)
|
(0.1
|
)
|
|||||||
|
Gain on sale of assets
|
(0.3
|
)
|
(1.8
|
)
|
—
|
|||||||
|
Impairment charges
|
—
|
0.2
|
—
|
|||||||||
|
Litigation settlements
|
—
|
—
|
(0.2
|
)
|
||||||||
|
Severance
|
0.3
|
—
|
0.2
|
|||||||||
|
Operating expenses
|
93.4
|
%
|
87.6
|
%
|
94.2
|
%
|
||||||
The increase in cost of goods sold in 2014 was primarily due to the increase in sales volume. The decrease in 2013 as compared to 2012 was largely related to the decrease in the price of copper, the Company’s principal raw material. This was offset by the recognition of a gain from LIFO liquidation that resulted in a reduction of approximately $8.0 million to cost of sales in 2012. Depreciation and amortization increased in 2014 as a result of depreciation and amortization of businesses acquired. The increase in 2013 was related to an increase in capital spending in 2012 and 2013. Selling, general, and administrative expenses decreased in 2014 primarily as a result of a decrease in legal fees of $4.8 million and lower net periodic pension costs of $5.0 million, offset by incremental costs associated with Howell and Yorkshire. The increase in 2013 was related to increased legal fees of $3.0 million, increased bad debt expense of $1.0 million, and increased software purchases of $0.7 million.
F-4
During 2014, our operating results were positively impacted by a net gain of $6.3 million recorded for the sale of our plastic pipe manufacturing assets, the land and building in Portage, Michigan, and our United Kingdom based import distribution business. This was offset by $7.3 million in severance charges related to the reorganization of Yorkshire.
Operating income increased in 2013 primarily as a result of the $106.3 million gain recognized in the settlement of our insurance claim related to the September 2011 fire at the Wynne, Arkansas manufacturing operation. In addition, we sold certain of our plastic fittings manufacturing assets and recognized a pre-tax gain of $39.8 million, or 41 cents per diluted share after tax, and recognized fixed asset impairment charges of $4.3 million.
During 2012, our operating results were positively impacted by a net gain of $4.1 million recorded upon receipt of payment related to the October 2012 settlement of a lawsuit against Xiamen Lota International Co., Ltd. We also settled the business interruption portion of our insurance claim related to the July 2009 explosion at the copper tube facility in Fulton, Mississippi and recorded a $1.5 million gain. The gain was offset by $3.4 million in severance charges.
Interest expense increased $1.8 million in 2014 due to increased borrowings by MEL and higher borrowing costs at Mueller-Xingrong to fund working capital. The decrease of $2.9 million in 2013 was related to the redemption of the 6% Subordinated Debentures during the second quarter of 2012. In addition, during 2013 the Company capitalized interest expense related to certain capital projects. Other expense, net, was $0.2 million in 2014 and other income, net, was $4.5 million in 2013. The income in 2013 resulted primarily from a $3.0 million gain on the sale of a non-operating property.
Income tax expense was $45.5 million in 2014, for an effective tax rate of 31 percent. This rate was lower than what would be computed using the U.S. statutory federal rate primarily due to decreases in valuation allowances of $5.7 million; the U.S. production activities deduction benefit of $4.0 million; and the effect of lower foreign tax rates and other foreign adjustments of $1.1 million. These decreases were partially offset by state tax expense (net of federal benefit) of $3.3 million and $1.2 million of other adjustments.
Income tax expense was $98.1 million in 2013, for an effective rate of 36 percent. This rate was higher than what would be computed using the U.S. statutory federal rate primarily due to state tax expense, net of federal benefit, of $6.4 million, and the impact of goodwill disposition of $1.8 million. These increases were partially offset by the U.S. production activities deduction benefit of $4.4 million and the effect of lower foreign tax rates and other foreign adjustments of $1.0 million.
Income tax expense was $36.7 million in 2012, for an effective rate of 30 percent. This rate was lower than what would be computed using the U.S. statutory federal rate primarily due to the U.S. production activities deduction benefit of $3.0 million, effect of lower foreign tax rates and other foreign adjustments of $2.6 million, and reductions in tax contingencies of $3.2 million. These decreases were partially offset by state tax expense, net of federal benefit, of $3.2 million.
Plumbing & Refrigeration Segment
The following table compares summary operating results for 2014, 2013, and 2012 for the businesses comprising our Plumbing & Refrigeration segment:
|
Percent Change
|
|||||||||||||||||||||
|
(In thousands)
|
2014
|
2013
|
2012
|
2014 vs. 2013
|
2013 vs. 2012
|
||||||||||||||||
|
Net sales
|
$
|
1,416,701
|
$
|
1,225,306
|
$
|
1,238,230
|
15.6
|
%
|
(1.0
|
)%
|
|
||||||||||
|
Operating income
|
93,230
|
219,146
|
87,014
|
(57.5
|
)
|
151.9
|
|||||||||||||||
The increase in net sales in 2014 was primarily due to (i) incremental sales of $91.7 million contributed by Yorkshire, (ii) $109.1 million of sales contributed by Howell, and (iii) an increase in net sales of $23.2 million from the segment’s non-core product lines. The decrease in net sales in 2013 was primarily due to lower net selling prices in the segment’s core product lines of $38.7 million. This was partially offset by an increase in unit sales volume due to $14.3 million of sales recorded by Howell and $12.4 million in the segment’s other core product lines.
F-5
The following tables compare operating expenses as dollar amounts and as a percent of net sales for 2014, 2013, and 2012:
|
(In thousands)
|
2014
|
2013
|
2012
|
|||||||||
|
Cost of goods sold
|
$
|
1,215,282
|
$
|
1,043,059
|
$
|
1,060,755
|
||||||
|
Depreciation and amortization
|
19,613
|
17,117
|
16,513
|
|||||||||
|
Selling, general, and administrative expense
|
87,539
|
85,471
|
75,448
|
|||||||||
|
Insurance settlements
|
—
|
(103,895
|
)
|
(1,500
|
)
|
|||||||
|
Gain on sale of assets
|
(6,259
|
)
|
(39,765
|
)
|
—
|
|||||||
|
Impairment charges
|
—
|
4,173
|
—
|
|||||||||
|
Severance
|
7,296
|
—
|
—
|
|||||||||
|
Operating expenses
|
$
|
1,323,471
|
$
|
1,006,160
|
$
|
1,151,216
|
||||||
|
Percent of Net Sales
|
||||||||||||
|
2014
|
2013
|
2012
|
||||||||||
|
Cost of goods sold
|
85.8
|
%
|
85.1
|
%
|
85.7
|
%
|
||||||
|
Depreciation and amortization
|
1.4
|
1.4
|
1.3
|
|||||||||
|
Selling, general, and administrative expense
|
6.2
|
7.0
|
6.1
|
|||||||||
|
Insurance settlements
|
—
|
(8.5
|
)
|
(0.1
|
)
|
|||||||
|
Gain on sale of assets
|
(0.4
|
)
|
(3.2
|
)
|
—
|
|||||||
|
Impairment charges
|
—
|
0.3
|
—
|
|||||||||
|
Severance
|
0.5
|
—
|
—
|
|||||||||
|
Operating expenses
|
93.5
|
%
|
82.1
|
%
|
93.0
|
%
|
||||||
The increase in cost of goods sold in 2014 was primarily due to the increase in net sales, while the decrease in 2013 was largely related to the decrease in the price of copper, the Company’s principal raw material. The decrease in 2013 was offset by the recognition of a gain from LIFO liquidation that resulted in a reduction of approximately $8.0 million to cost of sales in 2012. Depreciation and amortization increased in 2014 as a result of depreciation and amortization of businesses acquired. The increase in 2013 was related to an increase in capital spending in 2012 and 2013. Selling, general, and administrative expenses increased in 2014 primarily as a result of higher employment costs, including incentive compensation, of $2.8 million and incremental costs associated with Howell and Yorkshire. This was offset by a reduction in expense related to legal matters of $3.0 million. The increase in 2013 was due to higher employment costs, including incentive compensation, of $5.4 million, an increase in legal fees of $1.3 million, and an increase in bad debt expense of $1.0 million.
During 2014, operating results were positively impacted by a net gain of $6.3 million recorded for the sale of our plastic pipe manufacturing assets, the land and building in Portage, Michigan, and our United Kingdom based import distribution business. This was offset by $7.3 million in severance charges related to the reorganization of Yorkshire.
Operating income increased in 2013 primarily as a result of the $103.9 million gain recognized in the settlement of our insurance claim related to the September 2011 fire at the Wynne, Arkansas manufacturing operation. In addition, we sold certain of our plastic fittings manufacturing assets and recognized a pre-tax gain of $39.8 million and recognized fixed asset impairment charges of $4.2 million.
In 2012, we settled the business interruption portion of our insurance claim related to the July 2009 explosion at our copper tube facility in Fulton, Mississippi and recorded a $1.5 million gain.
F-6
OEM Segment
The following table compares summary operating results for 2014, 2013, and 2012 for the businesses comprising our OEM segment:
|
Percent Change
|
|||||||||||||||||||||
|
(In thousands)
|
2014
|
2013
|
2012
|
2014 vs. 2013
|
2013 vs. 2012
|
||||||||||||||||
|
Net sales
|
$
|
959,914
|
$
|
947,784
|
$
|
974,606
|
1.3
|
%
|
(2.8
|
)%
|
|
||||||||||
|
Operating income
|
85,714
|
76,631
|
67,087
|
11.9
|
14.2
|
||||||||||||||||
The increase in net sales in 2014 was primarily due to an increase in unit sales volume of $46.2 million, offset by a decrease of $31.4 million due to lower net selling prices in the segment’s core product lines of brass rod, forgings, and commercial tube. The decrease in net sales in 2013 was primarily due to lower net selling prices of $18.6 million and a decrease in unit sales volume of $12.7 million in the segment’s core product lines. This was partially offset by an increase in unit sales volume due to $11.1 million of sales recorded by Westermeyer.
The following tables compare operating expenses as dollar amounts and as a percent of net sales for 2014, 2013, and 2012:
|
(In thousands)
|
2014
|
2013
|
2012
|
|||||||||
|
Cost of goods sold
|
$
|
840,823
|
$
|
833,518
|
$
|
866,404
|
||||||
|
Depreciation and amortization
|
11,919
|
13,025
|
13,435
|
|||||||||
|
Selling, general, and administrative expense
|
21,458
|
24,479
|
27,680
|
|||||||||
|
Impairment charges
|
—
|
131
|
—
|
|||||||||
|
Operating expenses
|
$
|
874,200
|
$
|
871,153
|
$
|
907,519
|
||||||
|
Percent of Net Sales
|
||||||||||||
|
2014
|
2013
|
2012
|
||||||||||
|
Cost of goods sold
|
87.6
|
%
|
87.9
|
%
|
88.9
|
%
|
||||||
|
Depreciation and amortization
|
1.2
|
1.4
|
1.4
|
|||||||||
|
Selling, general, and administrative expense
|
2.2
|
2.6
|
2.8
|
|||||||||
|
Impairment charges
|
—
|
—
|
—
|
|||||||||
|
Operating expenses
|
91.0
|
%
|
91.9
|
%
|
93.1
|
%
|
||||||
The increase in cost of goods sold in 2014 and the decrease in 2013 were related to factors consistent with those noted regarding changes in net sales. Depreciation and amortization decreased in 2014 and 2013 as a result of several fixed assets becoming fully depreciated. Selling, general, and administrative expenses decreased in 2014 primarily as a result of lower net periodic pension costs of $3.5 million. The decrease in 2013 was due to lower employment costs, including incentive compensation, of $1.0 million and losses on fixed asset impairments recorded in 2012.
F-7
Liquidity and Capital Resources
The following table presents selected financial information and statistics for 2014, 2013, and 2012:
|
(In thousands)
|
2014
|
2013
|
2012
|
|||||||||
|
Cash and cash equivalents
|
$
|
352,134
|
$
|
311,800
|
$
|
198,934
|
||||||
|
Property, plant, and equipment, net
|
245,910
|
244,457
|
233,263
|
|||||||||
|
Total debt
|
241,444
|
235,333
|
234,870
|
|||||||||
|
Working capital, net of cash and current debt
|
387,204
|
372,744
|
317,134
|
|||||||||
|
Cash provided by operating activities
|
|
90,605
|
|
128,513
|
|
108,297
|
||||||
|
Cash used in investing activities
|
(38,424
|
)
|
(2,985
|
)
|
(16,376
|
)
|
||||||
|
Cash used in financing activities
|
(10,551
|
)
|
(13,643
|
)
|
(408,648
|
)
|
||||||
Management believes that cash provided by operations, funds available under the credit agreement, and cash on hand of $352.1 million will be adequate to meet the Company’s normal future capital expenditure and operational needs. Our current ratio (current assets divided by current liabilities) was 4.0 to 1 as of December 27, 2014.
As of December 27, 2014, $91.6 million of our cash and cash equivalents were held by foreign subsidiaries. The Company expects to repatriate $2.2 million of this cash and has accrued deferred tax on these earnings. All other earnings of the foreign subsidiaries are considered to be permanently reinvested, and it is not practicable to compute the potential deferred tax liability associated with these undistributed foreign earnings. The Company believes that cash held domestically, funds available through the credit agreement, and cash generated from U.S. based operations will be adequate to meet the future needs of the U.S. based operations.
The Company has significant environmental remediation obligations expected to occur over future years. Approximately $2.2 million was spent during 2014 for environmental matters. As of December 27, 2014, the Company expects to spend $0.7 million in 2015, $0.8 million in 2016, $0.7 million in 2017, $0.7 million in 2018, $0.8 million in 2019, and $9.4 million thereafter for ongoing projects. The timing of a potential payment for a $9.5 million settlement offer related to the Southeast Kansas Sites has not yet been determined.
Cash used to fund pension and other postretirement benefit obligations was $4.4 million in 2014 and $2.8 million in 2013.
Our Board of Directors declared a regular quarterly dividend of 7.5 cents per share for each quarter of fiscal 2014 and 6.25 cents per share on our common stock for each fiscal quarter of 2013. Payment of dividends in the future is dependent upon the Company’s financial condition, cash flows, capital requirements, and other factors.
Fluctuations in the cost of copper and other raw materials affect the Company’s liquidity. Changes in material costs directly impact components of working capital, primarily inventories and accounts receivable. The price of copper has fluctuated significantly and averaged approximately $3.12 in 2014, $3.34 in 2013, and $3.61 in 2012.
Cash Provided by Operating Activities
During 2014, cash provided by operating activities was primarily attributable to consolidated net income of $102.5 million and depreciation and amortization of $34.1 million. These cash increases were offset by increased receivables of $21.4 million, an increase in other assets of $23.7 million, and a decrease in other liabilities of $2.2 million. These changes were primarily due to increased sales volume in certain businesses and additional working capital needs of acquired businesses.
During 2013, the primary components of cash provided by operating activities were consolidated net income of $173.3 million, partially offset by the gain related to the settlement of the insurance claim for the September 2011 fire in Wynne, Arkansas of $106.3 million and the $39.8 million gain on the sale of the plastic fittings manufacturing assets. There were also increases due to the non-capital related insurance proceeds of $32.4 million, changes in working capital, and non-cash adjustments primarily consisting of depreciation and amortization of $30.9 million and deferred income taxes of $19.2 million. Major changes in working capital included a $19.4 million decrease in trade accounts receivable and a $14.1 million decrease in current liabilities. Changes in the components of working capital are heavily driven by the changes in raw material prices, primarily copper.
F-8
Cash Used in Investing Activities
The major components of net cash used in investing activities in 2014 included $30.1 million for the acquisition of Yorkshire, capital expenditures of $39.2 million, and deposits into restricted cash of $2.9 million. These decreases were partially offset by $33.8 million proceeds from the sales of assets.
The major components of net cash used in investing activities in 2013 included $55.3 million for the acquisition of Howell and $41.3 million used for capital expenditures. These decreases were partially offset by $65.1 million for proceeds from the sale of assets, including certain plastic fittings manufacturing assets, and $29.9 million for insurance proceeds for property and equipment related to the fire at our Wynne, Arkansas manufacturing operation.
Cash Used in Financing Activities
For 2014, net cash used in financing activities consisted primarily of $16.8 million for payment of regular quarterly dividends to stockholders of the Company, offset by $7.3 million received for the issuance of debt by Mueller-Xingrong.
For 2013, net cash used in financing activities totaled $13.6 million, which consisted primarily of $13.9 million for payment of regular quarterly dividends to stockholders of the Company.
Property, Plant, and Equipment, net
The Company’s capital expenditures were $39.2 million during 2014 and related primarily to upgrading equipment and implementing new manufacturing technologies in our copper tube and brass rod mills. We anticipate investing approximately $35 million to $40 million for capital expenditures during 2015.
Long-Term Debt
Effective May 29, 2014, the Company elected to modify its credit agreement (the Credit Agreement) entered into on March 7, 2011 to reduce the unsecured $350.0 million revolving credit facility (the Revolving Credit Facility) to $200.0 million. The Credit Agreement also provides for a $200.0 million Term Loan Facility, which, together with the Revolving Credit Facility, both mature on December 11, 2017. The Revolving Credit Facility backed approximately $10.5 million in letters of credit at the end of 2014.
Additionally, MEL’s credit agreement (the Invoice Facility, described in Note 7 of the Notes to the Consolidated Financial Statements) has a total borrowing capacity of £40.0 million, or approximately $62.2 million. The Invoice Facility has an initial term of two years. Borrowings outstanding under the Invoice Facility are secured by MEL’s trade account receivables denominated in British pounds. MEL did not have any borrowings outstanding under the Invoice Facility at December 27, 2014.
On September 23, 2013, Mueller-Xingrong entered into a secured revolving credit facility (the JV Credit Agreement), which matured on September 24, 2014. At the maturity date, individual draws on the JV Credit Agreement had maturity dates ranging up to nine months. Borrowings under the JV Credit Agreement bear an interest rate at the latest base-lending rate published by the People’s Bank of China, which was 5.6 percent at December 27, 2014. On February 2, 2015, Mueller-Xingrong entered into a new secured revolving credit agreement with a total borrowing capacity of RMB 230 million (or approximately $37.1 million). In addition, Mueller-Xingrong occasionally finances working capital through various accounts receivable and bank draft discount arrangements. Total borrowings at Mueller-Xingrong were $35.2 million at December 27, 2014.
As of December 27, 2014, the Company’s total debt was $241.4 million or 23.3 percent of its total capitalization.
Covenants contained in the Company’s financing obligations require, among other things, the maintenance of minimum levels of tangible net worth and the satisfaction of certain minimum financial ratios. As of December 27, 2014, the Company was in compliance with all of its debt covenants.
F-9
Share Repurchase Program
The Company’s Board of Directors has extended, until October 2015, its authorization to repurchase up to 20 million shares of the Company’s common stock through open market transactions or through privately negotiated transactions. The Company has no obligation to repurchase any shares and may cancel, suspend, or extend the time period for the repurchase of shares at any time. Any repurchases will be funded primarily through existing cash and cash from operations. The Company may hold any shares repurchased in treasury or use a portion of the repurchased shares for stock-based compensation plans, as well as for other corporate purposes. From its initial authorization in 1999 through December 27, 2014, the Company had repurchased approximately 4.7 million shares under this authorization.
Contractual Cash Obligations
The following table presents payments due by the Company under contractual obligations with minimum firm commitments as of December 27, 2014:
|
Payments Due by Year
|
||||||||||||||||||||
|
(In millions)
|
Total
|
2015
|
2016-2017
|
2018-2019
|
Thereafter
|
|||||||||||||||
|
Deb
|
||||||||||||||||||||
|
Total debt
|
$
|
241.4
|
$
|
36.2
|
$
|
202.0
|
$
|
2.0
|
$
|
1.2
|
||||||||||
|
Consulting agreement (1)
|
2.7
|
1.3
|
1.4
|
—
|
—
|
|||||||||||||||
|
Operating leases
|
15.3
|
6.2
|
6.6
|
2.5
|
—
|
|||||||||||||||
|
Heavy machinery and equipment commitments
|
1.5
|
1.5
|
—
|
—
|
—
|
|||||||||||||||
|
Purchase commitments (2)
|
603.7
|
603.7
|
—
|
—
|
—
|
|||||||||||||||
|
Interest payments (3)
|
16.6
|
5.5
|
11.0
|
0.1
|
—
|
|||||||||||||||
|
Total contractual cash obligations
|
$
|
881.2
|
$
|
654.4
|
$
|
221.0
|
$
|
4.6
|
$
|
1.2
|
||||||||||
|
(1)
|
See Note 8 to Consolidated Financial Statements.
|
|||||||||||||||||||
|
(2)
|
The Company has contractual supply commitments for raw materials totaling $565.2 million at year-end prices; these contracts contain variable pricing based on Comex and the London Metals Exchange. These commitments are for purchases of raw materials that are expected to be consumed in the ordinary course of business.
|
|||||||||||||||||||
|
(3)
|
These payments represent interest on variable rate debt based on rates in effect at December 27, 2014. The Company has entered into an interest rate swap, effective January 12, 2015, which will fix the interest rate associated with the majority of its variable rate debt.
|
|||||||||||||||||||
The above obligations will be satisfied with existing cash, funds available under the credit agreement, and cash generated by operations. The Company has no off-balance sheet financing arrangements except for the operating leases identified above.
Market Risks
The Company is exposed to market risks from changes in raw material and energy costs, interest rates, and foreign currency exchange rates. To reduce such risks, the Company may periodically use financial instruments. Hedging transactions are authorized and executed pursuant to policies and procedures. Further, the Company does not buy or sell financial instruments for trading purposes. A discussion of the Company’s accounting for derivative instruments and hedging activities is included in “Note 1 - Summary of Significant Accounting Policies” in the Notes to Consolidated Financial Statements.
F-10
Cost and Availability of Raw Materials and Energy
Raw materials, primarily copper and brass, represent the largest component of the Company’s variable costs of production. The cost of these materials is subject to global market fluctuations caused by factors beyond our control. Significant increases in the cost of metal, to the extent not reflected in prices for our finished products, or the lack of availability could materially and adversely affect the Company’s business, results of operations and financial condition.
The Company occasionally enters into forward fixed-price arrangements with certain customers. We may utilize futures contracts to hedge risks associated with these forward fixed-price arrangements. We may also utilize futures contracts to manage price risk associated with inventory. Depending on the nature of the hedge, changes in the fair value of the futures contracts will either be offset against the change in fair value of the inventory through earnings or recognized as a component of accumulated other comprehensive income (AOCI) and reflected in earnings upon the sale of inventory. Periodic value fluctuations of the contracts generally offset the value fluctuations of the underlying fixed-price transactions or inventory. At year-end, the Company held open futures contracts to purchase approximately $23.7 million of copper over the next 12 months related to fixed-price sales orders and to sell approximately $1.6 million of copper over the next three months related to copper inventory.
We may enter into futures contracts or forward fixed-price arrangements with certain vendors to manage price risk associated with natural gas purchases. The effective portion of gains and losses with respect to futures positions are deferred in equity as a component of AOCI and reflected in earnings upon consumption of natural gas. Periodic value fluctuations of the futures contracts generally offset the value fluctuations of the underlying natural gas prices. There were no open futures contracts to purchase natural gas at December 27, 2014.
Interest Rates
The Company had variable-rate debt outstanding of $241.4 million at December 27, 2014 and $235.3 million at December 28, 2013. At these borrowing levels, a hypothetical 10 percent increase in interest rates would have had an insignificant unfavorable impact on the Company’s pre-tax earnings and cash flows. The primary interest rate exposures on floating-rate debt are based on LIBOR, the base-lending rate published by the People’s Bank of China, and the base-lending rate published by HSBC. There was no fixed-rate debt outstanding as of December 27, 2014 or December 28, 2013.
We have reduced our exposure to increases in LIBOR by entering into interest rate swap contracts. These contracts have been designated as cash flow hedges. The fair value of these contracts has been recorded in the Consolidated Balance Sheets, and the related gains and losses on the contracts are deferred in stockholders’ equity as a component of AOCI. Deferred gains or losses on the contracts will be recognized in interest expense in the period in which the related interest payment being hedged is expensed. The interest rate swap agreement has an effective date of January 12, 2015.
Foreign Currency Exchange Rates
Foreign currency exposures arising from transactions include firm commitments and anticipated transactions denominated in a currency other than an entity’s functional currency. The Company and its subsidiaries generally enter into transactions denominated in their respective functional currencies. We may utilize certain futures or forward contracts with financial institutions to hedge foreign currency transactional exposures. Gains and losses with respect to these positions are deferred in equity as a component of AOCI and reflected in earnings upon collection of receivables or payment of commitments. At December 27, 2014, the Company had open forward contracts with a financial institution to sell approximately 0.6 million Canadian dollars, 5.1 million euros, 25.8 million Swedish kronor, and 6.8 million Norwegian kroner through December 2015. It also held open futures contracts to buy approximately 1.5 million euros through March 2015.
F-11
The Company’s primary foreign currency exposure arises from foreign-denominated revenues and profits and their translation into U.S. dollars. The primary currencies to which we are exposed include the Canadian dollar, the British pound sterling, the euro, the Mexican peso, and the Chinese renminbi. The Company generally views as long-term its investments in foreign subsidiaries with a functional currency other than the U.S. dollar. As a result, we generally do not hedge these net investments. The net investment in foreign subsidiaries translated into U.S. dollars using the year-end exchange rates was $185.6 million at December 27, 2014 and $174.8 million at December 28, 2013. The potential loss in value of the Company’s net investment in foreign subsidiaries resulting from a hypothetical 10 percent adverse change in quoted foreign currency exchange rates at December 27, 2014 and December 28, 2013 amounted to $18.6 million and $17.5 million, respectively. This change would be reflected in the foreign currency translation component of AOCI in the equity section of our Consolidated Balance Sheets until the foreign subsidiaries are sold or otherwise disposed.
The Company has significant investments in foreign operations whose functional currency is the British pound sterling and the Mexican peso. During 2014, the value of the Mexican peso decreased approximately 11 percent and the British pound decreased approximately six percent relative to the U.S. dollar, respectively. The resulting foreign currency translation losses were recorded as a component of AOCI.
Critical Accounting Policies and Estimates
The Company’s Consolidated Financial Statements are prepared in accordance with accounting principles generally accepted in the United States. Application of these principles requires the Company to make estimates, assumptions, and judgments that affect the amounts reported in the Consolidated Financial Statements. Management believes the most complex and sensitive judgments, because of their significance to the Consolidated Financial Statements, result primarily from the need to make estimates about the effects of matters which are inherently uncertain. The accounting policies and estimates that are most critical to aid in understanding and evaluating the results of operations and financial position of the Company include the following:
Inventory Valuation
The Company’s inventories are valued at the lower-of-cost-or-market. The material component of its U.S. copper tube and copper fittings inventories is valued on a last-in, first-out (LIFO) basis. Other manufactured inventories, including the non-material components of U.S. copper tube and copper fittings, are valued on a first-in, first-out (FIFO) basis. Certain inventories purchased for resale are valued on an average cost basis. Elements of cost in finished goods inventory in addition to the cost of material include depreciation, amortization, utilities, consumable production supplies, maintenance, production wages, and transportation costs.
The market price of copper cathode and scrap are subject to volatility. During periods when open market prices decline below net realizable value, the Company may need to provide an allowance to reduce the carrying value of its inventory. In addition, certain items in inventory may be considered obsolete and, as such, the Company may establish an allowance to reduce the carrying value of those items to their net realizable value. Changes in these estimates related to the value of inventory, if any, may result in a materially adverse impact on our reported financial position or results of operations. The Company recognizes the impact of any changes in estimates, assumptions, and judgments in income in the period in which it is determined.
Goodwill
Goodwill represents cost in excess of fair values assigned to the underlying net assets of acquired businesses. Goodwill is subject to impairment testing, which is performed by the Company as of the first day of the fourth quarter of each fiscal year, unless circumstances dictate more frequent testing. For testing purposes, the Company uses components of its operating segments; components of a segment having similar economic characteristics are combined. The annual impairment test is a two-step process. The first step is the estimation of fair value of reporting units that have goodwill. If this estimate indicates that impairment potentially exists, the second step is performed. Step two, used to measure the amount of goodwill impairment loss, compares the implied fair value of goodwill to the carrying value. In step two the Company is required to allocate the fair value of each reporting unit, as determined in step one, to the fair value of the reporting unit’s assets and liabilities, including unrecognized intangible assets and corporate allocation where applicable, in a hypothetical purchase price allocation as if the reporting unit had been purchased on that date. If the implied fair value of goodwill is less than the carrying value, an impairment charge is recorded. Inputs to that model include various estimates, including cash flow projections and assumptions. Some of the inputs are highly subjective and are affected by changes in business conditions and other factors. Changes in any of the inputs could have an effect on future tests and result in material impairment charges.
F-12
The Company has three reporting units with goodwill. Two of these reporting units are included in the Plumbing & Refrigeration segment, and one is included in the OEM segment.
Income Taxes
Deferred income tax assets and liabilities are recognized when differences arise between the treatment of certain items for financial statement and tax purposes. Realization of certain components of deferred tax assets is dependent upon the occurrence of future events. The Company records valuation allowances to reduce its deferred tax assets to the amount it believes is more likely than not to be realized. These valuation allowances can be impacted by changes in tax laws, changes to statutory tax rates, and future taxable income levels and are based on the Company’s judgment, estimates, and assumptions. In the event the Company were to determine that it would not be able to realize all or a portion of the net deferred tax assets in the future, the Company would increase the valuation allowance through a charge to income tax expense in the period that such determination is made. Conversely, if the Company were to determine that it would be able to realize its deferred tax assets in the future, in excess of the net carrying amounts, the Company would decrease the recorded valuation allowance through a decrease to income tax expense in the period that such determination is made.
The Company provides for uncertain tax positions and the related interest and penalties, if any, based upon management’s assessment of whether a tax benefit is more likely than not to be sustained upon examination by tax authorities. Tax benefits for uncertain tax positions that are recognized in the financial statements are measured as the largest amount of benefit, determined on a cumulative probability basis, that is more likely than not to be realized upon ultimate settlement. To the extent the Company prevails in matters for which a liability for an uncertain tax position is established or is required to pay amounts in excess of the liability, its effective tax rate in a given financial statement period may be affected.
Environmental Reserves
The Company recognizes an environmental liability when it is probable the liability exists and the amount is reasonably estimable. We estimate the duration and extent of our remediation obligations based upon reports of outside consultants; internal analyses of cleanup costs, and ongoing monitoring costs; communications with regulatory agencies; and changes in environmental law. If we were to determine that our estimates of the duration or extent of our environmental obligations were no longer accurate, we would adjust our environmental liabilities accordingly in the period that such determination is made. Estimated future expenditures for environmental remediation are not discounted to their present value. Accrued environmental liabilities are not reduced by potential insurance reimbursements.
Environmental expenses that relate to ongoing operations are included as a component of cost of goods sold. Environmental expenses related to non-operating properties are included in other income, net in the Consolidated Statements of Income.
Allowance for Doubtful Accounts
The Company provides an allowance for receivables that may not be fully collected. In circumstances where we are aware of a customer’s inability to meet their financial obligations (e.g., bankruptcy filings or substantial downgrading of credit ratings), we record an allowance for doubtful accounts against amounts due to reduce the net recognized receivable to the amount we believe most likely will be collected. For all other customers, we recognize an allowance for doubtful accounts based on our historical collection experience. If circumstances change (e.g., greater than expected defaults or an unexpected material change in a major customer’s ability to meet their financial obligations), our estimate of the recoverability of amounts due could be changed by a material amount.
F-13
Cautionary Statement Regarding Forward-Looking Information
This Annual Report contains various forward-looking statements and includes assumptions concerning the Company’s operations, future results, and prospects. These forward-looking statements are based on current expectations and are subject to risk and uncertainties. In connection with the “safe harbor” provisions of the Private Securities Litigation Reform Act of 1995, the Company provides the following cautionary statement identifying important economic, political, and technological factors, among others, which could cause actual results or events to differ materially from those set forth in or implied by the forward-looking statements and related assumptions.
In addition to those factors discussed under “Risk Factors” in this Annual Report on Form 10-K, such factors include: (i) the current and projected future business environment, including interest rates and capital and consumer spending; (ii) the domestic housing and commercial construction industry environment; (iii) availability and price fluctuations in commodities (including copper, natural gas, and other raw materials, including crude oil that indirectly affects plastic resins); (iv) competitive factors and competitor responses to the Company’s initiatives; (v) stability of government laws and regulations, including taxes; (vi) availability of financing; and (vii) continuation of the environment to make acquisitions, domestic and foreign, including regulatory requirements and market values of candidates.
F-14
MUELLER INDUSTRIES, INC.
CONSOLIDATED STATEMENTS OF INCOME
Years Ended December 27, 2014, December 28, 2013, and December 29, 2012
|
(In thousands, except per share data)
|
2014
|
2013
|
2012
|
|||||||||
|
Net sales
|
$
|
2,364,227
|
$
|
2,158,541
|
$
|
2,189,938
|
||||||
|
Cost of goods sold
|
2,043,719
|
1,862,089
|
1,904,463
|
|||||||||
|
Depreciation and amortization
|
33,735
|
32,394
|
31,495
|
|||||||||
|
Selling, general, and administrative expense
|
131,740
|
134,914
|
129,456
|
|||||||||
|
Insurance settlements
|
—
|
(106,332
|
)
|
(1,500
|
)
|
|||||||
|
Gain on sale of assets
|
(6,259
|
)
|
(39,765
|
)
|
—
|
|||||||
|
Impairment charges
|
—
|
4,304
|
—
|
|||||||||
|
Litigation settlements
|
—
|
—
|
(4,050
|
)
|
||||||||
|
Severance
|
7,296
|
—
|
3,369
|
|||||||||
|
Operating income
|
153,996
|
270,937
|
126,705
|
|||||||||
|
Interest expense
|
(5,740
|
)
|
(3,990
|
)
|
(6,890
|
)
|
||||||
|
Other (expense) income, net
|
(243
|
)
|
4,451
|
539
|
||||||||
|
Income before income taxes
|
148,013
|
271,398
|
120,354
|
|||||||||
|
Income tax expense
|
(45,479
|
)
|
(98,109
|
)
|
(36,681
|
)
|
||||||
|
Consolidated net income
|
102,534
|
173,289
|
83,673
|
|||||||||
|
Less net income attributable to noncontrolling interest
|
(974
|
)
|
(689
|
)
|
(1,278
|
)
|
||||||
|
Net income attributable to Mueller Industries, Inc.
|
$
|
101,560
|
$
|
172,600
|
$
|
82,395
|
||||||
|
Weighted average shares for basic earnings per share
|
56,042
|
55,742
|
70,664
|
|||||||||
|
Effect of dilutive stock-based awards
|
726
|
742
|
828
|
|||||||||
|
Adjusted weighted average shares for diluted earnings per share
|
56,768
|
56,484
|
71,492
|
|||||||||
|
Basic earnings per share
|
$
|
1.81
|
$
|
3.10
|
$
|
1.17
|
||||||
|
Diluted earnings per share
|
$
|
1.79
|
$
|
3.06
|
$
|
1.15
|
||||||
|
Dividends per share
|
$
|
0.3000
|
$
|
0.2500
|
$
|
0.2125
|
||||||
|
See accompanying notes to consolidated financial statements.
|
||||||||||||
F-15
MUELLER INDUSTRIES, INC.
CONSOLIDATED STATEMENTS OF COMPREHENSIVE INCOME
Years Ended December 27, 2014, December 28, 2013, and December 29, 2012
|
(In thousands)
|
2014
|
2013
|
2012
|
|||||||||
|
Consolidated net income
|
$
|
102,534
|
$
|
173,289
|
$
|
83,673
|
||||||
|
Other comprehensive (loss) income, net of tax:
|
||||||||||||
|
Foreign currency translation
|
(6,766
|
)
|
3,285
|
8,070
|
||||||||
|
Net change with respect to derivative instruments and hedging activities(1)
|
(2,499
|
)
|
1,713
|
255
|
||||||||
|
Net actuarial (loss) gain on pension and postretirement obligations(2)
|
(23,006
|
)
|
27,369
|
(847
|
)
|
|||||||
|
Other, net
|
15
|
151
|
14
|
|
||||||||
|
Total other comprehensive (loss) income
|
(32,256
|
)
|
32,518
|
7,492
|
||||||||
|
Comprehensive income
|
70,278
|
205,807
|
91,165
|
|||||||||
|
Less comprehensive income attributable to noncontrolling interest
|
(822
|
)
|
(1,404
|
)
|
(1,984
|
)
|
||||||
|
Comprehensive income attributable to Mueller Industries, Inc.
|
$
|
69,456
|
$
|
204,403
|
$
|
89,181
|
||||||
|
See accompanying notes to consolidated financial statements.
|
||||||||||||
|
(1) Net of taxes of $1,362 in 2014, $(962) in 2013, and $(162) in 2012
|
||||||||||||
|
(2) Net of taxes of $10,180 in 2014, $(15,015) in 2013, and $94 in 2012
|
||||||||||||
F-16
MUELLER INDUSTRIES, INC.
CONSOLIDATED BALANCE SHEETS
As of December 27, 2014 and December 28, 2013
|
(In thousands, except share data)
|
2014
|
2013
|
||||||
|
Assets
|
||||||||
|
Current assets:
|
||||||||
|
Cash and cash equivalents
|
$
|
352,134
|
$
|
311,800
|
||||
|
Accounts receivable, less allowance for doubtful accounts of $666 in 2014 and $2,391 in 2013
|
275,065
|
271,847
|
||||||
|
Inventories
|
256,585
|
251,716
|
||||||
|
Other current assets
|
57,429
|
39,354
|
||||||
|
Total current assets
|
941,213
|
874,717
|
||||||
|
Property, plant, and equipment, net
|
245,910
|
244,457
|
||||||
|
Goodwill, net
|
102,909
|
94,357
|
||||||
|
Other assets
|
38,064
|
34,236
|
||||||
|
Total Assets
|
$
|
1,328,096
|
$
|
1,247,767
|
||||
|
Liabilities
|
||||||||
|
Current liabilities:
|
||||||||
|
Current portion of debt
|
$
|
36,194
|
$
|
29,083
|
||||
|
Accounts payable
|
100,735
|
80,897
|
||||||
|
Accrued wages and other employee costs
|
41,595
|
37,109
|
||||||
|
Other current liabilities
|
59,545
|
72,167
|
||||||
|
Total current liabilities
|
238,069
|
219,256
|
||||||
|
Long-term debt, less current portion
|
205,250
|
206,250
|
||||||
|
Pension liabilities
|
20,070
|
10,645
|
||||||
|
Postretirement benefits other than pensions
|
21,486
|
16,781
|
||||||
|
Environmental reserves
|
21,842
|
22,144
|
||||||
|
Deferred income taxes
|
24,556
|
35,975
|
||||||
|
Other noncurrent liabilities
|
1,389
|
849
|
||||||
|
Total liabilities
|
532,662
|
511,900
|
||||||
|
Equity
|
||||||||
|
Mueller Industries, Inc. stockholders’ equity:
|
||||||||
|
Preferred stock - $1.00 par value; shares authorized 5,000,000; none outstanding
|
—
|
—
|
||||||
|
Common stock - $.01 par value; shares authorized 100,000,000; issued 80,183,004; outstanding 56,901,445 in 2014 and 56,604,674 in 2013
|
802
|
401
|
||||||
|
Additional paid-in capital
|
268,575
|
267,142
|
||||||
|
Retained earnings
|
992,798
|
908,274
|
||||||
|
Accumulated other comprehensive loss
|
(42,923
|
)
|
(10,819
|
)
|
||||
|
Treasury common stock, at cost
|
(457,102
|
)
|
(461,593
|
)
|
||||
|
Total Mueller Industries, Inc. stockholders’ equity
|
762,150
|
703,405
|
||||||
|
Noncontrolling interest
|
33,284
|
32,462
|
||||||
|
Total equity
|
795,434
|
735,867
|
||||||
|
Commitments and contingencies
|
—
|
—
|
||||||
|
Total Liabilities and Equity
|
$
|
1,328,096
|
$
|
1,247,767
|
||||
|
See accompanying notes to consolidated financial statements.
|
||||||||
F-17
MUELLER INDUSTRIES, INC.
CONSOLIDATED STATEMENTS OF CASH FLOWS
Years Ended December 27, 2014, December 28, 2013, and December 29, 2012
|
(In thousands)
|
2014
|
2013
|
2012
|
|||||||||
|
Operating activities:
|
||||||||||||
|
Consolidated net income
|
$
|
102,534
|
$
|
173,289
|
$
|
83,673
|
||||||
|
Reconciliation of net income to net cash provided by operating activities:
|
||||||||||||
|
Depreciation
|
30,205
|
30,946
|
30,326
|
|||||||||
|
Amortization of intangibles
|
3,530
|
1,448
|
1,169
|
|||||||||
|
Amortization of debt issuance costs
|
341
|
299
|
438
|
|||||||||
|
Stock-based compensation expense
|
6,265
|
5,704
|
6,136
|
|||||||||
|
Insurance settlements
|
—
|
(106,332
|
)
|
(1,500
|
)
|
|||||||
|
(Gain) loss on disposal of assets
|
(5,405
|
)
|
(42,300
|
)
|
1,411
|
|||||||
|
Insurance proceeds – noncapital related
|
—
|
32,395
|
14,250
|
|||||||||
|
Impairment charges
|
—
|
4,304
|
—
|
|||||||||
|
Income tax benefit from exercise of stock options
|
(837
|
)
|
(719
|
)
|
(2,528
|
)
|
||||||
|
Deferred income taxes
|
(6,495
|
)
|
19,213
|
(1,284
|
)
|
|||||||
|
(Recovery of) provision for doubtful accounts receivable
|
(500
|
)
|
(273
|
)
|
837
|
|
||||||
|
Changes in assets and liabilities, net of businesses acquired and sold:
|
||||||||||||
|
Receivables
|
(21,432
|
)
|
19,383
|
|
(23,690
|
)
|
||||||
|
Inventories
|
1,381
|
5,963
|
(4,834
|
)
|
||||||||
|
Other assets
|
(23,652
|
)
|
562
|
|
(14,985
|
)
|
||||||
|
Current liabilities
|
5,849
|
|
(14,139
|
)
|
8,368
|
|||||||
|
Other liabilities
|
(2,223
|
)
|
(1,935
|
)
|
9,345
|
|||||||
|
Other, net
|
1,044
|
705
|
1,165
|
|||||||||
|
Net cash provided by operating activities
|
90,605
|
128,513
|
108,297
|
|||||||||
|
Investing activities:
|
||||||||||||
|
Proceeds from sale of assets, net of cash transferred
|
33,788
|
65,147
|
517
|
|||||||||
|
Acquisition of businesses, net of cash acquired
|
(30,137
|
)
|
(55,276
|
)
|
(11,561
|
)
|
||||||
|
Capital expenditures
|
(39,173
|
)
|
(41,349
|
)
|
(56,825
|
)
|
||||||
|
Insurance proceeds
|
—
|
29,910
|
42,250
|
|||||||||
|
Net (deposits into) withdrawals from restricted cash balances
|
(2,902
|
)
|
(1,417
|
)
|
9,243
|
|
||||||
|
Net cash used in investing activities
|
(38,424
|
)
|
(2,985
|
)
|
(16,376
|
)
|
||||||
|
Financing activities:
|
||||||||||||
|
Dividends paid to stockholders of Mueller Industries, Inc.
|
(16,819
|
)
|
(13,941
|
)
|
(14,891
|
)
|
||||||
|
Repurchase of common stock
|
—
|
—
|
|
(427,446
|
)
|
|||||||
|
Repayments of long-term debt
|
(1,050
|
)
|
(1,000
|
)
|
(149,176
|
)
|
||||||
|
Issuance (repayment) of debt by joint venture, net
|
7,258
|
857
|
|
(14,429
|
)
|
|||||||
|
Issuance of long-term debt
|
—
|
—
|
200,000
|
|||||||||
|
Net cash used to settle stock-based awards
|
(777
|
)
|
(228
|
)
|
(4,181
|
)
|
||||||
|
Income tax benefit from exercise of stock options
|
837
|
719
|
2,528
|
|||||||||
|
Debt issuance costs
|
—
|
(50
|
)
|
(1,053
|
)
|
|||||||
|
Net cash used in financing activities
|
(10,551
|
)
|
(13,643
|
)
|
(408,648
|
)
|
||||||
|
Effect of exchange rate changes on cash
|
(1,296
|
)
|
981
|
1,499
|
|
|||||||
|
Increase (decrease) in cash and cash equivalents
|
40,334
|
112,866
|
|
(315,228
|
)
|
|||||||
|
Cash and cash equivalents at the beginning of the year
|
311,800
|
198,934
|
514,162
|
|||||||||
|
Cash and cash equivalents at the end of the year
|
$
|
352,134
|
$
|
311,800
|
$
|
198,934
|
||||||
|
See accompanying notes to consolidated financial statements.
|
||||||||||||
F-18
MUELLER INDUSTRIES, INC.
CONSOLIDATED STATEMENTS OF CHANGES IN EQUITY
Years Ended December 27, 2014, December 28, 2013, and December 29, 2012
|
2014
|
2013
|
2012
|
||||||||||||||||||||||
|
(In thousands)
|
Shares
|
Amount
|
Shares
|
Amount
|
Shares
|
Amount
|
||||||||||||||||||
|
Common stock:
|
||||||||||||||||||||||||
|
Balance at beginning of year
|
80,183
|
$
|
401
|
80,183
|
$
|
401
|
80,183
|
$
|
401
|
|||||||||||||||
|
Issuance of shares under two-for-one stock split
|
—
|
401
|
—
|
—
|
—
|
—
|
||||||||||||||||||
|
Balance at end of year
|
80,183
|
$
|
802
|
80,183
|
$
|
401
|
80,183
|
$
|
401
|
|||||||||||||||
|
Additional paid-in capital:
|
||||||||||||||||||||||||
|
Balance at beginning of year
|
$
|
267,142
|
$
|
267,826
|
$
|
266,936
|
||||||||||||||||||
|
Issuance of shares under incentive stock option plans
|
(1,646
|
)
|
(1,205
|
)
|
(4,303
|
)
|
||||||||||||||||||
|
Stock-based compensation expense
|
6,265
|
5,704
|
6,136
|
|||||||||||||||||||||
|
Income tax benefit from exercise of stock options
|
837
|
719
|
2,528
|
|||||||||||||||||||||
|
Issuance of shares under two-for-one stock split
|
(401
|
)
|
—
|
—
|
||||||||||||||||||||
|
Issuance of restricted stock
|
(3,622
|
)
|
(5,902
|
)
|
(3,471
|
)
|
||||||||||||||||||
|
Balance at end of year
|
$
|
268,575
|
$
|
267,142
|
$
|
267,826
|
||||||||||||||||||
|
Retained earnings:
|
||||||||||||||||||||||||
|
Balance at beginning of year
|
$
|
908,274
|
$
|
749,777
|
$
|
682,380
|
||||||||||||||||||
|
Net income attributable to Mueller Industries, Inc.
|
101,560
|
172,600
|
82,395
|
|||||||||||||||||||||
|
Dividends paid or payable to stockholders of Mueller Industries, Inc.
|
(17,036
|
)
|
(14,103
|
)
|
(14,998
|
)
|
||||||||||||||||||
|
Balance at end of year
|
$
|
992,798
|
$
|
908,274
|
$
|
749,777
|
||||||||||||||||||
|
Accumulated other comprehensive (loss) income:
|
||||||||||||||||||||||||
|
Balance at beginning of year
|
|
|
$
|
(10,819
|
)
|
$
|
(42,623
|
)
|
$
|
(49,409
|
)
|
|||||||||||||
|
Total other comprehensive (loss) income attributable to Mueller Industries, Inc.
|
(32,104
|
)
|
31,804
|
6,786
|
||||||||||||||||||||
|
Balance at end of year
|
$
|
(42,923
|
)
|
$
|
(10,819
|
)
|
$
|
(42,623
|
)
|
|||||||||||||||
|
|
||||||||||||||||||||||||
F-19
MUELLER INDUSTRIES, INC.
CONSOLIDATED STATEMENTS OF CHANGES IN EQUITY
(continued)
Years Ended December 27, 2014, December 28, 2013, and December 29, 2012
|
2014
|
2013
|
2012
|
||||||||||||||||||||||
|
(In thousands)
|
Shares
|
Amount
|
Shares
|
Amount
|
Shares
|
Amount
|
||||||||||||||||||
|
Treasury stock:
|
||||||||||||||||||||||||
|
Balance at beginning of year
|
23,578
|
$
|
(461,593
|
)
|
23,984
|
$
|
(468,473
|
)
|
3,710
|
$
|
(44,620
|
)
|
||||||||||||
|
Issuance of shares under incentive stock option plans
|
(208
|
)
|
4,504
|
(244
|
)
|
4,716
|
(1,152
|
)
|
20,881
|
|||||||||||||||
|
Repurchase of common stock
|
107
|
(3,832
|
)
|
140
|
(3,738
|
)
|
21,710
|
(448,205
|
)
|
|||||||||||||||
|
Issuance of restricted stock
|
(195
|
)
|
3,819
|
(302
|
)
|
5,902
|
(284
|
)
|
3,471
|
|||||||||||||||
|
Balance at end of year
|
23,282
|
$
|
(457,102
|
)
|
23,578
|
$
|
(461,593
|
)
|
23,984
|
$
|
(468,473
|
)
|
||||||||||||
|
|
||||||||||||||||||||||||
|
Noncontrolling interest:
|
||||||||||||||||||||||||
|
Balance at beginning of year
|
$
|
32,462
|
$
|
31,058
|
$
|
29,074
|
||||||||||||||||||
|
Net income attributable to noncontrolling interest
|
974
|
689
|
1,278
|
|||||||||||||||||||||
|
Foreign currency translation
|
(152
|
)
|
715
|
706
|
||||||||||||||||||||
|
Balance at end of year
|
$
|
33,284
|
$
|
32,462
|
$
|
31,058
|
||||||||||||||||||
|
See accompanying notes to consolidated financial statements.
|
||||||||||||||||||||||||
F-20
Notes to Consolidated Financial Statements
Note 1 – Summary of Significant Accounting Policies
Nature of Operations
The principal business of Mueller Industries, Inc. is the manufacture and sale of copper tube and fittings; line sets; brass and copper alloy rod, bar, and shapes; aluminum and brass forgings; aluminum and copper impact extrusions; plastic fittings and valves; refrigeration valves and fittings; fabricated tubular products; and steel nipples. The Company also resells imported brass and plastic plumbing valves, malleable iron fittings, faucets, and plumbing specialty products. The Company markets its products to the HVAC, plumbing, refrigeration, hardware, and other industries. Mueller’s operations are located throughout the United States and in Canada, Mexico, Great Britain, and China.
Fiscal Years
The Company’s fiscal year consists of 52 weeks ending on the last Saturday of December. These dates were December 27, 2014, December 28, 2013, and December 29, 2012.
Principles of Consolidation
The Consolidated Financial Statements include the accounts of Mueller Industries, Inc. and its majority owned subsidiaries. All significant intercompany accounts and transactions have been eliminated in consolidation. The noncontrolling interest represents a separate private ownership of 49.5 percent of Mueller-Xingrong.
On February 21, 2014, the Company announced a two-for-one stock split of its common stock effected in the form of a stock dividend of one share for each outstanding share. The record date for the stock split was March 14, 2014, and the additional shares were distributed on March 28, 2014. Accordingly, all references to share and per share amounts presented in the Consolidated Financial Statements and this Annual Report on Form 10-K have been adjusted retroactively to reflect the stock split.
Revenue Recognition
Revenue is recognized when title and risk of loss pass to the customer, provided collection is determined to be probable and no significant obligations remain for the Company. Estimates for future rebates on certain product lines and product returns are recognized in the period in which the revenue is recorded. The cost of shipping product to customers is expensed as incurred as a component of cost of goods sold.
Cash Equivalents
Temporary investments with original maturities of three months or less are considered to be cash equivalents. These investments are stated at cost. At December 27, 2014 and December 28, 2013, temporary investments consisted of money market mutual funds, commercial paper, bank repurchase agreements, and U.S. and foreign government securities totaling $144.9 million and $179.2 million, respectively. Included in other current assets is restricted cash of $8.1 million and $5.2 million at December 27, 2014 and December 28, 2013, respectively. These amounts represent required deposits into brokerage accounts that facilitate the Company’s hedging activities and deposits that secure certain short-term notes issued under Mueller-Xingrong’s credit facility.
Allowance for Doubtful Accounts
The Company provides an allowance for receivables that may not be fully collected. In circumstances where the Company is aware of a customer’s inability to meet their financial obligations (e.g., bankruptcy filings or substantial downgrading of credit ratings), it records an allowance for doubtful accounts against amounts due to reduce the net recognized receivable to the amount it believes most likely will be collected. For all other customers, the Company recognizes an allowance for doubtful accounts based on its historical collection experience. If circumstances change (e.g., greater than expected defaults or an unexpected material change in a major customer’s ability to meet their financial obligations), the Company could change its estimate of the recoverability of amounts due by a material amount.
F-21
Inventories
The Company’s inventories are valued at the lower-of-cost-or-market. The material component of its U.S. copper tube and copper fittings inventories is valued on a LIFO basis. Other manufactured inventories, including the non-material components of U.S. copper tube and copper fittings, are valued on a FIFO basis. Certain inventories purchased for resale are valued on an average cost basis. Elements of cost in finished goods inventory in addition to the cost of material include depreciation, amortization, utilities, maintenance, production wages, and transportation costs.
The market price of copper cathode and scrap is subject to volatility. During periods when open market prices decline below net book value, the Company may need to provide an allowance to reduce the carrying value of its inventory. In addition, certain items in inventory may be considered obsolete and, as such, the Company may establish an allowance to reduce the carrying value of those items to their net realizable value. Changes in these estimates related to the value of inventory, if any, may result in a materially adverse impact on the Company’s reported financial position or results of operations. The Company recognizes the impact of any changes in estimates, assumptions, and judgments in income in the period in which it is determined. See “Note 3 – Inventories” for additional information.
Property, Plant, and Equipment
Property, plant, and equipment are stated at cost. Depreciation of buildings, machinery, and equipment is provided on the straight-line method over the estimated useful lives ranging from 20 to 40 years for buildings and five to 20 years for machinery and equipment. Leasehold improvements are amortized over the lesser of their useful life or the remaining lease term. Repairs and maintenance are expensed as incurred. See “Note 5 – Property, Plant, and Equipment, Net” for additional information.
Goodwill
Goodwill represents cost in excess of fair values assigned to the underlying net assets of acquired businesses. Goodwill is subject to impairment testing, which is performed by the Company as of the first day of the fourth quarter of each fiscal year, unless circumstances dictate more frequent testing. For testing purposes, the Company defines reporting units as components of its operating segments; components of a segment having similar economic characteristics are combined. The annual impairment test is a two-step process. The first step is the estimation of fair value of reporting units that have goodwill. If this estimate indicates that impairment potentially exists, the second step is performed. Step two, used to measure the amount of goodwill impairment loss, compares the implied fair value of goodwill to the carrying value. In step two the Company is required to allocate the fair value of each reporting unit, as determined in step one, to the fair value of the reporting unit’s assets and liabilities, including unrecognized intangible assets and corporate allocation where applicable, in a hypothetical purchase price allocation as if the reporting unit had been purchased on that date. If the implied fair value of goodwill is less than the carrying value, an impairment charge is recorded. The reporting units with significant recorded goodwill include Standard Products (SPD), Mueller Europe, Limited (MEL), and Westermeyer. SPD and MEL are included in the Plumbing & Refrigeration segment, and Westermeyer is included in the OEM segment. There can be no assurance that additional goodwill impairment will not occur in the future.
Because there are no observable inputs available, the Company estimates fair value of reporting units based on a combination of the market approach and income approach (Level 3 hierarchy as defined by Accounting Standards Codification (ASC) 820, Fair Value Measurements and Disclosures (ASC 820)). The market approach measures the fair value of a business through the analysis of publicly traded companies or recent sales of similar businesses. The income approach uses a discounted cash flow model to estimate the fair value of reporting units based on expected cash flows (adjusted for capital investment required to support operations) and a terminal value. This cash flow stream is discounted to its present value to arrive at a fair value for each reporting unit. Future earnings are estimated using the Company’s most recent annual projections, applying a growth rate to future periods. Those projections are directly impacted by the condition of the markets in which the Company’s businesses participate. The discount rate selected for the reporting units is generally based on rates of return available for comparable companies at the date of valuation. See “Note 6 – Goodwill, Net” for additional information.
F-22
Self-Insurance Accruals
The Company is primarily self-insured for workers’ compensation claims and benefits paid under certain employee health care programs. Accruals are primarily based on estimated undiscounted cost of claims, which includes incurred but not reported claims, and are classified as accrued wages and other employee costs.
Benefit Plans
The Company sponsors several qualified and nonqualified pension and other postretirement benefit plans in the U.S. and certain foreign locations. The Company recognizes the overfunded or underfunded status of the plans as an asset or liability in the Consolidated Balance Sheet with changes in the funded status recorded through comprehensive income in the year in which those changes occur. The obligations for these plans are actuarially determined and affected by assumptions, including discount rates, expected long-term return on plan assets for defined benefit pension plans, and certain employee-related factors, such as retirement age and mortality. The Company evaluates its assumptions periodically and makes adjustments as necessary.
The expected return on plan assets is determined using the market value of plan assets. Differences between assumed and actual returns are amortized to the market value of assets on a straight-line basis over the average remaining service period of the plan participants using the corridor approach. The corridor approach defers all actuarial gains and losses resulting from variances between actual results and actuarial assumptions. These unrecognized gains and losses are amortized when the net gains and losses exceed 10 percent of the greater of the market value of the plan assets or the projected benefit obligation. The amount in excess of the corridor is amortized over the average remaining service period of the plan participants. For 2014, the average remaining service period for the pension plans was nine years. See “Note 13 –Benefit Plans” for additional information.
Environmental Reserves and Environmental Expenses
The Company recognizes an environmental liability when it is probable the liability exists and the amount is reasonably estimable. The Company estimates the duration and extent of its remediation obligations based upon reports of outside consultants; internal analyses of cleanup costs and ongoing monitoring costs; communications with regulatory agencies; and changes in environmental law. If the Company were to determine that its estimates of the duration or extent of its environmental obligations were no longer accurate, it would adjust environmental liabilities accordingly in the period that such determination is made. Estimated future expenditures for environmental remediation are not discounted to their present value. Accrued environmental liabilities are not reduced by potential insurance reimbursements.
Environmental expenses that relate to ongoing operations are included as a component of cost of goods sold. Environmental expenses related to non-operating properties are included in other income, net on the Consolidated Statements of Income. See “Note 8 – Commitments and Contingencies” for additional information.
Earnings Per Share
Basic earnings per share is computed based on the weighted average number of common shares outstanding. Diluted earnings per share reflects the increase in weighted average common shares outstanding that would result from the assumed exercise of outstanding stock options and vesting of restricted stock awards calculated using the treasury stock method. Approximately 180 thousand stock-based awards were excluded from the computation of diluted earnings per share for the year ended December 27, 2014 because they were antidilutive.
F-23
Income Taxes
Deferred income tax assets and liabilities are recognized when differences arise between the treatment of certain items for financial statement and tax purposes. Realization of certain components of deferred tax assets is dependent upon the occurrence of future events. The Company records valuation allowances to reduce its deferred tax assets to the amount it believes is more likely than not to be realized. These valuation allowances can be impacted by changes in tax laws, changes to statutory tax rates, and future taxable income levels and are based on the Company’s judgment, estimates, and assumptions regarding those future events. In the event the Company was to determine that it would not be able to realize all or a portion of the net deferred tax assets in the future, it would increase the valuation allowance through a charge to income tax expense in the period that such determination is made. Conversely, if it were to determine that it would be able to realize its deferred tax assets in the future, in excess of the net carrying amounts, the Company would decrease the recorded valuation allowance through a decrease to income tax expense in the period that such determination is made.
The Company provides for uncertain tax positions and the related interest and penalties, if any, based upon management’s assessment of whether a tax benefit is more likely than not to be sustained upon examination by tax authorities. Tax benefits for uncertain tax positions that are recognized in the financial statements are measured as the largest amount of benefit, determined on a cumulative probability basis, that is more likely than not to be realized upon ultimate settlement. To the extent the Company prevails in matters for which a liability for an uncertain tax position is established or is required to pay amounts in excess of the liability, the Company’s effective tax rate in a given financial statement period may be affected.
These estimates are highly subjective and could be affected by changes in business conditions and other factors. Changes in any of these factors could have a material impact on future income tax expense. See “Note 9 – Income Taxes” for additional information.
Taxes Collected from Customers and Remitted to Governmental Authorities
Taxes assessed by a governmental authority that are directly imposed on a revenue producing transaction between the Company and its customers, primarily value added taxes in foreign jurisdictions, are accounted for on a net (excluded from revenues and costs) basis.
Stock-Based Compensation
The Company has in effect stock incentive plans under which stock-based awards have been granted to certain employees and members of its Board of Directors. Stock-based compensation expense is recognized in the Consolidated Statements of Income as a component of selling, general, and administrative expense based on the grant date fair value of the awards. See “Note 11 – Stock-Based Compensation” for additional information.
Concentrations of Credit and Market Risk
Concentrations of credit risk with respect to accounts receivable are limited due to the large number of customers comprising the Company’s customer base, and their dispersion across different geographic areas and different industries, including HVAC, plumbing, refrigeration, hardware, automotive, OEMs, and others.
The Company minimizes its exposure to base metal price fluctuations through various strategies. Generally, it prices an equivalent amount of copper raw material, under flexible pricing arrangements it maintains with its suppliers, at the time it determines the selling price of finished products to its customers.
Derivative Instruments and Hedging Activities
The Company may utilize futures contracts to manage the volatility related to purchases of copper through cash flow hedges. It may also utilize futures contracts to protect the value of the copper inventory on hand and firm commitments to purchase copper through fair value hedges. The Company may elect to utilize futures contracts as economic hedges that do not qualify for hedge accounting in accordance with ASC 815, Derivatives and Hedging (ASC 815). In addition, the Company may use foreign currency forward contracts to reduce the risk from exchange rate fluctuations on future purchases and intercompany transactions denominated in foreign currencies.
F-24
All derivatives are recognized in the Consolidated Balance Sheets at their fair value. On the date the derivative contract is entered into, it is designated as (i) a hedge of a forecasted transaction or the variability of cash flow to be paid (cash flow hedge), or (ii) a hedge of the fair value of a recognized asset or liability (fair value hedge). Changes in the fair value of a derivative that is qualified, designated and highly effective as a cash flow hedge are recorded in accumulated other comprehensive income (AOCI), to the extent effective, until they are reclassified to earnings in the same period or periods during which the hedged transaction affects earnings. Changes in the fair value of a derivative that is qualified, designated and highly effective as a fair value hedge, along with the gain or loss on the hedged recognized asset or liability that is attributable to the hedged risk, are recorded in current earnings. Changes in the fair value of undesignated derivative instruments and the ineffective portion of designated derivative instruments are reported in current earnings.
The Company documents all relationships between hedging instruments and hedged items, as well as the risk-management objective and strategy for undertaking various hedge transactions. This process includes linking all derivatives that are designated as fair value hedges to specific assets and liabilities in the Consolidated Balance Sheets and linking cash flow hedges to specific forecasted transactions or variability of cash flow.
The Company also assesses, both at the hedge’s inception and on an ongoing basis, whether the designated derivatives that are used in hedging transactions are highly effective in offsetting changes in cash flow or fair values of hedged items. When a derivative is determined not to be highly effective as a hedge or the underlying hedged transaction is no longer probable, hedge accounting is discontinued prospectively, in accordance with the derecognition criteria for hedge accounting.
The Company primarily executes derivative contracts with major financial institutions. These counterparties expose the Company to credit risk in the event of non-performance. The amount of such exposure is limited to the fair value of the contract plus the unpaid portion of amounts due to the Company pursuant to terms of the derivative instruments, if any. If a downgrade in the credit rating of these counterparties occurs, management believes that this exposure is mitigated by provisions in the derivative arrangements which allow for the legal right of offset of any amounts due to the Company from the counterparties with any amounts payable to the counterparties by the Company. As a result, management considers the risk of loss from counterparty default to be minimal. See “Note 14 – Derivative Instruments and Hedging Activities” for additional information.
Fair Value of Financial Instruments
The carrying amounts for cash and cash equivalents, accounts receivable, and accounts payable approximate fair value due to the short-term maturity of these instruments.
The fair value of long-term debt at December 27, 2014 approximates the carrying value on that date. The estimated fair values were determined based on quoted market prices and the current rates offered for debt with similar terms and maturities. The fair value of long-term debt is classified as Level 2 within the fair value hierarchy. This classification is defined as a fair value determined using market-based inputs other than quoted prices that are observable for the liability, either directly or indirectly. Outstanding borrowings have variable interest rates that re-price frequently at current market rates.
Foreign Currency Translation
For foreign subsidiaries in which the functional currency is other than the U.S. dollar, balance sheet accounts are translated at exchange rates in effect at the end of the year and income statement accounts are translated at average exchange rates for the year. Translation gains and losses are included in equity as a component of OCI. Included in the Consolidated Statements of Income were transaction gains of $0.1 million in 2014, losses of $0.1 million in 2013, and losses of $0.3 million in 2012.
Use of Estimates
The preparation of financial statements in conformity with accounting principles generally accepted in the United States (U.S. GAAP) requires management to make estimates, assumptions, and judgments that affect the amounts reported in the financial statements and accompanying notes. Actual results could differ from those estimates.
F-25
Recently Issued Accounting Standards
In April 2014, the Financial Accounting Standards Board (FASB) issued Accounting Standards Update (ASU) No, 2014-08, Reporting Discontinued Operations and Disclosures of Disposals of Components of an Entity (ASU 2014-08). The ASU significantly changed the criteria for reporting a discontinued operation and added disclosure requirements for discontinued operations and other disposal transactions. It is effective for annual reporting periods beginning after December 15, 2014 and is applied prospectively. The Company has elected early adoption of ASU 2014-08 effective September 28, 2014. The new guidance did not have a significant impact on the Company’s Consolidated Financial Statements or related disclosures.
In May 2014, the FASB issued ASU No. 2014-09, Revenue from Contracts with Customers (Topic 606) (ASU 2014-09). The ASU will supersede virtually all existing revenue recognition guidance under U.S. GAAP and will be effective for annual reporting periods beginning after December 15, 2016. The fundamental principles of the new guidance are that companies should recognize revenue in a manner that reflects the timing of the transfer of services to customers and the amount of revenue recognized reflects the consideration that a company expects to receive for the goods and services provided. The new guidance establishes a five-step approach for the recognition of revenue. The Company is in the process of evaluating the impact of ASU 2014-09 on its Consolidated Financial Statements.
Note 2 – Acquisitions and Dispositions
Acquisitions
On October 18, 2013, the Company entered into a definitive agreement with KME Yorkshire Limited to acquire certain assets and assume certain liabilities of its copper tube business. Yorkshire Copper Tube (Yorkshire) produces European standard copper distribution tubes. This transaction received regulatory approval in the United Kingdom on February 11, 2014 and closed on February 28, 2014. The purchase price was approximately $30.1 million, paid in cash. The acquisition of Yorkshire complements the Company’s existing copper tube businesses in the Plumbing & Refrigeration segment. In 2012, Yorkshire had annual revenue of approximately $196.1 million. During the third quarter of 2014, the purchase price allocation, including all fair value measurements, was finalized. The fair value of the assets acquired totaled $20.7 million, consisting primarily of inventories of $17.6 million, property, plant, and equipment of $2.1 million, and other current assets of $1.0 million. The fair value of the liabilities assumed totaled $15.6 million, consisting primarily of accounts payable and accrued expenses of $15.2 million and other current liabilities of $0.4 million. Of the remaining purchase price, $8.1 million was allocated to tax-deductible goodwill and $16.9 million was allocated to other intangible assets.
The Company recognized approximately $7.3 million of severance costs related to the reorganization of Yorkshire during 2014 and expects to recognize an additional $2.7 million of expense in 2015.
On October 17, 2013, the Company entered into a Stock Purchase Agreement with Commercial Metals Company and Howell Metal Company (Howell) providing for the purchase of all of the outstanding capital stock of Howell for approximately $55.3 million in cash, net of working capital adjustments. Howell manufactures copper tube and line sets for U.S. distribution. The acquisition of Howell complements the Company’s copper tube and line sets businesses, both components of the Plumbing & Refrigeration segment. For the twelve months ended August 31, 2013, Howell’s net sales for copper tube and line sets totaled $156.3 million. During the first quarter of 2014, the purchase price allocation, including all fair value measurements, was finalized. The fair value of the assets acquired totaled $63.0 million, consisting primarily of receivables of $14.6 million, inventories of $27.6 million, property, plant, and equipment of $20.3 million, and other current assets of $0.5 million. The fair value of the liabilities assumed totaled $11.4 million, consisting primarily of accounts payable and accrued expenses of $9.9 million and other current liabilities of $1.5 million. Of the remaining purchase price, $2.3 million was allocated to other intangible assets and $1.3 million to tax-deductible goodwill.
On August 16, 2012, the Company acquired 100 percent of the outstanding stock of Westermeyer Industries, Inc. (Westermeyer) for approximately $11.6 million in cash. Westermeyer, located in Bluffs, Illinois, designs, manufactures, and distributes high-pressure components and accessories for the air-conditioning and refrigeration markets. The acquisition of Westermeyer complements the Company’s existing refrigeration business, a component of the OEM segment. The fair value of the assets acquired totaled $7.5 million, consisting of receivables of $2.0 million, inventories of $1.9 million, and property, plant, and equipment of $3.6 million. These assets were partially offset by current liabilities of approximately $1.0 million. Of the remaining purchase price, $2.3 million was allocated to tax-deductible goodwill and $2.7 million to other intangible assets.
F-26
These acquisitions were accounted for using the acquisition method of accounting. Therefore, the results of operations of the acquired businesses were included in the Company’s Consolidated Financial Statements from their respective acquisition dates. The purchase price for these acquisitions, which was financed by available cash balances, has been allocated to the assets and liabilities of the acquired businesses based on their respective fair market values.
Dispositions
On November 21, 2014, the Company entered into a Share Purchase Agreement with Travis Perkins PLC to sell all of the outstanding capital stock of Mueller Primaflow Limited (Primaflow), the Company’s United Kingdom based plumbing and heating systems import distribution business, for approximately $24.9 million. Primaflow, which serves markets in the United Kingdom and Ireland, was included in the Plumbing & Refrigeration segment and reported net sales of $57.5 million and after-tax net income of $4.4 million for the 2014 fiscal year. The carrying value of the assets disposed totaled $25.3 million, consisting primarily of accounts receivable and inventories. The carrying value of the liabilities disposed totaled $7.1 million, consisting primarily of accounts payable and other current liabilities. In addition, the Company recognized a cumulative translation loss of $6.0 million. The net gain on the sale of this business was immaterial to the Consolidated Financial Statements.
During November 2014, the Company sold its ABS plastic pipe manufacturing assets. These assets had a carrying value of approximately $1.9 million and were part of the SPD reporting unit, which is a component of the Plumbing & Refrigeration segment. The sales price was $6.0 million, which resulted in a pre-tax gain of $4.1 million.
On August 9, 2013, the Company sold certain of its plastic fittings manufacturing assets located in Portage, Michigan and Ft. Pierce, Florida. Simultaneously, the Company entered into a lease agreement with the purchaser of the assets to continue to manufacture and distribute Schedule 40 plastic fittings utilizing the Ft. Pierce assets for a period of approximately eight to 14 months (Transition Period). The total sales price was $66.2 million, of which $61.2 million was received on August 9, 2013; the remaining $5.0 million was received during the second quarter of 2014. This transaction resulted in a pre-tax gain of $39.8 million in the third quarter of 2013, or 41 cents per diluted share after tax.
The net book value of the plastic fittings manufacturing assets disposed was $15.9 million. For goodwill testing purposes, these assets were part of the SPD reporting unit which is a component of the Company’s Plumbing & Refrigeration segment. Because these assets met the definition of a business in accordance with ASC 805, Business Combinations, $10.5 million of the SPD reporting unit’s goodwill balance was allocated to the disposal group. The amount of goodwill allocated was based on the relative fair values of the asset group which was disposed and the portion of the SPD reporting unit which was retained.
The Company has continued to manufacture and supply plastic drain, waste, and vent (DWV) fittings, and extended its third party supply agreement to complement its product offering with purchased products it does not manufacture with the remaining assets. This supply agreement was originally entered into after the majority of the Company’s plastic manufacturing assets were destroyed in the 2011 fire at its Wynne, Arkansas facility.
With the decision to cease the Company’s manufacturing operations in Portage, there was an evaluation of the remaining long-lived assets for impairment, and it was determined that the carrying values of the land and building were no longer recoverable. An impairment charge of $3.2 million was recognized during the third quarter of 2013 to adjust the carrying values of the land and building to their estimated fair value. The fair value estimate was determined by obtaining and evaluating recent sales data for similar assets (Level 2 hierarchy as defined by ASC 820). During March 2014, the land and building in Portage were sold for $4.7 million, resulting in a pre-tax gain of $1.4 million.
F-27
Note 3 – Inventories
|
(In thousands)
|
2014
|
2013
|
||||||
|
Raw materials and supplies
|
$
|
53,586
|
$
|
54,613
|
||||
|
Work-in-process
|
39,707
|
43,796
|
||||||
|
Finished goods
|
168,481
|
159,422
|
||||||
|
Valuation reserves
|
(5,189
|
)
|
(6,115
|
)
|
||||
|
Inventories
|
$
|
256,585
|
$
|
251,716
|
||||
Inventories valued using the LIFO method totaled $25.9 million at December 27, 2014 and $34.9 million at December 28, 2013. At December 27, 2014 and December 28, 2013, the approximate FIFO cost of such inventories was $104.8 million and $117.9 million, respectively. Additionally, the Company valued certain inventories purchased for resale on an average cost basis. The value of those inventories was $47.7 million at December 27, 2014 and $54.7 million at December 28, 2013.
During 2011, inventory quantities valued using the LIFO method declined which resulted in liquidation of LIFO inventory layers. This liquidation resulted from intercompany sales; therefore, the gain from the LIFO liquidation of approximately $8.0 million was deferred. During the first quarter of 2012, the Company sold this inventory to third parties and recognized the gain. This recognition resulted in a reduction of approximately $8.0 million to cost of sales, or seven cents per diluted share after tax for 2012.
At the end of 2014 and 2013, the FIFO value of inventory consigned to others was $4.3 million.
Note 4 – Consolidated Financial Statement Details
Other Current Liabilities
Included in other current liabilities were accrued discounts and allowances of $45.3 million at December 27, 2014 and $43.2 million at December 28, 2013.
Other (Expense) Income, Net
|
(In thousands)
|
2014
|
2013
|
2012
|
|||||||||
|
Gain on the sale of non-operating property
|
$
|
—
|
$
|
3,000
|
$
|
—
|
||||||
|
Interest income
|
573
|
906
|
847
|
|||||||||
|
Environmental expense, non-operating properties
|
(822
|
)
|
(823
|
)
|
(1,128
|
)
|
||||||
|
Other
|
6
|
1,368
|
820
|
|||||||||
|
Other (expense) income, net
|
$
|
(243
|
)
|
$
|
4,451
|
$
|
539
|
|||||
F-28
Note 5 – Property, Plant, and Equipment, Net
|
(In thousands)
|
2014
|
2013
|
||||||
|
Land and land improvements
|
$
|
12,198
|
$
|
13,153
|
||||
|
Buildings
|
120,035
|
132,331
|
||||||
|
Machinery and equipment
|
561,093
|
561,005
|
||||||
|
Construction in progress
|
44,787
|
25,691
|
||||||
|
738,113
|
732,180
|
|||||||
|
Less accumulated depreciation
|
(492,203
|
)
|
(487,723
|
)
|
||||
|
Property, plant, and equipment, net
|
$
|
245,910
|
$
|
244,457
|
||||
Note 6 – Goodwill and Other Intangible Assets
Goodwill
The changes in the carrying amount of goodwill were as follows:
|
(In thousands)
|
|
Plumbing & Refrigeration Segment
|
|
|
OEM Segment
|
|
|
Total
|
|
|||
|
|
|
|
|
|
|
|
|
|
|
|
|
|
|
Balance at December 29, 2012:
|
|
|
|
|
|
|
|
|
|
|
|
|
|
Goodwill
|
|
$
|
141,684
|
|
|
$
|
12,300
|
|
|
$
|
153,984
|
|
|
Accumulated impairment and amortization
|
|
|
(39,434
|
)
|
|
|
(9,971
|
)
|
|
|
(49,405
|
)
|
|
|
|
|
|
|
|
|
|
|
|
|
|
|
|
|
|
|
102,250
|
|
|
|
2,329
|
|
|
|
104,579
|
|
|
|
|
|
|
|
|
|
|
|
|
|
|
|
|
Additions
|
|
|
310
|
|
|
|
—
|
|
|
|
310
|
|
|
Disposition
|
|
|
(10,532
|
)
|
|
|
—
|
|
|
|
(10,532
|
)
|
|
Balance at December 28, 2013:
|
|
|
|
|
|
|
|
|
|
|
|
|
|
Goodwill
|
|
|
131,462
|
|
|
|
12,300
|
|
|
|
143,762
|
|
|
Accumulated impairment and amortization
|
|
|
(39,434
|
)
|
|
|
(9,971
|
)
|
|
|
(49,405
|
)
|
|
|
|
|
|
|
|
|
|
|
|
|
|
|
|
|
|
|
92,028
|
|
|
|
2,329
|
|
|
|
94,357
|
|
|
|
|
|
|
|
|
|
|
|
|
|
|
|
|
Additions(1)
|
|
|
9,123
|
|
|
|
—
|
|
|
|
9,123
|
|
|
Currency translation
|
(571
|
)
|
—
|
(571
|
)
|
|||||||
|
Balance at December 27, 2014:
|
|
|
|
|
|
|
|
|
|
|
||
|
Goodwill
|
|
|
140,014
|
|
|
|
12,300
|
|
|
|
152,314
|
|
|
Accumulated impairment and amortization
|
|
|
(39,434
|
)
|
|
|
(9,971
|
)
|
|
|
(49,405
|
)
|
|
|
|
|
|
|
|
|
|
|
|
|||
|
Goodwill, net
|
$
|
100,580
|
$
|
2,329
|
$
|
102,909
|
||||||
|
(1) Includes finalization of the purchase price allocation adjustment for Howell of $1.0 million
|
|
|||||||||||
In 2013, the Company acquired Howell. Of the $55.3 million purchase price, $1.3 million was allocated to goodwill. In 2014, the Company acquired Yorkshire. Of the $30.1 million purchase price, $8.1 million was allocated to goodwill.
As discussed in Note 2, $10.5 million of goodwill relating to the SPD reporting unit was disposed of in 2013 in conjunction with the sale of a business.
F-29
There were no impairment charges resulting from the 2014, 2013, or 2012 impairment tests, as the estimated fair value of the reporting units exceeded the carrying value.
Other Intangible Assets
The gross and net book value of other intangible assets included in other assets was $7.8 million and $5.5 million, respectively, at December 28, 2013. The carrying amount of intangible assets at December 27, 2014 was as follows:
|
(In thousands)
|
Estimated Useful Life
|
Gross Carrying Amount
|
Accumulated Amortization
|
Net Carrying Amount
|
|||||||||
|
Customer relationships
|
20 years
|
$ | 11,852 | $ | (526 | ) | $ | 11,326 | |||||
|
Non-compete agreements
|
3-5 years
|
4,495 | (1,307 | ) | 3,188 | ||||||||
|
Patents and technology
|
10 years
|
6,852 | (4,744 | ) | 2,108 | ||||||||
|
Trade names and licenses
|
3 years
|
1,670 | (252 | ) | 1,418 | ||||||||
|
Other
|
2-5 years
|
877 | (453 | ) | 424 | ||||||||
|
Other intangible assets
|
$ | 25,746 | $ | (7,282 | ) | $ | 18,464 | ||||||
With the acquisition of Howell in 2013, $2.3 million of the purchase price was allocated to other intangible assets relating to trade names and customer relationships. During 2014, the purchase price allocation, including fair value adjustments, was finalized. With the acquisition of Yorkshire in 2014, $16.9 million of the purchase price was allocated to other intangible assets. This included customer relationships, non-compete agreements, and trade names and licenses. The remaining change was related to currency translation.
Amortization expense for intangible assets was $3.2 million in 2014, $0.9 million in 2013, and $0.7 million in 2012. Future amortization expense is estimated as follows:
|
(In thousands)
|
Amount
|
|||
|
2015
|
$
|
3,412
|
||
|
2016
|
2,519
|
|||
|
2017
|
1,334
|
|||
|
2018
|
1,079
|
|||
|
2019
|
1,011
|
|||
|
Thereafter
|
9,109
|
|||
|
Expected amortization expense
|
$
|
18,464
|
||
F-30
Note 7 – Debt
|
(In thousands)
|
2014
|
2013
|
||||||
|
Term Loan Facility with interest at 1.53%, due 2017
|
$
|
200,000
|
$
|
200,000
|
||||
|
Mueller-Xingrong credit facility with interest at 5.60%, due 2015
|
29,968
|
28,033
|
||||||
|
2001 Series IRB’s with interest at 1.13%, due through 2021
|
6,250
|
7,250
|
||||||
|
Other
|
5,226
|
50
|
||||||
|
241,444
|
235,333
|
|||||||
|
Less current portion of debt
|
(36,194
|
)
|
(29,083
|
)
|
||||
|
Long-term debt
|
$
|
205,250
|
$
|
206,250
|
||||
Effective May 29, 2014, the Company elected to modify its credit agreement (the Credit Agreement) entered into on March 7, 2011 to reduce the unsecured $350.0 million revolving credit facility to $200.0 million. The Credit Agreement also provides for a $200.0 million Term Loan Facility, which, together with the Revolving Loan Facility, mature on December 11, 2017. Borrowings under the Credit Agreement bear interest, at the Company’s option, at LIBOR or Base Rate as defined by the Credit Agreement, plus a variable premium. LIBOR advances may be based upon the one, three, or six-month LIBOR. The variable premium is based upon the Company’s debt to total capitalization ratio, and can range from 112.5 to 162.5 basis points for LIBOR based loans and 12.5 to 62.5 basis points for Base Rate loans. At December 27, 2014, the premium was 137.5 basis points for LIBOR loans and 37.5 basis points for Base Rate loans. Additionally, a facility fee is payable quarterly on the total commitment and varies from 25.0 to 37.5 basis points based upon the Company’s debt to total capitalization ratio. Availability of funds under the Revolving Credit Facility is reduced by the amount of certain outstanding letters of credit, which are used to secure the Company’s payment of insurance deductibles and certain retiree health benefits, totaling approximately $10.5 million at December 27, 2014. Terms of the letters of credit are generally one year but are renewable annually. There were no borrowings outstanding on the Revolving Credit Facility at the end of 2014.
On March 21, 2014, Mueller Europe, Limited (MEL) entered into a credit agreement (the Invoice Facility) establishing a total borrowing capacity of £40.0 million, or approximately $62.2 million. The Invoice Facility has an initial term of two years. Borrowings outstanding under the Invoice Facility are secured by MEL’s trade account receivables denominated in British pounds which totaled $57.9 million at December 27, 2014. There were no borrowings outstanding at the end of 2014.
On September 23, 2013, Mueller-Xingrong entered into a secured revolving credit facility (the JV Credit Agreement), which matured on September 24, 2014. At the maturity date, individual draws on the JV Credit Agreement had maturity dates ranging up to nine months. Borrowings under the JV Credit Agreement bear an interest rate at the latest base-lending rate published by the People’s Bank of China, which was 5.6 percent at December 27, 2014. On February 2, 2015, Mueller-Xingrong entered into a new secured revolving credit agreement with a total borrowing capacity of RMB 230 million (or approximately $37.1 million). In addition, Mueller-Xingrong occasionally finances working capital through various accounts receivable and bank draft discount arrangements. Total borrowings at Mueller-Xingrong were $35.2 million at December 27, 2014.
Covenants contained in the Company’s financing obligations require, among other things, the maintenance of minimum levels of tangible net worth and the satisfaction of certain minimum financial ratios. At December 27, 2014, the Company was in compliance with all debt covenants.
F-31
Aggregate annual maturities of the Company’s debt are as follows:
|
(In thousands)
|
Amount
|
|||
|
2015
|
$
|
36,194
|
||
|
2016
|
1,000
|
|||
|
2017
|
201,000
|
|||
|
2018
|
1,000
|
|||
|
2019
|
1,000
|
|||
|
Thereafter
|
1,250
|
|||
|
Long-term debt
|
$
|
241,444
|
||
Net interest expense consisted of the following:
|
(In thousands)
|
|
2014
|
|
|
2013
|
|
|
2012
|
|
|||
|
|
|
|
|
|
|
|
|
|
|
|
|
|
|
Interest expense
|
|
$
|
6,393
|
|
|
$
|
5,147
|
|
|
$
|
6,890
|
|
|
Capitalized interest
|
|
|
(653
|
)
|
|
|
(1,157
|
)
|
|
|
—
|
|
|
|
|
|
|
|
|
|
|
|
|
|
|
|
|
|
|
$
|
5,740
|
|
|
$
|
3,990
|
|
|
$
|
6,890
|
|
Interest paid in 2014, 2013, and 2012 was $5.7 million, $4.9 million, and $8.4 million, respectively.
Note 8 – Commitments and Contingencies
Environmental
The Company is subject to environmental standards imposed by federal, state, local, and foreign environmental laws and regulations. For all properties, the Company has provided and charged to expense $1.2 million in 2014, $1.0 million in 2013, and $3.1 million in 2012 for pending environmental matters. Environmental costs related to non-operating properties are classified as a component of other income, net and costs related to operating properties are classified as cost of goods sold. Environmental reserves totaled $22.7 million at December 27, 2014 and $23.6 million at December 28, 2013. As of December 27, 2014, the Company expects to spend $0.7 million in 2015, $0.8 million in 2016, $0.7 million in 2017, $0.7 million in 2018, $0.8 million in 2019, and $9.4 million thereafter for ongoing projects. The timing of a potential payment for a $9.5 million settlement offer related to the Southeast Kansas Sites has not yet been determined.
Non-operating Properties
Southeast Kansas Sites
The Kansas Department of Health and Environment (KDHE) has contacted the Company regarding environmental contamination at three former smelter sites in Kansas (Altoona, Iola and East La Harpe). While the Company believes that legally it is not a successor to the companies that operated these smelter sites, it is discussing possible settlement with KDHE and other potentially responsible parties (PRP) in order to avoid litigation. In 2008, the Company established a reserve of $9.5 million for this matter. Another PRP has conducted a site investigation of the Altoona site under a consent decree with KDHE. The Company and two other PRPs have conducted a site study evaluation of the East La Harpe site under KDHE supervision, and are now discussing sharing the costs of a possible cleanup. The EPA is in the early stages of study and remediation in the vicinity of the Iola site, which it added to the National Priority List (NPL) in May, 2013 as the “Former United Zinc & Associated Smelters” site. The NPL is a list of priority sites where the EPA has determined that there has been a release or threatened release of hazardous substances that warrant investigation and, if appropriate, remedial action. The NPL does not assign liability to any party including the owner or operator of a property placed on the NPL.
F-32
Shasta Area Mine Sites
Mining Remedial Recovery Company (MRRC), a wholly owned subsidiary, owns certain inactive mines in Shasta County, California. MRRC has continued a program, begun in the late 1980s, of sealing mine portals with concrete plugs in mine adits, which were discharging water. The sealing program achieved significant reductions in the metal load in discharges from these adits; however, additional reductions are required pursuant to an order issued by the California Regional Water Quality Control Board (QCB). In response to a 1996 Order issued by the QCB, MRRC completed a feasibility study in 1997 describing measures designed to mitigate the effects of acid rock drainage. In December 1998, the QCB modified the 1996 order extending MRRC’s time to comply with water quality standards. In September 2002, the QCB adopted a new order requiring MRRC to adopt Best Management Practices (BMP) to control discharges of acid mine drainage. That order extended the time to comply with water quality standards until September 2007. During that time, implementation of BMP further reduced impacts of acid rock drainage; however, full compliance has not been achieved. The QCB is presently renewing MRRC’s discharge permit and will concurrently issue a new order. It is expected that the new ten-year permit will include an order requiring continued implementation of BMP through 2025 to address residual discharges of acid rock drainage. At this site, MRRC spent approximately $1.7 million from 2012 through 2014 and estimates that it will spend between approximately $10.5 million and $13.0 million over the next 20 years.
Lead Refinery Site
U.S.S. Lead Refinery, Inc. (Lead Refinery), a non-operating wholly owned subsidiary of Mining Remedial Recovery Company, has conducted corrective action and interim remedial activities and studies (collectively, Site Activities) at Lead Refinery’s East Chicago, Indiana site pursuant to the Resource Conservation and Recovery Act. Site Activities, which began in December 1996, have been substantially concluded. Lead Refinery is required to perform monitoring and maintenance activities with respect to Site Activities pursuant to a post-closure permit issued by the Indiana Department of Environmental Management effective as of March 2, 2013. Lead Refinery spent approximately $0.1 million annually in 2014, 2013 and 2012 with respect to this site. Approximate costs to comply with the post-closure permit, including associated general and administrative costs, are between $1.9 million and $3.6 million over the next 20 years.
On April 9, 2009, pursuant to the Comprehensive Environmental Response, Compensation, and Liability Act (CERCLA), the EPA added the Lead Refinery site, and properties surrounding the Lead Refinery site, to the NPL. On July 17, 2009, Lead Refinery received a written notice from the EPA that the agency is of the view that Lead Refinery may be a PRP under CERCLA in connection with the release or threat of release of hazardous substances including lead into properties surrounding the Lead Refinery site. The EPA has identified two other PRPs in connection with the release or threat of release of hazardous substances into properties surrounding the Lead Refinery site. In November 2012, the EPA adopted a remedy in connection with properties surrounding the Lead Refinery site. In September 2014, the EPA announced that it had entered into a settlement with the two other PRPs whereby they will pay approximately $26.0 million to fund the cleanup of approximately 300 properties surrounding the Lead Refinery site. The EPA has not contacted Lead Refinery regarding settlement of the agency’s potential claims related to the properties surrounding the Lead Refinery site.
As of December 27, 2014, the EPA has not conducted an investigation of the Lead Refinery site, proposed remedies for the Lead Refinery site, or informed Lead Refinery that it is a PRP at the Lead Refinery site. The Company is unable to determine the likelihood of a material adverse outcome or the amount or range of a potential loss with respect to placement of the Lead Refinery site and adjacent properties on the NPL. Lead Refinery lacks the financial resources needed to undertake any investigations or remedial action that may be required by the EPA pursuant to CERCLA.
F-33
Operating Properties
Mueller Copper Tube Products, Inc.
In 1999, Mueller Copper Tube Products, Inc. (MCTP), a wholly owned subsidiary, commenced a cleanup and remediation of soil and groundwater at its Wynne, Arkansas plant. MCTP is currently removing trichloroethylene, a cleaning solvent formerly used by MCTP, from the soil and groundwater. On August 30, 2000, MCTP received approval of its Final Comprehensive Investigation Report and Storm Water Drainage Investigation Report addressing the treatment of soils and groundwater from the Arkansas Department of Environmental Quality (ADEQ). The Company established a reserve for this project in connection with the acquisition of MCTP in 1998. Effective November 17, 2008, MCTP entered into a Settlement Agreement and Administrative Order by Consent to submit a Supplemental Investigation Work Plan (SIWP) and subsequent Final Remediation Work Plan for the site. By letter dated January 20, 2010, ADEQ approved the SIWP as submitted, with changes acceptable to the Company. On December 16, 2011, MCTP entered into an amended Administrative Order by Consent to prepare and implement a revised Remediation Work Plan regarding final remediation for the Site. Construction and installation of the remediation system is under way. The remediation system was activated in February 2014. Costs to implement the work plans, including associated general and administrative costs, are approximately $0.8 million to $1.3 million over the next ten years.
United States Department of Commerce Antidumping Review
On December 23, 2009, the DOC initiated an antidumping administrative review of the antidumping duty order covering circular welded non-alloy steel pipe and tube from Mexico for the November 1, 2008 through October 31, 2009 period of review. The DOC selected Mueller Comercial as a respondent in the review. On June 21, 2011, the DOC published the final results of the review and assigned Mueller Comercial an antidumping duty rate of 19.8 percent. On August 22, 2011, the Company appealed the final results to the CIT. On December 21, 2012, the CIT issued a decision upholding the Department’s final results in part. The CIT issued its final judgment on May 2, 2013. On May 6, 2013, the Company appealed the CIT decision to the U.S. Court of Appeals for the Federal Circuit (Federal Circuit). On May 29, 2014, the Federal Circuit issued its decision vacating the CIT’s decision and remanding the case back to DOC to reconsider the Company’s rate. The Company and the United States have reached an agreement to settle the appeal. The Company anticipates that certain of its subsidiaries will incur antidumping duties on subject imports made during the period of review and, as such, established a reserve of approximately $1.1 million for this matter.
Subsequent to October 31, 2009, Mueller Comercial did not ship subject merchandise to the United States. Therefore, there is zero antidumping duty liability for periods of review after October 31, 2009.
Leases
The Company leases certain facilities, vehicles, and equipment under operating leases expiring on various dates through 2019. The lease payments under these agreements aggregate to approximately $6.2 million in 2015, $3.9 million in 2016, $2.6 million in 2017, $2.1 million in 2018, and $0.4 million in 2019. Total lease expense amounted to $9.8 million in 2014, $9.1 million in 2013, and $8.5 million in 2012.
Consulting Agreement
During 2004, the Company entered into a consulting and non-compete agreement (the Consulting Agreement) with Mr. Harvey L. Karp, at that time Chairman of the Board. The Consulting Agreement provides for post-employment services to be provided by Mr. Karp for a six-year period. During the first four years of the Consulting Agreement, an annual fee equal to two-thirds of the executive’s Final Base Compensation (as defined in the Consulting Agreement) is payable. During the final two years, the annual fee is set at one-third of the executive’s Final Base Compensation. During the term of the Consulting Agreement, Mr. Karp agrees not to engage in Competitive Activity (as defined in the Consulting Agreement) and is entitled to receive certain other benefits from the Company.
On November 3, 2011, Mr. Karp notified the Company that he would resign as Chairman of the Company and as a member of the Board of Directors of the Company effective as of December 31, 2011. Following his resignation, on January 1, 2012, the Consulting Agreement commenced. Based upon the value of the non-compete provisions of the Consulting Agreement, the Company expenses the value of the Consulting Agreement over its term. The maximum amount payable under the remaining term of the Consulting Agreement is $2.7 million.
F-34
Other
In July 2009, there was an explosion at the Company’s copper tube facility in Fulton, Mississippi, resulting in damage to certain production equipment. In 2010, the Company recorded a gain of $1.5 million related to the property damage claim. In 2012, the Company settled the business interruption portion of this claim and recognized a $1.5 million gain.
In September 2011, a portion of the Company’s Wynne, Arkansas manufacturing operation was damaged by fire. Certain inventories, production equipment, and building structures were extensively damaged. During 2013, the Company settled the claim with its insurer for total proceeds of $127.3 million, net of the deductible of $0.5 million. As a result of the settlement with its insurer, all proceeds received and all costs previously deferred (which were recorded as other current liabilities in prior periods) were recognized, resulting in a pre-tax gain of $106.3 million in 2013, or $1.17 per diluted share after tax. The Company received proceeds of $62.3 million and $55.0 million in 2013 and 2012, respectively.
In October 2012, the Company settled a lawsuit against a former supplier. In connection with the settlement, the Company received a $5.8 million cash payment which is recorded in the Consolidated Statement of Income net of legal costs.
Additionally, the Company is involved in certain litigation as a result of claims that arose in the ordinary course of business, which management believes will not have a material adverse effect on the Company’s financial position, results of operations, or cash flows. It may also realize the benefit of certain legal claims and litigation in the future; these gain contingencies are not recognized in the Consolidated Financial Statements.
Note 9 – Income Taxes
The components of income before income taxes were taxed under the following jurisdictions:
|
(In thousands)
|
2014
|
2013
|
2012
|
|||||||||
|
Domestic
|
$
|
135,445
|
$
|
262,220
|
$
|
105,945
|
||||||
|
Foreign
|
12,568
|
9,178
|
14,409
|
|||||||||
|
Income before income taxes
|
$
|
148,013
|
$
|
271,398
|
$
|
120,354
|
||||||
F-35
Income tax expense consists of the following:
|
(In thousands)
|
2014
|
2013
|
2012
|
|||||||||
|
Current tax expense:
|
||||||||||||
|
Federal
|
$
|
45,723
|
$
|
69,565
|
$
|
33,152
|
||||||
|
Foreign
|
2,346
|
2,608
|
1,764
|
|||||||||
|
State and local
|
3,905
|
6,723
|
3,049
|
|||||||||
|
Current tax expense
|
51,974
|
78,896
|
37,965
|
|||||||||
|
Deferred tax (benefit) expense:
|
||||||||||||
|
Federal
|
(2,469
|
)
|
17,694
|
570
|
||||||||
|
Foreign
|
890
|
(376
|
)
|
(2,015
|
)
|
|||||||
|
State and local
|
(4,916
|
)
|
1,895
|
161
|
||||||||
|
Deferred tax (benefit) expense
|
(6,495
|
)
|
19,213
|
(1,284
|
)
|
|||||||
|
Income tax expense
|
$
|
45,479
|
$
|
98,109
|
$
|
36,681
|
||||||
No provision is made for U.S. income taxes applicable to undistributed earnings of foreign subsidiaries that are indefinitely reinvested in foreign operations. It is not practicable to compute the potential deferred tax liability associated with these undistributed foreign earnings. The Company has approximately $75.0 million of undistributed foreign earnings for which it has not recorded deferred tax liabilities.
The difference between the reported income tax expense and a tax determined by applying the applicable U.S. federal statutory income tax rate to income before income taxes is reconciled as follows:
|
(In thousands)
|
2014
|
2013
|
2012
|
|||||||||
|
Expected income tax expense
|
$
|
51,805
|
$
|
94,989
|
$
|
42,124
|
||||||
|
State and local income tax, net of federal benefit
|
3,355
|
6,405
|
3,178
|
|||||||||
|
Effect of foreign statutory rate different from U.S. and other foreign adjustments
|
(1,094
|
)
|
(1,026
|
)
|
(2,637
|
)
|
||||||
|
Valuation allowance changes
|
(5,732
|
)
|
—
|
(1,224
|
)
|
|||||||
|
U.S. production activities deduction
|
(4,025
|
)
|
(4,445
|
)
|
(2,975
|
)
|
||||||
|
Goodwill disposition
|
—
|
1,790
|
—
|
|||||||||
|
Tax contingency changes
|
—
|
(140
|
)
|
(3,224
|
)
|
|||||||
|
Other, net
|
1,170
|
536
|
1,439
|
|||||||||
|
Income tax expense
|
$
|
45,479
|
$
|
98,109
|
$
|
36,681
|
||||||
During 2014, the Company released a valuation allowance of $5.7 million, or ten cents per diluted share, related to certain state income tax credits. As a result of legislative changes enacted in 2014, the Company now expects to be able to use such credits within the foreseeable future. During 2012, the Company released a valuation allowance of $1.2 million, or two cents per diluted share, due to the expectation that certain state tax attributes would be utilized.
F-36
The following summarizes the activity related to the Company’s unrecognized tax benefits:
|
(In thousands)
|
2014
|
2013
|
||||||
|
Beginning balance
|
$
|
2,828
|
$
|
3,259
|
||||
|
Increases related to prior year tax positions
|
—
|
|
—
|
|||||
|
Increases related to current year tax positions
|
—
|
—
|
||||||
|
Decreases related to prior year tax positions
|
(2,828
|
)
|
—
|
|||||
|
Decreases related to settlements with taxing authorities
|
—
|
|
(431
|
)
|
||||
|
Decreases due to lapses in the statute of limitations
|
—
|
—
|
||||||
|
Ending balance
|
$
|
—
|
$
|
2,828
|
||||
The $2.8 million reduction of unrecognized tax benefits in 2014 had no impact on the effective tax rate. The Company includes interest and penalties related to income tax matters as a component of income tax expense. The net reduction to income tax expense related to penalties and interest was immaterial in 2014, 2013, and 2012.
The Internal Revenue Service completed its audit of the Company’s 2012 tax return during 2014, the result of which was immaterial to the Consolidated Financial Statements. The Company is currently under audit in various other jurisdictions.
The statute of limitations is still open for the Company’s federal tax return and most state income tax returns for 2011 and all subsequent years. The statutes of limitations for certain state and foreign returns are also open for some earlier tax years due to differing statute periods. While the Company believes that it is adequately reserved for possible audit adjustments, the final resolution of these examinations cannot be determined with certainty and could result in final settlements that differ from current estimates.
The tax effects of temporary differences that give rise to significant portions of the deferred tax assets and deferred tax liabilities are presented below:
|
(In thousands)
|
2014
|
2013
|
||||||
|
Deferred tax assets:
|
||||||||
|
Inventories
|
$
|
12,815
|
$
|
11,136
|
||||
|
Other postretirement benefits and accrued items
|
14,550
|
13,548
|
||||||
|
Pension
|
4,792
|
—
|
||||||
|
Other reserves
|
10,262
|
12,931
|
||||||
|
Federal and foreign tax attributes
|
6,451
|
5,913
|
||||||
|
State tax attributes, net of federal benefit
|
22,928
|
24,663
|
||||||
|
Share-based compensation
|
3,016
|
2,486
|
||||||
|
Total deferred tax assets
|
74,814
|
70,677
|
||||||
|
Less valuation allowance
|
(17,119
|
)
|
(22,544
|
)
|
||||
|
Deferred tax assets, net of valuation allowance
|
57,695
|
48,133
|
||||||
|
Deferred tax liabilities:
|
||||||||
|
Property, plant, and equipment
|
57,089
|
60,425
|
||||||
|
Pension
|
—
|
4,507
|
||||||
|
Other
|
1,721
|
2,209
|
||||||
|
Total deferred tax liabilities
|
58,810
|
67,141
|
||||||
|
Net deferred tax liability
|
$
|
(1,115
|
)
|
$
|
(19,008
|
)
|
||
F-37
As of December 27, 2014, after consideration of the federal impact, the Company had state income tax credit carryforwards of $4.1 million, all of which expire by 2017, and other state income tax credit carryforwards of $11.1 million with unlimited lives. The Company had state net operating loss (NOL) carryforwards with potential tax benefits of $7.8 million expiring between 2017 and 2029. The state tax credit and NOL carryforwards are offset by valuation allowances totaling $11.8 million.
As of December 27, 2014, the Company had federal and foreign tax attributes with potential tax benefits of $6.4 million, of which $4.5 million has an unlimited life and $1.9 million expire from 2015 to 2019. These attributes were offset by valuation allowances of $3.4 million.
The change in the valuation allowance was primarily related to the release of the $5.7 million valuation allowance related to the state income tax credits as a result of 2014 legislative changes. The remainder of the change had no material impact on the effective tax rate.
Income taxes paid were approximately $47.3 million in 2014, $80.1 million in 2013, and $38.4 million in 2012.
Note 10 – Equity
The Company’s Board of Directors has extended, until October 2015, its authorization to repurchase up to 20 million shares of the Company’s common stock through open market transactions or through privately negotiated transactions. The Company has no obligation to purchase any shares and may cancel, suspend, or extend the time period for the purchase of shares at any time. Any purchases will be funded primarily through existing cash and cash from operations. The Company may hold any shares purchased in treasury or use a portion of the repurchased shares for its stock-based compensation plans, as well as for other corporate purposes. From its initial authorization in 1999 through December 27, 2014, the Company had repurchased approximately 4.7 million shares under this authorization.
The Company entered into an agreement with Leucadia National Corporation (Leucadia) pursuant to which the Company repurchased from Leucadia 20.8 million shares of the Company’s common stock on September 24, 2012 at a total cost of $427.3 million. The Company’s repurchase transaction with Leucadia was completed outside of the repurchase authorization previously approved by the Board of Directors.
Note 11 – Stock-Based Compensation
The Company has in effect stock incentive plans under which stock-based awards have been granted to certain employees and members of its Board of Directors. Under these existing plans, the Company may grant options to purchase shares of common stock at prices not less than the fair market value of the stock on the date of grant, as well as restricted stock awards. Generally, the awards vest annually over a five-year period beginning one year from the date of grant. Any unexercised options expire after not more than ten years.
In May 2014, the Company’s stockholders approved the 2014 Incentive Plan (2014 Plan). The 2014 Plan authorizes the award of stock-based incentives to employees and non-employee directors. Awards include options to purchase stock at specified prices during specified time periods, restricted stock, restricted stock units, stock appreciation rights, and performance awards, including cash awards. The 2014 Plan reserved 1.5 million shares of common stock which may be issued or transferred upon the exercise of options.
During the years ended December 27, 2014, December 28, 2013, and December 29, 2012, the Company recognized stock-based compensation, as a component of selling, general, and administrative expense, in its Consolidated Statements of Income of $6.3 million, $5.7 million, and $4.0 million, respectively. The tax benefit from exercise of share-based awards was $0.8 million in 2014, $0.7 million in 2013, and $2.6 million in 2012.
On October 26, 2012, the Company’s Chief Financial Officer (CFO) resigned. In connection with the resignation, on November 7, 2012, the Company entered into a separation agreement with its former CFO. Included in the separation agreement were provisions to allow (i) continued vesting of options to purchase shares of the Company’s common stock and unvested shares of restricted stock previously granted and (ii) continued exercisability of vested options through the later of the original expiration date or October 30, 2015 without regard to service. This modification to remove the service condition resulted in the recognition of $2.1 million of compensation cost on the modification date which is included in severance expense in the 2012 Consolidated Statement of Income.
F-38
Stock Options
The fair value of each option is estimated as a single award and amortized into compensation expense on a straight-line or accrual basis over its vesting period based on its vesting schedule. The weighted average grant-date fair value of options granted during 2014, 2013, and 2012 was $9.00, $8.77, and $7.45, respectively.
The Company estimates the fair value of all stock option awards as of the grant date by applying the Black-Scholes-Merton option pricing model. The use of this valuation model in the determination of compensation expense involves certain assumptions that are judgmental and/or highly sensitive including the expected life of the option, stock price volatility, risk-free interest rate, and dividend yield. Additionally, forfeitures are estimated at the time of valuation and reduce expense ratably over the vesting period. The forfeiture rate, which is adjusted periodically based on actual forfeitures, was 16.4 percent in 2014 and 16.5 percent in 2012. Due to the nature of the awards granted in 2013, a forfeiture rate was not considered necessary. The weighted average of key assumptions used in determining the fair value of options granted and a discussion of the methodology used to develop each assumption are as follows:
|
2014
|
2013
|
2012
|
||||||||||
|
Expected term
|
5.6 years
|
5.9 years
|
6.5 years
|
|||||||||
|
Expected price volatility
|
34.3%
|
39.7%
|
37.5%
|
|||||||||
|
Risk-free interest rate
|
1.7%
|
0.7%
|
0.7%
|
|||||||||
|
Dividend yield
|
1.0%
|
0.9%
|
0.9%
|
|||||||||
Expected term – This is the period of time estimated based on historical experience over which the options granted are expected to remain outstanding. An increase in the expected term will increase compensation expense.
Expected price volatility – This is a measure of the amount by which a price has fluctuated or is expected to fluctuate. The Company uses actual historical changes in the market value of its stock to calculate the volatility assumption. Daily market value changes from the date of grant over a past period representative of the expected term of the options are used. An increase in the expected price volatility rate will increase compensation expense.
Risk-free interest rate – This is the U.S. Treasury rate for the week of the grant, having a term representative of the expected term of the options. An increase in the risk-free rate will increase compensation expense.
Dividend yield – This rate is the annual dividends per share as a percentage of the Company’s stock price. An increase in the dividend yield will decrease compensation expense.
The total intrinsic value of options exercised was $3.5 million, $2.9 million, and $12.1 million in 2014, 2013, and 2012, respectively. The total fair value of options that vested was $1.0 million, $1.1 million, and $1.7 million in 2014, 2013, and 2012, respectively.
At December 27, 2014, the aggregate intrinsic value of all outstanding options was $18.2 million with a weighted average remaining contractual term of 5.1 years. Of the outstanding options, 795 thousand are currently exercisable with an aggregate intrinsic value of $15.1 million, a weighted average exercise price of $15.07, and a weighted average remaining contractual term of 4.0 years.
The total compensation expense not yet recognized related to unvested options at December 27, 2014 was $1.4 million with an average expense recognition period of 3.0 years.
F-39
Restricted Stock Awards
The fair value of each restricted stock award equals the fair value of the Company’s stock on the grant date and is amortized into compensation expense on a straight-line or accrual basis over its vesting period based on its vesting schedule. The weighted average grant-date fair value of awards granted during 2014, 2013, and 2012 was $28.80, $28.32, and $21.42, respectively.
The aggregate intrinsic value of outstanding and unvested awards was $24.7 million at December 27, 2014. Total compensation expense for restricted stock awards not yet recognized was $13.3 million with an average expense recognition period of 3.6 years. The total fair value of awards that vested was $4.2 million, $1.8 million, and $1.7 million in 2014, 2013, and 2012, respectively.
The Company generally issues treasury shares when options are exercised or restricted stock awards are granted. A summary of the activity and related information follows:
|
Stock Options
|
Restricted Stock Awards
|
|||||||||||||||
|
(Shares in thousands)
|
Shares
|
Weighted Average Exercise Price
|
Shares
|
Weighted Average Grant Date Fair Value
|
||||||||||||
|
Outstanding at December 28, 2013
|
1,177 | $ | 14.67 | 732 | $ | 21.75 | ||||||||||
|
Granted
|
202 | 28.79 | 197 | 28.80 | ||||||||||||
|
Exercised
|
(231 | ) | 13.20 | (200 | ) | 21.00 | ||||||||||
|
Forfeited
|
(21 | ) | 21.22 | (2 | ) | 28.28 | ||||||||||
|
Outstanding at December 27, 2014
|
1,127 | 17.38 | 727 | 25.21 | ||||||||||||
Approximately 1.6 million shares were available for future stock incentive awards at December 27, 2014.
Note 12 – Accumulated Other Comprehensive Income (Loss)
AOCI includes certain foreign currency translation adjustments from those subsidiaries not using the U.S. dollar as their functional currency, net deferred gains and losses on certain derivative instruments accounted for as cash flow hedges, adjustments to pension and OPEB liabilities, and unrealized gains and losses on marketable securities classified as available-for-sale.
F-40
The following table provides changes in AOCI by component, net of taxes and noncontrolling interest (amounts in parentheses indicate debits to AOCI):
|
(In thousands)
|
Cumulative Translation Adjustment
|
Unrealized (Losses)/ Gains on Derivatives
|
Minimum Pension/OPEB Liability Adjustment
|
Unrealized Gains on Equity Investments
|
Total
|
|||||||||||||||
|
Balance at December 29, 2012
|
$
|
(3,032
|
)
|
$
|
(167
|
)
|
$
|
(39,527
|
)
|
$
|
103
|
$
|
(42,623
|
)
|
||||||
|
Other comprehensive income (loss) before reclassifications
|
2,570
|
(2,102
|
)
|
24,851
|
152
|
25,471
|
||||||||||||||
|
Amounts reclassified from AOCI
|
—
|
3,815
|
2,518
|
—
|
6,333
|
|||||||||||||||
|
Balance at December 28, 2013
|
(462
|
)
|
1,546
|
(12,158
|
)
|
255
|
|
(10,819
|
)
|
|||||||||||
|
Other comprehensive income (loss) before reclassifications
|
(12,613
|
)
|
(2,766
|
)
|
(23,475
|
)
|
15
|
(38,839
|
)
|
|||||||||||
|
Amounts reclassified from AOCI
|
5,999
|
267
|
469
|
—
|
6,735
|
|||||||||||||||
|
Balance at December 27, 2014
|
$
|
(7,076
|
)
|
$
|
(953
|
)
|
$
|
(35,164
|
)
|
$
|
270
|
$
|
(42,923
|
)
|
||||||
F-41
Reclassification adjustments out of AOCI were as follows:
|
Amount reclassified from AOCI
|
|||||||||||||
|
(In thousands)
|
2014
|
2013
|
2012
|
Affected Line Item
|
|||||||||
|
Unrealized losses on derivatives:
|
|||||||||||||
|
Commodity contracts
|
$
|
328
|
$
|
5,618
|
$
|
763
|
Cost of goods sold
|
||||||
|
Foreign currency contracts
|
—
|
54
|
—
|
Depreciation expense
|
|||||||||
|
(61
|
)
|
(1,857
|
)
|
(294
|
)
|
Income tax expense
|
|||||||
|
267
|
3,815
|
469
|
Net of tax
|
||||||||||
|
—
|
—
|
—
|
Noncontrolling interest
|
||||||||||
|
$
|
267
|
$
|
3,815
|
$
|
469
|
Net of tax and noncontrolling interest
|
|||||||
|
Amortization of net loss and prior service cost on employee benefit plans
|
$
|
541
|
$
|
3,844
|
$
|
3,809
|
Selling, general, and administrative expense
|
||||||
|
(72
|
)
|
(1,326
|
)
|
(1,308
|
)
|
Income tax expense
|
|||||||
|
469
|
2,518
|
2,501
|
Net of tax
|
||||||||||
|
—
|
—
|
—
|
Noncontrolling interest
|
||||||||||
|
$
|
469
|
$
|
2,518
|
$
|
2,501
|
Net of tax and noncontrolling interest
|
|||||||
|
Loss recognized upon sale of business
|
$
|
5,999
|
$ |
—
|
$ |
—
|
Gain on sale of assets
|
||||||
|
—
|
—
|
—
|
Income tax benefit
|
||||||||||
|
5,999
|
—
|
—
|
Net of tax
|
||||||||||
|
—
|
—
|
—
|
Noncontrolling interest
|
||||||||||
|
$
|
5,999
|
$
|
—
|
$
|
—
|
Net of tax and noncontrolling interest
|
|||||||
F-42
Note 13 – Benefit Plans
Pension and Other Postretirement Plans
The Company sponsors several qualified and nonqualified pension plans and other postretirement benefit plans for certain employees. The following tables provide a reconciliation of the changes in the plans’ benefit obligations and the fair value of the plans’ assets for 2014 and 2013, and a statement of the plans’ aggregate funded status:
|
Pension Benefits
|
Other Benefits
|
|||||||||||||||
|
(In thousands)
|
2014
|
2013
|
2014
|
2013
|
||||||||||||
|
Change in benefit obligation:
|
||||||||||||||||
|
Obligation at beginning of year
|
$
|
184,058
|
$
|
196,167
|
$
|
15,381
|
$
|
18,096
|
||||||||
|
Service cost
|
973
|
948
|
348
|
413
|
||||||||||||
|
Interest cost
|
8,590
|
7,774
|
685
|
647
|
||||||||||||
|
Actuarial loss (gain)
|
30,138
|
|
(11,635
|
)
|
4,272
|
(2,554
|
)
|
|||||||||
|
Benefit payments
|
(11,064
|
)
|
(10,668
|
)
|
(1,142
|
)
|
(1,211
|
)
|
||||||||
|
Foreign currency translation adjustment
|
(4,957
|
)
|
1,472
|
(237
|
)
|
(10
|
)
|
|||||||||
|
Obligation at end of year
|
207,738
|
184,058
|
19,307
|
15,381
|
||||||||||||
|
Change in fair value of plan assets:
|
||||||||||||||||
|
Fair value of plan assets at beginning of year
|
188,870
|
160,980
|
—
|
—
|
||||||||||||
|
Actual return on plan assets
|
12,716
|
35,578
|
—
|
—
|
||||||||||||
|
Employer contributions
|
3,275
|
1,551
|
1,142
|
1,211
|
||||||||||||
|
Benefit payments
|
(11,064
|
)
|
(10,668
|
)
|
(1,142
|
)
|
(1,211
|
)
|
||||||||
|
Foreign currency translation adjustment
|
(3,781
|
)
|
1,429
|
—
|
—
|
|||||||||||
|
Fair value of plan assets at end of year
|
190,016
|
188,870
|
—
|
—
|
||||||||||||
|
(Underfunded) funded status at end of year
|
$
|
(17,722
|
)
|
$
|
4,812
|
$
|
(19,307
|
)
|
$
|
(15,381
|
)
|
|||||
The following represents amounts recognized in AOCI (before the effect of income taxes):
|
Pension Benefits
|
Other Benefits
|
|||||||||||||||
|
(In thousands)
|
2014
|
2013
|
2014
|
2013
|
||||||||||||
|
Unrecognized net actuarial loss (gain)
|
$
|
49,830
|
$
|
21,128
|
$
|
473
|
$
|
(4,016
|
)
|
|||||||
|
Unrecognized prior service cost
|
—
|
1
|
14
|
20
|
||||||||||||
The Company sponsors one pension plan in the U.K. which comprised 40 percent of the above benefit obligation at December 27, 2014 and December 28, 2013, and 34 percent of the above plan assets at December 27, 2014 and December 28, 2013, respectively.
As of December 27, 2014, $2.9 million of the actuarial net loss will, through amortization, be recognized as components of net periodic benefit cost in 2015.
The aggregate status of all overfunded plans is recognized as an asset and the aggregate status of all underfunded plans is recognized as a liability in the Consolidated Balance Sheets. The amounts recognized as a liability are classified as current or long-term on a plan-by-plan basis. Liabilities are classified as current to the extent the actuarial present value of benefits payable within the next 12 months exceeds the fair value of plan assets, with all remaining amounts being classified as long-term. As of December 27, 2014 and December 28, 2013, the total funded status of the plans recognized in the Consolidated Balance Sheets was as follows:
|
Pension Benefits
|
Other Benefits
|
|||||||||||||||
|
(In thousands)
|
2014
|
2013
|
2014
|
2013
|
||||||||||||
|
Long-term asset
|
$
|
2,348
|
$
|
15,457
|
$
|
—
|
$
|
—
|
||||||||
|
Current liability
|
—
|
—
|
(1,251
|
)
|
(1,033
|
)
|
||||||||||
|
Long-term liability
|
(20,070
|
)
|
(10,645
|
)
|
(18,056
|
)
|
(14,348
|
)
|
||||||||
|
Total (underfunded) funded status
|
$
|
(17,722
|
)
|
$
|
4,812
|
$
|
(19,307
|
)
|
$
|
(15,381
|
)
|
|||||
The components of net periodic benefit cost are as follows:
|
(In thousands)
|
2014
|
2013
|
2012
|
|||||||||
|
Pension benefits:
|
||||||||||||
|
Service cost
|
$
|
973
|
$
|
948
|
$
|
884
|
||||||
|
Interest cost
|
8,590
|
7,774
|
8,472
|
|||||||||
|
Expected return on plan assets
|
(13,669
|
)
|
(11,059
|
)
|
(10,263
|
)
|
||||||
|
Amortization of prior service cost
|
1
|
1
|
1
|
|||||||||
|
Amortization of net loss
|
752
|
4,005
|
3,883
|
|||||||||
|
Net periodic benefit (income) cost
|
$
|
(3,353
|
)
|
$
|
1,669
|
$
|
2,977
|
|||||
|
Other benefits:
|
||||||||||||
|
Service cost
|
$
|
348
|
$
|
413
|
$
|
380
|
||||||
|
Interest cost
|
685
|
647
|
635
|
|||||||||
|
Amortization of prior service cost (credit)
|
6
|
(2
|
)
|
(2
|
)
|
|||||||
|
Amortization of net gain
|
(218
|
)
|
(160
|
)
|
(73
|
)
|
||||||
|
Net periodic benefit cost
|
$
|
821
|
$
|
898
|
$
|
940
|
||||||
The weighted average assumptions used in the measurement of the Company’s benefit obligations are as follows:
|
Pension Benefits
|
Other Benefits
|
|||||||||||||||
|
|
2014
|
2013
|
2014
|
2013
|
||||||||||||
|
|
|
|
|
|
||||||||||||
|
Discount rate
|
4.03 | % | 4.82 | % | 4.33 | % | 4.89 | % | ||||||||
|
Expected long-term return on plan assets
|
5.58 | % | 7.40 | % | N/A | N/A | ||||||||||
|
Rate of compensation increases
|
N/A | N/A | 5.00 | % | 5.50 | % | ||||||||||
|
Rate of inflation
|
3.10 | % | 3.40 | % | N/A | N/A | ||||||||||
The weighted average assumptions used in the measurement of the Company’s net periodic benefit cost are as follows:
|
|
Pension Benefits
|
Other Benefits
|
||||||||||||||||||||||
|
|
2014
|
2013
|
2012
|
2014
|
2013
|
2012
|
||||||||||||||||||
|
|
||||||||||||||||||||||||
|
Discount rate
|
4.82 | % | 4.13 | % | 4.80 | % | 4.89 | % | 4.06 | % | 4.97 | % | ||||||||||||
|
Expected long-term return on plan assets
|
7.40 | % | 7.15 | % | 7.11 | % | N/A | N/A | N/A | |||||||||||||||
|
Rate of compensation increases
|
N/A | N/A | N/A | 5.50 | % | 5.04 | % | 5.04 | % | |||||||||||||||
|
Rate of inflation
|
3.40 | % | 2.70 | % | 3.00 | % | N/A | N/A | N/A | |||||||||||||||
The Company’s Mexican postretirement plans use the rate of compensation increase in the benefit formulas. Past service on the U.K. pension plan will be adjusted for the effects of inflation. All other pension and postretirement plans use benefit formulas based on length of service.
F-44
The annual assumed rate of increase in the per capita cost of covered benefits (i.e., health care cost trend rate) is assumed to range from 7.0 to 9.0 percent for 2015, gradually decrease to 4.5 percent through 2022, and remain at that level thereafter. The health care cost trend rate assumption could have a significant effect on the amounts reported. For example, increasing the assumed health care cost trend rates by one percentage point would increase the accumulated postretirement benefit obligation by $2.0 million and the service and interest cost components of net periodic postretirement benefit costs by $0.1 million for 2015. Decreasing the assumed health care cost trend rates by one percentage point in each year would decrease the accumulated postretirement benefit obligation and the service and interest cost components of net periodic postretirement benefit costs for 2015 by $1.7 million and $0.1 million, respectively.
Pension Assets
The weighted average asset allocation of the Company’s pension fund assets are as follows:
|
|
Pension Plan Assets
|
|||||||
|
Asset category
|
2014
|
2013
|
||||||
|
|
||||||||
|
Equity securities (includes equity mutual funds)
|
49 | % | 86 | % | ||||
|
Fixed income securities (includes fixed income mutual funds)
|
4 | 4 | ||||||
|
Cash and equivalents (includes money market funds)
|
44 | 7 | ||||||
|
Alternative investments
|
3 | 3 | ||||||
|
|
||||||||
|
Total
|
100 | % | 100 | % | ||||
At December 27, 2014, the long-term target allocation, by asset category, of assets of its defined benefit pension plans was: (i) fixed income securities - at least 60 percent; (ii) equity securities, including equity index funds - not more than 30 percent; and (iii) alternative investments - not more than 5 percent.
The pension plan obligations are long-term and, accordingly, the plan assets are invested for the long-term. Plan assets are monitored periodically. Based upon results, investment managers and/or asset classes are redeployed when considered necessary. None of the plans’ assets are expected to be returned to the Company during the next fiscal year. The assets of the plans do not include investments in securities issued by the Company.
The estimated rates of return on plan assets are the expected future long-term rates of earnings on plan assets and are forward-looking assumptions that materially affect pension cost. Establishing the expected future rates of return on pension assets is a judgmental matter. The Company reviews the expected long-term rates of return on an annual basis and revises as appropriate. The expected long-term rate of return on plan assets was 5.58 percent for 2014 and 7.40 percent in 2013. For 2014, the Company lowered its expected return assumption, as it refined its asset and liability management strategy. In lowering this assumption, management considered the historical returns, investment strategy, and target composition of each plan’s portfolio.
The Company’s investments for its pension plans are reported at fair value. The following methods and assumptions were used to estimate the fair value of the Company’s plan asset investments:
Cash and money market funds – Valued at cost, which approximates fair value.
Common stock – Valued at the closing price reported on the active market on which the individual securities are traded.
Mutual funds – Valued at the net asset value of shares held by the plans at December 27, 2014 and December 28, 2013, respectively, based upon quoted market prices.
F-45
Limited partnerships – Limited partnerships include investments in various Cayman Island multi-strategy hedge funds. The plans’ investments in limited partnerships are valued at the estimated fair value of the class shares owned by the plans based upon the equity in the estimated fair value of those shares. The estimated fair values of the limited partnerships are determined by the investment managers. In determining fair value, the investment managers of the limited partnerships utilize the estimated net asset valuations of the underlying investment entities. The underlying investment entities value securities and other financial instruments on a mark-to-market or estimated fair value basis. The estimated fair value is determined by the investment managers based upon, among other things, the type of investments, purchase price, marketability, current financial condition, operating results, and other information. The estimated fair values of substantially all of the investments of the underlying investment entities, which may include securities for which prices are not readily available, are determined by the investment managers or management of the respective underlying investment entities and may not reflect amounts that could be realized upon immediate sale. Accordingly, the estimated fair values may differ significantly from the values that would have been used had a ready market existed for these investments.
The following table sets forth by level, within the fair value hierarchy, the assets of the plans at fair value:
|
Fair Value Measurements at December 27, 2014
|
||||||||||||||||
|
(In thousands)
|
Level 1
|
Level 2
|
Level 3
|
Total
|
||||||||||||
|
Cash and money market funds
|
$
|
84,377
|
$
|
—
|
$
|
—
|
$
|
84,377
|
||||||||
|
Common stock (1)
|
26,105
|
—
|
—
|
26,105
|
||||||||||||
|
Mutual funds (2)
|
11,397
|
63,067
|
—
|
74,464
|
||||||||||||
|
Limited partnerships
|
—
|
—
|
5,070
|
5,070
|
||||||||||||
|
Total
|
$
|
121,879
|
$
|
63,067
|
$
|
5,070
|
$
|
190,016
|
||||||||
|
Fair Value Measurements at December 28, 2013
|
||||||||||||||||
|
(In thousands)
|
Level 1
|
Level 2
|
Level 3
|
Total
|
||||||||||||
|
Cash and money market funds
|
$
|
13,992
|
$
|
—
|
$
|
—
|
$
|
13,992
|
||||||||
|
Common stock (3)
|
79,497
|
—
|
—
|
79,497
|
||||||||||||
|
Mutual funds (4)
|
27,166
|
63,435
|
—
|
90,601
|
||||||||||||
|
Limited partnerships
|
—
|
—
|
4,780
|
4,780
|
||||||||||||
|
Total
|
$
|
120,655
|
$
|
63,435
|
$
|
4,780
|
$
|
188,870
|
||||||||
|
(1)
|
Approximately 51 percent of common stock represents investments in U.S. companies primarily in the health care, utilities, financials, consumer staples, industrials, and information technology sectors. All investments in common stock are listed on U.S. stock exchanges.
|
|
|
(2)
|
Approximately 40 percent of mutual funds are actively managed funds and approximately 60 percent of mutual funds are index funds. Additionally, 23 percent of the mutual funds’ assets are invested in U.S. equities, 67 percent in non-U.S. equities, and 10 percent in non-U.S. fixed income securities.
|
|
|
(3)
|
Approximately 84 percent of common stock represents investments in U.S. companies primarily in the health care, utilities, financials, consumer staples, industrials, and information technology sectors. All investments in common stock are listed on U.S. stock exchanges.
|
|
|
(4)
|
Approximately 32 percent of mutual funds are actively managed funds and approximately 68 percent of mutual funds are index funds. Additionally, 33 percent of the mutual funds’ assets are invested in U.S. equities, 58 percent in non-U.S. equities, and 9 percent in non-U.S. fixed income securities.
|
The table below reflects the changes in the assets of the plan measured at fair value on a recurring basis using significant unobservable inputs (Level 3 hierarchy as defined by ASC 820, Fair Value Measurements and Disclosures (ASC 820)) during the year ended December 27, 2014:
|
(In thousands)
|
Limited Partnerships
|
|||
|
Balance, December 28, 2013
|
$
|
4,780
|
||
|
Redemptions
|
(401
|
)
|
||
|
Subscriptions
|
401
|
|
||
|
Net appreciation in fair value
|
290
|
|||
|
Balance, December 27, 2014
|
$
|
5,070
|
||
Contributions and Benefit Payments
The Company expects to contribute approximately $1.5 million to its pension plans and $1.3 million to its other postretirement benefit plans in 2015. The Company expects future benefits to be paid from the plans as follows:
|
(In thousands)
|
Pension Benefits
|
Other Benefits
|
||||||
|
2015
|
$
|
11,303
|
$
|
1,251
|
||||
|
2016
|
11,492
|
1,137
|
||||||
|
2017
|
11,671
|
1,133
|
||||||
|
2018
|
11,878
|
1,203
|
||||||
|
2019
|
12,116
|
1,171
|
||||||
|
2020-2024
|
64,358
|
6,488
|
||||||
|
Total
|
$
|
122,818
|
$
|
12,383
|
||||
Multiemployer Plan
The Company contributes to the IAM National Pension Fund, National Pension Plan (IAM Plan), a multiemployer defined benefit plan. Participation in the IAM Plan was negotiated under the terms of two collective bargaining agreements in Port Huron, Michigan, the Local 218 IAM and Local 44 UAW that expire on May 1, 2016 and July 20, 2016, respectively. The Employer Identification Number for this plan is 51-6031295.
The risks of participating in multiemployer plans are different from single-employer plans in the following aspects: (i) Assets contributed to the multiemployer plan by one employer may be used to provide benefits to employees of other participating employers; (ii) if a participating employer stops contributing to the plan, the underfunded obligations of the plan may be borne by the remaining participating employers; (iii) if the Company chooses to stop participating in the plan, the Company may be required to pay the plan an amount based on the underfunded status of the plan, referred to as a withdrawal liability.
The Company makes contributions to the IAM Plan trusts that cover certain union employees; contributions by employees are not permitted. Contributions to the IAM Plan were $1.0 million in 2014, $0.9 million in 2013, and $1.0 million in 2012. The Company’s contributions are less than five percent of total employer contributions made to the IAM Plan indicated in the most recently filed Form 5500.
Under the Pension Protection Act of 2006, the IAM Plan’s actuary must certify the plan’s zone status annually. Plans in the red zone are generally less than 65 percent funded, plans in the yellow zone are less than 80 percent funded, and plans in the green zone are at least 80 percent funded. If a plan is determined to be in endangered status, red zone or yellow zone, the plan’s trustees must develop a formal plan of corrective action, a Financial Improvement Plan and/or a Rehabilitation Plan. For 2014 and 2013 the IAM Plan was determined to have green zone status; therefore, no formal plan of corrective action is either pending or has been implemented.
F-47
401(k) Plans
The Company sponsors voluntary employee savings plans that qualify under Section 401(k) of the Internal Revenue Code of 1986. Compensation expense for the Company’s matching contribution to the 401(k) plans was $4.1 million in 2014, $3.2 million in 2013, and $2.9 million in 2012. The Company match is a cash contribution. Participants direct the investment of their account balances by allocating among a range of asset classes including mutual funds (equity, fixed income, and balanced funds), and money market funds. The plans do not allow direct investment in securities issued by the Company.
UMWA Benefit Plans
In October 1992, the Coal Industry Retiree Health Benefit Act of 1992 (the Act) was enacted. The Act mandates a method of providing for postretirement benefits to the United Mine Workers of America (UMWA) current and retired employees, including some retirees who were never employed by the Company. In October 1993, beneficiaries were assigned to the Company and the Company began its mandated contributions to the UMWA Combined Benefit Fund, a multiemployer trust. Beginning in 1994, the Company was required to make contributions for assigned beneficiaries under an additional multiemployer trust created by the Act, the UMWA 1992 Benefit Plan. The ultimate amount of the Company’s liability under the Act will vary due to factors which include, among other things, the validity, interpretation, and regulation of the Act, its joint and several obligation, the number of valid beneficiaries assigned, and the extent to which funding for this obligation will be satisfied by transfers of excess assets from the 1950 UMWA pension plan and transfers from the Abandoned Mine Reclamation Fund. Contributions to the plan were $249 thousand, $290 thousand, and $315 thousand for the years ended December 27, 2014, December 28, 2013, and December 29, 2012, respectively.
Note 14 – Derivative Instruments and Hedging Activities
The Company’s earnings and cash flows are subject to fluctuations due to changes in commodity prices, foreign currency exchange rates, and interest rates. The Company uses derivative instruments such as commodity futures contracts, foreign currency forward contracts, and interest rate swaps to manage these exposures.
Commodity Futures Contracts
Copper and brass represent the largest component of the Company’s variable costs of production. The cost of these materials is subject to global market fluctuations caused by factors beyond the Company’s control. The Company occasionally enters into forward fixed-price arrangements with certain customers; the risk of these arrangements is generally managed with commodity futures contracts. These futures contracts have been designated as cash flow hedges.
At December 27, 2014, the Company held open futures contracts to purchase approximately $23.7 million of copper over the next 12 months related to fixed price sales orders. The fair value of those futures contracts was an $809 thousand loss position, which was determined by obtaining quoted market prices (Level 1 hierarchy as defined by ASC 820). In the next twelve months, the Company will reclassify into earnings realized gains or losses relating to cash flow hedges. At December 27, 2014, this amount was approximately $538 thousand of deferred net losses, net of tax.
The Company may also enter into futures contracts to protect the value of inventory against market fluctuations. These futures contracts have been designated as fair value hedges.
At December 27, 2014, the Company held open futures contracts to sell approximately $1.6 million of copper over the next three months related to copper inventory. The fair value of those futures contracts was an $87 thousand gain position, which was determined by obtaining quoted market prices (Level 1 hierarchy as defined by ASC 820). During the fourth quarter of 2013, the Company dedesignated previous hedges on its inventory because the hedging relationship was no longer deemed to be highly effective. These contracts no longer qualified as hedging instruments as of December 28, 2013.
F-48
Foreign Currency Forward Contracts
During 2012 and 2013, the Company entered into certain contracts to purchase heavy machinery and equipment denominated in euros. In anticipation of entering into these contracts, the Company entered into forward contracts to purchase euros to protect against adverse foreign exchange rate fluctuations.
At December 27, 2014, the Company held open forward contracts to purchase approximately 1.5 million euros over the next three months. The fair value of these contracts, which was determined by obtaining quoted market prices (Level 1 hierarchy as defined by ASC 820), was an $81 thousand loss position recorded in other current liabilities at December 27, 2014, and an $836 thousand gain position recorded in other current assets at December 28, 2013. At December 27, 2014, there was $157 thousand of deferred gains, net of tax, included in AOCI that is expected to be reclassified into depreciation expense over the useful life of the heavy machinery and equipment.
Interest Rate Swap
On February 20, 2013, the Company entered into a two-year forward-starting interest rate swap agreement with an effective date of January 12, 2015, and an underlying notional amount of $200.0 million, pursuant to which the Company receives variable interest payments based on one-month LIBOR and pays fixed interest at a rate of 1.4 percent. Based on the Company’s current variable premium pricing on its Term Loan Facility, the all-in fixed rate on the effective date is 2.7 percent. The interest rate swap will mature on December 11, 2017, and is structured to offset the interest rate risk associated with the Company’s floating-rate, LIBOR-based Term Loan Facility Agreement. The swap was designated and accounted for as a cash flow hedge from inception.
The fair value of the interest rate swap is estimated based on the present value of the difference between expected cash flows calculated at the contracted interest rate and the expected cash flows at the current market interest rate using observable benchmarks for LIBOR forward rates at the end of the period (Level 2 hierarchy as defined by ASC 820). Interest payable and receivable under the swap agreement will be accrued and recorded as an adjustment to interest expense. The fair value of the interest rate swap was a $927 thousand loss position recorded in other liabilities at December 27, 2014, and a $1.3 million gain position recorded in other assets at December 28, 2013. At December 27, 2014, there was $601 thousand of deferred losses, net of tax, included in AOCI that is expected to be reclassified into interest expense over the term of the hedged item.
The Company presents its derivative assets and liabilities in the Consolidated Balance Sheets on a net basis by counterparty. The following table summarizes the location and fair value of the derivative instruments and disaggregates the net derivative assets and liabilities into gross components on a contract-by-contract basis:
|
Asset Derivatives
|
Liability Derivatives
|
|||||||||||||||||
|
Fair Value
|
Fair Value
|
|||||||||||||||||
|
(In thousands)
|
Balance Sheet Location
|
2014
|
2013
|
Balance Sheet Location
|
2014
|
2013
|
||||||||||||
|
Hedging instrument:
|
||||||||||||||||||
|
Commodity contracts - gains
|
Other current assets
|
$
|
99
|
$
|
448
|
Other current liabilities
|
$
|
15
|
$
|
340
|
||||||||
|
Commodity contracts - losses
|
Other current assets
|
(4
|
)
|
(10
|
)
|
Other current liabilities
|
(832
|
)
|
(2,107
|
)
|
||||||||
|
Foreign currency contracts
|
Other current assets
|
—
|
836
|
Other current liabilities
|
(81
|
)
|
—
|
|||||||||||
|
Interest rate swap
|
Other assets
|
—
|
1,324
|
Other liabilities
|
(927
|
)
|
—
|
|||||||||||
|
Total derivatives (1)
|
$
|
95
|
$
|
2,598
|
$
|
(1,825
|
)
|
$
|
(1,767
|
)
|
||||||||
|
(1) Does not include the impact of cash collateral provided to counterparties.
|
||||||||||||||||||
F-49
The following tables summarize the effects of derivative instruments on the Consolidated Statements of Income:
|
(In thousands)
|
Location
|
2014
|
2013
|
||||||
|
Fair value hedges:
|
|||||||||
|
Gain on commodity contracts (qualifying)
|
Cost of goods sold
|
$
|
6,783
|
$
|
5,115
|
||||
|
Loss on hedged item - Inventory
|
Cost of goods sold
|
(5,958
|
)
|
(4,827
|
)
|
||||
|
Undesignated derivatives:
|
|||||||||
|
Gain (loss) on commodity contracts (nonqualifying)
|
Cost of goods sold
|
$
|
1,466
|
$
|
(611
|
)
|
The following tables summarize amounts recognized in and reclassified from AOCI during the period:
|
Year Ended December 27, 2014
|
|||||||||||
|
(In thousands)
|
(Loss) Gain Recognized in AOCI (Effective Portion), Net of Tax
|
Classification Gains (Losses)
|
Loss (Gain) Reclassified from AOCI (Effective Portion), Net of Tax
|
||||||||
|
Cash flow hedges:
|
|||||||||||
|
Commodity contracts
|
$
|
(1,088
|
)
|
Cost of goods sold
|
$ |
267
|
|
||||
|
Foreign currency contracts
|
(275
|
)
|
Depreciation expense
|
— |
|
||||||
|
Interest rate swap
|
(1,435
|
)
|
Interest expense
|
— |
|
||||||
|
Year Ended December 28, 2013
|
|||||||||||
|
(In thousands)
|
(Loss) Gain Recognized in AOCI (Effective Portion), Net of Tax
|
Classification Gains (Losses)
|
Loss (Gain) Reclassified from AOCI (Effective Portion), Net of Tax | ||||||||
|
Cash flow hedges:
|
|||||||||||
|
Commodity contracts
|
$
|
(3,337
|
)
|
Cost of goods sold
|
|
$ | 3,781 |
|
|||
|
Foreign currency contracts
|
401
|
Depreciation expense
|
34
|
|
|||||||
|
Interest rate swap
|
834
|
Interest expense
|
— |
|
|||||||
The Company enters into futures and forward contracts that closely match the terms of the underlying transactions. As a result, the ineffective portion of the open hedge contracts through December 27, 2014 was not material to the Consolidated Statements of Income.
The Company primarily enters into International Swaps and Derivatives Association (ISDA) master netting agreements with major financial institutions that permit the net settlement of amounts owed under their respective derivative contracts. Under these master netting agreements, net settlement generally permits the Company or the counterparty to determine the net amount payable for contracts due on the same date and in the same currency for similar types of derivative transactions. The master netting agreements generally also provide for net settlement of all outstanding contracts with a counterparty in the case of an event of default or a termination event. The Company does not offset fair value amounts for derivative instruments and fair value amounts recognized for the right to reclaim cash collateral. At December 27, 2014 and December 28, 2013, the Company had recorded restricted cash in other current assets of $0.5 million and $2.1 million, respectively, as collateral related to open derivative contracts under the master netting arrangements.
F-50
Note 15 – Industry Segments
The Company’s reportable segments are Plumbing & Refrigeration and OEM. For disclosure purposes, as permitted under ASC 280, Segment Reporting, certain operating segments are aggregated into reportable segments. The Plumbing & Refrigeration segment is composed of Standard Products (SPD), European Operations, and Mexican Operations. The OEM segment is composed of Industrial Products (IPD), Engineered Products (EPD), and Mueller-Xingrong. These segments are classified primarily by the markets for their products. Performance of segments is generally evaluated by their operating income. Intersegment transactions are generally conducted on an arms-length basis.
SPD manufactures copper tube and fittings, plastic fittings, and line sets. SPD also imports and resells brass and plastic plumbing valves, malleable iron fittings, faucets, and plumbing specialty products. These products are manufactured in the U.S. Outside the U.S., the Company’s European Operations manufacture copper tube, which is sold in Europe. Mexican Operations consist of pipe nipple manufacturing and import distribution businesses including product lines of malleable iron fittings and other plumbing specialties. The Plumbing & Refrigeration segment’s products are sold primarily to plumbing, refrigeration, and air-conditioning wholesalers, hardware wholesalers and co-ops, and building product retailers.
IPD manufactures brass rod, impact extrusions, and forgings as well as a variety of end products including plumbing brass, automotive components, valves, and fittings. EPD manufactures and fabricates valves and assemblies for the refrigeration, air-conditioning, gas appliance, and barbecue grill markets and specialty copper, copper-alloy, and aluminum tube. Mueller-Xingrong manufactures engineered copper tube primarily for air-conditioning applications. These products are sold primarily to OEM customers.
Summarized product line, geographic, and segment information is shown in the following tables. Geographic sales data indicates the location from which products are shipped. Unallocated expenses include general corporate expenses, plus certain charges or credits not included in segment activity.
During 2014, 2013, and 2012, no single customer exceeded 10 percent of worldwide sales.
Net Sales by Major Product Line:
|
(In thousands)
|
2014
|
2013
|
2012
|
|||||||||
|
Tube and fittings
|
$
|
1,143,164
|
$
|
972,107
|
$
|
986,825
|
||||||
|
Brass rod and forgings
|
556,985
|
553,896
|
583,940
|
|||||||||
|
OEM components, tube & assemblies
|
345,991
|
337,772
|
335,461
|
|||||||||
|
Valves and plumbing specialties
|
262,504
|
239,822
|
231,278
|
|||||||||
|
Other
|
55,583
|
54,944
|
52,434
|
|||||||||
|
$
|
2,364,227
|
$
|
2,158,541
|
$
|
2,189,938
|
|||||||
Geographic Information:
|
(In thousands)
|
2014
|
2013
|
2012
|
|||||||||
|
Net sales:
|
||||||||||||
|
United States
|
$
|
1,752,548
|
$
|
1,676,385
|
$
|
1,696,589
|
||||||
|
United Kingdom
|
326,832
|
229,659
|
234,684
|
|||||||||
|
Other
|
284,847
|
252,497
|
258,665
|
|||||||||
|
$
|
2,364,227
|
$
|
2,158,541
|
$
|
2,189,938
|
|||||||
F-51
|
(In thousands)
|
2014
|
2013
|
2012
|
|||||||||
|
Long-lived assets:
|
||||||||||||
|
United States
|
$
|
322,178
|
$
|
325,667
|
$
|
306,023
|
||||||
|
United Kingdom
|
43,064
|
22,159
|
23,496
|
|||||||||
|
Other
|
21,641
|
25,224
|
27,442
|
|||||||||
|
$
|
386,883
|
$
|
373,050
|
$
|
356,961
|
|||||||
Net assets of foreign operations at December 27, 2014 included $112.6 million in the United Kingdom, $50.4 million in Mexico, $45.7 million in Luxembourg, and $23.9 million in China.
Segment Information:
|
For the Year Ended December 27, 2014
|
||||||||||||||||
|
(In thousands)
|
Plumbing & Refrigeration Segment
|
OEM
Segment
|
Corporate and Eliminations
|
Total
|
||||||||||||
|
Net sales
|
$
|
1,416,701
|
$
|
959,914
|
$
|
(12,388
|
)
|
$
|
2,364,227
|
|||||||
|
Cost of goods sold
|
1,215,282
|
840,823
|
(12,386
|
)
|
2,043,719
|
|||||||||||
|
Depreciation and amortization
|
19,613
|
11,919
|
2,203
|
33,735
|
||||||||||||
|
Selling, general, and administrative expense
|
87,539
|
21,458
|
22,743
|
131,740
|
||||||||||||
|
Gain on sale of assets
|
(6,259
|
)
|
—
|
—
|
(6,259
|
)
|
||||||||||
|
Severance
|
7,296
|
—
|
—
|
7,296
|
||||||||||||
|
Operating income
|
93,230
|
85,714
|
(24,948
|
)
|
153,996
|
|||||||||||
|
Interest expense
|
(5,740
|
)
|
||||||||||||||
|
Other expense, net
|
(243
|
)
|
||||||||||||||
|
Income before income taxes
|
$
|
148,013
|
||||||||||||||
|
For the Year Ended December 28, 2013
|
||||||||||||||||
|
(In thousands)
|
Plumbing & Refrigeration Segment
|
OEM
Segment
|
Corporate and Eliminations
|
Total
|
||||||||||||
|
Net sales
|
$
|
1,225,306
|
$
|
947,784
|
$
|
(14,549
|
)
|
$
|
2,158,541
|
|||||||
|
Cost of goods sold
|
1,043,059
|
833,518
|
(14,488
|
)
|
1,862,089
|
|||||||||||
|
Depreciation and amortization
|
17,117
|
13,025
|
2,252
|
32,394
|
||||||||||||
|
Selling, general, and administrative expense
|
85,471
|
24,479
|
24,964
|
134,914
|
||||||||||||
|
Insurance settlement
|
(103,895
|
)
|
—
|
(2,437
|
)
|
(106,332
|
)
|
|||||||||
|
Gain on sale of plastic fittings manufacturing assets
|
(39,765
|
)
|
—
|
—
|
(39,765
|
)
|
||||||||||
|
Impairment charges
|
4,173
|
131
|
—
|
4,304
|
||||||||||||
|
Operating income
|
219,146
|
76,631
|
(24,840
|
)
|
270,937
|
|||||||||||
|
Interest expense
|
(3,990
|
)
|
||||||||||||||
|
Other income, net
|
4,451
|
|||||||||||||||
|
Income before income taxes
|
$
|
271,398
|
||||||||||||||
|
For the Year Ended December 29, 2012
|
||||||||||||||||
|
(In thousands)
|
Plumbing & Refrigeration Segment
|
OEM
Segment
|
Corporate and Eliminations
|
Total
|
||||||||||||
|
Net sales
|
$
|
1,238,230
|
$
|
974,606
|
$
|
(22,898
|
)
|
$
|
2,189,938
|
|||||||
|
Cost of goods sold
|
1,060,755
|
866,404
|
(22,696
|
)
|
1,904,463
|
|||||||||||
|
Depreciation and amortization
|
16,513
|
13,435
|
1,547
|
31,495
|
||||||||||||
|
Selling, general, and administrative expense
|
75,448
|
27,680
|
26,328
|
129,456
|
||||||||||||
|
Litigation settlement
|
—
|
—
|
(4,050
|
)
|
(4,050
|
)
|
||||||||||
|
Insurance settlement
|
(1,500
|
)
|
—
|
—
|
(1,500
|
)
|
||||||||||
|
Severance
|
—
|
—
|
3,369
|
3,369
|
||||||||||||
|
Operating income
|
87,014
|
67,087
|
(27,396
|
)
|
126,705
|
|||||||||||
|
Interest expense
|
(6,890
|
)
|
||||||||||||||
|
Other expense, net
|
539
|
|||||||||||||||
|
Income before income taxes
|
$
|
120,354
|
||||||||||||||
|
(In thousands)
|
2014
|
2013
|
2012
|
||||||
|
Expenditures for long-lived assets (including business acquisitions):
|
|||||||||
|
Plumbing & Refrigeration
|
$
|
55,098
|
$
|
47,222
|
$
|
24,030
|
|||
|
OEM
|
10,788
|
14,845
|
24,137
|
||||||
|
General corporate
|
400
|
3,253
|
17,290
|
||||||
|
$
|
66,286
|
$
|
65,320
|
$
|
65,457
|
||||
|
Segment assets:
|
|||||||||
|
Plumbing & Refrigeration
|
$
|
664,784
|
$
|
625,371
|
$
|
531,429
|
|||
|
OEM
|
313,245
|
305,052
|
290,058
|
||||||
|
General corporate
|
350,067
|
317,344
|
282,668
|
||||||
|
$
|
1,328,096
|
$
|
1,247,767
|
$
|
1,104,155
|
||||
Note 16 – Quarterly Financial Information (Unaudited) (6)
|
First
|
Second
|
Third
|
Fourth
|
||||||||||
|
(In thousands, except per share data)
|
Quarter
|
Quarter
|
Quarter
|
Quarter
|
|||||||||
|
2014
|
|||||||||||||
|
Net sales
|
$
|
574,374
|
$
|
649,691
|
$
|
602,820
|
$
|
537,342
|
|||||
|
Gross profit (1)
|
78,597
|
91,916
|
81,542
|
68,453
|
|||||||||
|
Consolidated net income (5)
|
24,954
|
35,209
|
24,322
|
18,049
|
(2)
|
||||||||
|
Net income attributable to Mueller Industries, Inc.
|
24,706
|
35,045
|
23,823
|
17,987
|
|||||||||
|
Basic earnings per share
|
0.44
|
0.63
|
0.42
|
0.32
|
|||||||||
|
Diluted earnings per share
|
0.44
|
0.62
|
0.42
|
0.32
|
|||||||||
|
Dividends per share
|
0.075
|
0.075
|
0.075
|
0.075
|
|||||||||
|
2013
|
|||||||||||||
|
Net sales
|
$
|
559,690
|
$
|
582,282
|
$
|
528,854
|
$
|
487,715
|
|||||
|
Gross profit (1)
|
76,840
|
81,157
|
72,552
|
65,903
|
|||||||||
|
Consolidated net income
|
26,434
|
91,842
|
(3)
|
39,993
|
(4)
|
15,020
|
|||||||
|
Net income attributable to Mueller Industries, Inc.
|
26,202
|
91,150
|
39,864
|
15,384
|
|||||||||
|
Basic earnings per share
|
0.47
|
1.64
|
0.71
|
0.28
|
|||||||||
|
Diluted earnings per share
|
0.46
|
1.62
|
0.71
|
0.27
|
|||||||||
|
Dividends per share
|
0.0625
|
0.0625
|
0.0625
|
0.0625
|
|||||||||
|
(1) Gross profit is net sales less cost of goods sold, which excludes depreciation and amortization.
|
|||||||||||||
|
(2) Includes $4.8 million pre-tax gain on sale of assets and $4.2 million of pre-tax charges related to severance.
|
|||||||||||||
|
(3) Includes $106.3 million pre-tax gain from settlement of insurance claims.
|
|||||||||||||
|
(4) Includes $39.8 million pre-tax gain on sale of manufacturing assets and pre-tax impairment charges of $4.3 million primarily
|
|||||||||||||
|
related to real property associated with the aforementioned plastics sale transaction.
|
|||||||||||||
|
(5) Includes income earned by Howell, acquired during Q4 2013, and losses incurred by Yorkshire, acquired during Q1 2014.
|
|||||||||||||
|
(6) The sum of quarterly amounts may not equal the annual amounts reported due to rounding. In addition, the earnings per share amounts are computed independently for each quarter while the full year is based on the weighted average shares outstanding.
|
|||||||||||||
F-54
Report of Independent Registered Public Accounting Firm
The Board of Directors and Stockholders of Mueller Industries, Inc.
We have audited the accompanying consolidated balance sheets of Mueller Industries, Inc. as of December 27, 2014 and December 28, 2013, and the related consolidated statements of income, comprehensive income, changes in equity and cash flows for each of the three years in the period ended December 27, 2014. Our audits also included the financial statement schedule listed in the Index at Item 15(a). These financial statements and schedule are the responsibility of the Company’s management. Our responsibility is to express an opinion on these financial statements and schedule based on our audits.
We conducted our audits in accordance with the standards of the Public Company Accounting Oversight Board (United States). Those standards require that we plan and perform the audit to obtain reasonable assurance about whether the financial statements are free of material misstatement. An audit includes examining, on a test basis, evidence supporting the amounts and disclosures in the financial statements. An audit also includes assessing the accounting principles used and significant estimates made by management, as well as evaluating the overall financial statement presentation. We believe that our audits provide a reasonable basis for our opinion.
In our opinion, the financial statements referred to above present fairly, in all material respects, the consolidated financial position of Mueller Industries, Inc. at December 27, 2014 and December 28, 2013, and the consolidated results of its operations and its cash flows for each of the three years in the period ended December 27, 2014, in conformity with U.S. generally accepted accounting principles. Also, in our opinion, the related financial statement schedule, when considered in relation to the basic financial statements taken as a whole, presents fairly in all material respects the information set forth therein.
We also have audited, in accordance with the standards of the Public Company Accounting Oversight Board (United States), Mueller Industries, Inc.’s internal control over financial reporting as of December 27, 2014, based on criteria established in Internal Control – Integrated Framework issued by the Committee of Sponsoring Organizations of the Treadway Commission (1992 Framework) and our report dated February 24, 2015 expressed an unqualified opinion thereon.
/s/Ernst & Young LLP
|
Memphis, Tennessee
|
|
February 24, 2015
|
F-55
MUELLER INDUSTRIES, INC.
SCHEDULE II - VALUATION AND QUALIFYING ACCOUNTS
Years Ended December 27, 2014, December 28, 2013, and December 29, 2012
|
Additions
|
|||||||||||||||||||
|
Balance at
|
Charged to
|
Balance
|
|||||||||||||||||
|
beginning
|
costs and
|
Other
|
at end
|
||||||||||||||||
|
(In thousands)
|
of year
|
expenses
|
additions
|
Deductions
|
of year
|
||||||||||||||
|
2014
|
|||||||||||||||||||
|
Allowance for doubtful accounts
|
$
|
2,391
|
$
|
(500
|
)
|
$
|
18
|
(1)
|
$
|
1,243
|
$
|
666
|
|||||||
|
Environmental reserves
|
$
|
23,637
|
$
|
1,187
|
$
|
—
|
$
|
2,163
|
$
|
22,661
|
|||||||||
|
Valuation allowance for deferred tax assets
|
$
|
22,544
|
$
|
(5,630
|
)
|
$
|
2,282
|
$
|
2,077
|
$
|
17,119
|
||||||||
|
2013
|
|||||||||||||||||||
|
Allowance for doubtful accounts
|
$
|
1,644
|
$
|
273
|
$
|
812
|
(1)
|
$
|
338
|
$
|
2,391
|
||||||||
|
Environmental reserves
|
$
|
24,635
|
$
|
986
|
$
|
—
|
$
|
1,984
|
$
|
23,637
|
|||||||||
|
Valuation allowance for deferred tax assets
|
$
|
30,394
|
$
|
332
|
$
|
—
|
$
|
8,182
|
$
|
22,544
|
|||||||||
|
2012
|
|||||||||||||||||||
|
Allowance for doubtful accounts
|
$
|
1,564
|
$
|
867
|
$
|
109
|
(1)
|
$
|
896
|
$
|
1,644
|
||||||||
|
Environmental reserves
|
$
|
22,892
|
$
|
3,056
|
$
|
—
|
$
|
1,313
|
$
|
24,635
|
|||||||||
|
Valuation allowance for deferred tax assets
|
$
|
29,705
|
$
|
(1,224
|
)
|
$
|
1,913
|
$
|
—
|
$
|
30,394
|
||||||||
|
(1) Other consists primarily of bad debt recoveries as well as the effect of fluctuating foreign currency exchange rates in all years presented.
|
|||||||||||||||||||
F-56
EXHIBIT INDEX
|
Exhibits
|
Description
|
|||
|
10.12
|
Summary description of the Registrant’s 2015 incentive plan for certain key employees.
|
|||
|
21.0
|
Subsidiaries of the Registrant.
|
|||
|
23.0
|
Consent of Independent Registered Public Accounting Firm.
|
|||
|
31.1
|
Certification of Chief Executive Officer pursuant to Rule 13a-14(a) and Rule 15d-14(a) of the Securities Exchange Act of 1934, as amended.
|
|||
|
31.2
|
Certification of Chief Financial Officer pursuant to Rule 13a-14(a) and Rule 15d-14(a) of the Securities Exchange Act of 1934, as amended.
|
|||
|
32.1
|
Certification of Chief Executive Officer pursuant to 18 U.S.C. 1350, as adopted pursuant to Section 906 of the Sarbanes-Oxley Act of 2002.
|
|||
|
32.2
|
Certification of Chief Financial Officer pursuant to 18 U.S.C. 1350, as adopted pursuant to Section 906 of the Sarbanes-Oxley Act of 2002.
|
|||
|
101.CAL
|
XBRL Taxonomy Extension Calculation Linkbase
|
|||
|
101.DEF
|
XBRL Taxonomy Extension Definition Linkbase
|
|||
|
101.INS
|
XBRL Instance Document
|
|||
|
101.LAB
|
XBRL Taxonomy Extension Label Linkbase
|
|||
|
101.PRE
|
XBRL Presentation Linkbase Document
|
|||
|
101.SCH
|
XBRL Taxonomy Extension Schema
|
|||
Exhibit 10.12
2015 INCENTIVE PLAN FOR CERTAIN KEY EMPLOYEES
The Company has a discretionary annual incentive program under which exempt salaried employees may earn cash payments based on a percentage of base annual salary. The actual percent is based on a variety of guidelines including performance levels of the respective business units primarily measured by operating income subject to certain adjustments.
The payment to an employee is based upon (i) their assigned grade level, (ii) actual company earnings achieved relative to a pre-determined target, which is adjusted upward if company performance exceeds target and reduced if company performance is less than target, and (iii) base salary paid during the fiscal year.
Exhibit 21.0
MUELLER INDUSTRIES, INC.
List of Subsidiaries
|
State or Country
|
|
|
Subsidiary*
|
of Incorporation
|
|
Mueller Brass Holding Company, Inc.
|
Delaware
|
|
Mueller Brass Co. (Assumed name: Mueller Brass Products)
|
Michigan
|
|
Extruded Metals, Inc.
|
Delaware
|
|
Mueller Industrial Realty Co.
|
Michigan
|
|
Itawamba Industrial Gas Company, Inc.
|
Mississippi
|
|
Streamline Copper & Brass Ltd.
|
Canada
|
|
Mueller Plastics Holding Company, Inc.
|
Ohio
|
|
Mueller Plastics Corporation, Inc.
|
Delaware
|
|
MPC Foundry, Inc.
|
Delaware
|
|
MPC Machine Shop, Inc.
|
Delaware
|
|
Mueller Brass Forging Company, Inc.
|
Delaware
|
|
Mueller Copper Tube Company, Inc.
|
Delaware
|
|
Mueller Fittings, LLC
|
Mississippi
|
|
Mueller Fittings Company, Inc.
|
Michigan
|
|
MCTC, LLC
|
Mississippi
|
|
Mueller East, Inc.
|
Delaware
|
|
Mueller Formed Tube Company, Inc.
|
Delaware
|
|
Mueller Impacts Company, Inc.
|
Delaware
|
|
Mueller Press Company, Inc.
|
Mississippi
|
|
Mueller Refrigeration Products Company, Inc.
|
Delaware
|
|
Mueller LBHC, Inc.
|
Delaware
|
|
Lincoln Brass Works, Inc. (Assumed name: Mueller Gas Products)
|
Michigan
|
|
Overstreet-Hughes, Co., Inc. (Assumed name: Fabricated Tube Products)
|
Tennessee
|
|
Mueller Refrigeration LLC
|
Delaware
|
|
Mueller Refrigeration Holding Company, Inc.
|
Delaware
|
|
Mueller Streamline Co.
|
Delaware
|
|
B&K, LLC
|
Delaware
|
|
Precision Tube Company, LLC
|
Pennsylvania
|
|
Mueller Southeast, Inc.
|
Pennsylvania
|
|
Southland Pipe Nipples Company, Inc.
|
Texas
|
|
Mueller Tool and Machine, Inc.
|
Delaware
|
|
Mueller Casting Company, Inc.
|
Delaware
|
|
Mueller Packaging, LLC
|
Mississippi
|
|
Micro Gauge, Inc.
|
Michigan
|
|
Microgauge Machining, Inc.
|
Michigan
|
|
Propipe Technologies, Inc. (Assumed name: Mueller Gas Products)
|
Ohio
|
|
WTC Holding Company
|
Michigan
|
|
Muellux Holding Company I SARL
|
Luxembourg
|
|
Muellux Holding Company II SARL
|
Luxembourg
|
|
Mueller Europe Investment Company Ltd.
|
United Kingdom
|
|
Mueller Europe, Limited
|
United Kingdom
|
|
Westermeyer Industries, Inc.
|
Illinois
|
Exhibit 21.0
|
State or Country
|
|
|
Subsidiary*
|
of Incorporation
|
|
DENO Investment Company, Inc.
|
Michigan
|
|
Mueller de Mexico, S.A. de C.V. (1)
|
Mexico
|
|
DENO Holding Company, Inc.
|
Michigan
|
|
DENO Acquisition EURL
|
France
|
|
Mueller Europe, S.A. (2)
|
France
|
|
B & K Industries, Inc.
|
Illinois
|
|
Mueller Copper Tube Products, Inc.
|
Delaware
|
|
MCTP, LLC
|
Michigan
|
|
Howell Metal Company
|
Virginia
|
|
Linesets, Inc.
|
Delaware
|
|
Climate Components, LLC
|
Delaware
|
|
Arava Natural Resources Company, Inc.
|
Delaware
|
|
United States Fuel Company
|
Nevada
|
|
King Coal Company
|
Utah
|
|
Canco Oil & Gas Ltd.
|
Alberta, Canada
|
|
Aegis Oil and Gas Leasing Ltd.
|
Alberta, Canada
|
|
Bayard Mining Corp.
|
Delaware
|
|
Washington Mining Company
|
Maine
|
|
Amwest Exploration Company
|
Delaware
|
|
USSRAM Exploration Company
|
Maine
|
|
White Knob Mining Company
|
Idaho
|
|
Arava Exploration Company
|
Colorado
|
|
Summit Systems, Inc.
|
Delaware
|
|
Kennet Company Limited
|
Bermuda
|
|
Mining Remedial Recovery Company
|
Delaware
|
|
Carpentertown Coal & Coke Company
|
Pennsylvania
|
|
U.S.S. Lead Refinery, Inc.
|
Maine
|
|
Leon Water Enterprises, Inc. (50%)
|
Texas
|
|
Macomber Construction Company
|
Ohio
|
|
Macomber, Incorporated
|
Ohio
|
|
Macomber Building and Land Corporation
|
Delaware
|
|
DENO Investment Company II, Inc.
|
Michigan
|
|
MII Financial Corporation
|
Michigan
|
|
Mueller Streamline Holding S.L.U.
|
Spain
|
|
WTC HoldCo I, LLC
|
Delaware
|
|
WTC HoldCo II, LLC
|
Delaware
|
|
Mueller Comercial de Mexico S. de R.L. de C.V. (3)
|
Mexico
|
|
NICNA Mexico, S. de R.L. de C.V. (4)
|
Mexico
|
|
NICNA Mexico Servicios, S. de R.L. de C.V. (4)
|
Mexico
|
|
NICNA Mexico Proyectos, S. de R.L. de C.V. (4)
|
Mexico
|
|
Mueller Streamline II, LLC
|
Delaware
|
|
Changzhou Mueller Refrigerant Valve Manufacturing Co., Ltd.
|
China
|
|
Mueller Industries Trading (Shanghai) Co., Ltd.
|
China
|
|
Mueller Streamline Trading, LLC
|
Delaware
|
|
Mueller Streamline China, LLC
|
Delaware
|
|
Jiangsu Mueller-Xingrong Copper Industries Limited (5)
|
China
|
Exhibit 21.0
|
*All subsidiaries are 100% owned, except as shown.
|
|
|
(1) Owned by DENO Investment Company, Inc. (99.94%) and Mueller Streamline Co. (.06%).
|
|
|
(2) On March 3, 2003, Mueller Europe S.A. filed a petition for liquidation with the Commercial Court of Provins, France and, on March 4, the Court declared the entity to be in liquidation. Less than 1%
owned by non-affiliated individuals. On May 26, 2014, the Commercial Court of Melun rendered a decision ordering the closure of the judicial liquidation proceedings of Mueller Europe S.A. due to
insufficiency of assets.
|
|
|
(3) Owned by Mueller Streamline Holding S.L.U. (99.983%), WTC HoldCo I, LLC (0.016% ), and WTC HoldCo II, LLC (0.001% ).
|
|
|
(4) Less than 1% of the outstanding common stock is owned by WTC HoldCo I, LLC.
|
|
|
(5) Owned by Mueller Streamline China, LLC (50.5%).
|
Exhibit 23.0
Consent of Independent Registered Public Accounting Firm
We consent to the incorporation by reference in the following Registration Statements:
|
1)
|
Form S-3 No. 333-182906 pertaining to the registration of 20,845,718 shares of Mueller Industries, Inc. common stock,
|
|
2)
|
Form S-8 No. 333-197609 pertaining to the Mueller Industries, Inc. 2014 Incentive Plan,
|
|
3)
|
Form S-8 No. 333-160718 pertaining to the Mueller Industries, Inc. 2009 Stock Incentive Plan,
|
|
4)
|
Form S-8 No. 333-138413 pertaining to the Mueller Industries, Inc. 2002 Stock Option Plan,
|
|
5)
|
Form S-8 No. 333-91238 pertaining to the Mueller Industries, Inc. 2002 Stock Option Plan,
|
|
6)
|
Form S-8 No. 33-54705 pertaining to the Mueller Industries, Inc. 1994 Stock Option Plan and the 1994 Non-Employee Director Stock Option Plan;
|
of our reports dated February 24, 2015, with respect to the consolidated financial statements and schedule of Mueller Industries, Inc. and the effectiveness of internal control over financial reporting of Mueller Industries, Inc., included in this Annual Report (Form 10-K) for the year ended December 27, 2014.
|
/s/ Ernst & Young LLP
|
|
|
Memphis, Tennessee
|
|
|
February 24, 2015
|
Exhibit 31.1
CERTIFICATION
I, Gregory L Christopher, certify that:
|
1.
|
I have reviewed this annual report on Form 10-K of Mueller Industries, Inc.;
|
||
|
2.
|
Based on my knowledge, this report does not contain any untrue statement of a material fact or omit to state a material fact necessary to make the statements made, in light of the circumstances under which such statements were made, not misleading with respect to the period covered by this report;
|
||
|
3.
|
Based on my knowledge, the financial statements, and other financial information included in this report, fairly present in all material respects the financial condition, results of operations and cash flows of the registrant as of, and for, the periods presented in this report;
|
||
|
4.
|
The registrant's other certifying officer and I are responsible for establishing and maintaining disclosure controls and procedures (as defined in Exchange Act Rules 13a-15(e) and 15d-15(e)) and internal control over financial reporting (as defined in Exchange Act Rules 13a-15(f) and 15d-15(f)), for the registrant and have:
|
||
|
a)
|
Designed such disclosure controls and procedures, or caused such disclosure controls and procedures to be designed under our supervision, to ensure that material information relating to the registrant, including its consolidated subsidiaries, is made known to us by others within those entities, particularly during the period in which this report is being prepared;
|
||
|
b)
|
Designed such internal control over financial reporting, or caused such internal control over financial reporting to be designed under our supervision, to provide reasonable assurance regarding the reliability of financial reporting and the preparation of financial statements for external purposes in accordance with generally accepted accounting principles;
|
||
|
c)
|
Evaluated the effectiveness of the registrant's disclosure controls and procedures and presented in this report our conclusions about the effectiveness of the disclosure controls and procedures, as of the end of the period covered by this report based on such evaluation; and
|
||
|
d)
|
Disclosed in this report any change in the registrant's internal control over financial reporting that occurred during the registrant's most recent fiscal quarter (the registrant's fourth fiscal quarter in the case of an annual report) that has materially affected, or is reasonably likely to materially affect, the registrant's internal control over financial reporting; and
|
||
|
5.
|
The registrant's other certifying officer and I have disclosed, based on our most recent evaluation of internal control over financial reporting, to the registrant's auditors and the audit committee of the registrant's board of directors (or persons performing the equivalent functions):
|
||
|
a)
|
All significant deficiencies and material weaknesses in the design or operation of internal control over financial reporting which are reasonably likely to adversely affect the registrant's ability to record, process, summarize and report financial information; and
|
||
|
b)
|
Any fraud, whether or not material, that involves management or other employees who have a significant role in the registrant's internal control over financial reporting.
|
||
|
Date: February 24, 2015
|
|
|
/s/ Gregory L. Christopher
|
|
|
Gregory L. Christopher
|
|
|
Chief Executive Officer
|
|
Exhibit 31.2
CERTIFICATION
I, Jeffrey A. Martin, certify that:
|
1.
|
I have reviewed this annual report on Form 10-K of Mueller Industries, Inc.;
|
||
|
2.
|
Based on my knowledge, this report does not contain any untrue statement of a material fact or omit to state a material fact necessary to make the statements made, in light of the circumstances under which such statements were made, not misleading with respect to the period covered by this report;
|
||
|
3.
|
Based on my knowledge, the financial statements, and other financial information included in this report, fairly present in all material respects the financial condition, results of operations and cash flows of the registrant as of, and for, the periods presented in this report;
|
||
|
4.
|
The registrant's other certifying officer and I are responsible for establishing and maintaining disclosure controls and procedures (as defined in Exchange Act Rules 13a-15(e) and 15d-15(e)) and internal control over financial reporting (as defined in Exchange Act Rules 13a-15(f) and 15d-15(f)), for the registrant and have:
|
||
|
a)
|
Designed such disclosure controls and procedures, or caused such disclosure controls and procedures to be designed under our supervision, to ensure that material information relating to the registrant, including its consolidated subsidiaries, is made known to us by others within those entities, particularly during the period in which this report is being prepared;
|
||
|
b)
|
Designed such internal control over financial reporting, or caused such internal control over financial reporting to be designed under our supervision, to provide reasonable assurance regarding the reliability of financial reporting and the preparation of financial statements for external purposes in accordance with generally accepted accounting principles;
|
||
|
c)
|
Evaluated the effectiveness of the registrant's disclosure controls and procedures and presented in this report our conclusions about the effectiveness of the disclosure controls and procedures, as of the end of the period covered by this report based on such evaluation; and
|
||
|
d)
|
Disclosed in this report any change in the registrant's internal control over financial reporting that occurred during the registrant's most recent fiscal quarter (the registrant's fourth fiscal quarter in the case of an annual report) that has materially affected, or is reasonably likely to materially affect, the registrant's internal control over financial reporting; and
|
||
|
5.
|
The registrant's other certifying officer and I have disclosed, based on our most recent evaluation of internal control over financial reporting, to the registrant's auditors and the audit committee of the registrant's board of directors (or persons performing the equivalent functions):
|
||
|
a)
|
All significant deficiencies and material weaknesses in the design or operation of internal control over financial reporting which are reasonably likely to adversely affect the registrant's ability to record, process, summarize and report financial information; and
|
||
|
b)
|
Any fraud, whether or not material, that involves management or other employees who have a significant role in the registrant's internal control over financial reporting.
|
||
|
Date: February 24, 2015
|
|
|
/s/ Jeffrey A. Martin
|
|
|
Jeffrey A. Martin
|
|
|
Chief Financial Officer
|
|
Exhibit 32.1
CERTIFICATION PURSUANT TO
18 U.S.C. SECTION 1350,
AS ADOPTED PURSUANT TO SECTION 906
OF THE SARBANES-OXLEY ACT OF 2002
In connection with the Annual Report of Mueller Industries, Inc. (the "Company") on Form 10-K for the period ending December 27, 2014 as filed with the Securities and Exchange Commission on the date hereof (the "Report"), I, Gregory L. Christopher, Chief Executive Officer of the Company, certify, pursuant to 18 U.S.C. Section 1350, as adopted pursuant to Section 906 of the Sarbanes-Oxley Act of 2002, that:
|
(1)
|
The Report fully complies with the requirements of Section 13(a) or 15(d) of the Securities Exchange Act of 1934; and
|
|||
|
(2)
|
The information contained in the Report fairly presents, in all material respects, the financial condition and results of operations of the Company.
|
|||
|
|
||||
|
/s/ Gregory L. Christopher
|
||||
|
Gregory L. Christopher
|
||||
|
Chief Executive Officer
|
||||
|
February 24, 2015
|
||||
Exhibit 32.2
CERTIFICATION PURSUANT TO
18 U.S.C. SECTION 1350,
AS ADOPTED PURSUANT TO SECTION 906
OF THE SARBANES-OXLEY ACT OF 2002
In connection with the Annual Report of Mueller Industries, Inc. (the "Company") on Form 10-K for the period ending December 27, 2014 as filed with the Securities and Exchange Commission on the date hereof (the "Report"), I, Jeffrey A. Martin, Chief Financial Officer of the Company, certify, pursuant to 18 U.S.C. Section 1350, as adopted pursuant to Section 906 of the Sarbanes-Oxley Act of 2002, that:
|
(1)
|
The Report fully complies with the requirements of Section 13(a) or 15(d) of the Securities Exchange Act of 1934; and
|
|||
|
(2)
|
The information contained in the Report fairly presents, in all material respects, the financial condition and results of operations of the Company.
|
|||
|
|
||||
|
/s/Jeffrey A. Martin
|
||||
|
Jeffrey A. Martin
|
||||
|
Chief Financial Officer
|
||||
|
February 24, 2015
|
||||
Serious News for Serious Traders! Try StreetInsider.com Premium Free!
You May Also Be Interested In
- Mueller Industries (MLI) to Acquire Nehring Electrical Works Company for $575M
- Exploring the Transformative Potential of AI Technology
- Renasant Announces Leadership Transition
Create E-mail Alert Related Categories
SEC FilingsSign up for StreetInsider Free!
Receive full access to all new and archived articles, unlimited portfolio tracking, e-mail alerts, custom newswires and RSS feeds - and more!
