

Form N-CSRS LAZARD RETIREMENT SERIES For: Jun 30
 Tweet
Tweet Share
ShareUNITED STATES
SECURITIES AND EXCHANGE COMMISSION
Washington, D.C. 20549
FORM N-CSR
CERTIFIED SHAREHOLDER REPORT OF REGISTERED
MANAGEMENT
INVESTMENT COMPANIES
Investment Company Act file number 811-08071
Lazard Retirement Series, Inc.
(Exact name of registrant as specified in charter)
30 Rockefeller Plaza
New York, New York 10112
| (Address of principal executive offices) | (Zip code) |
Nathan A. Paul, Esq.
Lazard Asset Management LLC
30 Rockefeller Plaza
New York, New York 10112
(Name and address of agent for service)
| Registrant’s telephone number, including area code: | (212) 632-6000 |
| Date of fiscal year end: | 12/31 |
| Date of reporting period: | 6/30/16 |
ITEM 1. REPORTS TO STOCKHOLDERS.
![]()
Lazard Retirement Series
Semi-Annual Report
June 30, 2016
| US Equity | Emerging Markets | ||
| Lazard Retirement US Strategic Equity Portfolio | Lazard Retirement Emerging Markets Equity Portfolio | ||
| Lazard Retirement US Small-Mid Cap Equity Portfolio | |||
| Asset Allocation | |||
| International Equity | Lazard Retirement Global Dynamic Multi Asset Portfolio | ||
| Lazard Retirement International Equity Portfolio |
Lazard Retirement Series, Inc. Table of Contents
Shares of the Portfolios are currently offered only to separate accounts established by insurance companies to fund variable annuity contracts and variable life insurance policies. Portfolio shares may also be offered to certain qualified pension and retirement plans and accounts permitting accumulation of assets on a tax-deferred basis.
Please consider a Portfolio’s investment objective, risks, charges and expenses carefully before investing. For more complete information about Lazard Retirement Series, Inc. (the “Fund”), you may obtain a prospectus or summary prospectus by calling 800-823-6300, or online, at www.LazardNet.com. Read the prospectus or each Portfolio’s summary prospectus carefully before you invest. The prospectus and summary prospectus contain the investment objective, risks, charges, expenses and other information about Portfolios of the Fund, which is not detailed in this report.
Distributed by Lazard Asset Management Securities LLC.
| Semi-Annual Report | 1 |
Lazard Retirement Series, Inc. A Message from Lazard
Dear Shareholder,
In the first half of 2016, global equity markets stood firm despite significant bouts of volatility. Concerns about the Chinese economy, commodity price declines, and a series of disappointing earnings announcements pressured equity markets in the early months of 2016. However, they rallied in the latter half of the first quarter and into the second as the US Federal Reserve lowered its forecast for 2016 interest rate increases. Although global equity markets fell again in late-June due to the uncertainty caused by the United Kingdom’s vote to leave the European Union, certain regions rebounded by the end of the period. In addition, signs of some stability in commodity prices helped emerging markets assets during the period.
Volatility also played a role in global bond markets as investors traded largely on risk assessment of macro events. In Europe, the 10-year German bund yield fell below zero for the first time, following Swiss and Japanese 10-year government bonds, which have been in negative territory for some time. The surprising outcome of the UK referendum triggered another rally in safe haven assets, pushing some government bond yields even further into negative territory. The low yield, but still positive, environment continued in the United States.
At Lazard Asset Management, we remain focused on active management and are committed to responsibly pursuing the Portfolios’ investment objectives. We appreciate your continued confidence in our investment management capabilities, and we feel privileged that you have turned to Lazard for your investment needs.
Sincerely,
Lazard Asset Management LLC
| 2 | Semi-Annual Report |
Lazard Retirement Series, Inc. Investment Overviews
US Equities
The S&P 500® Index rose 3.8% in the first half of 2016. Markets were down as much as 10% in the beginning of the period, on concerns about the Chinese economy, commodity price declines, and a series of disappointing corporate earnings announcements. However, shares rallied in the latter half of the first quarter and into the second, as the US Federal Reserve lowered its forecast for 2016 interest rate increases. Economic data were mixed during the period, as the economy capped its largest two-year private payroll gain since 1999 in March, but followed it with a spate of disappointing jobs growth reports to finish the period. GDP growth in the first half of 2016 generally exceeded expectations, however. Although US markets fell sharply in late-June due to the uncertainty caused by the United Kingdom’s affirmative vote to leave the European Union (the so-called “Brexit”), they had largely rebounded by the end of the period. Amid the continuingly uncertain economic and geopolitical backdrop, the Federal Open Market Committee elected not to raise interest rates at its June meeting, and expectations for a rate increase in the summer of 2016 fell sharply.
International Equities
International equities fell slightly in a volatile first half of 2016. Initial concerns centered around faltering Chinese growth and low oil prices, with resultant impacts on credit. This was calmed by evidence of a state-led investment recovery in China, falling US oil supply, and reassurance from the US Federal Reserve that US interest rates would remain low. The resulting weakness in the US dollar, and rise in many commodity prices, supported emerging markets assets alongside sectors such as energy and mining. On the other hand, ventures into negative interest rates in Japan and Europe put extreme pressure on the valuations of financial institutions, while the surprise Brexit vote result put pressure on assumptions for domestic demand growth in Europe. The banking and consumer discretionary sectors were weak as a result, alongside Italy, which has a particularly weak banking sector and upcoming political risk. UK domestic stocks inevitably fell on recession fears, though the UK index overall held up well even in US dollars, as the index is dominated by global multinationals. Sectors seen as sta-
ble, such as consumer staples and utilities, also benefited from very low interest rates.
Emerging Markets Equities
Emerging markets equities experienced somewhat of a changed environment in the first half of 2016. Some of the more defensive sector companies, which had led markets for a long time, underperformed while more economy-sensitive industries were relatively strong. Additionally, regions which had been very weak performers, like Latin America, performed very strongly while Asia, which had performed relatively well, finished the period virtually unchanged. The MSCI Emerging Markets® Index (the “EM Index”) rose by 6.4%, as measured in US dollar terms, during the six-month period with Asian markets declining marginally while eastern European markets rose by 10% and Latin American markets increased by 25%. The period included important events such as the Brexit referendum in the UK, attempts at renminbi devaluation in China, and a presidential impeachment in Brazil.
Signs of some stability in commodity prices helped shares in Peru and Brazil over the period. The dramatic political events in Brazil during the period, which brought about the successful impeachment votes against President Dilma Rousseff, caused both the Brazilian real and the market to rise. Peru’s market was helped towards the end of the period by the narrow election victory of market-friendly presidential candidate Pedro Pablo Kuczynski. Mexican shares were adversely affected by a weak peso.
Returns were highly diverse across Eastern Europe. The bottoming and then rising crude oil price helped Russian equities while the United Kingdom’s Brexit referendum vote to leave the European Union undermined shares in several European countries, including Greece and Poland. Turkish equities initially performed well but suffered after Prime Minister Ahmet Davutoglu’s resignation, an event which appeared to signal President Recep Tayyip Erdogan’s political dominance.
Although most Asian emerging markets generated positive returns over the six-month period, China’s attempt to devalue the renminbi at the beginning of 2016 destabilized global markets. In addition, MSCI’s
| Semi-Annual Report | 3 |
decision not to include Chinese mainland shares or A-shares in its Emerging Markets Index also hurt the Chinese market. These factors resulted in a negative return for China over the period. Indian stocks also did not progress much in the second quarter as investors became concerned by resistance to Prime Minister Narendra Modi’s policies. Conversely, strong performance was recorded in Thailand, the Philippines, and Indonesia as economies performed in line with expectations and President-elect Rodrigo Duterte outlined his program for the Philippines.
From a sector perspective, the energy, materials, and consumer staples sectors performed well, while the industrials, consumer discretionary, and health care sectors underperformed the EM Index.
Lazard Retirement US Strategic Equity Portfolio
For the six months ended June 30, 2016, the Lazard Retirement US Strategic Equity Portfolio’s Service Shares posted a total return of 0.56%, as compared with the 3.84% return for the S&P 500 Index.
Stock selection in the health care sector contributed to performance. Shares of pharmaceutical company Pfizer rose after the company reported strong quarterly earnings and management raised its guidance for 2016, driven by foreign exchange tailwinds and stronger revenues. Shares also rose after the company announced that it had terminated its proposed $160 billion acquisition of specialty-drug maker Allergan. Stock selection in the industrials sector also helped returns. Shares of salvage vehicle auction holder Copart rose after the company reported quarterly earnings above expectations, due to higher volume growth stemming from market share gains and overall scrap metal industry tailwinds.
In contrast, stock selection in the consumer discretionary sector detracted from performance. Shares of Norwegian Cruise Line Holdings fell in response to disappointing management guidance and macroeconomic instability, as management said it expected slower bookings in the second quarter. Stock selection and an overweight position in the information technology sector also detracted from performance.
Shares of Google parent Alphabet fell after the company reported disappointing second quarter results, which were hurt by greater holiday seasonality.
Lazard Retirement US Small-Mid Cap Equity Portfolio
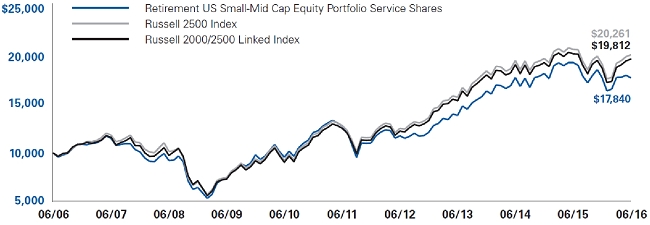
For the six months ended June 30, 2016, the Lazard Retirement US Small-Mid Cap Equity Portfolio’s Service Shares posted a total return of -0.14%, as compared with the 3.98% return for the Russell 2500® Index.
Stock selection in the information technology sector contributed to performance. Shares of NCR rose after the payment technology maker reported quarterly earnings above expectations, driven by strong margins. Stock selection and an overweight position in the energy sector also helped returns. Shares of New-field rose after the exploration and production company reported strong quarterly earnings, driven by strong production and expenses.
In contrast, stock selection in the financials sector detracted from performance. Shares of OneMain fell amid continued concerns about the consumer financial services provider’s funding costs in a rising interest rate environment, and as many investors moved away from shares of companies with subprime loan exposure. We exited our position in OneMain in May in pursuit of better opportunities elsewhere. Stock selection and an underweight position in the materials sector also hurt performance. Shares of KapStone Paper and Packaging fell after the pulp and paper company reported quarterly earnings below expectations and management gave a cautious outlook, citing difficult market conditions. We exited our position after the announcement in February in pursuit of better opportunities elsewhere.
Lazard Retirement International Equity Portfolio
For the six months ended June 30, 2016, the Lazard Retirement International Equity Portfolio’s Service Shares posted a total return of -2.52%, as compared with the -4.42% return for the MSCI EAFE® Index (the “EAFE Index”).
Stock selection in the consumer discretionary sector was the largest driver of relative returns as shares of
| 4 | Semi-Annual Report |
Dutch business information services provider Wolters Kluwer performed well on accelerating growth, while shares of Japanese shoe retailer ABC Mart rose on revenue that is growing faster than expectations and from an increasing dividend. Japanese consumer electronics and media company Sony also rose in the weak market, supported by yen strength. The preceding stocks more than compensated for weakness in jewelry retailer Signet, which was hurt by slowing consumer spending, concerns about the company’s credit portfolio, and some negative publicity. Elsewhere, Japanese telecoms SoftBank and KDDI both rose as investors expect higher revenues and benefited from the previously mentioned yen strength. Lastly, positioning in emerging markets had a positive impact on relative performance as shares of Taiwan Semiconductor and Brazilian insurance broker BB Seguridade both performed well.
In contrast, stock selection in the health care sector detracted from relative returns where shares of German pharmaceutical company Bayer (which was sold during the period) declined as investors reacted negatively to the proposed acquisition of Monsanto. Shares of Israeli pharmaceutical company Teva also declined during the period. The stock fell as revenues from their multiple sclerosis treatment Copaxone declined and management announced that the company’s acquisition of Allergan’s generic drug unit might be delayed. Stock selection in the United Kingdom detracted from relative returns as shares of British bank Lloyds (also sold during the period) declined following the Brexit referendum result. Elsewhere in the United Kingdom, shares of personal credit company Provident and grocer Sainsbury fell, while companies with global revenues, such as tobacco company British American Tobacco and health insurance exchange provider Aon, provided a partial offset. Lastly, low exposure to the strong performing materials and utilities sectors hurt the Portfolio’s relative returns.
Lazard Retirement Emerging Markets Equity Portfolio
For the six months ended June 30, 2016, the Lazard Retirement Emerging Markets Equity Portfolio’s Investor Shares posted a total return of 14.44%, while
Service Shares posted a total return of 14.27%, as compared with the 6.41% return for the EM Index.
During the period, Sberbank, a Russian bank, announced strong earnings and upgraded its guidance for return-on-equity. Telekomunikasi Indonesia, an Indonesian telecom services company, experienced strong growth in data usage leading to improving average revenue per user. Shares of Taiwan Semiconductor Manufacturing, a Taiwanese manufacturer of semiconductors, performed well on expectations of a strong third-quarter ramp up from sales of Apple’s new iPhone 7. Shares of Cielo, a Brazilian credit card processor, rose on the back of reduced regulatory concerns and improved market sentiment following the impeachment proceedings brought against President Dilma Rousseff. Shares of CCR, a Brazilian toll road operator, rose on expectations for lower interest rates in Brazil after the initiation of impeachment proceedings. Stock selection in the financials, consumer discretionary, industrials, and telecom services sectors, and in China helped performance. A higher-than-index exposure to Brazil and a lower-than-index exposure to China also added value.
In contrast, shares of Baidu, a Chinese search engine, declined after company management guided down expectations on continued weakness in its healthcare vertical after the government clampdown. Shares of Hanwha Life Insurance, a Korean insurance company, fell on expectations for a continued environment of low interest rates in Korea. Punjab National Bank, an Indian bank, experienced share declines after the bank increased provisioning for non-performing loans post a regulatory review of the loan book. Bharat Heavy Electricals, an Indian manufacturer of power plant equipment, posted poor earnings on the back of increased competition. Shares of Commercial International Bank, an Egyptian bank, fell early in the second quarter as Egyptian stocks and the Egyptian pound sold off on the back of macroeconomic concerns.
Lazard Retirement Global Dynamic Multi Asset Portfolio
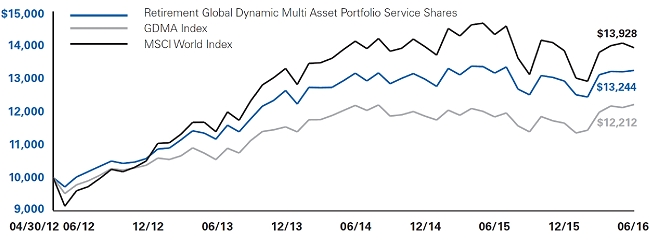
For the six months ended June 30, 2016, the Lazard Retirement Global Dynamic Multi Asset Portfolio’s
| Semi-Annual Report | 5 |
Service Shares posted a total return of 2.52%, as compared with the 4.85% return of the blended benchmark, which is a 50/50 blend of the MSCI World® Index and Barclays Capital Global Aggregate Bond® Index (the “GDMA Index”).
The Portfolio is managed using a combination of Lazard Asset Management LLC’s (the “Investment Manager”) domestic and foreign equity and fixed income strategies. The Investment Manager considers a market forecast based on four categories pertinent to allocation decisions among the strategies: Economy, Valuation, Liquidity, and Sentiment.
Changes made to the market forecast during 2016 reflected a consideration of many factors, including monetary policies of central banks around the globe; global macro data readings (particularly the Purchasing Managers Index, which measures economic activity) in China, the United States, the euro zone, and Japan; fiscal policy in developed and emerging markets; geopolitical events and risks; and equity and fixed income valuations, along with other data.
For the six months ended June 30, 2016, stock selection in the health care, consumer discretionary, tele-
com services, and financials sectors, an underweight position in the financials sector and an overweight position in the telecom services sector added value within the equity allocation, as did stock selection in Norway, China, and Italy. Within fixed income, performance was helped by overweight exposure to Australia, New Zealand, Canada, and Singapore, security selection in the United States, and overweight exposure to the New Zealand dollar and tactical management of the euro implemented via derivative instruments (forward currency contracts for long or short exposure to foreign currencies). In contrast, stock selection in the industrials, consumer staples, and materials sectors, and underweight exposures to energy and materials detracted from performance, as did stock selection in the United Kingdom, Canada, and Japan, and within equities, an underweight to Canada and an overweight to Israel. Within fixed income, performance was negatively impacted by underweight exposure to core Europe and Japan, underweight positions in long maturity government bonds from core markets, and small overweight exposure to the Swedish krona, Australian dollar, and Mexican peso (also implemented via derivative instruments comprised of forward currency contracts for long or short exposure to foreign currencies).
| Notes to Investment Overviews: |
Total returns reflect reinvestment of all dividends and distributions, if any. Certain expenses of a Portfolio may have been waived or reimbursed by the Investment Manager, State Street Bank and Trust Company, the Fund’s administrator (“State Street”), or Boston Financial Data Services, Inc., the Fund’s transfer and dividend disbursing agent (“BFDS”); without such waiver/reimbursement of expenses, such Portfolio’s returns would have been lower. Performance information does not reflect the fees and charges imposed by participating insurance companies at the separate account level, and such charges will have the effect of reducing performance. Past performance is not indicative, or a guarantee, of future results. Return for a period of less than one year is not annualized.
The performance data of the indices and other market data have been prepared from sources and data that the Investment Manager believes to be reliable, but no representation is made as to their accuracy. These indices are unmanaged, have no fees or costs and are not available for investment.
The views of the Investment Manager and the securities described in this report are as of June 30, 2016; these views and portfolio holdings may have changed subsequent to this date. Nothing herein should be construed as a recommendation to buy, sell, or hold a particular security. There is no assurance that the securities discussed herein will remain in a Portfolio at the time you receive this report, or that securities sold will not have been repurchased. The specific securities discussed may, in aggregate, represent only a small percentage of a Portfolio’s holdings. It should not be assumed that securities identified and discussed were, or will be, profitable, or that the investment decisions made in the future will be profitable, or equal the investment performance of the securities discussed herein.
The views and opinions expressed are provided for general information only, and do not constitute specific tax, legal, or investment advice to, or recommendations for, any person. There can be no guarantee as to the accuracy of any outlooks for markets, sectors and securities as discussed herein. You should read the Fund’s prospectus or each Portfolio’s summary prospectus for a more detailed discussion of each Portfolio’s investment objective, strategies, risks and fees.
| 6 | Semi-Annual Report |
Lazard Retirement Series, Inc. Performance Overviews (unaudited)
Lazard Retirement US Strategic Equity Portfolio
Comparison of Changes in Value of $10,000 Investment in the Service Shares of Lazard Retirement US Strategic Equity Portfolio and S&P 500® Index*

Average Annual Total Returns*
Periods Ended June 30, 2016
| One | Five | Ten | ||
| Year | Years | Years | ||
| Service Shares | -4.44% | 9.00% | 5.48% | |
| S&P 500 Index | 3.99% | 12.10% | 7.42% |
| * | Total returns reflect reinvestment of all dividends and distributions, if any. Certain expenses of the Portfolio have been waived or reimbursed by the Portfolio’s Investment Manager or State Street; without such waiver/reimbursement of expenses, the Portfolio’s returns would have been lower. Performance information does not reflect the fees and charges imposed by participating insurance companies at the separate account level, and such charges will have the effect of reducing performance. |
| Performance results do not include adjustments made for financial reporting purposes in accordance with accounting principles generally accepted in the United States of America (“GAAP”) and may differ from amounts reported in the financial highlights. | |
| The performance quoted represents past performance. Current performance may be lower or higher than the performance quoted. Past performance is not indicative, or a guarantee, of future results; the investment return and principal value of the Portfolio will fluctuate, so that Portfolio shares, when redeemed, may be worth more or less than their original cost. Within the longer periods illustrated there may have been short-term fluctuations, counter to the overall trend of investment results, and no single period of any length may be taken as typical of what may be expected in future periods. | |
| The performance data of the index has been prepared from sources and data that the Investment Manager believes to be reliable, but no representation is made as to its accuracy. The S&P 500 Index is a market capitalization-weighted index of 500 common stocks, designed to measure performance of the broad domestic economy through changes in the aggregate market value of these stocks, which represent all major industries. The index is unmanaged, has no fees or costs and is not available for investment. | |
| Before May 1, 2007, the Portfolio was known as Lazard Retirement Equity Portfolio and had a different investment strategy. | |
| Semi-Annual Report | 7 |
Lazard Retirement US Small-Mid Cap Equity Portfolio
Comparison of Changes in Value of $10,000 Investment in the Service Shares of Lazard Retirement US Small-Mid Cap Equity Portfolio, Russell 2500® Index and Russell 2000/2500 Linked Index*
Average Annual Total Returns*
Periods Ended June 30, 2016
| One | Five | Ten | ||
| Year | Years | Years | ||
| Service Shares | -8.24% | 6.78% | 5.96% | |
| Russell 2500 Index | -3.67% | 9.48% | 7.32% | |
| Russell 2000/2500 Linked Index | -3.67% | 9.48% | 7.08% |
| * | Total returns reflect reinvestment of all dividends and distributions, if any. Certain expenses of the Portfolio have been waived or reimbursed by the Portfolio’s Investment Manager; without such waiver/reimbursement of expenses, the Portfolio’s returns would have been lower. Performance information does not reflect the fees and charges imposed by participating insurance companies at the separate account level, and such charges will have the effect of reducing performance. |
| Performance results do not include adjustments made for financial reporting purposes in accordance with GAAP and may differ from amounts reported in the financial highlights. | |
| The performance quoted represents past performance. Current performance may be lower or higher than the performance quoted. Past performance is not indicative, or a guarantee, of future results; the investment return and principal value of the Portfolio will fluctuate, so that Portfolio shares, when redeemed, may be worth more or less than their original cost. Within the longer periods illustrated there may have been short-term fluctuations, counter to the overall trend of investment results, and no single period of any length may be taken as typical of what may be expected in future periods. | |
| The Portfolio was previously known as Lazard Retirement U.S. Small Cap Equity Portfolio. As of June 1, 2009, the Portfolio changed its name to Lazard Retirement U.S. Small-Mid Cap Equity Portfolio and changed its investment strategy to invest in equity securities of small-mid cap US companies. | |
| The performance data of the indices have been prepared from sources and data that the Investment Manager believes to be reliable, but no representation is made as to their accuracy. The Russell 2500 Index is comprised of the 2,500 smallest US companies included in the Russell 3000® Index (which consists of the 3,000 largest US companies by capitalization). The Russell 2000/2500 Linked Index is an index created by the Portfolio’s Investment Manager, which links the performance of the Russell 2000® Index for all periods through May 31, 2009 and the Russell 2500 Index for all periods thereafter. The Russell 2000 Index is comprised of the 2,000 smallest US companies included in the Russell 3000 Index. The indices are unmanaged, have no fees or costs and are not available for investment. | |
| 8 | Semi-Annual Report |
Lazard Retirement International Equity Portfolio
Comparison of Changes in Value of $10,000 Investment in the Service Shares of Lazard Retirement International Equity Portfolio and EAFE Index*
![]()
Average Annual Total Returns*
Periods Ended June 30, 2016
| One | Five | Ten | ||
| Year | Years | Years | ||
| Service Shares | -8.24% | 3.90% | 2.76% | |
| EAFE Index | -10.16% | 1.68% | 1.58% |
| * | Total returns reflect reinvestment of all dividends and distributions, if any. Certain expenses of the Portfolio have been waived or reimbursed by the Portfolio’s Investment Manager; without such waiver/reimbursement of expenses, the Portfolio’s returns would have been lower. Performance information does not reflect the fees and charges imposed by participating insurance companies at the separate account level, and such charges will have the effect of reducing performance. |
| Performance results do not include adjustments made for financial reporting purposes in accordance with GAAP and may differ from amounts reported in the financial highlights. | |
| The performance quoted represents past performance. Current performance may be lower or higher than the performance quoted. Past performance is not indicative, or a guarantee, of future results; the investment return and principal value of the Portfolio will fluctuate, so that Portfolio shares, when redeemed, may be worth more or less than their original cost. Within the longer periods illustrated there may have been short-term fluctuations, counter to the overall trend of investment results, and no single period of any length may be taken as typical of what may be expected in future periods. | |
| The performance data of the index has been prepared from sources and data that the Investment Manager believes to be reliable, but no representation is made as to its accuracy. The EAFE Index is a broadly diversified international index comprised of equity securities of approximately 1,000 companies located in developed countries outside the United States. The index is unmanaged, has no fees or costs and is not available for investment. | |
| Semi-Annual Report | 9 |
Lazard Retirement Emerging Markets Equity Portfolio
Comparison of Changes in Value of $10,000 Investment in the Service Shares of Lazard Retirement Emerging Markets Equity Portfolio and EM Index*

Average Annual Total Returns*
Periods Ended June 30, 2016
| One | Five | Ten | ||
| Year | Years | Years | ||
| Service Shares** | -7.72% | -2.85% | 4.33% | |
| Investor Shares** | -7.49% | -2.61% | 4.59% | |
| EM Index | -12.05% | -3.78% | 3.54% |
| * | Total returns reflect reinvestment of all dividends and distributions, if any. Certain expenses of the Portfolio have been waived or reimbursed by the Portfolio’s Investment Manager; without such waiver/reimbursement of expenses, the Portfolio’s returns would have been lower. Performance information does not reflect the fees and charges imposed by participating insurance companies at the separate account level, and such charges will have the effect of reducing performance. |
| Performance results do not include adjustments made for financial reporting purposes in accordance with GAAP and may differ from amounts reported in the financial highlights. | |
| The performance quoted represents past performance. Current performance may be lower or higher than the performance quoted. Past performance is not indicative, or a guarantee, of future results; the investment return and principal value of the Portfolio will fluctuate, so that Portfolio shares, when redeemed, may be worth more or less than their original cost. Within the longer periods illustrated there may have been short-term fluctuations, counter to the overall trend of investment results, and no single period of any length may be taken as typical of what may be expected in future periods. | |
| The performance data of the index has been prepared from sources and data that the Investment Manager believes to be reliable, but no representation is made as to its accuracy. The EM Index is comprised of emerging market securities in countries open to non-local investors. The index is unmanaged, has no fees or costs and is not available for investment. | |
| ** | The performance of Service Shares and Investor Shares may vary, primarily based on the differences in fees borne by shareholders investing in different classes. |
| 10 | Semi-Annual Report |
Lazard Retirement Global Dynamic Multi Asset Portfolio
Comparison of Changes in Value of $10,000 Investment in the Service Shares of Lazard Retirement Global Dynamic Multi Asset Portfolio, GDMA Index and MSCI World® Index*
Average Annual Total Returns*
Periods Ended June 30, 2016
| One | Since | ||
| Year | Inception | † | |
| Service Shares | 0.62% | 6.97% | |
| GDMA Index | 3.17% | 4.91% | |
| MSCI World Index | -2.78% | 8.28% |
| * | Total returns reflect reinvestment of all dividends and distributions, if any. Certain expenses of the Portfolio have been waived or reimbursed by the Portfolio’s Investment Manager, State Street or BFDS; without such waiver/reimbursement of expenses, the Portfolio’s returns would have been lower. Performance information does not reflect the fees and charges imposed by participating insurance companies at the separate account level, and such charges will have the effect of reducing performance. |
| Performance results do not include adjustments made for financial reporting purposes in accordance with GAAP and may differ from amounts reported in the financial highlights. | |
| The performance quoted represents past performance. Current performance may be lower or higher than the performance quoted. Past performance is not indicative, or a guarantee, of future results; the investment return and principal value of the Portfolio will fluctuate, so that Portfolio shares, when redeemed, may be worth more or less than their original cost. Within the longer periods illustrated there may have been short-term fluctuations, counter to the overall trend of investment results, and no single period of any length may be taken as typical of what may be expected in future periods. | |
| The performance data of the indices have been prepared from sources and data that the Investment Manager believes to be reliable, but no representation is made as to their accuracy. The GDMA Index is a 50/50 blend of the MSCI World Index and the Barclays Capital Global Aggregate Bond® Index. The MSCI World Index is a free float-adjusted market capitalization weighted index that is designed to measure the equity market performance of developed markets. The Barclays Capital Global Aggregate Bond Index provides a broad-based measure of global investment-grade fixed-income debt markets, including government-related debt, corporate debt, securitized debt and global Treasury, with maturities of no less than one year. The indices are unmanaged, have no fees or costs and are not available for investment. | |
| Before April 30, 2014, the Portfolio was known as Lazard Retirement Multi-Asset Targeted Volatility Portfolio. | |
| † | The inception date for the Portfolio was April 30, 2012. |
| Semi-Annual Report | 11 |
Lazard Retirement Series, Inc. Information About Your Portfolio’s Expenses (unaudited)
Expense Example
As a shareholder in a Portfolio of the Fund, you incur ongoing costs, including management fees, distribution and service (12b-1) fees (Service Shares only), and other expenses. This Example is intended to help you understand your ongoing costs (in dollars) of investing in a Portfolio and to compare these costs with the ongoing costs of investing in other mutual funds. The Example is based on an investment of $1,000 invested at the beginning of the six month period from January 1, 2016 through June 30, 2016 and held for the entire period.
Actual Expenses
For each Share class of the Portfolios, the first line of the table below provides information about actual account values and actual expenses. You may use the information in this line, together with the amount you invested, to estimate the expenses that you paid over the period. Simply divide your account value by $1,000 (for example, an $8,600 account value divided by $1,000=8.6), then multiply the result by the number in the first line under the heading entitled “Expenses Paid During Period” to estimate the expenses you paid on your account during this period.
Hypothetical Example for Comparison Purposes
For each Share class of the Portfolios, the second line of the table below provides information about hypothetical account values and hypothetical expenses based on the class’ actual expense ratio and an assumed rate of return of 5% per year before expenses, which is not the Portfolio’s actual return. The hypothetical account values and expenses may not be used to estimate the actual ending account balance or expenses you paid for the period. You may use this information to compare the ongoing costs of investing in the Portfolio and other mutual funds. To do so, compare this 5% hypothetical example with the 5% hypothetical examples that appear in the shareholders reports of other mutual funds.
Please note that you also bear fees and charges imposed by participating insurance companies at the separate account level, which are described in the separate prospectuses issued by the insurance companies. Such charges will have the effect of reducing account value.
| 12 | Semi-Annual Report |
| Beginning | Ending | Expenses Paid | Annualized Expense | |||||||||||||
| Account Value | Account Value | During Period* | Ratio During Period | |||||||||||||
| Portfolio | 1/1/16 | 6/30/16 | 1/1/16 - 6/30/16 | 1/1/16 - 6/30/16 | ||||||||||||
| US Strategic Equity | ||||||||||||||||
| Service Shares | ||||||||||||||||
| Actual | $ | 1,000.00 | $ | 1,005.60 | $ | 4.99 | 1.00 | % | ||||||||
| Hypothetical (5% Return Before Expenses) | $ | 1,000.00 | $ | 1,019.89 | $ | 5.02 | 1.00 | % | ||||||||
| US Small-Mid Cap Equity | ||||||||||||||||
| Service Shares | ||||||||||||||||
| Actual | $ | 1,000.00 | $ | 998.60 | $ | 6.21 | 1.25 | % | ||||||||
| Hypothetical (5% Return Before Expenses) | $ | 1,000.00 | $ | 1,018.65 | $ | 6.27 | 1.25 | % | ||||||||
| International Equity | ||||||||||||||||
| Service Shares | ||||||||||||||||
| Actual | $ | 1,000.00 | $ | 974.80 | $ | 5.40 | 1.10 | % | ||||||||
| Hypothetical (5% Return Before Expenses) | $ | 1,000.00 | $ | 1,019.39 | $ | 5.52 | 1.10 | % | ||||||||
| Emerging Markets Equity | ||||||||||||||||
| Service Shares | ||||||||||||||||
| Actual | $ | 1,000.00 | $ | 1,142.70 | $ | 7.41 | 1.39 | % | ||||||||
| Hypothetical (5% Return Before Expenses) | $ | 1,000.00 | $ | 1,017.95 | $ | 6.97 | 1.39 | % | ||||||||
| Investor Shares | ||||||||||||||||
| Actual | $ | 1,000.00 | $ | 1,144.40 | $ | 6.13 | 1.15 | % | ||||||||
| Hypothetical (5% Return Before Expenses) | $ | 1,000.00 | $ | 1,019.14 | $ | 5.77 | 1.15 | % | ||||||||
| Global Dynamic Multi Asset | ||||||||||||||||
| Service Shares | ||||||||||||||||
| Actual | $ | 1,000.00 | $ | 1,025.20 | $ | 5.29 | 1.05 | % | ||||||||
| Hypothetical (5% Return Before Expenses) | $ | 1,000.00 | $ | 1,019.64 | $ | 5.27 | 1.05 | % | ||||||||
| * | Expenses are equal to the annualized expense ratio of each Share class multiplied by the average account value over the period, multiplied by 182/366 (to reflect one-half year period). |
| Semi-Annual Report | 13 |
Lazard Retirement Series, Inc. Portfolio Holdings Presented by Sector June 30, 2016 (unaudited)
| Lazard | Lazard | Lazard | Lazard | ||||||||||||||
| Retirement | Retirement | Retirement | Retirement | ||||||||||||||
| US Strategic | US Small-Mid Cap | International | Emerging Markets | ||||||||||||||
| Sector* | Equity Portfolio | Equity Portfolio | Equity Portfolio | Equity Portfolio | |||||||||||||
| Consumer Discretionary | 8.9 | % | 13.5 | % | 17.2 | % | 8.7 | % | |||||||||
| Consumer Staples | 11.4 | — | 13.8 | 7.1 | |||||||||||||
| Energy | 5.9 | 3.1 | 7.2 | 8.4 | |||||||||||||
| Financials | 14.2 | 28.1 | 18.4 | 27.8 | |||||||||||||
| Health Care | 16.6 | 9.7 | 9.7 | 0.2 | |||||||||||||
| Industrials | 11.1 | 14.1 | 11.2 | 5.0 | |||||||||||||
| Information Technology | 25.6 | 18.4 | 4.1 | 23.6 | |||||||||||||
| Materials | 0.8 | 4.2 | 2.7 | 3.6 | |||||||||||||
| Telecommunication Services | 1.0 | — | 8.8 | 11.5 | |||||||||||||
| Utilities | — | 5.0 | 1.1 | — | |||||||||||||
| Short-Term Investments | 4.5 | 3.9 | 5.8 | 4.1 | |||||||||||||
| Total Investments | 100.0 | % | 100.0 | % | 100.0 | % | 100.0 | % | |||||||||
| Lazard Retirement | |||||||||||||||||
| Global Dynamic | |||||||||||||||||
| Multi Asset | |||||||||||||||||
| Sector* | Portfolio | ||||||||||||||||
| Consumer Discretionary | 10.9 | % | |||||||||||||||
| Consumer Staples | 8.1 | ||||||||||||||||
| Energy | 3.8 | ||||||||||||||||
| Financials | 16.9 | ||||||||||||||||
| Health Care | 8.7 | ||||||||||||||||
| Industrials | 8.1 | ||||||||||||||||
| Information Technology | 8.3 | ||||||||||||||||
| Materials | 2.9 | ||||||||||||||||
| Telecommunication Services | 4.8 | ||||||||||||||||
| Utilities | 4.6 | ||||||||||||||||
| Municipal | 0.5 | ||||||||||||||||
| Sovereign Debt | 17.3 | ||||||||||||||||
| US Treasury Securities | 1.5 | ||||||||||||||||
| Short-Term Investment | 3.6 | ||||||||||||||||
| Total Investments | 100.0 | % | |||||||||||||||
* Represents percentage of total investments.
| 14 | Semi-Annual Report |
Lazard Retirement Series, Inc. Portfolios of Investments June 30, 2016 (unaudited)
Fair | ||||||||
| Description | Shares | Value | ||||||
| Food & Staples Retailing | 2.7% | ||||||||
| CVS Health Corp. | 1,650 | $ | 157,971 | |||||
| Walgreens Boots Alliance, Inc. | 1,260 | 104,920 | ||||||
| 262,891 | ||||||||
| Food Products | 2.0% | ||||||||
| Kellogg Co. | 2,465 | 201,267 | ||||||
| Health Care Equipment & Supplies | 1.3% | ||||||||
| Stryker Corp. | 1,070 | 128,218 | ||||||
| Health Care Providers & Services | 1.6% | ||||||||
| Aetna, Inc. | 1,255 | 153,273 | ||||||
| Hotels, Restaurants & Leisure | 0.9% | ||||||||
| Norwegian Cruise Line Holdings, Ltd. (a) | 2,245 | 89,441 | ||||||
| Household Products | 3.8% | ||||||||
| The Procter & Gamble Co. | 4,380 | 370,855 | ||||||
| Insurance | 3.5% | ||||||||
| Aon PLC | 1,675 | 182,960 | ||||||
| The Hartford Financial Services Group, Inc. | 3,675 | 163,097 | ||||||
| 346,057 | ||||||||
| Internet Software & Services | 6.8% | ||||||||
| Alphabet, Inc., Class A (a) | 610 | 429,153 | ||||||
| Alphabet, Inc., Class C (a) | 93 | 64,365 | ||||||
| eBay, Inc. (a) | 7,435 | 174,054 | ||||||
| 667,572 | ||||||||
| IT Services | 3.5% | ||||||||
| Fidelity National Information Services, Inc. | 1,650 | 121,572 | ||||||
| Visa, Inc., Class A | 3,070 | 227,702 | ||||||
| 349,274 | ||||||||
| Life Sciences Tools & Services | 0.1% | ||||||||
| Quintiles Transnational Holdings, Inc. (a) | 100 | 6,532 | ||||||
| Machinery | 1.1% | ||||||||
| Deere & Co. | 885 | 71,720 | ||||||
| Parker Hannifin Corp. | 315 | 34,036 | ||||||
| 105,756 | ||||||||
| Media | 1.6% | ||||||||
| The Madison Square Garden Co. Class A (a) | 920 | 158,709 | ||||||
| Multiline Retail | 1.1% | ||||||||
| J.C. Penney Co., Inc. (a) | 12,450 | 110,556 | ||||||
The accompanying notes are an integral part of these financial statements.
| Semi-Annual Report | 15 |
Fair | ||||||||
| Description | Shares | Value | ||||||
| Lazard Retirement US Strategic Equity Portfolio (concluded) | ||||||||
| Oil, Gas & Consumable Fuels | 4.5% | ||||||||
| Chevron Corp. | 2,120 | $ | 222,240 | |||||
| EOG Resources, Inc. | 1,445 | 120,542 | ||||||
| Pioneer Natural Resources Co. | 695 | 105,091 | ||||||
| 447,873 | ||||||||
| Pharmaceuticals | 13.7% | ||||||||
| Allergan PLC (a) | 1,045 | 241,489 | ||||||
| Eli Lilly & Co. | 2,275 | 179,156 | ||||||
| Mallinckrodt PLC (a) | 1,945 | 118,217 | ||||||
| Pfizer, Inc. | 9,990 | 351,748 | ||||||
| Zoetis, Inc. | 9,658 | 458,369 | ||||||
| 1,348,979 | ||||||||
| Real Estate Investment Trusts (REITs) | 1.8% | ||||||||
| Corrections Corp. of America | 3,198 | 111,994 | ||||||
| Host Hotels & Resorts, Inc. | 4,205 | 68,163 | ||||||
| 180,157 | ||||||||
| Road & Rail | 1.6% | ||||||||
| Union Pacific Corp. | 1,815 | 158,359 | ||||||
| Semiconductors & Semiconductor Equipment | 4.9% | ||||||||
| Applied Materials, Inc. | 4,575 | 109,663 | ||||||
| NXP Semiconductors NV (a) | 1,835 | 143,754 | ||||||
| Skyworks Solutions, Inc. | 2,435 | 154,087 | ||||||
| Teradyne, Inc. | 3,735 | 73,542 | ||||||
| 481,046 | ||||||||
Fair | ||||||||
| Description | Shares | Value | ||||||
| Software | 3.4% | ||||||||
| Microsoft Corp. | 6,655 | $ | 340,536 | |||||
| Specialty Retail | 3.1% | ||||||||
| Advance Auto Parts, Inc. | 1,868 | 301,925 | ||||||
| Technology Hardware, Storage & Peripherals | 3.2% | ||||||||
| Apple, Inc. | 3,324 | 317,774 | ||||||
| Textiles, Apparel & Luxury Goods | 0.6% | ||||||||
| Deckers Outdoor Corp. (a) | 1,005 | 57,808 | ||||||
| Total Common Stocks (Cost $9,029,655) | 9,421,598 | |||||||
| Short-Term Investment | 4.5% | ||||||||
| State Street Institutional Treasury Money Market Fund, Premier Class, 0.14% (7 day yield) (Cost $440,410) | 440,410 | 440,410 | ||||||
| Total Investments | 100.0% (Cost $9,470,065) (b) | $ | 9,862,008 | ||||||
| Cash and Other Assets in Excess of Liabilities | 0.0% | 83 | |||||||
| Net Assets | 100.0% | $ | 9,862,091 | ||||||
The accompanying notes are an integral part of these financial statements.
| 16 | Semi-Annual Report |
Fair | ||||||||
| Description | Shares | Value | ||||||
| Diversified Financial Services | 2.9% | ||||||||
| CBOE Holdings, Inc. | 10,200 | $ | 679,524 | |||||
| Morningstar, Inc. | 11,330 | 926,567 | ||||||
| 1,606,091 | ||||||||
| Electric Utilities | 1.8% | ||||||||
| PNM Resources, Inc. | 28,940 | 1,025,634 | ||||||
| Electrical Equipment | 2.2% | ||||||||
| Generac Holdings, Inc. (a) | 15,425 | 539,258 | ||||||
| Regal-Beloit Corp. | 12,165 | 669,683 | ||||||
| 1,208,941 | ||||||||
| Electronic Equipment, Instruments & Components | 2.9% | ||||||||
| FLIR Systems, Inc. | 27,085 | 838,281 | ||||||
| Littelfuse, Inc. | 6,520 | 770,599 | ||||||
| 1,608,880 | ||||||||
| Gas Utilities | 1.2% | ||||||||
| New Jersey Resources Corp. | 17,990 | 693,515 | ||||||
| Health Care Equipment & Supplies | 3.1% | ||||||||
| DENTSPLY SIRONA, Inc. | 14,627 | 907,459 | ||||||
| STERIS PLC | 11,910 | 818,813 | ||||||
| 1,726,272 | ||||||||
| Health Care Providers & Services | 1.2% | ||||||||
| Team Health Holdings, Inc. (a) | 17,125 | 696,474 | ||||||
| Hotels, Restaurants & Leisure | 1.0% | ||||||||
| Bloomin’ Brands, Inc. | 30,945 | 552,987 | ||||||
| Insurance | 8.3% | ||||||||
| Arch Capital Group, Ltd. (a) | 15,045 | 1,083,240 | ||||||
| Argo Group International Holdings, Ltd. | 17,879 | 927,920 | ||||||
| Brown & Brown, Inc. | 15,860 | 594,274 | ||||||
| Reinsurance Group of America, Inc. | 11,120 | 1,078,529 | ||||||
| Validus Holdings, Ltd. | 19,130 | 929,527 | ||||||
| 4,613,490 | ||||||||
| Internet Software & Services | 1.3% | ||||||||
| j2 Global, Inc. | 11,255 | 710,978 | ||||||
| IT Services | 2.9% | ||||||||
| Leidos Holdings, Inc. | 17,445 | 835,092 | ||||||
| Vantiv, Inc., Class A (a) | 14,160 | 801,456 | ||||||
| 1,636,548 | ||||||||
The accompanying notes are an integral part of these financial statements.
| Semi-Annual Report | 17 |
Fair | ||||||||
| Description | Shares | Value | ||||||
| Lazard Retirement US Small-Mid Cap Equity Portfolio (concluded) | ||||||||
| Life Sciences Tools & Services | 3.2% | ||||||||
| Quintiles Transnational Holdings, Inc. (a) | 14,140 | $ | 923,625 | |||||
| VWR Corp. (a) | 30,735 | 888,241 | ||||||
| 1,811,866 | ||||||||
| Machinery | 3.7% | ||||||||
| Altra Industrial Motion Corp. | 24,345 | 656,828 | ||||||
| Tennant Co. | 5,100 | 274,737 | ||||||
| TriMas Corp. (a) | 33,805 | 608,490 | ||||||
| Woodward, Inc. | 9,510 | 548,156 | ||||||
| 2,088,211 | ||||||||
| Media | 3.9% | ||||||||
| AMC Networks, Inc., Class A (a) | 12,440 | 751,625 | ||||||
| Cable One, Inc. | 920 | 470,497 | ||||||
| Scholastic Corp. | 24,265 | 961,137 | ||||||
| 2,183,259 | ||||||||
| Multi-Utilities | 1.9% | ||||||||
| CMS Energy Corp. | 23,600 | 1,082,296 | ||||||
| Oil, Gas & Consumable Fuels | 3.2% | ||||||||
| Matador Resources Co. (a) | 24,415 | 483,417 | ||||||
| Memorial Resource Development Corp. (a) | 41,105 | 652,747 | ||||||
| Newfield Exploration Co. (a) | 14,195 | 627,135 | ||||||
| 1,763,299 | ||||||||
| Real Estate Investment Trusts (REITs) | 7.9% | ||||||||
| American Campus Communities, Inc. | 18,680 | 987,611 | ||||||
| DCT Industrial Trust, Inc. | 23,095 | 1,109,484 | ||||||
| Extra Space Storage, Inc. | 6,305 | 583,465 | ||||||
| Kilroy Realty Corp. | 10,535 | 698,365 | ||||||
| Tanger Factory Outlet Centers, Inc. | 25,500 | 1,024,590 | ||||||
| 4,403,515 | ||||||||
| Real Estate Management & Development | 1.0% | ||||||||
| Jones Lang LaSalle, Inc. | 5,715 | 556,927 | ||||||
| Semiconductors & Semiconductor Equipment | 4.4% | ||||||||
| Brooks Automation, Inc. | 20,400 | 228,888 | ||||||
| Cypress Semiconductor Corp. | 78,700 | 830,285 | ||||||
| MACOM Technology Solutions Holdings, Inc. (a) | 16,890 | 557,032 | ||||||
| Microsemi Corp. (a) | 25,655 | 838,406 | ||||||
| 2,454,611 | ||||||||
Fair | ||||||||
| Description | Shares | Value | ||||||
| Software | 4.5% | ||||||||
| BroadSoft, Inc. (a) | 15,015 | $ | 616,065 | |||||
| Pegasystems, Inc. | 13,725 | 369,889 | ||||||
| RealPage, Inc. (a) | 40,860 | 912,404 | ||||||
| Red Hat, Inc. (a) | 8,795 | 638,517 | ||||||
| 2,536,875 | ||||||||
| Specialty Retail | 4.4% | ||||||||
| Advance Auto Parts, Inc. | 2,660 | 429,936 | ||||||
| Chico’s FAS, Inc. | 64,985 | 695,989 | ||||||
| Foot Locker, Inc. | 11,425 | 626,776 | ||||||
| Sally Beauty Holdings, Inc. (a) | 23,850 | 701,428 | ||||||
| 2,454,129 | ||||||||
| Technology Hardware, Storage & Peripherals | 1.4% | ||||||||
| NCR Corp. (a) | 27,230 | 756,177 | ||||||
| Textiles, Apparel & Luxury Goods | 1.2% | ||||||||
| Steven Madden, Ltd. (a) | 19,650 | 671,637 | ||||||
| Trading Companies & Distributors | 1.3% | ||||||||
| Beacon Roofing Supply, Inc. (a) | 16,160 | 734,795 | ||||||
| Total Common Stocks (Cost $51,223,621) | 53,927,203 | |||||||
| Short-Term Investment | 4.0% | ||||||||
| State Street Institutional Treasury Money Market Fund,
Premier Class, 0.14% (7 day yield) (Cost $2,212,382) | 2,212,382 | 2,212,382 | ||||||
| Total Investments | 100.5% (Cost $53,436,003) (b) | $ | 56,139,585 | ||||||
| Liabilities in Excess of Cash and Other Assets | (0.5)% | (252,427 | ) | ||||||
| Net Assets | 100.0% | $ | 55,887,158 | ||||||
The accompanying notes are an integral part of these financial statements.
| 18 | Semi-Annual Report |
| Description | Shares | Fair Value | ||||||
| Italy | 1.6% | ||||||||
| Azimut Holding SpA | 301,232 | $ | 4,909,103 | |||||
| Mediaset SpA | 1,765,247 | 6,213,632 | ||||||
| 11,122,735 | ||||||||
| Japan | 20.7% | ||||||||
| ABC-Mart, Inc. | 117,600 | 7,826,597 | ||||||
| Daiwa House Industry Co., Ltd. | 685,700 | 20,008,604 | ||||||
| Don Quijote Holdings Co., Ltd. | 403,500 | 14,907,375 | ||||||
| Isuzu Motors, Ltd. | 845,600 | 10,349,748 | ||||||
| Japan Tobacco, Inc. | 262,500 | 10,515,908 | ||||||
| KDDI Corp. | 575,200 | 17,509,848 | ||||||
| Makita Corp. | 142,500 | 9,396,291 | ||||||
| Seven & I Holdings Co., Ltd. | 277,400 | 11,581,254 | ||||||
| SoftBank Group Corp. | 190,600 | 10,783,186 | ||||||
| Sony Corp. | 395,000 | 11,560,113 | ||||||
| Sumitomo Mitsui Financial Group, Inc. | 394,300 | 11,304,686 | ||||||
| United Arrows, Ltd. | 146,300 | 4,232,953 | ||||||
| 139,976,563 | ||||||||
| Luxembourg | 0.7% | ||||||||
| RTL Group SA | 58,968 | 4,809,467 | ||||||
| Netherlands | 5.6% | ||||||||
| Koninklijke KPN NV | 1,807,647 | 6,556,594 | ||||||
| Royal Dutch Shell PLC, A Shares | 661,985 | 18,074,439 | ||||||
| Wolters Kluwer NV | 322,434 | 13,176,416 | ||||||
| 37,807,449 | ||||||||
| Norway | 1.4% | ||||||||
| Telenor ASA | 584,522 | 9,654,712 | ||||||
| Philippines | 0.5% | ||||||||
| Alliance Global Group, Inc. | 9,970,300 | 3,146,319 | ||||||
| Spain | 1.1% | ||||||||
| Red Electrica Corporacion SA | 81,689 | 7,282,942 | ||||||
| Sweden | 3.4% | ||||||||
| Assa Abloy AB, Class B | 678,061 | 13,898,162 | ||||||
| Swedbank AB, A Shares | 440,122 | 9,206,285 | ||||||
| 23,104,447 | ||||||||
| Switzerland | 5.9% | ||||||||
| Novartis AG | 336,063 | 27,645,811 | ||||||
| Wolseley PLC | 238,805 | 12,376,111 | ||||||
| 40,021,922 | ||||||||
| Taiwan | 2.0% | ||||||||
| Taiwan Semiconductor Manufacturing Co., Ltd. Sponsored ADR | 509,400 | 13,361,562 | ||||||
The accompanying notes are an integral part of these financial statements.
| Semi-Annual Report | 19 |
| Description | Shares | Fair Value | ||||||
| Lazard Retirement International Equity Portfolio (concluded) | ||||||||
| Thailand | 0.6% | ||||||||
| Krung Thai Bank Public Co. Ltd. (c) | 8,002,400 | $ | 3,711,984 | |||||
| Turkey | 1.1% | ||||||||
| Turkcell Iletisim Hizmetleri AS (a) | 2,084,109 | 7,676,082 | ||||||
| United Kingdom | 12.8% | ||||||||
| British American Tobacco PLC | 322,509 | 20,985,808 | ||||||
| Direct Line Insurance Group PLC | 1,019,511 | 4,714,692 | ||||||
| Howden Joinery Group PLC | 957,463 | 4,993,828 | ||||||
| Informa PLC | 666,172 | 6,524,041 | ||||||
| J Sainsbury PLC | 2,069,882 | 6,419,163 | ||||||
| Provident Financial PLC | 184,746 | 5,710,496 | ||||||
| Prudential PLC | 844,538 | 14,387,380 | ||||||
| RELX PLC | 678,674 | 12,505,020 | ||||||
| Unilever PLC | 208,960 | 10,023,200 | ||||||
| 86,263,628 | ||||||||
| Description | Shares | Fair Value | ||||||
| United States | 3.1% | ||||||||
| Aon PLC | 117,875 | $ | 12,875,486 | |||||
| Signet Jewelers, Ltd. | 95,341 | 7,857,052 | ||||||
| 20,732,538 | ||||||||
| Total Common
Stocks (Cost $543,283,343) | 612,479,892 | |||||||
| Short-Term Investment | 5.5% | ||||||||
| State
Street Institutional Treasury Money Market Fund, Premier Class, 0.14% (7 day yield) (Cost $37,473,652) | 37,473,652 | 37,473,652 | ||||||
| Total Investments | 96.0% (Cost $580,756,995) (b) | $ | 649,953,544 | ||||||
| Cash and Other Assets in Excess of Liabilities | 4.0% | 26,837,535 | |||||||
| Net Assets | 100.0% | $ | 676,791,079 | ||||||
The accompanying notes are an integral part of these financial statements.
| 20 | Semi-Annual Report |
| Description | Shares | Fair Value | ||||||
| India | 9.8% | ||||||||
| Axis Bank, Ltd. | 2,743,029 | $ | 21,820,458 | |||||
| Bajaj Auto, Ltd. | 231,398 | 9,261,755 | ||||||
| Bharat Heavy Electricals, Ltd. | 2,506,622 | 4,783,163 | ||||||
| HCL Technologies, Ltd. | 1,086,435 | 11,787,919 | ||||||
| Hero MotoCorp, Ltd. | 346,621 | 16,228,679 | ||||||
| Punjab National Bank (a) | 5,875,030 | 9,307,249 | ||||||
| Tata Consultancy Services, Ltd. | 752,872 | 28,437,364 | ||||||
| 101,626,587 | ||||||||
| Indonesia | 7.2% | ||||||||
| PT Astra International Tbk | 22,998,900 | 12,964,337 | ||||||
| PT Bank Mandiri (Persero) Tbk | 24,016,429 | 17,410,321 | ||||||
| PT Semen Indonesia (Persero) Tbk | 10,198,200 | 7,247,130 | ||||||
| PT Telekomunikasi Indonesia (Persero) Tbk Sponsored ADR | 502,400 | 30,877,504 | ||||||
| PT United Tractors Tbk | 4,815,740 | 5,422,861 | ||||||
| 73,922,153 | ||||||||
| Macau | 0.3% | ||||||||
| Wynn Macau, Ltd. | 2,116,000 | 3,083,255 | ||||||
| Malaysia | 0.6% | ||||||||
| British American Tobacco Malaysia Berhad | 517,700 | 6,772,540 | ||||||
| Mexico | 2.8% | ||||||||
| America Movil SAB de CV, Class L Sponsored ADR | 744,448 | 9,126,933 | ||||||
| Grupo Mexico SAB de CV, Series B | 4,114,197 | 9,640,460 | ||||||
| Kimberly-Clark de Mexico SAB de CV, Series A | 4,271,362 | 10,090,503 | ||||||
| 28,857,896 | ||||||||
| Pakistan | 2.0% | ||||||||
| Habib Bank, Ltd. | 4,359,600 | 8,225,461 | ||||||
| Oil & Gas Development Co., Ltd. | 3,279,300 | 4,355,724 | ||||||
| Pakistan Petroleum, Ltd. | 5,144,402 | 7,624,437 | ||||||
| 20,205,622 | ||||||||
| Philippines | 1.3% | ||||||||
| Philippine Long Distance Telephone Co. Sponsored ADR | 306,900 | 13,678,533 | ||||||
The accompanying notes are an integral part of these financial statements.
| Semi-Annual Report | 21 |
| Description | Shares | Fair Value | ||||||
| Lazard Retirement Emerging Markets Equity Portfolio (concluded) | ||||||||
| Russia | 9.1% | ||||||||
| ALROSA PAO (a) | 6,613,700 | $ | 7,123,980 | |||||
| Gazprom PJSC Sponsored ADR | 3,402,719 | 14,695,152 | ||||||
| Lukoil PJSC Sponsored ADR | 423,337 | 17,717,515 | ||||||
| Magnit PJSC Sponsored GDR (c), (d) | 108,375 | 3,600,218 | ||||||
| Magnit PJSC Sponsored GDR | 57,639 | 1,917,301 | ||||||
| Mobile TeleSystems PJSC Sponsored ADR | 1,805,420 | 14,948,878 | ||||||
| Sberbank of Russia PJSC (a) | 16,162,500 | 33,686,691 | ||||||
| 93,689,735 | ||||||||
| South Africa | 7.8% | ||||||||
| Bid Corp., Ltd. (a) | 403,334 | 7,558,405 | ||||||
| Imperial Holdings, Ltd. | 817,112 | 8,391,608 | ||||||
| Life Healthcare Group Holdings, Ltd. | 1,035,590 | 2,550,354 | ||||||
| Nedbank Group, Ltd. | 590,682 | 7,510,247 | ||||||
| PPC, Ltd. | 3,297,837 | 1,799,404 | ||||||
| Sanlam, Ltd. | 2,031,224 | 8,354,866 | ||||||
| Shoprite Holdings, Ltd. | 1,233,255 | 13,958,360 | ||||||
| Standard Bank Group, Ltd. | 983,441 | 8,620,696 | ||||||
| The Bidvest Group, Ltd. | 403,334 | 3,799,823 | ||||||
| Vodacom Group, Ltd. | 754,698 | 8,631,388 | ||||||
| Woolworths Holdings, Ltd. | 1,627,632 | 9,313,231 | ||||||
| 80,488,382 | ||||||||
| South Korea | 12.5% | ||||||||
| Coway Co., Ltd. | 151,043 | 13,728,902 | ||||||
| Hanwha Life Insurance Co., Ltd. | 1,875,601 | 9,434,582 | ||||||
| Hyundai Mobis Co., Ltd. | 74,708 | 16,356,500 | ||||||
| KB Financial Group, Inc. | 326,393 | 9,311,037 | ||||||
| KT&G Corp. | 72,977 | 8,650,181 | ||||||
| Samsung Electronics Co., Ltd. | 27,862 | 34,684,255 | ||||||
| Shinhan Financial Group Co., Ltd. | 646,348 | 21,340,129 | ||||||
| SK Hynix, Inc. | 538,610 | 15,308,352 | ||||||
| 128,813,938 | ||||||||
| Description | Shares | Fair Value | ||||||
| Taiwan | 5.4% | ||||||||
| Hon Hai Precision Industry Co., Ltd. | 4,240,138 | $ | 10,910,300 | |||||
| Taiwan Semiconductor Manufacturing Co., Ltd. | 8,920,642 | 45,107,819 | ||||||
| 56,018,119 | ||||||||
| Thailand | 2.1% | ||||||||
| Kasikornbank Public Co. Ltd. | 1,618,436 | 7,958,241 | ||||||
| PTT Exploration & Production Public Co. Ltd. | 2,742,135 | 6,476,870 | ||||||
| The Siam Cement Public Co. Ltd. | 551,650 | 7,512,879 | ||||||
| 21,947,990 | ||||||||
| Turkey | 4.4% | ||||||||
| Akbank TAS | 4,823,787 | 13,971,599 | ||||||
| KOC Holding AS | 2,217,366 | 10,133,852 | ||||||
| Turk Telekomunikasyon AS | 555,430 | 1,175,791 | ||||||
| Turkcell Iletisim Hizmetleri AS (a) | 2,738,913 | 10,087,822 | ||||||
| Turkiye Is Bankasi AS, C Shares | 6,153,624 | 9,864,972 | ||||||
| 45,234,036 | ||||||||
| Total Common Stocks (Cost $1,068,453,550) | 987,012,742 | |||||||
| Short-Term Investment | 4.1% | ||||||||
| State Street Institutional Treasury
Money Market Fund, Premier Class, 0.14% (7 day yield) (Cost $41,909,918) | 41,909,918 | 41,909,918 | ||||||
| Total Investments | 99.8% (Cost $1,110,363,468) (b) | $ | 1,028,922,660 | ||||||
| Cash and Other Assets in Excess of Liabilities | 0.2% | 1,890,529 | |||||||
| Net Assets | 100.0% | $ | 1,030,813,189 | ||||||
The accompanying notes are an integral part of these financial statements.
| 22 | Semi-Annual Report |
| Description | Shares | Fair Value | ||||||
| Genworth MI Canada, Inc. | 8,424 | $ | 216,085 | |||||
| Imperial Oil, Ltd. | 5,350 | 169,285 | ||||||
| Intact Financial Corp. | 7,313 | 522,402 | ||||||
| Lundin Mining Corp. (a) | 62,217 | 209,967 | ||||||
| Magna International, Inc. | 20,064 | 704,286 | ||||||
| Manulife Financial Corp. | 15,318 | 209,504 | ||||||
| Metro, Inc. | 9,068 | 315,918 | ||||||
| Open Text Corp. | 6,461 | 382,024 | ||||||
| Quebecor, Inc., Class B | 5,875 | 168,344 | ||||||
| Suncor Energy, Inc. | 12,020 | 333,447 | ||||||
| Transcontinental, Inc. Class A | 8,034 | 108,886 | ||||||
| Uni-Select, Inc. | 4,220 | 107,007 | ||||||
| 7,600,010 | ||||||||
| Denmark | 0.7% | ||||||||
| Carlsberg A/S Class B Sponsored ADR | 27,285 | 519,779 | ||||||
| Coloplast A/S, Class B | 3,303 | 246,561 | ||||||
| Novo Nordisk A/S Sponsored ADR | 10,295 | 553,665 | ||||||
| Novo Nordisk A/S, Class B | 5,539 | 297,871 | ||||||
| Vestas Wind Systems A/S | 2,411 | 163,621 | ||||||
| 1,781,497 | ||||||||
| Finland | 0.6% | ||||||||
| Kone Oyj, Class B | 12,783 | 590,223 | ||||||
| Sampo Oyj, A Shares ADR | 42,795 | 870,664 | ||||||
| 1,460,887 | ||||||||
| France | 0.5% | ||||||||
| Airbus Group SE | 7,264 | 421,809 | ||||||
| BNP Paribas SA | 3,087 | 138,785 | ||||||
| Electricite de France SA | 6,734 | 82,775 | ||||||
| Engie SA | 10,747 | 173,440 | ||||||
| Orange SA | 12,446 | 203,293 | ||||||
| Sopra Steria Group | 1,064 | 110,429 | ||||||
| TOTAL SA | 3,406 | 164,243 | ||||||
| 1,294,774 | ||||||||
| Germany | 1.0% | ||||||||
| Bayer AG | 1,940 | 195,188 | ||||||
| Continental AG Sponsored ADR | 13,455 | 511,290 | ||||||
| Daimler AG | 1,242 | 74,068 | ||||||
| Deutsche Lufthansa AG | 6,493 | 75,593 | ||||||
| GEA Group AG Sponsored ADR | 11,035 | 520,962 | ||||||
| Muenchener Rueckversicherungs AG | 631 | 105,458 | ||||||
| ProSiebenSat.1 Media SE | 3,573 | 156,017 | ||||||
| Rheinmetall AG | 1,347 | 79,552 | ||||||
| Symrise AG ADR | 46,910 | 802,395 | ||||||
| 2,520,523 | ||||||||
The accompanying notes are an integral part of these financial statements.
| Semi-Annual Report | 23 |
| Description | Shares | Fair Value | ||||||
| Lazard Retirement Global Dynamic Multi Asset Portfolio (continued) | ||||||||
| Hong Kong | 1.9% | ||||||||
| AIA Group, Ltd. Sponsored ADR | 22,355 | $ | 537,973 | |||||
| CLP Holdings, Ltd. | 43,500 | 445,293 | ||||||
| Henderson Land Development Co., Ltd. | 46,200 | 261,793 | ||||||
| Hongkong Land Holdings, Ltd. | 20,700 | 126,522 | ||||||
| Jardine Matheson Holdings, Ltd. | 9,800 | 573,878 | ||||||
| Link Real Estate Investment Trust | 170,500 | 1,166,411 | ||||||
| PCCW, Ltd. | 451,000 | 303,233 | ||||||
| Swire Pacific, Ltd., Class A | 51,500 | 586,395 | ||||||
| The Wharf Holdings, Ltd. | 49,000 | 299,457 | ||||||
| Wheelock & Co., Ltd. | 89,000 | 420,933 | ||||||
| 4,721,888 | ||||||||
| Ireland | 0.6% | ||||||||
| Experian PLC | 5,854 | 111,194 | ||||||
| Ryanair Holdings PLC Sponsored ADR | 1,501 | 104,380 | ||||||
| Shire PLC ADR | 7,175 | 1,320,774 | ||||||
| 1,536,348 | ||||||||
| Israel | 0.6% | ||||||||
| Bank Hapoalim BM | 19,750 | 99,693 | ||||||
| Check Point Software Technologies, Ltd. (a) | 3,575 | 284,856 | ||||||
| Israel Discount Bank, Ltd., Class A (a) | 82,275 | 141,937 | ||||||
| Nice, Ltd. | 2,968 | 186,370 | ||||||
| Orbotech, Ltd. (a) | 12,016 | 307,009 | ||||||
| Teva Pharmaceutical Industries, Ltd. Sponsored ADR | 11,360 | 570,613 | ||||||
| 1,590,478 | ||||||||
| Italy | 0.4% | ||||||||
| Davide Campari-Milano SpA ADR | 145,760 | 708,102 | ||||||
| Enel SpA | 24,120 | 107,274 | ||||||
| Moncler SpA | 4,049 | 64,046 | ||||||
| Saras SpA | 48,272 | 83,638 | ||||||
| 963,060 | ||||||||
| Japan | 5.5% | ||||||||
| Amano Corp. | 9,300 | 160,793 | ||||||
| Astellas Pharma, Inc. | 9,500 | 148,668 | ||||||
| Central Japan Railway Co. | 400 | 70,799 | ||||||
| Chubu Electric Power Co., Inc. | 6,900 | 98,248 | ||||||
| CKD Corp. | 7,200 | 53,450 | ||||||
| Daito Trust Construction Co., Ltd. | 6,000 | 972,576 | ||||||
| Daiwa House Industry Co., Ltd. | 4,600 | 134,227 | ||||||
| Daiwa House Industry Co., Ltd. ADR | 41,415 | 1,202,899 | ||||||
| Electric Power Development Co., Ltd. | 3,600 | 83,674 | ||||||
| Fuji Heavy Industries, Ltd. | 9,700 | 332,052 | ||||||
| Fujitsu General, Ltd. | 4,000 | 88,445 | ||||||
| Haseko Corp. | 9,100 | 90,821 | ||||||
| Description | Shares | Fair Value | ||||||
| Heiwa Corp. | 7,600 | $ | 153,324 | |||||
| Idemitsu Kosan Co., Ltd. | 35,700 | 769,781 | ||||||
| Iida Group Holdings Co., Ltd. | 10,600 | 215,903 | ||||||
| Japan Airlines Co., Ltd. | 3,700 | 118,757 | ||||||
| JTEKT Corp. | 11,400 | 128,530 | ||||||
| Kakaku.com, Inc. | 5,300 | 104,479 | ||||||
| KDDI Corp. | 4,300 | 130,898 | ||||||
| KDDI Corp. ADR | 65,695 | 994,622 | ||||||
| Kumagai Gumi Co., Ltd. | 29,000 | 81,629 | ||||||
| Kuraray Co., Ltd. | 10,700 | 127,253 | ||||||
| Kyokuto Kaihatsu Kogyo Co., Ltd. | 7,500 | 70,131 | ||||||
| Lion Corp. | 11,000 | 180,260 | ||||||
| Mazda Motor Corp. | 6,500 | 87,059 | ||||||
| Medipal Holdings Corp. | 27,800 | 456,167 | ||||||
| Mitsubishi Electric Corp. | 32,000 | 379,430 | ||||||
| Mitsubishi UFJ Financial Group, Inc. | 81,200 | 361,935 | ||||||
| Murata Manufacturing Co., Ltd. | 4,900 | 549,674 | ||||||
| Nichirei Corp. | 15,000 | 137,084 | ||||||
| Nippon Telegraph & Telephone Corp. | 14,000 | 657,209 | ||||||
| Nipro Corp. | 11,100 | 137,196 | ||||||
| Nissan Chemical Industries, Ltd. | 3,900 | 113,278 | ||||||
| Nisshinbo Holdings, Inc. | 12,400 | 111,918 | ||||||
| Nitto Denko Corp. | 1,400 | 88,283 | ||||||
| NTT Data Corp. | 2,100 | 98,959 | ||||||
| Ryohin Keikaku Co., Ltd. ADR | 11,480 | 556,608 | ||||||
| Sanyo Chemical Industries, Ltd. | 14,000 | 108,737 | ||||||
| Sanyo Special Steel Co., Ltd. | 14,000 | 62,125 | ||||||
| Shimadzu Corp. | 8,000 | 119,064 | ||||||
| Shionogi & Co., Ltd. | 2,000 | 108,770 | ||||||
| Showa Shell Sekiyu KK | 10,800 | 100,350 | ||||||
| Sompo Japan Nipponkoa Holdings, Inc. | 14,500 | 384,097 | ||||||
| Sumitomo Chemical Co., Ltd. | 30,000 | 123,026 | ||||||
| Sumitomo Mitsui Financial Group, Inc. | 22,400 | 642,214 | ||||||
| Sumitomo Osaka Cement Co., Ltd. | 33,000 | 141,124 | ||||||
| Taikisha, Ltd. | 6,000 | 148,437 | ||||||
| Teijin, Ltd. | 101,000 | 332,664 | ||||||
| The San-In Godo Bank, Ltd. | 22,900 | 148,849 | ||||||
| Toho Holdings Co., Ltd. | 4,400 | 105,671 | ||||||
| Tohoku Electric Power Co., Inc. | 8,600 | 107,849 | ||||||
| Tokyo Gas Co., Ltd. | 41,000 | 168,314 | ||||||
| Ube Industries, Ltd. | 104,000 | 171,073 | ||||||
| UNY Group Holdings Co., Ltd. | 25,000 | 209,615 | ||||||
| V Technology Co., Ltd. | 1,300 | 148,619 | ||||||
| West Japan Railway Co. | 2,400 | 151,696 | ||||||
| Yamaguchi Financial Group, Inc. | 21,000 | 197,709 | ||||||
| Yoshinoya Holdings Co., Ltd. | 10,700 | 145,608 | ||||||
| 14,072,630 | ||||||||
The accompanying notes are an integral part of these financial statements.
| 24 | Semi-Annual Report |
| Description | Shares | Fair Value | ||||||
| Lazard Retirement Global Dynamic Multi Asset Portfolio (continued) | ||||||||
| Malta | 0.1% | ||||||||
| Unibet Group PLC SDR | 24,262 | $ | 221,950 | |||||
| Netherlands | 1.4% | ||||||||
| NN Group NV | 11,375 | 316,006 | ||||||
| NXP Semiconductors NV (a) | 10,865 | 851,164 | ||||||
| Royal Dutch Shell PLC, A Shares | 49,322 | 1,352,706 | ||||||
| Wolters Kluwer NV | 2,452 | 100,202 | ||||||
| Wolters Kluwer NV Sponsored ADR | 24,555 | 1,002,581 | ||||||
| 3,622,659 | ||||||||
| New Zealand | 0.1% | ||||||||
| Air New Zealand, Ltd. | 81,148 | 121,956 | ||||||
| Fisher & Paykel Healthcare Corp., Ltd., Class C | 33,170 | 238,094 | ||||||
| 360,050 | ||||||||
| Norway | 0.8% | ||||||||
| Det Norske Oljeselskap ASA (a) | 37,731 | 459,339 | ||||||
| DNB ASA | 9,034 | 109,222 | ||||||
| Leroy Seafood Group ASA | 2,827 | 133,144 | ||||||
| Statoil ASA | 73,385 | 1,270,691 | ||||||
| Telenor ASA | 10,033 | 165,718 | ||||||
| 2,138,114 | ||||||||
| Portugal | 0.1% | ||||||||
| Altri SGPS SA | 17,635 | 57,088 | ||||||
| Galp Energia SGPS SA | 15,632 | 217,090 | ||||||
| Jeronimo Martins SGPS SA | 6,543 | 103,083 | ||||||
| 377,261 | ||||||||
| Singapore | 0.7% | ||||||||
| CapitaLand, Ltd. | 93,700 | 215,246 | ||||||
| SATS, Ltd. | 42,300 | 129,230 | ||||||
| Singapore Airlines, Ltd. | 62,700 | 497,285 | ||||||
| United Overseas Bank, Ltd. | 65,300 | 901,713 | ||||||
| 1,743,474 | ||||||||
| South Africa | 0.1% | ||||||||
| Mediclinic International PLC | 19,107 | 279,749 | ||||||
| Spain | 0.3% | ||||||||
| Banco Santander SA | 81,466 | 317,180 | ||||||
| CaixaBank SA | 119,934 | 264,004 | ||||||
| Corporacion Financiera Alba SA | 1,257 | 51,309 | ||||||
| 632,493 | ||||||||
| Description | Shares | Fair Value | ||||||
| Sweden | 0.7% | ||||||||
| Assa Abloy AB ADR | 101,300 | $ | 1,033,260 | |||||
| Axfood AB | 33,474 | 640,318 | ||||||
| Castellum AB | 10,508 | 149,576 | ||||||
| 1,823,154 | ||||||||
| Switzerland | 1.2% | ||||||||
| Actelion, Ltd. | 831 | 139,439 | ||||||
| Actelion, Ltd. ADR | 30,685 | 1,289,077 | ||||||
| Chocoladefabriken Lindt & Spruengli AG | 37 | 220,086 | ||||||
| Roche Holding AG | 5,367 | 1,417,052 | ||||||
| 3,065,654 | ||||||||
| United Kingdom | 4.2% | ||||||||
| Admiral Group PLC | 7,349 | 200,587 | ||||||
| Bellway PLC | 7,775 | 196,576 | ||||||
| Berendsen PLC | 9,695 | 157,947 | ||||||
| Berkeley Group Holdings PLC | 4,960 | 168,848 | ||||||
| British American Tobacco PLC Sponsored ADR | 8,945 | 1,158,199 | ||||||
| BT Group PLC | 124,517 | 687,564 | ||||||
| Centrica PLC | 363,810 | 1,098,376 | ||||||
| Cineworld Group PLC | 7,492 | 54,637 | ||||||
| Coca-Cola European Partners PLC | 7,197 | 256,861 | ||||||
| Compass Group PLC | 18,658 | 355,651 | ||||||
| Compass Group PLC Sponsored ADR | 43,650 | 833,715 | ||||||
| Debenhams PLC | 186,392 | 138,329 | ||||||
| easyJet PLC | 7,005 | 101,755 | ||||||
| Greene King PLC | 8,875 | 92,643 | ||||||
| Greggs PLC | 6,965 | 90,292 | ||||||
| Halma PLC | 9,686 | 131,457 | ||||||
| Hargreaves Lansdown PLC | 18,903 | 314,561 | ||||||
| IG Group Holdings PLC | 9,892 | 106,964 | ||||||
| International Consolidated Airlines Group SA Sponsored ADR | 2,915 | 72,438 | ||||||
| ITV PLC | 51,482 | 124,362 | ||||||
| JD Sports Fashion PLC | 5,806 | 89,463 | ||||||
| Moneysupermarket.com Group PLC | 20,649 | 74,662 | ||||||
| National Grid PLC | 8,702 | 127,967 | ||||||
| Petrofac, Ltd. | 8,254 | 85,783 | ||||||
| Provident Financial PLC | 2,593 | 80,150 | ||||||
| Prudential PLC ADR | 19,205 | 653,162 | ||||||
| RELX NV | 1 | 17 | ||||||
| RELX NV Sponsored ADR | 59,030 | 1,027,712 | ||||||
| RELX PLC | 7,860 | 144,826 | ||||||
The accompanying notes are an integral part of these financial statements.
| Semi-Annual Report | 25 |
| Description | Shares | Fair Value | ||||||
| Lazard Retirement Global Dynamic Multi Asset Portfolio (continued) | ||||||||
| Rentokil Initial PLC | 98,050 | $ | 252,869 | |||||
| SSE PLC | 38,470 | 804,404 | ||||||
| Subsea 7 SA (a) | 26,566 | 260,020 | ||||||
| Unilever PLC Sponsored ADR | 11,175 | 535,394 | ||||||
| WH Smith PLC | 4,460 | 94,628 | ||||||
| 10,572,819 | ||||||||
| United States | 37.0% | ||||||||
| 3M Co. | 6,970 | 1,220,586 | ||||||
| Accenture PLC, Class A | 6,596 | 747,261 | ||||||
| Aetna, Inc. | 918 | 112,115 | ||||||
| Air Lease Corp. | 11,101 | 297,285 | ||||||
| Alphabet, Inc., Class A (a) | 1,829 | 1,286,756 | ||||||
| Alphabet, Inc., Class C (a) | 1,040 | 719,784 | ||||||
| Altria Group, Inc. | 2,120 | 146,195 | ||||||
| Amazon.com, Inc. (a) | 297 | 212,539 | ||||||
| AMC Networks, Inc., Class A (a) | 3,529 | 213,222 | ||||||
| Amdocs, Ltd. | 3,051 | 176,104 | ||||||
| American Electric Power Co., Inc. | 25,860 | 1,812,527 | ||||||
| Amgen, Inc. | 804 | 122,329 | ||||||
| Aon PLC | 9,298 | 1,015,621 | ||||||
| Apple, Inc. | 16,363 | 1,564,303 | ||||||
| Applied Materials, Inc. | 24,720 | 592,538 | ||||||
| ARRIS International PLC (a) | 9,604 | 201,300 | ||||||
| AT&T, Inc. | 54,035 | 2,334,852 | ||||||
| Automatic Data Processing, Inc. | 4,524 | 415,620 | ||||||
| AutoZone, Inc. (a) | 825 | 654,918 | ||||||
| Avon Products, Inc. | 44,267 | 167,329 | ||||||
| Ball Corp. | 1,037 | 74,965 | ||||||
| Bank of America Corp. | 51,216 | 679,636 | ||||||
| Baxter International, Inc. | 16,785 | 759,018 | ||||||
| Biogen, Inc. (a) | 1,043 | 252,218 | ||||||
| Bristol-Myers Squibb Co. | 10,862 | 798,900 | ||||||
| Bunge, Ltd. | 4,513 | 266,944 | ||||||
| Cadence Design Systems, Inc. (a) | 6,285 | 152,726 | ||||||
| Cal-Maine Foods, Inc. | 2,681 | 118,822 | ||||||
| Campbell Soup Co. | 12,020 | 799,691 | ||||||
| Carnival Corp. | 6,513 | 287,875 | ||||||
| Casey’s General Stores, Inc. | 2,339 | 307,602 | ||||||
| CBOE Holdings, Inc. | 5,243 | 349,289 | ||||||
| CBRE Group, Inc., Class A (a) | 14,625 | 387,270 | ||||||
| Church & Dwight Co., Inc. | 1,302 | 133,963 | ||||||
| Cigna Corp. | 673 | 86,137 | ||||||
| Cisco Systems, Inc. | 30,756 | 882,390 | ||||||
| Citigroup, Inc. | 19,583 | 830,123 | ||||||
| Description | Shares | Fair Value | ||||||
| Colgate-Palmolive Co. | 2,181 | $ | 159,649 | |||||
| Comcast Corp., Class A | 11,889 | 775,044 | ||||||
| Costco Wholesale Corp. | 1,453 | 228,179 | ||||||
| CR Bard, Inc. | 1,623 | 381,665 | ||||||
| CVS Health Corp. | 5,475 | 524,176 | ||||||
| Darden Restaurants, Inc. | 6,029 | 381,877 | ||||||
| Delta Air Lines, Inc. | 7,306 | 266,158 | ||||||
| Dr Pepper Snapple Group, Inc. | 7,307 | 706,075 | ||||||
| Eaton Corp. PLC | 8,310 | 496,356 | ||||||
| Edison International | 2,888 | 224,311 | ||||||
| Emerson Electric Co. | 3,225 | 168,216 | ||||||
| EOG Resources, Inc. | 5,545 | 462,564 | ||||||
| Equity Residential REIT | 2,329 | 160,422 | ||||||
| Everest Re Group, Ltd. | 3,771 | 688,849 | ||||||
| Exelon Corp. | 19,729 | 717,346 | ||||||
| Facebook, Inc., Class A (a) | 8,557 | 977,894 | ||||||
| FactSet Research Systems, Inc. | 3,998 | 645,357 | ||||||
| FedEx Corp. | 3,455 | 524,400 | ||||||
| Fidelity National Information Services, Inc. | 7,530 | 554,810 | ||||||
| Fifth Third Bancorp | 41,454 | 729,176 | ||||||
| First NBC Bank Holding Co. (a) | 9,432 | 158,363 | ||||||
| Foot Locker, Inc. | 2,498 | 137,040 | ||||||
| Ford Motor Co. | 8,053 | 101,226 | ||||||
| GATX Corp. | 3,133 | 137,758 | ||||||
| General Dynamics Corp. | 2,194 | 305,493 | ||||||
| General Electric Co. | 29,199 | 919,185 | ||||||
| General Motors Co. | 21,460 | 607,318 | ||||||
| Global Payments, Inc. | 4,945 | 352,974 | ||||||
| Great Plains Energy, Inc. | 34,440 | 1,046,976 | ||||||
| HCA Holdings, Inc. (a) | 8,625 | 664,211 | ||||||
| HFF, Inc., Class A | 4,802 | 138,682 | ||||||
| Honeywell International, Inc. | 9,515 | 1,106,785 | ||||||
| IDEXX Laboratories, Inc. (a) | 1,521 | 141,240 | ||||||
| Intel Corp. | 27,840 | 913,152 | ||||||
| Intercontinental Exchange, Inc. | 3,054 | 781,702 | ||||||
| International Paper Co. | 3,780 | 160,196 | ||||||
| Intuit, Inc. | 4,266 | 476,128 | ||||||
| Iron Mountain, Inc. REIT | 7,624 | 303,664 | ||||||
| Johnson & Johnson | 26,521 | 3,216,997 | ||||||
| JPMorgan Chase & Co. | 39,363 | 2,446,017 | ||||||
| KB Home | 7,420 | 112,858 | ||||||
| Kellogg Co. | 3,970 | 324,151 | ||||||
| KeyCorp. | 34,432 | 380,474 | ||||||
| Lincoln National Corp. | 6,752 | 261,775 | ||||||
| Linear Technology Corp. | 3,128 | 145,546 | ||||||
| Lowe’s Cos., Inc. | 22,743 | 1,800,563 | ||||||
The accompanying notes are an integral part of these financial statements.
| 26 | Semi-Annual Report |
| Description | Shares | Fair Value | ||||||
| Lazard Retirement Global Dynamic Multi Asset Portfolio (continued) | ||||||||
| Marathon Petroleum Corp. | 1,838 | $ | 69,770 | |||||
| Marsh & McLennan Cos., Inc. | 2,750 | 188,265 | ||||||
| MasterCard, Inc., Class A | 2,261 | 199,104 | ||||||
| McDonald’s Corp. | 10,522 | 1,266,217 | ||||||
| McKesson Corp. | 4,473 | 834,885 | ||||||
| Mead Johnson Nutrition Co. | 4,735 | 429,701 | ||||||
| MetLife, Inc. | 8,606 | 342,777 | ||||||
| Mettler-Toledo International, Inc. (a) | 1,523 | 555,773 | ||||||
| Microsoft Corp. | 47,702 | 2,440,911 | ||||||
| Molson Coors Brewing Co., Class B | 8,016 | 810,658 | ||||||
| Monsanto Co. | 7,617 | 787,674 | ||||||
| Motorola Solutions, Inc. | 1,698 | 112,017 | ||||||
| MSCI, Inc. | 2,243 | 172,980 | ||||||
| NIKE, Inc., Class B | 6,147 | 339,314 | ||||||
| Nordstrom, Inc. | 3,853 | 146,607 | ||||||
| Northrop Grumman Corp. | 812 | 180,491 | ||||||
| NVR, Inc. (a) | 129 | 229,664 | ||||||
| O’Reilly Automotive, Inc. (a) | 4,227 | 1,145,940 | ||||||
| Omnicom Group, Inc. | 3,468 | 282,607 | ||||||
| PayPal Holdings, Inc. (a) | 2,926 | 106,828 | ||||||
| PepsiCo, Inc. | 13,091 | 1,386,861 | ||||||
| Pfizer, Inc. | 3,619 | 127,425 | ||||||
| Phillips 66 | 8,428 | 668,678 | ||||||
| Pinnacle West Capital Corp. | 2,786 | 225,833 | ||||||
| Piper Jaffray Cos., Inc. (a) | 7,530 | 283,881 | ||||||
| Pool Corp. | 5,423 | 509,925 | ||||||
| Premier, Inc., Class A (a) | 3,184 | 104,117 | ||||||
| Primerica, Inc. | 3,381 | 193,528 | ||||||
| Public Service Enterprise Group, Inc. | 12,000 | 559,320 | ||||||
| Quintiles Transnational Holdings, Inc. (a) | 18,445 | 1,204,827 | ||||||
| Regeneron Pharmaceuticals, Inc. (a) | 289 | 100,927 | ||||||
| Regions Financial Corp. | 14,314 | 121,812 | ||||||
| Republic Services, Inc. | 4,905 | 251,676 | ||||||
| Reynolds American, Inc. | 19,387 | 1,045,541 | ||||||
| Rockwell Automation, Inc. | 6,715 | 771,016 | ||||||
| Rockwell Collins, Inc. | 3,571 | 304,035 | ||||||
| Ross Stores, Inc. | 3,965 | 224,776 | ||||||
| S&P Global, Inc. | 8,296 | 889,829 | ||||||
| Sabre Corp. | 12,101 | 324,186 | ||||||
| Sanderson Farms, Inc. | 1,542 | 133,599 | ||||||
| Schlumberger, Ltd. | 16,510 | 1,305,611 | ||||||
| Simon Property Group, Inc. REIT | 5,108 | 1,107,925 | ||||||
| Skechers USA, Inc., Class A (a) | 3,765 | 111,896 | ||||||
| Skyworks Solutions, Inc. | 1,858 | 117,574 | ||||||
| Description | Shares | Fair Value | ||||||
| Snap-on, Inc. | 3,390 | $ | 535,010 | |||||
| Spirit AeroSystems Holdings, Inc., Class A (a) | 2,438 | 104,834 | ||||||
| Starbucks Corp. | 12,831 | 732,907 | ||||||
| Steel Dynamics, Inc. | 13,626 | 333,837 | ||||||
| Target Corp. | 2,258 | 157,654 | ||||||
| Teradata Corp. (a) | 4,216 | 105,695 | ||||||
| Tesoro Corp. | 722 | 54,092 | ||||||
| Texas Instruments, Inc. | 2,421 | 151,676 | ||||||
| The Boeing Co. | 3,779 | 490,779 | ||||||
| The Charles Schwab Corp. | 18,005 | 455,707 | ||||||
| The Clorox Co. | 6,193 | 857,049 | ||||||
| The Dow Chemical Co. | 11,287 | 561,077 | ||||||
| The Estee Lauder Cos., Inc., Class A | 2,682 | 244,116 | ||||||
| The Kroger Co. | 33,929 | 1,248,248 | ||||||
| The Procter & Gamble Co. | 10,776 | 912,404 | ||||||
| The Southern Co. | 12,851 | 689,199 | ||||||
| The TJX Cos., Inc. | 9,480 | 732,140 | ||||||
| The Walt Disney Co. | 2,009 | 196,520 | ||||||
| Thermo Fisher Scientific, Inc. | 3,815 | 563,704 | ||||||
| Time Warner, Inc. | 15,764 | 1,159,285 | ||||||
| Time, Inc. | 8,505 | 139,992 | ||||||
| Tyco International PLC | 11,485 | 489,261 | ||||||
| Tyson Foods, Inc., Class A | 11,519 | 769,354 | ||||||
| United Technologies Corp. | 9,995 | 1,024,987 | ||||||
| UnitedHealth Group, Inc. | 6,950 | 981,340 | ||||||
| Universal Health Services, Inc., Class B | 2,090 | 280,269 | ||||||
| Unum Group | 25,335 | 805,400 | ||||||
| Validus Holdings, Ltd. | 1,682 | 81,728 | ||||||
| Vantiv, Inc., Class A (a) | 10,080 | 570,528 | ||||||
| Verizon Communications, Inc. | 48,951 | 2,733,424 | ||||||
| Visa, Inc., Class A | 14,511 | 1,076,281 | ||||||
| Wabash National Corp. (a) | 5,267 | 66,891 | ||||||
| WABCO Holdings, Inc. (a) | 528 | 48,349 | ||||||
| Wal-Mart Stores, Inc. | 11,063 | 807,820 | ||||||
| Waters Corp. (a) | 2,422 | 340,654 | ||||||
| WellCare Health Plans, Inc. (a) | 1,152 | 123,587 | ||||||
| Wells Fargo & Co. | 10,934 | 517,506 | ||||||
| Whirlpool Corp. | 914 | 152,309 | ||||||
| Wyndham Worldwide Corp. | 2,396 | 170,667 | ||||||
| Xcel Energy, Inc. | 10,129 | 453,577 | ||||||
| Zoetis, Inc. | 23,745 | 1,126,938 | ||||||
| 93,857,527 | ||||||||
| Total Common Stocks (Cost $157,996,065) | 164,085,639 | |||||||
The accompanying notes are an integral part of these financial statements.
| Semi-Annual Report | 27 |
| Description | Security Currency | Principal Amount (000) | Fair Value | |||||||
| Lazard Retirement Global Dynamic Multi Asset Portfolio (continued) | ||||||||||
| Corporate Bonds | 10.1% | ||||||||||
| Australia | 0.7% | ||||||||||
| Telstra Corp., Ltd., 4.000%, 11/15/17 | AUD | 1,490 | $ | 1,132,099 | ||||||
| Toyota Finance Australia, Ltd., 4.250%, 05/15/19 | AUD | 827 | 643,969 | |||||||
| 1,776,068 | ||||||||||
| Belgium | 0.6% | ||||||||||
| Anheuser-Busch InBev Finance, Inc.: | ||||||||||
| 2.375%, 01/25/18 | CAD | 1,295 | 1,016,885 | |||||||
| 2.650%, 02/01/21 | USD | 530 | 549,217 | |||||||
| 1,566,102 | ||||||||||
| Canada | 1.4% | ||||||||||
| Suncor Energy, Inc., 6.100%, 06/01/18 | USD | 640 | 692,067 | |||||||
| The Bank of Nova Scotia, 2.125%, 09/11/19 | USD | 1,580 | 1,620,950 | |||||||
| The Toronto-Dominion Bank: | ||||||||||
| 2.250%, 11/05/19 | USD | 395 | 405,342 | |||||||
| 2.621%, 12/22/21 | CAD | 875 | 709,407 | |||||||
| 3,427,766 | ||||||||||
| Denmark | 0.2% | ||||||||||
| Carlsberg Breweries A/S, 2.500%, 05/28/24 | EUR | 500 | 612,645 | |||||||
| France | 0.3% | ||||||||||
| Orange SA, 5.375%, 07/08/19 | USD | 735 | 816,090 | |||||||
| Germany | 0.7% | ||||||||||
| BMW Finance NV, 3.375%, 12/14/18 | GBP | 785 | 1,099,410 | |||||||
| Daimler Finance North America LLC, 3.875%, 09/15/21 | USD | 575 | 626,517 | |||||||
| 1,725,927 | ||||||||||
| Italy | 0.3% | ||||||||||
| Atlantia SpA, 4.375%, 09/16/25 | EUR | 480 | 691,177 | |||||||
| Mexico | 0.1% | ||||||||||
| America Movil SAB de CV, 6.450%, 12/05/22 | MXN | 7,000 | 363,130 | |||||||
| Description | Security Currency | Principal Amount (000) | Fair Value | |||||||
| Netherlands | 0.2% | ||||||||||
| Bank Nederlandse Gemeenten NV, 5.000%, 09/16/20 | NZD | 805 | $ | 619,022 | ||||||
| New Zealand | 0.1% | ||||||||||
| Fonterra Cooperative Group, Ltd., 5.500%, 02/26/24 | AUD | 300 | 253,214 | |||||||
| Norway | 0.4% | ||||||||||
| Statoil ASA, 3.700%, 03/01/24 | USD | 540 | 583,534 | |||||||
| Telenor ASA, 1.750%, 05/22/18 | USD | 480 | 483,089 | |||||||
| 1,066,623 | ||||||||||
| United Kingdom | 1.0% | ||||||||||
| Centrica PLC, 7.000%, 09/19/18 | GBP | 100 | 149,231 | |||||||
| Rolls-Royce PLC, 6.750%, 04/30/19 | GBP | 452 | 692,845 | |||||||
| Santander UK PLC, 5.125%, 04/14/21 | GBP | 620 | 970,905 | |||||||
| SSE PLC, 5.000%, 10/01/18 | GBP | 450 | 649,484 | |||||||
| 2,462,465 | ||||||||||
| United States | 4.1% | ||||||||||
| Alphabet, Inc., 3.625%, 05/19/21 | USD | 400 | 441,144 | |||||||
| Apple, Inc., 3.850%, 05/04/43 | USD | 1,010 | 1,014,782 | |||||||
| Citigroup, Inc., 3.595%, 05/04/21 (e) | AUD | 1,415 | 1,053,506 | |||||||
| General Electric Co., 5.500%, 02/01/17 | NZD | 370 | 267,617 | |||||||
| John Deere Canada Funding, Inc.: | ||||||||||
| 2.300%, 01/17/18 | CAD | 355 | 278,755 | |||||||
| 2.050%, 09/17/20 | CAD | 580 | 455,847 | |||||||
| John Deere Capital Corp., 2.300%, 09/16/19 | USD | 245 | 252,592 | |||||||
| JPMorgan Chase & Co., 4.500%, 01/24/22 | USD | 530 | 589,878 | |||||||
| Morgan Stanley, 2.500%, 01/24/19 | USD | 1,015 | 1,035,512 | |||||||
| Nestle Holdings, Inc., 2.500%, 07/10/17 | NOK | 6,660 | 806,842 | |||||||
| The Goldman Sachs Group, Inc.: | ||||||||||
| 5.200%, 12/17/19 | NZD | 1,135 | 847,193 | |||||||
| 3.625%, 01/22/23 | USD | 700 | 734,533 | |||||||
The accompanying notes are an integral part of these financial statements.
| 28 | Semi-Annual Report |
| Description | Security Currency | Principal Amount (000) | Fair Value | |||||||
| Lazard Retirement Global Dynamic Multi Asset Portfolio (continued) | ||||||||||
| The Home Depot, Inc., 2.625%, 06/01/22 |
USD | 750 | $ | 785,006 | ||||||
| Union Pacific Corp., 4.163%, 07/15/22 |
USD | 755 | 849,775 | |||||||
| Valero Energy Corp., 6.125%, 02/01/20 |
USD | 319 | 360,056 | |||||||
| Wells Fargo Canada Corp., 3.040%, 01/29/21 |
CAD | 640 | 525,331 | |||||||
| 10,298,369 | ||||||||||
| Total Corporate Bonds (Cost $26,093,729) |
25,678,598 | |||||||||
| Foreign Government Obligations | 15.0% | ||||||||||
| Australia | 1.3% | ||||||||||
| Queensland Treasury Corp., 5.500%, 06/21/21 |
AUD | 1,090 | 947,309 | |||||||
| Treasury Corp. of Victoria, 6.000%, 10/17/22 |
AUD | 1,585 | 1,463,703 | |||||||
| Western Australian Treasury Corp., 6.000%, 10/16/23 |
AUD | 855 | 790,770 | |||||||
| 3,201,782 | ||||||||||
| Bahamas | 0.6% | ||||||||||
| Commonwealth of Bahamas: | ||||||||||
| 5.750%, 01/16/24 | USD | 520 | 543,400 | |||||||
| 6.950%, 11/20/29 | USD | 835 | 945,283 | |||||||
| 1,488,683 | ||||||||||
| Bermuda | 0.7% | ||||||||||
| Government of Bermuda: | ||||||||||
| 5.603%, 07/20/20 | USD | 1,265 | 1,388,246 | |||||||
| 4.138%, 01/03/23 | USD | 300 | 310,050 | |||||||
| 1,698,296 | ||||||||||
| Canada | 4.2% | ||||||||||
| Canada Government Bond, 1.125%, 03/19/18 |
USD | 1,490 | 1,500,966 | |||||||
| City of Vancouver, 2.900%, 11/20/25 |
CAD | 415 | 340,667 | |||||||
| Province of Alberta, 4.000%, 12/01/19 | CAD | 2,470 | 2,099,352 | |||||||
| Province of British Columbia, 3.700%, 12/18/20 | CAD | 1,770 | 1,523,917 | |||||||
| Description | Security Currency | Principal Amount (000) | Fair Value | |||||||
| Province of Ontario: | ||||||||||
| 2.450%, 06/29/22 | USD | 1,695 | $ | 1,773,965 | ||||||
| 1.950%, 01/27/23 | CAD | 1,045 | 831,802 | |||||||
| Province of Quebec: | ||||||||||
| 3.500%, 07/29/20 | USD | 1,515 | 1,643,370 | |||||||
| 2.500%, 04/20/26 | USD | 775 | 797,880 | |||||||
| 10,511,919 | ||||||||||
| Chile | 0.3% | ||||||||||
| Republic of Chile, 1.625%, 01/30/25 | EUR | 730 | 858,724 | |||||||
| Colombia | 0.3% | ||||||||||
| Republic of Colombia, 2.625%, 03/15/23 | USD | 850 | 822,375 | |||||||
| Ireland | 0.6% | ||||||||||
| Irish Treasury, 3.400%, 03/18/24 | EUR | 1,100 | 1,506,203 | |||||||
| Mexico | 1.2% | ||||||||||
| Mexican Bonos: | ||||||||||
| 5.000%, 12/11/19 | MXN | 26,860 | 1,457,696 | |||||||
| 6.500%, 06/09/22 | MXN | 14,380 | 820,372 | |||||||
| United Mexican States, 6.750%, 02/06/24 | GBP | 570 | 904,883 | |||||||
| 3,182,951 | ||||||||||
| New Zealand | 0.9% | ||||||||||
| New Zealand Government Bonds: | ||||||||||
| 3.000%, 04/15/20 | NZD | 1,895 | 1,399,545 | |||||||
| 6.000%, 05/15/21 | NZD | 1,190 | 972,337 | |||||||
| 2,371,882 | ||||||||||
| Norway | 1.0% | ||||||||||
| Oslo Kommune: | ||||||||||
| 4.900%, 11/04/19 | NOK | 2,000 | 265,471 | |||||||
| 3.550%, 02/12/21 | NOK | 4,000 | 518,214 | |||||||
| 3.600%, 12/06/22 | NOK | 3,000 | 401,530 | |||||||
| 2.450%, 05/24/23 | NOK | 2,000 | 249,755 | |||||||
| 3.650%, 11/08/23 | NOK | 4,000 | 539,674 | |||||||
| 2.350%, 09/04/24 | NOK | 4,000 | 493,646 | |||||||
| 2,468,290 | ||||||||||
| Panama | 0.4% | ||||||||||
| Republic of Panama, 4.000%, 09/22/24 | USD | 1,000 | 1,066,250 | |||||||
The accompanying notes are an integral part of these financial statements.
| Semi-Annual Report | 29 |
| Description | Security Currency | Principal Amount (000) | Fair Value | |||||||
| Lazard Retirement Global Dynamic Multi Asset Portfolio (continued) | ||||||||||
| Poland | 1.3% | ||||||||||
| Poland Government Bond, 1.750%, 01/25/21 (e) | PLN | 9,750 | $ | 2,434,374 | ||||||
| Republic of Poland, 3.000%, 03/17/23 | USD | 884 | 899,028 | |||||||
| 3,333,402 | ||||||||||
| Singapore | 0.6% | ||||||||||
| Singapore Government Bond, 3.000%, 09/01/24 | SGD | 1,980 | 1,601,373 | |||||||
| Slovakia | 0.1% | ||||||||||
| Slovak Republic, 4.375%, 05/21/22 | USD | 200 | 226,818 | |||||||
| Spain | 0.2% | ||||||||||
| Spain Government Bond, 1.600%, 04/30/25 | EUR | 360 | 417,437 | |||||||
| Sweden | 0.7% | ||||||||||
| Kommuninvest I Sverige AB, 1.500%, 04/23/19 (d) | USD | 500 | 507,097 | |||||||
| Svensk Exportkredit AB, 1.875%, 12/21/18 | GBP | 955 | 1,307,059 | |||||||
| 1,814,156 | ||||||||||
| United Kingdom | 0.6% | ||||||||||
| United Kingdom Treasury: | ||||||||||
| 1.750%, 07/22/19 | GBP | 530 | 738,597 | |||||||
| 2.000%, 07/22/20 | GBP | 480 | 682,030 | |||||||
| 1,420,627 | ||||||||||
| Total Foreign Government Obligations (Cost $38,443,239) | 37,991,168 | |||||||||
| Quasi Government Bonds | 2.8% | ||||||||||
| Canada | 1.2% | ||||||||||
| Canada Housing Trust No. 1, 1.250%, 12/15/20 | CAD | 2,045 | 1,603,139 | |||||||
| Hydro-Quebec: | ||||||||||
| 1.050%, 12/01/19 (e) | CAD | 1,500 | 1,158,760 | |||||||
| 9.625%, 07/15/22 | CAD | 368 | 418,593 | |||||||
| 3,180,492 | ||||||||||
| Description | Security Currency | Principal Amount (000) | Fair Value | |||||||
| Chile | 0.4% | ||||||||||
| Corp. Nacional del Cobre de Chile, 4.500%, 08/13/23 | USD | 800 | $ | 848,153 | ||||||
| Germany | 0.6% | ||||||||||
| Deutsche Bahn Finance BV, 3.375%, 09/01/16 | NOK | 3,630 | 435,161 | |||||||
| KFW: | ||||||||||
| 2.875%, 10/12/16 | NOK | 1,210 | 145,305 | |||||||
| 1.125%, 12/23/19 | GBP | 485 | 657,043 | |||||||
| Landeskreditbank Baden-Wuerttemberg Foerderbank, 3.000%, 05/22/17 | NOK | 1,180 | 143,130 | |||||||
| 1,380,639 | ||||||||||
| Mexico | 0.1% | ||||||||||
| Nacional Financiera SNC, 3.375%, 11/05/20 | USD | 300 | 306,000 | |||||||
| Singapore | 0.5% | ||||||||||
| Temasek Financial I, Ltd., 4.300%, 10/25/19 | USD | 1,215 | 1,330,219 | |||||||
| Total Quasi Government Bonds (Cost $7,178,894) | 7,045,503 | |||||||||
| Supranationals | 1.6% | ||||||||||
| African Development Bank, 2.375%, 09/23/21 | USD | 740 | 777,164 | |||||||
| Asian Development Bank: | ||||||||||
| 1.875%, 04/12/19 | USD | 1,125 | 1,154,405 | |||||||
| 2.125%, 03/19/25 | USD | 680 | 705,794 | |||||||
| Corporacion Andina de Fomento, 4.375%, 06/15/22 | USD | 985 | 1,099,644 | |||||||
| Inter-American Development Bank, 6.000%, 12/15/17 | NZD | 565 | 422,570 | |||||||
| Total Supranationals (Cost $4,088,953) | 4,159,577 | |||||||||
The accompanying notes are an integral part of these financial statements.
| 30 | Semi-Annual Report |
| Description | Security Currency | Principal Amount (000) | Fair Value | |||||||
| Lazard Retirement Global Dynamic Multi Asset Portfolio (continued) | ||||||||||
| US Municipal Bonds | 0.5% | ||||||||||
| Georgia | 0.4% | ||||||||||
| Georgia State: | ||||||||||
| Build America Bond Series H, 5.014%, 11/01/27 | USD | 420 | $ | 527,776 | ||||||
| Series B, 2.380%, 02/01/27 | USD | 350 | 358,386 | |||||||
| 886,162 | ||||||||||
| Pennsylvania | 0.0% | ||||||||||
| Pennsylvania State Build America Bond Third Series B, 5.850%, 07/15/30 | USD | 50 | 56,978 | |||||||
| Texas | 0.0% | ||||||||||
| Texas State Build America Bond Series A, 4.123%, 04/01/25 | USD | 100 | 117,890 | |||||||
| Wisconsin | 0.1% | ||||||||||
| Wisconsin State Build America Bond Series D, 5.400%, 05/01/28 | USD | 175 | 201,789 | |||||||
| Total US Municipal Bonds (Cost $1,189,406) | 1,262,819 | |||||||||
| US Treasury Securities | 1.5% | ||||||||||
| US Treasury Notes: | ||||||||||
| 2.125%, 05/15/25 | USD | 2,880 | 3,043,463 | |||||||
| 1.625%, 05/15/26 | USD | 840 | 850,762 | |||||||
| Total US Treasury Securities (Cost $3,780,200) | 3,894,225 | |||||||||
| Description | Shares | Fair Value | ||||||
| Short-Term Investment | 3.6% | ||||||||
| State Street Institutional Treasury Money Market Fund, Premier Class, 0.14% (7 day yield) (Cost $9,114,789) |
9,114,789 | $ | 9,114,789 | |||||
| Total Investments | 99.7% (Cost $247,885,275) (b), (f) |
$ | 253,232,318 | ||||||
| Cash and Other Assets in Excess of Liabilities | 0.3% | 646,622 | |||||||
| Net Assets | 100.0% | $ | 253,878,940 | ||||||
The accompanying notes are an integral part of these financial statements.
| Semi-Annual Report | 31 |
Lazard Retirement Global Dynamic Multi Asset Portfolio (continued)
Forward Currency Contracts open at June 30, 2016:
| Currency Purchased | Quantity | Currency Sold |
Quantity | Counterparty | Settlement Date |
Unrealized Appreciation | Unrealized Depreciation | |||||||||||||||||||||
| AUD | 167,627 | USD | 123,498 | HSB | 08/18/16 | $ | 1,318 | $ | — | |||||||||||||||||||
| AUD | 303,500 | USD | 222,019 | HSB | 08/18/16 | 3,968 | — | |||||||||||||||||||||
| CAD | 556,136 | USD | 435,000 | RBC | 08/18/16 | — | 4,479 | |||||||||||||||||||||
| CHF | 682,838 | USD | 707,080 | HSB | 08/18/16 | — | 5,962 | |||||||||||||||||||||
| CZK | 1,549,311 | USD | 65,585 | CIT | 08/18/16 | — | 1,975 | |||||||||||||||||||||
| DKK | 4,191,239 | USD | 642,596 | CIT | 08/18/16 | — | 16,240 | |||||||||||||||||||||
| EUR | 6,584,615 | USD | 7,519,663 | CIT | 08/18/16 | — | 200,883 | |||||||||||||||||||||
| EUR | 444,435 | USD | 499,900 | HSB | 08/18/16 | — | 5,912 | |||||||||||||||||||||
| EUR | 6,921,106 | USD | 7,903,661 | HSB | 08/18/16 | — | 210,872 | |||||||||||||||||||||
| EUR | 2,686,666 | USD | 3,060,099 | HSB | 09/02/16 | — | 72,366 | |||||||||||||||||||||
| EUR | 471,483 | USD | 537,000 | SCB | 08/18/16 | — | 12,948 | |||||||||||||||||||||
| GBP | 379,483 | USD | 549,207 | HSB | 08/18/16 | — | 43,825 | |||||||||||||||||||||
| GBP | 285,237 | USD | 412,618 | SSB | 09/02/16 | — | 32,700 | |||||||||||||||||||||
| JPY | 89,796,080 | USD | 880,000 | CIT | 08/18/16 | — | 9,261 | |||||||||||||||||||||
| JPY | 98,095,032 | USD | 963,000 | CIT | 08/18/16 | — | 11,787 | |||||||||||||||||||||
| JPY | 1,145,800,056 | USD | 10,515,207 | CIT | 08/18/16 | 595,444 | — | |||||||||||||||||||||
| JPY | 36,129,034 | USD | 327,800 | HSB | 08/18/16 | 22,538 | — | |||||||||||||||||||||
| JPY | 419,425,467 | USD | 3,849,388 | HSB | 08/18/16 | 217,718 | — | |||||||||||||||||||||
| JPY | 44,798,314 | USD | 418,000 | SCB | 08/18/16 | 16,403 | — | |||||||||||||||||||||
| JPY | 77,444,595 | USD | 723,006 | SSB | 09/02/16 | 28,313 | — | |||||||||||||||||||||
| KRW | 304,108,920 | USD | 260,100 | CIT | 09/21/16 | 3,711 | — | |||||||||||||||||||||
| KRW | 858,401,400 | USD | 735,247 | CIT | 09/21/16 | 9,406 | — | |||||||||||||||||||||
| MXN | 3,356,421 | USD | 179,000 | HSB | 08/18/16 | 3,815 | — | |||||||||||||||||||||
| MXN | 3,478,387 | USD | 190,384 | HSB | 08/18/16 | — | 925 | |||||||||||||||||||||
| NOK | 1,967,756 | USD | 236,583 | HSB | 08/18/16 | — | 1,471 | |||||||||||||||||||||
| NOK | 1,976,704 | USD | 241,664 | HSB | 08/18/16 | — | 5,483 | |||||||||||||||||||||
| SEK | 4,235,193 | USD | 518,676 | CIT | 08/18/16 | — | 17,157 | |||||||||||||||||||||
| SEK | 8,948,969 | USD | 1,097,332 | HSB | 08/18/16 | — | 37,623 | |||||||||||||||||||||
| USD | 2,481,340 | AUD | 2,508,202 | CAN | 08/18/16 | — | 26,862 | |||||||||||||||||||||
| USD | 3,062,351 | NZD | 3,205,278 | CAN | 08/18/16 | — | 142,927 | |||||||||||||||||||||
| USD | 53,017 | AUD | 54,517 | CIT | 08/18/16 | — | 1,500 | |||||||||||||||||||||
| USD | 133,973 | GBP | 123,950 | CIT | 08/18/16 | 10,023 | — | |||||||||||||||||||||
| USD | 173,122 | AUD | 175,051 | CIT | 08/18/16 | — | 1,929 | |||||||||||||||||||||
| USD | 189,869 | GBP | 172,001 | CIT | 08/18/16 | 17,868 | — | |||||||||||||||||||||
| USD | 309,000 | GBP | 291,718 | CIT | 08/18/16 | 17,282 | — | |||||||||||||||||||||
| USD | 401,309 | NZD | 419,780 | CIT | 08/18/16 | — | 18,471 | |||||||||||||||||||||
| USD | 836,000 | GBP | 827,939 | CIT | 08/18/16 | 8,061 | — | |||||||||||||||||||||
| USD | 1,040,000 | GBP | 1,008,743 | CIT | 08/18/16 | 31,257 | — | |||||||||||||||||||||
| USD | 1,981,112 | CAD | 1,969,901 | CIT | 08/18/16 | 11,210 | — | |||||||||||||||||||||
| USD | 117,380 | MXN | 117,280 | HSB | 08/18/16 | 100 | — | |||||||||||||||||||||
| USD | 137,015 | PLN | 138,119 | HSB | 08/18/16 | — | 1,104 | |||||||||||||||||||||
| USD | 275,000 | NZD | 281,111 | HSB | 08/18/16 | — | 6,111 | |||||||||||||||||||||
| USD | 402,794 | NOK | 400,514 | HSB | 08/18/16 | 2,280 | — | |||||||||||||||||||||
| USD | 418,473 | PLN | 410,639 | HSB | 08/18/16 | 7,834 | — | |||||||||||||||||||||
The accompanying notes are an integral part of these financial statements.
| 32 | Semi-Annual Report |
Lazard Retirement Global Dynamic Multi Asset Portfolio (concluded)
| Currency Purchased | Quantity | Currency Sold |
Quantity | Counterparty | Settlement Date |
Unrealized Appreciation | Unrealized Depreciation | |||||||||||||||||||||
| USD | 512,000 | SEK | 519,364 | HSB | 08/18/16 | $ | — | $ | 7,364 | |||||||||||||||||||
| USD | 515,462 | NOK | 499,721 | HSB | 08/18/16 | 15,741 | — | |||||||||||||||||||||
| USD | 910,000 | EUR | 920,067 | HSB | 08/18/16 | — | 10,067 | |||||||||||||||||||||
| USD | 1,744,652 | MXN | 1,736,173 | HSB | 08/18/16 | 8,479 | — | |||||||||||||||||||||
| USD | 1,823,725 | PLN | 1,794,181 | HSB | 08/18/16 | 29,544 | — | |||||||||||||||||||||
| USD | 2,089,355 | AUD | 2,113,968 | HSB | 08/18/16 | — | 24,613 | |||||||||||||||||||||
| USD | 2,095,435 | CAD | 2,083,854 | HSB | 08/18/16 | 11,582 | — | |||||||||||||||||||||
| USD | 3,196,130 | GBP | 2,941,088 | HSB | 08/18/16 | 255,041 | — | |||||||||||||||||||||
| USD | 3,640,484 | NOK | 3,536,738 | HSB | 08/18/16 | 103,746 | — | |||||||||||||||||||||
| USD | 621,605 | JPY | 645,997 | HSB | 09/02/16 | — | 24,392 | |||||||||||||||||||||
| USD | 641,951 | AUD | 649,840 | HSB | 09/02/16 | — | 7,889 | |||||||||||||||||||||
| USD | 2,855,455 | CAD | 2,839,267 | HSB | 09/02/16 | 16,188 | — | |||||||||||||||||||||
| USD | 206,202 | MXN | 205,254 | JPM | 08/18/16 | 948 | — | |||||||||||||||||||||
| USD | 258,406 | MXN | 262,104 | JPM | 08/18/16 | — | 3,698 | |||||||||||||||||||||
| USD | 322,132 | GBP | 296,410 | JPM | 08/18/16 | 25,721 | — | |||||||||||||||||||||
| USD | 5,351,183 | CAD | 5,321,300 | RBC | 08/18/16 | 29,883 | — | |||||||||||||||||||||
| USD | 277,136 | SGD | 282,618 | SCB | 08/18/16 | — | 5,481 | |||||||||||||||||||||
| USD | 1,258,960 | SGD | 1,277,415 | SCB | 08/18/16 | — | 18,455 | |||||||||||||||||||||
| USD | 321,415 | AUD | 325,328 | SSB | 09/02/16 | — | 3,913 | |||||||||||||||||||||
| USD | 354,438 | CAD | 352,399 | SSB | 09/02/16 | 2,039 | — | |||||||||||||||||||||
| USD | 1,638,949 | HKD | 1,640,246 | SSB | 09/02/16 | — | 1,297 | |||||||||||||||||||||
| Total gross unrealized appreciation/depreciation on Forward Currency Contracts | $ | 1,507,461 | $ | 997,942 | ||||||||||||||||||||||||
The accompanying notes are an integral part of these financial statements.
| Semi-Annual Report | 33 |
Lazard Retirement Series, Inc. Notes to Portfolios of Investments June 30, 2016 (unaudited)
| (a) | Non-income producing security. |
| (b) | For federal income tax purposes, the aggregate cost, aggregate gross unrealized appreciation, aggregate gross unrealized depreciation and the net unrealized appreciation (depreciation) were as follows: |
| Portfolio | Aggregate Cost | Aggregate
Gross Unrealized Appreciation | Aggregate
Gross Unrealized Depreciation | Net
Unrealized Appreciation (Depreciation) | |||||||||||||
| US Strategic Equity | $ | 9,470,065 | $ | 740,621 | $ | 348,678 | $ | 391,943 | |||||||||
| US Small-Mid Cap Equity | 53,436,003 | 4,835,302 | 2,131,720 | 2,703,582 | |||||||||||||
| International Equity | 580,756,995 | 106,830,006 | 37,633,457 | 69,196,549 | |||||||||||||
| Emerging Markets Equity | 1,110,363,468 | 124,742,033 | 206,182,841 | (81,440,808 | ) | ||||||||||||
| Global Dynamic Multi Asset | 247,885,275 | 13,741,699 | 8,394,656 | 5,347,043 | |||||||||||||
| (c) | Security valued using Level 2 inputs, based on reference to a similar security which was trading on an active market, under GAAP hierarchy — see Note 8. |
| (d) | Pursuant to Rule 144A under the Securities Act of 1933, these securities may only be traded among “qualified institutional buyers.” At June 30, 2016, the percentage of net assets for each Portfolio was as follows: |
| Portfolio | Percentage
of Net Assets | |||
| Emerging Markets Equity | 0.3 | % | ||
| Global Dynamic Multi Asset | 0.2 | |||
| (e) | Variable and floating rate securities are securities which interest rate changes are based on changes in a designated base rate. The rates shown are those in effect on June 30, 2016. |
| (f) | The Portfolio, at all times, maintains portfolio securities in sufficient amount to cover its obligations related to investments in forward currency contracts. |
Security Abbreviations:
| ADR | — | American Depositary Receipt | |||||
| GDR | — | Global Depositary Receipt | |||||
| PJSC | — | Public Joint Stock Company | |||||
| REIT | — | Real Estate Investment Trust | |||||
| SDR | — | Swedish Depositary Receipt | |||||
| Currency Abbreviations: | |||||||
| AUD | — | Australian Dollar | KRW | — | South Korean Won | ||
| CAD | — | Canadian Dollar | MXN | — | Mexican New Peso | ||
| CHF | — | Swiss Franc | NOK | — | Norwegian Krone | ||
| CZK | — | Czech Koruna | NZD | — | New Zealand Dollar | ||
| DKK | — | Danish Krone | PLN | — | Polish Zloty | ||
| EUR | — | Euro | SEK | — | Swedish Krone | ||
| GBP | — | British Pound Sterling | SGD | — | Singapore Dollar | ||
| HKD | — | Hong Kong Dollar | USD | — | United States Dollar | ||
| JPY | — | Japanese Yen | |||||
| Counterparty Abbreviations: | |||||||
| CAN | — | Canadian Imperial Bank of Commerce | RBC | — | Royal Bank of Canada | ||
| CIT | — | Citibank NA | SCB | — | Standard Chartered Bank | ||
| HSB | — | HSBC Bank USA NA | SSB | — | State Street Bank and Trust Co. | ||
| JPM | — | JPMorgan Chase Bank NA | |||||
The accompanying notes are an integral part of these financial statements.
| 34 | Semi-Annual Report |
Portfolio holdings by industry (as a percentage of net assets), for those Portfolios previously presented by country:
| Lazard | Lazard | Lazard | |||||||||||
| Retirement | Retirement | Retirement Global | |||||||||||
| International | Emerging | Dynamic | |||||||||||
| Equity | Markets Equity | Multi Asset | |||||||||||
| Industry* | Portfolio | Portfolio | Portfolio | ||||||||||
| Aerospace & Defense | 0.9 | % | — | % | 1.8 | % | |||||||
| Air Freight & Logistics | — | — | 0.2 | ||||||||||
| Airlines | 0.8 | — | 0.5 | ||||||||||
| Auto Components | 1.8 | 1.6 | 0.5 | ||||||||||
| Automobiles | 1.5 | 3.7 | 1.4 | ||||||||||
| Banks | 5.7 | 24.2 | 6.7 | ||||||||||
| Beverages | 4.5 | 1.7 | 3.1 | ||||||||||
| Biotechnology | 2.8 | — | 1.9 | ||||||||||
| Building Products | 2.1 | — | 0.4 | ||||||||||
| Capital Markets | 0.7 | — | 2.1 | ||||||||||
| Chemicals | — | 0.4 | 1.3 | ||||||||||
| Commercial Services & Suppliers | — | — | 0.5 | ||||||||||
| Communications Equipment | — | — | 0.5 | ||||||||||
| Construction & Engineering | 1.9 | — | 0.1 | ||||||||||
| Construction Materials | 1.0 | 1.6 | 0.1 | ||||||||||
| Consumer Finance | 0.8 | — | — | ||||||||||
| Containers & Packaging | — | — | 0.5 | ||||||||||
| Distributors | — | 0.8 | 0.2 | ||||||||||
| Diversified Financial Services | — | — | 2.0 | ||||||||||
| Diversified Telecommunication Services | 3.2 | 3.1 | 4.2 | ||||||||||
| Electric Utilities | 1.1 | — | 3.0 | ||||||||||
| Electrical Equipment | — | 0.5 | 0.8 | ||||||||||
| Electronic Equipment, Instruments & Components | — | 2.0 | 0.6 | ||||||||||
| Energy Equipment & Services | — | — | 0.7 | ||||||||||
| Food & Staples Retailing | 2.7 | 2.6 | 1.8 | ||||||||||
| Food Products | — | — | 1.7 | ||||||||||
| Gas Utilities | — | — | 0.1 | ||||||||||
| Health Care Equipment & Supplies | — | — | 0.8 | ||||||||||
| Health Care Providers & Services | — | 0.2 | 1.6 | ||||||||||
| Hotels, Restaurants & Leisure | — | 0.3 | 1.8 | ||||||||||
| Household Durables | 1.7 | 1.3 | 0.5 | ||||||||||
| Household Products | — | 1.0 | 0.9 | ||||||||||
| Independent Power and Renewable Electricity Producers | — | — | 0.7 | ||||||||||
| Industrial Conglomerates | 0.5 | 1.4 | 1.2 | ||||||||||
| Insurance | 7.4 | 3.5 | 2.9 | ||||||||||
| Internet & Catalog Retail | — | — | 0.1 | ||||||||||
| Internet Software & Services | — | 5.9 | 1.4 | ||||||||||
| IT Services | 1.9 | 6.3 | 2.1 | ||||||||||
| Leisure Products | — | — | 0.1 | ||||||||||
| Life Sciences Tools & Services | — | — | 1.0 | ||||||||||
| Machinery | 2.1 | 0.7 | 1.2 | ||||||||||
| Media | 6.4 | — | 2.4 | ||||||||||
| Metals & Mining | 1.5 | 1.6 | 1.0 | ||||||||||
The accompanying notes are an integral part of these financial statements.
| Semi-Annual Report | 35 |
| Lazard | Lazard | Lazard | |||||||||||
| Retirement | Retirement | Retirement Global | |||||||||||
| International | Emerging | Dynamic | |||||||||||
| Equity | Markets Equity | Multi Asset | |||||||||||
| Industry* | Portfolio | Portfolio | Portfolio | ||||||||||
| Multiline Retail | 2.2 | % | 0.9 | % | 0.6 | % | |||||||
| Multi-Utilities | — | — | 0.8 | ||||||||||
| Oil, Gas & Consumable Fuels | 6.9 | 8.4 | 3.2 | ||||||||||
| Personal Products | 1.5 | 0.3 | 0.5 | ||||||||||
| Pharmaceuticals | 6.5 | — | 3.4 | ||||||||||
| Real Estate Investment Trusts (REITs) | — | — | 1.2 | ||||||||||
| Real Estate Management & Development | 3.0 | — | 2.0 | ||||||||||
| Road & Rail | — | 0.8 | 1.1 | ||||||||||
| Semiconductors & Semiconductor Equipment | 2.0 | 5.9 | 1.1 | ||||||||||
| Software | — | — | 1.6 | ||||||||||
| Specialty Retail | 2.9 | 0.1 | 2.3 | ||||||||||
| Technology Hardware, Storage & Peripherals | — | 3.4 | 1.0 | ||||||||||
| Textiles, Apparel & Luxury Goods | — | — | 0.2 | ||||||||||
| Thrifts & Mortgage Finance | — | — | 0.1 | ||||||||||
| Tobacco | 4.6 | 1.5 | 0.9 | ||||||||||
| Trading Companies & Distributors | 2.6 | — | 0.2 | ||||||||||
| Transportation Infrastructure | — | 1.6 | 0.3 | ||||||||||
| Wireless Telecommunication Services | 5.3 | 8.4 | 0.6 | ||||||||||
| Subtotal | 90.5 | 95.7 | 77.5 | ||||||||||
| Foreign Government Obligations | — | — | 15.0 | ||||||||||
| Supranationals | — | — | 1.6 | ||||||||||
| US Municipal Bonds | — | — | 0.5 | ||||||||||
| US Treasury Securities | — | — | 1.5 | ||||||||||
| Short-Term Investments | 5.5 | 4.1 | 3.6 | ||||||||||
| Total Investments | 96.0 | % | 99.8 | % | 99.7 | % | |||||||
| * | Industry classifications may be different than those used for compliance monitoring purposes. |
The accompanying notes are an integral part of these financial statements.
| 36 | Semi-Annual Report |
[This page intentionally left blank]
| Semi-Annual Report | 37 |
Lazard Retirement Series, Inc. Statements of Assets and Liabilities (unaudited)
| Lazard | Lazard | ||||||||
| Retirement | Retirement | ||||||||
| US Strategic | US Small-Mid Cap | ||||||||
| June 30, 2016 | Equity Portfolio | Equity Portfolio | |||||||
| ASSETS | |||||||||
| Investments in securities, at fair value | $ | 9,862,008 | $ | 56,139,585 | |||||
| Cash | — | — | |||||||
| Foreign currency, at fair value | — | — | |||||||
| Receivables for: | |||||||||
| Dividends and interest | 6,690 | 36,139 | |||||||
| Capital stock sold | 11,446 | 91,554 | |||||||
| Investments sold | 30,240 | 26,094 | |||||||
| Amount due from Investment Manager (Note 3) | 5,450 | — | |||||||
| Gross unrealized appreciation on forward currency contracts | — | — | |||||||
| Total assets | 9,915,834 | 56,293,372 | |||||||
| LIABILITIES | |||||||||
| Foreign currency due to custodian | — | — | |||||||
| Payables for: | |||||||||
| Management fees | — | 30,999 | |||||||
| Accrued distribution fees | 2,055 | 11,604 | |||||||
| Accrued shareholders’ reports | 7,525 | 17,430 | |||||||
| Accrued custodian fees | 9,339 | 9,343 | |||||||
| Accrued administration fees | 4,258 | 8,798 | |||||||
| Accrued professional services | 19,767 | 20,399 | |||||||
| Capital stock redeemed | 2,537 | 33,791 | |||||||
| Investments purchased | 6,466 | 272,182 | |||||||
| Gross unrealized depreciation on forward currency contracts | — | — | |||||||
| Other accrued expenses and payables | 1,796 | 1,668 | |||||||
| Total liabilities | 53,743 | 406,214 | |||||||
| Net assets | $ | 9,862,091 | $ | 55,887,158 | |||||
| NET ASSETS | |||||||||
| Paid in capital | $ | 9,811,328 | $ | 50,787,023 | |||||
| Undistributed (distributions in excess of) net investment income (loss) | 53,314 | (31,554 | ) | ||||||
| Accumulated net realized gain (loss) | (394,494 | ) | 2,428,107 | ||||||
| Net unrealized appreciation (depreciation) on: | |||||||||
| Investments | 391,943 | 2,703,582 | |||||||
| Foreign currency translations and forward currency contracts | — | — | |||||||
| Net assets | $ | 9,862,091 | $ | 55,887,158 | |||||
| Service Shares | |||||||||
| Net assets | $ | 9,862,091 | $ | 55,887,158 | |||||
| Shares of capital stock outstanding* | 921,878 | 7,568,069 | |||||||
| Net asset value, offering and redemption price per share | $ | 10.70 | $ | 7.38 | |||||
| Investor Shares | |||||||||
| Net assets | — | — | |||||||
| Shares of capital stock outstanding* | — | — | |||||||
| Net asset value, offering and redemption price per share | — | — | |||||||
| Cost of investments in securities | $ | 9,470,065 | $ | 53,436,003 | |||||
| Cost of foreign currency | — | — | |||||||
| * | $0.001 par value, 2,450,000,000 shares authorized for the Portfolios in total. |
The accompanying notes are an integral part of these financial statements.
| 38 | Semi-Annual Report |
| Lazard | Lazard | Lazard | ||||||||||
| Retirement | Retirement | Retirement | ||||||||||
| International | Emerging Markets | Global Dynamic | ||||||||||
| Equity Portfolio | Equity Portfolio | Multi Asset Portfolio | ||||||||||
| $ | 649,953,544 | $ | 1,028,922,660 | $ | 253,232,318 | |||||||
| — | — | 21,500 | ||||||||||
| 1,727,951 | 250,300 | — | ||||||||||
| 2,523,215 | 5,546,214 | 1,049,494 | ||||||||||
| 18,608,603 | 4,014,512 | 751,428 | ||||||||||
| 5,675,952 | 128,611 | 364,496 | ||||||||||
| — | — | — | ||||||||||
| — | — | 1,507,461 | ||||||||||
| 678,489,265 | 1,038,862,297 | 256,926,697 | ||||||||||
| — | — | 17,844 | ||||||||||
| 405,621 | 821,590 | 130,558 | ||||||||||
| 137,057 | 169,976 | 50,855 | ||||||||||
| 39,532 | 113,259 | 16,953 | ||||||||||
| 31,157 | 104,317 | 32,080 | ||||||||||
| 29,073 | 39,075 | 15,250 | ||||||||||
| 53,599 | 27,454 | 25,506 | ||||||||||
| 125,829 | 6,613,039 | 80,237 | ||||||||||
| 813,991 | 25,913 | 1,680,025 | ||||||||||
| — | — | 997,942 | ||||||||||
| 62,327 | 134,485 | 507 | ||||||||||
| 1,698,186 | 8,049,108 | 3,047,757 | ||||||||||
| $ | 676,791,079 | $ | 1,030,813,189 | $ | 253,878,940 | |||||||
| $ | 612,066,569 | $ | 1,172,912,330 | $ | 250,064,798 | |||||||
| 8,831,941 | 12,871,658 | 323,807 | ||||||||||
| (13,299,411 | ) | (73,412,492 | ) | (2,366,019 | ) | |||||||
| 69,196,549 | (81,576,056 | ) | 5,347,043 | |||||||||
| (4,569 | ) | 17,749 | 509,311 | |||||||||
| $ | 676,791,079 | $ | 1,030,813,189 | $ | 253,878,940 | |||||||
| $ | 676,791,079 | $ | 854,742,634 | $ | 253,878,940 | |||||||
| 56,552,625 | 47,644,057 | 21,507,531 | ||||||||||
| $ | 11.97 | $ | 17.94 | $ | 11.80 | |||||||
| — | $ | 176,070,555 | — | |||||||||
| — | 9,918,542 | — | ||||||||||
| — | $ | 17.75 | — | |||||||||
| $ | 580,756,995 | $ | 1,110,363,468 | $ | 247,885,275 | |||||||
| $ | 1,723,832 | $ | 250,385 | — | ||||||||
| Semi-Annual Report | 39 |
Lazard Retirement Series, Inc. Statements of Operations (unaudited)
| Lazard | Lazard | ||||||||
| Retirement | Retirement | ||||||||
| US Strategic | US Small-Mid Cap | ||||||||
| For the Six Months Ended June 30, 2016 | Equity Portfolio | Equity Portfolio | |||||||
| Investment Income (Loss) | |||||||||
| Income | |||||||||
| Dividends | $ | 94,802 | $ | 314,384 | |||||
| Interest | — | — | |||||||
| Total investment income* | 94,802 | 314,384 | |||||||
| Expenses | |||||||||
| Management fees (Note 3) | 36,511 | 207,563 | |||||||
| Distribution fees (Service Shares) | 13,040 | 69,188 | |||||||
| Custodian fees | 24,192 | 29,061 | |||||||
| Administration fees | 22,261 | 26,727 | |||||||
| Professional services | 17,821 | 21,060 | |||||||
| Shareholders’ reports | 6,424 | 9,440 | |||||||
| Directors’ fees and expenses | 2,700 | 3,586 | |||||||
| Shareholders’ services | 6,394 | 6,899 | |||||||
| Other | 1,360 | 2,023 | |||||||
| Total gross expenses | 130,703 | 375,547 | |||||||
| Management fees waived and expenses reimbursed | (69,169 | ) | (29,609 | ) | |||||
| Administration fees waived | (9,375 | ) | — | ||||||
| Total net expenses | 52,159 | 345,938 | |||||||
| Net investment income (loss) | 42,643 | (31,554 | ) | ||||||
| Net Realized and Unrealized Gain (Loss) on Investments, Foreign Currency Transactions and Forward Currency Contracts | |||||||||
| Net realized gain (loss) on: | |||||||||
| Investments | (487,981 | ) | (493,553 | ) | |||||
| Foreign currency transactions and forward currency contracts | — | — | |||||||
| Total net realized gain (loss) on investments, foreign currency transactions and forward currency contracts | (487,981 | ) | (493,553 | ) | |||||
| Net change in unrealized appreciation (depreciation) on: | |||||||||
| Investments** | 486,923 | 398,494 | |||||||
| Foreign currency translations and forward currency contracts | — | — | |||||||
| Total net change in unrealized appreciation (depreciation) on investments, foreign currency translations and forward currency contracts | 486,923 | 398,494 | |||||||
| Net realized and unrealized gain (loss) on investments, foreign currency transactions and forward currency contracts | (1,058 | ) | (95,059 | ) | |||||
| Net increase (decrease) in net assets resulting from operations | $ | 41,585 | $ | (126,613 | ) | ||||
| * Net of foreign withholding taxes of | $ | — | $ | 1,281 | |||||
| ** Includes net change in unrealized appreciation (depreciation) of foreign capital gains taxes of | $ | — | $ | — | |||||
The accompanying notes are an integral part of these financial statements.
| 40 | Semi-Annual Report |
| Lazard | Lazard | Lazard | ||||||||||
| Retirement | Retirement | Retirement | ||||||||||
| International | Emerging Markets | Global Dynamic | ||||||||||
| Equity Portfolio | Equity Portfolio | Multi Asset Portfolio | ||||||||||
| $ | 12,101,860 | $ | 16,624,748 | $ | 2,141,269 | |||||||
| — | — | 799,431 | ||||||||||
| 12,101,860 | 16,624,748 | 2,940,700 | ||||||||||
| 2,445,098 | 4,672,299 | 986,818 | ||||||||||
| 815,033 | 969,373 | 290,441 | ||||||||||
| 83,865 | 345,161 | 89,629 | ||||||||||
| 86,395 | 114,510 | 44,427 | ||||||||||
| 89,241 | 82,950 | 35,931 | ||||||||||
| 40,563 | 82,704 | 18,286 | ||||||||||
| 15,152 | 19,848 | 6,719 | ||||||||||
| 8,628 | 13,596 | 7,919 | ||||||||||
| 9,534 | 13,209 | 3,999 | ||||||||||
| 3,593,509 | 6,313,650 | 1,484,169 | ||||||||||
| (7,302 | ) | — | (264,316 | ) | ||||||||
| — | — | — | ||||||||||
| 3,586,207 | 6,313,650 | 1,219,853 | ||||||||||
| 8,515,653 | 10,311,098 | 1,720,847 | ||||||||||
| (14,198,910 | ) | (46,782,706 | ) | (3,302,744 | ) | |||||||
| 75,743 | (25,868 | ) | 1,059,765 | |||||||||
| (14,123,167 | ) | (46,808,574 | ) | (2,242,979 | ) | |||||||
| (12,517,424 | ) | 165,242,306 | 6,860,368 | |||||||||
| 61,591 | 13,784 | 88,289 | ||||||||||
| (12,455,833 | ) | 165,256,090 | 6,948,657 | |||||||||
| (26,579,000 | ) | 118,447,516 | 4,705,678 | |||||||||
| $ | (18,063,347 | ) | $ | 128,758,614 | $ | 6,426,525 | ||||||
| $ | 1,311,539 | $ | 2,423,530 | $ | 128,135 | |||||||
| $ | — | $ | 30,748 | $ | — | |||||||
| Semi-Annual Report | 41 |
Lazard Retirement Series, Inc. Statements of Changes in Net Assets
| Lazard Retirement US Strategic Equity Portfolio | Lazard Retirement US Small-Mid Cap Equity Portfolio |
|||||||||||||||||
| Six Months Ended | Year Ended | Six Months Ended | Year Ended | |||||||||||||||
| June 30, 2016 | December 31, | June 30, 2016 | December 31, | |||||||||||||||
| (unaudited) | 2015 | (unaudited) | 2015 | |||||||||||||||
| Increase (Decrease) in Net Assets | ||||||||||||||||||
| Operations | ||||||||||||||||||
| Net investment income (loss) | $ | 42,643 | $ | 66,770 | $ | (31,554 | ) | $ | (139,450 | ) | ||||||||
| Net realized gain (loss) on investments, foreign currency transactions and forward currency contracts | (487,981 | ) | 927,106 | (493,553 | ) | 5,414,421 | ||||||||||||
| Net change in unrealized appreciation (depreciation) on investments, foreign currency translations and forward currency contracts | 486,923 | (1,620,763 | ) | 398,494 | (6,818,250 | ) | ||||||||||||
| Net increase (decrease) in net assets resulting from operations | 41,585 | (626,887 | ) | (126,613 | ) | (1,543,279 | ) | |||||||||||
| Distributions to shareholders | ||||||||||||||||||
| From net investment income | ||||||||||||||||||
| Service Shares | — | (52,360 | ) | — | — | |||||||||||||
| Investor Shares | — | — | — | — | ||||||||||||||
| From net realized gains | ||||||||||||||||||
| Service Shares | — | (792,085 | ) | — | (4,465,229 | ) | ||||||||||||
| Investor Shares | — | — | — | — | ||||||||||||||
| Net decrease in net assets resulting from distributions | — | (844,445 | ) | — | (4,465,229 | ) | ||||||||||||
| Capital stock transactions | ||||||||||||||||||
| Net proceeds from sales | ||||||||||||||||||
| Service Shares | 621,658 | 5,026,315 | 4,679,419 | 14,432,469 | ||||||||||||||
| Investor Shares | — | — | — | — | ||||||||||||||
| Net proceeds from reinvestment of distributions | ||||||||||||||||||
| Service Shares | — | 844,445 | — | 4,465,229 | ||||||||||||||
| Investor Shares | — | — | — | — | ||||||||||||||
| Cost of shares redeemed | ||||||||||||||||||
| Service Shares | (2,330,119 | ) | (5,261,809 | ) | (8,164,959 | ) | (16,880,480 | ) | ||||||||||
| Investor Shares | — | — | — | — | ||||||||||||||
| Net increase (decrease) in net assets from capital stock transactions | (1,708,461 | ) | 608,951 | (3,485,540 | ) | 2,017,218 | ||||||||||||
| Total increase (decrease) in net assets | (1,666,876 | ) | (862,381 | ) | (3,612,153 | ) | (3,991,290 | ) | ||||||||||
| Net assets at beginning of period | 11,528,967 | 12,391,348 | 59,499,311 | 63,490,601 | ||||||||||||||
| Net assets at end of period* | $ | 9,862,091 | $ | 11,528,967 | $ | 55,887,158 | $ | 59,499,311 | ||||||||||
| * Includes undistributed (distributions in excess of) net investment income (loss) of | $ | 53,314 | $ | 10,671 | $ | (31,554 | ) | $ | — | |||||||||
| Shares issued and redeemed | ||||||||||||||||||
| Service Shares | ||||||||||||||||||
| Shares outstanding at beginning of period | 1,083,612 | 1,020,099 | 8,047,591 | 7,764,268 | ||||||||||||||
| Shares sold | 59,848 | 420,624 | 645,520 | 1,725,627 | ||||||||||||||
| Shares issued to shareholders from reinvestment of distributions | — | 80,270 | — | 605,900 | ||||||||||||||
| Shares redeemed | (221,582 | ) | (437,381 | ) | (1,125,042 | ) | (2,048,204 | ) | ||||||||||
| Net increase (decrease) | (161,734 | ) | 63,513 | (479,522 | ) | 283,323 | ||||||||||||
| Shares outstanding at end of period | 921,878 | 1,083,612 | 7,568,069 | 8,047,591 | ||||||||||||||
| Investor Shares | ||||||||||||||||||
| Shares outstanding at beginning of period | ||||||||||||||||||
| Shares sold | ||||||||||||||||||
| Shares issued to shareholders from reinvestment of distributions | ||||||||||||||||||
| Shares redeemed | ||||||||||||||||||
| Net increase (decrease) | ||||||||||||||||||
| Shares outstanding at end of period | ||||||||||||||||||
The accompanying notes are an integral part of these financial statements.
| 42 | Semi-Annual Report |
| Lazard Retirement International Equity Portfolio | Lazard Retirement Emerging Markets Equity Portfolio | Lazard Retirement Global Dynamic Multi Asset Portfolio |
|||||||||||||||||||||||||
| Six Months Ended | Year Ended | Six Months Ended | Year Ended | Six Months Ended | Year Ended | ||||||||||||||||||||||
| June 30, 2016 | December 31, | June 30, 2016 | December 31, | June 30, 2016 | December 31, | ||||||||||||||||||||||
| (unaudited) | 2015 | (unaudited) | 2015 | (unaudited) | 2015 | ||||||||||||||||||||||
| $ | 8,515,653 | $ | 10,085,261 | $ | 10,311,098 | $ | 15,243,474 | $ | 1,720,847 | $ | 2,379,616 | ||||||||||||||||
| (14,123,167 | ) | 27,470,767 | (46,808,574 | ) | (24,302,162 | ) | (2,242,979 | ) | (909,955 | ) | |||||||||||||||||
| (12,455,833 | ) | (24,202,942 | ) | 165,256,090 | (208,269,416 | ) | 6,948,657 | (3,041,867 | ) | ||||||||||||||||||
| (18,063,347 | ) | 13,353,086 | 128,758,614 | (217,328,104 | ) | 6,426,525 | (1,572,206 | ) | |||||||||||||||||||
| — | (11,274,502 | ) | — | (9,782,582 | ) | — | — | ||||||||||||||||||||
| — | — | — | (2,497,132 | ) | — | — | |||||||||||||||||||||
| — | (12,022,244 | ) | — | (2,236,910 | ) | — | (5,417,685 | ) | |||||||||||||||||||
| — | — | — | (517,868 | ) | — | — | |||||||||||||||||||||
| — | (23,296,746 | ) | — | (15,034,492 | ) | — | (5,417,685 | ) | |||||||||||||||||||
| 58,380,688 | 108,614,054 | 81,963,305 | 201,022,412 | 44,134,329 | 78,547,519 | ||||||||||||||||||||||
| — | — | 14,442,423 | 29,579,712 | — | — | ||||||||||||||||||||||
| — | 23,296,746 | — | 12,019,492 | — | 5,417,685 | ||||||||||||||||||||||
| — | — | — | 3,015,000 | — | — | ||||||||||||||||||||||
| (45,538,035 | ) | (130,279,566 | ) | (88,991,567 | ) | (127,926,800 | ) | (19,348,105 | ) | (30,978,537 | ) | ||||||||||||||||
| — | — | (18,212,855 | ) | (62,096,136 | ) | — | — | ||||||||||||||||||||
| 12,842,653 | 1,631,234 | (10,798,694 | ) | 55,613,680 | 24,786,224 | 52,986,667 | |||||||||||||||||||||
| (5,220,694 | ) | (8,312,426 | ) | 117,959,920 | (176,748,916 | ) | 31,212,749 | 45,996,776 | |||||||||||||||||||
| 682,011,773 | 690,324,199 | 912,853,269 | 1,089,602,185 | 222,666,191 | 176,669,415 | ||||||||||||||||||||||
| $ | 676,791,079 | $ | 682,011,773 | $ | 1,030,813,189 | $ | 912,853,269 | $ | 253,878,940 | $ | 222,666,191 | ||||||||||||||||
| $ | 8,831,941 | $ | 316,288 | $ | 12,871,658 | $ | 2,560,560 | $ | 323,807 | $ | (1,397,040 | ) | |||||||||||||||
| 55,520,320 | 55,231,355 | 48,088,227 | 43,075,583 | 19,352,557 | 14,895,028 | ||||||||||||||||||||||
| 4,869,313 | 8,242,943 | 4,930,197 | 11,097,828 | 3,838,825 | 6,588,954 | ||||||||||||||||||||||
| — | 1,911,335 | — | 758,566 | — | 476,062 | ||||||||||||||||||||||
| (3,837,008 | ) | (9,865,313 | ) | (5,374,367 | ) | (6,843,750 | ) | (1,683,851 | ) | (2,607,487 | ) | ||||||||||||||||
| 1,032,305 | 288,965 | (444,170 | ) | 5,012,644 | 2,154,974 | 4,457,529 | |||||||||||||||||||||
| 56,552,625 | 55,520,320 | 47,644,057 | 48,088,227 | 21,507,531 | 19,352,557 | ||||||||||||||||||||||
| 10,186,142 | 11,645,766 | ||||||||||||||||||||||||||
| 871,462 | 1,623,022 | ||||||||||||||||||||||||||
| — | 192,541 | ||||||||||||||||||||||||||
| (1,139,062 | ) | (3,275,187 | ) | ||||||||||||||||||||||||
| (267,600 | ) | (1,459,624 | ) | ||||||||||||||||||||||||
| 9,918,542 | 10,186,142 | ||||||||||||||||||||||||||
| Semi-Annual Report | 43 |
Lazard Retirement Series, Inc. Financial Highlights
LAZARD RETIREMENT US STRATEGIC EQUITY PORTFOLIO
| Six Months | |||||||||||||||||||||||||
| Selected data for a share of capital | Ended | Year Ended | |||||||||||||||||||||||
| stock outstanding throughout each period | 6/30/16† | 12/31/15 | 12/31/14 | 12/31/13 | 12/31/12 | 12/31/11 | |||||||||||||||||||
| Service Shares | |||||||||||||||||||||||||
| Net asset value, beginning of period | $ | 10.64 | $ | 12.15 | $ | 12.02 | $ | 10.44 | $ | 9.26 | $ | 9.18 | |||||||||||||
| Income (loss) from investment operations: | |||||||||||||||||||||||||
| Net investment income (loss) | 0.05 | 0.06 | 0.09 | 0.11 | 0.12 | 0.10 | |||||||||||||||||||
| Net realized and unrealized gain (loss) | 0.01 | (0.73 | ) | 1.68 | 2.80 | 1.18 | 0.08 | ||||||||||||||||||
| Total from investment operations | 0.06 | (0.67 | ) | 1.77 | 2.91 | 1.30 | 0.18 | ||||||||||||||||||
| Less distributions from: | |||||||||||||||||||||||||
| Net investment income | — | (0.05 | ) | (0.09 | ) | (0.11 | ) | (0.12 | ) | (0.10 | ) | ||||||||||||||
| Net realized gains | — | (0.79 | ) | (1.55 | ) | (1.22 | ) | — | — | ||||||||||||||||
| Total distributions | — | (0.84 | ) | (1.64 | ) | (1.33 | ) | (0.12 | ) | (0.10 | ) | ||||||||||||||
| Net asset value, end of period | $ | 10.70 | $ | 10.64 | $ | 12.15 | $ | 12.02 | $ | 10.44 | $ | 9.26 | |||||||||||||
| Total Return (a) | 0.56 | % | –5.44 | % | 14.71 | % | 28.07 | % | 14.01 | % | 1.96 | % | |||||||||||||
| Ratios and Supplemental Data: | |||||||||||||||||||||||||
| Net assets, end of period (in thousands) | $ | 9,862 | $ | 11,529 | $ | 12,391 | $ | 8,944 | $ | 6,702 | $ | 6,008 | |||||||||||||
| Ratios to average net assets (b): | |||||||||||||||||||||||||
| Net expenses | 1.00 | % | 1.00 | % | 1.00 | % | 1.00 | % | 1.00 | % | 1.00 | % | |||||||||||||
| Gross expenses | 2.51 | % | 2.31 | % | 2.59 | % | 2.88 | % | 3.23 | % | 3.37 | % | |||||||||||||
| Net investment income (loss) | 0.82 | % | 0.53 | % | 0.79 | % | 0.97 | % | 1.16 | % | 1.04 | % | |||||||||||||
| Portfolio turnover rate | 29 | % | 86 | % | 72 | % | 66 | % | 59 | % | 50 | % | |||||||||||||
| † | Unaudited. |
| (a) | Total returns reflect reinvestment of all dividends and distributions, if any. Certain expenses of the Portfolio have been waived or reimbursed by the Portfolio’s Investment Manager or State Street; without such waiver/reimbursement of expenses, the Portfolio’s returns would have been lower. Performance information does not reflect the fees and charges imposed by participating insurance companies at the separate account level, and such charges will have the effect of reducing performance. Return for a period of less than one year is not annualized. |
| (b) | Annualized for a period of less than one year. |
The accompanying notes are an integral part of these financial statements.
| 44 | Semi-Annual Report |
LAZARD RETIREMENT US SMALL-MID CAP EQUITY PORTFOLIO
| Six Months | |||||||||||||||||||||||||
| Selected data for a share of capital | Ended | Year Ended | |||||||||||||||||||||||
| stock outstanding throughout each period | 6/30/16† | 12/31/15 | 12/31/14 | 12/31/13 | 12/31/12 | 12/31/11 | |||||||||||||||||||
| Service Shares | |||||||||||||||||||||||||
| Net asset value, beginning of period | $ | 7.39 | $ | 8.18 | $ | 8.71 | $ | 7.30 | $ | 9.26 | $ | 11.04 | |||||||||||||
| Income (loss) from investment operations: | |||||||||||||||||||||||||
| Net investment income (loss) | — | (a) | (0.02 | ) | (0.02 | ) | (0.03 | ) | (0.01 | ) | (0.01 | ) | |||||||||||||
| Net realized and unrealized gain (loss) | (0.01 | ) | (0.19 | ) | 0.94 | 2.53 | 0.95 | (1.01 | ) | ||||||||||||||||
| Total from investment operations | (0.01 | ) | (0.21 | ) | 0.92 | 2.50 | 0.94 | (1.02 | ) | ||||||||||||||||
| Less distributions from: | |||||||||||||||||||||||||
| Net realized gains | — | (0.58 | ) | (1.45 | ) | (1.09 | ) | (2.90 | ) | (0.76 | ) | ||||||||||||||
| Total distributions | — | (0.58 | ) | (1.45 | ) | (1.09 | ) | (2.90 | ) | (0.76 | ) | ||||||||||||||
| Net asset value, end of period | $ | 7.38 | $ | 7.39 | $ | 8.18 | $ | 8.71 | $ | 7.30 | $ | 9.26 | |||||||||||||
| Total Return (b) | –0.14 | % | –2.38 | % | 11.03 | % | 35.08 | % | 10.38 | % | –9.07 | % | |||||||||||||
| Ratios and Supplemental Data: | |||||||||||||||||||||||||
| Net assets, end of period (in thousands) | $ | 55,887 | $ | 59,499 | $ | 63,491 | $ | 58,923 | $ | 46,978 | $ | 180,524 | |||||||||||||
| Ratios to average net assets (c): | |||||||||||||||||||||||||
| Net expenses | 1.25 | % | 1.25 | % | 1.25 | % | 1.25 | % | 1.20 | % | 1.15 | % | |||||||||||||
| Gross expenses | 1.36 | % | 1.35 | % | 1.32 | % | 1.35 | % | 1.20 | % | 1.15 | % | |||||||||||||
| Net investment income (loss) | –0.11 | % | –0.22 | % | –0.20 | % | –0.33 | % | –0.06 | % | –0.16 | % | |||||||||||||
| Portfolio turnover rate | 46 | % | 89 | % | 92 | % | 101 | % | 74 | % | 98 | % | |||||||||||||
| † | Unaudited. |
| (a) | Amount is less than $0.01 per share. |
| (b) | Total returns reflect reinvestment of all dividends and distributions, if any. Certain expenses of the Portfolio have been waived or reimbursed by the Portfolio’s Investment Manager; without such waiver/reimbursement of expenses, the Portfolio’s returns would have been lower. Performance information does not reflect the fees and charges imposed by participating insurance companies at the separate account level, and such charges will have the effect of reducing performance. Return for a period of less than one year is not annualized. |
| (c) | Annualized for a period of less than one year. |
The accompanying notes are an integral part of these financial statements.
| Semi-Annual Report | 45 |
LAZARD RETIREMENT INTERNATIONAL EQUITY PORTFOLIO
| Six Months | |||||||||||||||||||||||||
| Selected data for a share of capital | Ended | Year Ended | |||||||||||||||||||||||
| stock outstanding throughout each period | 6/30/16† | 12/31/15 | 12/31/14 | 12/31/13 | 12/31/12 | 12/31/11 | |||||||||||||||||||
| Service Shares | |||||||||||||||||||||||||
| Net asset value, beginning of period | $ | 12.28 | $ | 12.50 | $ | 13.26 | $ | 11.12 | $ | 9.33 | $ | 10.28 | |||||||||||||
| Income (loss) from investment operations: | |||||||||||||||||||||||||
| Net investment income (loss) | 0.15 | 0.19 | 0.21 | 0.17 | 0.19 | 0.18 | |||||||||||||||||||
| Net realized and unrealized gain (loss) | (0.46 | ) | 0.02 | (0.76 | ) | 2.13 | 1.78 | (0.93 | ) | ||||||||||||||||
| Total from investment operations | (0.31 | ) | 0.21 | (0.55 | ) | 2.30 | 1.97 | (0.75 | ) | ||||||||||||||||
| Less distributions from: | |||||||||||||||||||||||||
| Net investment income | — | (0.21 | ) | (0.21 | ) | (0.16 | ) | (0.18 | ) | (0.20 | ) | ||||||||||||||
| Net realized gains | — | (0.22 | ) | — | — | — | — | ||||||||||||||||||
| Total distributions | — | (0.43 | ) | (0.21 | ) | (0.16 | ) | (0.18 | ) | (0.20 | ) | ||||||||||||||
| Net asset value, end of period | $ | 11.97 | $ | 12.28 | $ | 12.50 | $ | 13.26 | $ | 11.12 | $ | 9.33 | |||||||||||||
| Total Return (a) | –2.52 | % | 1.75 | % | –4.21 | % | 20.76 | % | 21.11 | % | –7.27 | % | |||||||||||||
| Ratios and Supplemental Data: | |||||||||||||||||||||||||
| Net assets, end of period (in thousands) | $ | 676,791 | $ | 682,012 | $ | 690,324 | $ | 689,512 | $ | 592,437 | $ | 513,882 | |||||||||||||
| Ratios to average net assets (b): | |||||||||||||||||||||||||
| Net expenses | 1.10 | % | 1.11 | % | 1.09 | % | 1.10 | % | 1.10 | % | 1.12 | % | |||||||||||||
| Gross expenses | 1.10 | % | 1.11 | % | 1.09 | % | 1.10 | % | 1.10 | % | 1.12 | % | |||||||||||||
| Net investment income (loss) | 2.61 | % | 1.42 | % | 1.59 | % | 1.41 | % | 1.80 | % | 1.89 | % | |||||||||||||
| Portfolio turnover rate | 13 | % | 37 | % | 34 | % | 40 | % | 43 | % | 39 | % | |||||||||||||
| † | Unaudited. |
| (a) | Total returns reflect reinvestment of all dividends and distributions, if any. Certain expenses of the Portfolio have been waived or reimbursed by the Portfolio’s Investment Manager; without such waiver/reimbursement of expenses, the Portfolio’s returns would have been lower. Performance information does not reflect the fees and charges imposed by participating insurance companies at the separate account level, and such charges will have the effect of reducing performance. Return for a period of less than one year is not annualized. |
| (b) | Annualized for a period of less than one year. |
The accompanying notes are an integral part of these financial statements.
| 46 | Semi-Annual Report |
LAZARD RETIREMENT EMERGING MARKETS EQUITY PORTFOLIO
| Six Months | |||||||||||||||||||||||||
| Selected data for a share of capital | Ended | Year Ended | |||||||||||||||||||||||
| stock outstanding throughout each period | 6/30/16† | 12/31/15 | 12/31/14 | 12/31/13 | 12/31/12 | 12/31/11 | |||||||||||||||||||
| Service Shares | |||||||||||||||||||||||||
| Net asset value, beginning of period | $ | 15.70 | $ | 19.96 | $ | 21.51 | $ | 22.22 | $ | 18.71 | $ | 23.33 | |||||||||||||
| Income (loss) from investment operations: | |||||||||||||||||||||||||
| Net investment income (loss) (a) | 0.18 | 0.27 | 0.37 | 0.31 | 0.33 | 0.44 | |||||||||||||||||||
| Net realized and unrealized gain (loss) | 2.06 | (4.27 | ) | (1.35 | ) | (0.58 | ) | 3.78 | (4.64 | ) | |||||||||||||||
| Total from investment operations | 2.24 | (4.00 | ) | (0.98 | ) | (0.27 | ) | 4.11 | (4.20 | ) | |||||||||||||||
| Less distributions from: | |||||||||||||||||||||||||
| Net investment income | — | (0.21 | ) | (0.37 | ) | (0.31 | ) | (0.35 | ) | (0.42 | ) | ||||||||||||||
| Net realized gains | — | (0.05 | ) | (0.20 | ) | (0.13 | ) | (0.25 | ) | — | |||||||||||||||
| Total distributions | — | (0.26 | ) | (0.57 | ) | (0.44 | ) | (0.60 | ) | (0.42 | ) | ||||||||||||||
| Net asset value, end of period | $ | 17.94 | $ | 15.70 | $ | 19.96 | $ | 21.51 | $ | 22.22 | $ | 18.71 | |||||||||||||
| Total Return (b) | 14.27 | % | –20.05 | % | –4.64 | % | –1.24 | % | 22.05 | % | –18.00 | % | |||||||||||||
| Ratios and Supplemental Data: | |||||||||||||||||||||||||
| Net assets, end of period (in thousands) | $ | 854,743 | $ | 754,835 | $ | 859,747 | $ | 846,233 | $ | 734,699 | $ | 580,370 | |||||||||||||
| Ratios to average net assets (c): | |||||||||||||||||||||||||
| Net expenses | 1.39 | % | 1.39 | % | 1.38 | % | 1.38 | % | 1.39 | % | 1.42 | % | |||||||||||||
| Gross expenses | 1.39 | % | 1.39 | % | 1.38 | % | 1.38 | % | 1.39 | % | 1.42 | % | |||||||||||||
| Net investment income (loss) | 2.17 | % | 1.43 | % | 1.66 | % | 1.42 | % | 1.57 | % | 2.04 | % | |||||||||||||
| Portfolio turnover rate | 7 | % | 9 | % | 12 | % | 14 | % | 23 | % | 19 | % | |||||||||||||
| Six Months | |||||||||||||||||||||||||
| Selected data for a share of capital | Ended | Year Ended | |||||||||||||||||||||||
| stock outstanding throughout each period | 6/30/16† | 12/31/15 | 12/31/14 | 12/31/13 | 12/31/12 | 12/31/11 | |||||||||||||||||||
| Investor Shares | |||||||||||||||||||||||||
| Net asset value, beginning of period | $ | 15.51 | $ | 19.74 | $ | 21.28 | $ | 21.99 | $ | 18.52 | $ | 23.17 | |||||||||||||
| Income (loss) from investment operations: | |||||||||||||||||||||||||
| Net investment income (loss) (a) | 0.19 | 0.32 | 0.42 | 0.37 | 0.38 | 0.50 | |||||||||||||||||||
| Net realized and unrealized gain (loss) | 2.05 | (4.25 | ) | (1.34 | ) | (0.59 | ) | 3.74 | (4.62 | ) | |||||||||||||||
| Total from investment operations | 2.24 | (3.93 | ) | (0.92 | ) | (0.22 | ) | 4.12 | (4.12 | ) | |||||||||||||||
| Less distributions from: | |||||||||||||||||||||||||
| Net investment income | — | (0.25 | ) | (0.42 | ) | (0.36 | ) | (0.40 | ) | (0.53 | ) | ||||||||||||||
| Net realized gains | — | (0.05 | ) | (0.20 | ) | (0.13 | ) | (0.25 | ) | — | |||||||||||||||
| Total distributions | — | (0.30 | ) | (0.62 | ) | (0.49 | ) | (0.65 | ) | (0.53 | ) | ||||||||||||||
| Net asset value, end of period | $ | 17.75 | $ | 15.51 | $ | 19.74 | $ | 21.28 | $ | 21.99 | $ | 18.52 | |||||||||||||
| Total Return (b) | 14.44 | % | –19.90 | % | –4.38 | % | –1.01 | % | 22.34 | % | –17.79 | % | |||||||||||||
| Ratios and Supplemental Data: | |||||||||||||||||||||||||
| Net assets, end of period (in thousands) | $ | 176,071 | $ | 158,018 | $ | 229,855 | $ | 260,330 | $ | 282,596 | $ | 244,320 | |||||||||||||
| Ratios to average net assets (c): | |||||||||||||||||||||||||
| Net expenses | 1.15 | % | 1.15 | % | 1.14 | % | 1.14 | % | 1.14 | % | 1.17 | % | |||||||||||||
| Gross expenses | 1.15 | % | 1.15 | % | 1.14 | % | 1.14 | % | 1.14 | % | 1.17 | % | |||||||||||||
| Net investment income (loss) | 2.41 | % | 1.71 | % | 1.91 | % | 1.71 | % | 1.85 | % | 2.31 | % | |||||||||||||
| Portfolio turnover rate | 7 | % | 9 | % | 12 | % | 14 | % | 23 | % | 19 | % | |||||||||||||
| † | Unaudited. |
| (a) | Net investment income (loss) has been computed using the average shares method. |
| (b) | Total returns reflect reinvestment of all dividends and distributions, if any. Performance information does not reflect the fees and charges imposed by participating insurance companies at the separate account level, and such charges will have the effect of reducing performance. Return for a period of less than one year is not annualized. |
| (c) | Annualized for a period of less than one year. |
The accompanying notes are an integral part of these financial statements.
| Semi-Annual Report | 47 |
LAZARD RETIREMENT GLOBAL DYNAMIC MULTI ASSET PORTFOLIO
| Six Months | For the Period | ||||||||||||||||||||||||
| Selected data for a share of capital | Ended | Year Ended | 4/30/12* to | ||||||||||||||||||||||
| stock outstanding throughout each period | 6/30/16† | 12/31/15 | 12/31/14 | 12/31/13 | 12/31/12 | ||||||||||||||||||||
| Service Shares | |||||||||||||||||||||||||
| Net asset value, beginning of period | $ | 11.51 | $ | 11.86 | $ | 12.30 | $ | 10.54 | $ | 10.00 | |||||||||||||||
| Income (loss) from investment operations: | |||||||||||||||||||||||||
| Net investment income (loss) | 0.09 | 0.13 | 0.11 | 0.06 | 0.03 | ||||||||||||||||||||
| Net realized and unrealized gain (loss) | 0.20 | (0.19 | ) | 0.23 | 1.99 | 0.54 | |||||||||||||||||||
| Total from investment operations | 0.29 | (0.06 | ) | 0.34 | 2.05 | 0.57 | |||||||||||||||||||
| Less distributions from: | |||||||||||||||||||||||||
| Net investment income | — | — | (0.07 | ) | (0.04 | ) | — | (a) | |||||||||||||||||
| Net realized gains | — | (0.29 | ) | (0.71 | ) | (0.25 | ) | (0.03 | ) | ||||||||||||||||
| Total distributions | — | (0.29 | ) | (0.78 | ) | (0.29 | ) | (0.03 | ) | ||||||||||||||||
| Net asset value, end of period | $ | 11.80 | $ | 11.51 | $ | 11.86 | $ | 12.30 | $ | 10.54 | |||||||||||||||
| Total Return (b) | 2.52 | % | –0.44 | % | 2.70 | % | 19.49 | % | 5.74 | % | |||||||||||||||
| Ratios and Supplemental Data: | |||||||||||||||||||||||||
| Net assets, end of period (in thousands) | $ | 253,879 | $ | 222,666 | $ | 176,669 | $ | 99,760 | $ | 30,262 | |||||||||||||||
| Ratios to average net assets (c): | |||||||||||||||||||||||||
| Net expenses | 1.05 | % | 1.05 | % | 1.05 | % | 1.05 | % | 1.05 | % | |||||||||||||||
| Gross expenses | 1.28 | % | 1.31 | % | 1.33 | % | 1.70 | % | 3.80 | % | |||||||||||||||
| Net investment income (loss) | 1.48 | % | 1.18 | % | 1.19 | % | 1.01 | % | 1.03 | % | |||||||||||||||
| Portfolio turnover rate | 48 | % | 114 | % | 105 | % | 62 | % | 45 | % | |||||||||||||||
| * | The Portfolio commenced operations on April 30, 2012. |
| † | Unaudited. |
| (a) | Amount is less than $0.01 per share. |
| (b) | Total returns reflect reinvestment of all dividends and distributions, if any. Certain expenses of the Portfolio have been waived or reimbursed by the Portfolio’s Investment Manager, State Street or BFDS; without such waiver/reimbursement of expenses, the Portfolio’s returns would have been lower. Performance information does not reflect the fees and charges imposed by participating insurance companies at the separate account level, and such charges will have the effect of reducing performance. Return for a period of less than one year is not annualized. |
| (c) | Annualized for a period of less than one year. |
The accompanying notes are an integral part of these financial statements.
| 48 | Semi-Annual Report |
Lazard Retirement Series, Inc. Notes to Financial Statements June 30, 2016 (unaudited)
1. Organization
Lazard Retirement Series, Inc. (the “Fund”) was incorporated in Maryland on February 13, 1997 and is registered under the Investment Company Act of 1940, as amended (the “1940 Act”), as an open-end management investment company. The Fund, comprised of twenty-one no-load portfolios (each referred to as a “Portfolio”), is currently offered only to separate accounts established by insurance companies to fund variable annuity contracts and variable life insurance policies. Portfolio shares may also be offered to certain qualified pension and retirement plans and accounts permitting accumulation of assets on a tax-deferred basis. Effective January 31, 2006, the Fund designated its existing class of shares as Service Shares and commenced offering Investor Shares. Investor Shares and Service Shares are identical, except as to the services offered to and expenses borne by each class of shares. As of June 30, 2016, only Lazard Retirement Emerging Markets Equity Portfolio had issued Investor Shares. Currently, only the following five Portfolios, each of which is “diversified”, as defined in the 1940 Act, are offered: Lazard Retirement US Strategic Equity Portfolio (“US Strategic Equity Portfolio”), Lazard Retirement US Small-Mid Cap Equity Portfolio (“US Small-Mid Cap Equity Portfolio”), Lazard Retirement International Equity Portfolio (“International Equity Portfolio”), Lazard Retirement Emerging Markets Equity Portfolio (“Emerging Markets Equity Portfolio”), and Lazard Retirement Global Dynamic Multi Asset Portfolio (“Global Dynamic Multi Asset Portfolio”). Each of the other sixteen Portfolios had not commenced operations as of June 30, 2016.
2. Significant Accounting Policies
The accompanying financial statements are presented in conformity with GAAP. The Fund is an investment company and therefore applies specialized accounting guidance in Accounting Standards Codification Topic 946. The following is a summary of significant accounting policies consistently followed by the Fund in the preparation of the financial statements:
(a) Valuation of Investments—Market values for securities listed on the New York Stock Exchange (“NYSE”), NASDAQ national market or other US or
foreign exchanges or markets are generally based on the last reported sales price on the exchange or market on which the security is principally traded on each valuation date; securities not traded on the valuation date are valued at the most recent quoted bid price. The Fund values NASDAQ-traded securities at the NASDAQ Official Closing Price, which may not be the last reported sales price in certain instances. Forward currency contracts generally are valued using quotations from an independent pricing service. Investments in money market funds are valued at the fund’s net asset value (“NAV”) per share.
Bonds and other fixed-income securities that are not exchange-traded are valued on the basis of prices provided by independent pricing services which are based on, among other things, trading in securities with similar characteristics, brokers’ quotations and/or a matrix system which considers such factors as other security prices, yields and maturities.
The Valuation Committee of the Investment Manager, which meets periodically under the direction of the Board of Directors (the “Board”), may evaluate a variety of factors to determine the fair value of securities for which market quotations are determined not to be readily available or reliable. These factors include, but are not limited to, the type of security, the value of comparable securities, observations from financial institutions and relevant news events. Input from the Investment Manager’s portfolio managers/analysts also will be considered.
If a significant event materially affecting the value of securities occurs between the close of the exchange or market on which the security is principally traded and the time when a Portfolio’s NAV is calculated, or when current market quotations otherwise are determined not to be readily available or reliable (including restricted or other illiquid securities such as certain derivative instruments), such securities will be valued at their fair value as determined by, or in accordance with procedures approved by, the Board. The fair value of non-US securities may be determined with the assistance of an independent pricing service using correlations between the movement of prices of such securities and indices of US securities and other
| Semi-Annual Report | 49 |
appropriate indicators, such as closing market prices of relevant ADRs or futures contracts. Non-US securities may trade on days when a Portfolio is not open for business, thus affecting the value of the Portfolio’s assets on days when Portfolio shareholders may not be able to buy or sell Portfolio shares.
The effect of using fair value pricing is that the NAV of a Portfolio will reflect the affected securities’ values as determined in the judgment of the Board or its designee instead of being determined by the market. Using a fair value pricing methodology to price securities may result in a value that is different from the most recent closing price of a security and from the prices used by other investment companies to calculate their portfolios’ NAVs.
(b) Portfolio Securities Transactions and Investment Income—Portfolio securities transactions are accounted for on trade date. Realized gain (loss) on sales of investments are recorded on a specific identification basis. Dividend income is recorded on the ex-dividend date except for certain dividends from non-US securities where the dividend rate is not available. In such cases, the dividend is recorded as soon as the information is received by the Portfolio. Interest income is accrued daily. The Portfolios amortize premiums and accrete discounts on fixed-income securities using the effective yield method.
During the period ended June 30, 2016, only Global Dynamic Multi Asset Portfolio traded in fixed-income securities.
A Portfolio may be subject to taxes imposed by non-US countries in which it invests. Such taxes are generally based upon income earned or capital gains (realized or unrealized). An affected Portfolio accrues and applies such taxes to net investment income, net realized gains and net unrealized gains concurrent with the recognition of income earned or capital gains (realized and unrealized) from the applicable portfolio securities.
As a result of several court cases in certain countries across the European Union, the International Equity Portfolio has filed additional tax reclaims for previously withheld taxes on dividends earned in those countries.
These additional filings are subject to various administrative proceedings by the local jurisdictions’ tax authorities within the European Union, as well as a number of related judicial proceedings. Uncertainty exists as to the ultimate resolution of these proceedings, the likelihood of receipt of these claims, and the potential timing of payment, and accordingly no amounts are reflected in the financial statements. Such amounts, if and when recorded, could result in an increase in the International Equity Portfolio’s NAV per share.
(c) Foreign Currency Translation and Forward Currency Contracts—The accounting records of the Fund are maintained in US dollars. Portfolio securities and other assets and liabilities denominated in a foreign currency are translated daily into US dollars at the prevailing rates of exchange. Purchases and sales of securities, income receipts and expense payments are translated into US dollars at the prevailing exchange rates on the respective transaction dates.
The Portfolios do not isolate the portion of operations resulting from changes in foreign exchange rates on investments from the fluctuations arising from changes in their market prices. Such fluctuations are included in net realized and unrealized gain (loss) on investments. Net realized gain (loss) on foreign currency transactions and forward currency contracts represents net foreign currency gain (loss) from forward currency contracts, disposition of foreign currencies, currency gain (loss) realized between the trade and settlement dates on securities transactions, and the difference between the amount of dividends, interest and foreign withholding taxes recorded on the Portfolios’ accounting records and the US dollar equivalent amounts actually received or paid. Net change in unrealized appreciation (depreciation) on foreign currency translations reflects the impact of changes in exchange rates on the value of assets and liabilities, other than investments in securities, during the period.
A forward currency contract is an agreement between two parties to buy or sell currency at a set price on a future date. Upon entering into these contracts, risks may arise from the potential inability of counterparties to meet the terms of their contracts and from
| 50 | Semi-Annual Report |
unanticipated movements in the value of the foreign currency relative to the US dollar.
The US dollar value of forward currency contracts is determined using quotations provided by an independent pricing service. Daily fluctuations in the value of such contracts are recorded as unrealized appreciation (depreciation) on forward currency contracts. When the contract is closed, a Portfolio records a realized gain (loss) equal to the difference between the value at the time it was opened and the value at the time it was closed.
During the period ended June 30, 2016, only Global Dynamic Multi Asset Portfolio traded in forward currency contracts.
(d) Federal Income Taxes—The Fund’s policy is to continue to have each Portfolio qualify as a regulated investment company under Subchapter M of the Internal Revenue Code (the “Code”) and to distribute all of its taxable income, including any net realized capital gains, to shareholders. Therefore, no federal income tax provision is required.
At December 31, 2015, the following Portfolio had unused realized capital loss carryovers which, for federal income tax purposes, could be used to offset future realized capital gains with no expiration date as follows:
| Portfolio | Short-Term | Long-Term | ||||||
| Emerging Markets Equity | $ | 2,845,581 | $ | 21,282,968 | ||||
Under current tax law, certain late year losses, as defined by the Code, within the taxable year may be deferred and treated as occurring on the first day of the following tax year. For the tax year ended December 31, 2015, the following Portfolio elected to defer such losses as follows:
| Post October | Late Year | |||||||
| Capital Loss | Ordinary Loss | |||||||
| Portfolio | Deferral | Deferral | ||||||
| Global Dynamic Multi Asset | $ | — | $ | (786,134 | ) | |||
Management has analyzed the Portfolios’ tax positions, and has concluded that no liability for unrecognized tax benefits should be recorded related to uncertain tax positions taken on returns filed for open tax years (2012-2014), or expected to be taken in the Portfolios’ 2015 tax returns.
(e) Dividends and Distributions—Dividends from net investment income, if any, will be declared and paid annually. During any particular year, net realized gains from investment transactions in excess of available capital loss carryforwards would be taxable to the Portfolios, if not distributed. The Portfolios intend to declare and distribute these amounts, at least annually, to shareholders; however, to avoid taxation, a second distribution may be required. Differences in per share distributions, by class, are generally due to differences in class specific expenses.
Income and capital gains distributions are determined in accordance with federal income tax regulations which may differ from GAAP. These book/tax differences, which may result in distribution reclassifications, are primarily due to differing treatments of foreign currency transactions, wash sales, passive foreign investment companies and distributions from real estate investment trusts and partnerships. The book/tax differences relating to shareholder distributions may result in reclassifications among certain capital accounts.
(f) Allocation of Expenses—Expenses not directly chargeable to a specific Portfolio are allocated among all Portfolios primarily on the basis of relative net assets. Portfolios accrue distribution and service (12b-1) fees to Service Shares. The Portfolios’ income, expenses (other than class specific expenses) and realized and unrealized gains and losses are allocated proportionally each day between the classes based upon the relative net assets of each class.
(g) Estimates—The preparation of financial statements in conformity with GAAP requires management to make estimates and assumptions that affect the reported amounts of assets and liabilities and disclosure of contingent assets and liabilities at the date of the financial statements and the reported amounts of increases and decreases in net assets resulting
| Semi-Annual Report | 51 |
from operations during the reporting period. Actual results could differ from those estimates.
(h) Net Asset Value—NAV per share for each class of each Portfolio is determined each day the NYSE is open for trading as of the close of regular trading on the NYSE (generally 4:00 p.m. Eastern time). The Fund will not treat an intraday unscheduled disruption in NYSE trading as a closure of the NYSE, and will price its shares as of 4:00 p.m., if the particular disruption directly affects only the NYSE. NAV per share is determined by dividing the value of the total assets of the Portfolio represented by such class, less all liabilities, by the total number of Portfolio shares of such class outstanding.
3. Investment Management, Administration, Distribution and Transfer Agency Agreements
The Fund, on behalf of the Portfolios, has entered into a management agreement (the “Management Agreement”) with the Investment Manager. Pursuant to the Management Agreement, the Investment Manager regularly provides each Portfolio with investment research, advice and supervision and furnishes continuously an investment program for each Portfolio consistent with its investment objective and policies, including the purchase, retention and disposition of securities. For its services provided to the Portfolios, the Investment Manager earns a management fee, accrued daily as a percentage of its average daily net assets and payable by each Portfolio monthly, at the annual rate set forth below:
| Portfolio | Annual Rate | |||
| US Strategic Equity | 0.70 | % | ||
| US Small-Mid Cap Equity | 0.75 | |||
| International Equity | 0.75 | |||
| Emerging Markets Equity | 1.00 | |||
| Global Dynamic Multi Asset (a) | 0.80 | |||
(a) From January 1, 2016 to June 28, 2016, percentage was 0.85%.
The Investment Manager has voluntarily agreed to reduce its fees and, if necessary, reimburse the Portfolios through May 1, 2017 if annualized operating expenses, exclusive of taxes, brokerage, interest on borrowings, fees and expenses of “Acquired Funds” (as defined in Form N-1A) and extraordinary expenses, but including the management fee stated in the Management Agree-
ment between the Investment Manager and the Fund, on behalf of the Portfolios, exceed the following percentages of the value of the Portfolios’ average daily net assets for the respective shares:
| Portfolio | Service Shares | Investor Shares | ||||
| US Strategic Equity | 1.00 | % | N/A | |||
| US Small-Mid Cap Equity | 1.25 | N/A | ||||
| International Equity | 1.10 | N/A | ||||
| Emerging Markets Equity | 1.55 | 1.30 | % | |||
| Global Dynamic Multi Asset | 1.05 | N/A | ||||
During the period ended June 30, 2016, the Investment Manager waived its management fees and reimbursed the following Portfolios for other expenses as follows:
| Service Shares | ||||||||
| Management | Expenses | |||||||
| Portfolio | Fees Waived | Reimbursed | ||||||
| US Strategic Equity | $ | 36,511 | $ | 32,658 | ||||
| US Small-Mid Cap Equity | 29,609 | — | ||||||
| International Equity | 7,302 | — | ||||||
| Global Dynamic Multi Asset | 264,316 | — | ||||||
The aforementioned waivers and/or reimbursements are not subject to recoupment by the Investment Manager.
The Fund has entered into an administration agreement with State Street to provide certain administrative services. Each Portfolio bears the cost of such services at a fixed annual rate of $42,500, plus 0.02% of average daily net assets up to $1 billion and 0.01% of average daily net assets over $1 billion. State Street has agreed to waive up to $18,750 of the $42,500 annual fee for the US Strategic Equity Portfolio until the Portfolio’s net assets reach $25 million. During the period ended June 30, 2016, State Street waived $9,375 of its fee for the US Strategic Equity Portfolio.
The Fund has a distribution agreement with Lazard Asset Management Securities LLC (the “Distributor”), a wholly-owned subsidiary of the Investment Manager, to serve as the distributor for shares of each Portfolio. The Distributor bears the cost of printing and mailing prospectuses to potential investors and certain expenses in connection with the offering of Portfolio shares.
| 52 | Semi-Annual Report |
Under a distribution and servicing plan adopted pursuant to Rule 12b-1 under the 1940 Act, each Portfolio pays a monthly fee to the Distributor, at an annual rate of 0.25% of the average daily net assets of its Service Shares, for distribution and servicing of accounts. The Distributor may make payments to participating insurance companies, certain financial institutions, securities dealers and other industry professionals for providing these services.
BFDS is the Fund’s transfer and dividend disbursing agent. For its services, BFDS receives a monthly fee computed on the basis of the number of shareholder accounts it maintains, subject to a minimum fee amount per share class in each Portfolio, and is reimbursed for certain out-of-pocket expenses. BFDS has agreed to waive the monthly minimum fee for the first six months after a new Portfolio or share class has commenced operations.
4. Directors’ Compensation
Certain Directors of the Fund are officers of the Investment Manager. Each Director who is not an affiliated person of the Investment Manager or any of its affiliates is paid by the Fund, The Lazard Funds, Inc., Lazard Global Total Return and Income Fund, Inc. and Lazard World Dividend & Income Fund, Inc. (collectively with the Fund, the “Lazard Fund Complex”), each a registered management investment company advised by the Investment Manager: (1) an annual retainer of $190,000, (2) an additional annual fee of $20,000 to the lead Independent Director (an “Independent Director” is a Director who is not an “interested person” (as defined in the 1940 Act) of the Fund), and (3) an additional annual fee of $10,000 to the Audit Committee Chair. The Independent Directors may be paid additional compensation for participation on ad hoc committees or other work performed on behalf of the Board. The Independent Directors also are reimbursed for travel and other out-of-pocket expenses for attending Board and committee meetings. The Directors do not receive benefits from the Fund pursuant to any pension, retirement or similar arrangement. Independent Directors’ fees are allocated among the portfolios in the Lazard Fund Complex at a rate of $5,000 per portfolio with the remainder allocated based upon each portfolio’s proportionate share of combined net assets.
The Statements of Operations show the Independent Directors’ fees and expenses paid by each Portfolio.
5. Securities Transactions and Transactions with Affiliates
Purchases and sales of portfolio securities (excluding short-term investments) for the period ended June 30, 2016 were as follows:
| Portfolio | Purchases | Sales | ||||||
| US Strategic Equity | $ | 2,946,213 | $ | 4,534,029 | ||||
| US Small-Mid Cap Equity | 24,893,093 | 28,341,328 | ||||||
| International Equity | 79,556,518 | 89,564,388 | ||||||
| Emerging Markets Equity | 62,577,166 | 75,672,032 | ||||||
| Global Dynamic Multi Asset | 134,185,444 | 108,183,400 | ||||||
| US Treasury Securities | ||||||||
| Portfolio | Purchases | Sales | ||||||
| Global Dynamic Multi Asset | $2,600,191 | $1,389,933 | ||||||
For the period ended June 30, 2016, the Portfolios did not engage in any cross-trades in accordance with Rule 17a-7 under the 1940 Act, and no brokerage commissions were paid to affiliates of the Investment Manager or other affiliates of the Fund for portfolio transactions executed on behalf of the Fund.
6. Investment Risks
(a) Non-US Securities Risk—Certain Portfolios may invest in securities of foreign entities and in instruments denominated in foreign currencies which involve risks not typically associated with investments in US securities. Such Portfolios’ performance will be influenced by political, social and economic factors affecting the non-US countries and companies in which the Portfolios invest. Non-US securities carry special risks, such as less developed or less efficient trading markets, political instability, a lack of company information, differing auditing and legal standards, and, potentially, less liquidity. In addition, investments denominated in currencies other than US dollars may experience a decline in value, in US dollar terms, due solely to fluctuations in currency exchange rates. The Portfolios’ investments could be adversely affected by delays in, or a refusal to grant, repatriation of funds or conversion of emerging market currencies. Emerging market countries can generally have economic structures that are less diverse and mature, and political
| Semi-Annual Report | 53 |
systems that are less stable, than those of developed countries. The economies of countries with emerging markets may be based predominantly on only a few industries, may be highly vulnerable to changes in local or global trade conditions, and may suffer from extreme debt burdens or volatile inflation rates. The securities markets of emerging market countries have historically been extremely volatile. These market conditions may continue or worsen. Significant devaluation of emerging market currencies against the US dollar may occur subsequent to acquisition of investments denominated in emerging market currencies. Investments in these countries may be subject to political, economic, legal, market and currency risks. The risks may include less protection of property rights and uncertain political and economic policies, the imposition of capital controls and/or foreign investment limitations by a country, nationalization of businesses and the imposition of sanctions by other countries, such as the US.
(b) Fixed-Income and Debt Securities Risk—Global Dynamic Multi Asset Portfolio invests in fixed-income securities. The market value of a debt security may decline due to general market conditions that are not specifically related to a particular company, such as real or perceived adverse economic conditions, changes in the outlook for corporate earnings, changes in interest or currency rates or adverse investor sentiment generally. The debt securities market can be susceptible to increases in volatility and decreases in liquidity. Liquidity can decline unpredictably in response to overall economic conditions or credit tightening. Prices of bonds and other debt securities tend to move inversely with changes in interest rates. Interest rate risk is usually greater for fixed-income securities with longer maturities or durations. A rise in interest rates (or the expectation of a rise in interest rates) may result in periods of volatility, decreased liquidity and increased redemptions, and, as a result, the Portfolio may have to liquidate portfolio securities at disadvantageous prices. Risks associated with rising interest rates are heightened given that interest rates in the US and other countries are at or near historic lows.
The Portfolio’s investments in lower-rated, higher-yielding securities (“junk bonds”) are subject to
greater credit risk than its higher rated investments. Credit risk is the risk that the issuer will not make interest or principal payments, or will not make payments on a timely basis. Non-investment grade securities tend to be more volatile, less liquid and are considered speculative. If there is a decline, or perceived decline, in the credit quality of a debt security (or any guarantor of payment on such security), the security’s value could fall, potentially lowering the Portfolio’s share price. The prices of non-investment grade securities, unlike investment grade debt securities, may fluctuate unpredictably and not necessarily inversely with changes in interest rates. The market for these securities may be less liquid and therefore these securities may be harder to value or sell at an acceptable price, especially during times of market volatility or decline.
Some debt securities may give the issuer the option to call, or redeem, the securities before their maturity, and, during a time of declining interest rates, the Portfolio may have to reinvest the proceeds in an investment offering a lower yield (and the Portfolio may not fully benefit from any increase in the value of its portfolio holdings as a result of declining interest rates).
7. Contractual Obligations
The Fund enters into contracts in the normal course of business that contain a variety of indemnifications. A Portfolio’s maximum exposure under these arrangements is unknown. Management has reviewed the Fund’s existing contracts and expects the risk of loss to be remote.
8. Fair Value Measurements
Fair value is defined as the price that a Portfolio would receive to sell an asset, or would pay to transfer a liability, in an orderly transaction between market participants at the date of measurement. The Fair Value Measurements and Disclosures provisions of GAAP also establish a framework for measuring fair value, and a three-level hierarchy for fair value measurement that is based upon the transparency of inputs to the valuation of an asset or liability. Inputs may be observable or unobservable and refer, broadly, to the assumptions that market participants would use in pricing the asset or liability. Observable inputs reflect the assumptions that market participants would use in
| 54 | Semi-Annual Report |
pricing the asset or liability based on market data obtained from sources independent of the Fund. Unobservable inputs reflect the Fund’s own assumptions about the assumptions that market participants would use in pricing the asset or liability, developed based on the best information available in the circumstances. Each investment’s fair value measurement level within the fair value hierarchy is based on the lowest level of any input that is significant to the overall fair value measurement. The three-level hierarchy of inputs is summarized below:
| • | Level 1 – unadjusted quoted prices in active markets for identical investments |
| • | Level 2 – other significant observable inputs (including unadjusted quoted prices for similar investments, interest rates, prepayment speeds, credit risk, etc.) |
| • | Level 3 – significant unobservable inputs (including the Fund’s own assumptions in determining the fair value of investments) |
Changes in valuation technique may result in transfer into or out of the current assigned level within the hierarchy.
The inputs or methodology used for valuing securities are not necessarily an indication of the risks associated with investing in these securities.
The following table summarizes the valuation of the Portfolios’ investments by each fair value hierarchy level as of June 30, 2016:
| Description | Unadjusted Quoted Prices in Active Markets for Identical Investments (Level 1) | Significant Other Observable Inputs (Level 2) | Significant Unobservable Inputs (Level 3) | Balance as of June 30, 2016 | |||||||||||||
| US Strategic Equity Portfolio | |||||||||||||||||
| Common Stocks* | $ | 9,421,598 | $ | — | $ | — | $ | 9,421,598 | |||||||||
| Short-Term Investment | 440,410 | — | — | 440,410 | |||||||||||||
| Total | $ | 9,862,008 | $ | — | $ | — | $ | 9,862,008 | |||||||||
| US Small-Mid Cap Equity Portfolio | |||||||||||||||||
| Common Stocks* | $ | 53,927,203 | $ | — | $ | — | $ | 53,927,203 | |||||||||
| Short-Term Investment | 2,212,382 | — | — | 2,212,382 | |||||||||||||
| Total | $ | 56,139,585 | $ | — | $ | — | $ | 56,139,585 | |||||||||
| International Equity Portfolio | |||||||||||||||||
| Common Stocks* | |||||||||||||||||
| Australia | $ | — | $ | 21,074,019 | $ | — | $ | 21,074,019 | |||||||||
| Belgium | — | 28,023,035 | — | 28,023,035 | |||||||||||||
| Denmark | — | 7,920,197 | — | 7,920,197 | |||||||||||||
| Finland | — | 11,058,464 | — | 11,058,464 | |||||||||||||
| France | — | 49,792,681 | — | 49,792,681 | |||||||||||||
| Germany | — | 4,968,446 | — | 4,968,446 | |||||||||||||
| Ireland | 5,453,536 | 25,720,982 | — | 31,174,518 | |||||||||||||
| Italy | — | 11,122,735 | — | 11,122,735 | |||||||||||||
| Japan | — | 139,976,563 | — | 139,976,563 | |||||||||||||
| Luxembourg | — | 4,809,467 | — | 4,809,467 | |||||||||||||
| Netherlands | — | 37,807,449 | — | 37,807,449 | |||||||||||||
| Norway | — | 9,654,712 | — | 9,654,712 | |||||||||||||
| Philippines | — | 3,146,319 | — | 3,146,319 | |||||||||||||
| Spain | — | 7,282,942 | — | 7,282,942 | |||||||||||||
| Sweden | — | 23,104,447 | — | 23,104,447 | |||||||||||||
| Switzerland | — | 40,021,922 | — | 40,021,922 | |||||||||||||
| Thailand | — | 3,711,984 | — | 3,711,984 | |||||||||||||
| Turkey | — | 7,676,082 | — | 7,676,082 | |||||||||||||
| United Kingdom | — | 86,263,628 | — | 86,263,628 | |||||||||||||
| Other | 83,890,282 | — | — | 83,890,282 | |||||||||||||
| Short-Term Investment | 37,473,652 | — | — | 37,473,652 | |||||||||||||
| Total | $ | 126,817,470 | $ | 523,136,074 | $ | — | $ | 649,953,544 | |||||||||
| Semi-Annual Report | 55 |
| Description | Unadjusted
Quoted Prices in Active Markets for Identical Investments (Level 1) | Significant
Other Observable Inputs (Level 2) | Significant
Unobservable Inputs (Level 3) | Balance
as of June 30, 2016 | |||||||||||||
| Emerging Markets Equity Portfolio | |||||||||||||||||
| Common Stocks* | |||||||||||||||||
| China | $ | 91,003,580 | $ | 73,739,892 | $ | — | $ | 164,743,472 | |||||||||
| Egypt | 514,098 | 8,402,198 | — | 8,916,296 | |||||||||||||
| Hong Kong | — | 4,159,665 | — | 4,159,665 | |||||||||||||
| Hungary | — | 15,304,421 | — | 15,304,421 | |||||||||||||
| India | — | 101,626,587 | — | 101,626,587 | |||||||||||||
| Indonesia | 30,877,504 | 43,044,649 | — | 73,922,153 | |||||||||||||
| Macau | — | 3,083,255 | — | 3,083,255 | |||||||||||||
| Malaysia | — | 6,772,540 | — | 6,772,540 | |||||||||||||
| Pakistan | — | 20,205,622 | — | 20,205,622 | |||||||||||||
| Russia | 15,044,684 | 78,645,051 | — | 93,689,735 | |||||||||||||
| South Africa | 7,558,405 | 72,929,977 | — | 80,488,382 | |||||||||||||
| South Korea | — | 128,813,938 | — | 128,813,938 | |||||||||||||
| Taiwan | — | 56,018,119 | — | 56,018,119 | |||||||||||||
| Thailand | — | 21,947,990 | — | 21,947,990 | |||||||||||||
| Turkey | — | 45,234,036 | — | 45,234,036 | |||||||||||||
| Other | 162,086,531 | — | — | 162,086,531 | |||||||||||||
| Short-Term Investment | 41,909,918 | — | — | 41,909,918 | |||||||||||||
| Total | $ | 348,994,720 | $ | 679,927,940 | $ | — | $ | 1,028,922,660 | |||||||||
| Global Dynamic Multi Asset Portfolio | |||||||||||||||||
| Assets: | |||||||||||||||||
| Common Stocks* | |||||||||||||||||
| Australia | $ | — | $ | 6,130,132 | $ | — | $ | 6,130,132 | |||||||||
| Austria | — | 203,231 | — | 203,231 | |||||||||||||
| Belgium | 1,335,894 | 179,383 | — | 1,515,277 | |||||||||||||
| Denmark | 1,073,444 | 708,053 | — | 1,781,497 | |||||||||||||
| Finland | 870,664 | 590,223 | — | 1,460,887 | |||||||||||||
| France | — | 1,294,774 | — | 1,294,774 | |||||||||||||
| Germany | 1,834,647 | 685,876 | — | 2,520,523 | |||||||||||||
| Hong Kong | 537,973 | 4,183,915 | — | 4,721,888 | |||||||||||||
| Ireland | 1,425,154 | 111,194 | — | 1,536,348 | |||||||||||||
| Israel | 1,162,478 | 428,000 | — | 1,590,478 | |||||||||||||
| Italy | 708,102 | 254,958 | — | 963,060 | |||||||||||||
| Japan | 2,754,129 | 11,318,501 | — | 14,072,630 | |||||||||||||
| Malta | — | 221,950 | — | 221,950 | |||||||||||||
| Netherlands | 1,853,745 | 1,768,914 | — | 3,622,659 | |||||||||||||
| New Zealand | — | 360,050 | — | 360,050 | |||||||||||||
| Norway | — | 2,138,114 | — | 2,138,114 | |||||||||||||
| Portugal | — | 377,261 | — | 377,261 | |||||||||||||
| Singapore | — | 1,743,474 | — | 1,743,474 | |||||||||||||
| South Africa | — | 279,749 | — | 279,749 | |||||||||||||
| Spain | — | 632,493 | — | 632,493 | |||||||||||||
| Sweden | 1,033,260 | 789,894 | — | 1,823,154 | |||||||||||||
| Switzerland | 1,289,077 | 1,776,577 | — | 3,065,654 | |||||||||||||
| United Kingdom | 4,537,481 | 6,035,338 | — | 10,572,819 | |||||||||||||
| Other | 101,457,537 | — | — | 101,457,537 | |||||||||||||
| Corporate Bonds* | — | 25,678,598 | — | 25,678,598 | |||||||||||||
| Foreign Government Obligations* | — | 37,991,168 | — | 37,991,168 | |||||||||||||
| Quasi Government Bonds* | — | 7,045,503 | — | 7,045,503 | |||||||||||||
| Supranationals | — | 4,159,577 | — | 4,159,577 | |||||||||||||
| US Municipal Bonds | — | 1,262,819 | — | 1,262,819 | |||||||||||||
| US Treasury Securities | — | 3,894,225 | — | 3,894,225 | |||||||||||||
| Short-Term Investment | 9,114,789 | — | — | 9,114,789 | |||||||||||||
| Other Financial Instruments** | |||||||||||||||||
| Forward Currency Contracts | — | 1,507,461 | — | 1,507,461 | |||||||||||||
| Total | $ | 130,988,374 | $ | 123,751,405 | $ | — | $ | 254,739,779 | |||||||||
| Liabilities: | |||||||||||||||||
| Other Financial Instruments** | |||||||||||||||||
| Forward Currency Contracts | $ | — | $ | (997,942 | ) | $ | — | $ | (997,942 | ) | |||||||
| * | Please refer to Portfolios of Investments (page 15 through 33) and Notes to Portfolios of Investments (page 35 through 36) for portfolio holdings by country and industry. |
| ** | Other financial instruments are derivative instruments which are valued at their respective unrealized appreciation (depreciation). |
| 56 | Semi-Annual Report |
Certain securities to which footnote (c) in the Notes to Portfolios of Investments apply are included in Level 2 and were valued based on reference to similar securities which were trading on active markets.
In connection with the periodic implementation of fair value pricing procedures with respect to non-US securities (see Note 2(a)), certain equity securities (other than those securities described in footnote (c) in the Notes to Portfolios of Investments) in the International Equity, Emerging Markets Equity and Global Dynamic Multi Asset Portfolios can transfer from Level 1 to Level 2 as a result of fair value pricing procedure triggers being met and would revert to Level 1 when the fair value pricing procedure triggers are no longer met. Accordingly, a significant portion of the Portfolios’ investments are categorized as Level 2 investments. A Portfolio recognizes all transfers between levels as though they were transferred at the beginning of the reporting period.
At June 30, 2016, securities valued at the following amounts were transferred from Level 2 to Level 1:
| Portfolio | Amount | ||||
| International Equity | $ | 4,577,992 | |||
| Emerging Markets Equity | 62,990,444 | ||||
There were no other transfers into or out of Levels 1, 2 or 3 during the period ended June 30, 2016.
For further information regarding security characteristics see Portfolios of Investments.
9. Derivative Instruments
Certain Portfolios may use derivative instruments, including forward currency contracts.
Forward currency contracts may be used for hedging purposes or to seek to increase returns.
Global Dynamic Multi Asset Portfolio
During the period ended June 30, 2016, the approximate average monthly notional exposure for derivative instruments was as follows:
| Forward currency contracts | $73,300,000 |
The following table summarizes the fair value of derivative instruments on the Statement of Assets and Liabilities as of June 30, 2016:
| Fair Value | |||||
| Asset Derivatives | |||||
| Foreign Exchange Risk: | |||||
| Gross unrealized appreciation on forward currency contracts | $ | 1,507,461 | |||
| Liability Derivatives | |||||
| Foreign Exchange Risk: | |||||
| Gross unrealized depreciation on forward currency contracts | $ | 997,942 | |||
The effect of derivative instruments on the Statement of Operations for the period ended June 30, 2016 was:
| Amount | |||||
| Realized Gain (Loss) on Derivatives | |||||
| Foreign Exchange Risk: | |||||
| Net realized gain (loss) on foreign currency transactions and forward currency contracts | $ | 989,672 | |||
| Net Change in Unrealized Appreciation (Depreciation) on Derivatives | |||||
| Foreign Exchange Risk: | |||||
| Net change in unrealized appreciation (depreciation) on foreign currency translations and forward currency contracts | $ | 74,102 | |||
See Note 2(c) and the Portfolios of Investments for additional disclosures about derivative instruments.
None of the other Portfolios presented traded in derivative instruments during the period ended June 30, 2016.
As of June 30, 2016, Global Dynamic Multi Asset Portfolio holds derivative instruments that are eligible for offset in the Statement of Assets and Liabilities and are subject to master netting arrangements. A master netting arrangement is an agreement between two counterparties who have multiple contracts with each other that provides for the net settlement of all contracts, as well as any cash collateral, through a single payment in the event of default on, or termination of, any one contract.
| Semi-Annual Report | 57 |
The required information for the affected Portfolio is presented in the below table, as of June 30, 2016:
Global Dynamic Multi Asset Portfolio
| Description | Gross
Amounts of Recognized Assets |
Gross
Amounts Offset in the Statement of Assets and Liabilities |
Net
Amounts of Assets Presented in the Statement of Assets and Liabilities |
|||||
| Forward Currency Contracts | $1,507,461 | $ — | $1,507,461 | |||||
| Amounts Not Offset in the Statement of Assets and Liabilities | ||||||||||||||||||
| Counterparty | Net
Amounts of Assets Presented in the Statement of Assets and Liabilities |
Financial Instruments | Collateral Received | Net Amounts | ||||||||||||||
| Citibank NA | $ | 704,262 | $ | (279,203 | ) | $ | — | $ | 425,059 | |||||||||
| HSBC Bank USA NA | 699,892 | (465,979 | ) | — | 233,913 | |||||||||||||
| JPMorgan Chase Bank NA | 26,669 | (3,698 | ) | — | 22,971 | |||||||||||||
| Royal Bank of Canada | 29,883 | (4,479 | ) | — | 25,404 | |||||||||||||
| Standard Chartered Bank | 16,403 | (16,403 | ) | — | — | |||||||||||||
| State Street Bank and Trust Co. | 30,352 | (30,352 | ) | — | — | |||||||||||||
| Total | $ | 1,507,461 | $ | (800,114 | ) | $ | — | $ | 707,347 | |||||||||
| Description | Gross
Amounts of Recognized Liabilities |
Gross
Amounts Offset in the Statement of Assets and Liabilities |
Net
Amounts of Liabilities Presented in the Statement of Assets and Liabilities |
|||||
| Forward Currency Contracts | $997,942 | $ — | $997,942 | |||||
| Amounts Not Offset in the Statement of Assets and Liabilities | ||||||||||||||||||
| Counterparty | Net
Amounts of Liabilities Presented in the Statement of Assets and Liabilities | Financial Instruments | Collateral Pledged | Net Amounts | ||||||||||||||
| Canadian Imperial Bank of Commerce | $ | 169,789 | $ | — | $ | — | $ | 169,789 | ||||||||||
| Citibank NA | 279,203 | (279,203 | ) | — | — | |||||||||||||
| HSBC Bank USA NA | 465,979 | (465,979 | ) | — | — | |||||||||||||
| JPMorgan Chase Bank NA | 3,698 | (3,698 | ) | — | — | |||||||||||||
| Royal Bank of Canada | 4,479 | (4,479 | ) | — | — | |||||||||||||
| Standard Chartered Bank | 36,884 | (16,403 | ) | — | 20,481 | |||||||||||||
| State Street Bank and Trust Co. | 37,910 | (30,352 | ) | — | 7,558 | |||||||||||||
| Total | $ | 997,942 | $ | (800,114 | ) | $ | — | $ | 197,828 | |||||||||
10. Subsequent Events
Management has evaluated subsequent events affecting the Fund through the issuance of the finan-
cial statements and has determined that there were no subsequent events that required adjustment or disclosure.
| 58 | Semi-Annual Report |
Lazard Retirement Series, Inc. Board of Directors and Officers Information (unaudited)
| Name
(Age) Address(1) |
Position(s)
with the Fund (Since) and Term(2) |
Principal
Occupation(s) and Other Public Company Directorships Held During the Past Five Years(2) | ||
| Independent Directors(3): | ||||
| Franci J. Blassberg (62) | Director (August 2014) |
Debevoise & Plimpton LLP, a law firm, Of Counsel (2013 – present); previously, Partner (through 2012)
Cornell Law School, Visiting Professor of Practice (2015 – present); previously, Distinguished Practitioner in Residence (Fall 2013 and Fall 2014) | ||
| Kenneth S. Davidson (71) | Director (April 1997) |
Davidson Capital Management Corporation, an investment manager, President (1978 – present)
Landseer Advisors LLC, an investment manager, Senior Advisor (2012 – 2014)
Aquiline Holdings LLC, an investment manager, Partner (2006 – 2012) | ||
| Nancy A. Eckl (53) | Director (May 2007) |
College Retirement Equities Fund (eight accounts), Trustee (2007 – present)
TIAA-CREF Funds (67 funds) and TIAA-CREF Life Funds (11 funds), Trustee (2007 – present)
TIAA Separate Account VA-1, Member of the Management Committee (2007 – present)
American Beacon Advisors, Inc. (“American Beacon”) and certain funds advised by American Beacon, Vice President (1990 – 2006) | ||
| Trevor W. Morrison (45) | Director (April 2014) |
New York University School of Law, Dean and Eric M. and Laurie B. Roth Professor of Law (2013 – present)
Columbia Law School, Professor of Law (2008 – 2013) | ||
| Richard Reiss, Jr. (72) |
Director (April 1997) |
Georgica Advisors LLC, an investment manager, Chairman (1997 – present)
Resource Americas, Inc., a real estate asset management company, Director (2016 – present)
O’Charley’s, Inc., a restaurant chain, Director (1984 – 2012) | ||
| Robert M. Solmson (68) | Director (September 2004) |
Fairwood Capital, LLC, a private investment corporation engaged primarily in real estate and hotel investments, President (2008 – present) | ||
| Semi-Annual Report | 59 |
| Name
(Age) Address(1) |
Position(s)
with the Fund (Since) and Term(2) |
Principal
Occupation(s) and Other Public Company Directorships Held During the Past Five Years(2) | ||
| Interested Directors(4): | ||||
| Charles L. Carroll (55) | Chief Executive Officer, President and Director (June 2004) |
Investment Manager, Deputy Chairman and Head of Global Marketing (2004 – present) | ||
| Ashish Bhutani (56) | Director (July 2005) |
Investment Manager, Chief Executive Officer (2004 – present)
Lazard Ltd, Vice Chairman and Director (2010 – present) | ||
| (1) | The address of each Director of the Fund is Lazard Asset Management LLC, 30 Rockefeller Plaza, New York, New York 10112-6300. |
| (2) | Each Director serves as a Director for each of the funds in the Lazard Fund Complex (comprised of, as of July 31, 2016, 40 active investment portfolios). Each Director serves an indefinite term, until his or her successor is elected, and each Director serves in the same capacity for the other funds in the Lazard Fund Complex. |
| (3) | “Independent Directors” are not “interested persons” (as defined in the 1940 Act) of the Fund. |
| (4) | Messrs. Bhutani and Carroll are “interested persons” (as defined in the 1940 Act) of the Fund because of their positions with the Investment Manager. |
The Fund’s Statement of Additional Information contains further information about the Directors and is available without charge by calling 800-823-6300, or online, at www.LazardNet.com.
| 60 | Semi-Annual Report |
| Name
(Age) Address(1) |
Position(s)
with the Fund (Since) and Term(2) |
Principal Occupation(s) During the Past Five Years | ||
| Officers(3): | ||||
| Nathan A. Paul (43) | Vice President and Secretary (April 2002) |
Managing Director and General Counsel of the Investment Manager | ||
| Christopher Snively (31) | Chief Financial Officer (March 2016) |
Senior Vice President of the Investment Manager (since November 2015)
Assurance Manager at PricewaterhouseCoopers LLP (2008 – November 2015) | ||
| Stephen St. Clair (57) | Treasurer (May 2003) |
Vice President of the Investment Manager | ||
| Mark R. Anderson (46) | Chief Compliance Officer (September 2014) |
Director and Chief Compliance Officer of the Investment Manager (since September 2014)
Senior Vice President, Counsel and Deputy Chief Compliance Officer of AllianceBernstein L.P. (2004 – August 2014) | ||
| Tamar Goldstein (41) | Assistant Secretary (February 2009) |
Director (since February 2016, previously Senior Vice President), and Director of Legal Affairs (since July 2015) of the Investment Manager | ||
| Shari L. Soloway (34) | Assistant Secretary (November 2015) |
Senior Vice President, Legal and Compliance, of the Investment Manager (since September 2015)
Vice President and Associate General Counsel of GE Asset Management (July 2011 – September 2015)
Associate at Clifford Chance US LLP (2006 – July 2011) | ||
| Cesar A. Trelles (41) | Assistant Treasurer (December 2004) |
Vice President of the Investment Manager |
| (1) | The address of each officer of the Fund is Lazard Asset Management LLC, 30 Rockefeller Plaza, New York, New York 10112-6300. |
| (2) | Each officer serves for an indefinite term, until his or her successor is elected and qualifies or until his or her earlier resignation or removal. Each officer serves in the same capacity for the other funds in the Lazard Fund Complex. |
| (3) | In addition to Charles L. Carroll, President, whose information is included in the Interested Directors section. |
| Semi-Annual Report | 61 |
Lazard Retirement Series, Inc. Other Information (unaudited)
Proxy Voting
A description of the policies and procedures used to determine how proxies relating to Fund portfolio securities are voted is available (1) without charge, upon request, by calling (800) 823-6300 or (2) on the Securities and Exchange Commission (the “SEC”) website at http://www.sec.gov.
The Fund’s proxy voting record for the most recent 12-month period ended June 30 is available (1) without charge, upon request, by calling (800) 823-6300 or (2) on the SEC’s website at http://www.sec.gov. Information as of June 30 each year will generally be available by the following August 31.
Form N-Q
The Fund files a complete schedule of each Portfolio’s holdings for the first and third quarters of its fiscal year with the SEC on Form N-Q. The Fund’s Forms N-Q are available on the SEC’s website at http://www.sec.gov and may be reviewed and copied at the SEC’s Public Reference Room in Washington, D.C. Information on the operation of the SEC’s Public Reference Room may be obtained by calling 1-800-SEC-0330.
Board Consideration of Management Agreement
All Portfolios except Lazard Retirement Emerging Markets Equity Advantage Portfolio, Lazard Retirement International Equity Advantage Portfolio, Lazard Retirement International Equity Concentrated Portfolio and Lazard Retirement Managed Equity Volatility Portfolio
At a meeting of the Board held on June 28-29, 2016, the Board considered the approval, for an additional annual period, of the Management Agreement between the Fund, on behalf of the Portfolios, and the Investment Manager. The Independent Directors were assisted in their review by independent legal counsel, who advised the Board on relevant legal standards and met with the Independent Directors in executive session separate from representatives of the Investment Manager.
Services Provided
Representatives of the Investment Manager discussed with the Board the Investment Manager’s written presentation provided in advance of the meeting
addressing, among other matters, the nature, extent and quality of services that the Investment Manager provides the Fund, including a discussion of the Investment Manager and its clients (of which the Lazard Funds complex of 40 active funds comprised approximately $28 billion (as of April 30, 2016) of the approximately $191 billion of total assets under the management of the Investment Manager and its global affiliates as of March 31, 2016). The Investment Manager’s representatives noted that the Investment Manager believes that the Fund and its shareholders continue to be able to obtain significant benefits as a result of the resources and support of the Investment Manager’s global research, portfolio management, operations, technology, legal and compliance and marketing infrastructure. The Directors also considered information provided by the Investment Manager regarding its personnel, resources, financial condition and experience; the Fund’s distribution channels and the relationships with various intermediaries; marketing activities on behalf of the Portfolios; and Portfolio asset flows and the growth or decline in asset levels.
The Directors considered the various services provided by the Investment Manager including the Investment Manager’s research and portfolio management capabilities and oversight of day-to-day operations, including supervision of fund accounting and administration-related services and assistance in meeting legal and regulatory requirements. The Directors also considered the Investment Manager’s infrastructure and agreed that the Fund benefits from the services and infrastructure provided by the Investment Manager. The Directors accepted management’s assertion that such services and infrastructure are greater than those typically provided to a $28 billion fund complex not managed by a large, global firm such as the Investment Manager.
Comparative Fee, Expense Ratio and Performance Information
The Directors reviewed comparative fee, expense ratio and performance (through March 31, 2016) information prepared by Strategic Insight, noting the limitations of certain Strategic Insight comparison groups (each, a “Group”) and broader Morningstar categories (each, a “Category”). Strategic Insight’s analyses were for the Service Shares class of each Portfolio
| 62 | Semi-Annual Report |
except for the Emerging Markets Equity Portfolio, which has both Service Shares and Investor Shares classes outstanding.
Advisory Fees and Expense Ratios. The Directors discussed the management fees paid to the Investment Manager (referred to in the Strategic Insight materials as “advisory fees”) and expense ratios for each Portfolio. They noted the methodology and assumptions used by Strategic Insight. The Directors considered that the Investment Manager continues to voluntarily enter into fee waiver and expense reimbursement agreements for all of the active Portfolios and that for certain of these Portfolios the Investment Manager was waiving advisory fees and/or reimbursing expenses.
Except for the Capital Allocator Opportunistic Strategies, Enhanced Opportunities, Fundamental Long/Short, Global Dynamic Multi Asset, Global Listed Infrastructure, Global Strategic Equity and US Strategic Equity Portfolios (of which only the Global Dynamic Multi Asset and US Strategic Equity Portfolios are active), the current gross advisory fee was at or lower than the Portfolio’s relevant Group median. It was noted that the Investment Manager proposed to lower the advisory fee for the Global Dynamic Multi Asset Portfolio by five basis points, which would bring the fee closer to the median, and that, for the US Strategic Equity Portfolio, the gross advisory fee was only one tenth of a basis point above the median.
For the active Portfolios, total expenses were at or below the median of the relevant Group, except for the Global Dynamic Multi Asset Portfolio (only nine basis points above the median), the US Small-Mid Cap Equity Portfolio and the Emerging Markets Equity Portfolio (Investor Shares total expenses less than two basis points above the Group median).
The Directors also considered fees paid to the Investment Manager by funds advised or sub-advised by the Investment Manager utilizing the same investment strategies as the Portfolios, as well as the Investment Manager’s separately managed accounts with similar investment objectives, policies and strategies (for each Portfolio, collectively with such funds, “Similar Accounts”). The Directors discussed the fees paid to the Investment Manager by the Fund’s Portfolios compared to the fees paid to the Investment Manager by
Similar Accounts. Representatives of the Investment Manager discussed the nature of the Similar Accounts and the extensive differences, from the Investment Manager’s perspective, in services provided to the different types of Similar Accounts as compared to the services provided to the Portfolios. The Directors considered the relevance of the fee information provided for Similar Accounts managed by the Investment Manager, in light of the significant differences in services provided, to evaluate the fees paid to the Investment Manager by the Portfolios.
Performance. Strategic Insight’s performance analyses compared each Portfolio’s investment returns to those of the funds in the relevant Group and Category over one-, three-, five- and ten-year periods ended March 31, 2016 (as applicable).
The Directors noted that performance of the International Equity Portfolio was above the Group and Category averages in all periods; US Small-Mid Cap Equity Portfolio was generally below the Group average and generally above the Category average in all periods; the Emerging Markets Equity Portfolio was below the Group and Category averages for the one- and three-year periods (except for the one-year period where Investor Shares were slightly above the Category average) and above the averages for all other periods; the US Strategic Equity Portfolio was below the Group and Category averages in all periods; and the Global Dynamic Multi Asset Portfolio was above the Group and Category averages in all periods.
At the meeting, the Directors received and would continue to receive regular updates on the Investment Manager’s efforts in respect of underperforming Portfolios.
Investment Manager Profitability and Economies of Scale
The Directors reviewed information prepared by the Investment Manager for each Portfolio concerning profits realized by the Investment Manager and its affiliates resulting from the Management Agreement, calculated using the actual revenues received for the calendar year ended December 31, 2015 and the Investment Manager’s cost allocation methodology to compute an estimate of each Portfolio’s costs to the Investment Manager. The Investment Manager’s rep-
| Semi-Annual Report | 63 |
resentatives stated that neither the Investment Manager nor its affiliates receive any significant indirect benefits from the Investment Manager acting as investment adviser to the Portfolios. The Investment Manager’s representatives reviewed with the Board information provided on the Investment Manager’s brokerage practices and the Portfolios’ brokerage allocation, commission payments and soft dollar commissions and benefits. The representatives of the Investment Manager reminded the Board that the Investment Manager is continuing to support distribution relationships through direct payments from its or its affiliates’ own resources to third parties in connection with distribution and shareholder servicing and/or administrative and recordkeeping services, and noted that the Fund does not bear any related costs other than the 0.25% 12b-1 fee pursuant to the Distribution and Servicing Plan adopted for the Portfolios’ Service Shares.
The profitability percentages were within ranges determined by relevant court cases not to be so disproportionately large that they bore no reasonable relationship to the services rendered. Representatives of the Investment Manager stated that the Investment Manager believed the profits are not unreasonable in light of the services provided and other factors. The Directors considered the Investment Manager’s estimated profitability with respect to each Portfolio as part of their evaluation of whether the Portfolio’s fee under the Management Agreement, considered in relation to the mix of services provided by the Investment Manager, including the nature, extent and quality of such services, and evaluated profitability in light of the relevant circumstances for each Portfolio, including the size of each Portfolio and the trend in asset growth or decline, supported the renewal of the Management Agreement. Representatives of the Investment Manager and the Directors discussed ways economies of scale could be realized and how they could be shared, including the Investment Manager’s reinvestment of money back into its business, waiving or reimbursing Portfolio management fees and expenses (including for some Portfolios amending the Management Agreement to lower contractual management fees), adding discounts to a Portfolio’s management fee schedule as a Portfolio’s assets increase or by instituting relatively low management
fees from inception. It was noted that, for Portfolios with declining or stable assets or a low level of assets, the extent to which the Investment Manager may have realized any economies of scale would be reduced.
At the conclusion of these discussions, each of the Directors expressed the opinion that he or she had been furnished with such information as may reasonably be necessary to make an informed business decision with respect to evaluation of the renewal of the Management Agreement. Based on its discussions and considerations as described above, the Board made the following conclusions and determinations.
| • | The Board concluded that the nature, extent and quality of the services provided by the Investment Manager are adequate and appropriate, noting the benefits of advisory and research services and other services and infrastructure (as discussed above) associated with an approximately $191 billion global asset management business. |
| • | The Board was generally satisfied with the overall performance of most of the Portfolios, either because relative performance in the Group and/or Category was satisfactory or performance was otherwise consistent with the investment approach employed for a Portfolio. For certain Portfolios that were not performing in accordance with expectations, the Board would continue to monitor performance. |
| • | The Board concluded that each Portfolio’s fee paid to the Investment Manager supported the renewal of the Management Agreement in light of the considerations discussed above. |
| • | The Board recognized that economies of scale may be realized as the assets of the Portfolios increase and determined that they would continue to consider potential material economies of scale. |
In evaluating the Management Agreement, the Board relied on the information described above as well as other information provided by the Investment Manager, in addition to information received on a routine and regular basis throughout the year relating to the
| 64 | Semi-Annual Report |
operations of the Fund and the investment management and other services provided under the Management Agreement, including information on the investment performance of the Portfolios in comparison to similar mutual funds and benchmark performance indices; general market outlook as applicable to the Portfolios; and compliance reports. The Board also relied on its previous knowledge, gained through meetings and other interactions with the Investment Man-
ager, of the Fund and the services provided to the Fund by the Investment Manager. The Board considered these conclusions and determinations in their totality and determined to approve the Fund’s Management Agreement for each Portfolio. In deciding whether to vote to approve the Management Agreement for each Portfolio, each Director may have accorded different weights to different factors so that each Director may have had a different basis for his or her decision.
| Semi-Annual Report | 65 |
NOTES
NOTES
| Lazard Retirement Series, Inc. |
| 30 Rockefeller Plaza |
| New York, New York 10112-6300 |
| Telephone: 800-823-6300 |
| http://www.LazardNet.com |
| Investment Manager |
| Lazard Asset Management LLC |
| 30 Rockefeller Plaza |
| New York, New York 10112-6300 |
| Telephone: 800-823-6300 |
| Distributor |
| Lazard Asset Management Securities LLC |
| 30 Rockefeller Plaza |
| New York, New York 10112-6300 |
| Custodian |
| State Street Bank and Trust Company |
| One Iron Street |
| Boston, Massachusetts 02210 |
| Transfer Agent and Dividend Disbursing Agent |
| Boston Financial Data Services, Inc. |
| P.O. Box 8514 |
| Boston, Massachusetts 02266-8514 |
| Telephone: 800-986-3455 |
| Independent Registered Public Accounting Firm |
| Deloitte & Touche LLP |
| 30 Rockefeller Plaza |
| New York, New York 10112-0015 |
| Legal Counsel |
| Stroock & Stroock & Lavan LLP |
| 180 Maiden Lane |
| New York, New York 10038-4982 |
| http://www.stroock.com |
![]()
Performance information as of the most recent month end is available online at www.LazardNet.com.
| Lazard Asset Management LLC • 30 Rockefeller Plaza • New York NY 10112 • www.lazardnet.com |  |
LZDPS010
ITEM 2. CODE OF ETHICS.
Not applicable.
ITEM 3. AUDIT COMMITTEE FINANCIAL EXPERT.
Not applicable.
ITEM 4. PRINCIPAL ACCOUNTANT FEES AND SERVICES.
Not applicable.
ITEM 5. AUDIT COMMITTEE OF LISTED REGISTRANTS.
Not applicable.
ITEM 6. INVESTMENTS
Not applicable.
ITEM 7. DISCLOSURE OF PROXY VOTING POLICIES AND PROCEDURES FOR CLOSED END MANAGEMENT INVESTMENT COMPANIES.
Not applicable.
ITEM 8. PORTFOLIO MANAGERS OF CLOSED-END MANAGEMENT INVESTMENT COMPANIES.
Not applicable.
ITEM 9. PURCHASES OF EQUITY SECURITIES BY CLOSED-END MANAGEMENT INVESTMENT COMPANY AND AFFILIATED PURCHASERS.
Not applicable.
ITEM 10. SUBMISSION OF MATTERS TO A VOTE OF SECURITY HOLDERS.
There were no material changes to the procedures by which shareholders may recommend nominees to the Registrant’s Board of Directors during the period covered by this report.
ITEM 11. CONTROLS AND PROCEDURES.
(a) The Registrant’s principal executive and principal financial officers have concluded, based on their evaluation of the Registrant’s disclosure controls and procedures as of a date within 90 days of the filing date of this report, that the Registrant’s disclosure controls and procedures are reasonably designed to ensure that information required to be disclosed by the Registrant on Form N-CSR is recorded, processed, summarized and reported within the required time periods and that information required to be disclosed by the Registrant in the reports that it files or submits on Form N-CSR is accumulated and communicated to the Registrant’s management, including its principal executive and principal financial officers, as appropriate to allow timely decisions regarding required disclosure.
(b) There were no changes to the Registrant’s internal control over financial reporting that occurred during the second fiscal quarter of the period covered by this report that have materially affected, or are reasonably likely to materially affect, the Registrant’s internal control over financial reporting.
ITEM 12. EXHIBITS.
(a)(1) Not applicable.
(a)(2) Certifications of principal executive and principal financial officers as required by Rule 30a-2(a) under the Investment Company Act of 1940.
(a)(3) Not applicable.
(b) Certifications of principal executive and principal financial officers as required by Rule 30a-2(b) under the Investment Company Act of 1940.
SIGNATURES
Pursuant to the requirements of the Securities Exchange Act of 1934 and the Investment Company Act of 1940, the registrant has duly caused this report to be signed on its behalf by the undersigned, thereunto duly authorized.
Lazard Retirement Series, Inc.
| By | /s/ Charles L. Carroll |
| Charles L. Carroll | |
| Chief Executive Officer | |
| Date | September 6, 2016 |
Pursuant to the requirements of the Securities Exchange Act of 1934 and the Investment Company Act of 1940, this report has been signed below by the following persons on behalf of the registrant and in the capacities and on the dates indicated.
| By | /s/ Charles L. Carroll |
| Charles L. Carroll | |
| Chief Executive Officer |
| Date | September 6, 2016 |
| By | /s/ Christopher Snively |
| Christopher Snively | |
| Chief Financial Officer | |
| Date | September 6, 2016 |
Exhibit (a)(2)
Rule 30a-2(a) CERTIFICATIONS
I, Charles L. Carroll, certify that:
1. I have reviewed this report on Form N-CSR of Lazard Retirement Series, Inc.;
2. Based on my knowledge, this report does not contain any untrue statement of a material fact or omit to state a material fact necessary to make the statements made, in light of the circumstances under which such statements were made, not misleading with respect to the period covered by this report;
3. Based on my knowledge, the financial statements, and other financial information included in this report, fairly present in all material respects the financial condition, results of operations, changes in net assets, and cash flows (if the financial statements are required to include a statement of cash flows) of the Registrant as of, and for, the periods presented in this report;
4. The Registrant’s other certifying officer(s) and I are responsible for establishing and maintaining disclosure controls and procedures (as defined in Rule 30a-3(c) under the Investment Company Act of 1940) and internal control over financial reporting (as defined in Rule 30a-3(d) under the Investment Company Act of 1940) for the Registrant and have:
(a) Designed such disclosure controls and procedures, or caused such disclosure controls and procedures to be designed under our supervision, to ensure that material information relating to the Registrant, including its consolidated subsidiaries, is made known to us by others within those entities, particularly during the period in which this report is being prepared;
(b) Designed such internal control over financial reporting, or caused such internal control over financial reporting to be designed under our supervision, to provide reasonable assurance regarding the reliability of financial reporting and the preparation of financial statements for external purposes in accordance with generally accepted accounting principles;
(c) Evaluated the effectiveness of the Registrant’s disclosure controls and procedures and presented in this report our conclusions about the effectiveness of the disclosure controls and procedures, as of a date within 90 days prior to the filing date of this report based on such evaluation; and
(d) Disclosed in this report any change in the Registrant’s internal control over financial reporting that occurred during the Registrant’s second fiscal quarter of the period covered by this report that has materially affected, or is reasonably likely to materially affect, the Registrant’s internal control over financial reporting; and
5. The Registrant’s other certifying officer(s) and I have disclosed to the Registrant’s auditors and the audit committee of the Registrant’s board of directors (or persons performing the equivalent functions):
(a) All significant deficiencies and material weaknesses in the design or operation of internal control over financial reporting which are reasonably likely to adversely affect the Registrant’s ability to record, process, summarize, and report financial information; and
(b) Any fraud, whether or not material, that involves management or other employees who have a significant role in the Registrant’s internal control over financial reporting.
Date: September 6, 2016
/s/ Charles L. Carroll
Charles L. Carroll
Chief Executive Officer
Rule 30a-2(a) CERTIFICATIONS
I, Christopher Snively, certify that:
1. I have reviewed this report on Form N-CSR of Lazard Retirement Series, Inc.;
2. Based on my knowledge, this report does not contain any untrue statement of a material fact or omit to state a material fact necessary to make the statements made, in light of the circumstances under which such statements were made, not misleading with respect to the period covered by this report;
3. Based on my knowledge, the financial statements, and other financial information included in this report, fairly present in all material respects the financial condition, results of operations, changes in net assets, and cash flows (if the financial statements are required to include a statement of cash flows) of the Registrant as of, and for, the periods presented in this report;
4. The Registrant’s other certifying officer(s) and I are responsible for establishing and maintaining disclosure controls and procedures (as defined in Rule 30a-3(c) under the Investment Company Act of 1940) and internal control over financial reporting (as defined in Rule 30a-3(d) under the Investment Company Act of 1940) for the Registrant and have:
(a) Designed such disclosure controls and procedures, or caused such disclosure controls and procedures to be designed under our supervision, to ensure that material information relating to the Registrant, including its consolidated subsidiaries, is made known to us by others within those entities, particularly during the period in which this report is being prepared;
(b) Designed such internal control over financial reporting, or caused such internal control over financial reporting to be designed under our supervision, to provide reasonable assurance regarding the reliability of financial reporting and the preparation of financial statements for external purposes in accordance with generally accepted accounting principles;
(c) Evaluated the effectiveness of the Registrant’s disclosure controls and procedures and presented in this report our conclusions about the effectiveness of the disclosure controls and procedures, as of a date within 90 days prior to the filing date of this report based on such evaluation; and
(d) Disclosed in this report any change in the Registrant’s internal control over financial reporting that occurred during the Registrant’s second fiscal quarter of the period covered by this report that has materially affected, or is reasonably likely to materially affect, the Registrant’s internal control over financial reporting; and
5. The Registrant’s other certifying officer(s) and I have disclosed to the Registrant’s auditors and the audit committee of the Registrant’s board of directors (or persons performing the equivalent functions):
(a) All significant deficiencies and material weaknesses in the design or operation of internal control over financial reporting which are reasonably likely to adversely affect the Registrant’s ability to record, process, summarize, and report financial information; and
(b) Any fraud, whether or not material, that involves management or other employees who have a significant role in the Registrant’s internal control over financial reporting.
Date: September 6, 2016
/s/ Christopher Snively
Christopher Snively
Chief Financial Officer
Exhibit (b)
SECTION 906 CERTIFICATIONS
In connection with this report on Form N-CSR for the Registrant as furnished to the Securities and Exchange Commission on the date hereof (the "Report"), the undersigned hereby certify, pursuant to Section 906 of the Sarbanes-Oxley Act of 2002, that:
(1) the Report fully complies with the requirements of Section 13(a) or 15(d) of the Securities Exchange Act of 1934, as applicable; and
(2) the information contained in the Report fairly presents, in all material respects, the financial condition and results of operations of the Registrant.
| By: | /s/ Charles L. Carroll | |
| Charles L. Carroll | ||
| Chief Executive Officer | ||
| Date: | September 6, 2016 | |
| By: | /s/ Christopher Snively | |
| Christopher Snively | ||
| Chief Financial Officer | ||
| Date: | September 6, 2016 |
This certificate is furnished pursuant to the requirements of Form N-CSR and shall not be deemed "filed" for purposes of Section 18 of the Securities Exchange Act of 1934, or otherwise subject to the liability of that section, and shall not be deemed to be incorporated by reference into any filing under the Securities Act of 1933 or the Securities Exchange Act of 1934.
Serious News for Serious Traders! Try StreetInsider.com Premium Free!
You May Also Be Interested In
- Great Lakes Dredge & Dock (GLDD) Announces $150M Second-Lien Financing Agreement
- CEL-SCI Corp (CVM) Appoints Mario Gobbo to Its Board
Create E-mail Alert Related Categories
SEC FilingsRelated Entities
LazardSign up for StreetInsider Free!
Receive full access to all new and archived articles, unlimited portfolio tracking, e-mail alerts, custom newswires and RSS feeds - and more!
