

Form N-CSRS AMERICAN FUNDS DEVELOPIN For: May 31
 Tweet
Tweet Share
Share
UNITED STATES
SECURITIES AND EXCHANGE COMMISSION
Washington, D.C. 20549
FORM N-CSR
Certified Shareholder Report of
Registered Management Investment Companies
Investment Company Act File Number: 811-22881
American Funds Developing World Growth and Income Fund
(Exact Name of Registrant as Specified in Charter)
6455 Irvine Center Drive
Irvine, California 92618
(Address of Principal Executive Offices)
Registrant's telephone number, including area code: (213) 486-9200
Date of fiscal year end: November 30
Date of reporting period: May 31, 2016
Michael W. Stockton
American Funds Developing World Growth and Income Fund
333 South Hope Street
Los Angeles, California 90071
(Name and Address of Agent for Service)
ITEM 1 – Reports to Stockholders
![]()
 |
American Funds
Semi-annual report |
American Funds Developing World Growth and Income Fund seeks to provide long-term growth of capital while providing current income.
This fund is one of more than 40 offered by one of the nation’s largest mutual fund families, American Funds, from Capital Group. For 85 years, Capital has invested with a long-term focus based on thorough research and attention to risk.
Fund results shown in this report, unless otherwise indicated, are for Class A shares at net asset value. If a sales charge (maximum 5.75%) had been deducted, the results would have been lower. Results are for past periods and are not predictive of results for future periods. Current and future results may be lower or higher than those shown. Share prices and returns will vary, so investors may lose money. Investing for short periods makes losses more likely. Investments are not FDIC-insured, nor are they deposits of or guaranteed by a bank or any other entity, so they may lose value. For current information and month-end results, visit americanfunds.com.
Here are the total returns on a $1,000 investment with all distributions reinvested for the periods ended June 30, 2016 (the most recent calendar quarter-end):
| Class A shares | 1 year | Lifetime (since 2/3/14) | ||
| Reflecting 5.75% maximum sales charge | –13.67% | –4.66% |
The total annual fund operating expense ratio was 1.32% for Class A shares as of the prospectus dated February 1, 2016.
Investment results assume all distributions are reinvested and reflect applicable fees and expenses. When applicable, investment results reflect fee waivers and expense reimbursements, without which results would have been lower. Visit americanfunds.com for more information.
The fund’s 30-day yield for Class A shares as of June 30, 2016, reflecting the 5.75% maximum sales charge and calculated in accordance with the U.S. Securities and Exchange Commission formula, was 1.92%.
Investing in developing markets involves risks, such as significant currency and price fluctuations, political instability, differing securities regulations and periods of illiquidity, which are detailed in the fund’s prospectus. Investments in developing markets have been more volatile than investments in developed markets, reflecting the greater uncertainties of investing in less established economies. Individuals investing in developing markets should have a long-term perspective and be able to tolerate potentially sharp declines in the value of their investments. Refer to the fund prospectus and the Risk Factors section of this report for more information on these and other risks associated with investing in the fund.
Fellow investors:
Stock markets were volatile during the first half of American Funds Developing World Growth and Income Fund’s fiscal year. Sentiment zigzagged as investors weighed the impact of China’s economic slowdown, global stimulus measures and shifting commodity prices.
Against this backdrop, the fund gained 1.89% with dividends reinvested for the six months ended May 31, 2016, outpacing the 0.04% return of the MSCI Emerging Markets Index, which measures markets in more than 20 developing countries. The Lipper Emerging Markets Funds Index, a peer group, climbed 1.26%. For those shareholders taking dividends in cash, the return was 1.38%.
Market review
After a selloff in the first two months of the period, emerging markets rallied before tailing off in May. Equity returns varied dramatically by country, while most currencies appreciated against the U.S. dollar.
Stocks in Brazil staged a major comeback after several years of poor returns. The MSCI Brazil Index1 surged 16.28%, fueled by expectations that President Dilma Rousseff would be impeached and the change in leadership would spur much-needed reforms in Latin America’s biggest economy. Rousseff was suspended from office in mid-May and replaced by her vice president, Michel Temer. A recovery in oil and iron ore prices further aided Brazilian equities. The country’s currency rose 9% against the dollar. Elsewhere in Latin America, Mexican stocks lost 5.32% as lower oil prices weighed on the country’s growth prospects and prompted government budget cuts. The peso depreciated nearly 10% against the greenback.
| 1 | Unless otherwise indicated, equity and country stock returns are based on MSCI indexes and measured in U.S. dollars with net dividends reinvested. |
Results at a glance
For periods ended May 31, 2016, with all distributions reinvested
| Cumulative total returns |
Average annual total returns | |||||||||||
| 6 months | 1 year | Lifetime (since 2/3/14) | ||||||||||
| American Funds Developing World Growth and Income Fund (Class A shares) | 1.89 | % | –14.85 | % | –3.99 | % | ||||||
| MSCI Emerging Markets Index* | 0.04 | –17.63 | –3.52 | |||||||||
| Lipper Emerging Markets Funds Index† | 1.26 | –14.59 | –2.32 | |||||||||
| * | The market index is unmanaged and, therefore, has no expenses. Investors cannot invest directly in an index. Results reflect dividends net of withholding taxes. |
| † | Lipper indexes track the largest mutual funds (no more than 30), represented by one share class per fund, in the corresponding Lipper category. |
| American Funds Developing World Growth and Income Fund | 1 |
The MSCI China Index fell 6.93% in the midst of market turbulence. In January, China faced intense scrutiny as investors questioned the country’s economic growth rate, rising debt levels and a potential devaluation of the renminbi. As part of their efforts to stimulate the economy, government leaders eased restrictions on property purchases and lowered reserve requirements for banks. Funding for infrastructure projects was increased as well.
Indonesia was a bright spot in Asia. The MSCI Indonesia Index climbed 11.20% as investors appeared encouraged by steps President Joko Widodo was taking to attract investment and boost consumption. The country’s central bank also reduced interest rates twice over the six months. Stocks in India strengthened late in the period as the Reserve Bank of India cut the benchmark interest rate and corporate profits improved. The MSCI India Index advanced 2.25%. Russian stocks gained 5.58%, primarily buoyed by a rebound in the price of Brent crude, a key export for the country.
Inside the portfolio
Several of the fund’s industrials holdings contributed to returns. CCR, an operator and developer of toll roads in Brazil, jumped 27.5% in U.S. dollar terms for the six months ended May 31, 2016. CCR and other Brazilian equities rose on fresh hopes for political change in a country long mired in recession. CTCI, a Taiwanese-based provider of engineering consulting services, soared 30.5%, helped by its strong order backlog.
Consumer discretionary stocks also supported returns, particularly investments in Indonesia. Astra International, a proxy for the Indonesian economy due to its many business interests, advanced 13.1%, while department store operator Matahari surged 23.6%. Macau casino operators Sands China and Wynn Macau improved 13.9% and 26.1%, respectively.
A few of the fund’s investments in telecommunications were also additive. These included Hong Kong-based HKT Trust and HKT Ltd. and Globe Telecom, a major wireless provider in the Philippines.
Investments in Mexico weighed on returns, partly due to a more cautious market outlook for Mexican equities and weakness in the country’s currency. Telecommunications giant América Móvil declined 24.3%, hurt by a disappointing first-quarter earnings report. Real estate investment trust Fibra Uno and retailer Grupo Sanborns also detracted from results.
Among Chinese stocks, Shanghai Fosun Pharmaceutical dropped 19.6%. Fund managers believe the company is still poised to benefit from the rapidly growing use of prescription drugs in China, as well as the ongoing privatization of hospitals. China Pacific Insurance and China Overseas Land & Investment fell on broader concerns about the country’s economy.
| 2 | American Funds Developing World Growth and Income Fund |
The road ahead
Launched in 2014, American Funds Developing World Growth and Income Fund aims to take advantage of long-term growth prospects and income opportunities in emerging markets by investing in firms that have consistently paid meaningful dividends over time. Most of the fund’s assets are invested in stocks domiciled in developing markets, however managers may also invest in developed market companies that derive a meaningful portion of their revenue from emerging markets.
The last few years have been challenging for emerging markets. Recently, prices for several commodities appear to have stabilized after a prolonged slump — a positive sign for resource-rich countries such as Russia, South Africa and Brazil. U.S. dollar strength, historically a headwind for emerging markets, has also eased. Meanwhile, positive structural reforms are gaining traction in countries such as Indonesia and India, two of Asia’s fastest-growing economies.
Managers actively invest on a company-by-company basis, focusing on those with strong balance sheets, the ability to navigate challenging periods and a disciplined approach to increasing dividends over time. We believe this emphasis on higher quality, dividend-paying companies can help provide stability in volatile markets, and offers a unique combination of long-term growth and income opportunities.
Currently the fund’s growth and income objectives are being expressed through investments in consumer discretionary and consumer staples, which account for nearly a third of equity holdings. In the latter sector, the fund favors companies headquartered in developed countries that sell to emerging markets as their dividend yields tend to be higher and balance sheets healthier.
On the whole, we believe that growth prospects, technological advancements and population demographics remain favorable for emerging markets countries. Along with rising wealth, these factors should fuel demand for a range of consumer goods and financial services as people seek a higher quality of life.
We appreciate your trust and look forward to reporting to you at the close of the fund’s fiscal year.
Sincerely,

Shaw B. Wagener
Vice Chairman and President
July 14, 2016
For current information about the fund, visit americanfunds.com.
| American Funds Developing World Growth and Income Fund | 3 |
| Summary investment portfolio May 31, 2016 | unaudited |
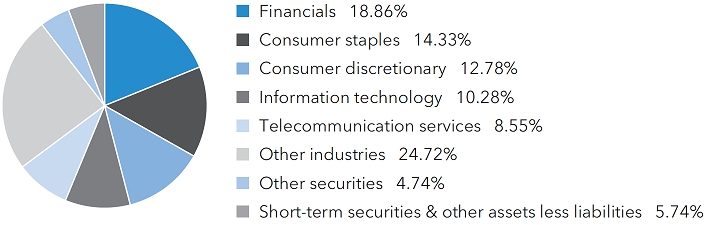
| Industry sector diversification | Percent of net assets |
| Country diversification by domicile | Percent of net assets |
|||
| Taiwan | 10.01 | % | ||
| China | 8.45 | |||
| Hong Kong | 8.41 | |||
| Mexico | 6.02 | |||
| Indonesia | 5.77 | |||
| United Kingdom | 5.64 | |||
| United States | 4.98 | |||
| Brazil | 4.65 | |||
| Thailand | 4.03 | |||
| Other countries | 36.30 | |||
| Short-term securities & other assets less liabilities | 5.74 | |||
| Common stocks 89.52% | Shares | Value (000) |
||||||
| Financials 18.86% | ||||||||
| Fibra Uno Administración, SA de CV | 21,389,900 | $ | 46,311 | |||||
| Discovery Ltd. | 5,620,366 | 42,989 | ||||||
| First Gulf Bank PJSC | 11,899,338 | 38,389 | ||||||
| China Vanke Co. Ltd., Class H | 14,238,000 | 33,933 | ||||||
| Moscow Exchange MICEX-RTS PJSC | 19,458,889 | 31,922 | ||||||
| Union National Bank PJSC | 31,234,452 | 29,167 | ||||||
| China Pacific Insurance (Group) Co., Ltd., Class H1 | 8,122,800 | 27,753 | ||||||
| Akbank TAS | 6,390,635 | 17,253 | ||||||
| Credicorp Ltd. | 122,200 | 17,133 | ||||||
| Other securities | 115,570 | |||||||
| 400,420 | ||||||||
| Consumer staples 14.33% | ||||||||
| Unilever PLC | 1,335,700 | 60,861 | ||||||
| Thai Beverage PCL | 55,467,000 | 35,243 | ||||||
| Carlsberg A/S | 341,587 | 32,959 | ||||||
| Nestlé SA | 363,397 | 26,834 | ||||||
| Philip Morris International Inc. | 255,600 | 25,223 | ||||||
| British American Tobacco PLC | 395,700 | 24,059 | ||||||
| Shoprite Holdings Ltd. | 2,161,408 | 22,680 | ||||||
| Danone SA | 270,894 | 19,013 | ||||||
| 4 | American Funds Developing World Growth and Income Fund |
| Shares | Value (000) |
|||||||
| PZ Cussons PLC | 3,737,500 | $ | 18,957 | |||||
| Other securities | 38,434 | |||||||
| 304,263 | ||||||||
| Consumer discretionary 12.78% | ||||||||
| Astra International Tbk PT | 120,582,800 | 58,261 | ||||||
| Sands China Ltd. | 10,978,400 | 42,101 | ||||||
| Stella International Holdings Ltd. | 11,003,000 | 27,045 | ||||||
| Matahari Department Store Tbk PT | 17,633,400 | 24,494 | ||||||
| PT Surya Citra Media Tbk | 93,543,000 | 22,941 | ||||||
| Grupo Sanborns, SAB de CV, Series B1 | 14,235,410 | 18,758 | ||||||
| Other securities | 77,759 | |||||||
| 271,359 | ||||||||
| Information technology 10.28% | ||||||||
| Taiwan Semiconductor Manufacturing Co., Ltd. | 14,911,000 | 71,554 | ||||||
| Taiwan Semiconductor Manufacturing Co., Ltd. (ADR) | 471,200 | 11,648 | ||||||
| Delta Electronics, Inc. | 11,827,407 | 54,400 | ||||||
| Quanta Computer Inc. | 10,325,000 | 18,363 | ||||||
| Other securities | 62,262 | |||||||
| 218,227 | ||||||||
| Telecommunication services 8.55% | ||||||||
| HKT Trust and HKT Ltd., units | 29,709,960 | 43,050 | ||||||
| América Móvil, SAB de CV, Series L (ADR) | 3,470,400 | 42,512 | ||||||
| Globe Telecom, Inc. | 719,605 | 37,084 | ||||||
| Singapore Telecommunications Ltd. | 8,245,700 | 23,173 | ||||||
| Bharti Airtel Ltd. | 4,166,654 | 21,761 | ||||||
| Other securities | 13,941 | |||||||
| 181,521 | ||||||||
| Industrials 7.75% | ||||||||
| CCR SA, ordinary nominative | 8,672,300 | 36,599 | ||||||
| CTCI Corp. | 16,667,000 | 23,994 | ||||||
| SEEK Ltd. | 1,926,052 | 22,691 | ||||||
| BTS Rail Mass Transit Growth Infrastructure Fund | 52,714,700 | 17,412 | ||||||
| Other securities | 63,845 | |||||||
| 164,541 | ||||||||
| Energy 3.91% | ||||||||
| Coal India Ltd. | 7,189,190 | 31,135 | ||||||
| Türkiye Petrol Rafinerileri AS | 953,781 | 21,518 | ||||||
| Oil Search Ltd. | 3,875,270 | 19,018 | ||||||
| Other securities | 11,475 | |||||||
| 83,146 | ||||||||
| Health care 3.66% | ||||||||
| Shanghai Fosun Pharmaceutical (Group) Co., Ltd. Class H | 12,465,500 | 32,404 | ||||||
| Odontoprev SA, ordinary nominative | 6,531,100 | 20,261 | ||||||
| Other securities | 25,001 | |||||||
| 77,666 | ||||||||
| American Funds Developing World Growth and Income Fund | 5 |
| Common stocks (continued) | Shares | Value (000) |
||||||
| Materials 3.48% | ||||||||
| Alrosa PJSC | 25,135,753 | $ | 26,556 | |||||
| LafargeHolcim Ltd. | 383,861 | 17,262 | ||||||
| Other securities | 30,141 | |||||||
| 73,959 | ||||||||
| Utilities 1.91% | ||||||||
| Other securities | 40,593 | |||||||
| Miscellaneous 4.01% | ||||||||
| Other common stocks in initial period of acquisition | 85,113 | |||||||
| Total common stocks (cost: $2,134,936,000) | 1,900,808 | |||||||
| Preferred securities 0.50% | ||||||||
| Consumer discretionary 0.50% | ||||||||
| Other securities | 10,501 | |||||||
| Total preferred securities (cost: $10,800,000) | 10,501 | |||||||
| Rights & warrants 2.10% | ||||||||
| Consumer staples 2.10% | ||||||||
| Savola Group Co., warrants, expire 20172,3 | 3,190,951 | 31,841 | ||||||
| Other securities | 12,661 | |||||||
| Total rights & warrants (cost: $73,762,000) | 44,502 | |||||||
| Convertible bonds 0.16% | Principal amount (000) |
|||||||
| Miscellaneous 0.16% | ||||||||
| Other convertible bonds in initial period of acquisition | 3,443 | |||||||
| Total convertible bonds (cost: $6,352,000) | 3,443 | |||||||
| Bonds, notes & other debt instruments 1.98% | ||||||||
| Bonds & notes of governments outside the U.S. 0.85% | ||||||||
| Argentina (Republic of) 7.50% 20262 | $ | 17,150 | 18,042 | |||||
| Corporate bonds & notes 0.81% | ||||||||
| Telecommunication services 0.30% | ||||||||
| América Móvil, SAB de CV 2.375% 2016 | 6,488 | 6,511 | ||||||
| Other corporate bonds & notes 0.51% | ||||||||
| Other securities | 10,741 | |||||||
| Total corporate bonds & notes | 17,252 | |||||||
| U.S. Treasury bonds & notes 0.32% | ||||||||
| Other securities | 6,701 | |||||||
| Total bonds, notes & other debt instruments (cost: $40,794,000) | 41,995 | |||||||
| 6 | American Funds Developing World Growth and Income Fund |
| Short-term securities 5.97% | Principal amount (000) |
Value (000) |
||||||
| Caisse d’Amortissement de la Dette Sociale 0.48% due 7/7/20162 | $ | 17,700 | $ | 17,694 | ||||
| General Electric Co. 0.32% due 6/1/2016 | 49,900 | 49,899 | ||||||
| Total Capital Canada Ltd. 0.60% due 7/15/20162 | 20,000 | 19,990 | ||||||
| Other securities | 39,199 | |||||||
| Total short-term securities (cost: $126,775,000) | 126,782 | |||||||
| Total investment securities 100.23% (cost: $2,393,419,000) | 2,128,031 | |||||||
| Other assets less liabilities (0.23)% | (4,806 | ) | ||||||
| Net assets 100.00% | $ | 2,123,225 | ||||||
This summary investment portfolio is designed to streamline the report and help investors better focus on the fund’s principal holdings. See the inside back cover for details on how to obtain a complete schedule of portfolio holdings.
As permitted by U.S. Securities and Exchange Commission regulations, “Miscellaneous” securities include holdings in their first year of acquisition that have not previously been publicly disclosed.
“Other securities” includes all issues that are not disclosed separately in the summary investment portfolio.
Forward currency contracts
The fund has entered into a forward currency contract as shown in the following table. The average month-end notional amount of open forward currency contracts while held was $25,293,000.
| Unrealized | ||||||||||||
| Contract amount | appreciation | |||||||||||
| Receive | Deliver | at 5/31/2016 | ||||||||||
| Settlement date | Counterparty | (000) | (000) | (000) | ||||||||
| Sales: | ||||||||||||
| British pounds | 7/22/2016 | Bank of America, N.A. | $19,219 | £13,150 | $166 | |||||||
| 1 | Security did not produce income during the last 12 months. |
| 2 | Acquired in a transaction exempt from registration under Rule 144A or Section 4(2) of the Securities Act of 1933. May be resold in the U.S. in transactions exempt from registration, normally to qualified institutional buyers. The total value of all such securities, including those in “Other securities,” was $135,167,000, which represented 6.37% of the net assets of the fund. |
| 3 | Valued under fair value procedures adopted by authority of the board of trustees. The total value of all such securities, including those in “Other securities,” was $44,502,000, which represented 2.10% of the net assets of the fund. |
Key to abbreviation and symbol
ADR = American Depositary Receipts
£ = British pounds
See Notes to Financial Statements
| American Funds Developing World Growth and Income Fund | 7 |
Financial statements
| Statement of assets and liabilities | unaudited | |||||||
| at May 31, 2016 | (dollars in thousands) | |||||||
| Assets: | ||||||||
| Investment securities, at value (cost: $2,393,419) | $ | 2,128,031 | ||||||
| Cash denominated in currencies other than U.S. dollars (cost: $2,465) | 2,440 | |||||||
| Unrealized appreciation on open forward currency contracts | 166 | |||||||
| Receivables for: | ||||||||
| Sales of investments | $ | 2,075 | ||||||
| Sales of fund’s shares | 5,285 | |||||||
| Dividends and interest | 6,682 | |||||||
| Other | 27 | 14,069 | ||||||
| 2,144,706 | ||||||||
| Liabilities: | ||||||||
| Payables for: | ||||||||
| Purchases of investments | 14,501 | |||||||
| Repurchases of fund’s shares | 3,240 | |||||||
| Investment advisory services | 1,354 | |||||||
| Services provided by related parties | 1,058 | |||||||
| Trustees’ deferred compensation | 288 | |||||||
| Other | 1,040 | 21,481 | ||||||
| Net assets at May 31, 2016 | $ | 2,123,225 | ||||||
| Net assets consist of: | ||||||||
| Capital paid in on shares of beneficial interest | $ | 2,654,052 | ||||||
| Undistributed net investment income | 15,424 | |||||||
| Accumulated net realized loss | (280,809 | ) | ||||||
| Net unrealized depreciation | (265,442 | ) | ||||||
| Net assets at May 31, 2016 | $ | 2,123,225 | ||||||
See Notes to Financial Statements
| 8 | American Funds Developing World Growth and Income Fund |
(dollars and shares in thousands, except per-share amounts)
Shares of beneficial interest issued and outstanding (no stated par value) —
unlimited shares authorized (241,038 total shares outstanding)
| Net assets | Shares outstanding |
Net asset value per share |
||||||||||
| Class A | $ | 1,288,795 | 146,315 | $ | 8.81 | |||||||
| Class B | 296 | 34 | 8.79 | |||||||||
| Class C | 109,276 | 12,460 | 8.77 | |||||||||
| Class F-1 | 86,195 | 9,782 | 8.81 | |||||||||
| Class F-2 | 564,391 | 64,010 | 8.82 | |||||||||
| Class 529-A | 24,095 | 2,737 | 8.80 | |||||||||
| Class 529-B | 30 | 3 | 8.79 | |||||||||
| Class 529-C | 3,742 | 427 | 8.77 | |||||||||
| Class 529-E | 763 | 87 | 8.80 | |||||||||
| Class 529-F-1 | 1,675 | 190 | 8.81 | |||||||||
| Class R-1 | 1,432 | 163 | 8.78 | |||||||||
| Class R-2 | 5,932 | 677 | 8.76 | |||||||||
| Class R-2E | 27 | 3 | 8.79 | |||||||||
| Class R-3 | 5,828 | 663 | 8.79 | |||||||||
| Class R-4 | 5,478 | 622 | 8.81 | |||||||||
| Class R-5E | 10 | 1 | 8.80 | |||||||||
| Class R-5 | 3,300 | 374 | 8.82 | |||||||||
| Class R-6 | 21,960 | 2,490 | 8.82 | |||||||||
See Notes to Financial Statements
| American Funds Developing World Growth and Income Fund | 9 |
| Statement of operations | unaudited | |||||||
| for the six months ended May 31, 2016 | (dollars in thousands) | |||||||
| Investment income: | ||||||||
| Income: | ||||||||
| Dividends (net of non-U.S. taxes of $2,622) | $ | 36,884 | ||||||
| Interest (net of non-U.S. taxes of $4) | 1,145 | $ | 38,029 | |||||
| Fees and expenses*: | ||||||||
| Investment advisory services | 7,556 | |||||||
| Distribution services | 2,471 | |||||||
| Transfer agent services | 1,864 | |||||||
| Administrative services | 254 | |||||||
| Reports to shareholders | 178 | |||||||
| Registration statement and prospectus | 572 | |||||||
| Trustees’ compensation | 171 | |||||||
| Auditing and legal | 32 | |||||||
| Custodian | 587 | |||||||
| Other | (15 | ) | ||||||
| Total fees and expenses before reimbursement | 13,670 | |||||||
| Less transfer agent services reimbursement | — | † | ||||||
| Total fees and expenses after reimbursement | 13,670 | |||||||
| Net investment income | 24,359 | |||||||
| Net realized loss and unrealized appreciation: | ||||||||
| Net realized (loss) gain on: | ||||||||
| Investments | (168,229 | ) | ||||||
| Forward currency contracts | (292 | ) | ||||||
| Currency transactions | 172 | (168,349 | ) | |||||
| Net unrealized appreciation (depreciation) on: | ||||||||
| Investments (net of non-U.S. taxes of $220) | 182,610 | |||||||
| Forward currency contracts | (93 | ) | ||||||
| Currency translations | (66 | ) | 182,451 | |||||
| Net realized loss and unrealized appreciation | 14,102 | |||||||
| Net increase in net assets resulting from operations | $ | 38,461 | ||||||
| * | Additional information related to class-specific fees and expenses is included in the Notes to Financial Statements. |
| † | Amount less than one thousand. |
See Notes to Financial Statements
| 10 | American Funds Developing World Growth and Income Fund |
| Statements of changes in net assets | ||||||||
| (dollars in thousands) | ||||||||
| Six months ended | Year ended | |||||||
| May 31, | November 30, | |||||||
| 2016* | 2015 | |||||||
| Operations: | ||||||||
| Net investment income | $ | 24,359 | $ | 39,661 | ||||
| Net realized loss | (168,349 | ) | (102,800 | ) | ||||
| Net unrealized appreciation (depreciation) | 182,451 | (404,170 | ) | |||||
| Net increase (decrease) in net assets resulting from operations | 38,461 | (467,309 | ) | |||||
| Dividends paid to shareholders from net investment income | (10,545 | ) | (38,327 | ) | ||||
| Net capital share transactions | 1,212 | 582,082 | ||||||
| Total increase in net assets | 29,128 | 76,446 | ||||||
| Net assets: | ||||||||
| Beginning of period | 2,094,097 | 2,017,651 | ||||||
| End of period (including undistributed net investment income: $15,424 and $1,610, respectively) | $ | 2,123,225 | $ | 2,094,097 | ||||
*Unaudited.
See Notes to Financial Statements
| American Funds Developing World Growth and Income Fund | 11 |
| Notes to financial statements | unaudited |
1. Organization
American Funds Developing World Growth and Income Fund (the “fund”) is registered under the Investment Company Act of 1940 as an open-end, diversified management investment company. The fund seeks to provide long-term growth of capital while providing current income.
The fund has 18 share classes consisting of five retail share classes (Classes A, B and C, as well as two F share classes, F-1 and F-2), five 529 college savings plan share classes (Classes 529-A, 529-B, 529-C, 529-E and 529-F-1) and eight retirement plan share classes (Classes R-1, R-2, R-2E, R-3, R-4, R-5E, R-5 and R-6). The 529 college savings plan share classes can be used to save for college education. The retirement plan share classes are generally offered only through eligible employer-sponsored retirement plans. The fund’s share classes are described further in the following table:
| Contingent deferred sales | ||||||
| Share class | Initial sales charge | charge upon redemption | Conversion feature | |||
| Classes A and 529-A | Up to 5.75% | None (except 1% for certain redemptions within one year of purchase without an initial sales charge) | None | |||
| Classes B and 529-B* | None | Declines from 5% to 0% for redemptions within six years of purchase | Classes B and 529-B convert to Classes A and 529-A, respectively, after eight years | |||
| Class C | None | 1% for redemptions within one year of purchase | Class C converts to Class F-1 after 10 years | |||
| Class 529-C | None | 1% for redemptions within one year of purchase | None | |||
| Class 529-E | None | None | None | |||
| Classes F-1, F-2 and 529-F-1 | None | None | None | |||
| Classes R-1, R-2, R-2E, R-3, R-4, R-5E, R-5 and R-6 | None | None | None |
*Class B and 529-B shares of the fund are not available for purchase.
Holders of all share classes have equal pro rata rights to the assets, dividends and liquidation proceeds of the fund. Each share class has identical voting rights, except for the exclusive right to vote on matters affecting only its class. Share classes have different fees and expenses (“class-specific fees and expenses”), primarily due to different arrangements for distribution, transfer agent and administrative services. Differences in class-specific fees and expenses will result in differences in net investment income and, therefore, the payment of different per-share dividends by each share class.
| 12 | American Funds Developing World Growth and Income Fund |
2. Significant accounting policies
The fund is an investment company that applies the accounting and reporting guidance issued in Topic 946 by the U.S. Financial Accounting Standards Board. The fund’s financial statements have been prepared to comply with U.S. generally accepted accounting principles (“U.S. GAAP”). These principles require the fund’s investment adviser to make estimates and assumptions that affect reported amounts and disclosures. Actual results could differ from those estimates. Subsequent events, if any, have been evaluated through the date of issuance in the preparation of the financial statements. The fund follows the significant accounting policies described in this section, as well as the valuation policies described in the next section on valuation.
Security transactions and related investment income — Security transactions are recorded by the fund as of the date the trades are executed with brokers. Realized gains and losses from security transactions are determined based on the specific identified cost of the securities. In the event a security is purchased with a delayed payment date, the fund will segregate liquid assets sufficient to meet its payment obligations. Dividend income is recognized on the ex-dividend date and interest income is recognized on an accrual basis. Market discounts, premiums and original issue discounts on fixed-income securities are amortized daily over the expected life of the security.
Class allocations — Income, fees and expenses (other than class-specific fees and expenses) and realized and unrealized gains and losses are allocated daily among the various share classes based on their relative net assets. Class-specific fees and expenses, such as distribution, transfer agent and administrative services, are charged directly to the respective share class.
Dividends and distributions to shareholders — Dividends and distributions to shareholders are recorded on the ex-dividend date.
Currency translation — Assets and liabilities, including investment securities, denominated in currencies other than U.S. dollars are translated into U.S. dollars at the exchange rates supplied by one or more pricing vendors on the valuation date. Purchases and sales of investment securities and income and expenses are translated into U.S. dollars at the exchange rates on the dates of such transactions. The effects of changes in exchange rates on investment securities are included with the net realized gain or loss and net unrealized appreciation or depreciation on investments in the fund’s statement of operations. The realized gain or loss and unrealized appreciation or depreciation resulting from all other transactions denominated in currencies other than U.S. dollars are disclosed separately.
| American Funds Developing World Growth and Income Fund | 13 |
3. Valuation
Capital Research and Management Company (“CRMC”), the fund’s investment adviser, values the fund’s investments at fair value as defined by U.S. GAAP. The net asset value of each share class of the fund is generally determined as of approximately 4:00 p.m. New York time each day the New York Stock Exchange is open.
Methods and inputs — The fund’s investment adviser uses the following methods and inputs to establish the fair value of the fund’s assets and liabilities. Use of particular methods and inputs may vary over time based on availability and relevance as market and economic conditions evolve.
Equity securities are generally valued at the official closing price of, or the last reported sale price on, the exchange or market on which such securities are traded, as of the close of business on the day the securities are being valued or, lacking any sales, at the last available bid price. Prices for each security are taken from the principal exchange or market on which the security trades.
Fixed-income securities, including short-term securities, are generally valued at prices obtained from one or more pricing vendors. Vendors value such securities based on one or more of the inputs described in the following table. The table provides examples of inputs that are commonly relevant for valuing particular classes of fixed-income securities in which the fund is authorized to invest. However, these classifications are not exclusive, and any of the inputs may be used to value any other class of fixed-income security.
| Fixed-income class | Examples of standard inputs |
| All | Benchmark yields, transactions, bids, offers, quotations from dealers and trading systems, new issues, spreads and other relationships observed in the markets among comparable securities; and proprietary pricing models such as yield measures calculated using factors such as cash flows, financial or collateral performance and other reference data (collectively referred to as “standard inputs”) |
| Corporate bonds & notes; convertible securities | Standard inputs and underlying equity of the issuer |
| Bonds & notes of governments & government agencies | Standard inputs and interest rate volatilities |
| Mortgage-backed; asset-backed obligations | Standard inputs and cash flows, prepayment information, default rates, delinquency and loss assumptions, collateral characteristics, credit enhancements and specific deal information |
When the fund’s investment adviser deems it appropriate to do so (such as when vendor prices are unavailable or deemed to be not representative), fixed-income securities will be valued in good faith at the mean quoted bid and ask prices that are reasonably and timely available (or bid prices, if ask prices are not available) or at prices for securities of comparable maturity, quality and type.
| 14 | American Funds Developing World Growth and Income Fund |
Securities with both fixed-income and equity characteristics, or equity securities traded principally among fixed-income dealers, are generally valued in the manner described for either equity or fixed-income securities, depending on which method is deemed most appropriate by the fund’s investment adviser. Forward currency contracts are valued at the mean of representative quoted bid and ask prices, generally based on prices supplied by one or more pricing vendors.
Securities and other assets for which representative market quotations are not readily available or are considered unreliable by the fund’s investment adviser are fair valued as determined in good faith under fair valuation guidelines adopted by authority of the fund’s board of trustees as further described. The investment adviser follows fair valuation guidelines, consistent with U.S. Securities and Exchange Commission rules and guidance, to consider relevant principles and factors when making fair value determinations. The investment adviser considers relevant indications of value that are reasonably and timely available to it in determining the fair value to be assigned to a particular security, such as the type and cost of the security; contractual or legal restrictions on resale of the security; relevant financial or business developments of the issuer; actively traded similar or related securities; conversion or exchange rights on the security; related corporate actions; significant events occurring after the close of trading in the security; and changes in overall market conditions. In addition, the closing prices of equity securities that trade in markets outside U.S. time zones may be adjusted to reflect significant events that occur after the close of local trading but before the net asset value of each share class of the fund is determined. Fair valuations and valuations of investments that are not actively trading involve judgment and may differ materially from valuations that would have been used had greater market activity occurred.
Processes and structure — The fund’s board of trustees has delegated authority to the fund’s investment adviser to make fair value determinations, subject to board oversight. The investment adviser has established a Joint Fair Valuation Committee (the “Fair Valuation Committee”) to administer, implement and oversee the fair valuation process, and to make fair value decisions. The Fair Valuation Committee regularly reviews its own fair value decisions, as well as decisions made under its standing instructions to the investment adviser’s valuation teams. The Fair Valuation Committee reviews changes in fair value measurements from period to period and may, as deemed appropriate, update the fair valuation guidelines to better reflect the results of back testing and address new or evolving issues. The Fair Valuation Committee reports any changes to the fair valuation guidelines to the board of trustees with supplemental information to support the changes. The fund’s board and audit committee also regularly review reports that describe fair value determinations and methods.
The fund’s investment adviser has also established a Fixed-Income Pricing Review Group to administer and oversee the fixed-income valuation process, including the use of fixed-income pricing vendors. This group regularly reviews pricing vendor information and market data. Pricing decisions, processes and controls over security valuation are also subject to additional internal reviews, including an annual control self-evaluation program facilitated by the investment adviser’s compliance group.
| American Funds Developing World Growth and Income Fund | 15 |
Classifications — The fund’s investment adviser classifies the fund’s assets and liabilities into three levels based on the inputs used to value the assets or liabilities. Level 1 values are based on quoted prices in active markets for identical securities. Level 2 values are based on significant observable market inputs, such as quoted prices for similar securities and quoted prices in inactive markets. Certain securities trading outside the U.S. may transfer between Level 1 and Level 2 due to valuation adjustments resulting from significant market movements following the close of local trading. Level 3 values are based on significant unobservable inputs that reflect the investment adviser’s determination of assumptions that market participants might reasonably use in valuing the securities. The valuation levels are not necessarily an indication of the risk or liquidity associated with the underlying investment. For example, U.S. government securities are reflected as Level 2 because the inputs used to determine fair value may not always be quoted prices in an active market. The following tables present the fund’s valuation levels as of May 31, 2016 (dollars in thousands):
| Investment securities | ||||||||||||||||
| Level 1* | Level 2 | Level 3 | Total | |||||||||||||
| Assets: | ||||||||||||||||
| Common stocks: | ||||||||||||||||
| Financials | $ | 400,420 | $ | — | $ | — | $ | 400,420 | ||||||||
| Consumer staples | 304,263 | — | — | 304,263 | ||||||||||||
| Consumer discretionary | 271,359 | — | — | 271,359 | ||||||||||||
| Information technology | 218,227 | — | — | 218,227 | ||||||||||||
| Telecommunication services | 181,521 | — | — | 181,521 | ||||||||||||
| Industrials | 164,541 | — | — | 164,541 | ||||||||||||
| Energy | 83,146 | — | — | 83,146 | ||||||||||||
| Health care | 77,666 | — | — | 77,666 | ||||||||||||
| Materials | 73,959 | — | — | 73,959 | ||||||||||||
| Utilities | 40,593 | — | — | 40,593 | ||||||||||||
| Miscellaneous | 85,113 | — | — | 85,113 | ||||||||||||
| Preferred securities | 10,501 | — | — | 10,501 | ||||||||||||
| Rights & warrants | — | 44,502 | — | 44,502 | ||||||||||||
| Convertible bonds | — | 3,443 | — | 3,443 | ||||||||||||
| Bonds, notes & other debt instruments | — | 41,995 | — | 41,995 | ||||||||||||
| Short-term securities | — | 126,782 | — | 126,782 | ||||||||||||
| Total | $ | 1,911,309 | $ | 216,722 | $ | — | $ | 2,128,031 | ||||||||
| Other investments† | ||||||||||||||||
| Level 1 | Level 2 | Level 3 | Total | |||||||||||||
| Assets: | ||||||||||||||||
| Unrealized appreciation on open forward currency contracts | $ | — | $ | 166 | $ | — | $ | 166 | ||||||||
| * | Securities with a value of $1,451,384,000, which represented 68.36% of the net assets of the fund, transferred from Level 2 to Level 1 since the prior fiscal year-end, primarily due to a lack of significant market movements following the close of local trading. |
| † | Forward currency contracts are not included in the investment portfolio. |
| 16 | American Funds Developing World Growth and Income Fund |
4. Risk factors
Investing in the fund may involve certain risks including, but not limited to, those described below.
Market conditions — The prices of, and the income generated by, the common stocks and other securities held by the fund may decline — sometimes rapidly or unpredictably — due to various factors, including events or conditions affecting the general economy or particular industries; overall market changes; local, regional or global political, social or economic instability; governmental or governmental agency responses to economic conditions; and currency exchange, interest rate and commodity price fluctuations.
Issuer risks — The prices of, and the income generated by, securities held by the fund may decline in response to various factors directly related to the issuers of such securities, including reduced demand for an issuer’s goods or services, poor management performance and strategic initiatives such as mergers, acquisitions or dispositions, and the market response to any such initiatives.
Investing outside the U.S. — Securities of issuers domiciled outside the U.S., or with significant operations or revenues outside the U.S., may lose value because of adverse political, social, economic or market developments (including social instability, regional conflicts, terrorism and war) in the countries or regions in which the issuers operate or generate revenue. These securities may also lose value due to changes in foreign currency exchange rates against the U.S. dollar and/or currencies of other countries. Issuers of these securities may be more susceptible to actions of foreign governments, such as the imposition of price controls or punitive taxes, that could adversely impact revenues. Securities markets in certain countries may be more volatile and/or less liquid than those in the U.S. Investments outside the U.S. may also be subject to different accounting practices and different regulatory, legal and reporting standards and practices, and may be more difficult to value, than those in the U.S. In addition, the value of investments outside the U.S. may be reduced by foreign taxes, including foreign withholding taxes on interest and dividends. Further, there may be increased risks of delayed settlement of securities purchased or sold by the fund. The risks of investing outside the U.S. may be heightened in connection with investments in emerging markets.
Investing in emerging markets — Investing in emerging markets may involve risks in addition to and greater than those generally associated with investing in the securities markets of developed countries. For instance, developing countries may have less developed legal and accounting systems than those in developed countries. The governments of these countries may be less stable and more likely to impose capital controls, nationalize a company or industry, place restrictions on foreign ownership and on withdrawing sale proceeds of securities from the country, and/or impose punitive taxes that could adversely affect the prices of securities. In addition, the economies of these countries may be dependent on relatively few industries that are more susceptible to local and global changes. Securities markets in these countries can also be relatively small and have substantially lower trading volumes. As a result, securities issued in these
| American Funds Developing World Growth and Income Fund | 17 |
countries may be more volatile and less liquid, and may be more difficult to value, than securities issued in countries with more developed economies and/or markets. Less certainty with respect to security valuations may lead to additional challenges and risks in calculating the fund’s net asset value. Additionally, there may be increased settlement risks for transactions in local securities.
Investing in growth-oriented stocks — Growth-oriented common stocks and other equity-type securities (such as preferred stocks, convertible preferred stocks and convertible bonds) may involve larger price swings and greater potential for loss than other types of investments. These risks may be even greater in the case of smaller capitalization stocks.
Investing in income-oriented stocks — Income provided by the fund may be reduced by changes in the dividend policies of, and the capital resources available for dividend payments at, the companies in which the fund invests.
Investing in small companies — Investing in smaller companies may pose additional risks. For example, it is often more difficult to value or dispose of small company stocks and more difficult to obtain information about smaller companies than about larger companies. Furthermore, smaller companies often have limited product lines, operating histories, markets and/or financial resources, may be dependent on one or a few key persons for management, and can be more susceptible to losses. Moreover, the prices of their stocks may be more volatile than stocks of larger, more established companies.
Management — The investment adviser to the fund actively manages the fund’s investments. Consequently, the fund is subject to the risk that the methods and analyses employed by the investment adviser in this process may not produce the desired results. This could cause the fund to lose value or its investment results to lag relevant benchmarks or other funds with similar objectives.
| 18 | American Funds Developing World Growth and Income Fund |
5. Certain investment techniques
Forward currency contracts — The fund has entered into forward currency contracts, which represent agreements to exchange currencies on specific future dates at predetermined rates. The fund’s investment adviser uses forward currency contracts to manage the fund’s exposure to changes in exchange rates. Upon entering into these contracts, risks may arise from the potential inability of counterparties to meet the terms of their contracts and from possible movements in exchange rates.
On a daily basis, the fund’s investment adviser values forward currency contracts and records unrealized appreciation or depreciation for open forward currency contracts in the fund’s statement of assets and liabilities. Realized gains or losses are recorded at the time the forward currency contract is closed or offset by another contract with the same broker for the same settlement date and currency.
Closed forward currency contracts that have not reached their settlement date are included in the respective receivables or payables for closed forward currency contracts in the fund’s statement of assets and liabilities. Net realized gains or losses from closed forward currency contracts and net unrealized appreciation or depreciation from open forward currency contracts are recorded in the fund’s statement of operations.
The following tables present the financial statement impacts resulting from the fund’s use of forward currency contracts as of, or for the six months ended, May 31, 2016 (dollars in thousands):
| Assets | Liabilities | |||||||||
| Contract | Risk type | Location
on statement of assets and liabilities |
Value | Location
on statement of assets and liabilities |
Value | |||||
| Forward currency | Currency | Unrealized appreciation on open forward currency contracts | $ | 166 | Unrealized depreciation on open forward currency contracts | $ | — | |||
| Net realized loss | Net unrealized depreciation | |||||||||
| Contract | Risk type | Location
on statement of operations |
Value | Location
on statement of operations |
Value | |||||
| Forward currency | Currency | Net realized loss on forward currency contracts | $ | (292) | Net unrealized depreciation on forward currency contracts | $ | (93) | |||
Collateral — The fund participates in a collateral program due to its use of forward currency contracts. The program calls for the fund to either receive or pledge collateral based on the net gain or loss on unsettled forward currency contracts by counterparty. The purpose of the collateral is to cover potential losses that could occur in the event that either party cannot meet its contractual obligations.
| American Funds Developing World Growth and Income Fund | 19 |
Rights of offset — The fund has entered into enforceable master netting agreements with certain counterparties for forward currency contracts, where on any date amounts payable by each party to the other (in the same currency with respect to the same transaction) may be closed or offset by each party’s payment obligation. If an early termination date occurs under these agreements following an event of default or termination event, all obligations of each party to its counterparty are settled net through a single payment in a single currency (“close-out netting”). For financial reporting purposes, the fund does not offset financial assets and financial liabilities that are subject to these master netting arrangements in the statement of assets and liabilities.
The following table presents the fund’s forward currency contracts by counterparty that are subject to master netting agreements but that are not offset in the fund’s statement of assets and liabilities. The net amount column shows the impact of offsetting on the fund’s statement of assets and liabilities as of May 31, 2016, if close-out netting was exercised (dollars in thousands):
| Gross amounts not offset in the | ||||||||||||||||||||
| Gross amounts | statement of assets and liabilities and | |||||||||||||||||||
| recognized in the | subject to a master netting agreement | |||||||||||||||||||
| statement of assets | Available | Non-cash | Cash | Net | ||||||||||||||||
| Counterparty | and liabilities | to offset | collateral* | collateral | amount | |||||||||||||||
| Assets: | ||||||||||||||||||||
| Bank of America, N.A. | $ | 166 | $ | — | $ | — | $ | — | $ | 166 | ||||||||||
*Non-cash collateral is shown on a settlement basis.
6. Taxation and distributions
Federal income taxation — The fund complies with the requirements under Subchapter M of the Internal Revenue Code applicable to mutual funds and intends to distribute substantially all of its net taxable income and net capital gains each year. The fund is not subject to income taxes to the extent such distributions are made. Therefore, no federal income tax provision is required.
As of and during the period ended May 31, 2016, the fund did not have a liability for any unrecognized tax benefits. The fund recognizes interest and penalties, if any, related to unrecognized tax benefits as income tax expense in the statement of operations. During the period, the fund did not incur any interest or penalties.
The fund is not subject to examination by U.S. federal and state tax authorities for tax years before 2013, the year the fund commenced operations, and by tax authorities outside the U.S. for tax years before 2014.
| 20 | American Funds Developing World Growth and Income Fund |
Non-U.S. taxation — Dividend and interest income are recorded net of non-U.S. taxes paid. The fund may file withholding tax reclaims in certain jurisdictions to recover a portion of amounts previously withheld. These reclaims are recorded when the amount is known and there are no significant uncertainties on collectability. Gains realized by the fund on the sale of securities in certain countries are subject to non-U.S. taxes. The fund records a liability based on unrealized gains to provide for potential non-U.S. taxes payable upon the sale of these securities.
Distributions — Distributions paid to shareholders are based on net investment income and net realized gains determined on a tax basis, which may differ from net investment income and net realized gains for financial reporting purposes. These differences are due primarily to different treatment for items such as currency gains and losses; short-term capital gains and losses; and net capital losses. The fiscal year in which amounts are distributed may differ from the year in which the net investment income and net realized gains are recorded by the fund for financial reporting purposes.
The components of distributable earnings on a tax basis are reported as of the fund’s most recent year-end. As of November 30, 2015, the components of distributable earnings on a tax basis were as follows (dollars in thousands):
| Undistributed ordinary income | $ | 1,849 | ||
| Capital loss carryforward* | (112,199 | ) |
| * | The capital loss carryforward will be used to offset any capital gains realized by the fund in the current year or in subsequent years. The fund will not make distributions from capital gains while a capital loss carryforward remains. |
As of May 31, 2016, the tax basis unrealized appreciation (depreciation) and cost of investment securities were as follows (dollars in thousands):
| Gross unrealized appreciation on investment securities | $ | 99,818 | ||
| Gross unrealized depreciation on investment securities | (365,227 | ) | ||
| Net unrealized depreciation on investment securities | (265,409 | ) | ||
| Cost of investment securities | 2,393,440 |
| American Funds Developing World Growth and Income Fund | 21 |
Tax-basis distributions paid to shareholders from ordinary income were as follows (dollars in thousands):
| Six months ended | Year ended | |||||||
| May 31, | November 30, | |||||||
| Share class | 2016 | 2015 | ||||||
| Class A | $ | 6,121 | $ | 22,078 | ||||
| Class B | — | * | 7 | |||||
| Class C | 129 | 1,317 | ||||||
| Class F-1 | 478 | 2,030 | ||||||
| Class F-2 | 3,502 | 11,988 | ||||||
| Class 529-A | 109 | 360 | ||||||
| Class 529-B | — | * | — | * | ||||
| Class 529-C | 3 | 35 | ||||||
| Class 529-E | 3 | 11 | ||||||
| Class 529-F-1 | 8 | 22 | ||||||
| Class R-1 | 2 | 19 | ||||||
| Class R-2 | 2 | 43 | ||||||
| Class R-2E | — | * | — | * | ||||
| Class R-3 | 18 | 62 | ||||||
| Class R-4 | 23 | 68 | ||||||
| Class R-5E† | — | * | — | |||||
| Class R-5 | 20 | 37 | ||||||
| Class R-6 | 127 | 250 | ||||||
| Total | $ | 10,545 | $ | 38,327 | ||||
| * | Amount less than one thousand. |
| † | Class R-5E shares were offered beginning November 20, 2015. |
| 22 | American Funds Developing World Growth and Income Fund |
7. Fees and transactions with related parties
CRMC, the fund’s investment adviser, is the parent company of American Funds Distributors,® Inc. (“AFD”), the principal underwriter of the fund’s shares, and American Funds Service Company® (“AFS”), the fund’s transfer agent. CRMC, AFD and AFS are considered related parties to the fund.
Investment advisory services — The fund has an investment advisory and service agreement with CRMC that provides for monthly fees accrued daily. At the beginning of the year, these fees were based on a series of decreasing annual rates beginning with 0.850% on the first $500 million of daily net assets and decreasing to 0.660% on such assets in excess of $2.5 billion. On December 3, 2015, the fund’s board of trustees approved an amended investment advisory and service agreement effective February 1, 2016, decreasing the annual rate on daily net assets in excess of $4 billion to 0.640%. For the six months ended May 31, 2016, the investment advisory services fee was $7,556,000, which was equivalent to an annualized rate of 0.763% of average daily net assets.
Class-specific fees and expenses — Expenses that are specific to individual share classes are accrued directly to the respective share class. The principal class-specific fees and expenses are further described below:
Distribution services — The fund has plans of distribution for all share classes, except Class F-2, R-5E, R-5 and R-6 shares. Under the plans, the board of trustees approves certain categories of expenses that are used to finance activities primarily intended to sell fund shares and service existing accounts. The plans provide for payments, based on an annualized percentage of average daily net assets, ranging from 0.30% to 1.00% as noted in this section. In some cases, the board of trustees has limited the amounts that may be paid to less than the maximum allowed by the plans. All share classes with a plan may use up to 0.25% of average daily net assets to pay service fees, or to compensate AFD for paying service fees, to firms that have entered into agreements with AFD to provide certain shareholder services. The remaining amounts available to be paid under each plan are paid to dealers to compensate them for their sales activities.
For Class A and 529-A shares, distribution-related expenses include the reimbursement of dealer and wholesaler commissions paid by AFD for certain shares sold without a sales charge. These share classes reimburse AFD for amounts
| American Funds Developing World Growth and Income Fund | 23 |
billed within the prior 15 months but only to the extent that the overall annual expense limit of 0.25% is not exceeded. As of May 31, 2016, there were no unreimbursed expenses subject to reimbursement for Class A or 529-A shares.
| Share class | Currently approved limits | Plan limits | ||||||
| Class A | 0.30 | % | 0.30 | % | ||||
| Class 529-A | 0.30 | 0.50 | ||||||
| Classes B and 529-B | 1.00 | 1.00 | ||||||
| Classes C, 529-C and R-1 | 1.00 | 1.00 | ||||||
| Class R-2 | 0.75 | 1.00 | ||||||
| Class R-2E | 0.60 | 0.85 | ||||||
| Classes 529-E and R-3 | 0.50 | 0.75 | ||||||
| Classes F-1, 529-F-1 and R-4 | 0.25 | 0.50 | ||||||
Transfer agent services — The fund has a shareholder services agreement with AFS under which the fund compensates AFS for providing transfer agent services to each of the fund’s share classes. These services include recordkeeping, shareholder communications and transaction processing. In addition, the fund reimburses AFS for amounts paid to third parties for performing transfer agent services on behalf of fund shareholders.
Administrative services — The fund has an administrative services agreement with CRMC under which the fund compensates CRMC for providing administrative services to Class A, C, F, 529 and R shares. These services include, but are not limited to, coordinating, monitoring, assisting and overseeing third parties that provide services to fund shareholders. Under the agreement, Class A shares pay an annual fee of 0.01% and Class C, F, 529 and R shares pay an annual fee of 0.05% of their respective average daily net assets.
529 plan services — Each 529 share class is subject to service fees to compensate the Virginia College Savings Plan (“Virginia529”) for its oversight and administration of the 529 college savings plan. The quarterly fee is based on a series of decreasing annual rates beginning with 0.10% on the first $30 billion of the net assets invested in Class 529 shares of the American Funds and decreasing to 0.05% on such assets in excess of $70 billion. Effective July 1, 2016, the quarterly fee will be amended to annual rates of 0.10% on the first $20 billion of the net assets invested in the Class 529 shares of the American Funds, 0.05% on net assets between $20 billion and $100 billion, and 0.03% on net assets over $100 billion. The fee for any given calendar quarter is accrued and calculated on the basis of the average net assets of Class 529 shares of the American Funds for the last month of the prior calendar quarter. The fee is included in other expenses in the fund’s statement of operations. Virginia529 is not considered a related party to the fund.
| 24 | American Funds Developing World Growth and Income Fund |
For the six months ended May 31, 2016, class-specific expenses under the agreements were as follows (dollars in thousands):
| Distribution | Transfer agent | Administrative | 529 plan | |||||||||||||
| Share class | services | services | services | services | ||||||||||||
| Class A | $1,759 | $1,339 | $60 | Not applicable | ||||||||||||
| Class B | 2 | 1 | Not applicable | Not applicable | ||||||||||||
| Class C | 520 | 117 | 26 | Not applicable | ||||||||||||
| Class F-1 | 109 | 57 | 22 | Not applicable | ||||||||||||
| Class F-2 | Not applicable | 298 | 130 | Not applicable | ||||||||||||
| Class 529-A | 18 | 21 | 6 | $10 | ||||||||||||
| Class 529-B | — | * | — | * | — | * | — | * | ||||||||
| Class 529-C | 17 | 4 | 1 | 1 | ||||||||||||
| Class 529-E | 2 | — | * | — | * | — | * | |||||||||
| Class 529-F-1 | — | 1 | — | * | 1 | |||||||||||
| Class R-1 | 8 | 1 | — | * | Not applicable | |||||||||||
| Class R-2 | 19 | 16 | 1 | Not applicable | ||||||||||||
| Class R-2E | — | * | — | * | — | * | Not applicable | |||||||||
| Class R-3 | 12 | 5 | 1 | Not applicable | ||||||||||||
| Class R-4 | 5 | 3 | 1 | Not applicable | ||||||||||||
| Class R-5E | Not applicable | — | * | — | * | Not applicable | ||||||||||
| Class R-5 | Not applicable | 1 | 1 | Not applicable | ||||||||||||
| Class R-6 | Not applicable | — | * | 5 | Not applicable | |||||||||||
| Total class-specific expenses | $2,471 | $1,864 | $254 | $12 | ||||||||||||
*Amount less than one thousand.
Trustees’ deferred compensation — Trustees who are unaffiliated with CRMC may elect to defer the cash payment of part or all of their compensation. These deferred amounts, which remain as liabilities of the fund, are treated as if invested in shares of the fund or other American Funds. These amounts represent general, unsecured liabilities of the fund and vary according to the total returns of the selected funds. Trustees’ compensation of $171,000 in the fund’s statement of operations reflects $167,000 in current fees (either paid in cash or deferred) and a net increase of $4,000 in the value of the deferred amounts.
Affiliated officers and trustees — Officers and certain trustees of the fund are or may be considered to be affiliated with CRMC, AFD and AFS. No affiliated officers or trustees received any compensation directly from the fund.
Security transactions with related funds — The fund may purchase from, or sell securities to, other CRMC-managed funds (or funds managed by certain affiliates of CRMC) under procedures adopted by the fund’s board of trustees. The funds involved in such transactions are considered related by virtue of having a common investment adviser (or affiliated investment advisers), common trustees and/or common officers. When such transactions occur, each transaction is executed at the current market price of the security and no brokerage commissions or fees are paid in accordance with Rule 17a-7 of the 1940 Act.
| American Funds Developing World Growth and Income Fund | 25 |
8. Capital share transactions
Capital share transactions in the fund were as follows (dollars and shares in thousands):
| Reinvestments | Net increase | |||||||||||||||||||||||||||||||
| Sales1 | of dividends | Repurchases1 | (decrease) | |||||||||||||||||||||||||||||
| Share class | Amount | Shares | Amount | Shares | Amount | Shares | Amount | Shares | ||||||||||||||||||||||||
| Six months ended May 31, 2016 | ||||||||||||||||||||||||||||||||
| Class A | $ | 209,379 | 25,003 | $ | 6,066 | 713 | $ | (193,731 | ) | (23,277 | ) | $ | 21,714 | 2,439 | ||||||||||||||||||
| Class B | 26 | 3 | — | 2 | — | 2 | (246 | ) | (30 | ) | (220 | ) | (27 | ) | ||||||||||||||||||
| Class C | 13,538 | 1,613 | 129 | 15 | (16,483 | ) | (1,990 | ) | (2,816 | ) | (362 | ) | ||||||||||||||||||||
| Class F-1 | 26,821 | 3,157 | 475 | 56 | (44,038 | ) | (5,185 | ) | (16,742 | ) | (1,972 | ) | ||||||||||||||||||||
| Class F-2 | 163,660 | 19,523 | 3,318 | 390 | (182,535 | ) | (21,604 | ) | (15,557 | ) | (1,691 | ) | ||||||||||||||||||||
| Class 529-A | 4,166 | 495 | 109 | 13 | (1,560 | ) | (186 | ) | 2,715 | 322 | ||||||||||||||||||||||
| Class 529-B | 4 | 1 | — | 2 | — | 2 | (7 | ) | (2 | ) | (3 | ) | (1 | ) | ||||||||||||||||||
| Class 529-C | 747 | 91 | 4 | — | 2 | (342 | ) | (41 | ) | 409 | 50 | |||||||||||||||||||||
| Class 529-E | 221 | 27 | 3 | — | 2 | (130 | ) | (15 | ) | 94 | 12 | |||||||||||||||||||||
| Class 529-F-1 | 683 | 79 | 8 | 1 | (254 | ) | (29 | ) | 437 | 51 | ||||||||||||||||||||||
| Class R-1 | 172 | 20 | 2 | 1 | (351 | ) | (41 | ) | (177 | ) | (20 | ) | ||||||||||||||||||||
| Class R-2 | 2,084 | 249 | 2 | — | 2 | (713 | ) | (83 | ) | 1,373 | 166 | |||||||||||||||||||||
| Class R-2E | 18 | 2 | — | 2 | — | 2 | — | — | 18 | 2 | ||||||||||||||||||||||
| Class R-3 | 2,914 | 338 | 18 | 2 | (1,770 | ) | (212 | ) | 1,162 | 128 | ||||||||||||||||||||||
| Class R-4 | 2,012 | 234 | 23 | 3 | (462 | ) | (55 | ) | 1,573 | 182 | ||||||||||||||||||||||
| Class R-5E | — | — | — | — | — | — | — | — | ||||||||||||||||||||||||
| Class R-5 | 848 | 100 | 20 | 2 | (262 | ) | (31 | ) | 606 | 71 | ||||||||||||||||||||||
| Class R-6 | 7,611 | 925 | 127 | 15 | (1,112 | ) | (134 | ) | 6,626 | 806 | ||||||||||||||||||||||
| Total net increase (decrease) | $ | 434,904 | 51,860 | $ | 10,304 | 1,211 | $ | (443,996 | ) | (52,915 | ) | $ | 1,212 | 156 | ||||||||||||||||||
| 26 | American Funds Developing World Growth and Income Fund |
| Reinvestments | Net increase | |||||||||||||||||||||||||||||||
| Sales1 | of dividends | Repurchases1 | (decrease) | |||||||||||||||||||||||||||||
| Share class | Amount | Shares | Amount | Shares | Amount | Shares | Amount | Shares | ||||||||||||||||||||||||
| Year ended November 30, 2015 | ||||||||||||||||||||||||||||||||
| Class A | $ | 576,953 | 57,350 | $ | 21,920 | 2,284 | $ | (290,334 | ) | (30,124 | ) | $ | 308,539 | 29,510 | ||||||||||||||||||
| Class B | 274 | 27 | 7 | 1 | (607 | ) | (60 | ) | (326 | ) | (32 | ) | ||||||||||||||||||||
| Class C | 47,985 | 4,756 | 1,311 | 137 | (32,092 | ) | (3,308 | ) | 17,204 | 1,585 | ||||||||||||||||||||||
| Class F-1 | 72,860 | 7,254 | 2,023 | 210 | (76,229 | ) | (7,788 | ) | (1,346 | ) | (324 | ) | ||||||||||||||||||||
| Class F-2 | 511,428 | 51,514 | 10,782 | 1,119 | (294,286 | ) | (31,320 | ) | 227,924 | 21,313 | ||||||||||||||||||||||
| Class 529-A | 11,845 | 1,171 | 360 | 38 | (2,548 | ) | (260 | ) | 9,657 | 949 | ||||||||||||||||||||||
| Class 529-B | 12 | 1 | 1 | — | 2 | (82 | ) | (8 | ) | (69 | ) | (7 | ) | |||||||||||||||||||
| Class 529-C | 2,098 | 210 | 35 | 4 | (646 | ) | (68 | ) | 1,487 | 146 | ||||||||||||||||||||||
| Class 529-E | 392 | 40 | 11 | 1 | (177 | ) | (19 | ) | 226 | 22 | ||||||||||||||||||||||
| Class 529-F-1 | 1,036 | 101 | 22 | 2 | (338 | ) | (35 | ) | 720 | 68 | ||||||||||||||||||||||
| Class R-1 | 676 | 65 | 19 | 2 | (315 | ) | (32 | ) | 380 | 35 | ||||||||||||||||||||||
| Class R-2 | 4,359 | 436 | 43 | 5 | (1,076 | ) | (112 | ) | 3,326 | 329 | ||||||||||||||||||||||
| Class R-2E | — | — | — | 2 | — | 2 | (9 | ) | (1 | ) | (9 | ) | (1 | ) | ||||||||||||||||||
| Class R-3 | 3,642 | 365 | 62 | 8 | (1,163 | ) | (119 | ) | 2,541 | 254 | ||||||||||||||||||||||
| Class R-4 | 3,722 | 370 | 68 | 7 | (1,439 | ) | (147 | ) | 2,351 | 230 | ||||||||||||||||||||||
| Class R-5E3 | 10 | 1 | — | — | — | — | 10 | 1 | ||||||||||||||||||||||||
| Class R-5 | 2,373 | 240 | 37 | 4 | (211 | ) | (21 | ) | 2,199 | 223 | ||||||||||||||||||||||
| Class R-6 | 7,719 | 789 | 248 | 26 | (699 | ) | (72 | ) | 7,268 | 743 | ||||||||||||||||||||||
| Total net increase (decrease) | $ | 1,247,384 | 124,690 | $ | 36,949 | 3,848 | $ | (702,251 | ) | (73,494 | ) | $ | 582,082 | 55,044 | ||||||||||||||||||
| 1 | Includes exchanges between share classes of the fund. |
| 2 | Amount less than one thousand. |
| 3 | Class R-5E shares were offered beginning November 20, 2015. |
9. Investment transactions
The fund made purchases and sales of investment securities, excluding short-term securities and U.S. government obligations, if any, of $271,325,000 and $259,884,000, respectively, during the six months ended May 31, 2016.
| American Funds Developing World Growth and Income Fund | 27 |
Financial highlights
| Income (loss) from investment operations1 | ||||||||||||||||
| Net asset value, beginning of period |
Net investment income |
Net gains (losses) on securities (both realized and unrealized) |
Total from investment operations |
|||||||||||||
| Class A: | ||||||||||||||||
| Six months ended 5/31/20164,5 | $ | 8.69 | $ | .10 | $ | .06 | $ | .16 | ||||||||
| Year ended 11/30/2015 | 10.86 | .17 | (2.18 | ) | (2.01 | ) | ||||||||||
| Period from 2/3/2014 to 11/30/20145,8 | 10.00 | .17 | .81 | .98 | ||||||||||||
| Class B: | ||||||||||||||||
| Six months ended 5/31/20164,5 | 8.67 | .06 | .07 | .13 | ||||||||||||
| Year ended 11/30/2015 | 10.83 | .09 | (2.15 | ) | (2.06 | ) | ||||||||||
| Period from 2/3/2014 to 11/30/20145,8 | 10.00 | .10 | .82 | .92 | ||||||||||||
| Class C: | ||||||||||||||||
| Six months ended 5/31/20164,5 | 8.66 | .07 | .05 | .12 | ||||||||||||
| Year ended 11/30/2015 | 10.83 | .09 | (2.16 | ) | (2.07 | ) | ||||||||||
| Period from 2/3/2014 to 11/30/20145,8 | 10.00 | .09 | .83 | .92 | ||||||||||||
| Class F-1: | ||||||||||||||||
| Six months ended 5/31/20164,5 | 8.70 | .11 | .05 | .16 | ||||||||||||
| Year ended 11/30/2015 | 10.86 | .17 | (2.17 | ) | (2.00 | ) | ||||||||||
| Period from 2/3/2014 to 11/30/20145,8 | 10.00 | .18 | .80 | .98 | ||||||||||||
| Class F-2: | ||||||||||||||||
| Six months ended 5/31/20164,5 | 8.70 | .12 | .06 | .18 | ||||||||||||
| Year ended 11/30/2015 | 10.87 | .21 | (2.19 | ) | (1.98 | ) | ||||||||||
| Period from 2/3/2014 to 11/30/20145,8 | 10.00 | .16 | .85 | 1.01 | ||||||||||||
| Class 529-A: | ||||||||||||||||
| Six months ended 5/31/20164,5 | 8.69 | .10 | .05 | .15 | ||||||||||||
| Year ended 11/30/2015 | 10.85 | .18 | (2.17 | ) | (1.99 | ) | ||||||||||
| Period from 2/3/2014 to 11/30/20145,8 | 10.00 | .15 | .82 | .97 | ||||||||||||
| 28 | American Funds Developing World Growth and Income Fund |
| Dividends (from net investment income) |
Net asset value, end of period |
Total return2,3 |
Net assets, end of period (in millions) |
Ratio of expenses to average net assets before reimbursements/ waivers |
Ratio of expenses to average net assets after reimbursements/ waivers2 |
Ratio of net income to average net assets2 |
||||||||||||||||||||
| $ | (.04 | ) | $ | 8.81 | 1.89 | %6 | $ | 1,289 | 1.44 | %7 | 1.44 | %7 | 2.40 | %7 | ||||||||||||
| (.16 | ) | 8.69 | (18.65 | ) | 1,251 | 1.32 | 1.32 | 1.70 | ||||||||||||||||||
| (.12 | ) | 10.86 | 9.75 | 6 | 1,242 | 1.40 | 7 | 1.39 | 7 | 1.81 | 7 | |||||||||||||||
| (.01 | ) | 8.79 | 1.46 | 6 | — | 9 | 2.17 | 7 | 2.17 | 7 | 1.44 | 7 | ||||||||||||||
| (.10 | ) | 8.67 | (19.12 | ) | — | 9 | 2.03 | 2.02 | .90 | |||||||||||||||||
| (.09 | ) | 10.83 | 9.15 | 6 | 1 | 2.10 | 7 | 2.09 | 7 | 1.13 | 7 | |||||||||||||||
| (.01 | ) | 8.77 | 1.39 | 6 | 109 | 2.19 | 7 | 2.19 | 7 | 1.63 | 7 | |||||||||||||||
| (.10 | ) | 8.66 | (19.18 | ) | 111 | 2.07 | 2.07 | .95 | ||||||||||||||||||
| (.09 | ) | 10.83 | 9.17 | 6 | 122 | 2.14 | 7 | 2.13 | 7 | .94 | 7 | |||||||||||||||
| (.05 | ) | 8.81 | 1.81 | 6 | 86 | 1.34 | 7 | 1.34 | 7 | 2.49 | 7 | |||||||||||||||
| (.16 | ) | 8.70 | (18.52 | ) | 102 | 1.26 | 1.26 | 1.72 | ||||||||||||||||||
| (.12 | ) | 10.86 | 9.80 | 6 | 131 | 1.34 | 7 | 1.33 | 7 | 1.91 | 7 | |||||||||||||||
| (.06 | ) | 8.82 | 2.06 | 6 | 564 | 1.08 | 7 | 1.08 | 7 | 2.77 | 7 | |||||||||||||||
| (.19 | ) | 8.70 | (18.37 | ) | 572 | 1.00 | 1.00 | 2.08 | ||||||||||||||||||
| (.14 | ) | 10.87 | 10.02 | 6 | 482 | 1.07 | 7 | 1.07 | 7 | 1.75 | 7 | |||||||||||||||
| (.04 | ) | 8.80 | 1.78 | 6 | 24 | 1.42 | 7 | 1.42 | 7 | 2.44 | 7 | |||||||||||||||
| (.17 | ) | 8.69 | (18.52 | ) | 21 | 1.25 | 1.25 | 1.79 | ||||||||||||||||||
| (.12 | ) | 10.85 | 9.62 | 6 | 16 | 1.50 | 7 | 1.49 | 7 | 1.60 | 7 | |||||||||||||||
See page 33 for footnotes.
| American Funds Developing World Growth and Income Fund | 29 |
Financial highlights (continued)
| Income (loss) from investment operations1 | ||||||||||||||||
| Net asset value, beginning of period |
Net investment income |
Net gains (losses) on securities (both realized and unrealized) |
Total from investment operations |
|||||||||||||
| Class 529-B: | ||||||||||||||||
| Six months ended 5/31/20164,5 | $ | 8.67 | $ | .07 | $ | .07 | $ | .14 | ||||||||
| Year ended 11/30/2015 | 10.84 | .09 | (2.17 | ) | (2.08 | ) | ||||||||||
| Period from 2/3/2014 to 11/30/20145,8 | 10.00 | .07 | .85 | .92 | ||||||||||||
| Class 529-C: | ||||||||||||||||
| Six months ended 5/31/20164,5 | 8.65 | .07 | .06 | .13 | ||||||||||||
| Year ended 11/30/2015 | 10.83 | .09 | (2.17 | ) | (2.08 | ) | ||||||||||
| Period from 2/3/2014 to 11/30/20145,8 | 10.00 | .08 | .83 | .91 | ||||||||||||
| Class 529-E: | ||||||||||||||||
| Six months ended 5/31/20164,5 | 8.68 | .09 | .07 | .16 | ||||||||||||
| Year ended 11/30/2015 | 10.85 | .15 | (2.18 | ) | (2.03 | ) | ||||||||||
| Period from 2/3/2014 to 11/30/20145,8 | 10.00 | .13 | .83 | .96 | ||||||||||||
| Class 529-F-1: | ||||||||||||||||
| Six months ended 5/31/20164,5 | 8.69 | .11 | .06 | .17 | ||||||||||||
| Year ended 11/30/2015 | 10.86 | .19 | (2.18 | ) | (1.99 | ) | ||||||||||
| Period from 2/3/2014 to 11/30/20145,8 | 10.00 | .15 | .84 | .99 | ||||||||||||
| Class R-1: | ||||||||||||||||
| Six months ended 5/31/20164,5 | 8.66 | .07 | .06 | .13 | ||||||||||||
| Year ended 11/30/2015 | 10.83 | .10 | (2.17 | ) | (2.07 | ) | ||||||||||
| Period from 2/3/2014 to 11/30/20145,8 | 10.00 | .10 | .82 | .92 | ||||||||||||
| Class R-2: | ||||||||||||||||
| Six months ended 5/31/20164,5 | 8.64 | .06 | .06 | .12 | ||||||||||||
| Year ended 11/30/2015 | 10.82 | .09 | (2.17 | ) | (2.08 | ) | ||||||||||
| Period from 2/3/2014 to 11/30/20145,8 | 10.00 | .08 | .84 | .92 | ||||||||||||
| 30 | American Funds Developing World Growth and Income Fund |
| Dividends (from net investment income) |
Net asset value, end of period |
Total return2,3 |
Net assets, end of period (in millions) |
Ratio of expenses to average net assets before reimbursements/ waivers |
Ratio of expenses to average net assets after reimbursements/ waivers2 |
Ratio of net income to average net assets2 |
||||||||||||||||||||
| $ | (.02 | ) | $ | 8.79 | 1.59 | %6,10 | $ | — | 9 | 2.00 | %7,10 | 2.00 | %7,10 | 1.78 | %7,10 | |||||||||||
| (.09 | ) | 8.67 | (19.28 | )10 | — | 9 | 2.12 | 10 | 2.12 | 10 | .89 | 10 | ||||||||||||||
| (.08 | ) | 10.84 | 9.14 | 6,10 | — | 9 | 2.18 | 7,10 | 2.17 | 7,10 | .74 | 7,10 | ||||||||||||||
| (.01 | ) | 8.77 | 1.49 | 6 | 4 | 2.26 | 7 | 2.26 | 7 | 1.61 | 7 | |||||||||||||||
| (.10 | ) | 8.65 | (19.29 | ) | 3 | 2.13 | 2.13 | .92 | ||||||||||||||||||
| (.08 | ) | 10.83 | 9.11 | 6 | 2 | 2.20 | 7 | 2.19 | 7 | .91 | 7 | |||||||||||||||
| (.04 | ) | 8.80 | 1.82 | 6 | 1 | 1.61 | 7 | 1.61 | 7 | 2.23 | 7 | |||||||||||||||
| (.14 | ) | 8.68 | (18.81 | ) | 1 | 1.51 | 1.51 | 1.51 | ||||||||||||||||||
| (.11 | ) | 10.85 | 9.56 | 6 | 1 | 1.62 | 7 | 1.61 | 7 | 1.40 | 7 | |||||||||||||||
| (.05 | ) | 8.81 | 1.98 | 6 | 2 | 1.25 | 7 | 1.25 | 7 | 2.66 | 7 | |||||||||||||||
| (.18 | ) | 8.69 | (18.48 | ) | 1 | 1.12 | 1.12 | 1.94 | ||||||||||||||||||
| (.13 | ) | 10.86 | 9.87 | 6 | 1 | 1.18 | 7 | 1.17 | 7 | 1.63 | 7 | |||||||||||||||
| (.01 | ) | 8.78 | 1.54 | 6 | 2 | 2.09 | 7 | 2.09 | 7 | 1.65 | 7 | |||||||||||||||
| (.10 | ) | 8.66 | (19.15 | ) | 1 | 1.99 | 1.99 | 1.05 | ||||||||||||||||||
| (.09 | ) | 10.83 | 9.17 | 6 | 2 | 2.08 | 7 | 2.08 | 7 | 1.06 | 7 | |||||||||||||||
| — | 11 | 8.76 | 1.43 | 6 | 6 | 2.36 | 7 | 2.36 | 7 | 1.54 | 7 | |||||||||||||||
| (.10 | ) | 8.64 | (19.33 | ) | 4 | 2.19 | 2.19 | .92 | ||||||||||||||||||
| (.10 | ) | 10.82 | 9.17 | 6 | 2 | 2.11 | 7 | 2.11 | 7 | .90 | 7 | |||||||||||||||
See page 33 for footnotes.
| American Funds Developing World Growth and Income Fund | 31 |
Financial highlights (continued)
| Income (loss) from investment operations1 | ||||||||||||||||
| Net asset value, beginning of period |
Net investment income |
Net gains (losses) on securities (both realized and unrealized) |
Total from investment operations |
|||||||||||||
| Class R-2E: | ||||||||||||||||
| Six months ended 5/31/20164,5 | $ | 8.69 | $ | .10 | $ | .05 | $ | .15 | ||||||||
| Year ended 11/30/2015 | 10.85 | .14 | (2.13 | ) | (1.99 | ) | ||||||||||
| Period from 8/29/2014 to 11/30/20145,12 | 11.67 | .01 | (.76 | ) | (.75 | ) | ||||||||||
| Class R-3: | ||||||||||||||||
| Six months ended 5/31/20164,5 | 8.68 | .09 | .05 | .14 | ||||||||||||
| Year ended 11/30/2015 | 10.84 | .15 | (2.17 | ) | (2.02 | ) | ||||||||||
| Period from 2/3/2014 to 11/30/20145,8 | 10.00 | .11 | .85 | .96 | ||||||||||||
| Class R-4: | ||||||||||||||||
| Six months ended 5/31/20164,5 | 8.69 | .11 | .06 | .17 | ||||||||||||
| Year ended 11/30/2015 | 10.86 | .18 | (2.18 | ) | (2.00 | ) | ||||||||||
| Period from 2/3/2014 to 11/30/20145,8 | 10.00 | .13 | .86 | .99 | ||||||||||||
| Class R-5E: | ||||||||||||||||
| Six months ended 5/31/20164,5 | 8.69 | .11 | .06 | .17 | ||||||||||||
| Period from 11/20/2015 to 11/30/20155,13 | 8.95 | — | 11 | (.26 | ) | (.26 | ) | |||||||||
| Class R-5: | ||||||||||||||||
| Six months ended 5/31/20164,5 | 8.70 | .12 | .06 | .18 | ||||||||||||
| Year ended 11/30/2015 | 10.87 | .20 | (2.17 | ) | (1.97 | ) | ||||||||||
| Period from 2/3/2014 to 11/30/20145,8 | 10.00 | .19 | .82 | 1.01 | ||||||||||||
| Class R-6: | ||||||||||||||||
| Six months ended 5/31/20164,5 | 8.70 | .13 | .05 | .18 | ||||||||||||
| Year ended 11/30/2015 | 10.87 | .20 | (2.17 | ) | (1.97 | ) | ||||||||||
| Period from 2/3/2014 to 11/30/20145,8 | 10.00 | .08 | .93 | 1.01 | ||||||||||||
| Six
months ended May 31, 20164,5,6 |
Year
ended November 30 2015 |
For
the period 2/3/2014 to 11/30/20145,6,8 |
|||||||||
| Portfolio turnover rate for all share classes | 14% | 29% | 20% |
See Notes to Financial Statements
| 32 | American Funds Developing World Growth and Income Fund |
| Dividends (from net investment income) |
Net asset value, end of period |
Total return2,3 |
Net assets, end of period (in millions) |
Ratio of expenses to average net assets before reimbursements/ waivers |
Ratio of expenses to average net assets after reimbursements/ waivers2 |
Ratio of net income to average net assets2 |
||||||||||||||||||||
| $ | (.05 | ) | $ | 8.79 | 1.70 | %6,10 | $ | — | 9 | 1.71 | %7,10 | 1.66 | %7,10 | 2.35 | %7,10 | |||||||||||
| (.17 | ) | 8.69 | (18.47 | )10 | — | 9 | 1.29 | 10 | 1.27 | 10 | 1.36 | 10 | ||||||||||||||
| (.07 | ) | 10.85 | (6.46 | )6,10 | — | 9 | .35 | 6,10 | .35 | 6,10 | .09 | 6,10 | ||||||||||||||
| (.03 | ) | 8.79 | 1.66 | 6 | 6 | 1.68 | 7 | 1.68 | 7 | 2.20 | 7 | |||||||||||||||
| (.14 | ) | 8.68 | (18.77 | ) | 5 | 1.56 | 1.55 | 1.49 | ||||||||||||||||||
| (.12 | ) | 10.84 | 9.54 | 6 | 3 | 1.62 | 7 | 1.62 | 7 | 1.17 | 7 | |||||||||||||||
| (.05 | ) | 8.81 | 1.95 | 6 | 5 | 1.34 | 7 | 1.34 | 7 | 2.62 | 7 | |||||||||||||||
| (.17 | ) | 8.69 | (18.57 | ) | 4 | 1.24 | 1.23 | 1.86 | ||||||||||||||||||
| (.13 | ) | 10.86 | 9.82 | 6 | 2 | 1.33 | 7 | 1.32 | 7 | 1.42 | 7 | |||||||||||||||
| (.06 | ) | 8.80 | 1.95 | 6 | — | 9 | 1.17 | 7 | 1.17 | 7 | 2.65 | 7 | ||||||||||||||
| — | 8.69 | (2.90 | )6 | — | 9 | .03 | 6 | .03 | 6 | .01 | 6 | |||||||||||||||
| (.06 | ) | 8.82 | 2.10 | 6 | 3 | 1.03 | 7 | 1.03 | 7 | 2.87 | 7 | |||||||||||||||
| (.20 | ) | 8.70 | (18.32 | ) | 3 | .92 | .92 | 2.08 | ||||||||||||||||||
| (.14 | ) | 10.87 | 10.02 | 6 | 1 | 1.05 | 7 | 1.04 | 7 | 2.06 | 7 | |||||||||||||||
| (.06 | ) | 8.82 | 2.13 | 6 | 22 | .97 | 7 | .97 | 7 | 3.14 | 7 | |||||||||||||||
| (.20 | ) | 8.70 | (18.28 | ) | 15 | .88 | .88 | 2.06 | ||||||||||||||||||
| (.14 | ) | 10.87 | 10.05 | 6 | 10 | .98 | 7 | .97 | 7 | .94 | 7 | |||||||||||||||
| 1 | Based on average shares outstanding. |
| 2 | This column reflects the impact, if any, of certain reimbursements/waivers from CRMC. During some of the periods shown, CRMC reduced fees for investment advisory services and reimbursed other fees and expenses. |
| 3 | Total returns exclude any applicable sales charges, including contingent deferred sales charges. |
| 4 | Unaudited. |
| 5 | Based on operations for the period shown and, accordingly, is not representative of a full year. |
| 6 | Not annualized. |
| 7 | Annualized. |
| 8 | For the period February 3, 2014, commencement of operations, through November 30, 2014. |
| 9 | Amount less than $1 million. |
| 10 | All or a significant portion of assets in this class consisted of seed capital invested by CRMC and/or its affiliates. Fees for distribution services are not charged or accrued on these seed capital assets. If such fees were paid by the fund on seed capital assets, fund expenses would have been higher and net income and total return would have been lower. |
| 11 | Amount less than $.01. |
| 12 | Class R-2E shares were offered beginning August 29, 2014. |
| 13 | Class R-5E shares were offered beginning November 20, 2015. |
| American Funds Developing World Growth and Income Fund | 33 |
| Expense example | unaudited |
As a fund shareholder, you incur two types of costs: (1) transaction costs, such as initial sales charges on purchase payments and contingent deferred sales charges on redemptions (loads), and (2) ongoing costs, including management fees, distribution and service (12b-1) fees, and other expenses. This example is intended to help you understand your ongoing costs (in dollars) of investing in the fund so you can compare these costs with the ongoing costs of investing in other mutual funds. The example is based on an investment of $1,000 invested at the beginning of the period and held for the entire six-month period (December 1, 2015, through May 31, 2016).
Actual expenses:
The first line of each share class in the table on the following page provides information about actual account values and actual expenses. You may use the information in this line, together with the amount you invested, to estimate the expenses that you paid over the period. Simply divide your account value by $1,000 (for example, an $8,600 account value divided by $1,000 = 8.6), then multiply the result by the number in the first line under the heading entitled “Expenses paid during period” to estimate the expenses you paid on your account during this period.
Hypothetical example for comparison purposes:
The second line of each share class in the table on the following page provides information about hypothetical account values and hypothetical expenses based on the actual expense ratio for the share class and an assumed rate of return of 5.00% per year before expenses, which is not the actual return of the share class. The hypothetical account values and expenses may not be used to estimate the actual ending account balance or expenses you paid for the period. You may use this information to compare the ongoing costs of investing in the fund and other funds. To do so, compare this 5.00% hypothetical example with the 5.00% hypothetical examples that appear in the shareholder reports of the other funds.
Notes:
Retirement plan participants may be subject to certain fees charged by the plan sponsor, and Class F-1, F-2 and 529-F-1 shareholders may be subject to fees charged by financial intermediaries, typically ranging from 0.75% to 1.50% of assets annually depending on services offered. You can estimate the impact of these fees by adding the amount of the fees to the total estimated expenses you paid on your account during the period as calculated above. In addition, your ending account value would be lower by the amount of these fees.
Note that the expenses shown in the table on the following page are meant to highlight your ongoing costs only and do not reflect any transactional costs, such as sales charges (loads). Therefore, the second line of each share class in the table is useful in comparing ongoing costs only and will not help you determine the relative total costs of owning different funds. In addition, if these transactional costs were included, your costs would have been higher.
| 34 | American Funds Developing World Growth and Income Fund |
| Beginning | Ending | |||||||||||||||
| account value | account value | Expenses paid | Annualized | |||||||||||||
| 12/1/2015 | 5/31/2016 | during period* | expense ratio | |||||||||||||
| Class A - actual return | $ | 1,000.00 | $ | 1,018.94 | $ | 7.27 | 1.44 | % | ||||||||
| Class A - assumed 5% return | 1,000.00 | 1,017.80 | 7.26 | 1.44 | ||||||||||||
| Class B - actual return | 1,000.00 | 1,014.63 | 10.93 | 2.17 | ||||||||||||
| Class B - assumed 5% return | 1,000.00 | 1,014.15 | 10.93 | 2.17 | ||||||||||||
| Class C - actual return | 1,000.00 | 1,013.93 | 11.03 | 2.19 | ||||||||||||
| Class C - assumed 5% return | 1,000.00 | 1,014.05 | 11.03 | 2.19 | ||||||||||||
| Class F-1 - actual return | 1,000.00 | 1,018.06 | 6.76 | 1.34 | ||||||||||||
| Class F-1 - assumed 5% return | 1,000.00 | 1,018.30 | 6.76 | 1.34 | ||||||||||||
| Class F-2 - actual return | 1,000.00 | 1,020.62 | 5.46 | 1.08 | ||||||||||||
| Class F-2 - assumed 5% return | 1,000.00 | 1,019.60 | 5.45 | 1.08 | ||||||||||||
| Class 529-A - actual return | 1,000.00 | 1,017.83 | 7.16 | 1.42 | ||||||||||||
| Class 529-A - assumed 5% return | 1,000.00 | 1,017.90 | 7.16 | 1.42 | ||||||||||||
| Class 529-B - actual return | 1,000.00 | 1,015.90 | 10.08 | 2.00 | ||||||||||||
| Class 529-B - assumed 5% return | 1,000.00 | 1,015.00 | 10.08 | 2.00 | ||||||||||||
| Class 529-C - actual return | 1,000.00 | 1,014.91 | 11.38 | 2.26 | ||||||||||||
| Class 529-C - assumed 5% return | 1,000.00 | 1,013.70 | 11.38 | 2.26 | ||||||||||||
| Class 529-E - actual return | 1,000.00 | 1,018.18 | 8.12 | 1.61 | ||||||||||||
| Class 529-E - assumed 5% return | 1,000.00 | 1,016.95 | 8.12 | 1.61 | ||||||||||||
| Class 529-F-1 - actual return | 1,000.00 | 1,019.80 | 6.31 | 1.25 | ||||||||||||
| Class 529-F-1 - assumed 5% return | 1,000.00 | 1,018.75 | 6.31 | 1.25 | ||||||||||||
| Class R-1 - actual return | 1,000.00 | 1,015.43 | 10.53 | 2.09 | ||||||||||||
| Class R-1 - assumed 5% return | 1,000.00 | 1,014.55 | 10.53 | 2.09 | ||||||||||||
| Class R-2 - actual return | 1,000.00 | 1,014.25 | 11.88 | 2.36 | ||||||||||||
| Class R-2 - assumed 5% return | 1,000.00 | 1,013.20 | 11.88 | 2.36 | ||||||||||||
| Class R-2E - actual return | 1,000.00 | 1,016.98 | 8.37 | 1.66 | ||||||||||||
| Class R-2E - assumed 5% return | 1,000.00 | 1,016.70 | 8.37 | 1.66 | ||||||||||||
| Class R-3 - actual return | 1,000.00 | 1,016.57 | 8.47 | 1.68 | ||||||||||||
| Class R-3 - assumed 5% return | 1,000.00 | 1,016.60 | 8.47 | 1.68 | ||||||||||||
| Class R-4 - actual return | 1,000.00 | 1,019.46 | 6.77 | 1.34 | ||||||||||||
| Class R-4 - assumed 5% return | 1,000.00 | 1,018.30 | 6.76 | 1.34 | ||||||||||||
| Class R-5E - actual return | 1,000.00 | 1,019.54 | 5.91 | 1.17 | ||||||||||||
| Class R-5E - assumed 5% return | 1,000.00 | 1,019.15 | 5.91 | 1.17 | ||||||||||||
| Class R-5 - actual return | 1,000.00 | 1,020.99 | 5.20 | 1.03 | ||||||||||||
| Class R-5 - assumed 5% return | 1,000.00 | 1,019.85 | 5.20 | 1.03 | ||||||||||||
| Class R-6 - actual return | 1,000.00 | 1,021.27 | 4.90 | .97 | ||||||||||||
| Class R-6 - assumed 5% return | 1,000.00 | 1,020.15 | 4.90 | .97 | ||||||||||||
| * | The “expenses paid during period” are equal to the “annualized expense ratio,” multiplied by the average account value over the period, multiplied by the number of days in the period, and divided by 366 (to reflect the one-half year period). |
| American Funds Developing World Growth and Income Fund | 35 |
Approval of Investment Advisory and Service Agreement
American Funds Developing World Growth and Income Fund’s board has approved the fund’s Investment Advisory and Service Agreement (the “agreement”) with Capital Research and Management Company (“CRMC”) for an additional one-year term through January 31, 2017. The agreement was amended to add an additional advisory fee breakpoint if and when the fund’s net assets exceed $4 billion. The board approved the agreement following the recommendation of the fund’s Contracts Committee (the “committee”), which is composed of all of the fund’s independent board members. The board and the committee determined that the fund’s advisory fee structure was fair and reasonable in relation to the services provided, and that approving the agreement was in the best interests of the fund and its shareholders.
In reaching this decision, the board and the committee took into account information furnished to them throughout the year and otherwise provided to them, as well as information prepared specifically in connection with their review of the agreement, and were advised by their independent counsel. They considered the following factors, among others, but did not identify any single issue or particular piece of information that, in isolation, was the controlling factor, and each board and committee member did not necessarily attribute the same weight to each factor.
1. Nature, extent and quality of services
The board and the committee considered the depth and quality of CRMC’s investment management process, including its global research capabilities; the experience, capability and integrity of its senior management and other personnel; the low turnover rates of its key personnel; the overall financial strength and stability of CRMC and the Capital Group organization; and the ongoing evolution of CRMC’s organizational structure designed to maintain and strengthen these qualities. The board and the committee also considered the nature, extent and quality of administrative, compliance and shareholder services provided by CRMC to the fund under the agreement and other agreements, as well as the benefits to fund shareholders from investing in a fund that is part of a large family of funds. The board and the committee concluded that the nature, extent and quality of the services provided by CRMC have benefited and should continue to benefit the fund and its shareholders.
2. Investment results
The board and the committee considered the investment results of the fund in light of its objective of providing long-term growth of capital while providing current income. They compared the fund’s investment results with those of other funds (including funds that currently form the basis of the Lipper index for the category in which the fund is included), and data such as relevant market and fund indexes, from the fund’s launch date of February 3, 2014, through May 31, 2015. This report, including the letter to shareholders and related disclosures, contains certain information about the fund’s investment results. The board and the committee reviewed the fund’s investment results measured against various indexes, including the Lipper Emerging Markets Funds Index and the MSCI Emerging Markets Index. They noted that for the brief operating period of the fund, the investment results were below the indexes. The board and the committee concluded that the fund’s investment results have been satisfactory for renewal of the agreement, and that CRMC’s record in managing the fund indicated that its continued management should benefit the fund and its shareholders.
| 36 | American Funds Developing World Growth and Income Fund |
3. Advisory fees and total expenses
The board and the committee compared the advisory fees and total expense levels of the fund to those of other relevant funds. They observed that the fund’s advisory fees and expenses generally compared favorably to those of other similar funds included in the Lipper Emerging Markets Funds category. The board and the committee also considered the breakpoint discounts in the fund’s advisory fee structure that reduce the level of fees charged by CRMC to the fund as fund assets increase. In addition, they reviewed information regarding the effective advisory fees charged to non-mutual fund clients by CRMC and its affiliates. They noted that, to the extent there were differences between the advisory fees paid by the fund and the advisory fees paid by those clients, the differences appropriately reflected the investment, operational, regulatory and market differences between advising the fund and the other clients. The board and the committee concluded that the fund’s cost structure was fair and reasonable in relation to the services provided, and that the fund’s shareholders receive reasonable value in return for the advisory fees and other amounts paid to CRMC by the fund.
4. Ancillary benefits
The board and the committee considered a variety of other benefits that CRMC and its affiliates receive as a result of CRMC’s relationship with the fund and the other American Funds, including fees for administrative services provided to certain share classes; fees paid to CRMC’s affiliated transfer agent; sales charges and distribution fees received and retained by the fund’s principal underwriter, an affiliate of CRMC; and possible ancillary benefits to CRMC and its institutional management affiliates in managing other investment vehicles. The board and the committee reviewed CRMC’s portfolio trading practices, noting the benefits CRMC receives from the research obtained with commissions from portfolio transactions made on behalf of the fund. The board and the committee took these ancillary benefits into account in evaluating the reasonableness of the advisory fees and other amounts paid to CRMC by the fund.
5. Adviser financial information
The board and the committee reviewed information regarding CRMC’s costs of providing services to the American Funds, including personnel, systems and resources of investment, compliance, trading, accounting and other administrative operations. They considered CRMC’s costs and related cost allocation methodology, as well as its willingness to invest in technology, infrastructure and staff to maintain and expand services and capabilities, respond to industry and regulatory developments, and attract and retain qualified personnel. They noted information regarding the compensation structure for CRMC’s investment professionals. The board and the committee also compared CRMC’s profitability and compensation data to the reported results and data of several large, publicly held investment management companies. The board and the committee noted the competitiveness and cyclicality of both the mutual fund industry and the capital markets, and the importance in that environment of CRMC’s long-term profitability for maintaining its independence, company culture and management continuity. They further considered the breakpoint discounts in the fund’s advisory fee structure. The board and the committee concluded that the fund’s advisory fee structure reflected a reasonable sharing of benefits between CRMC and the fund’s shareholders.
| American Funds Developing World Growth and Income Fund | 37 |
This page was intentionally left blank.
| 38 | American Funds Developing World Growth and Income Fund |
This page was intentionally left blank.
| American Funds Developing World Growth and Income Fund | 39 |
This page was intentionally left blank.
| 40 | American Funds Developing World Growth and Income Fund |
This page was intentionally left blank.
| American Funds Developing World Growth and Income Fund | 41 |
This page was intentionally left blank.
| 42 | American Funds Developing World Growth and Income Fund |
This page was intentionally left blank.
| American Funds Developing World Growth and Income Fund | 43 |
Office of the fund
6455 Irvine Center Drive
Irvine, CA 92618-4518
Investment adviser
Capital Research and Management Company
333 South Hope Street
Los Angeles, CA 90071-1406
6455 Irvine Center Drive
Irvine, CA 92618-4518
Transfer agent for shareholder accounts
American Funds Service Company
(Write to the address near you.)
P.O. Box 6007
Indianapolis, IN 46206-6007
P.O. Box 2280
Norfolk, VA 23501-2280
Custodian of assets
Bank of New York Mellon
One Wall Street
New York, NY 10286
Counsel
Morgan, Lewis & Bockius LLP
300 South Grand Avenue, 22nd Floor
Los Angeles, CA 90071-3132
Independent registered public accounting firm
Deloitte & Touche LLP
695 Town Center Drive
Suite 1200
Costa Mesa, CA 92626-7188
Principal underwriter
American Funds Distributors, Inc.
333 South Hope Street
Los Angeles, CA 90071-1406
| 44 | American Funds Developing World Growth and Income Fund |
Investors should carefully consider investment objectives, risks, charges and expenses. This and other important information is contained in the fund prospectus and summary prospectus, which can be obtained from your financial professional and should be read carefully before investing. You may also call American Funds Service Company (AFS) at (800) 421-4225 or visit the American Funds website at americanfunds.com.
“American Funds Proxy Voting Procedures and Principles” — which describes how we vote proxies relating to portfolio securities — is available on the American Funds website or upon request by calling AFS. The fund files its proxy voting record with the U.S. Securities and Exchange Commission (SEC) for the 12 months ended June 30 by August 31. The proxy voting record is available free of charge on the SEC website at sec.gov and on the American Funds website.
A complete May 31, 2016, portfolio of American Funds Developing World Growth and Income Fund’s investments is available free of charge by calling AFS or visiting the SEC website (where it is part of Form N-CSR).
American Funds Developing World Growth and Income Fund files a complete list of its portfolio holdings with the SEC for the first and third quarters of each fiscal year on Form N-Q. This filing is available free of charge on the SEC website. You may also review or, for a fee, copy this filing at the SEC’s Public Reference Room in Washington, D.C. Additional information regarding the operation of the Public Reference Room may be obtained by calling the SEC’s Office of Investor Education and Advocacy at (800) SEC-0330. Additionally, the list of portfolio holdings is available by calling AFS.
This report is for the information of shareholders of American Funds Developing World Growth and Income Fund, but it also may be used as sales literature when preceded or accompanied by the current prospectus or summary prospectus, which gives details about charges, expenses, investment objectives and operating policies of the fund. If used as sales material after September 30, 2016, this report must be accompanied by an American Funds statistical update for the most recently completed calendar quarter.
The American Funds AdvantageSM
Since 1931, American Funds, part of Capital Group, has helped investors pursue long-term investment success. Our consistent approach — in combination with The Capital SystemSM — has resulted in a superior long-term track record.
| Aligned with investor success | |
| We base our decisions on a long-term perspective, which we believe aligns our goals with the interests of our clients. Our portfolio managers average 27 years of investment experience, including 22 years at our company, reflecting a career commitment to our long-term approach.1 | |
| The Capital SystemSM | |
| The Capital System combines individual accountability with teamwork. Funds using The Capital System are divided into portions that are managed independently by investment professionals with diverse backgrounds, ages and investment approaches. An extensive global research effort is the backbone of our system. | |
| Superior long-term track record | |
| Our equity funds have beaten their Lipper peer indexes in 91% of 10-year periods and 95% of 20-year periods. Our fixed-income funds have beaten their Lipper indexes in 58% of 10-year periods and 58% of 20-year periods.2 Our fund management fees have been among the lowest in the industry.3 | |
| 1 | Portfolio manager experience as of December 31, 2015. | |
| 2 | Based on Class A share results for rolling periods through December 31, 2015. Periods covered are the shorter of the fund’s lifetime or since the comparable Lipper index inception date (except Capital Income Builder and SMALLCAP World Fund, for which the Lipper average was used). | |
| 3 | On average, our management fees were in the lowest quintile 68% of the time, based on the 20-year period ended December 31, 2015, versus comparable Lipper categories, excluding funds of funds. |

ITEM 2 – Code of Ethics
Not applicable for filing of semi-annual reports to shareholders.
ITEM 3 – Audit Committee Financial Expert
Not applicable for filing of semi-annual reports to shareholders.
ITEM 4 – Principal Accountant Fees and Services
Not applicable for filing of semi-annual reports to shareholders.
ITEM 5 – Audit Committee of Listed Registrants
Not applicable to this Registrant, insofar as the Registrant is not a listed issuer as defined in Rule 10A-3 under the Securities Exchange Act of 1934.
ITEM 6 – Schedule of Investments

| Common stocks 89.52% Financials 18.86% |
Shares | Value (000) |
| Fibra Uno Administración, SA de CV | 21,389,900 | $46,311 |
| Discovery Ltd. | 5,620,366 | 42,989 |
| First Gulf Bank PJSC | 11,899,338 | 38,389 |
| China Vanke Co. Ltd., Class H | 14,238,000 | 33,933 |
| Moscow Exchange MICEX-RTS PJSC | 19,458,889 | 31,922 |
| Union National Bank PJSC | 31,234,452 | 29,167 |
| China Pacific Insurance (Group) Co., Ltd., Class H1 | 8,122,800 | 27,753 |
| Akbank TAS | 6,390,635 | 17,253 |
| Credicorp Ltd. | 122,200 | 17,133 |
| China Overseas Land & Investment Ltd. | 4,784,000 | 14,375 |
| Shinhan Financial Group Co., Ltd. | 409,732 | 13,597 |
| BM&FBOVESPA SA - Bolsa de Valores, Mercadorias e Futuros, ordinary nominative | 2,603,600 | 11,470 |
| Banco Bradesco SA, preferred nominative (ADR) | 1,765,720 | 11,053 |
| BDO Unibank, Inc. | 4,906,240 | 10,596 |
| AIA Group Ltd. | 1,771,200 | 10,360 |
| Grupo Financiero Inbursa, SAB de CV | 5,620,500 | 9,373 |
| Siam Commercial Bank PCL | 2,263,800 | 8,491 |
| ICICI Bank Ltd. | 2,329,430 | 8,470 |
| Mapletree Greater China Commercial Trust | 11,070,300 | 7,878 |
| Sberbank of Russia | 3,235,447 | 6,432 |
| Itaú Unibanco Holding SA, preferred nominative (ADR) | 433,785 | 3,475 |
| 400,420 | ||
| Consumer staples 14.33% | ||
| Unilever PLC | 1,335,700 | 60,861 |
| Thai Beverage PCL | 55,467,000 | 35,243 |
| Carlsberg A/S | 341,587 | 32,959 |
| Nestlé SA | 363,397 | 26,834 |
| Philip Morris International Inc. | 255,600 | 25,223 |
| British American Tobacco PLC | 395,700 | 24,059 |
| Shoprite Holdings Ltd. | 2,161,408 | 22,680 |
| Danone SA | 270,894 | 19,013 |
| PZ Cussons PLC | 3,737,500 | 18,957 |
| Diageo PLC | 586,700 | 15,895 |
| Olam International Ltd. | 8,761,600 | 11,579 |
| Mead Johnson Nutrition Co. | 133,200 | 10,960 |
| 304,263 | ||
| Consumer discretionary 12.78% | ||
| Astra International Tbk PT | 120,582,800 | 58,261 |
| Sands China Ltd. | 10,978,400 | 42,101 |
| Stella International Holdings Ltd. | 11,003,000 | 27,045 |
| Matahari Department Store Tbk PT | 17,633,400 | 24,494 |
| PT Surya Citra Media Tbk | 93,543,000 | 22,941 |
| Grupo Sanborns, SAB de CV, Series B1 | 14,235,410 | 18,758 |
| Hyundai Motor Co., Series 2 | 163,432 | 14,399 |
| Hyundai Motor Co. | 34,794 | 4,072 |
| Common stocks Consumer discretionary (continued) |
Shares | Value (000) |
| Wynn Macau, Ltd. | 9,807,200 | $15,347 |
| Minth Group Ltd. | 4,910,000 | 14,438 |
| Merida Industry Co., Ltd. | 2,683,350 | 11,313 |
| Chow Sang Sang Holdings International Ltd. | 3,784,000 | 6,467 |
| Naspers Ltd., Class N | 41,810 | 6,149 |
| Great Wall Motor Co. Ltd., Class H | 7,243,500 | 5,574 |
| 271,359 | ||
| Information technology 10.28% | ||
| Taiwan Semiconductor Manufacturing Co., Ltd. | 14,911,000 | 71,554 |
| Taiwan Semiconductor Manufacturing Co., Ltd. (ADR) | 471,200 | 11,648 |
| Delta Electronics, Inc. | 11,827,407 | 54,400 |
| Quanta Computer Inc. | 10,325,000 | 18,363 |
| Broadcom Ltd. | 105,800 | 16,331 |
| Accenture PLC, Class A | 113,000 | 13,444 |
| VTech Holdings Ltd. | 746,600 | 8,176 |
| MercadoLibre, Inc. | 56,400 | 7,699 |
| Infosys Ltd. | 333,800 | 6,194 |
| Tech Mahindra Ltd. | 699,770 | 5,620 |
| Catcher Technology Co., Ltd. | 631,000 | 4,798 |
| 218,227 | ||
| Telecommunication services 8.55% | ||
| HKT Trust and HKT Ltd., units | 29,709,960 | 43,050 |
| América Móvil, SAB de CV, Series L (ADR) | 3,470,400 | 42,512 |
| Globe Telecom, Inc. | 719,605 | 37,084 |
| Singapore Telecommunications Ltd. | 8,245,700 | 23,173 |
| Bharti Airtel Ltd. | 4,166,654 | 21,761 |
| Perusahaan Perseroan (Persero) PT Telekomunikasi Indonesia Tbk, Class B | 29,672,300 | 8,037 |
| MegaFon PJSC (GDR) | 527,095 | 5,904 |
| 181,521 | ||
| Industrials 7.75% | ||
| CCR SA, ordinary nominative | 8,672,300 | 36,599 |
| CTCI Corp. | 16,667,000 | 23,994 |
| SEEK Ltd. | 1,926,052 | 22,691 |
| BTS Rail Mass Transit Growth Infrastructure Fund | 52,714,700 | 17,412 |
| AirTAC International Group | 2,297,250 | 15,391 |
| Haitian International Holdings Ltd. | 8,335,000 | 13,386 |
| Edenred SA | 711,501 | 13,181 |
| IJM Corp. Bhd. | 15,083,400 | 12,749 |
| Beijing Enterprises Holdings Ltd. | 1,590,500 | 8,269 |
| Yungtay Engineering Co., Ltd. | 592,189 | 869 |
| 164,541 | ||
| Energy 3.91% | ||
| Coal India Ltd. | 7,189,190 | 31,135 |
| Türkiye Petrol Rafinerileri AS | 953,781 | 21,518 |
| Oil Search Ltd. | 3,875,270 | 19,018 |
| Tenaris SA (ADR) | 262,900 | 6,948 |
| Rosneft Oil Company OJSC (GDR) | 935,700 | 4,527 |
| 83,146 |
| Common stocks Health care 3.66% |
Shares | Value (000) |
| Shanghai Fosun Pharmaceutical (Group) Co., Ltd. Class H | 12,465,500 | $32,404 |
| Odontoprev SA, ordinary nominative | 6,531,100 | 20,261 |
| Shanghai Pharmaceutical (Group) Co., Ltd., Class H | 7,598,500 | 16,408 |
| Kalbe Farma Tbk PT1 | 82,088,500 | 8,593 |
| 77,666 | ||
| Materials 3.48% | ||
| Alrosa PJSC | 25,135,753 | 26,556 |
| LafargeHolcim Ltd. | 383,861 | 17,262 |
| Vale SA, Class A, preferred nominative | 5,152,167 | 16,026 |
| Vale SA, Class A, preferred nominative (ADR) | 14,800 | 45 |
| Potash Corp. of Saskatchewan Inc. (CAD denominated) | 514,000 | 8,388 |
| First Quantum Minerals Ltd. | 866,300 | 5,682 |
| 73,959 | ||
| Utilities 1.91% | ||
| Glow Energy PCL | 6,610,200 | 15,913 |
| AES Corp. | 920,600 | 10,209 |
| Enersis Américas SA (ADR) | 1,086,400 | 8,300 |
| Enersis Chile SA (ADR) | 1,086,400 | 6,171 |
| 40,593 | ||
| Miscellaneous 4.01% | ||
| Other common stocks in initial period of acquisition | 85,113 | |
| Total common stocks (cost: $2,134,936,000) | 1,900,808 | |
| Preferred securities 0.50% Consumer discretionary 0.50% |
||
| Zee Entertainment Enterprises Ltd., 6.00% preferred, expires 2022 | 78,949,000 | 10,501 |
| Total preferred securities (cost: $10,800,000) | 10,501 | |
| Rights & warrants 2.10% Consumer staples 2.10% |
||
| Savola Group Co., warrants, expire 20172,3 | 3,190,951 | 31,841 |
| Shanghai Jahwa United Co., Ltd., Class A, warrants, expire 20161,2,3 | 3,000,000 | 12,661 |
| Total rights & warrants (cost: $73,762,000) | 44,502 | |
| Convertible bonds 0.16% Miscellaneous 0.16% |
Principal amount (000) |
|
| Other convertible bonds in initial period of acquisition | 3,443 | |
| Total convertible bonds (cost: $6,352,000) | 3,443 | |
| Bonds, notes & other debt instruments 1.98% Bonds & notes of governments outside the U.S. 0.85% |
||
| Argentina (Republic of) 7.50% 20262 | $ 17,150 | 18,042 |
| Bonds, notes & other debt instruments Corporate bonds & notes 0.81% Industrials 0.33% |
Principal amount (000) |
Value (000) |
| Lima Metro Line Finance Ltd. 5.875% 20342 | $6,795 | $6,982 |
| Telecommunication services 0.30% | ||
| América Móvil, SAB de CV 2.375% 2016 | 6,488 | 6,511 |
| Energy 0.18% | ||
| YPF Sociedad Anónima 8.50% 20252 | 3,650 | 3,759 |
| Total corporate bonds & notes | 17,252 | |
| U.S. Treasury bonds & notes 0.32% U.S. Treasury 0.32% |
||
| U.S. Treasury 0.50% 2016 | 6,700 | 6,701 |
| Total U.S. Treasury bonds & notes | 6,701 | |
| Total bonds, notes & other debt instruments (cost: $40,794,000) | 41,995 | |
| Short-term securities 5.97% | ||
| BASF AG 0.45% due 6/27/20162 | 7,200 | 7,198 |
| Caisse d’Amortissement de la Dette Sociale 0.48% due 7/7/20162 | 17,700 | 17,694 |
| Canadian Imperial Bank of Commerce 0.54% due 8/1/2016 | 15,000 | 15,001 |
| General Electric Co. 0.32% due 6/1/2016 | 49,900 | 49,899 |
| Gotham Funding Corp. 0.45% due 6/2/20162 | 7,000 | 7,000 |
| Sumitomo Mitsui Banking Corp. 0.61% due 6/1/20162 | 10,000 | 10,000 |
| Total Capital Canada Ltd. 0.60% due 7/15/20162 | 20,000 | 19,990 |
| Total short-term securities (cost: $126,775,000) | 126,782 | |
| Total investment securities 100.23% (cost: $2,393,419,000) | 2,128,031 | |
| Other assets less liabilities (0.23)% | (4,806) | |
| Net assets 100.00% | $2,123,225 |
| Settlement date |
Counterparty | Contract amount | Unrealized appreciation at 5/31/2016 (000) | ||
| Receive (000) |
Deliver (000) | ||||
| Sales: | |||||
| British pounds | 7/22/2016 | Bank of America, N.A. | $19,219 | £13,150 | $166 |
| 1 | Security did not produce income during the last 12 months. |
| 2 | Acquired in a transaction exempt from registration under Rule 144A or Section 4(2) of the Securities Act of 1933. May be resold in the U.S. in transactions exempt from registration, normally to qualified institutional buyers. The total value of all such securities was $135,167,000, which represented 6.37% of the net assets of the fund. |
| 3 | Valued under fair value procedures adopted by authority of the board of trustees. The total value of all such securities was $44,502,000, which represented 2.10% of the net assets of the fund. |
| Key to abbreviations and symbol |
| ADR = American Depositary Receipts |
| CAD = Canadian dollars |
| GDR = Global Depositary Receipts |
| £ = British pounds |
| MFGEFPX-100-0716O-S54187 | American Funds Developing World Growth and Income Fund — Page 5 of 5 |
ITEM 7 – Disclosure of Proxy Voting Policies and Procedures for Closed-End Management Investment Companies
Not applicable to this Registrant, insofar as the Registrant is not a closed-end management investment company.
ITEM 8 – Portfolio Managers of Closed-End Management Investment Companies
Not applicable to this Registrant, insofar as the Registrant is not a closed-end management investment company.
ITEM 9 – Purchases of Equity Securities by Closed-End Management Investment Company and Affiliated Purchasers
Not applicable to this Registrant, insofar as the Registrant is not a closed-end management investment company.
ITEM 10 – Submission of Matters to a Vote of Security Holders
There have been no material changes to the procedures by which shareholders may recommend nominees to the Registrant’s board of trustees since the Registrant last submitted a proxy statement to its shareholders. The procedures are as follows. The Registrant has a nominating and governance committee comprised solely of persons who are not considered ‘‘interested persons’’ of the Registrant within the meaning of the Investment Company Act of 1940, as amended. The committee periodically reviews such issues as the board’s composition, responsibilities, committees, compensation and other relevant issues, and recommends any appropriate changes to the full board of trustees. While the committee normally is able to identify from its own resources an ample number of qualified candidates, it will consider shareholder suggestions of persons to be considered as nominees to fill future vacancies on the board. Such suggestions must be sent in writing to the nominating and governance committee of the Registrant, c/o the Registrant’s Secretary, and must be accompanied by complete biographical and occupational data on the prospective nominee, along with a written consent of the prospective nominee for consideration of his or her name by the nominating and governance committee.
ITEM 11 – Controls and Procedures
| (a) | The Registrant’s Principal Executive Officer and Principal Financial Officer have concluded, based on their evaluation of the Registrant’s disclosure controls and procedures (as such term is defined in Rule 30a-3 under the Investment Company Act of 1940), that such controls and procedures are adequate and reasonably designed to achieve the purposes described in paragraph (c) of such rule. |
| (b) | There were no changes in the Registrant’s internal controls over financial reporting (as defined in Rule 30a-3(d) under the Investment Company Act of 1940) that occurred during the Registrant’s second fiscal quarter of the period covered by this report that has materially affected, or is reasonably likely to materially affect, the Registrant’s internal control over financial reporting. |
ITEM 12 – Exhibits
| (a)(1) | Not applicable for filing of semi-annual reports to shareholders. |
| (a)(2) | The certifications required by Rule 30a-2 of the Investment Company Act of 1940 and Sections 302 and 906 of the Sarbanes-Oxley Act of 2002 are attached as exhibits hereto. |
SIGNATURES
Pursuant to the requirements of the Securities Exchange Act of 1934 and the Investment Company Act of 1940, the Registrant has duly caused this report to be signed on its behalf by the undersigned, thereunto duly authorized.
| AMERICAN FUNDS DEVELOPING WORLD GROWTH AND INCOME FUND | |
| By /s/ Shaw B. Wagener | |
|
Shaw B. Wagener, Vice Chairman, President and Principal Executive Officer | |
| Date: July 29, 2016 |
Pursuant to the requirements of the Securities Exchange Act of 1934 and the Investment Company Act of 1940, this report has been signed below by the following persons on behalf of the Registrant and in the capacities and on the dates indicated.
| By /s/ Shaw B. Wagener |
|
Shaw B. Wagener, Vice Chairman, President and Principal Executive Officer |
| Date: July 29, 2016 |
| By /s/ Kimberley H. Monasterio |
|
Kimberley H. Monasterio, Treasurer and Principal Financial Officer |
| Date: July 29, 2016 |
 |
American Funds Developing World Growth
6455 Irvine Center Drive, Irvine, California 92618 (213) 486-9200 |
CERTIFICATION
I, Shaw B. Wagener, certify that:
| 1. | I have reviewed this report on Form N-CSR of American Funds Developing World Growth and Income Fund; |
| 2. | Based on my knowledge, this report does not contain any untrue statement of a material fact or omit to state a material fact necessary to make the statements made, in light of the circumstances under which such statements were made, not misleading with respect to the period covered by this report; |
| 3. | Based on my knowledge, the financial statements, and other financial information included in this report, fairly present in all material respects the financial condition, results of operations, changes in net assets, and cash flows (if the financial statements are required to include a statement of cash flows) of the registrant as of, and for, the periods presented in this report; |
| 4. | The registrant's other certifying officer(s) and I are responsible for establishing and maintaining disclosure controls and procedures (as defined in rule 30a-3(c) under the Investment Company Act of 1940) and internal controls over financial reporting (as defined in Rule 30a-3(d) under the Investment Company Act of 1940) for the registrant and have: |
| a) Designed such disclosure controls and procedures, or caused such disclosure controls and procedures to be designed under our supervision, to ensure that material information relating to the registrant, including its consolidated subsidiaries, is made known to us by others within those entities, particularly during the period in which this report is being prepared; | |
| b) Designed such internal control over financial reporting, or caused such internal control over financial reporting to be designed under our supervision, to provide reasonable assurance regarding the reliability of financial reporting and the preparation of financial statements for external purposes in accordance with generally accepted accounting principles; | |
| c) Evaluated the effectiveness of the registrant's disclosure controls and procedures and presented in this report our conclusions about the effectiveness of the disclosure controls and procedures, as of a date within 90 days prior to the filing date of this report based on such evaluation; and | |
| d) Disclosed in this report any change in the registrant’s internal control over financial reporting that occurred during the registrant’s second fiscal quarter of the period covered by this report that has materially affected, or is reasonably likely to materially affect, the registrant’s internal control over financial reporting; and | |
| 5. | The registrant's other certifying officer(s) and I have disclosed to the registrant's auditors and the audit committee of the registrant's Board of Trustees (or persons performing the equivalent functions): |
| a) All significant deficiencies and material weaknesses in the design or operation of internal control over financial reporting which are reasonably likely to adversely affect the registrant’s ability to record, process, summarize, and report financial information; and | |
| b) Any fraud, whether or not material, that involves management or other employees who have a significant role in the registrant's internal control over financial reporting. |
Date: July 29, 2016
/s/ Shaw B. Wagener
Shaw B. Wagener, Vice Chairman, President and
Principal Executive Officer
American Funds Developing World Growth and Income Fund
 |
American Funds Developing World Growth
6455 Irvine Center Drive, Irvine, California 92618 (213) 486-9200 |
CERTIFICATION
I, Kimberley H. Monasterio, certify that:
| 1. | I have reviewed this report on Form N-CSR of American Funds Developing World Growth and Income Fund; |
| 2. | Based on my knowledge, this report does not contain any untrue statement of a material fact or omit to state a material fact necessary to make the statements made, in light of the circumstances under which such statements were made, not misleading with respect to the period covered by this report; |
| 3. | Based on my knowledge, the financial statements, and other financial information included in this report, fairly present in all material respects the financial condition, results of operations, changes in net assets, and cash flows (if the financial statements are required to include a statement of cash flows) of the registrant as of, and for, the periods presented in this report; |
| 4. | The registrant's other certifying officer(s) and I are responsible for establishing and maintaining disclosure controls and procedures (as defined in rule 30a-3(c) under the Investment Company Act of 1940) and internal controls over financial reporting (as defined in Rule 30a-3(d) under the Investment Company Act of 1940) for the registrant and have: |
| a) Designed such disclosure controls and procedures, or caused such disclosure controls and procedures to be designed under our supervision, to ensure that material information relating to the registrant, including its consolidated subsidiaries, is made known to us by others within those entities, particularly during the period in which this report is being prepared; | |
| b) Designed such internal control over financial reporting, or caused such internal control over financial reporting to be designed under our supervision, to provide reasonable assurance regarding the reliability of financial reporting and the preparation of financial statements for external purposes in accordance with generally accepted accounting principles; | |
| c) Evaluated the effectiveness of the registrant's disclosure controls and procedures and presented in this report our conclusions about the effectiveness of the disclosure controls and procedures, as of a date within 90 days prior to the filing date of this report based on such evaluation; and | |
| d) Disclosed in this report any change in the registrant’s internal control over financial reporting that occurred during the registrant’s second fiscal quarter of the period covered by this report that has materially affected, or is reasonably likely to materially affect, the registrant’s internal control over financial reporting; and | |
| 5. | The registrant's other certifying officer(s) and I have disclosed to the registrant's auditors and the audit committee of the registrant's Board of Trustees (or persons performing the equivalent functions): |
| a) All significant deficiencies and material weaknesses in the design or operation of internal control over financial reporting which are reasonably likely to adversely affect the registrant’s ability to record, process, summarize, and report financial information; and | |
| b) Any fraud, whether or not material, that involves management or other employees who have a significant role in the registrant's internal control over financial reporting. |
Date: July 29, 2016
/s/ Kimberley H. Monasterio
Kimberley H. Monasterio, Treasurer and
Principal Financial Officer
American Funds Developing World Growth and Income Fund
 |
American Funds Developing World Growth
6455 Irvine Center Drive, Irvine, California 92618 (213) 486-9200 |
CERTIFICATION PURSUANT TO 18 U.S.C. SECTION 1350,
AS ADOPTED PURSUANT TO
SECTION 906 OF THE SARBANES-OXLEY ACT OF 2002
SHAW B. WAGENER, Vice Chairman, President and Principal Executive Officer, and KIMBERLEY H. MONASTERIO, Treasurer and Principal Financial Officer of American Funds Developing World Growth and Income Fund (the "Registrant"), each certify to the best of his knowledge that:
| 1) | The Registrant's periodic report on Form N-CSR for the period ended May 31, 2016 (the "Form N-CSR") fully complies with the requirements of Section 13(a) or 15(d) of the Securities Exchange Act of 1934, as amended; and |
| 2) | The information contained in the Form N-CSR fairly presents, in all material respects, the financial condition and results of operations of the Registrant. |
| Principal Executive Officer | Principal Financial Officer |
| AMERICAN FUNDS DEVELOPING WORLD GROWTH AND INCOME FUND | AMERICAN FUNDS DEVELOPING WORLD GROWTH AND INCOME FUND |
| /s/ Shaw B. Wagener | /s/ Kimberley H. Monasterio |
| Shaw B. Wagener, Vice Chairman, President | Kimberley H. Monasterio, Treasurer |
| Date: July 29, 2016 | Date: July 29, 2016 |
A signed original of this written statement required by Section 906 of the Sarbanes-Oxley Act of 2002 has been provided to AMERICAN FUNDS DEVELOPING WORLD GROWTH AND INCOME FUND and will be retained by AMERICAN FUNDS DEVELOPING WORLD GROWTH AND INCOME FUND and furnished to the Securities and Exchange Commission (the "Commission") or its staff upon request.
This certification is being furnished to the Commission solely pursuant to 18 U.S.C. Section 1350 and is not being filed as part of the Form N-CSR filed with the Commission.
Create E-mail Alert Related Categories
SEC FilingsRelated Entities
The Capital Group CompaniesSign up for StreetInsider Free!
Receive full access to all new and archived articles, unlimited portfolio tracking, e-mail alerts, custom newswires and RSS feeds - and more!
