

Form N-CSR Eaton Vance Floating-Rat For: May 31
 Tweet
Tweet Share
Share
UNITED STATES
SECURITIES AND EXCHANGE COMMISSION
Washington, D.C. 20549
Form N-CSR
CERTIFIED SHAREHOLDER REPORT OF REGISTERED
MANAGEMENT INVESTMENT COMPANIES
Investment Company Act File Number: 811-21574
Eaton Vance Floating-Rate Income Trust
(Exact Name of Registrant as Specified in Charter)
Two International Place, Boston, Massachusetts 02110
(Address of Principal Executive Offices)
Maureen A. Gemma
Two International Place, Boston, Massachusetts 02110
(Name and Address of Agent for Services)
(617) 482-8260
(Registrant’s Telephone Number)
May 31
Date of Fiscal Year End
May 31, 2016
Date of Reporting Period
Item 1. Reports to Stockholders

Eaton Vance
Floating-Rate Income Trust
(EFT)
Annual Report
May 31, 2016

Commodity Futures Trading Commission Registration. Effective December 31, 2012, the Commodity Futures Trading Commission (“CFTC”) adopted certain regulatory changes that subject registered investment companies and advisers to regulation by the CFTC if a fund invests more than a prescribed level of its assets in certain CFTC-regulated instruments (including futures, certain options and swap agreements) or markets itself as providing investment exposure to such instruments. The Fund has claimed an exclusion from the definition of the term “commodity pool operator” under the Commodity Exchange Act. Accordingly, neither the Fund nor the adviser with respect to the operation of the Fund is subject to CFTC regulation. Because of its management of other strategies, the Fund’s adviser is registered with the CFTC as a commodity pool operator and a commodity trading advisor.
Fund shares are not insured by the FDIC and are not deposits or other obligations of, or guaranteed by, any depository institution. Shares are subject to investment risks, including possible loss of principal invested.
Annual Report May 31, 2016
Eaton Vance
Floating-Rate Income Trust
Table of Contents
| Management’s Discussion of Fund Performance |
2 | |||
| Performance |
3 | |||
| Fund Profile |
4 | |||
| Endnotes and Additional Disclosures |
5 | |||
| Financial Statements |
6 | |||
| Report of Independent Registered Public Accounting Firm |
44 | |||
| Federal Tax Information |
45 | |||
| Annual Meeting of Shareholders |
46 | |||
| Dividend Reinvestment Plan |
47 | |||
| Board of Trustees’ Contract Approval |
49 | |||
| Management and Organization |
52 | |||
| Important Notices |
55 | |||
Eaton Vance
Floating-Rate Income Trust
May 31, 2016
Management’s Discussion of Fund Performance1
See Endnotes and Additional Disclosures in this report.
Past performance is no guarantee of future results. Returns are historical and are calculated by determining the percentage change in net asset value (NAV) or market price (as applicable) with all distributions reinvested and include management fees and other expenses. Fund performance at market price will differ from its results at NAV due to factors such as changing perceptions about the Fund, market conditions, fluctuations in supply and demand for Fund shares, or changes in Fund distributions. Investment return and principal value will fluctuate so that shares, when sold, may be worth more or less than their original cost. Performance less than or equal to one year is cumulative. Performance is for the stated time period only; due to market volatility, current Fund performance may be lower or higher than the quoted return. For performance as of the most recent month-end, please refer to eatonvance.com.
| 2 |
Eaton Vance
Floating-Rate Income Trust
May 31, 2016
Performance2,3
Portfolio Managers Scott H. Page, CFA and Ralph Hinckley, CFA
| % Average Annual Total Returns | Inception Date | One Year | Five Years | Ten Years | ||||||||||||
| Fund at NAV |
06/29/2004 | 0.46 | % | 4.99 | % | 4.91 | % | |||||||||
| Fund at Market Price |
— | 1.14 | 2.73 | 4.63 | ||||||||||||
| S&P/LSTA Leveraged Loan Index |
— | 0.49 | % | 3.71 | % | 4.49 | % | |||||||||
| % Premium/Discount to NAV4 | ||||||||||||||||
| –7.57 | % | |||||||||||||||
| Distributions5 |
||||||||||||||||
| Total Distributions per share for the period |
$ | 0.904 | ||||||||||||||
| Distribution Rate at NAV |
6.05 | % | ||||||||||||||
| Distribution Rate at Market Price |
6.55 | % | ||||||||||||||
| % Total Leverage6 |
||||||||||||||||
| Borrowings |
25.86 | % | ||||||||||||||
| Variable Rate Term Preferred Shares (VRTP Shares) |
8.92 | |||||||||||||||
See Endnotes and Additional Disclosures in this report.
Past performance is no guarantee of future results. Returns are historical and are calculated by determining the percentage change in net asset value (NAV) or market price (as applicable) with all distributions reinvested and include management fees and other expenses. Fund performance at market price will differ from its results at NAV due to factors such as changing perceptions about the Fund, market conditions, fluctuations in supply and demand for Fund shares, or changes in Fund distributions. Investment return and principal value will fluctuate so that shares, when sold, may be worth more or less than their original cost. Performance less than or equal to one year is cumulative. Performance is for the stated time period only; due to market volatility, current Fund performance may be lower or higher than the quoted return. For performance as of the most recent month-end, please refer to eatonvance.com.
| 3 |
Eaton Vance
Floating-Rate Income Trust
May 31, 2016
Fund Profile
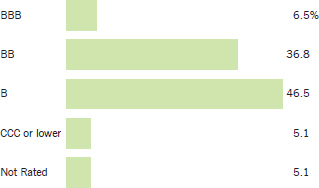
See Endnotes and Additional Disclosures in this report.
| 4 |
Eaton Vance
Floating-Rate Income Trust
May 31, 2016
Endnotes and Additional Disclosures
| 5 |
Eaton Vance
Floating-Rate Income Trust
May 31, 2016
Portfolio of Investments
| 6 | See Notes to Financial Statements. |
Eaton Vance
Floating-Rate Income Trust
May 31, 2016
Portfolio of Investments — continued
| 7 | See Notes to Financial Statements. |
Eaton Vance
Floating-Rate Income Trust
May 31, 2016
Portfolio of Investments — continued
| 8 | See Notes to Financial Statements. |
Eaton Vance
Floating-Rate Income Trust
May 31, 2016
Portfolio of Investments — continued
| 9 | See Notes to Financial Statements. |
Eaton Vance
Floating-Rate Income Trust
May 31, 2016
Portfolio of Investments — continued
| 10 | See Notes to Financial Statements. |
Eaton Vance
Floating-Rate Income Trust
May 31, 2016
Portfolio of Investments — continued
| 11 | See Notes to Financial Statements. |
Eaton Vance
Floating-Rate Income Trust
May 31, 2016
Portfolio of Investments — continued
| 12 | See Notes to Financial Statements. |
Eaton Vance
Floating-Rate Income Trust
May 31, 2016
Portfolio of Investments — continued
| 13 | See Notes to Financial Statements. |
Eaton Vance
Floating-Rate Income Trust
May 31, 2016
Portfolio of Investments — continued
| 14 | See Notes to Financial Statements. |
Eaton Vance
Floating-Rate Income Trust
May 31, 2016
Portfolio of Investments — continued
| 15 | See Notes to Financial Statements. |
Eaton Vance
Floating-Rate Income Trust
May 31, 2016
Portfolio of Investments — continued
| 16 | See Notes to Financial Statements. |
Eaton Vance
Floating-Rate Income Trust
May 31, 2016
Portfolio of Investments — continued
| 17 | See Notes to Financial Statements. |
Eaton Vance
Floating-Rate Income Trust
May 31, 2016
Portfolio of Investments — continued
| 18 | See Notes to Financial Statements. |
Eaton Vance
Floating-Rate Income Trust
May 31, 2016
Portfolio of Investments — continued
| 19 | See Notes to Financial Statements. |
Eaton Vance
Floating-Rate Income Trust
May 31, 2016
Portfolio of Investments — continued
| 20 | See Notes to Financial Statements. |
Eaton Vance
Floating-Rate Income Trust
May 31, 2016
Portfolio of Investments — continued
| 21 | See Notes to Financial Statements. |
Eaton Vance
Floating-Rate Income Trust
May 31, 2016
Portfolio of Investments — continued
| 22 | See Notes to Financial Statements. |
Eaton Vance
Floating-Rate Income Trust
May 31, 2016
Portfolio of Investments — continued
| 23 | See Notes to Financial Statements. |
Eaton Vance
Floating-Rate Income Trust
May 31, 2016
Portfolio of Investments — continued
| 24 | See Notes to Financial Statements. |
Eaton Vance
Floating-Rate Income Trust
May 31, 2016
Portfolio of Investments — continued
| 25 | See Notes to Financial Statements. |
Eaton Vance
Floating-Rate Income Trust
May 31, 2016
Portfolio of Investments — continued
| 26 | See Notes to Financial Statements. |
Eaton Vance
Floating-Rate Income Trust
May 31, 2016
Portfolio of Investments — continued
| 27 | See Notes to Financial Statements. |
Eaton Vance
Floating-Rate Income Trust
May 31, 2016
Portfolio of Investments — continued
| Forward Foreign Currency Exchange Contracts | ||||||||||||||||||||||||
| Currency Purchased | Currency Sold | Counterparty | Settlement Date |
Unrealized Appreciation |
Unrealized (Depreciation) |
|||||||||||||||||||
| USD | 8,014,075 | EUR | 7,106,573 | HSBC Bank USA, N.A. | 6/30/16 | $ | 99,213 | $ | — | |||||||||||||||
| USD | 7,296,246 | GBP | 5,080,279 | Goldman Sachs International | 6/30/16 | — | (63,250 | ) | ||||||||||||||||
| USD | 1,446,332 | GBP | 995,000 | State Street Bank and Trust Company | 6/30/16 | 4,935 | — | |||||||||||||||||
| USD | 7,577,458 | EUR | 6,686,319 | Goldman Sachs International | 7/29/16 | 123,396 | — | |||||||||||||||||
| USD | 3,452,485 | GBP | 2,373,674 | State Street Bank and Trust Company | 7/29/16 | 13,297 | — | |||||||||||||||||
| USD | 2,442,728 | CAD | 3,173,201 | State Street Bank and Trust Company | 8/31/16 | 22,697 | — | |||||||||||||||||
| USD | 4,039,804 | EUR | 3,600,795 | State Street Bank and Trust Company | 8/31/16 | 20,949 | — | |||||||||||||||||
| USD | 1,762,297 | GBP | 1,201,793 | JPMorgan Chase Bank, N.A. | 8/31/16 | 20,591 | — | |||||||||||||||||
| $ | 305,078 | $ | (63,250 | ) | ||||||||||||||||||||
Abbreviations:
| DIP | – | Debtor In Possession | ||
| PIK | – | Payment In Kind |
Currency Abbreviations:
| CAD | – | Canadian Dollar | ||
| EUR | – | Euro | ||
| GBP | – | British Pound Sterling | ||
| USD | – | United States Dollar |
| 28 | See Notes to Financial Statements. |
Eaton Vance
Floating-Rate Income Trust
May 31, 2016
Statement of Assets and Liabilities
| Assets | May 31, 2016 | |||
| Unaffiliated investments, at value (identified cost, $926,222,047) |
$ | 887,040,305 | ||
| Affiliated investment, at value (identified cost, $9,881,589) |
9,881,589 | |||
| Cash |
7,614,662 | |||
| Restricted cash* |
320,000 | |||
| Foreign currency, at value (identified cost, $37,460) |
37,413 | |||
| Interest and dividends receivable |
5,474,535 | |||
| Interest receivable from affiliated investment |
4,690 | |||
| Receivable for investments sold |
1,003,964 | |||
| Receivable for open forward foreign currency exchange contracts |
305,078 | |||
| Prepaid upfront fees on variable rate term preferred shares |
132,267 | |||
| Prepaid upfront fees on notes payable |
245,284 | |||
| Prepaid expenses |
29,560 | |||
| Total assets |
$ | 912,089,347 | ||
| Liabilities | ||||
| Notes payable |
$ | 232,000,000 | ||
| Variable rate term preferred shares, at liquidation value |
80,000,000 | |||
| Payable for investments purchased |
13,629,309 | |||
| Payable for open forward foreign currency exchange contracts |
63,250 | |||
| Payable to affiliates: |
||||
| Investment adviser fee |
568,883 | |||
| Trustees’ fees |
8,027 | |||
| Interest expense and fees payable |
443,250 | |||
| Accrued expenses |
275,682 | |||
| Total liabilities |
$ | 326,988,401 | ||
| Net assets applicable to common shares |
$ | 585,100,946 | ||
| Sources of Net Assets | ||||
| Common shares, $0.01 par value, unlimited number of shares authorized, 39,863,690 shares issued and outstanding |
$ | 398,637 | ||
| Additional paid-in capital |
747,871,292 | |||
| Accumulated net realized loss |
(125,913,060 | ) | ||
| Accumulated undistributed net investment income |
1,785,277 | |||
| Net unrealized depreciation |
(39,041,200 | ) | ||
| Net assets applicable to common shares |
$ | 585,100,946 | ||
| Net Asset Value Per Common Share | ||||
| ($585,100,946 ÷ 39,863,690 common shares issued and outstanding) |
$ | 14.68 | ||
| * | Represents restricted cash on deposit at the custodian for open forward foreign currency exchange contracts. |
| 29 | See Notes to Financial Statements. |
Eaton Vance
Floating-Rate Income Trust
May 31, 2016
Statement of Operations
| Investment Income | Year Ended May 31, 2016 |
|||
| Interest and other income |
$ | 48,666,571 | ||
| Dividends |
851,157 | |||
| Interest allocated from affiliated investment |
33,519 | |||
| Expenses allocated from affiliated investment |
(1,579 | ) | ||
| Total investment income |
$ | 49,549,668 | ||
| Expenses | ||||
| Investment adviser fee |
$ | 6,970,567 | ||
| Trustees’ fees and expenses |
51,788 | |||
| Custodian fee |
344,048 | |||
| Transfer and dividend disbursing agent fees |
17,994 | |||
| Legal and accounting services |
252,802 | |||
| Printing and postage |
77,599 | |||
| Amortization of deferred offering costs |
90,144 | |||
| Interest expense and fees |
5,415,456 | |||
| Miscellaneous |
128,340 | |||
| Total expenses |
$ | 13,348,738 | ||
| Deduct — |
||||
| Reduction of custodian fee |
$ | 17 | ||
| Total expense reductions |
$ | 17 | ||
| Net expenses |
$ | 13,348,721 | ||
| Net investment income |
$ | 36,200,947 | ||
| Realized and Unrealized Gain (Loss) | ||||
| Net realized gain (loss) — |
||||
| Investment transactions |
$ | (17,226,266 | ) | |
| Investment transactions allocated from affiliated investment |
37 | |||
| Foreign currency and forward foreign currency exchange contract transactions |
428,142 | |||
| Net realized loss |
$ | (16,798,087 | ) | |
| Change in unrealized appreciation (depreciation) — |
||||
| Investments |
$ | (22,219,618 | ) | |
| Foreign currency and forward foreign currency exchange contracts |
515,208 | |||
| Net change in unrealized appreciation (depreciation) |
$ | (21,704,410 | ) | |
| Net realized and unrealized loss |
$ | (38,502,497 | ) | |
| Net decrease in net assets from operations |
$ | (2,301,550 | ) | |
| 30 | See Notes to Financial Statements. |
Eaton Vance
Floating-Rate Income Trust
May 31, 2016
Statements of Changes in Net Assets
| Year Ended May 31, | ||||||||
| Increase (Decrease) in Net Assets | 2016 | 2015 | ||||||
| From operations — |
||||||||
| Net investment income |
$ | 36,200,947 | $ | 35,156,685 | ||||
| Net realized gain (loss) from investment, foreign currency and forward foreign currency exchange contract transactions |
(16,798,087 | ) | 4,513,875 | |||||
| Net change in unrealized appreciation (depreciation) from investments, foreign currency and forward foreign currency exchange contracts |
(21,704,410 | ) | (21,791,821 | ) | ||||
| Net increase (decrease) in net assets from operations |
$ | (2,301,550 | ) | $ | 17,878,739 | |||
| Distributions to common shareholders — |
||||||||
| From net investment income |
$ | (36,036,776 | ) | $ | (35,518,548 | ) | ||
| Total distributions to common shareholders |
$ | (36,036,776 | ) | $ | (35,518,548 | ) | ||
| Net decrease in net assets |
$ | (38,338,326 | ) | $ | (17,639,809 | ) | ||
| Net Assets Applicable to Common Shares | ||||||||
| At beginning of year |
$ | 623,439,272 | $ | 641,079,081 | ||||
| At end of year |
$ | 585,100,946 | $ | 623,439,272 | ||||
| Accumulated undistributed net investment income included in net assets applicable to common shares |
||||||||
| At end of year |
$ | 1,785,277 | $ | 687,522 | ||||
| 31 | See Notes to Financial Statements. |
Eaton Vance
Floating-Rate Income Trust
May 31, 2016
Statement of Cash Flows
| Cash Flows From Operating Activities | Year Ended May 31, 2016 |
|||
| Net decrease in net assets from operations |
$ | (2,301,550 | ) | |
| Adjustments to reconcile net decrease in net assets from operations to net cash provided by operating activities: |
||||
| Investments purchased |
(272,011,499 | ) | ||
| Investments sold and principal repayments |
327,388,507 | |||
| Increase in short-term investments, net |
(3,896,315 | ) | ||
| Net amortization/accretion of premium (discount) |
(1,632,326 | ) | ||
| Amortization of deferred offering costs and prepaid upfront fees on variable rate term preferred shares |
225,008 | |||
| Amortization of prepaid upfront fees on notes payable |
310,344 | |||
| Increase in restricted cash |
(320,000 | ) | ||
| Decrease in interest and dividends receivable |
311,057 | |||
| Increase in interest receivable from affiliated investment |
(3,222 | ) | ||
| Increase in receivable for open forward foreign currency exchange contracts |
(284,196 | ) | ||
| Decrease in prepaid expenses |
6,182 | |||
| Decrease in payable for open forward foreign currency exchange contracts |
(302,585 | ) | ||
| Decrease in payable to affiliate for investment adviser fee |
(65,164 | ) | ||
| Increase in payable to affiliate for Trustees’ fees |
41 | |||
| Increase in interest expense and fees payable |
52,317 | |||
| Increase in accrued expenses |
52,226 | |||
| Increase in unfunded loan commitments |
950,202 | |||
| Net change in unrealized (appreciation) depreciation from investments |
22,219,618 | |||
| Net realized (gain) loss from investments |
17,226,266 | |||
| Net cash provided by operating activities |
$ | 87,924,911 | ||
| Cash Flows From Financing Activities | ||||
| Distributions paid to common shareholders, net of reinvestments |
$ | (36,036,776 | ) | |
| Payment of prepaid upfront fees on variable rate term preferred shares |
(120,000 | ) | ||
| Payment of prepaid upfront fees on notes payable |
(310,000 | ) | ||
| Proceeds from notes payable |
23,000,000 | |||
| Repayments of notes payable |
(81,000,000 | ) | ||
| Net cash used in financing activities |
$ | (94,466,776 | ) | |
| Net decrease in cash* |
$ | (6,541,865 | ) | |
| Cash at beginning of year(1) |
$ | 14,193,940 | ||
| Cash at end of year(1) |
$ | 7,652,075 | ||
| Supplemental disclosure of cash flow information: | ||||
| Cash paid for interest and fees on borrowings and variable rate term preferred shares |
$ | 5,347,931 | ||
| * | Includes net change in unrealized appreciation (depreciation) on foreign currency of $(71). |
| (1) | Balance includes foreign currency, at value. |
| 32 | See Notes to Financial Statements. |
Eaton Vance
Floating-Rate Income Trust
May 31, 2016
Financial Highlights
Selected data for a common share outstanding during the periods stated
| Year Ended May 31, | ||||||||||||||||||||
| 2016 | 2015 | 2014 | 2013 | 2012 | ||||||||||||||||
| Net asset value — Beginning of year (Common shares) |
$ | 15.640 | $ | 16.080 | $ | 16.300 | $ | 15.510 | $ | 15.900 | ||||||||||
| Income (Loss) From Operations | ||||||||||||||||||||
| Net investment income(1) |
$ | 0.908 | $ | 0.882 | $ | 0.889 | $ | 1.058 | $ | 1.034 | ||||||||||
| Net realized and unrealized gain (loss) |
(0.964 | ) | (0.431 | ) | (0.145 | ) | 0.707 | (0.368 | ) | |||||||||||
| Distributions to APS shareholders — |
||||||||||||||||||||
| From net investment income(1) |
— | — | — | (0.024 | ) | (0.032 | ) | |||||||||||||
| Discount on redemption and repurchase of APS(1) |
— | — | — | 0.036 | — | |||||||||||||||
| Total income (loss) from operations |
$ | (0.056 | ) | $ | 0.451 | $ | 0.744 | $ | 1.777 | $ | 0.634 | |||||||||
| Less Distributions to Common Shareholders | ||||||||||||||||||||
| From net investment income |
$ | (0.904 | ) | $ | (0.891 | ) | $ | (0.966 | ) | $ | (1.041 | ) | $ | (1.024 | ) | |||||
| Total distributions to common shareholders |
$ | (0.904 | ) | $ | (0.891 | ) | $ | (0.966 | ) | $ | (1.041 | ) | $ | (1.024 | ) | |||||
| Premium from common shares sold through shelf offering (see Note 6)(1) |
$ | — | $ | — | $ | 0.002 | $ | 0.054 | $ | — | ||||||||||
| Net asset value — End of year (Common shares) |
$ | 14.680 | $ | 15.640 | $ | 16.080 | $ | 16.300 | $ | 15.510 | ||||||||||
| Market value — End of year (Common shares) |
$ | 13.560 | $ | 14.360 | $ | 15.180 | $ | 16.680 | $ | 15.790 | ||||||||||
| Total Investment Return on Net Asset Value(2) |
0.46 | % | 3.43 | % | 4.87 | % | 12.15 | % | 4.43 | % | ||||||||||
| Total Investment Return on Market Value(2) |
1.14 | % | 0.59 | % | (3.19 | )% | 12.66 | % | 3.13 | % | ||||||||||
| 33 | See Notes to Financial Statements. |
Eaton Vance
Floating-Rate Income Trust
May 31, 2016
Financial Highlights — continued
Selected data for a common share outstanding during the periods stated
| Year Ended May 31, | ||||||||||||||||||||
| Ratios/Supplemental Data | 2016 | 2015 | 2014 | 2013 | 2012 | |||||||||||||||
| Net assets applicable to common shares, end of year (000’s omitted) |
$ | 585,101 | $ | 623,439 | $ | 641,079 | $ | 646,842 | $ | 582,011 | ||||||||||
| Ratios (as a percentage of average daily net assets applicable to common shares):† |
||||||||||||||||||||
| Expenses excluding interest and fees(3) |
1.36 | % | 1.37 | % | 1.36 | % | 1.38 | %(4) | 1.28 | %(4) | ||||||||||
| Interest and fee expense(5) |
0.93 | % | 0.80 | % | 0.77 | % | 0.66 | % | 0.58 | % | ||||||||||
| Total expenses(3) |
2.29 | % | 2.17 | % | 2.13 | % | 2.04 | %(4) | 1.86 | %(4) | ||||||||||
| Net investment income |
6.22 | % | 5.60 | % | 5.50 | % | 6.61 | %(4) | 6.73 | %(4) | ||||||||||
| Portfolio Turnover |
29 | % | 32 | % | 35 | % | 47 | % | 38 | % | ||||||||||
| Senior Securities: |
||||||||||||||||||||
| Total notes payable outstanding (in 000’s) |
$ | 232,000 | $ | 290,000 | $ | 300,000 | $ | 290,000 | $ | 260,000 | ||||||||||
| Asset coverage per $1,000 of notes payable(6) |
$ | 3,867 | $ | 3,426 | $ | 3,404 | $ | 3,506 | $ | 3,546 | ||||||||||
| Total preferred shares outstanding(7) |
800 | 800 | 800 | 800 | 3,200 | |||||||||||||||
| Asset coverage per preferred share(7)(8) |
$ | 287,532 | $ | 268,497 | $ | 268,705 | $ | 274,822 | $ | 67,796 | ||||||||||
| Involuntary liquidation preference per preferred share(7)(9) |
$ | 100,000 | $ | 100,000 | $ | 100,000 | $ | 100,000 | $ | 25,000 | ||||||||||
| Approximate market value per preferred share(7)(9) |
$ | 100,000 | $ | 100,000 | $ | 100,000 | $ | 100,000 | $ | 25,000 | ||||||||||
| (1) | Computed using average common shares outstanding. |
| (2) | Returns are historical and are calculated by determining the percentage change in net asset value or market value with all distributions reinvested. Distributions are assumed to be reinvested at prices obtained under the Trust’s dividend reinvestment plan. |
| (3) | Excludes the effect of custody fee credits, if any, of less than 0.005%. |
| (4) | Ratios do not reflect the effect of dividend payments to APS shareholders. |
| (5) | Interest and fee expense relates to variable rate term preferred shares (see Note 2) and the notes payable, primarily incurred to redeem the Trust’s APS (see Note 9). |
| (6) | Calculated by subtracting the Trust’s total liabilities (not including the notes payable and preferred shares) from the Trust’s total assets, and dividing the result by the notes payable balance in thousands. |
| (7) | Preferred shares represent variable rate term preferred shares as of May 31, 2016, 2015, 2014 and 2013 and APS as of May 31, 2012. |
| (8) | Calculated by subtracting the Trust’s total liabilities (not including the notes payable and preferred shares) from the Trust’s total assets, dividing the result by the sum of the value of the notes payable and liquidation value of the preferred shares, and multiplying the result by the liquidation value of one preferred share. Such amount equates to 288%, 268%, 269%, 275%, 271% and 287% at May 31, 2016, 2015, 2014, 2013 and 2012, respectively. |
| (9) | Plus accumulated and unpaid dividends. |
| † | Ratios based on net assets applicable to common shares plus preferred shares (variable rate term preferred shares and APS, as applicable) and borrowings are presented below. Ratios do not reflect the effect of dividend payments to APS shareholders and exclude the effect of custody fee credits, if any. |
| Year Ended May 31, | ||||||||||||||||||||
| 2016 | 2015 | 2014 | 2013 | 2012 | ||||||||||||||||
| Expenses excluding interest and fees |
0.86 | % | 0.85 | % | 0.85 | % | 0.89 | % | 0.81 | % | ||||||||||
| Interest and fee expense |
0.58 | % | 0.50 | % | 0.49 | % | 0.42 | % | 0.37 | % | ||||||||||
| Total expenses |
1.44 | % | 1.35 | % | 1.34 | % | 1.31 | % | 1.18 | % | ||||||||||
| Net investment income |
3.90 | % | 3.50 | % | 3.46 | % | 4.23 | % | 4.28 | % | ||||||||||
| APS | – | Auction Preferred Shares |
| 34 | See Notes to Financial Statements. |
Eaton Vance
Floating-Rate Income Trust
May 31, 2016
Notes to Financial Statements
1 Significant Accounting Policies
Eaton Vance Floating-Rate Income Trust (the Trust) is a Massachusetts business trust registered under the Investment Company Act of 1940, as amended (the 1940 Act), as a diversified, closed-end management investment company. The Trust’s investment objective is to provide a high level of current income. The Trust will, as a secondary objective, also seek preservation of capital to the extent consistent with its primary goal of high current income.
The following is a summary of significant accounting policies of the Trust. The policies are in conformity with accounting principles generally accepted in the United States of America (U.S. GAAP). The Trust is an investment company and follows accounting and reporting guidance in the Financial Accounting Standards Board (“FASB”) Accounting Standards Codification Topic 946.
A Investment Valuation — The following methodologies are used to determine the market value or fair value of investments.
Senior Floating-Rate Loans. Interests in senior floating-rate loans (Senior Loans) for which reliable market quotations are readily available are valued generally at the average mean of bid and ask quotations obtained from a third party pricing service. Other Senior Loans are valued at fair value by the investment adviser under procedures approved by the Trustees. In fair valuing a Senior Loan, the investment adviser utilizes one or more of the valuation techniques described in (i) through (iii) below to assess the likelihood that the borrower will make a full repayment of the loan underlying such Senior Loan relative to yields on other Senior Loans issued by companies of comparable credit quality. If the investment adviser believes that there is a reasonable likelihood of full repayment, the investment adviser will determine fair value using a matrix pricing approach that considers the yield on the Senior Loan. If the investment adviser believes there is not a reasonable likelihood of full repayment, the investment adviser will determine fair value using analyses that include, but are not limited to: (i) a comparison of the value of the borrower’s outstanding equity and debt to that of comparable public companies; (ii) a discounted cash flow analysis; or (iii) when the investment adviser believes it is likely that a borrower will be liquidated or sold, an analysis of the terms of such liquidation or sale. In certain cases, the investment adviser will use a combination of analytical methods to determine fair value, such as when only a portion of a borrower’s assets are likely to be sold. In conducting its assessment and analyses for purposes of determining fair value of a Senior Loan, the investment adviser will use its discretion and judgment in considering and appraising relevant factors. Fair value determinations are made by the portfolio managers of the Trust based on information available to such managers. The portfolio managers of other funds managed by the investment adviser that invest in Senior Loans may not possess the same information about a Senior Loan borrower as the portfolio managers of the Trust. At times, the fair value of a Senior Loan determined by the portfolio managers of other funds managed by the investment adviser that invest in Senior Loans may vary from the fair value of the same Senior Loan determined by the portfolio managers of the Trust. The fair value of each Senior Loan is periodically reviewed and approved by the investment adviser’s Valuation Committee and by the Trustees based upon procedures approved by the Trustees. Junior Loans (i.e., subordinated loans and second lien loans) are valued in the same manner as Senior Loans.
Debt Obligations. Debt obligations (including short-term obligations with a remaining maturity of more than sixty days) are generally valued on the basis of valuations provided by third party pricing services, as derived from such services’ pricing models. Inputs to the models may include, but are not limited to, reported trades, executable bid and asked prices, broker/dealer quotations, prices or yields of securities with similar characteristics, interest rates, anticipated prepayments, benchmark curves or information pertaining to the issuer, as well as industry and economic events. The pricing services may use a matrix approach, which considers information regarding securities with similar characteristics to determine the valuation for a security. Short-term obligations purchased with a remaining maturity of sixty days or less are generally valued at amortized cost, which approximates market value.
Equity Securities. Equity securities listed on a U.S. securities exchange generally are valued at the last sale or closing price on the day of valuation or, if no sales took place on such date, at the mean between the closing bid and asked prices therefore on the exchange where such securities are principally traded. Equity securities listed on the NASDAQ Global or Global Select Market generally are valued at the NASDAQ official closing price. Unlisted or listed securities for which closing sales prices or closing quotations are not available are valued at the mean between the latest available bid and asked prices or, in the case of preferred equity securities that are not listed or traded in the over-the-counter market, by a third party pricing service that uses various techniques that consider factors including, but not limited to, prices or yields of securities with similar characteristics, benchmark yields, broker/dealer quotes, quotes of underlying common stock, issuer spreads, as well as industry and economic events.
Derivatives. Forward foreign currency exchange contracts are generally valued at the mean of the average bid and average asked prices that are reported by currency dealers to a third party pricing service at the valuation time. Such third party pricing service valuations are supplied for specific settlement periods and the Trust’s forward foreign currency exchange contracts are valued at an interpolated rate between the closest preceding and subsequent settlement period reported by the third party pricing service.
Foreign Securities and Currencies. Foreign securities and currencies are valued in U.S. dollars, based on foreign currency exchange rate quotations supplied by a third party pricing service. The pricing service uses a proprietary model to determine the exchange rate. Inputs to the model include reported trades and implied bid/ask spreads.
Affiliated Fund. The Trust may invest in Eaton Vance Cash Reserves Fund, LLC (Cash Reserves Fund), an affiliated investment company managed by Eaton Vance Management (EVM). The value of the Trust’s investment in Cash Reserves Fund reflects the Trust’s proportionate interest in its net assets. Cash Reserves Fund generally values its investment securities utilizing the amortized cost valuation technique in accordance with Rule 2a-7 under the 1940 Act. This technique involves initially valuing a portfolio security at its cost and thereafter assuming a constant amortization to maturity of any discount or premium. If amortized cost is determined not to approximate fair value, Cash Reserves Fund may value its investment securities in the same manner as debt obligations described above.
Fair Valuation. Investments for which valuations or market quotations are not readily available or are deemed unreliable are valued at fair value using methods determined in good faith by or at the direction of the Trustees of the Trust in a manner that fairly reflects the security’s value, or the amount that
| 35 |
Eaton Vance
Floating-Rate Income Trust
May 31, 2016
Notes to Financial Statements — continued
the Trust might reasonably expect to receive for the security upon its current sale in the ordinary course. Each such determination is based on a consideration of relevant factors, which are likely to vary from one pricing context to another. These factors may include, but are not limited to, the type of security, the existence of any contractual restrictions on the security’s disposition, the price and extent of public trading in similar securities of the issuer or of comparable companies or entities, quotations or relevant information obtained from broker/dealers or other market participants, information obtained from the issuer, analysts, and/or the appropriate stock exchange (for exchange-traded securities), an analysis of the company’s or entity’s financial condition, and an evaluation of the forces that influence the issuer and the market(s) in which the security is purchased and sold.
B Investment Transactions — Investment transactions for financial statement purposes are accounted for on a trade date basis. Realized gains and losses on investments sold are determined on the basis of identified cost.
C Income — Interest income is recorded on the basis of interest accrued, adjusted for amortization of premium or accretion of discount. Fees associated with loan amendments are recognized immediately. Dividend income is recorded on the ex-dividend date for dividends received in cash and/or securities. Distributions from investment companies are recorded as dividend income, capital gains or return of capital based on the nature of the distribution.
D Federal Taxes — The Trust’s policy is to comply with the provisions of the Internal Revenue Code applicable to regulated investment companies and to distribute to shareholders each year substantially all of its net investment income, and all or substantially all of its net realized capital gains. Accordingly, no provision for federal income or excise tax is necessary.
As of May 31, 2016, the Trust had no uncertain tax positions that would require financial statement recognition, de-recognition, or disclosure. The Trust files a U.S. federal income tax return annually after its fiscal year-end, which is subject to examination by the Internal Revenue Service for a period of three years from the date of filing.
E Expense Reduction — State Street Bank and Trust Company (SSBT) serves as custodian of the Trust. Pursuant to the custodian agreement, SSBT receives a fee that may be reduced by credits, which are determined based on the average daily cash balance the Trust maintains with SSBT. All credit balances, if any, used to reduce the Trust’s custodian fees are reported as a reduction of expenses in the Statement of Operations. Effective September 1, 2015, SSBT began imposing fees on certain uninvested cash balances and discontinued credits on cash deposit balances.
F Foreign Currency Translation — Investment valuations, other assets, and liabilities initially expressed in foreign currencies are translated each business day into U.S. dollars based upon current exchange rates. Purchases and sales of foreign investment securities and income and expenses denominated in foreign currencies are translated into U.S. dollars based upon currency exchange rates in effect on the respective dates of such transactions. Recognized gains or losses on investment transactions attributable to changes in foreign currency exchange rates are recorded for financial statement purposes as net realized gains and losses on investments. That portion of unrealized gains and losses on investments that results from fluctuations in foreign currency exchange rates is not separately disclosed.
G Unfunded Loan Commitments — The Trust may enter into certain loan agreements all or a portion of which may be unfunded. The Trust is obligated to fund these commitments at the borrower’s discretion. These commitments are disclosed in the accompanying Portfolio of Investments. At May 31, 2016, the Trust had sufficient cash and/or securities to cover these commitments.
H Use of Estimates — The preparation of the financial statements in conformity with U.S. GAAP requires management to make estimates and assumptions that affect the reported amounts of assets and liabilities at the date of the financial statements and the reported amounts of income and expense during the reporting period. Actual results could differ from those estimates.
I Indemnifications — Under the Trust’s organizational documents, its officers and Trustees may be indemnified against certain liabilities and expenses arising out of the performance of their duties to the Trust. Under Massachusetts law, if certain conditions prevail, shareholders of a Massachusetts business trust (such as the Trust) could be deemed to have personal liability for the obligations of the Trust. However, the Trust’s Declaration of Trust contains an express disclaimer of liability on the part of Trust shareholders and the By-laws provide that the Trust shall assume the defense on behalf of any Trust shareholders. Moreover, the By-laws also provide for indemnification out of Trust property of any shareholder held personally liable solely by reason of being or having been a shareholder for all loss or expense arising from such liability. Additionally, in the normal course of business, the Trust enters into agreements with service providers that may contain indemnification clauses. The Trust’s maximum exposure under these arrangements is unknown as this would involve future claims that may be made against the Trust that have not yet occurred.
J Forward Foreign Currency Exchange Contracts — The Trust may enter into forward foreign currency exchange contracts for the purchase or sale of a specific foreign currency at a fixed price on a future date. The forward foreign currency exchange contracts are adjusted by the daily exchange rate of the underlying currency and any gains or losses are recorded as unrealized until such time as the contracts have been closed. Risks may arise upon entering these contracts from the potential inability of counterparties to meet the terms of their contracts and from movements in the value of a foreign currency relative to the U.S. dollar.
K When-Issued Securities and Delayed Delivery Transactions — The Trust may purchase securities on a delayed delivery or when-issued basis. Payment and delivery may take place after the customary settlement period for that security. At the time the transaction is negotiated, the price of the security that will be delivered is fixed. The Trust maintains cash and/or security positions for these commitments such that sufficient liquid assets will be available to
| 36 |
Eaton Vance
Floating-Rate Income Trust
May 31, 2016
Notes to Financial Statements — continued
make payments upon settlement. Securities purchased on a delayed delivery or when-issued basis are marked-to-market daily and begin earning interest on settlement date. Losses may arise due to changes in the market value of the underlying securities or if the counterparty does not perform under the contract.
L Statement of Cash Flows — The cash amount shown in the Statement of Cash Flows of the Trust is the amount included in the Trust’s Statement of Assets and Liabilities and represents the unrestricted cash on hand at its custodian and does not include any short-term investments.
2 Variable Rate Term Preferred Shares
On December 18, 2012, the Trust issued 800 shares of Series C-1 Variable Rate Term Preferred Shares (VRTP Shares) in a private offering to a commercial paper conduit sponsored by a large financial institution (the Conduit), all of which are outstanding at May 31, 2016. The Trust used the net proceeds from the issuance to enter into a series of transactions which resulted in a redemption and/or repurchase of its Auction Preferred Shares.
The VRTP Shares are a form of preferred shares that represent stock of the Trust. The VRTP Shares have a par value of $0.01 per share, a liquidation preference of $100,000 per share, and a current mandatory redemption date of January 8, 2017, unless extended. The original mandatory redemption date of December 18, 2015 was extended to July 8, 2016 on May 20, 2015 and further extended on December 22, 2015 upon consent of the holders of the VRTP Shares and approval of the Trust’s Board of Trustees. Dividends on the VRTP Shares are determined each day based on a spread of 1.45% to the Conduit’s current cost of funding. Such spread to the cost of funding is determined based on the current credit rating of the VRTP Shares.
The VRTP Shares are redeemable at the option of the Trust at a redemption price equal to $100,000 per share, plus accumulated and unpaid dividends, on any business day and solely for the purpose of reducing the leverage of the Trust. The VRTP Shares are also subject to mandatory redemption at a redemption price equal to $100,000 per share, plus accumulated and unpaid dividends, if the Trust is in default for an extended period on its asset maintenance or leverage ratio requirements with respect to the VRTP Shares. Six months prior to the mandatory redemption date, the Trust is required to segregate in a liquidity account with its custodian investments equal to 110% of the VRTP Shares’ redemption price, and over the six month period execute a series of liquidation transactions to assure sufficient liquidity to redeem the VRTP Shares. The holders of the VRTP Shares, voting as a class, are entitled to elect two Trustees of the Trust. If the dividends on the VRTP Shares remain unpaid in an amount equal to two full years’ dividends, the holders of the VRTP Shares as a class have the right to elect a majority of the Board of Trustees.
For financial reporting purposes, the liquidation value of the VRTP Shares is presented as a liability on the Statement of Assets and Liabilities and unpaid dividends are included in interest expense and fees payable. Dividends accrued on VRTP Shares are treated as interest payments for financial reporting purposes and are included in interest expense and fees on the Statement of Operations. Costs incurred by the Trust in connection with its offering of VRTP Shares were capitalized as deferred offering costs and were amortized over a period of three years to the original mandatory redemption date of December 18, 2015. In connection with the issuance of VRTP Shares, the Trust paid an initial upfront fee to the Conduit of $400,000 that prior to the extension of the mandatory redemption date, was being amortized to interest expense and fees over a period of three years. In connection with the subsequent extensions of the mandatory redemption date, the Trust paid additional upfront fees of $194,074 which, together with the unamortized portion of the initial upfront fee, are being amortized over the remaining term of the VRTP Shares to January 8, 2017. The unamortized amounts as of May 31, 2016 are presented as prepaid upfront fees on VRTP Shares on the Statement of Assets and Liabilities. The carrying amount of the VRTP Shares at May 31, 2016 represents its liquidation value, which approximates fair value. If measured at fair value, the VRTP Shares would have been considered as Level 2 in the fair value hierarchy (see Note 12) at May 31, 2016.
The average liquidation preference of the VRTP Shares during the year ended May 31, 2016 was $80,000,000.
3 Distributions to Shareholders and Income Tax Information
The Trust intends to make monthly distributions of net investment income to common shareholders, after payment of any dividends on any outstanding VRTP Shares. In addition, at least annually, the Trust intends to distribute all or substantially all of its net realized capital gains (reduced by available capital loss carryforwards from prior years). Distributions to common shareholders are recorded on the ex-dividend date. Dividends to VRTP shareholders are accrued daily and payable monthly. The dividend rate on the VRTP Shares at May 31, 2016 was 2.04%. The amount of dividends accrued and the average dividend rate of the VRTP Shares during the year ended May 31, 2016 were $1,493,253 and 1.87%, respectively.
Distributions to shareholders are determined in accordance with income tax regulations, which may differ from U.S. GAAP. As required by U.S. GAAP, only distributions in excess of tax basis earnings and profits are reported in the financial statements as a return of capital. Permanent differences between book and tax accounting relating to distributions are reclassified to paid-in capital. For tax purposes, distributions from short-term capital gains are considered to be from ordinary income.
| 37 |
Eaton Vance
Floating-Rate Income Trust
May 31, 2016
Notes to Financial Statements — continued
The tax character of distributions declared, including distributions on VRTP Shares that are treated as interest payments for financial reporting purposes, for the years ended May 31, 2016 and May 31, 2015 was as follows:
| Year Ended May 31, | ||||||||
| 2016 | 2015 | |||||||
| Distributions declared from: |
||||||||
| Ordinary income |
$ | 37,530,029 | $ | 36,863,119 | ||||
During the year ended May 31, 2016, accumulated net realized loss was decreased by $913,036, accumulated undistributed net investment income was increased by $933,584 and paid-in capital was decreased by $1,846,620 due to differences between book and tax accounting, primarily for foreign currency gain (loss), tax straddle transactions, premium amortization, accretion of market discount, defaulted bond interest, investments in partnerships and the treatment of VRTP Shares as equity for tax purposes. These reclassifications had no effect on the net assets or net asset value per share of the Trust.
As of May 31, 2016, the components of distributable earnings (accumulated losses) on a tax basis were as follows:
| Undistributed ordinary income |
$ | 1,921,986 | ||
| Capital loss carryforwards and deferred capital losses |
$ | (124,966,485 | ) | |
| Net unrealized depreciation |
$ | (39,987,775 | ) | |
| Other temporary differences |
$ | (136,709 | ) |
The differences between components of distributable earnings (accumulated losses) on a tax basis and the amounts reflected in the Statement of Assets and Liabilities are primarily due to wash sales, investments in partnerships, the timing of recognizing distributions to shareholders, premium amortization, accretion of market discount and defaulted bond interest.
At May 31, 2016, the Trust, for federal income tax purposes, had capital loss carryforwards of $107,490,819 and deferred capital losses of $17,475,666, which would reduce its taxable income arising from future net realized gains on investment transactions, if any, to the extent permitted by the Internal Revenue Code, and thus would reduce the amount of distributions to shareholders, which would otherwise be necessary to relieve the Trust of any liability for federal income or excise tax. Such capital loss carryforwards will expire on May 31, 2017 ($49,801,677), May 31, 2018 ($40,967,167) and May 31, 2019 ($16,721,975) and their character is short-term. Under tax regulations, capital losses incurred in taxable years beginning after December 2010 are considered deferred capital losses and are treated as arising on the first day of the Trust’s next taxable year, retaining the same short-term or long-term character as when originally deferred. Deferred capital losses are required to be used prior to capital loss carryforwards, which carry an expiration date. As a result of this ordering rule, capital loss carryforwards may be more likely to expire unused. Of the deferred capital losses at May 31, 2016, $1,132,461 are short-term and $16,343,205 are long-term.
The cost and unrealized appreciation (depreciation) of investments of the Trust at May 31, 2016, as determined on a federal income tax basis, were as follows:
| Aggregate cost |
$ | 937,050,211 | ||
| Gross unrealized appreciation |
$ | 8,579,575 | ||
| Gross unrealized depreciation |
(48,707,892 | ) | ||
| Net unrealized depreciation |
$ | (40,128,317 | ) | |
4 Investment Adviser Fee and Other Transactions with Affiliates
The investment adviser fee is earned by EVM as compensation for management and investment advisory services rendered to the Trust. The fee is computed at an annual rate of 0.75% of the Trust’s average daily gross assets and is payable monthly. Gross assets as referred to herein represent net assets plus obligations attributable to investment leverage. For the year ended May 31, 2016, the Trust’s investment adviser fee amounted to $6,970,567. The Trust invests its cash in Cash Reserves Fund. EVM does not currently receive a fee for advisory services provided to Cash Reserves Fund. EVM also serves as administrator of the Trust, but receives no compensation.
| 38 |
Eaton Vance
Floating-Rate Income Trust
May 31, 2016
Notes to Financial Statements — continued
Trustees and officers of the Trust who are members of EVM’s organization receive remuneration for their services to the Trust out of the investment adviser fee. Trustees of the Trust who are not affiliated with EVM may elect to defer receipt of all or a percentage of their annual fees in accordance with the terms of the Trustees Deferred Compensation Plan. For the year ended May 31, 2016, no significant amounts have been deferred. Certain officers and Trustees of the Trust are officers of EVM.
5 Purchases and Sales of Investments
Purchases and sales of investments, other than short-term obligations and including maturities and principal repayments on Senior Loans, aggregated $263,292,657 and $323,070,338, respectively, for the year ended May 31, 2016.
6 Common Shares of Beneficial Interest and Shelf Offering
The Trust may issue common shares pursuant to its dividend reinvestment plan. There were no common shares issued by the Trust for the years ended May 31, 2016 and May 31, 2015.
On November 11, 2013, the Board of Trustees of the Trust authorized the repurchase by the Trust of up to 10% of its then currently outstanding common shares in open-market transactions at a discount to net asset value. The repurchase program does not obligate the Trust to purchase a specific amount of shares. There were no repurchases of common shares by the Trust for the years ended May 31, 2016 and May 31, 2015.
Pursuant to a registration statement filed with the SEC, the Trust is authorized to issue up to an additional 5,495,789 common shares through an equity shelf offering program (the “shelf offering”). Under the shelf offering, the Trust, subject to market conditions, may raise additional capital from time to time and in varying amounts and offering methods at a net price at or above the Trust’s net asset value per common share. During the years ended May 31, 2016 and May 31, 2015, there were no shares sold by the Trust pursuant to its shelf offering.
7 Restricted Securities
At May 31, 2016, the Trust owned the following securities (representing less than 0.1% of net assets applicable to common shares) which were restricted as to public resale and not registered under the Securities Act of 1933 (excluding Rule 144A securities). The Trust has various registration rights (exercisable under a variety of circumstances) with respect to these securities. The value of these securities is determined based on valuations provided by brokers when available, or if not available, they are valued at fair value using methods determined in good faith by or at the direction of the Trustees.
| Description | Date of Acquisition |
Shares | Cost | Value | ||||||||||||
| Common Stocks |
||||||||||||||||
| Panolam Holdings Co. |
12/30/09 | 280 | $ | 153,860 | $ | 243,609 | ||||||||||
| Total Restricted Securities |
$ | 153,860 | $ | 243,609 | ||||||||||||
8 Financial Instruments
The Trust may trade in financial instruments with off-balance sheet risk in the normal course of its investing activities. These financial instruments may include forward foreign currency exchange contracts and may involve, to a varying degree, elements of risk in excess of the amounts recognized for financial statement purposes. The notional or contractual amounts of these instruments represent the investment the Trust has in particular classes of financial instruments and do not necessarily represent the amounts potentially subject to risk. The measurement of the risks associated with these instruments is meaningful only when all related and offsetting transactions are considered. A summary of obligations under these financial instruments at May 31, 2016 is included in the Portfolio of Investments. At May 31, 2016, the Trust had sufficient cash and/or securities to cover commitments under these contracts.
The Trust is subject to foreign exchange risk in the normal course of pursuing its investment objective. Because the Trust holds foreign currency denominated investments, the value of these investments and related receivables and payables may change due to future changes in foreign currency exchange rates. To hedge against this risk, the Trust enters into forward foreign currency exchange contracts.
The Trust enters into forward foreign currency exchange contracts that may contain provisions whereby the counterparty may terminate the contract under certain conditions, including but not limited to a decline in the Trust’s net assets below a certain level over a certain period of time, which would trigger a payment by the Trust for those derivatives in a liability position. At May 31, 2016, the fair value of derivatives with credit-related contingent features in a net liability position was $63,250. The aggregate fair value of assets pledged as collateral by the Trust for such liability was $10,000 at May 31, 2016.
| 39 |
Eaton Vance
Floating-Rate Income Trust
May 31, 2016
Notes to Financial Statements — continued
The over-the-counter (OTC) derivatives in which the Trust invests are subject to the risk that the counterparty to the contract fails to perform its obligations under the contract. To mitigate this risk, the Trust has entered into an International Swaps and Derivatives Association, Inc. Master Agreement (“ISDA Master Agreement”) or similar agreement with substantially all its derivative counterparties. An ISDA Master Agreement is a bilateral agreement between the Trust and a counterparty that governs certain OTC derivatives and typically contains, among other things, set-off provisions in the event of a default and/or termination event as defined under the relevant ISDA Master Agreement. Under an ISDA Master Agreement, the Trust may, under certain circumstances, offset with the counterparty certain derivative financial instruments’ payables and/or receivables with collateral held and/or posted and create one single net payment. The provisions of the ISDA Master Agreement typically permit a single net payment in the event of default including the bankruptcy or insolvency of the counterparty. However, bankruptcy or insolvency laws of a particular jurisdiction may impose restrictions on or prohibitions against the right of offset in bankruptcy or insolvency. Certain ISDA Master Agreements allow counterparties to OTC derivatives to terminate derivative contracts prior to maturity in the event the Trust’s net assets decline by a stated percentage or the Trust fails to meet the terms of its ISDA Master Agreements, which would cause the counterparty to accelerate payment by the Trust of any net liability owed to it.
The collateral requirements for derivatives traded under an ISDA Master Agreement are governed by a Credit Support Annex to the ISDA Master Agreement. Collateral requirements are determined at the close of business each day and are typically based on changes in market values for each transaction under an ISDA Master Agreement and netted into one amount for such agreement. Generally, the amount of collateral due from or to a counterparty is subject to a minimum transfer threshold amount before a transfer is required, which may vary by counterparty. Collateral pledged for the benefit of the Trust and/or counterparty is held in segregated accounts by the Trust’s custodian and cannot be sold, re-pledged, assigned or otherwise used while pledged. The portion of such collateral representing cash, if any, is reflected as restricted cash and, in the case of cash pledged by a counterparty for the benefit of the Trust, a corresponding liability on the Statement of Assets and Liabilities. Securities pledged by the Trust as collateral, if any, are identified as such in the Portfolio of Investments.
The fair value of open derivative instruments (not considered to be hedging instruments for accounting disclosure purposes) and whose primary underlying risk exposure is foreign exchange risk at May 31, 2016 was as follows:
| Fair Value | ||||||||
| Derivative | Asset Derivative | Liability Derivative | ||||||
| Forward foreign currency exchange contracts |
$ | 305,078 | (1) | $ | (63,250 | )(2) | ||
| (1) | Statement of Assets and Liabilities location: Receivable for open forward foreign currency exchange contracts; Net unrealized depreciation. |
| (2) | Statement of Assets and Liabilities location: Payable for open forward foreign currency exchange contracts; Net unrealized depreciation. |
The Trust’s derivative assets and liabilities at fair value by type, which are reported gross in the Statement of Assets and Liabilities, are presented in the table above. The following tables present the Trust’s derivative assets and liabilities by counterparty, net of amounts available for offset under a master netting agreement and net of the related collateral received by the Trust for such assets and pledged by the Trust for such liabilities as of May 31, 2016.
| Counterparty | Derivative Assets Subject to Master Netting Agreement |
Derivatives Available for Offset |
Non-cash Collateral Received(a) |
Cash Collateral Received(a) |
Net Amount of Derivative Assets(b) |
|||||||||||||||
| Goldman Sachs International |
$ | 123,396 | $ | (63,250 | ) | $ | — | $ | — | $ | 60,146 | |||||||||
| HSBC Bank USA, N.A. |
99,213 | — | — | — | 99,213 | |||||||||||||||
| JPMorgan Chase Bank, N.A. |
20,591 | — | — | — | 20,591 | |||||||||||||||
| State Street Bank and Trust Company |
61,878 | — | — | — | 61,878 | |||||||||||||||
| $ | 305,078 | $ | (63,250 | ) | $ | — | $ | — | $ | 241,828 | ||||||||||
| Counterparty | Derivative Liabilities Subject to |
Derivatives Available for Offset |
Non-cash Collateral Pledged(a) |
Cash Collateral Pledged(a) |
Net Amount of Derivative Liabilities(c) |
|||||||||||||||
| Goldman Sachs International |
$ | (63,250 | ) | $ | 63,250 | $ | — | $ | — | $ | — | |||||||||
| (a) | In some instances, the actual collateral received and/or pledged may be more than the amount shown due to overcollateralization. |
| 40 |
Eaton Vance
Floating-Rate Income Trust
May 31, 2016
Notes to Financial Statements — continued
| (b) | Net amount represents the net amount due from the counterparty in the event of default. |
| (c) | Net amount represents the net amount payable to the counterparty in the event of default. |
The effect of derivative instruments (not considered to be hedging instruments for accounting disclosure purposes) on the Statement of Operations and whose primary underlying risk exposure is foreign exchange risk for the year ended May 31, 2016 was as follows:
| Derivative | Realized Gain (Loss) on Derivatives Recognized in Income(1) |
Change in Unrealized Appreciation (Depreciation) on Derivatives Recognized in Income(2) |
||||||
| Forward foreign currency exchange contracts |
596,886 | 586,781 | ||||||
| (1) | Statement of Operations location: Net realized gain (loss) – Foreign currency and forward foreign currency exchange contract transactions. |
| (2) | Statement of Operations location: Change in unrealized appreciation (depreciation) – Foreign currency and forward foreign currency exchange contracts. |
The average notional amount of forward foreign currency exchange contracts outstanding during the year ended May 31, 2016, which is indicative of the volume of this derivative type, was approximately $42,205,000.
9 Revolving Credit and Security Agreement
The Trust has entered into a Revolving Credit and Security Agreement, as amended (the Agreement) with conduit lenders and a bank to borrow up to $310 million. Borrowings under the Agreement are secured by the assets of the Trust. Interest is charged at a rate above the conduits’ commercial paper issuance rate and is payable monthly. Under the terms of the Agreement, in effect through March 13, 2017, the Trust also pays a program fee of 0.67% per annum on its outstanding borrowings to administer the facility and a liquidity fee of 0.15% (0.25% if the outstanding loan amount is less than or equal to 60% (50% prior to March 15, 2016) of the total facility size) per annum on the borrowing limit under the Agreement. Program and liquidity fees for the year ended May 31, 2016 totaled $2,294,443 and are included in interest expense and fees on the Statement of Operations. The Trust also paid an upfront fee of $310,000, which is being amortized to interest expense over a period of one year through March 2017. The unamortized balance at May 31, 2016 is approximately $245,000 and is included in prepaid upfront fees on notes payable on the Statement of Assets and Liabilities. The Trust is required to maintain certain net asset levels during the term of the Agreement. At May 31, 2016, the Trust had borrowings outstanding under the Agreement of $232,000,000 at an interest rate of 0.63%. Based on the short-term nature of the borrowings under the Agreement and the variable interest rate, the carrying amount of the borrowings at May 31, 2016 approximated its fair value. If measured at fair value, borrowings under the Agreement would have been considered as Level 2 in the fair value hierarchy (see Note 12) at May 31, 2016. For the year ended May 31, 2016, the average borrowings under the Agreement and the average interest rate (excluding fees) were $267,081,967 and 0.44%, respectively.
10 Risks Associated with Foreign Investments
Investing in securities issued by companies whose principal business activities are outside the United States may involve significant risks not present in domestic investments. For example, there is generally less publicly available information about foreign companies, particularly those not subject to the disclosure and reporting requirements of the U.S. securities laws. Certain foreign issuers are generally not bound by uniform accounting, auditing, and financial reporting requirements and standards of practice comparable to those applicable to domestic issuers. Investments in foreign securities also involve the risk of possible adverse changes in investment or exchange control regulations, expropriation or confiscatory taxation, limitation on the removal of funds or other assets of the Trust, political or financial instability or diplomatic and other developments which could affect such investments. Foreign securities markets, while growing in volume and sophistication, are generally not as developed as those in the United States, and securities of some foreign issuers (particularly those located in developing countries) may be less liquid and more volatile than securities of comparable U.S. companies. In general, there is less overall governmental supervision and regulation of foreign securities markets, broker/dealers and issuers than in the United States.
11 Credit Risk
The Trust invests primarily in below investment grade floating-rate loans, which are considered speculative because of the credit risk of their issuers. Changes in economic conditions or other circumstances are more likely to reduce the capacity of issuers of these securities to make principal and interest payments. Such companies are more likely to default on their payments of interest and principal owed than issuers of investment grade bonds. An economic downturn generally leads to a higher non-payment rate, and a loan or other debt obligation may lose significant value before a default occurs. Lower rated investments also may be subject to greater price volatility than higher rated investments. Moreover, the specific collateral used to secure a loan may decline in value or become illiquid, which would adversely affect the loan’s value.
| 41 |
Eaton Vance
Floating-Rate Income Trust
May 31, 2016
Notes to Financial Statements — continued
12 Fair Value Measurements
Under generally accepted accounting principles for fair value measurements, a three-tier hierarchy to prioritize the assumptions, referred to as inputs, is used in valuation techniques to measure fair value. The three-tier hierarchy of inputs is summarized in the three broad levels listed below.
| • | Level 1 – quoted prices in active markets for identical investments |
| • | Level 2 – other significant observable inputs (including quoted prices for similar investments, interest rates, prepayment speeds, credit risk, etc.) |
| • | Level 3 – significant unobservable inputs (including a fund’s own assumptions in determining the fair value of investments) |
In cases where the inputs used to measure fair value fall in different levels of the fair value hierarchy, the level disclosed is determined based on the lowest level input that is significant to the fair value measurement in its entirety. The inputs or methodology used for valuing securities are not necessarily an indication of the risk associated with investing in those securities.
At May 31, 2016, the hierarchy of inputs used in valuing the Trust’s investments and open derivative instruments, which are carried at value, were as follows:
| Asset Description | Level 1 | Level 2 | Level 3* | Total | ||||||||||||
| Senior Floating-Rate Loans (Less Unfunded Loan Commitments) |
$ | — | $ | 776,613,255 | $ | 1,526,466 | $ | 778,139,721 | ||||||||
| Corporate Bonds & Notes |
— | 55,161,603 | 23,536 | 55,185,139 | ||||||||||||
| Asset-Backed Securities |
— | 35,261,130 | — | 35,261,130 | ||||||||||||
| Common Stocks |
729,215 | 1,372,932 | 4,103,181 | 6,205,328 | ||||||||||||
| Convertible Preferred Stocks |
— | — | 35,192 | 35,192 | ||||||||||||
| Closed-End Funds |
12,213,740 | — | — | 12,213,740 | ||||||||||||
| Miscellaneous |
— | 55 | 0 | 55 | ||||||||||||
| Short-Term Investments |
— | 9,881,589 | — | 9,881,589 | ||||||||||||
| Total Investments |
$ | 12,942,955 | $ | 878,290,564 | $ | 5,688,375 | $ | 896,921,894 | ||||||||
| Forward Foreign Currency Exchange Contracts |
$ | — | $ | 305,078 | $ | — | $ | 305,078 | ||||||||
| Total |
$ | 12,942,955 | $ | 878,595,642 | $ | 5,688,375 | $ | 897,226,972 | ||||||||
| Liability Description |
||||||||||||||||
| Forward Foreign Currency Exchange Contracts |
$ | — | $ | (63,250 | ) | $ | — | $ | (63,250 | ) | ||||||
| Total |
$ | — | $ | (63,250 | ) | $ | — | $ | (63,250 | ) | ||||||
| * | None of the unobservable inputs for Level 3 assets, individually or collectively, had a material impact on the Trust. |
Level 3 investments at the beginning and/or end of the period in relation to net assets were not significant and accordingly, a reconciliation of Level 3 assets for the year ended May 31, 2016 is not presented.
At May 31, 2016, there were no investments transferred between Level 1 and Level 2 during the year then ended.
13 Legal Proceedings
In May 2015, the Trust was served with an amended complaint filed in an adversary proceeding in the United States Bankruptcy Court for the Southern District of New York. The adversary proceeding was filed by the Motors Liquidation Company Avoidance Action Trust (“AAT”) against the former holders of a $1.5 billion term loan issued by General Motors Corp. (“GM”) in 2006 (the “Term Loan Lenders”) who received a full repayment of the term loan pursuant to a court order in the GM bankruptcy proceeding. The court order was made with the understanding that the term loan was fully secured at the time of GM’s bankruptcy filing in June 2009. The AAT is seeking (1) a determination from the Bankruptcy Court that the security interest held by the Term Loan Lenders was not perfected at the time GM filed for Chapter 11 Bankruptcy protection and thus the Term Loan Lenders should have been treated in the same manner as GM’s unsecured creditors, (2) disgorgement of any interest payments made to the Term Loan Lenders within ninety days of GM’s filing for Chapter 11 Bankruptcy protection, and (3) disgorgement of the $1.5 billion term loan repayment that was made to the Term Loan Lenders. The value of the payment received under the term loan agreement by the Trust is approximately $4,166,000 (equal to 0.71% of net assets applicable to common shares at May 31, 2016). The Trust cannot predict the outcome of these proceedings or the effect, if any, on the Trust’s net asset value. The attorneys’ fees and costs related to these actions are expensed by the Trust as incurred.
| 42 |
Eaton Vance
Floating-Rate Income Trust
May 31, 2016
Notes to Financial Statements — continued
14 Subsequent Event
In June 2016, the redemption date of the VRTP Shares was further extended to April 8, 2017 from January 8, 2017 upon consent of the holders of the VRTP Shares and approval of the Trust’s Board of Trustees.
| 43 |
Eaton Vance
Floating-Rate Income Trust
May 31, 2016
Report of Independent Registered Public Accounting Firm
To the Trustees and Shareholders of Eaton Vance Floating-Rate Income Trust:
We have audited the accompanying statement of assets and liabilities of Eaton Vance Floating-Rate Income Trust (the “Trust”), including the portfolio of investments, as of May 31, 2016, and the related statements of operations and cash flows for the year then ended, the statements of changes in net assets for each of the two years in the period then ended, and the financial highlights for each of the five years in the period then ended. These financial statements and financial highlights are the responsibility of the Trust’s management. Our responsibility is to express an opinion on these financial statements and financial highlights based on our audits.
We conducted our audits in accordance with the standards of the Public Company Accounting Oversight Board (United States). Those standards require that we plan and perform the audit to obtain reasonable assurance about whether the financial statements and financial highlights are free of material misstatement. The Trust is not required to have, nor were we engaged to perform, an audit of its internal control over financial reporting. Our audits included consideration of internal control over financial reporting as a basis for designing audit procedures that are appropriate in the circumstances, but not for the purpose of expressing an opinion on the effectiveness of the Trust’s internal control over financial reporting. Accordingly, we express no such opinion. An audit also includes examining, on a test basis, evidence supporting the amounts and disclosures in the financial statements, assessing the accounting principles used and significant estimates made by management, as well as evaluating the overall financial statement presentation. Our procedures included confirmation of securities and senior loans owned as of May 31, 2016, by correspondence with the custodian, brokers, and selling or agent banks; where replies were not received from brokers and selling or agent banks, we performed other auditing procedures. We believe that our audits provide a reasonable basis for our opinion.
In our opinion, such financial statements and financial highlights referred to above present fairly, in all material respects, the financial position of Eaton Vance Floating-Rate Income Trust as of May 31, 2016, the results of its operations and its cash flows for the year then ended, the changes in its net assets for each of the two years in the period then ended, and the financial highlights for each of the five years in the period then ended, in conformity with accounting principles generally accepted in the United States of America.
DELOITTE & TOUCHE LLP
Boston, Massachusetts
July 18, 2016
| 44 |
Eaton Vance
Floating-Rate Income Trust
May 31, 2016
Federal Tax Information (Unaudited)
The Form 1099-DIV you receive in February 2017 will show the tax status of all distributions paid to your account in calendar year 2016. Shareholders are advised to consult their own tax adviser with respect to the tax consequences of their investment in the Trust. As required by the Internal Revenue Code and/or regulations, shareholders must be notified regarding the status of qualified dividend income for individuals.
Qualified Dividend Income. For the fiscal year ended May 31, 2016, the Trust designates approximately $15,434, or up to the maximum amount of such dividends allowable pursuant to the Internal Revenue Code, as qualified dividend income eligible for the reduced tax rate of 15%.
| 45 |
Eaton Vance
Floating-Rate Income Trust
May 31, 2016
Annual Meeting of Shareholders (Unaudited)
The Fund held its Annual Meeting of Shareholders on March 24, 2016. The following action was taken by the shareholders:
Item 1: The election of Helen Frame Peters, Valerie A. Mosley and Ralph F. Verni as Class III Trustees of the Fund for a three-year term expiring in 2019. Mr. Verni was elected solely by VRTP shareholders.
| Nominee for Trustee Elected by All Shareholders |
Number of Shares | |||||||
| For | Withheld | |||||||
| Helen Frame Peters |
31,989,627 | 1,890,628 | ||||||
| Valerie A. Mosley |
32,094,296 | 1,785,959 | ||||||
| Nominee for Trustee Elected by VRTP Shareholders |
Number of Shares | |||||||
| For | Withheld | |||||||
| Ralph F. Verni |
800 | 0 | ||||||
| 46 |
Eaton Vance
Floating-Rate Income Trust
May 31, 2016
Dividend Reinvestment Plan
The Trust offers a dividend reinvestment plan (the Plan) pursuant to which shareholders may elect to have dividends and capital gains distributions reinvested in common shares (the Shares) of the Trust. You may elect to participate in the Plan by completing the Dividend Reinvestment Plan Application Form. If you do not participate, you will receive all distributions in cash paid by check mailed directly to you by American Stock Transfer & Trust Company, LLC (AST) as a dividend paying agent. On the distribution payment date, if the net asset value per Share is equal to or less than the market price per Share plus estimated brokerage commissions, then new Shares will be issued. The number of Shares shall be determined by the greater of the net asset value per Share or 95% of the market price. Otherwise, Shares generally will be purchased on the open market by AST, the Plan agent (Agent). Distributions subject to income tax (if any) are taxable whether or not Shares are reinvested.
If your Shares are in the name of a brokerage firm, bank, or other nominee, you can ask the firm or nominee to participate in the Plan on your behalf. If the nominee does not offer the Plan, you will need to request that your Shares be re-registered in your name with the Trust’s transfer agent, American Stock Transfer & Trust Company, LLC or you will not be able to participate.
The Plan Agent’s service fee for handling distributions will be paid by the Trust. Each participant will be charged their pro rata share of brokerage commissions on all open-market purchases.
Plan participants may withdraw from the Plan at any time by writing to the Agent at the address noted on the following page. If you withdraw, you will receive Shares in your name for all Shares credited to your account under the Plan. If a participant elects by written notice to the Agent to have the Agent sell part or all of his or her Shares and remit the proceeds, the Agent is authorized to deduct a $5.00 fee plus brokerage commissions from the proceeds.
If you wish to participate in the Plan and your Shares are held in your own name, you may complete the form on the following page and deliver it to the Plan Agent. Any inquiries regarding the Plan can be directed to the Plan Agent at 1-866-439-6787.
| 47 |
Eaton Vance
Floating-Rate Income Trust
May 31, 2016
Application for Participation in Dividend Reinvestment Plan
This form is for shareholders who hold their common shares in their own names. If your common shares are held in the name of a brokerage firm, bank, or other nominee, you should contact your nominee to see if it will participate in the Plan on your behalf. If you wish to participate in the Plan, but your brokerage firm, bank, or nominee is unable to participate on your behalf, you should request that your common shares be re-registered in your own name which will enable your participation in the Plan.
The following authorization and appointment is given with the understanding that I may terminate it at any time by terminating my participation in the Plan as provided in the terms and conditions of the Plan.
Please print exact name on account:
Shareholder signature Date
Shareholder signature Date
Please sign exactly as your common shares are registered. All persons whose names appear on the share certificate must sign.
YOU SHOULD NOT RETURN THIS FORM IF YOU WISH TO RECEIVE YOUR DISTRIBUTIONS IN CASH. THIS IS NOT A PROXY.
This authorization form, when signed, should be mailed to the following address:
Eaton Vance Floating-Rate Income Trust
c/o American Stock Transfer & Trust Company, LLC
P.O. Box 922
Wall Street Station
New York, NY 10269-0560
Number of Employees
The Trust is organized as a Massachusetts business trust and is registered under the Investment Company Act of 1940, as amended, as a diversified, closed-end management investment company and has no employees.
Number of Shareholders
As of May 31, 2016, Trust records indicate that there are 9 registered shareholders and approximately 20,353 shareholders owning the Trust shares in street name, such as through brokers, banks, and financial intermediaries.
If you are a street name shareholder and wish to receive Trust reports directly, which contain important information about the Trust, please write or call:
Eaton Vance Distributors, Inc.
Two International Place
Boston, MA 02110
1-800-262-1122
New York Stock Exchange symbol
The New York Stock Exchange symbol is EFT.
| 48 |
Eaton Vance
Floating-Rate Income Trust
May 31, 2016
Board of Trustees’ Contract Approval
Overview of the Contract Review Process
The Investment Company Act of 1940, as amended (the “1940 Act”), provides, in substance, that each investment advisory agreement between a fund and its investment adviser will continue in effect from year to year only if its continuation is approved at least annually by the fund’s board of trustees, including by a vote of a majority of the trustees who are not “interested persons” of the fund (“Independent Trustees”), cast in person at a meeting called for the purpose of considering such approval.
At a meeting of the Boards of Trustees (each a “Board”) of the registered investment companies advised, administered and/or distributed by Eaton Vance Management or its affiliates (the “Eaton Vance Funds”) held on April 26, 2016, the Board, including a majority of the Independent Trustees, voted to approve continuation of existing investment advisory and sub-advisory agreements for the Eaton Vance Funds for an additional one-year period. In voting its approval, the Board relied upon the affirmative recommendation of its Contract Review Committee, which is a committee comprised exclusively of Independent Trustees. Prior to making its recommendation, the Contract Review Committee reviewed information furnished by each adviser to the Eaton Vance Funds (including information specifically requested by the Board) for a series of meetings of the Contract Review Committee held between February and April 2016. The Contract Review Committee also considered information received at prior meetings of the Board and its committees, as relevant to its annual evaluation of the investment advisory and sub-advisory agreements.
The information that the Board considered included, among other things, the following (for funds that invest through one or more underlying portfolio(s), references to “each fund” in this section may include information that was considered at the portfolio-level):
Information about Fees, Performance and Expenses
| • | A report from an independent data provider comparing the advisory and related fees paid by each fund with fees paid by comparable funds as identified by the independent data provider (“comparable funds”); |
| • | A report from an independent data provider comparing each fund’s total expense ratio and its components to comparable funds; |
| • | A report from an independent data provider comparing the investment performance of each fund (including, where relevant, yield data, Sharpe ratios and information ratios) to the investment performance of comparable funds over various time periods; |
| • | Data regarding investment performance in comparison to benchmark indices and customized groups of peer funds identified by the adviser in consultation with the Board; |
| • | For each fund, comparative information concerning the fees charged and the services provided by each adviser in managing other accounts (including mutual funds, other collective investment funds and institutional accounts) using investment strategies and techniques similar to those used in managing such fund; |
| • | Profitability analyses for each adviser with respect to each fund; |
Information about Portfolio Management and Trading
| • | Descriptions of the investment management services provided to each fund, including the investment strategies and processes it employs; |
| • | The procedures and processes used to determine the fair value of fund assets and actions taken to monitor and test the effectiveness of such procedures and processes; |
| • | Information about each adviser’s policies and practices with respect to trading, including each adviser’s processes for monitoring best execution of portfolio transactions; |
| • | Information about the allocation of brokerage transactions and the benefits received by each adviser as a result of brokerage allocation, including information concerning the acquisition of research through client commission arrangements and policies with respect to “soft dollars”; |
| • | Data relating to portfolio turnover rates of each fund; |
Information about each Adviser
| • | Reports detailing the financial results and condition of each adviser; |
| • | Descriptions of the qualifications, education and experience of the individual investment professionals whose responsibilities include portfolio management and investment research for the funds, and information relating to their compensation and responsibilities with respect to managing other mutual funds and investment accounts; |
| • | The Code of Ethics of each adviser and its affiliates, together with information relating to compliance with and the administration of such codes; |
| • | Policies and procedures relating to proxy voting and the handling of corporate actions and class actions; |
| • | Information concerning the resources devoted to compliance efforts undertaken by each adviser and its affiliates (including descriptions of various compliance programs) and their record of compliance; |
| • | Information concerning the business continuity and disaster recovery plans of each adviser and its affiliates; |
| • | A description of Eaton Vance Management’s procedures for overseeing third party advisers and sub-advisers, including with respect to regulatory and compliance issues, investment management and other matters; |
| 49 |
Eaton Vance
Floating-Rate Income Trust
May 31, 2016
Board of Trustees’ Contract Approval — continued
Other Relevant Information
| • | Information concerning the nature, cost and character of the administrative and other non-investment advisory services provided by Eaton Vance Management and its affiliates; |
| • | Information concerning management of the relationship with the custodian, subcustodians and fund accountants by each adviser or the funds’ administrator; and |
| • | The terms of each investment advisory agreement. |
Over the course of the twelve-month period ended April 30, 2016, with respect to one or more funds, the Board met ten times and the Contract Review Committee, the Audit Committee, the Governance Committee, the Portfolio Management Committee and the Compliance Reports and Regulatory Matters Committee, each of which is a Committee comprised solely of Independent Trustees, met seven, sixteen, four, nine and eleven times, respectively. At such meetings, the Trustees participated in investment and performance reviews with the portfolio managers and other investment professionals of each investment adviser relating to each fund, and considered various investment and trading strategies used in pursuing each fund’s investment objective, such as the use of derivative instruments, as well as risk management techniques. The Board and its Committees also evaluated issues pertaining to industry and regulatory developments, compliance procedures, fund governance and other issues with respect to the funds, and received and participated in reports and presentations provided by Eaton Vance Management and other fund advisers with respect to such matters. In addition to the formal meetings of the Board and its Committees, the Independent Trustees hold regular teleconferences in between meetings to discuss, among other topics, matters relating to the continuation of investment advisory and sub-advisory agreements.
For funds that invest through one or more underlying portfolios, the Board considered similar information about the portfolio(s) when considering the approval of investment advisory agreements. In addition, in cases where the fund’s investment adviser has engaged a sub-adviser, the Board considered similar information about the sub-adviser when considering the approval of any sub-advisory agreement.
The Contract Review Committee was assisted throughout the contract review process by Goodwin Procter LLP, independent legal counsel for the Independent Trustees. The members of the Contract Review Committee relied upon the advice of such counsel and their own business judgment in determining the material factors to be considered in evaluating each investment advisory and sub-advisory agreement and the weight to be given to each such factor. The conclusions reached with respect to each investment advisory and sub-advisory agreement were based on a comprehensive evaluation of all the information provided and not any single factor. Moreover, each member of the Contract Review Committee may have placed varying emphasis on particular factors in reaching conclusions with respect to each investment advisory and sub-advisory agreement. In evaluating each investment advisory and sub-advisory agreement, including the specific fee structures and other terms of the agreements, the Contract Review Committee was informed by multiple years of analysis and discussion among the Independent Trustees and the Eaton Vance Funds’ advisers and sub-advisers.
Results of the Process
Based on its consideration of the foregoing, and such other information as it deemed relevant, including the factors and conclusions described below, the Contract Review Committee concluded that the continuation of the investment advisory agreement of Eaton Vance Floating-Rate Income Trust (the “Fund”) with Eaton Vance Management (the “Adviser”), including its fee structure, is in the interests of shareholders and, therefore, the Contract Review Committee recommended to the Board approval of the agreement. The Board accepted the recommendation of the Contract Review Committee based on the material factors considered and conclusions reached by the Contract Review Committee with respect to the agreement. Accordingly, the Board, including a majority of the Independent Trustees, voted to approve continuation of the investment advisory agreement for the Fund.
Nature, Extent and Quality of Services
In considering whether to approve the investment advisory agreement of the Fund, the Board evaluated the nature, extent and quality of services provided to the Fund by the Adviser.
The Board considered the Adviser’s management capabilities and investment process with respect to the types of investments held by the Fund, including the education, experience and number of its investment professionals and other personnel who provide portfolio management, investment research, and similar services to the Fund. In particular, the Board considered the abilities and experience of such investment professionals in analyzing factors such as the special considerations relevant to investing in senior floating rate loans. The Board considered the Adviser’s large group of bank loan investment professionals and other personnel who provide services to the Fund, including portfolio managers and analysts. The Board also took into account the resources dedicated to portfolio management and other services, as well as the compensation methods of the Adviser and other factors, such as the reputation and resources of the Adviser to recruit and retain highly qualified research, advisory and supervisory investment professionals. In addition, the Board considered the time and attention devoted to the Eaton Vance Funds, including the Fund, by senior management, as well as the infrastructure, operational capabilities and support staff in place to assist in the portfolio management and operations of the Fund, including the provision of administrative services.
The Board considered the compliance programs of the Adviser and relevant affiliates thereof. Among other matters, the Board considered compliance and reporting matters relating to personal trading by investment professionals, selective disclosure of portfolio holdings, late trading, frequent trading, portfolio valuation, business continuity and the allocation of investment opportunities. The Board also considered the responses of the Adviser and its affiliates to requests in recent years from regulatory authorities such as the Securities and Exchange Commission and the Financial Industry Regulatory Authority.
| 50 |
Eaton Vance
Floating-Rate Income Trust
May 31, 2016
Board of Trustees’ Contract Approval — continued
The Board considered shareholder and other administrative services provided or managed by Eaton Vance Management and its affiliates, including transfer agency and accounting services. The Board evaluated the benefits to shareholders of investing in a fund that is a part of a large fund complex offering exposure to a variety of asset classes and investment disciplines.
After consideration of the foregoing factors, among others, the Board concluded that the nature, extent and quality of services provided by the Adviser, taken as a whole, are appropriate and consistent with the terms of the investment advisory agreement.
Fund Performance
The Board compared the Fund’s investment performance to that of comparable funds and appropriate benchmark indices, as well as a customized peer group of similarly managed funds. The Board’s review included comparative performance data for the one-, three-, five- and ten-year periods ended September 30, 2015 for the Fund. On the basis of the foregoing and other relevant information provided by the Adviser in response to inquiries from the Contract Review Committee, the Board concluded that the performance of the Fund was satisfactory.
Management Fees and Expenses
The Board considered contractual fee rates payable by the Fund for advisory and administrative services (referred to collectively as “management fees”). As part of its review, the Board considered the Fund’s management fees and total expense ratio for the one year period ended September 30, 2015, as compared to those of comparable funds, before and after giving effect to any undertaking to waive fees or reimburse expenses. The Board also considered factors that had an impact on Fund expense ratios, as identified by management in response to inquiries from the Contract Review Committee.
After considering the foregoing information, and in light of the nature, extent and quality of the services provided by the Adviser, the Board concluded that the management fees charged for advisory and related services are reasonable.
Profitability and Other “Fall-Out” Benefits
The Board considered the level of profits realized by the Adviser and relevant affiliates thereof in providing investment advisory and administrative services to the Fund and to all Eaton Vance Funds as a group. The Board considered the level of profits realized without regard to marketing support or other payments by the Adviser and its affiliates to third parties in respect of distribution services. The Board also considered other direct or indirect fall-out benefits received by the Adviser and its affiliates in connection with their relationships with the Fund, including the benefits of research services that may be available to the Adviser as a result of securities transactions effected for the Fund and other investment advisory clients.
The Board concluded that, in light of the foregoing factors and the nature, extent and quality of the services rendered, the profits realized by the Adviser and its affiliates are deemed not to be excessive.
Economies of Scale
In reviewing management fees and profitability, the Board also considered the extent to which the Adviser and its affiliates, on the one hand, and the Fund, on the other hand, can expect to realize benefits from economies of scale as the assets of the Fund increase. The Board acknowledged the difficulty in accurately measuring the benefits resulting from economies of scale, if any, with respect to the management of any specific fund or group of funds. The Board reviewed data summarizing the increases and decreases in the assets of the Fund and of all Eaton Vance Funds as a group over various time periods, and evaluated the extent to which the total expense ratio of the Fund and the profitability of the Adviser and its affiliates may have been affected by such increases or decreases. Based upon the foregoing, the Board concluded that the Fund currently shares in any benefits from economies of scale. The Board also considered the fact that the Fund is not continuously offered and that the Fund’s assets are not expected to increase materially in the foreseeable future. The Board concluded that, in light of the level of the Adviser’s profits with respect to the Fund, the implementation of breakpoints in the advisory fee schedule is not warranted at this time.
| 51 |
Eaton Vance
Floating-Rate Income Trust
May 31, 2016
Management and Organization
Fund Management. The Trustees of Eaton Vance Floating-Rate Income Trust (the Trust) are responsible for the overall management and supervision of the Trust’s affairs. The Trustees and officers of the Trust are listed below. Except as indicated, each individual has held the office shown or other offices in the same company for the last five years. The “Noninterested Trustees” consist of those Trustees who are not “interested persons” of the Trust, as that term is defined under the 1940 Act. The business address of each Trustee and officer is Two International Place, Boston, Massachusetts 02110. As used below, “EVC” refers to Eaton Vance Corp., “EV” refers to Eaton Vance, Inc., “EVM” refers to Eaton Vance Management, “BMR” refers to Boston Management and Research, “EVMI” refers to Eaton Vance Management (International) Limited and “EVD” refers to Eaton Vance Distributors, Inc. EVC and EV are the corporate parent and trustee, respectively, of EVM and BMR. EVMI is an indirect, wholly-owned subsidiary of EVC. EVD is the Trust’s principal underwriter and a wholly-owned subsidiary of EVC. Each officer affiliated with Eaton Vance may hold a position with other Eaton Vance affiliates that is comparable to his or her position with EVM listed below. Each Trustee oversees 175 portfolios in the Eaton Vance Complex (including all master and feeder funds in a master feeder structure). Each officer serves as an officer of certain other Eaton Vance funds. Each Trustee serves for a three year term. Each officer serves until his or her successor is elected.
| Name and Year of Birth | Position(s) with the |
Term Expiring; Trustee Since(1) |
Principal Occupation(s) and Directorships During Past Five Years and Other Relevant Experience | |||
| Interested Trustee |
||||||
| Thomas E. Faust Jr. 1958 |
Class I Trustee | Until 2017. Trustee since 2007. |
Chairman, Chief Executive Officer and President of EVC, Director and President of EV, Chief Executive Officer and President of EVM and BMR, and Director of EVD and EVMI. Trustee and/or officer of 175 registered investment companies. Mr. Faust is an interested person because of his positions with EVM, BMR, EVD, EVMI, EVC and EV, which are affiliates of the Trust. Directorships in the Last Five Years.(2) Director of EVC and Hexavest Inc. (investment management firm). | |||
| Noninterested Trustees | ||||||
| Scott E. Eston(A) 1956 |
Class I Trustee | Until 2017. Trustee since 2011. |
Private investor. Formerly held various positions at Grantham, Mayo, Van Otterloo and Co., L.L.C. (investment management firm) (1997-2009), including Chief Operating Officer (2002-2009), Chief Financial Officer (1997-2009) and Chairman of the Executive Committee (2002-2008); President and Principal Executive Officer, GMO Trust (open-end registered investment company) (2006-2009). Former Partner, Coopers and Lybrand L.L.P. (now PricewaterhouseCoopers) (an independent registered public accounting firm) (1987-1997). Directorships in the Last Five Years.(2) None. | |||
| Cynthia E. Frost 1961 |
Class I Trustee | Until 2017. Trustee since 2014. |
Private investor. Formerly, Chief Investment Officer of Brown University (university endowment) (2000-2012); Portfolio Strategist for Duke Management Company (university endowment manager) (1995-2000); Managing Director, Cambridge Associates (investment consulting company) (1989-1995); Consultant, Bain and Company (management consulting firm) (1987-1989); Senior Equity Analyst, BA Investment Management Company (1983-1985). Directorships in the Last Five Years. None. | |||
| George J. Gorman 1952 |
Class II Trustee | Until 2018. Trustee since 2014. |
Principal at George J. Gorman LLC (consulting firm). Formerly, Senior Partner at Ernst & Young LLP (public accounting firm) (1974-2009). Directorships in the Last Five Years. Formerly, Trustee of the Bank of America Money Market Funds Series Trust (2011-2014) and of the Ashmore Funds (2010-2014). | |||
| Valerie A. Mosley 1960 |
Class III Trustee | Until 2019. Trustee since 2014. |
Chairwoman and Chief Executive Officer of Valmo Ventures (a consulting and investment firm). Former Partner and Senior Vice President, Portfolio Manager and Investment Strategist at Wellington Management Company, LLP (investment management firm) (1992-2012). Former Chief Investment Officer, PG Corbin Asset Management (1990-1992). Formerly worked in institutional corporate bond sales at Kidder Peabody (1986-1990). Directorships in the Last Five Years.(2) Director of Dynex Capital, Inc. (mortgage REIT) (since 2013). | |||
| 52 |
Eaton Vance
Floating-Rate Income Trust
May 31, 2016
Management and Organization — continued
| Name and Year of Birth | Position(s) with the |
Term Expiring; Trustee Since(1) |
Principal Occupation(s) and Directorships During Past Five Years and Other Relevant Experience | |||
| Noninterested Trustees (continued) | ||||||
| William H. Park 1947 |
Chairperson of the Board and Class II Trustee | Until 2018. Chairperson of the Board since 2016 and Trustee since 2003. |
Private investor. Formerly, Consultant (management and transactional) (2012-2014). Formerly, Chief Financial Officer, Aveon Group L.P. (investment management firm) (2010-2011). Formerly, Vice Chairman, Commercial Industrial Finance Corp. (specialty finance company) (2006-2010). Formerly, President and Chief Executive Officer, Prizm Capital Management, LLC (investment management firm) (2002-2005). Formerly, Executive Vice President and Chief Financial Officer, United Asset Management Corporation (investment management firm) (1982-2001). Formerly, Senior Manager, Price Waterhouse (now PricewaterhouseCoopers) (an independent registered public accounting firm) (1972-1981). Directorships in the Last Five Years.(2) None. | |||
| Helen Frame Peters 1948 |
Class III Trustee | Until 2019. Trustee since 2008. |
Professor of Finance, Carroll School of Management, Boston College. Formerly, Dean, Carroll School of Management, Boston College (2000-2002). Formerly, Chief Investment Officer, Fixed Income, Scudder Kemper Investments (investment management firm) (1998-1999). Formerly, Chief Investment Officer, Equity and Fixed Income, Colonial Management Associates (investment management firm) (1991-1998). Directorships in the Last Five Years.(2) Formerly, Director of BJ’s Wholesale Club, Inc. (wholesale club retailer) (2004-2011). Formerly, Trustee of SPDR Index Shares Funds and SPDR Series Trust (exchange traded funds) (2000-2009). Formerly, Director of Federal Home Loan Bank of Boston (a bank for banks) (2007-2009). | |||
| Susan J. Sutherland 1957 |
Class II Trustee | Until 2018. Trustee since 2015. |
Private investor. Formerly, Associate, Counsel and Partner at Skadden, Arps, Slate, Meagher & Flom LLP (law firm) (1982-2013). Directorships in the Last Five Years. Formerly, Director of Montpelier Re Holdings Ltd. (global provider of customized insurance and reinsurance products) (2013-2015). | |||
| Harriett Tee Taggart 1948 |
Class II Trustee | Until 2018. Trustee since 2011. |
Managing Director, Taggart Associates (a professional practice firm). Formerly, Partner and Senior Vice President, Wellington Management Company, LLP (investment management firm) (1983-2006). Directorships in the Last Five Years.(2) Director of Albemarle Corporation (chemicals manufacturer) (since 2007) and The Hanover Group (specialty property and casualty insurance company) (since 2009). Formerly, Director of Lubrizol Corporation (specialty chemicals) (2007-2011). | |||
| Ralph F. Verni(A) 1943 |
Class III Trustee | Until 2019. Trustee since 2005. |
Consultant and private investor. Formerly, Chief Investment Officer (1982-1992), Chief Financial Officer (1988-1990) and Director (1982-1992), New England Life. Formerly, Chairperson, New England Mutual Funds (1982-1992). Formerly, President and Chief Executive Officer, State Street Management & Research (1992-2000). Formerly, Chairperson, State Street Research Mutual Funds (1992-2000). Formerly, Director, W.P. Carey, LLC (1998-2004) and First Pioneer Farm Credit Corp. (financial services cooperative) (2002-2006). Directorships in the Last Five Years.(2) None. | |||
| Principal Officers who are not Trustees | ||||||
| Name and Year of Birth | Position(s) with the Trust |
Officer Since(3) |
Principal Occupation(s) During Past Five Years | |||
| Scott H. Page 1959 |
President | Since 1996 | Vice President of EVM and BMR. | |||
| Payson F. Swaffield 1956 |
Vice President | Since 2003 | Chief Income Investment Officer of EVC. Vice President of EVM and BMR. | |||
| Maureen A. Gemma 1960 |
Vice President, Secretary and Chief Legal Officer | Since 2005 | Vice President of EVM and BMR. | |||
| 53 |
Eaton Vance
Floating-Rate Income Trust
May 31, 2016
Management and Organization — continued
| Name and Year of Birth | Position(s) with the Trust |
Officer Since(3) |
Principal Occupation(s) During Past Five Years | |||
| Principal Officers who are not Trustees (continued) | ||||||
| James F. Kirchner 1967 |
Treasurer | Since 2007 | Vice President of EVM and BMR. | |||
| Paul M. O’Neil 1953 |
Chief Compliance Officer | Since 2004 | Vice President of EVM and BMR. | |||
| (1) | Year first appointed to serve as Trustee for a fund in the Eaton Vance family of funds. Each Trustee has served continuously since appointment unless indicated otherwise. Each Trustee holds office until the annual meeting for the year in which his or her term expires and until his or her successor is elected and qualified, subject to a prior death, resignation, retirement, disqualification or removal. |
| (2) | During their respective tenures, the Trustees (except for Mmes. Frost and Sutherland and Mr. Gorman) also served as Board members of one or more of the following funds (which operated in the years noted): eUnitsTM 2 Year U.S. Market Participation Trust: Upside to Cap / Buffered Downside (launched in 2012 and terminated in 2014); eUnitsTM 2 Year U.S. Market Participation Trust II: Upside to Cap / Buffered Downside (launched in 2012 and terminated in 2014); and Eaton Vance National Municipal Income Trust (launched in 1998 and terminated in 2009). However, Ms. Mosley did not serve as a Board member of eUnitsTM 2 Year U.S. Market Participation Trust: Upside to Cap / Buffered Downside (launched in 2012 and terminated in 2014). |
| (3) | Year first elected to serve as officer of a fund in the Eaton Vance family of funds when the officer has served continuously. Otherwise, year of most recent election as an officer of a fund in the Eaton Vance family of funds. Titles may have changed since initial election. |
| (A) | VRTP Trustee. |
| 54 |
Eaton Vance Funds
IMPORTANT NOTICES
Privacy. The Eaton Vance organization is committed to ensuring your financial privacy. Each of the financial institutions identified below has in effect the following policy (“Privacy Policy”) with respect to nonpublic personal information about its customers:
| • | Only such information received from you, through application forms or otherwise, and information about your Eaton Vance fund transactions will be collected. This may include information such as name, address, social security number, tax status, account balances and transactions. |
| • | None of such information about you (or former customers) will be disclosed to anyone, except as permitted by law (which includes disclosure to employees necessary to service your account). In the normal course of servicing a customer’s account, Eaton Vance may share information with unaffiliated third parties that perform various required services such as transfer agents, custodians and broker-dealers. |
| • | Policies and procedures (including physical, electronic and procedural safeguards) are in place that are designed to protect the confidentiality of such information. |
| • | We reserve the right to change our Privacy Policy at any time upon proper notification to you. Customers may want to review our Privacy Policy periodically for changes by accessing the link on our homepage: www.eatonvance.com. |
Our pledge of privacy applies to the following entities within the Eaton Vance organization: the Eaton Vance Family of Funds, Eaton Vance Management, Eaton Vance Investment Counsel, Eaton Vance Distributors, Inc., Eaton Vance Trust Company, Eaton Vance Management (International) Limited, Eaton Vance Management’s Real Estate Investment Group and Boston Management and Research. In addition, our Privacy Policy applies only to those Eaton Vance customers who are individuals and who have a direct relationship with us. If a customer’s account (i.e., fund shares) is held in the name of a third-party financial advisor/broker-dealer, it is likely that only such advisor’s privacy policies apply to the customer. This notice supersedes all previously issued privacy disclosures. For more information about Eaton Vance’s Privacy Policy, please call 1-800-262-1122.
Delivery of Shareholder Documents. The Securities and Exchange Commission (SEC) permits funds to deliver only one copy of shareholder documents, including prospectuses, proxy statements and shareholder reports, to fund investors with multiple accounts at the same residential or post office box address. This practice is often called “householding” and it helps eliminate duplicate mailings to shareholders. Eaton Vance, or your financial advisor, may household the mailing of your documents indefinitely unless you instruct Eaton Vance, or your financial advisor, otherwise. If you would prefer that your Eaton Vance documents not be householded, please contact Eaton Vance at 1-800-262-1122, or contact your financial advisor. Your instructions that householding not apply to delivery of your Eaton Vance documents will be effective within 30 days of receipt by Eaton Vance or your financial advisor.
Portfolio Holdings. Each Eaton Vance Fund and its underlying Portfolio(s) (if applicable) will file a schedule of portfolio holdings on Form N-Q with the SEC for the first and third quarters of each fiscal year. The Form N-Q will be available on the Eaton Vance website at www.eatonvance.com, by calling Eaton Vance at 1-800-262-1122 or in the EDGAR database on the SEC’s website at www.sec.gov. Form N-Q may also be reviewed and copied at the SEC’s public reference room in Washington, D.C. (call 1-800-732-0330 for information on the operation of the public reference room).
Proxy Voting. From time to time, funds are required to vote proxies related to the securities held by the funds. The Eaton Vance Funds or their underlying Portfolios (if applicable) vote proxies according to a set of policies and procedures approved by the Funds’ and Portfolios’ Boards. You may obtain a description of these policies and procedures and information on how the Funds or Portfolios voted proxies relating to portfolio securities during the most recent 12-month period ended June 30, without charge, upon request, by calling 1-800-262-1122 and by accessing the SEC’s website at www.sec.gov.
Share Repurchase Program. The Fund’s Board of Trustees has approved a share repurchase program authorizing the Fund to repurchase up to 10% of its outstanding common shares as of the approved date in open-market transactions at a discount to net asset value. The repurchase program does not obligate the Fund to purchase a specific amount of shares. The Fund’s repurchase activity, including the number of shares purchased, average price and average discount to net asset value, is disclosed in the Fund’s annual and semi-annual reports to shareholders.
Additional Notice to Shareholders. If applicable, a Fund may also redeem or purchase its outstanding preferred shares in order to maintain compliance with regulatory requirements, borrowing or rating agency requirements or for other purposes as it deems appropriate or necessary.
Closed-End Fund Information. Eaton Vance closed-end funds make fund performance data and certain information about portfolio characteristics available on the Eaton Vance website shortly after the end of each month. Other information about the funds is available on the website. The funds’ net asset value per share is readily accessible on the Eaton Vance website. Portfolio holdings for the most recent month-end are also posted to the website approximately 30 days following the end of the month. This information is available at www.eatonvance.com on the fund information pages under “Individual Investors — Closed-End Funds”.
| 55 |
This Page Intentionally Left Blank
| 2224 5.31.16 |
Item 2. Code of Ethics
The registrant has adopted a code of ethics applicable to its Principal Executive Officer, Principal Financial Officer and Principal Accounting Officer. The registrant undertakes to provide a copy of such code of ethics to any person upon request, without charge, by calling 1-800-262-1122.
Item 3. Audit Committee Financial Expert
The registrant’s Board has designated William H. Park, an independent trustee, as its audit committee financial expert. Mr. Park is a certified public accountant who is a private investor. Previously, he served as a consultant, as the Chief Financial Officer of Aveon Group, L.P. (an investment management firm), as the Vice Chairman of Commercial Industrial Finance Corp. (specialty finance company), as President and Chief Executive Officer of Prizm Capital Management, LLC (investment management firm), as Executive Vice President and Chief Financial Officer of United Asset Management Corporation (an institutional investment management firm) and as a Senior Manager at Price Waterhouse (now PricewaterhouseCoopers) (an independent registered public accounting firm).
Item 4. Principal Accountant Fees and Services
Rule 2-01(c)(1)(ii)(A) of Regulation S-X (the “Loan Rule”) prohibits an accounting firm, such as the Fund’s principal accountant, Deloitte & Touche LLP (“D&T”), from having certain financial relationships with their audit clients and affiliated entities. Specifically, the Loan Rule provides, in relevant part, that an accounting firm generally would not be independent if it receives a loan from a lender that is a “record or beneficial owner of more than ten percent of the audit client’s equity securities.” Based on information provided to the Audit Committee of the Board of Trustees (the “Audit Committee”) of the Eaton Vance Family of Funds by D&T, certain relationships between D&T and its affiliates (“Deloitte Entities”) and its lenders who are record owners of shares of one or more funds (the “Funds”) within the Eaton Vance Funds’ investment company complex implicate the Loan Rule, calling into question D&T’s independence with respect to the Funds. The Funds are providing this disclosure to explain the facts and circumstances as well as D&T’s conclusions concerning D&T’s objectivity and impartiality with respect to the audits of the Funds.
D&T advised the Audit Committee that it believes that, in light of the facts surrounding its lending relationships, its ability to exercise objective and impartial judgment on all issues encompassed within D&T’s audit engagement has not been impaired. D&T has advised the Audit Committee that this conclusion is based in part on the following considerations: (1) Deloitte Entity personnel responsible for managing the lending relationships have had no interactions with the audit engagement team; (2) the lending relationships are in good standing and the principal and interest payments are up-to-date; (3) the lending relationships are not significant to the Deloitte Entities or to D&T.
On June 20, 2016, the U.S. Securities and Exchange Commission (the “SEC”) issued no-action relief to another mutual fund complex (see Fidelity Management & Research Company et al., No-Action Letter (June 20, 2016)) related to the auditor independence issue described above. In that letter, the SEC indicated that it would not recommend enforcement action against the fund group if the auditor is not in compliance with the Loan Rule provided that: (1) the auditor has complied with PCAOB Rule 3526(b)(1) and 3526(b)(2); (2) the auditor’s non-compliance under the Loan Rule is with respect to certain lending relationships; and (3) notwithstanding such non-compliance, the auditor has concluded that it is objective and impartial with respect to the issues encompassed within its engagement as auditor of the funds. Based on information provided by D&T, the requirements of the no-action letter appear to be met with respect to D&T’s lending relationships described above. The SEC has indicated that the no-action relief will expire 18 months from its issuance.
(a) –(d)
The following table presents the aggregate fees billed to the registrant for the registrant’s fiscal years ended May 31, 2015 and May 31, 2016 by D&T for professional services rendered for the audit of the registrant’s annual financial statements and fees billed for other services rendered by D&T during such periods
Eaton Vance Floating-Rate Income Trust
| Fiscal Years Ended |
5/31/15 | 5/31/16 | ||||||
| Audit Fees |
$ | 103,150 | $ | 106,250 | ||||
| Audit-Related Fees(1) |
$ | 18,000 | $ | 0 | ||||
| Tax Fees(2) |
$ | 19,920 | $ | 20,003 | ||||
| All Other Fees(3) |
$ | 0 | $ | 0 | ||||
|
|
|
|
|
|||||
| Total |
$ | 141,070 | $ | 126,253 | ||||
|
|
|
|
|
|||||
| (1) | Audit-related fees consist of the aggregate fees billed for assurance and related services that are reasonably related to the performance of the audit of financial statements and are not reported under the category of audit fees and specifically include fees for the performance of certain agreed-upon procedures relating to the registrant’s revolving credit and security agreement. |
| (2) | Tax fees consist of the aggregate fees billed for professional services rendered by the principal accountant relating to tax compliance, tax advice, and tax planning and specifically include fees for tax return preparation and other related tax compliance/planning matters. |
| (3) | All other fees consist of the aggregate fees billed for products and services provided by the principal accountant other than audit, audit-related, and tax services. |
(e)(1) The registrant’s audit committee has adopted policies and procedures relating to the pre-approval of services provided by the registrant’s principal accountant (the “Pre-Approval Policies”). The Pre-Approval Policies establish a framework intended to assist the audit committee in the proper discharge of its pre-approval responsibilities. As a general matter, the Pre-Approval Policies (i) specify certain types of audit, audit-related, tax, and other services determined to be pre-approved by the audit committee; and (ii) delineate specific procedures governing the mechanics of the pre-approval process, including the approval and monitoring of audit and non-audit service fees. Unless a service is specifically pre-approved under the Pre-Approval Policies, it must be separately pre-approved by the audit committee.
The Pre-Approval Policies and the types of audit and non-audit services pre-approved therein must be reviewed and ratified by the registrant’s audit committee at least annually. The registrant’s audit committee maintains full responsibility for the appointment, compensation, and oversight of the work of the registrant’s principal accountant.
(e)(2) No services described in paragraphs (b)-(d) above were approved by the registrant’s audit committee pursuant to the “de minimis exception” set forth in Rule 2-01(c)(7)(i)(C) of Regulation S-X.
(f) Not applicable.
(g) The following table presents (i) the aggregate non-audit fees (i.e., fees for audit-related, tax, and other services) billed to the registrant by D&T for the registrant’s fiscal years ended May 31, 2015 and May 31, 2016; and (ii) the aggregate non-audit fees (i.e., fees for audit-related, tax, and other services) billed to the Eaton Vance organization by D&T for the same time periods.
| Fiscal Years Ended |
5/31/15 | 5/31/16 | ||||||
| Registrant |
$ | 37,920 | $ | 20,003 | ||||
| Eaton Vance(1) |
$ | 76,000 | $ | 10,434 | ||||
| (1) | The investment adviser to the registrant, as well as any of its affiliates that provide ongoing services to the registrant, are subsidiaries of Eaton Vance Corp. |
(h) The registrant’s audit committee has considered whether the provision by the registrant’s principal accountant of non-audit services to the registrant’s investment adviser and any entity controlling, controlled by, or under common control with the adviser that provides ongoing services to the registrant that were not pre-approved pursuant to Rule 2-01(c)(7)(ii) of Regulation S-X is compatible with maintaining the principal accountant’s independence.
Item 5. Audit Committee of Listed Registrants
The registrant has a separately-designated standing audit committee established in accordance with Section 3(a)(58)(A) of the Securities and Exchange Act of 1934, as amended. Ralph F. Verni (Chair), Scott E. Eston, George J. Gorman and William H. Park are the members of the registrant’s audit committee.
Item 6. Schedule of Investments
Please see schedule of investments contained in the Report to Stockholders included under Item 1 of this Form N-CSR.
Item 7. Disclosure of Proxy Voting Policies and Procedures for Closed-End Management Investment Companies
The Board of Trustees of the Trust has adopted a proxy voting policy and procedure (the “Fund Policy”), pursuant to which the Trustees have delegated proxy voting responsibility to the Fund’s investment adviser and adopted the investment adviser’s proxy voting policies and procedures (the “Policies”) which are described below. The Trustees will review the Fund’s proxy voting records from time to time and will annually consider approving the Policies for the upcoming year. In the event that a conflict of interest arises between the Fund’s shareholders and the investment adviser, the administrator, or any of their affiliates or any affiliate of the Fund, the investment adviser will generally refrain from voting the proxies related to the companies giving rise to such conflict until it consults with the Board’s Special Committee except as contemplated under the Fund Policy. The Board’s Special Committee will instruct the investment adviser on the appropriate course of action.
The Policies are designed to promote accountability of a company’s management to its shareholders and to align the interests of management with those shareholders. An independent proxy voting service (“Agent”), currently Institutional Shareholder Services, Inc., has been retained to assist in the voting of proxies through the provision of vote analysis, implementation and recordkeeping and disclosure services. The investment adviser will generally vote proxies through the Agent. The Agent is required to vote all proxies and/or refer them back to the investment adviser pursuant to the Policies. It is generally the policy of the investment adviser to vote in accordance with the recommendation of the Agent. The Agent shall refer to the investment adviser proxies relating to mergers and restructurings, and the disposition of assets, termination, liquidation and mergers contained in mutual fund proxies. The investment adviser will normally vote against anti-takeover measures and other proposals designed to limit the ability of shareholders to act on possible transactions, except in the case of closed-end management investment companies. The investment adviser generally supports management on social and environmental proposals. The investment adviser may abstain from voting from time to time where it determines that the costs associated with voting a proxy outweighs the benefits derived from exercising the right to vote or the economic effect on shareholders interests or the value of the portfolio holding is indeterminable or insignificant.
In addition, the investment adviser will monitor situations that may result in a conflict of interest between the Fund’s shareholders and the investment adviser, the administrator, or any of their affiliates or any affiliate of the Fund by maintaining a list of significant existing and prospective corporate clients. The investment adviser’s personnel responsible for reviewing and voting proxies on behalf of the Fund will report any proxy received or expected to be received from a company included on that list to the personnel of the investment adviser identified in the Policies. If such personnel expects to instruct the Agent to vote such proxies in a manner inconsistent with the guidelines of the Policies or the recommendation of the Agent, the personnel will consult with members of senior management of the investment adviser to determine if a material conflict of interests exists. If it is determined that a material conflict does exist, the investment adviser will seek instruction on how to vote from the Special Committee.
Information on how the Fund voted proxies relating to portfolio securities during the most recent 12 month period ended June 30 is available (1) without charge, upon request, by calling 1-800-262-1122, and (2) on the Securities and Exchange Commission’s website at http://www.sec.gov.
Item 8. Portfolio Managers of Closed-End Management Investment Companies
Eaton Vance Management (“EVM” or “Eaton Vance”) is the investment adviser of the Trust. Ralph H. Hinckley, Jr. and Scott H. Page comprise the investment team responsible for the overall management of the Trust’s investments.
Mr. Hinckley is a Vice President of EVM and has been a portfolio manager of the Trust since January 2008. Mr. Page is a Vice President of EVM, has been a portfolio manager of the Trust since June 2004 and is Co-Director of EVM’s Floating Rate Loan Group. Messrs. Hinckley and Page have managed other Eaton Vance portfolios for more than five years. This information is provided as of the date of filing of this report.
The following table shows, as of the Trust’s most recent fiscal year end, the number of accounts each portfolio manager managed in each of the listed categories and the total assets (in millions of dollars) in the accounts managed within each category. The table also shows the number of accounts with respect to which the advisory fee is based on the performance of the account, if any, and the total assets (in millions of dollars) in those accounts.
| Number of All Accounts |
Total Assets of All Accounts |
Number of Accounts Paying a Performance Fee |
Total Assets of Accounts Paying a Performance Fee |
|||||||||||||
| Ralph H. Hinckley, Jr. |
||||||||||||||||
| Registered Investment Companies |
1 | $ | 896.9 | 0 | $ | 0 | ||||||||||
| Other Pooled Investment Vehicles |
2 | $ | 6,835.1 | 0 | $ | 0 | ||||||||||
| Other Accounts |
0 | $ | 0 | 0 | $ | 0 | ||||||||||
| Scott H. Page |
||||||||||||||||
| Registered Investment Companies |
13 | $ | 21,755.1 | 0 | $ | 0 | ||||||||||
| Other Pooled Investment Vehicles |
12 | $ | 9,419.6 | 1 | $ | 2.4 | ||||||||||
| Other Accounts |
8 | $ | 4,209.1 | 0 | $ | 0 | ||||||||||
The following table shows the dollar range of Trust shares beneficially owned by each portfolio manager as of the Trust’s most recent fiscal year end.
| Portfolio Manager |
Dollar Range of Equity Securities Beneficially Owned in the Trust | |
| Ralph H. Hinckley, Jr. |
$10,001 - $50,000 | |
| Scott H. Page |
$100,001 - $500,000 |
Potential for Conflicts of Interest. It is possible that conflicts of interest may arise in connection with a portfolio manager’s management of the Trust’s investments on the one hand and investments of other accounts for which a portfolio manager is responsible on the other. For example, a portfolio manager may have conflicts of interest in allocating management time, resources and investment opportunities among the Trust and other accounts he or she advises. In addition, due to differences in the investment strategies or restrictions between
the Trust and the other accounts, a portfolio manager may take action with respect to another account that differs from the action taken with respect to the Trust. In some cases, another account managed by a portfolio manager may compensate the investment adviser based on the performance of the securities held by that account. The existence of such a performance based fee may create additional conflicts of interest for a portfolio manager in the allocation of management time, resources and investment opportunities. Whenever conflicts of interest arise, a portfolio manager will endeavor to exercise his or her discretion in a manner that he or she believes is equitable to all interested persons. EVM has adopted several policies and procedures designed to address these potential conflicts including a code of ethics and policies which govern the investment adviser’s trading practices, including among other things the aggregation and allocation of trades among clients, brokerage allocation, cross trades and best execution.
Compensation Structure for EVM
Compensation of EVM’s portfolio managers and other investment professionals has three primary components: (1) a base salary, (2) an annual cash bonus, and (3) annual stock-based compensation consisting of options to purchase shares of Eaton Vance Corp.’s (“EVC’s”) nonvoting common stock and restricted shares of EVC’s nonvoting common stock. EVM’s investment professionals also receive certain retirement, insurance and other benefits that are broadly available to EVM’s employees. Compensation of EVM’s investment professionals is reviewed primarily on an annual basis. Cash bonuses, stock-based compensation awards, and adjustments in base salary are typically paid or put into effect at or shortly after the October 31st fiscal year end of EVC.
Method to Determine Compensation. EVM compensates its portfolio managers based primarily on the scale and complexity of their portfolio responsibilities and the total return performance of managed funds and accounts versus the benchmark(s) stated in the prospectus, as well as an appropriate peer group (as described below). In addition to rankings within peer groups of funds on the basis of absolute performance, consideration may also be given to relative risk-adjusted performance. Risk-adjusted performance measures include, but are not limited to, the Sharpe ratio (Sharpe ratio uses standard deviation and excess return to determine reward per unit of risk). Performance is normally based on periods ending on the September 30th preceding fiscal year end. Fund performance is normally evaluated primarily versus peer groups of funds as determined by Lipper Inc. and/or Morningstar, Inc. When a fund’s peer group as determined by Lipper or Morningstar is deemed by EVM’s management not to provide a fair comparison, performance may instead be evaluated primarily against a custom peer group or market index. In evaluating the performance of a fund and its manager, primary emphasis is normally placed on three-year performance, with secondary consideration of performance over longer and shorter periods. A portion of the compensation payable to equity portfolio managers and investment professionals will be determined based on the ability of one or more accounts managed by such manager to achieve a specified target average annual gross return over a three year period in excess of the account benchmark. The cash bonus to be payable at the end of the three year term will be established at the inception of the term and will be adjusted positively or negatively to the extent that the average annual gross return varies from the specified target return. For funds that are tax-managed or otherwise have an objective of after-tax returns, performance is measured net of taxes. For other funds, performance is evaluated on a pre-tax basis. For funds with an investment objective other than total return (such as current income), consideration will also be given to the fund’s success in achieving its objective. For managers responsible for multiple funds and accounts, investment performance is evaluated on an aggregate basis, based on averages or weighted averages among managed funds and accounts. Funds and accounts that have performance-based advisory fees are not accorded disproportionate weightings in measuring aggregate portfolio manager performance.
The compensation of portfolio managers with other job responsibilities (such as heading an investment group or providing analytical support to other portfolios) will include consideration of the scope of such responsibilities and the managers’ performance in meeting them.
EVM seeks to compensate portfolio managers commensurate with their responsibilities and performance, and competitive with other firms within the investment management industry. EVM participates in investment-industry
compensation surveys and utilizes survey data as a factor in determining salary, bonus and stock-based compensation levels for portfolio managers and other investment professionals. Salaries, bonuses and stock-based compensation are also influenced by the operating performance of EVM and its parent company. The overall annual cash bonus pool is generally based on a substantially fixed percentage of pre-bonus adjusted operating income. While the salaries of EVM’s portfolio managers are comparatively fixed, cash bonuses and stock-based compensation may fluctuate significantly from year to year, based on changes in manager performance and other factors as described herein. For a high performing portfolio manager, cash bonuses and stock-based compensation may represent a substantial portion of total compensation.
Item 9. Purchases of Equity Securities by Closed-End Management Investment Company and Affiliated Purchasers
No such purchases this period.
Item 10. Submission of Matters to a Vote of Security Holders
No material changes.
Item 11. Controls and Procedures
(a) It is the conclusion of the registrant’s principal executive officer and principal financial officer that the effectiveness of the registrant’s current disclosure controls and procedures (such disclosure controls and procedures having been evaluated within 90 days of the date of this filing) provide reasonable assurance that the information required to be disclosed by the registrant has been recorded, processed, summarized and reported within the time period specified in the Commission’s rules and forms and that the information required to be disclosed by the registrant has been accumulated and communicated to the registrant’s principal executive officer and principal financial officer in order to allow timely decisions regarding required disclosure.
(b) There have been no changes in the registrant’s internal controls over financial reporting during the second fiscal quarter of the period covered by this report that has materially affected, or is reasonably likely to materially affect, the registrant’s internal control over financial reporting.
Item 12. Exhibits
| (a)(1) |
Registrant’s Code of Ethics – Not applicable (please see Item 2). | |
| (a)(2)(i) |
Treasurer’s Section 302 certification. | |
| (a)(2)(ii) |
President’s Section 302 certification. | |
| (b) |
Combined Section 906 certification. | |
Signatures
Pursuant to the requirements of the Securities Exchange Act of 1934 and the Investment Company Act of 1940, the registrant has duly caused this report to be signed on its behalf by the undersigned, thereunto duly authorized.
Eaton Vance Floating-Rate Income Trust
| By: | /s/ Scott H. Page | |
| Scott H. Page | ||
| President | ||
| Date: | July 18, 2016 | |
Pursuant to the requirements of the Securities Exchange Act of 1934 and the Investment Company Act of 1940, this report has been signed below by the following persons on behalf of the registrant and in the capacities and on the dates indicated.
| By: | /s/ James F. Kirchner | |
| James F. Kirchner | ||
| Treasurer | ||
| Date: | July 18, 2016 | |
| By: | /s/ Scott H. Page | |
| Scott H. Page | ||
| President | ||
| Date: | July 18, 2016 | |
Eaton Vance Floating-Rate Income Trust
FORM N-CSR
Exhibit 12(a)(2)(i)
CERTIFICATION
I, James F. Kirchner, certify that:
1. I have reviewed this report on Form N-CSR of Eaton Vance Floating-Rate Income Trust;
2. Based on my knowledge, this report does not contain any untrue statement of a material fact or omit to state a material fact necessary to make the statements made, in light of the circumstances under which such statements were made, not misleading with respect to the period covered by this report;
3. Based on my knowledge, the financial statements, and other financial information included in this report, fairly present in all material respects the financial condition, results of operations, changes in net assets, and cash flows (if the financial statements are required to include a statement of cash flows) of the registrant as of, and for, the periods presented in this report;
4. The registrant’s other certifying officer(s) and I are responsible for establishing and maintaining disclosure controls and procedures (as defined in Rule 30a-3(c) under the Investment Company Act of 1940) and internal control over financial reporting (as defined in Rule 30a-3(d) under the Investment Company Act of 1940) for the registrant and have:
(a) Designed such disclosure controls and procedures, or caused such disclosure controls and procedures to be designed under our supervision, to ensure that material information relating to the registrant, including its consolidated subsidiaries, is made known to us by others within those entities, particularly during the period in which this report is being prepared;
(b) Designed such internal control over financial reporting, or caused such internal control over financial reporting to be designed under our supervision, to provide reasonable assurance regarding the reliability of financial reporting and the preparation of financial statements for external purposes in accordance with generally accepted accounting principles;
(c) Evaluated the effectiveness of the registrant’s disclosure controls and procedures and presented in this report our conclusions about the effectiveness of the disclosure controls and procedures, as of a date within 90 days prior to the filing date of this report based on such evaluation; and
(d) Disclosed in this report any change in the registrant’s internal control over financial reporting that occurred during the second fiscal quarter of the period covered by this report that has materially affected, or is reasonably likely to materially affect, the registrant’s internal control over financial reporting; and
5. The registrant’s other certifying officer(s) and I have disclosed to the registrant’s auditors and the audit committee of the registrant’s board of directors (or persons performing the equivalent functions):
(a) All significant deficiencies and material weaknesses in the design or operation of internal control over financial reporting which are reasonably likely to adversely affect the registrant’s ability to record, process, summarize, and report financial information; and
(b) Any fraud, whether or not material, that involves management or other employees who have a significant role in the registrant’s internal control over financial reporting.
| Date: July 18, 2016 | /s/ James F. Kirchner | |||||
| James F. Kirchner | ||||||
| Treasurer |
Eaton Vance Floating-Rate Income Trust
FORM N-CSR
Exhibit 12(a)(2)(ii)
CERTIFICATION
I, Scott H. Page, certify that:
1. I have reviewed this report on Form N-CSR of Eaton Vance Floating-Rate Income Trust;
2. Based on my knowledge, this report does not contain any untrue statement of a material fact or omit to state a material fact necessary to make the statements made, in light of the circumstances under which such statements were made, not misleading with respect to the period covered by this report;
3. Based on my knowledge, the financial statements, and other financial information included in this report, fairly present in all material respects the financial condition, results of operations, changes in net assets, and cash flows (if the financial statements are required to include a statement of cash flows) of the registrant as of, and for, the periods presented in this report;
4. The registrant’s other certifying officer(s) and I are responsible for establishing and maintaining disclosure controls and procedures (as defined in Rule 30a-3(c) under the Investment Company Act of 1940) and internal control over financial reporting (as defined in Rule 30a-3(d) under the Investment Company Act of 1940) for the registrant and have:
(a) Designed such disclosure controls and procedures, or caused such disclosure controls and procedures to be designed under our supervision, to ensure that material information relating to the registrant, including its consolidated subsidiaries, is made known to us by others within those entities, particularly during the period in which this report is being prepared;
(b) Designed such internal control over financial reporting, or caused such internal control over financial reporting to be designed under our supervision, to provide reasonable assurance regarding the reliability of financial reporting and the preparation of financial statements for external purposes in accordance with generally accepted accounting principles;
(c) Evaluated the effectiveness of the registrant’s disclosure controls and procedures and presented in this report our conclusions about the effectiveness of the disclosure controls and procedures, as of a date within 90 days prior to the filing date of this report based on such evaluation; and
(d) Disclosed in this report any change in the registrant’s internal control over financial reporting that occurred during the second fiscal quarter of the period covered by this report that has materially affected, or is reasonably likely to materially affect, the registrant’s internal control over financial reporting; and
5. The registrant’s other certifying officer(s) and I have disclosed to the registrant’s auditors and the audit committee of the registrant’s board of directors (or persons performing the equivalent functions):
(a) All significant deficiencies and material weaknesses in the design or operation of internal control over financial reporting which are reasonably likely to adversely affect the registrant’s ability to record, process, summarize, and report financial information; and
(b) Any fraud, whether or not material, that involves management or other employees who have a significant role in the registrant’s internal control over financial reporting.
| Date: July 18, 2016 | /s/ Scott H. Page | |||||
| Scott H. Page | ||||||
| President |
Form N-CSR Item 12(b) Exhibit
CERTIFICATION PURSUANT TO
18 U.S.C. SECTION 1350,
AS ADOPTED PURSUANT TO
SECTION 906 OF THE SARBANES-OXLEY ACT OF 2002
The undersigned hereby certify in their capacity as Treasurer and President, respectively, of Eaton Vance Floating-Rate Income Trust (the “Trust”), that:
| (a) | The Annual Report of the Trust on Form N-CSR for the period ended May 31, 2016 (the “Report”) fully complies with the requirements of Section 13(a) or 15(d) of the Securities Exchange Act of 1934, as amended; and |
| (b) | The information contained in the Report fairly presents, in all material respects, the financial condition and the results of operations of the Trust for such period. |
A signed original of this written statement required by section 906 has been provided to the Trust and will be retained by the Trust and furnished to the Securities and Exchange Commission or its staff upon request.
Eaton Vance Floating-Rate Income Trust
| Date: July 18, 2016 |
| /s/ James F. Kirchner |
| James F. Kirchner |
| Treasurer |
| Date: July 18, 2016 |
| /s/ Scott H. Page |
| Scott H. Page |
| President |
Serious News for Serious Traders! Try StreetInsider.com Premium Free!
You May Also Be Interested In
- Practising Law Institute Holds Elections for Board of Trustees at Annual Meeting
- Snowflake Launches Arctic: The Most Open, Enterprise-Grade Large Language Model
- Gale Digital Scholar Lab Expands to Help Students Present and Share Digital Humanities Research
Create E-mail Alert Related Categories
SEC FilingsSign up for StreetInsider Free!
Receive full access to all new and archived articles, unlimited portfolio tracking, e-mail alerts, custom newswires and RSS feeds - and more!
