

Form 8-K Third Point Reinsurance For: Mar 02
 Tweet
Tweet Share
Share
UNITED STATES
SECURITIES AND EXCHANGE COMMISSION
WASHINGTON, D.C. 20549
FORM 8-K
CURRENT REPORT
Pursuant to Section 13 or 15(d)
of the Securities Exchange Act of 1934
Date of Report (Date of Earliest Event Reported): March 2, 2015 (March 2, 2015)
THIRD POINT REINSURANCE LTD.
(Exact name of registrant as specified in its charter)
| Bermuda | 001-36052 | 98-1039994 | ||
| (State or other jurisdiction of incorporation) |
(Commission File Number) |
(I.R.S. Employer Identification No.) |
The Waterfront, Chesney House
96 Pitts Bay Road
Pembroke HM 08 Bermuda
(Address of principal executive offices and Zip Code)
Registrant’s telephone number, including area code: +1 441 542-3300
Not Applicable
(Former name or former address, if changed since last report)
Check the appropriate box below if the Form 8-K filing is intended to simultaneously satisfy the filing obligation of the registrant under any of the following provisions:
| ¨ | Written communications pursuant to Rule 425 under the Securities Act (17 CFR 230.425) |
| ¨ | Soliciting material pursuant to Rule 14a-12 under the Exchange Act (17 CFR 240.14a-12) |
| ¨ | Pre-commencement communications pursuant to Rule 14d-2(b) under the Exchange Act (17 CFR 240.14d-2(b)) |
| ¨ | Pre-commencement communications pursuant to Rule 13e-4(c) under the Exchange Act (17 CFR 240.13e-4(c)) |
| Item 7.01 | Regulation FD Disclosure. |
Third Point Reinsurance Ltd. is hereby disclosing the information set forth in Exhibit 99.1 hereto, which is incorporated herein by reference. The information hereunder is not deemed to be “filed” for purposes of Section 18 of the Securities Exchange Act of 1934, is not otherwise subject to the liabilities of that section and is not incorporated by reference into any filing under the Securities Act of 1933 or the Securities Exchange Act of 1934, except as shall be expressly set forth by specific reference in such a filing.
| Item 9.01 | Financial Statements and Exhibits. |
(d) Exhibits
| Exhibit No. |
Description | |
| 99.1 | Regulation FD Information. | |
SIGNATURE
Pursuant to the requirements of the Securities Exchange Act of 1934, the registrant has duly caused this report to be signed on its behalf by the undersigned hereunto duly authorized.
| Date: March 2, 2015 | /s/ Tonya L. Marshall |
|||||
| Name: | Tonya L. Marshall | |||||
| Title: | Executive Vice President, General Counsel and Secretary | |||||
EXHIBIT INDEX
| Exhibit No. |
Description | |
| 99.1 | Regulation FD Information. | |
 Investor Presentation
MARCH 2015
Exhibit 99.1 |
 For
Information Purposes Only CAUTIONARY STATEMENT REGARDING FORWARD-
LOOKING STATEMENTS
2
Certain statements and information in this presentation may constitute forward-looking statements
within the meaning of the Private Securities Litigation Reform Act of 1995. The words “believe,” “anticipate,” “plan,” “intend,” “foresee,” “guidance,” “potential,” “expect,” “should,” “will”
“continue,” “could,” “estimate,” “forecast,” “goal,”
“may,” “objective,” “predict,” “projection,” or similar expressions are intended to identify forward-
looking statements (including those contained in certain visual depictions) in this
presentation. These forward-looking statements reflect the Company’s current
expectations and/or beliefs concerning future events. The Company has made every reasonable effort to ensure that the
information, estimates, forecasts and assumptions on which these statements are based are current,
reasonable and complete. However, these forward-looking statements are subject to a
number of risks and uncertainties that may cause the Company’s actual performance to differ
materially from that projected in such statements. Although it is not possible to identify all
of these risks and factors, they include, among others, the following: (i) limited historical
information about the Company; (ii) operational structure currently is being developed; (iii) fluctuation in results of
operations; (iv) more established competitors; (v) losses exceeding reserves; (vi) downgrades or
withdrawal of ratings by rating agencies; (vii) dependence on key executives; (viii) dependence
on letter of credit facilities that may not be available on commercially acceptable terms; (ix)
potential inability to pay dividends; (x) inability to service indebtedness; (xi) limited cash flow
and liquidity due to indebtedness; (xii) unavailability of capital in the future; (xiii)
fluctuations in market price of the Company’s common shares; (xiv) dependence on clients' evaluations of risks
associated with such clients' insurance underwriting; (xv) suspension or revocation of reinsurance
license; (xvi) potentially being deemed an investment company under United States federal
securities law; (xvii) potential characterization of Third Point Re and/or Third Point Reinsurance
Company Ltd. as a PFIC; (xviii) dependence on Third Point LLC to implement the Company's investment
strategy; (xix) termination by Third Point LLC of the investment management agreements; (xx)
risks associated with the Company's investment strategy being greater than those faced by
competitors; (xxi) increased regulation or scrutiny of alternative investment advisors affecting the
Company's reputation; (xxii) the Company potentially becoming subject to United States federal
income taxation; (xxiii) the Company potentially becoming subject to United States withholding
and information reporting requirements under the FATCA provisions; and (xxiv) other risks and factors listed under “Risk Factors” in
the Company’s Annual Report on Form 10-K for the fiscal year ended December 31, 2014 and
other periodic and current disclosures filed with the U.S. Securities and Exchange Commission.
All forward-looking statements speak only as of the date made and the Company undertakes no
obligation to update or revise publicly any forward-looking statements, whether as a result of new
information, future events or otherwise. This presentation may also contain non-GAAP financial information. The Company’s
management uses this information in its internal analysis of results and believes that this
information may be informative to investors in gauging the quality of the Company’s financial performance, identifying
trends in our results and providing meaningful period-to-period comparisons. For
additional information regarding these non-GAAP measures, including any required
reconciliations to the most directly comparable financial measure calculated according to GAAP, see in the Appendix
section of this presentation.
|
 For
Information Purposes Only OUR COMPANY
•
Specialty property & casualty reinsurer based in Bermuda
•
A-
(Excellent) financial strength rating from A.M. Best Company
•
Began operations in January 2012 and completed IPO in August 2013
•
Investment portfolio managed by Third Point LLC
•
Total return focused
–
Flexible and opportunistic reinsurance underwriting
–
Superior investment management
3 |
 For
Information Purposes Only KEY METRICS
4
12 Months Ended
December 31, 2014
12 Months Ended
December 31, 2013
12 Months Ended
December 31, 2012
Diluted Book Value Per Share
$13.55
$13.12
$10.89
Shareholders’
Equity
$1.45 billion
$1.39 billion
$869 million
Return on Beginning
Shareholders’
Equity*
3.6%
23.4%
13.0%
Growth in Diluted Book Value
Per Share*
3.3%
20.5%
11.9%
Cumulative Growth in Diluted
Book Value Per Share from
December
31,
2011*
1
39.2%
34.8%
11.9%
1
Diluted Book Value Per Share as of December 31, 2011 = $9.73
* Non-GAAP measure; please see descriptions and reconciliations on slides 29
and 30 |
 TOTAL
RETURN BUSINESS MODEL DESIGNED TO DELIVER SUPERIOR RETURNS
5
Exceptional Resources
Optimal Deployment
Outstanding Results
+
=
Experienced
Underwriting
Team
Superior
Investment
Management
Stable Capital
Base
Underwriting
Profit
Investment
Return on Float
Investment Return
on Capital
Opportunity for
Attractive Equity
Returns to
Shareholders
Over Time
For Information Purposes Only |
 For
Information Purposes Only EXPERIENCED SENIOR MANAGEMENT TEAM
6
CEO
Experience
John Berger
Chairman & CEO
•
Strong business relationships
•
Expertise in writing all lines of
property, casualty & specialty
reinsurance
•
Track record of capitalizing
on market opportunities and
producing strong underwriting
results
•
Significant business-building
experience
•
CEO, Reinsurance, Vice Chairman of the Board,
Alterra Capital Holdings Limited
•
CEO & President, Harbor Point Re Limited
•
CEO & President, Chubb Re, Inc.
•
President, F&G Re
•
CEO, Aon Benfield Securities
•
President, Aon Benfield Americas
•
CEO, Benfield U.S. Inc. & CEO, Benfield
Advisory
•
Board Member, Benfield Group PLC
•
President & CEO, JRG Reinsurance Company
•
CUO & Head of Reins. Operations, Endurance
Reinsurance Corporation of America
•
EVP & CUO, AXA Corporate Solutions
Reinsurance Company
•
EVP, Co-Head of Specialty Lines, Aon Benfield
•
President & CEO, Stockton Reinsurance Ltd.
•
President, Center Re Bermuda
Robert Bredahl
President & COO
Tony Urban
EVP Underwriting
Dan Malloy
EVP Underwriting |
 For
Information Purposes Only ORGANIZATIONAL STRUCTURE
7
Third Point Reinsurance Ltd.
(Holding Company)
Third Point Reinsurance
Company Ltd.
(Class 4 Insurer)
Third Point Reinsurance
Investment Management Ltd.
(Investment Manager)
Third Point Reinsurance
Opportunities Fund Ltd.
(Fund)
Third Point Re
Marketing (UK) Ltd.
(Marketing Company)
100%
100%
100% Common Shares
(Management Voting Non
Participating)
100%
53% of Common Shares
(Non Voting Participating)
Third Point Re Cat Ltd.
(Special Purpose Insurer)
100% Common Shares (Voting
Non Participating) & 100% Preferred
Shares (Non Voting Participating)
Third Point Re (UK)
Holdings Ltd.
(Intermediate Holding Company)
100%
Third Point Re (USA)
Holdings Inc.
(Intermediate Holding Company)
Third Point Reinsurance
(USA) Ltd.
(Class 4 Insurer)
100%
100% |
 For
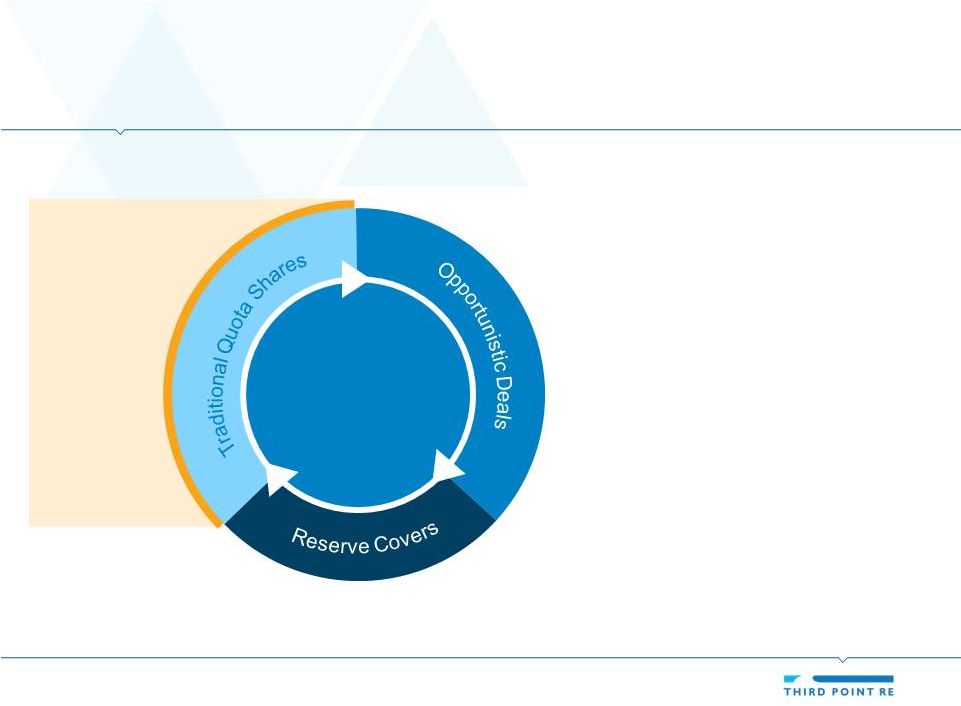
Information Purposes Only FLEXIBLE & OPPORTUNISTIC UNDERWRITING
STRATEGY 8
•
Our total return model provides
crucial flexibility in today’s
market environment
•
We leverage strong relationships
to access attractive opportunities
•
We are the lead underwriter on
most of our transactions
•
Limited property cat exposure on
rated balance sheet
For Information Purposes Only
Target Best
Opportunities |
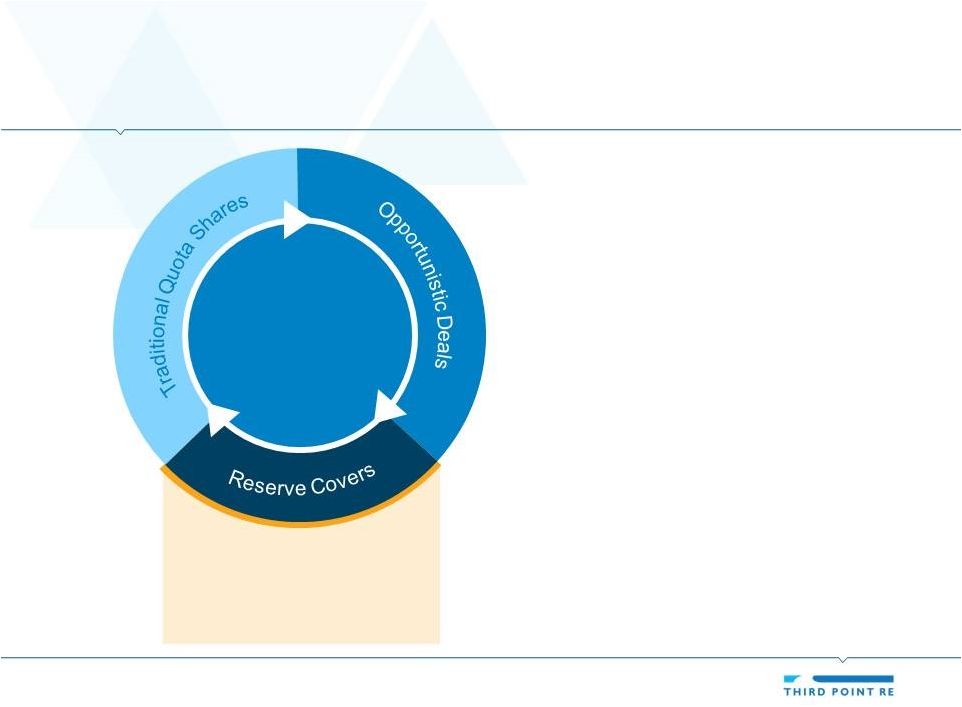
 For
Information Purposes Only TRADITIONAL QUOTA SHARES
9
•
We focus on lines of business
with lower volatility
•
We provide reinsurance
support to small and medium
size insurers seeking surplus
relief
•
These transactions are
typically relationship-driven,
since reinsurance plays such
a key role in the client’s
capital structure
•
Non-standard auto
•
Ex-wind homeowners
•
General liability
Target Best
Opportunities |
 For
Information Purposes Only OPPORTUNISTIC DEALS
10
•
Our relationships allow us to
often be the first call for
many special situations
•
We look for dislocated
markets and distressed
situations where higher risk-
adjusted returns are
available
•
We manage our downside
exposure with structural
features and contract terms
& conditions
•
Regional workers’
compensation
•
Financial lines
•
Distressed situations
Target Best
Opportunities |
 For
Information Purposes Only RESERVE COVERS
11
•
Reserve covers provide clients
with reinsurance protection,
capital relief and potentially
enhanced investment returns
•
Relationships are key –
decision-maker is typically the
client’s CEO or CFO
•
Our team has a reputation for
sophisticated structuring to meet
each client’s specific needs
•
Bermuda reinsurers
•
Lloyds Syndicates
•
US Insurers
•
Captives
Target Best
Opportunities |
 DIVERSIFIED PREMIUM BASE
12
Traditional
Quota Shares
(49)
Reserve
Covers (7)
Opportunistic
Deals (44)
Property QS
(23)
Auto (24)
Workers
Comp (16)
Multi-Line
(22)
Agriculture (6)
Financial
Lines (4)
General
Liability (5)
Gross
Premium
Written
Since
Inception
1
by
Type of Transaction
(Percent)
Gross
Premium
Written
Since
Inception
1
by
Line of Business
(Percent)
1
As of 12/31/14
Note: All figures are for P&C Segment only
For Information Purposes Only |
 For
Information Purposes Only REINSURANCE RISK MANAGEMENT
13
•
Reinsurance business plan complements our investment management
strategy: no property catastrophe excess treaties on rated balance sheet and
premium and reserve leverage lower than peer group
•
Company-wide focus on risk management
•
Robust underwriting and operational controls
Risk
Management
Culture
Holistic Risk
Control
Framework
•
Measure use of risk capital using internally-developed capital model, AM
Best BCAR model and Bermuda Monetary Authority BSCR model
•
Developed a comprehensive Risk Register that is appropriate for our business
model
•
Instituted a Risk Appetite Statement that governs overall sensitivities in
underwriting, investment, and enterprise portfolio
Ongoing
Risk
Oversight
•
Own Risk Self Assessment (ORSA) report produced quarterly and provided to
management / Board of Directors
•
Provides management with meaningful statistics on our current capital
requirement and comparisons to our risk appetite statement
•
Growing in scope |
 For
Information Purposes Only REINSURANCE RISK MANAGEMENT (CONT’D)
14
•
Low premium leverage and
asset leverage compared to
peer group
•
Limited legacy reserves
mitigate the risk of adverse
reserve development
•
Catastrophe risk is largely
limited to our $59.5 million
investment in our catastrophe
fund
1
Bermuda Reinsurer Leverage Metrics
(Percent)
Premium to Equity
TPRE
Source:
Dowling
&
Co;
As
of
12/31/2014;
“Premium
to
Equity”
=
Trailing
12
months’
net
premium
written
divided
by
shareholders’
equity;
“Invested
Assets
to
Equity”
=
Invested
assets
and
cash
divided
by
shareholders’
equity;
Peer
group = ACGL, AGII, AWH, AXS, PTP, RE, XL, AHL, ENH, GLRE, MRH, PRE, RNR, VR
1
As of December 31, 2014; In January 2015, we received $21.1 million from a partial
redemption of our investment 100
150
200
250
300
350
20
40
60
80
100 |
 For
Information Purposes Only REINSURANCE OPERATIONS
15
•
Strong pipeline
•
Combined ratio trending lower as we gain scale
•
Continue to expand our underwriting platform
U.K. marketing office
Physical presence in the U.S.
Opportunistically hire experienced underwriters |
 For
Information Purposes Only NEW U.S. PLATFORM
•
U.S. onshore presence a key component of overall growth strategy
–
Strengthen relationships with U.S. cedents and brokers
–
Develop first-hand knowledge of cedent underwriting and
claims capabilities
•
Structure optimized for our investment strategy: Third Point
Reinsurance (USA) Ltd. is a Bermuda-domiciled reinsurer that will
apply for a 953D U.S. federal tax election
–
Assets can be invested in a separate account managed by
Third Point LLC
–
U.S. activity is permitted, including a new office in New Jersey
•
Strong financial support from Third Point Re group
–
Senior unsecured notes benefit from a full guarantee from
Third Point Reinsurance Ltd.
–
75% quota share with Third Point Reinsurance Company Ltd.
–
Net worth maintenance agreement with Third Point
Reinsurance Ltd. ($250m minimum surplus)
16
Thomas Wafer
•
Chairman Reinsurance, Alterra Capital
•
CEO Reinsurance, Alterra Capital & President,
Alterra Re USA
•
President, Harbor Point Re U.S.
•
MD International Underwriting, Harbor Point Re
•
MD International Underwriting, Chubb Re
Jonathan Norton
•
Chief Actuary, Alterra Re USA
•
Chief Actuary, Harbor Point Re
•
Chief Actuary, Chubb Re
•
Managing Director, Guy Carpenter
New Hires to Help Establish & Manage
U.S. Operations |
 MARKET-LEADING INVESTMENT MANAGEMENT
17
•
Third Point LLC owned and
led by Daniel S. Loeb
•
20.6% net annualized
returns since inception in
1995
5
•
Risk-adjusted returns driven
by superior security
selection and lower volatility
Illustrative
Net
Return
1
Since
Inception
2,3,4
($ Thousands)
Third Point Partners LP
HFRI Event-Driven (Total) Index
DJ CS HFI Event Driven Index
S&P 500 (TR)
For Information Purposes Only
1
For Third Point Partners L.P. after fees, expenses and incentive allocation; 2 Past performance is not
necessarily indicative of future results; all investments involve risk including the loss of principal; 3 The historical performance of Third Point Partners L.P. (i) for the years 2001 through Dec
31, 2014 reflects the total return after incentive allocation for each such year as included in the
audited statement of financial condition of Third Point Partners L.P. for those years and (ii) for the years 1995 through 2000 reflects the total return after incentive allocation for each such year as
reported by Third Point Partners L.P. Total return after incentive allocation for the years 2001
through Dec 31, 2014 is based on the net asset value for all limited partners of Third Point Partners L.P. taken as a whole, some of whom pay no incentive allocation or management fees, whereas
total return after incentive allocation for the years 1995 through 2000 is based on the net asset value
for only those limited partners of Third Point Partners L.P. that paid incentive allocation and management fees. In each case, results are presented net of management fees, brokerage
commissions, administrative expenses, and accrued performance allocation, if any, and include the
reinvestment of all dividends, interest, and capital gains; 4 The illustrative return is calculated as a theoretical investment of $1,000 in Third Point Partners, L.P. at inception relative to the same
theoretical investment in two hedge fund indices designed to track performance of certain
“event-driven” hedge funds over the same period of time. All references to the Dow Jones Credit Suisse HFI Event Driven Index (“DJ-CS HFI”) and HFRI Event-Driven Total Index (“HFRI”) reflect
performance calculated through Dec 31, 2014. The DJ-CS HFI is an asset-weighted index and
includes only funds, as opposed to separate accounts. The DJ-CS HFI uses the Dow Jones Credit Suisse database and consists only of event driven funds deemed to be “event-driven” by the index
and that have a minimum of $50 million in assets under management, a minimum of a 12-month track
record, and audited financial statements. The HFRI consists only of event driven funds with a minimum of $50 million in assets under management or a minimum of a 12-month track record.
Both indices state that returns are reported net of all fees and expenses. While Third Point Partners
L.P. has been compared here with the performance of well-known and widely recognized indices, the indices have not been selected to represent an appropriate benchmark for Third Point
Partners L.P., whose holdings, performance and volatility may differ significantly from the securities
that comprise the indices; 5 From formation of Third Point Partners L.P. in June 1995 through Dec 31, 2014. |
 For
Information Purposes Only RELATIONSHIP WITH THIRD POINT LLC
18
•
Exclusive relationship through 2016, followed by successive 3-year terms on
renewal
•
Investments are managed on substantially the same basis as the main Third
Point LLC hedge funds
•
We pay the standard 2% management fee and 20% performance allocation.
The performance allocation is subject to a standard high water mark
Investment
Management
Agreement
Risk
Management
•
Restrictions on leverage, position concentrations and illiquid, private
investments
•
Key man and performance termination provisions
•
Allowed to diversify portfolio to address concerns of A.M. Best or regulator
Liquidity
•
of investment portfolio to provide liquidity for claims and expenses
•
More than 95% of investments are within FAS 157 Levels 1 & 2
1
•
Separate account may be used at any time to pay claims and expenses
1
As of December 31, 2014
Investments are held in a separate account – Third Point Re has full ownership |
 THIRD POINT LLC PORTFOLIO RISK MANAGEMENT
19
•
Portfolio diversification across industries,
geographies, asset classes and strategies
•
Highly
liquid
portfolio
–
investment
manager
can dynamically shift exposures depending
on macro/market developments
•
Security selection with extensive diligence
process
•
Approach includes index and macro
hedging and tail risk protection
•
Institutional platform with robust investment
and operational risk management
procedures
For Information Purposes Only |
 For
Information Purposes Only STRONG CAPITAL BASE
20
1
As of 12/31/2014; Amounts for AM Best and BMA estimated by TPRE based on the most
recent models provided by these entities
2014
Capital
Requirements
1
($ Millions)
Available Capital
Required Capital
A.M.Best
BCAR
BMA Solvency
Requirement
TPRE Internal
Capital Model
0
500
1000
1500
•
Publicly-traded capital base
•
Significant capacity to support
growth
•
Unlike many other reinsurers,
our excess underwriting
capital is not a drag on ROE |
 For
Information Purposes Only STRONG PREMIUM GROWTH
21
•
Robust growth since
inception
•
Broad range of lines of
business and distribution
sources (brokers)
•
Management views the
company’s pipeline of
opportunities as strong
Total Gross Written Premium
($ Millions)
190
402
613
0
250
500
750
2012
2013
2014 |
 For
Information Purposes Only STEADY PROGRESS TOWARDS COMBINED RATIO <
100% 22
•
Combined ratio is improving
in-line with projections as
reinsurance operation gains
scale
•
We anticipate further
improvement in our
combined ratio as additional
premium is earned over the
next few quarters
•
Combined ratio for Q4 14
was 100.2%
P&C Segment Combined Ratio
(Percent)
129.7
107.5
102.2
80
100
120
140
2012
2013
2014 |
 For
Information Purposes Only SIGNIFICANT FLOAT GENERATION
23
•
Float = premium held until
claims must be paid
•
If the underlying reinsurance
risk is attractive, generating
float allows a reinsurer to
access investment “leverage”
at low or no cost
•
Certain lines of business
provide reinsurers with float
for several years
Float As A Percentage of Total Shareholders’
Equity
(Percent)
Float: 12/31/2012 = $63.9 million; 12/31/2013 = $214.9 million; 12/31/2014 =
$389.2million 6.9
14.2
25.1
0
5
10
15
20
25
30
2012
2013
2014 |
 For
Information Purposes Only ATTRACTIVE RETURNS SINCE INCEPTION
24
Return
on
Beginning
Shareholders’
Equity
1
(Percent)
•
Returns have been
attractive, even through the
start-up phase
•
We are reaching scale in
the underwriting operation
•
We believe that we are
well-positioned to out-
perform in a challenging
market environment
1
Non-GAAP measure; please see descriptions and reconciliations on slides 29 and
30 13.0
23.4
3.6
Average
= 13.3%
0
5
10
15
20
25
2012
2013
2014 |
 For
Information Purposes Only TOTAL RETURN BUSINESS MODEL DESIGNED TO DELIVER
SUPERIOR RETURNS
25
Opportunity for
Attractive Equity
Returns to
Shareholders
Over Time
Experienced
Underwriting
Team
Superior
Investment
Management
Stable Capital
Base
Underwriting
Profit
Investment
Return on Float
Investment Return
on Capital
Exceptional Resources
Optimal Deployment
Outstanding Results
+
= |
 For
Information Purposes Only 26
APPENDIX |
 For
Information Purposes Only KEY FINANCIAL HIGHLIGHTS
27
Year ended
12/31/14
Year ended
12/31/13
Year ended
12/31/12
Gross premiums written
$613,300
$401,937
$190,374
Gross premiums ceded
(150)
(9,975)
-
Net premiums earned
444,532
220,667
96,481
Net investment income¹
85,582
258,125
136,868
Total revenues
$530,114
$478,792
$233,349
Loss and loss adjustment expenses incurred, net
283,147
139,812
80,306
Acquisition costs, net
137,206
67,944
24,604
General and administrative expenses
40,008
33,036
27,376
Other expenses¹
7,395
4,922
446
Total expenses
$467,756
$245,714
$132,732
Income before income tax expense
62,358
233,078
100,617
Income tax expense
(5,648)
-
-
Income including non-controlling interests
56,710
233,078
100,617
Income attributable to non-controlling interests
(6,315)
(5,767)
(1,216)
Net income
$50,395
$227,311
$99,401
Year ended
12/31/14
Year ended
12/31/13
Year ended
12/31/12
Loss ratio
3
65.5%
65.7%
83.2%
Acquisition cost ratio
4
31.5%
31.5%
25.5%
General and administrative expense ratio
5
5.2%
10.3%
21.0%
Combined ratio
6
102.2%
107.5%
129.7%
Net investment return
7
5.1%
23.9%
17.7%
Consolidated Income Statement ($000s)
Selected Income Statement Ratios
2
Generated $1.206 billion of
gross premiums written from
inception to date.
Gross premium written in the
Property and Casualty Segment
increased by 106.7% in 2013
and by 52.8% in 2014.
Combined ratio continued to
improve to 100.2% in the fourth
quarter of 2014 as we gained
scale.
Strong investment returns from
investments managed by Third
Point LLC of 17.7% in 2012,
23.9% in 2013, and 5.1% in
2014.
Highlights
1 Prior to 2014, changes in estimated fair value of embedded derivatives were recorded in net
investment income. As these embedded derivatives have become more prominent, the presentation has been modified and changes in the estimated fair value of embedded derivatives
are now recorded in other expenses in the consolidated statements of income. In addition, fixed
interest crediting features on these contracts that were recorded in net investment income are now classified in other expenses in the condensed consolidated statements of income.
2 Underwriting ratios are for the property and casualty reinsurance segment only; 3 Loss ratio
is calculated by dividing loss and loss adjustment expenses incurred, net, by net premiums earned; 4 Acquisition cost ratio is calculated by dividing acquisition costs, net by net premiums
earned; 5 General and administrative expense ratio is calculated by dividing general and
administrative expenses related to underwriting activities by net premiums earned; 6 Combined ratio is calculated by dividing the sum of loss and loss adjustment expenses incurred, net,
acquisition costs, net and general and administrative expenses related to underwriting
activities by net premiums earned; 7 Net investment return represents the return on our investments managed by Third Point LLC, net of fees.
|
 For
Information Purposes Only KEY FINANCIAL HIGHLIGHTS (CONT’D)
28
As of 12/31/14
As of 12/31/13
As of 12/31/12
Total assets
$2,582,580
$2,159,890
$1,402,017
Total liabilities
1,300,532
649,494
473,696
Total shareholders’
equity
$1,552,048
$1,510,396
$928,321
Non-controlling interests
(100,135)
(118,735)
(59,777)
Shareholders' equity attributable to shareholders
$1,451,913
$1,391,661
$868,544
Year ended
12/31/14
Year ended
12/31/13
Year ended
12/31/12
Diluted book value per share*
$13.55
$13.12
$10.89
Growth in diluted book value per share*
3.3%
20.5%
11.9%
Return on beginning shareholders’
equity*
3.6%
23.4%
13.0%
Selected Balance Sheet Data ($000s)
Selected Balance Sheet Metrics
* Non-GAAP measure; please see descriptions and reconciliations on slides 29
and 30 As of 12/31/14
As of 12/31/13
As of 12/31/12
Total investments managed by Third Point LLC
$1,802,183
$1,559,442
$925,453
Investments ($000s) |
 For
Information Purposes Only
NON-GAAP MEASURES
29
As of 12/31/14
As of 12/31/13
As of 12/31/12
Basic and diluted book value per share numerator:
Total shareholders’
equity
$1,552,048
$1,510,396
$928,321
Less: Non-controlling interests
(100,135)
(118,735)
(59,777)
Shareholders’
equity attributable to shareholders
$1,451,913
$1,391,661
$868,544
Effect of dilutive warrants issued to founders and an advisor
46,512
46,512
36,480
Effect of dilutive share options issued to directors and employees
61,705
101,274
51,670
Diluted book value per share numerator
$1,560,130
$1,539,447
$956,694
Basic and diluted book value per share denominator:
Issued and outstanding shares
103,397,542
103,264,616
78,432,132
Effect of dilutive warrants issued to founders and an advisor
4,651,163
4,651,163
3,648,006
Effect of dilutive share options issued to directors and employees
6,151,903
8,784,861
5,167,045
Effect of dilutive restricted shares issued to directors and employees
922,610
657,156
619,300
Diluted book value per share denominator
115,123,218
117,357,796
87,866,483
Basic book value per share
$14.04
$13.48
$11.07
Diluted book value per share
$13.55
$13.12
$10.89
($000s, Except Share and Per Share Amounts)
Book value per share
Book value per share as used by our management is a non-GAAP measure, as it is calculated
after deducting the impact of non-controlling interests. Book value per share is
calculated by dividing shareholders’ equity attributable to shareholders, adjusted for subscriptions
receivable, by the number of issued and outstanding shares at period end. In addition, diluted
book value per share is also a non-GAAP measure and represents book value per share
combined with the impact from dilution of all in-the-money share options issued, warrants and
unvested restricted shares outstanding as of any period end. We believe that long-term
growth in diluted book value per share is the most important measure of our financial
performance because it allows our management and investors to track over time the value created by the
retention of earnings. In addition, we believe this metric is used by investors because it
provides a basis for comparison with other companies in our industry that also report a
similar measure. The following table sets forth the computation of basic and diluted book value
per share as of December 31, 2014, December 31, 2013 and 2012: |
  For Information Purposes
Only NON-GAAP MEASURES
(CONT’D) 30
Return
on
beginning
shareholders’
equity
($000s)
Insurance float
Calculated
by
taking
the
change
in
diluted
book
value
per
share
divided
by
the
beginning
of
period
diluted
book
value
per
share.
We
believe that long-term growth in the diluted book value per share is the most important measure of
our financial performance because it allows
our
management
and
investors
to
track
over
time
the
value
created
by
the
retention
of
earnings.
In
addition,
we
believe
that
this
metric is used by investors because it provides a basis for comparison with other companies in our
industry that also report a similar measure.
December 31, 2014
December 31, 2013
December 31, 2012
Net income
50,395
$
227,311
$
99,401
$
Shareholders' equity attributable to shareholders -beginning of period
1,391,661
868,544
585,425
Subscriptions receivable
-
-
177,507
Impact of weighting related to shareholders' equity from IPO
-
104,502
-
Adjusted shareholders' equity attributable to shareholders - beginning of
period 1,391,661
$
973,046
762,932
Return on beginning shareholders' equity
3.6%
23.4%
13.0%
For the years ended
Calculated by dividing net income by the beginning shareholders’ equity attributable to
shareholders. For purposes of determining December 31, 2011 shareholders’ equity
attributable to shareholders, we add back the impact of subscriptions receivable to shareholders’ equity attributable
to shareholders. For the year ended December 31, 2013 and December 31, 2014, we have also
adjusted the beginning shareholders’ equity for the impact of the issuance of
shares in our IPO on a weighted average basis. This adjustment lowers the stated return on beginning shareholders’
equity attributable to shareholders. We believe this metric is used by investors to supplement
measures of our profitability. Growth
in diluted book value per share In an insurance or reinsurance
operation, float arises because premiums and proceeds associated with deposit accounted reinsurance contracts are
collected before losses are paid. In some instances, the interval between premium receipts and
loss payments can extend over many years. During this time interval, insurance and
reinsurance companies invest the premiums received and seek to generate investment returns. Although float can be
calculated using numbers determined under U.S. GAAP, float is a non-GAAP financial measure
and, therefore, there is no comparable U.S. GAAP measure. We believe that net
investment income generated on float is an important consideration in evaluating the overall contribution of our property
and casualty reinsurance operation to our consolidated results. It is also explicitly
considered as part of the evaluation of management’s performance for the purposes
of incentive compensation. |
Create E-mail Alert Related Categories
SEC FilingsRelated Entities
Third Point LLCSign up for StreetInsider Free!
Receive full access to all new and archived articles, unlimited portfolio tracking, e-mail alerts, custom newswires and RSS feeds - and more!
