

Form 8-K LEHMAN BROTHERS HOLDINGS For: Dec 22
 Tweet
Tweet Share
Share
UNITED STATES
SECURITIES AND EXCHANGE COMMISSION
Washington, D.C. 20549
FORM 8-K
CURRENT REPORT
Pursuant to Section 13 or 15(d)
of The Securities Exchange Act of 1934
Date of Report (Date of earliest event reported): December 22, 2015
LEHMAN BROTHERS HOLDINGS INC. PLAN TRUST
(Exact name of registrant as specified in its charter)
| Delaware | 1-9466 | 30-6315144 | ||
| (State or other jurisdiction Of incorporation) |
(Commission File Number) |
(IRS Employer Identification No.) |
1271 Avenue of the Americas
New York, New York
10020
(Address of Principal Executive Offices) (Zip Code)
Registrant’s telephone number, including area code: (646) 285-9000
Check the appropriate box below if the Form 8-K filing is intended to simultaneously satisfy the filing obligation of the registrant under any of the following provisions (see General Instruction A.2. below):
| ¨ | Written communications pursuant to Rule 425 under the Securities Act (17 CFR 230.425) |
| ¨ | Soliciting material pursuant to Rule 14a-12 under the Exchange Act (17 CFR 240.14a-12) |
| ¨ | Pre-commencement communications pursuant to Rule 14d-2(b) under the Exchange Act (17 CFR 240.14d-2(b)) |
| ¨ | Pre-commencement communications pursuant to Rule 13e-4(c) under the Exchange Act (17 CFR 240.13e-4(c)) |
ITEM 7.01 Regulation FD Disclosure.
As previously disclosed, on September 15, 2008, Lehman Brothers Holdings Inc. (“LBHI”) filed a voluntary petition for relief under Chapter 11 of the United States Code in the United States Bankruptcy Court for the Southern District of New York (the “Bankruptcy Court”). Together with the Chapter 11 cases thereafter filed by certain subsidiaries (collectively with LBHI, the “Debtors”), the cases are being jointly administered under the case caption In re Lehman Brothers Holdings Inc., et. al., Case Number 08-13555 (the “Chapter 11 Proceeding”) pursuant to Rule 1015(b) of the Federal Rules of Bankruptcy Procedure. On March 6, 2012, the Modified Third Amended Joint Chapter 11 Plan of Lehman Brothers Holdings Inc. and its Affiliated Debtors (the “Plan”) became effective.
As contemplated under the Plan, on December 22, 2015, LBHI, the Plan Administrator, filed the Quarterly Financial Report as of October 1, 2015, which includes Balance Sheets, Management’s Discussion and Analysis, Accompanying Schedules, and Post-Eighth Distribution Cash Flow Estimates (collectively, the “Quarterly Financial Report”) of LBHI and Other Debtors and Debtor-Controlled Entities (collectively, the “Company”) with the Bankruptcy Court. A copy of the court filing is attached hereto as Exhibit 99.1 to this Current Report on Form 8-K.
Limitation on Incorporation by Reference
In accordance with General Instruction B.2 of Form 8-K, the information in this Item 7.01 shall not be deemed “filed” for purposes of Section 18 of the Securities Exchange Act of 1934, as amended (the “Exchange Act”), or otherwise subject to the liabilities of that section, nor shall such information be deemed incorporated by reference in any filing under the Securities Act of 1933, as amended, except as shall be expressly set forth by specific reference in such a filing.
Cautionary Statements Regarding Financial and Operating Data
The Company cautions the reader not to place undue reliance upon the information contained in the Quarterly Financial Report, as it is not prepared for the purpose of providing the basis for an investment decision directly or indirectly relating to the Company or any of its securities. The Quarterly Financial Report is not prepared in accordance with U.S. generally accepted accounting principles, is not audited or reviewed by independent accountants, will not be subject to audit or review by external auditors at any time in the future, is in a format consistent with applicable bankruptcy laws, and is subject to future adjustments and reconciliations. There can be no assurances that the Quarterly Financial Report is accurate or complete. The Quarterly Financial Report contains a further description of limitations on the information contained therein. The Quarterly Financial Report also contains information which might not be indicative of the Company’s financial condition. Results set forth in the Quarterly Financial Report should not be viewed as indicative of future results.
Cautionary Statement Regarding Forward-Looking Statements
This Current Report on Form 8-K and Exhibit 99.1 hereto may contain forward-looking statements within the meaning of the Private Securities Litigation Reform Act of 1995 with respect to the Company’s financial condition, results of operations, and business that is not historical information. Forward-looking statements reflect the Company’s current views with respect to future events as well as various estimates, assumptions and comparisons based on available information up to the date of this report, many of which are subject to risks and uncertainties. All statements other than statements of historical fact are statements that could be deemed forward-looking statements, including all statements regarding information regarding the intent, belief or current expectation of the Company and members of
its management. The words “believe,” “expect,” “plan,” “intend,” “estimate,” or “anticipate” and similar expressions, as well as future or conditional verbs such as “will,” “should,” “would,” and “could,” often identify forward-looking statements. These statements speak only as of the date hereof and involve known and unknown risks, uncertainties and other factors, including factors which are outside the Company’s control, which may cause the Company’s actual condition, results, performance or achievements to be materially different from any future condition, results, performance or achievements expressed or implied by these forward-looking statements. Such factors include, without limitation, the potential adverse impact of the Chapter 11 Proceeding on the Company’s liquidity or results of operations. The Company undertakes no obligation to publicly update or revise any forward-looking statement, whether as a result of new information, future events, or otherwise, but reserves the right to do so. Readers of this report should not place undue reliance on these forward-looking statements.
The Company’s informational filings with the Bankruptcy Court, including the Quarterly Financial Report included in Exhibit 99.1, are available to the public at the office of the Clerk of the Bankruptcy Court, Alexander Hamilton Custom House, One Bowling Green, New York, New York 10004-1408. Such informational filings may be available electronically, for a fee, through the Bankruptcy Court’s Internet world wide web site (www.nysb.uscourts.gov), and/or free of cost, at a world wide web site maintained by the Company’s Bankruptcy Court-approved noticing agent (www.lehman-docket.com).
| ITEM 9.01 | Financial Statements and Exhibits. |
(d) Exhibits
| 99.1 | Quarterly Financial Report as of October 1, 2015, which includes Balance Sheets, Management’s Discussion and Analysis, Accompanying Schedules, and Post-Eighth Distribution Cash Flow Estimates of Lehman Brothers Holdings Inc. and Other Debtors and Debtor-Controlled Entities | |
SIGNATURES
Pursuant to the requirements of the Securities Exchange Act of 1934, as amended, Lehman Brothers Holdings Inc. Plan Trust has duly caused this report to be signed on its behalf by the undersigned hereunto duly authorized.
| LEHMAN BROTHERS HOLDINGS INC. PLAN TRUST
By Lehman Brothers Holdings Inc. as Plan Administrator
| ||||||
| Date: December 22, 2015 | By: | /s/ Michael S. Leto | ||||
| Name: | Michael S. Leto | |||||
| Title: | Chief Financial Officer and Executive Vice President | |||||
EXHIBIT INDEX
| Exhibit No. |
Description | |
| 99.1 | Quarterly Financial Report as of October 1, 2015, which includes Balance Sheets, Management’s Discussion and Analysis, Accompanying Schedules, and Post-Eighth Distribution Cash Flow Estimates of Lehman Brothers Holdings Inc. and Other Debtors and Debtor-Controlled Entities. | |
EXHIBIT 99.1
UNITED STATES BANKRUPTCY COURT
SOUTHERN DISTRICT OF NEW YORK
In re:
|
|
Chapter 11 Case No. | |
| Lehman Brothers Holdings Inc., et al., | 08-13555 | |
| Jointly Administered | ||
| Debtors. |
||
QUARTERLY FINANCIAL REPORT
AS OF OCTOBER 1, 2015
BALANCE SHEETS, MANAGEMENT’S DISCUSSION AND ANALYSIS,
ACCOMPANYING SCHEDULES,
AND POST-EIGHTH DISTRIBUTION CASH FLOW ESTIMATES
| DEBTORS’ ADDRESS: | LEHMAN BROTHERS HOLDINGS INC. | |
| c/o MICHAEL S. LETO, CHIEF FINANCIAL OFFICER | ||
| 1271 AVENUE OF THE AMERICAS | ||
| 40th FLOOR | ||
| NEW YORK, NY 10020 | ||
| DEBTORS’ ATTORNEYS: | WEIL, GOTSHAL & MANGES LLP | |
| c/o JACQUELINE MARCUS, GARRETT A. FAIL | ||
| 767 FIFTH AVENUE | ||
| NEW YORK, NY 10153 | ||
| REPORT PREPARER: | LEHMAN BROTHERS HOLDINGS INC., AS PLAN ADMINISTRATOR | |
| Date: December 22, 2015 |
Quarterly Financial Report as of October 1, 2015 (Unaudited)
Table of Contents
| I. | Schedule of Debtors | 3 | ||||
| II. | Notes to the Balance Sheets and Management’s Discussion & Analysis | 4 | ||||
| Note 1 – Basis of Presentation | 4 | |||||
| Note 2 – Use of Estimates | 5 | |||||
| Note 3 – Cash and Short-Term Investment | 5 | |||||
| Note 4 – Cash and Short-Term Investments Pledged or Restricted | 6 | |||||
| Note 5 – Financial Instruments and Other Inventory Positions | 7 | |||||
| Note 6 – Subrogated Receivables from Affiliates and Third Parties | 10 | |||||
| Note 7 – Receivables from Controlled Affiliates and Other Assets | 11 | |||||
| Note 8 – Investments in Affiliates | 13 | |||||
| Note 9 – Due from/to Affiliates | 14 | |||||
| Note 10 – Payables to Controlled Affiliates and Other Liabilities | 26 | |||||
| Note 11 – Taxes Payable | 27 | |||||
| Note 12 – Liabilities Subject to Compromise | 28 | |||||
| Note 13 – Legal Proceedings | 30 | |||||
| Note 14 – Currency Translation | 32 | |||||
| Note 15 – Financial Systems and Control Environment | 32 | |||||
| III. | Balance Sheets | 33 | ||||
| IV. | Accompanying Schedules | 36 | ||||
| V. | Post-Eighth Distribution Cash Flow Estimates | 42 | ||||
QUESTIONS
The Company has established an email address to receive questions from readers regarding this presentation and its other financial disclosures. The Company plans to review questions received, and for those subjects which the Company determines a response would not (i) violate a confidentiality provision, (ii) place the Company in a competitive or negotiation disadvantage, or (iii) be unduly burdensome relative to the value of information requested, the Company shall endeavor to post a response (maintaining the anonymity of the originators of the questions). The Company assumes no obligation to respond to email inquiries.
Please email questions, with document references as relevant, to:
The Company’s previously posted responses can be found on the Epiq website maintained for the Company:
www.lehman-docket.com under Key Documents
|
|
Page 2 |
|
Quarterly Financial Report as of October 1, 2015 (Unaudited)
I. Schedule of Debtors
The following entities (the “Debtors”) filed for bankruptcy in the United States Bankruptcy Court for the Southern District of New York (the “Bankruptcy Court”) on the dates indicated below. On December 6, 2011, the Bankruptcy Court confirmed the Modified Third Amended Joint Chapter 11 Plan of Lehman Brothers Holdings Inc. and its Affiliated Debtors (the “Plan”). On March 6, 2012, the “Effective Date” (as defined in the Plan) occurred. The Debtors’ Chapter 11 cases remain open as of the date hereof.
| Case No. | Date Filed | |||
| Lehman Brothers Holdings Inc. (“LBHI”) |
08-13555 | 9/15/2008 | ||
| LB 745 LLC |
08-13600 | 9/16/2008 | ||
| PAMI Statler Arms LLC |
08-13664 | 9/23/2008 | ||
| Lehman Brothers Commodity Services Inc. (“LBCS”) |
08-13885 | 10/3/2008 | ||
| Lehman Brothers Special Financing Inc. (“LBSF”) |
08-13888 | 10/3/2008 | ||
| Lehman Brothers OTC Derivatives Inc. (“LOTC”) |
08-13893 | 10/3/2008 | ||
| Lehman Brothers Derivative Products Inc. (“LBDP”) |
08-13899 | 10/5/2008 | ||
| Lehman Commercial Paper Inc. (“LCPI”) |
08-13900 | 10/5/2008 | ||
| Lehman Brothers Commercial Corporation (“LBCC”) |
08-13901 | 10/5/2008 | ||
| Lehman Brothers Financial Products Inc.(“LBFP”) |
08-13902 | 10/5/2008 | ||
| Lehman Scottish Finance L.P. |
08-13904 | 10/5/2008 | ||
| CES Aviation LLC |
08-13905 | 10/5/2008 | ||
| CES Aviation V LLC |
08-13906 | 10/5/2008 | ||
| CES Aviation IX LLC |
08-13907 | 10/5/2008 | ||
| East Dover Limited |
08-13908 | 10/5/2008 | ||
| Luxembourg Residential Properties Loan Finance S.a.r.l (“Lux Resi”) |
09-10108 | 1/7/2009 | ||
| BNC Mortgage LLC |
09-10137 | 1/9/2009 | ||
| LB Rose Ranch LLC |
09-10560 | 2/9/2009 | ||
| Structured Asset Securities Corporation |
09-10558 | 2/9/2009 | ||
| LB 2080 Kalakaua Owners LLC |
09-12516 | 4/23/2009 | ||
| Merit LLC (“Merit”) |
09-17331 | 12/14/2009 | ||
| LB Somerset LLC (“LBS”) |
09-17503 | 12/22/2009 | ||
| LB Preferred Somerset LLC (“LBPS”) |
09-17505 | 12/22/2009 |
|
|
Page 3 |
|
Quarterly Financial Report as of October 1, 2015 (Unaudited)
II. Notes to the Balance Sheets and Management’s Discussion & Analysis
|
|
Page 4 |
|
Quarterly Financial Report as of October 1, 2015 (Unaudited)
Note 1 – Basis of Presentation (continued)
|
|
Page 5 |
|
Quarterly Financial Report as of October 1, 2015 (Unaudited)
Note 4 – Cash and Short-Term Investments Pledged or Restricted
The following table summarizes the components of restricted cash as of October 1, 2015:
| Total Debtors and Debtor- Controlled Entities |
||||||||||||||||||||||||||||
| Debtors | Debtor- Controlled Entities |
|||||||||||||||||||||||||||
| ($ in millions) |
LBHI | LBSF | LCPI | Other | Total | |||||||||||||||||||||||
| Reserves for Claims: |
||||||||||||||||||||||||||||
| Disputed unsecured claims (1) |
$ | 1,167 | $ | 1,006 | $ | 16 | $ | 291 | $ | 2,480 | $ | — | $ | 2,480 | ||||||||||||||
| Tax claims (2) |
0 | 25 | — | 4 | 29 | — | 29 | |||||||||||||||||||||
| Distributions on Allowed Claims (not remitted) (3) |
90 | 0 | 0 | 0 | 91 | — | 91 | |||||||||||||||||||||
| Secured, Admin, Priority Claims and Other |
64 | 27 | 13 | 20 | 123 | — | 123 | |||||||||||||||||||||
|
|
|
|
|
|
|
|
|
|
|
|
|
|
|
|||||||||||||||
| Subtotal, Claims Reserves |
1,321 | 1,058 | 29 | 315 | 2,723 | — | 2,723 | |||||||||||||||||||||
| Cash pledged to JPMorgan (CDA) (4) |
76 | — | — | — | 76 | — | 76 | |||||||||||||||||||||
| Citigroup and HSBC (5) |
2,034 | — | — | — | 2,034 | — | 2,034 | |||||||||||||||||||||
| Other (6) |
179 | 1 | 0 | 25 | 205 | 77 | 282 | |||||||||||||||||||||
|
|
|
|
|
|
|
|
|
|
|
|
|
|
|
|||||||||||||||
| Total |
$ | 3,611 | $ | 1,059 | $ | 30 | $ | 339 | $ | 5,038 | $ | 77 | $ | 5,115 | ||||||||||||||
|
|
|
|
|
|
|
|
|
|
|
|
|
|
|
|||||||||||||||
| Totals may not foot due to rounding. |
||||||||||||||||||||||||||||
| (1) | Represents the cash reserve for the principal amount of disputed unsecured claims subsequent to the eighth Plan distribution on October 1, 2015. Amounts of claim reserves at LBSF and LBCC exclude amounts invested in loans to LBHI in the amount of $859 million and $125 million, respectively (refer to Note 7 – Receivables from Controlled Affiliates and Other Assets). |
| (2) | The $29 million reserved at LBSF and LBCC represents the cash reserve for non-income tax issues. |
| (3) | Includes (i) $73 million related to the Office of Foreign Asset Control (“OFAC”) and (ii) $18 million related to other open items. |
| (4) | Represents cash deposited into accounts by LBHI and pledged to JP Morgan (including its affiliates, “JPM”) pursuant to paragraph 6(b) of the Collateral Disposition Agreement (“CDA”) with JPM, effective March 31, 2010. The release of this cash is pending resolution of, among other items, certain clearance and derivative exposures. |
| (5) | Represents cash deposited prior to the Commencement Date by the Company in connection with certain requests and/or documents executed by the Company and Citigroup Inc. (“Citigroup”) ($2,007 million) and HSBC Bank PLC (“HSBC”) ($27 million). The Company has recorded reserves against this cash in Secured Claims Payable to Third Parties, because these institutions have asserted claims. The Company is in discussions with HSBC and commenced litigation against Citigroup regarding these deposits. |
| (6) | Includes: (i) $89 million related to various pre-petition balances on administrative hold by certain financial institutions, (ii) $55 million related to misdirected wires and other cash received by LBHI for the benefit of third parties and Non-Controlled Affiliates (reported as a payable), and (iii) $138 million of various miscellaneous items. |
|
|
Page 6 |
|
Quarterly Financial Report as of October 1, 2015 (Unaudited)
Note 5 – Financial Instruments and Other Inventory Positions
Financial instruments and other inventory positions are reported at estimated “recovery values,” which are determined by utilizing market prices, certain assumptions, estimates and/or pricing models to estimate future undiscounted cash flows.
The table below presents recovery values as of October 1, 2015 by asset portfolio, and the changes in recovery values since the previously filed Quarterly Financial Report as of June 30, 2015:
| (Activity 07/01/15- 10/01/15) | ||||||||||||||||||||
| $ in millions | Inventory as of June 30, 2015 |
Transfers and Reclassifications |
Recovery Value Change (1) |
Cash Activities (2) | Inventory as of October 1, 2015 |
|||||||||||||||
| Commercial Real Estate |
||||||||||||||||||||
| Debtors: |
||||||||||||||||||||
| Lehman Brothers Holdings Inc. |
$ | 60 | $ | — | $ | 1 | $ | (1 | ) | $ | 61 | |||||||||
| Lehman Commercial Paper Inc. |
232 | — | (0 | ) | (6 | ) | 225 | |||||||||||||
|
|
|
|
|
|
|
|
|
|
|
|||||||||||
| Subtotal Debtors |
292 | — | 1 | (7 | ) | 287 | ||||||||||||||
| Debtor-Controlled |
548 | — | (48 | ) | (95 | ) | 404 | |||||||||||||
|
|
|
|
|
|
|
|
|
|
|
|||||||||||
| Total Commercial Real Estate |
840 | — | (47 | ) | (102 | ) | 690 | |||||||||||||
|
|
|
|
|
|
|
|
|
|
|
|||||||||||
| Loans and Residential Real Estate |
||||||||||||||||||||
| Debtors: |
||||||||||||||||||||
| Lehman Brothers Holdings Inc. |
73 | — | (1 | ) | (5 | ) | 67 | |||||||||||||
| Lehman Brothers Special Financing Inc. |
0 | — | (0 | ) | (0 | ) | — | |||||||||||||
| Lehman Commercial Paper Inc. |
69 | — | 22 | (17 | ) | 74 | ||||||||||||||
|
|
|
|
|
|
|
|
|
|
|
|||||||||||
| Subtotal Debtors |
143 | — | 21 | (23 | ) | 140 | ||||||||||||||
| Debtor-Controlled |
43 | — | 1 | (1 | ) | 43 | ||||||||||||||
|
|
|
|
|
|
|
|
|
|
|
|||||||||||
| Total Loans and Residential Real Estate |
185 | — | 22 | (24 | ) | 183 | ||||||||||||||
|
|
|
|
|
|
|
|
|
|
|
|||||||||||
| Private Equity / Principal Investments |
||||||||||||||||||||
| Debtors: |
||||||||||||||||||||
| Lehman Brothers Holdings Inc. |
3 | — | 0 | (3 | ) | 1 | ||||||||||||||
| Lehman Commercial Paper Inc. |
36 | — | 8 | (41 | ) | 3 | ||||||||||||||
|
|
|
|
|
|
|
|
|
|
|
|||||||||||
| Subtotal Debtors |
39 | — | 8 | (44 | ) | 4 | ||||||||||||||
| Debtor-Controlled |
1,382 | — | 19 | (14 | ) | 1,387 | ||||||||||||||
|
|
|
|
|
|
|
|
|
|
|
|||||||||||
| Total Private Equity / Principal Investments |
1,422 | — | 27 | (58 | ) | 1,391 | ||||||||||||||
|
|
|
|
|
|
|
|
|
|
|
|||||||||||
| Derivative Receivables and Related Assets |
||||||||||||||||||||
| Debtors: |
||||||||||||||||||||
| Lehman Brothers Special Financing Inc. |
249 | (1 | ) | (16 | ) | (78 | ) | 154 | ||||||||||||
| Lehman Brothers Commodity Services Inc. |
0 | — | 0 | — | 0 | |||||||||||||||
| Lehman Brothers Commercial Corp. |
4 | — | — | — | 4 | |||||||||||||||
| Other Debtors |
33 | — | (0 | ) | (6 | ) | 27 | |||||||||||||
|
|
|
|
|
|
|
|
|
|
|
|||||||||||
| Subtotal Debtors |
286 | (1 | ) | (16 | ) | (84 | ) | 185 | ||||||||||||
| Debtor-Controlled |
9 | — | (0 | ) | (8 | ) | 1 | |||||||||||||
|
|
|
|
|
|
|
|
|
|
|
|||||||||||
| Total Derivative Receivables and Related Assets |
295 | (1 | ) | (16 | ) | (92 | ) | 186 | ||||||||||||
|
|
|
|
|
|
|
|
|
|
|
|||||||||||
| Totals |
$ | 2,742 | $ | (1 | ) | $ | (14 | ) | $ | (276 | ) | $ | 2,450 | |||||||
|
|
|
|
|
|
|
|
|
|
|
|||||||||||
| (1) | Represents adjustments to recovery values based on changes in market prices, assumptions and/or estimates which, in the Company’s judgment, impact the Company’s recoverable value on the underlying assets. |
| (2) | Cash activities are presented net of disbursements. Amounts may differ from previously filed Schedules of Cash Receipts and Disbursements mainly due to timing and classification differences. Cash activities related to Derivative Receivables and Related Assets include collections on open and terminated trades, net of hedging activities. |
|
|
Page 7 |
|
Quarterly Financial Report as of October 1, 2015 (Unaudited)
Note 5 – Financial Instruments and Other Inventory Positions (continued)
|
|
Page 8 |
|
Quarterly Financial Report as of October 1, 2015 (Unaudited)
Note 5 – Financial Instruments and Other Inventory Positions (continued)
|
|
Page 9 |
|
Quarterly Financial Report as of October 1, 2015 (Unaudited)
Note 5 – Financial Instruments and Other Inventory Positions (continued)
|
|
Page 10 |
|
Quarterly Financial Report as of October 1, 2015 (Unaudited)
Note 7 – Receivables from Debtors and Debtor-Controlled Entities and Other Assets
Receivables from Debtors and Debtor-Controlled Entities and Other Assets includes: (i) $3.1 billion related to certain post-petition activities between and among Debtors and Debtor-Controlled Entities, with the corresponding liabilities reflected in Payables to Debtors and Debtor-Controlled Entities and Other Liabilities, and (ii) $420 million of other assets.
The following table summarizes the main components of Receivables from Debtors and Debtor-Controlled Entities and Other Assets as of October 1, 2015:
| Total Debtors | ||||||||||||||||||||||||||||
| Debtors | Debtor- | and Debtor- | ||||||||||||||||||||||||||
| $ in millions |
LBHI | LCPI | LBSF | Other Debtors |
Total | Controlled Entities |
Controlled Entities |
|||||||||||||||||||||
| Encumbered Financial Inventory (1) |
$ | — | $ | 300 | $ | — | $ | — | $ | 300 | $ | — | $ | 300 | ||||||||||||||
| Secured Notes (2) |
— | — | 859 | 970 | 1,828 | 75 | 1,903 | |||||||||||||||||||||
| PIK Notes (3) |
4 | — | 4 | 31 | 39 | — | 39 | |||||||||||||||||||||
| Fundings and other activities (4) |
249 | 42 | 0 | 8 | 298 | 551 | 849 | |||||||||||||||||||||
|
|
|
|
|
|
|
|
|
|
|
|
|
|
|
|||||||||||||||
| Receivables from Debtors and Debtor-Controlled Entities |
253 | 342 | 863 | 1,008 | 2,466 | 626 | 3,091 | |||||||||||||||||||||
| Receivable related to Fenway (5) |
92 | — | — | — | 92 | — | 92 | |||||||||||||||||||||
| Affiliate Claims (6) |
134 | 1 | 27 | 1 | 163 | 0 | 163 | |||||||||||||||||||||
| Collateral Posted on Hedges |
134 | 5 | — | — | 139 | — | 139 | |||||||||||||||||||||
| Other |
7 | 1 | 0 | 0 | 8 | 17 | 25 | |||||||||||||||||||||
|
|
|
|
|
|
|
|
|
|
|
|
|
|
|
|||||||||||||||
| Total Other Assets |
367 | 7 | 27 | 1 | 403 | 18 | 420 | |||||||||||||||||||||
|
|
|
|
|
|
|
|
|
|
|
|
|
|
|
|||||||||||||||
| Total Receivables from Debtors and Debtor-Controlled Entities and Other Assets |
$ | 620 | $ | 349 | $ | 890 | $ | 1,010 | $ | 2,868 | $ | 643 | $ | 3,512 | ||||||||||||||
|
|
|
|
|
|
|
|
|
|
|
|
|
|
|
|||||||||||||||
| (1) | Represents Private Equity/Principal Investment assets encumbered by LB I Group Inc. for the benefit of LCPI. |
| (2) | Includes (i) loans from LOTC of $540 million, LBCC of $95 million and a Debtor-Controlled Entity of $75 million to LBHI, secured by LBHI assets; (ii) loans from LBFP to LCPI and LBSF of $200 million and $10 million, respectively, secured by LCPI and LBSF assets; and (iii) investments of $859 million and $125 million of LBSF’s and LBCC’s cash reserves for disputed claims, respectively, in secured notes issued by LBHI. |
| (3) | Represents the remaining portions of the PIK Notes, net of distributions through October 1, 2015, issued by Lehman ALI Inc. (“ALI”) to LOTC, LBSF, and LBHI. |
| (4) | Includes (i) $226 million related to promissory notes issued by LBHI to certain Debtor-Controlled Entities, of which LBHI is the ultimate economic beneficiary; (ii) $194 million primarily related to fundings (e.g. capital calls) by LBHI and cost allocations; (iii) $190 million of cash collections at LCPI for the benefit of certain Debtor-Controlled Entities, of which LCPI is the ultimate economic beneficiary; and (iv) $55 million at LBHI related to the “Modified Settlement with respect to the Variable Funding Trust” [Docket No. 19370]. |
| (5) | Represents unsecured claims asserted by LBHI against LCPI based on the Fenway transactions, as disclosed in Section 6.5(h) of the Plan, net of $138 million of payments received by LBHI as a result of Plan distributions. |
| (6) | Includes (i) $81 million of affiliate claims acquired through settlements with third parties valued at estimated recoveries, net of distributions; and (ii) $82 million from a total return swap related to future distributions on LBI claims held by LBHI; LBHI recorded an offsetting payable of $82 million in Payables to Controlled Affiliates and other liabilities. |
|
|
Page 11 |
|
Quarterly Financial Report as of October 1, 2015 (Unaudited)
Note 7 – Receivables from Debtors and Debtor-Controlled Entities and Other Assets (continued)
|
|
Page 12 |
|
Quarterly Financial Report as of October 1, 2015 (Unaudited)
Note 8 – Investments in Affiliates
|
|
Page 13 |
|
Quarterly Financial Report as of October 1, 2015 (Unaudited)
Note 9 – Due from/to Affiliates
|
|
Page 14 |
|
Quarterly Financial Report as of October 1, 2015 (Unaudited)
Note 9 – Due from/to Affiliates (continued)
| (a) | Intercompany Balances Among Debtors and Debtor-Controlled Entities |
The table below presents the Due from/to Debtors and Debtor-Controlled Entities balances as of October 1, 2015 and the related activity since the previously filed Quarterly Financial Report as of June 30, 2015:
| Activity 7/1/15 - 10/1/15 | ||||||||||||||||||||||||||||
| As of June 30, | Cash | Cash | Claim | Plan Related | Debt | As of October | ||||||||||||||||||||||
| $ in millions |
2015 | Receipts (1) | Distributions (2) | Assignments | Adjustments | Forgiveness (3) | 1, 2015 | |||||||||||||||||||||
| Due From Controlled |
||||||||||||||||||||||||||||
| Debtors: |
||||||||||||||||||||||||||||
| Lehman Brothers Holdings Inc. |
$ | 30,098 | $ | (872 | ) | $ | — | $ | 12 | $ | (2 | ) | $ | (292 | ) | $ | 28,943 | |||||||||||
| Lehman Commercial Paper Inc. |
5,108 | (87 | ) | — | — | (0 | ) | 1 | 5,022 | |||||||||||||||||||
| Lehman Brothers Special Financing Inc. |
542 | (31 | ) | — | — | (4 | ) | 0 | 508 | |||||||||||||||||||
| Other Debtors |
734 | (23 | ) | — | — | (3 | ) | (0 | ) | 708 | ||||||||||||||||||
|
|
|
|
|
|
|
|
|
|
|
|
|
|
|
|||||||||||||||
| Subtotal Debtors |
36,482 | (1,012 | ) | — | 12 | (10 | ) | (291 | ) | 35,181 | ||||||||||||||||||
| Debtor-Controlled |
4,531 | (119 | ) | — | (8 | ) | (0 | ) | (6 | ) | 4,398 | |||||||||||||||||
|
|
|
|
|
|
|
|
|
|
|
|
|
|
|
|||||||||||||||
| Total |
$ | 41,013 | $ | (1,131 | ) | $ | — | $ | 4 | $ | (10 | ) | $ | (297 | ) | $ | 39,579 | |||||||||||
|
|
|
|
|
|
|
|
|
|
|
|
|
|
|
|||||||||||||||
| Due To Controlled (4) |
||||||||||||||||||||||||||||
| Debtors: |
||||||||||||||||||||||||||||
| Lehman Brothers Holdings Inc. |
$ | 4,753 | $ | — | $ | (127 | ) | $ | (8 | ) | $ | — | $ | (4 | ) | $ | 4,615 | |||||||||||
| Lehman Commercial Paper Inc. |
4,601 | — | (458 | ) | 9 | (9 | ) | (2 | ) | 4,140 | ||||||||||||||||||
| Lehman Brothers Special Financing Inc. |
10,379 | — | (35 | ) | 3 | (1 | ) | (0 | ) | 10,346 | ||||||||||||||||||
| Other Debtors |
918 | — | (26 | ) | — | (0 | ) | 892 | ||||||||||||||||||||
|
|
|
|
|
|
|
|
|
|
|
|
|
|
|
|||||||||||||||
| Subtotal Debtors |
20,651 | — | (646 | ) | 4 | (10 | ) | (6 | ) | 19,994 | ||||||||||||||||||
| Debtor-Controlled |
13,120 | — | (212 | ) | — | — | (291 | ) | 12,616 | |||||||||||||||||||
|
|
|
|
|
|
|
|
|
|
|
|
|
|
|
|||||||||||||||
| Total |
$ | 33,771 | $ | — | $ | (858 | ) | $ | 4 | $ | (10 | ) | $ | (297 | ) | $ | 32,610 | |||||||||||
|
|
|
|
|
|
|
|
|
|
|
|
|
|
|
|||||||||||||||
| (1) | Includes cash receipts, net of Plan Adjustments, related to D8. |
| (2) | Includes distributions on allowed claims related to D8 from Debtors and partial repayments on intercompany balances by Debtor-Controlled Entities to Debtors. |
| (3) | Includes debt forgiveness resulting from dissolution of Debtor-Controlled Entities, primarily L.B.A. YK of $290 million. |
| (4) | “Due to Debtors and Debtor-Controlled Entities” balances are reflected in Liabilities Subject to Compromise on the October 1, 2015 Balance Sheets. |
|
|
Page 15 |
|
Quarterly Financial Report as of October 1, 2015 (Unaudited)
Note 9 – Due from/to Affiliates (continued)
| (a) | Intercompany Balances Among Debtors and Debtor-Controlled Entities (continued) |
The following table presents a summary of Due from/to Debtors and Debtor-Controlled Entities for Debtors as of October 1, 2015:
| LBHI | LBSF | LCPI | Other Debtors | Total Debtors | ||||||||||||||||||||||||||||||||||||
| $ in millions |
Due from | Due to | Due from | Due to | Due from | Due to | Due from | Due to | Due from | Due to | ||||||||||||||||||||||||||||||
| Lehman Brothers Holdings Inc |
$ | — | $ | — | $ | 188 | $ | (9,965 | ) | $ | 34 | $ | (3,695 | ) | $ | 201 | $ | (362 | ) | $ | 422 | $ | (14,022 | ) | ||||||||||||||||
| LB Special Financing Inc |
9,965 | (188 | ) | — | — | 73 | (255 | ) | 278 | (25 | ) | 10,315 | (468 | ) | ||||||||||||||||||||||||||
| Lehman Commercial Paper Inc |
3,695 | (34 | ) | 255 | (73 | ) | — | — | 162 | (359 | ) | 4,112 | (465 | ) | ||||||||||||||||||||||||||
| LB Commodity Services Inc |
100 | (41 | ) | — | (260 | ) | — | (1 | ) | — | (0 | ) | 100 | (302 | ) | |||||||||||||||||||||||||
| LB Commercial Corporation |
30 | (15 | ) | 25 | — | 74 | — | 0 | — | 129 | (15 | ) | ||||||||||||||||||||||||||||
| Structured Asset Securities Corp |
223 | — | 0 | — | — | (154 | ) | — | — | 223 | (154 | ) | ||||||||||||||||||||||||||||
| Merit, LLC |
— | (15 | ) | — | (13 | ) | 198 | — | — | — | 198 | (28 | ) | |||||||||||||||||||||||||||
| LB OTC Derivatives Inc |
0 | (0 | ) | 0 | — | — | — | — | — | 0 | (0 | ) | ||||||||||||||||||||||||||||
| Other Debtors |
9 | (130 | ) | 0 | (5 | ) | 86 | (6 | ) | 0 | (0 | ) | 95 | (141 | ) | |||||||||||||||||||||||||
| RACERS Claims (1) |
959 | — | — | — | — | — | — | — | 959 | — | ||||||||||||||||||||||||||||||
|
|
|
|
|
|
|
|
|
|
|
|
|
|
|
|
|
|
|
|
|
|||||||||||||||||||||
| Total Debtors |
$ | 14,981 | $ | (422 | ) | $ | 468 | $ | (10,315 | ) | $ | 465 | $ | (4,112 | ) | $ | 641 | $ | (746 | ) | $ | 16,555 | $ | (15,596 | ) | |||||||||||||||
| Lehman Ali Inc: |
||||||||||||||||||||||||||||||||||||||||
| Lehman Ali Inc (PCO) |
— | (2,542 | ) | — | (0 | ) | 2,602 | — | 0 | — | 2,602 | (2,543 | ) | |||||||||||||||||||||||||||
| LB Pass-Through Securities Inc |
176 | — | — | — | 93 | — | — | — | 269 | — | ||||||||||||||||||||||||||||||
| LCPI Properties Inc |
0 | (513 | ) | — | — | — | (0 | ) | — | (0 | ) | 0 | (513 | ) | ||||||||||||||||||||||||||
| LB I Group Inc: |
— | — | ||||||||||||||||||||||||||||||||||||||
| LB I Group Inc (PCO) |
2,162 | (29 | ) | 9 | — | 61 | (1 | ) | (0 | ) | — | 2,232 | (30 | ) | ||||||||||||||||||||||||||
| LB Offshore Partners Ltd |
387 | — | — | (0 | ) | 1 | — | (0 | ) | — | 388 | (0 | ) | |||||||||||||||||||||||||||
| DL Mortgage Corp |
— | (191 | ) | 0 | — | 772 | — | — | — | 772 | (191 | ) | ||||||||||||||||||||||||||||
| 314 Commonwealth Ave Inc: |
||||||||||||||||||||||||||||||||||||||||
| 314 Commonwealth Ave Inc (PCO) |
873 | (90 | ) | — | (2 | ) | — | — | — | (86 | ) | 873 | (178 | ) | ||||||||||||||||||||||||||
| LB U.K. Holdings (Delaware) Inc: |
||||||||||||||||||||||||||||||||||||||||
| LB U.K. Holdings (Delaware) Inc (PCO) |
191 | (12 | ) | — | — | — | — | — | — | 191 | (12 | ) | ||||||||||||||||||||||||||||
| Other: |
||||||||||||||||||||||||||||||||||||||||
| Pami Ali LLC |
1,815 | (66 | ) | 1 | — | 847 | (2 | ) | — | (48 | ) | 2,662 | (117 | ) | ||||||||||||||||||||||||||
| Luxembourg Finance Sarl |
844 | — | 28 | — | — | — | 67 | — | 939 | — | ||||||||||||||||||||||||||||||
| Real Estate Private Equity Inc |
600 | — | — | — | — | — | — | — | 600 | — | ||||||||||||||||||||||||||||||
| Repe LBREP II Holdings, L.P. |
220 | — | — | — | — | — | — | — | 220 | — | ||||||||||||||||||||||||||||||
| LBHK Funding (Cayman) No.4 |
185 | — | — | — | — | — | — | — | 185 | — | ||||||||||||||||||||||||||||||
| Lehman Brothers Global Services Inc. |
69 | — | — | (0 | ) | — | (0 | ) | — | (0 | ) | 69 | (0 | ) | ||||||||||||||||||||||||||
| LB Private Equity Advisers LLC |
— | (89 | ) | — | (0 | ) | — | — | — | — | — | (90 | ) | |||||||||||||||||||||||||||
| Lehman Investment Inc |
— | (99 | ) | — | (28 | ) | 148 | — | — | — | 148 | (127 | ) | |||||||||||||||||||||||||||
| Other |
429 | (560 | ) | 2 | (1 | ) | 34 | (25 | ) | (0 | ) | (11 | ) | 464 | (597 | ) | ||||||||||||||||||||||||
| LB Re Financing No.1 Limited |
6,010 | — | — | — | — | — | — | — | 6,010 | — | ||||||||||||||||||||||||||||||
|
|
|
|
|
|
|
|
|
|
|
|
|
|
|
|
|
|
|
|
|
|||||||||||||||||||||
| Total Debtor-Controlled Entities |
$ | 13,962 | $ | (4,192 | ) | $ | 40 | $ | (32 | ) | $ | 4,557 | $ | (28 | ) | $ | 67 | $ | (146 | ) | $ | 18,626 | $ | (4,398 | ) | |||||||||||||||
|
|
|
|
|
|
|
|
|
|
|
|
|
|
|
|
|
|
|
|
|
|||||||||||||||||||||
| $ | 28,943 | $ | (4,615 | ) | $ | 508 | $ | (10,346 | ) | $ | 5,022 | $ | (4,140 | ) | $ | 708 | $ | (892 | ) | $ | 35,181 | $ | (19,994 | ) | ||||||||||||||||
|
|
|
|
|
|
|
|
|
|
|
|
|
|
|
|
|
|
|
|
|
|||||||||||||||||||||
“PCO” – parent company only
| (1) | Refer to Section IV.I.b of the Disclosure Statement for further information on the RACERS Claims. |
|
|
Page 16 |
|
Quarterly Financial Report as of October 1, 2015 (Unaudited)
Note 9 – Due from/to Affiliates (continued)
| (a) | Intercompany Balances Among Debtors and Debtor-Controlled Entities (continued) |
The following table presents a summary of Due from/to Affiliates balances for Debtor-Controlled Entities as of October 1, 2015:
| 314 Commonwealth | LB UK Holdings |
Other Debtor- Controlled |
||||||||||||||||||||||||||||||||||||||
| Lehman ALI Inc. | LB I Group Inc. | Ave. Inc. | Delaware Inc. | Entities | ||||||||||||||||||||||||||||||||||||
| $ in millions |
Due from | Due to | Due from | Due to | Due from | Due to | Due from | Due to | Due from | Due to | ||||||||||||||||||||||||||||||
| Debtors: |
||||||||||||||||||||||||||||||||||||||||
| Lehman Brothers Holdings Inc. |
$ | 3,056 | $ | (176 | ) | $ | 220 | $ | (2,550 | ) | $ | 90 | $ | (873 | ) | $ | 12 | $ | (191 | ) | $ | 815 | $ | (4,162 | ) | |||||||||||||||
| Lehman Commercial Paper Inc. |
— | (2,695 | ) | 1 | (833 | ) | — | — | — | — | 27 | (1,028 | ) | |||||||||||||||||||||||||||
| Lehman Brothers Special Financing Inc. |
— | — | — | (9 | ) | 2 | — | — | — | 29 | (30 | ) | ||||||||||||||||||||||||||||
| Luxembourg Residential Properties Loan Fin S.a.r.l. |
— | — | — | — | 86 | — | — | — | — | — | ||||||||||||||||||||||||||||||
|
|
|
|
|
|
|
|
|
|
|
|
|
|
|
|
|
|
|
|
|
|||||||||||||||||||||
| Total Debtors |
$ | 3,056 | $ | (2,871 | ) | $ | 220 | $ | (3,393 | ) | $ | 178 | $ | (873 | ) | $ | 12 | $ | (191 | ) | $ | 871 | $ | (5,221 | ) | |||||||||||||||
| Debtor-Controlled: |
||||||||||||||||||||||||||||||||||||||||
| 314 Commonwealth Ave Inc |
$ | 50 | $ | — | $ | — | $ | — | $ | — | $ | — | $ | — | $ | — | $ | — | $ | — | ||||||||||||||||||||
| Lehman Ali Inc (1) |
— | — | — | — | — | (50 | ) | — | — | 235 | — | |||||||||||||||||||||||||||||
| Repe LBREP III LLC (1) |
— | — | — | — | — | — | — | — | 123 | — | ||||||||||||||||||||||||||||||
| Real Estate Private Equity Inc (1) |
— | — | — | — | — | — | — | — | 222 | — | ||||||||||||||||||||||||||||||
| LB I Group Inc. |
— | — | — | — | — | — | — | — | — | (304 | ) | |||||||||||||||||||||||||||||
| LCPI Properties Inc. |
— | — | — | — | — | — | — | — | — | (170 | ) | |||||||||||||||||||||||||||||
| Pami ALI LLC |
170 | (235 | ) | 304 | — | — | — | — | — | — | (345 | ) | ||||||||||||||||||||||||||||
| Other |
56 | (46 | ) | 29 | (7 | ) | 0 | (2 | ) | 886 | (738 | ) | 797 | (982 | ) | |||||||||||||||||||||||||
|
|
|
|
|
|
|
|
|
|
|
|
|
|
|
|
|
|
|
|
|
|||||||||||||||||||||
| Total Debtor-Controlled Entities |
$ | 276 | $ | (282 | ) | $ | 333 | $ | (7 | ) | $ | 0 | $ | (52 | ) | $ | 886 | $ | (738 | ) | $ | 1,378 | $ | (1,801 | ) | |||||||||||||||
|
|
|
|
|
|
|
|
|
|
|
|
|
|
|
|
|
|
|
|
|
|||||||||||||||||||||
| Total |
$ | 3,331 | $ | (3,153 | ) | $ | 554 | $ | (3,400 | ) | $ | 178 | $ | (925 | ) | $ | 899 | $ | (929 | ) | $ | 2,249 | $ | (7,022 | ) | |||||||||||||||
|
|
|
|
|
|
|
|
|
|
|
|
|
|
|
|
|
|
|
|
|
|||||||||||||||||||||
| Non-Controlled Affiliates: (2) |
||||||||||||||||||||||||||||||||||||||||
| Lehman Brothers Holdings Intermediate 2 Ltd |
$ | — | $ | — | $ | — | $ | — | $ | — | $ | — | $ | 77 | $ | — | $ | 749 | $ | — | ||||||||||||||||||||
| Lehman Brothers Holdings PLC |
— | — | — | — | — | — | 178 | (53 | ) | 2 | — | |||||||||||||||||||||||||||||
| Lehman Brothers Asia Holdings Limited |
— | — | — | (30 | ) | 0 | — | 13 | (23 | ) | 278 | (353 | ) | |||||||||||||||||||||||||||
| LB UK RE Holdings Limited (3) |
— | — | — | — | 7 | — | — | — | — | — | ||||||||||||||||||||||||||||||
| Other |
0 | (1 | ) | 1 | (2 | ) | 7 | — | 115 | (3 | ) | 77 | (101 | ) | ||||||||||||||||||||||||||
|
|
|
|
|
|
|
|
|
|
|
|
|
|
|
|
|
|
|
|
|
|||||||||||||||||||||
| Total |
$ | 0 | $ | (1 | ) | $ | 1 | $ | (32 | ) | $ | 15 | $ | — | $ | 383 | $ | (79 | ) | $ | 1,105 | $ | (454 | ) | ||||||||||||||||
|
|
|
|
|
|
|
|
|
|
|
|
|
|
|
|
|
|
|
|
|
|||||||||||||||||||||
| (1) | “Due from” balances at Other Debtor-Controlled Entities are related to receivables recorded by Pami ALI LLC. |
| (2) | Certain “Due from” balances are recorded in the local currency of the respective Non-Controlled Affiliates and as a result, balances may fluctuate as a result of changes in foreign exchange rates. Due from/to Affiliates balances include both settled and unresolved balances with Non-Controlled Affiliates. |
| (3) | The Debtor-Controlled Entities sold the majority of their claims against LB UK RE Holdings Limited to LBHI during the third quarter of 2015. |
|
|
Page 17 |
|
Quarterly Financial Report as of October 1, 2015 (Unaudited)
Note 9 – Due from/to Affiliates (continued)
| (b) | Intercompany balances among Debtors and Debtor-Controlled Entities and Non-Controlled Affiliates |
The table below presents the Due from/to Non-Controlled Affiliates balances as of October 1, 2015 and the related activity since the previously filed Quarterly Financial Report as of June 30, 2015:
| Activity 7/1/15 - 10/1/15 | ||||||||||||||||||||||||||||
| As of June 30, | Cash | Cash | Claim | Plan Related | As of October | |||||||||||||||||||||||
| $ in millions |
2015 | Receipts (1) | Distributions (2) | Assignments (3) | Adjustments | Other (4) | 1, 2015 | |||||||||||||||||||||
| Due From Non-Controlled (5) |
||||||||||||||||||||||||||||
| Debtors: |
||||||||||||||||||||||||||||
| Lehman Brothers Holdings Inc. |
$ | 21,474 | $ | (1,585 | ) | $ | — | $ | 1,502 | $ | — | $ | (1,446 | ) | $ | 19,945 | ||||||||||||
| Lehman Commercial Paper Inc. |
147 | (4 | ) | — | — | — | (5 | ) | 138 | |||||||||||||||||||
| Lehman Brothers Special Financing Inc. |
1,354 | (20 | ) | — | (10 | ) | — | (21 | ) | 1,302 | ||||||||||||||||||
| Other Debtors |
594 | (55 | ) | — | (0 | ) | — | (84 | ) | 455 | ||||||||||||||||||
|
|
|
|
|
|
|
|
|
|
|
|
|
|
|
|||||||||||||||
| Subtotal Debtors |
23,568 | (1,664 | ) | — | 1,492 | — | (1,556 | ) | 21,841 | |||||||||||||||||||
| Debtor-Controlled |
2,552 | (157 | ) | — | (556 | ) | — | (335 | ) | 1,504 | ||||||||||||||||||
|
|
|
|
|
|
|
|
|
|
|
|
|
|
|
|||||||||||||||
| Total |
$ | 26,120 | $ | (1,820 | ) | $ | — | $ | 937 | $ | — | $ | (1,892 | ) | $ | 23,345 | ||||||||||||
|
|
|
|
|
|
|
|
|
|
|
|
|
|
|
|||||||||||||||
| Due To Non-Controlled (6) |
||||||||||||||||||||||||||||
| Debtors: |
||||||||||||||||||||||||||||
| Lehman Brothers Holdings Inc. |
$ | 41,335 | $ | — | $ | (1,107 | ) | $ | — | $ | — | $ | 2 | $ | 40,230 | |||||||||||||
| Lehman Commercial Paper Inc. |
753 | — | (59 | ) | (9 | ) | (13 | ) | (0 | ) | 673 | |||||||||||||||||
| Lehman Brothers Special Financing Inc. |
1,078 | — | (30 | ) | (3 | ) | (0 | ) | (39 | ) | 1,005 | |||||||||||||||||
| Other Debtors |
99 | — | (0 | ) | — | (0 | ) | (0 | ) | 99 | ||||||||||||||||||
|
|
|
|
|
|
|
|
|
|
|
|
|
|
|
|||||||||||||||
| Subtotal Debtors |
43,366 | — | (1,196 | ) | (12 | ) | (14 | ) | (37 | ) | 42,007 | |||||||||||||||||
| Debtor-Controlled |
628 | — | (4 | ) | — | — | (57 | ) | 567 | |||||||||||||||||||
|
|
|
|
|
|
|
|
|
|
|
|
|
|
|
|||||||||||||||
| Total |
$ | 43,993 | $ | — | $ | (1,200 | ) | $ | (12 | ) | $ | (14 | ) | $ | (94 | ) | $ | 42,574 | ||||||||||
|
|
|
|
|
|
|
|
|
|
|
|
|
|
|
|||||||||||||||
| (1) | Between July 1, 2015 and October 1, 2015, the Company collected approximately $1.82 billion from: |
| $ in millions |
LBHI | LBSF | LCPI | Other Debtors |
Debtor- Controlled Entities |
Total | ||||||||||||||||||
| Lehman Brothers Asia Holdings Ltd |
$ | 362 | $ | — | $ | — | $ | 8 | $ | 31 | $ | 401 | ||||||||||||
| Lehman Brothers Bankhaus A.G. (i) |
350 | — | — | 18 | — | 368 | ||||||||||||||||||
| Lehman Brothers Inc. (ii) |
209 | — | 1 | 18 | 71 | 299 | ||||||||||||||||||
| Lehman Brothers Finance S.A. |
231 | — | — | — | — | 231 | ||||||||||||||||||
| Lehman Brothers Commercial Corp. Asia Ltd |
138 | 1 | — | 7 | 1 | 147 | ||||||||||||||||||
| Lehman Brothers Luxembourg S.A. |
118 | — | — | — | — | 118 | ||||||||||||||||||
| Lehman Brothers Treasury Co. B.V. (iii) |
59 | 18 | — | 1 | — | 78 | ||||||||||||||||||
| Lehman Brothers Securities Asia Ltd |
62 | — | — | — | — | 62 | ||||||||||||||||||
| LB UK RE Holdings Ltd |
13 | — | — | — | 26 | 39 | ||||||||||||||||||
| Lehman Brothers ODC 1 |
— | — | — | — | 29 | 29 | ||||||||||||||||||
| Monaco NPL (No.1) Ltd |
15 | — | — | — | — | 15 | ||||||||||||||||||
| LB Lease & Finance No.1 Ltd |
6 | — | — | — | — | 6 | ||||||||||||||||||
| Stepstone Mortgage Funding Ltd |
4 | — | — | — | — | 4 | ||||||||||||||||||
| Other |
17 | 1 | 2 | 3 | 1 | 24 | ||||||||||||||||||
|
|
|
|
|
|
|
|
|
|
|
|
|
|||||||||||||
| $ | 1,585 | $ | 20 | $ | 4 | $ | 55 | $ | 157 | $ | 1,820 | |||||||||||||
|
|
|
|
|
|
|
|
|
|
|
|
|
|||||||||||||
| (i) | Receipts at LBHI are for claims against LB Bankhaus that were assigned to LBHI as a result of the Bankhaus Creditors’ Settlement (refer to the Bankhaus Creditors’ Settlement herein for additional information). |
| (ii) | Receipts from LBI include (a) $121 million from LBI third distribution, (b) $96 million from the sale of $750 million face amount of LBI claims, and (c) $82 million from a total return swap related to future distributions on $1.5 billion face amount of LBI claims held by LBHI. |
|
|
Page 18 |
|
Quarterly Financial Report as of October 1, 2015 (Unaudited)
Note 9 – Due from/to Affiliates (continued)
| (b) | Intercompany balances among Debtors and Debtor-Controlled Entities and Non-Controlled Affiliates (continued) |
| (iii) | Pursuant to agreements with LBT, LBSF and LBCS, LBHI deducted and withheld approximately $78 million from its eighth Plan distribution (“Withheld Distributions”) due from LBHI to LBT to offset amounts due to LBHI, LBSF and LBCS from LBT. The Withheld Distributions were then distributed to LBSF, LBCS and LBHI for inclusion in their respective eighth Plan distributions. |
| (2) | Cash Distributions include payments on allowed claims held by Non-Controlled Affiliates for D8. |
| (3) | Claim Assignments primarily include (i) direct claims against LB Bankhaus of $937 million as a result of the Bankhaus Creditors’ Settlement (refer to the Bankhaus Creditors’ Settlement herein for additional information) and (ii) the sale to LBHI of claims against LB UK RE Holdings Limited of $553 million, net of distributions, by Debtor-Controlled Entities. |
| (4) | Other primarily includes a reduction at LBHI of $1.3 billion related to (i) the sale of $750 million face amount of LBI claims for $96 million, and (ii) a total return swap related to future distributions on $1.5 billion face amount of LBI claims for proceeds of $82 million; the resulting decrease of $1.3 billion represents the difference between the aggregate proceeds and the aggregate face amount of these LBI claims. |
| (5) | “Due From Non-Controlled” balances are recorded in the local currency of the Non-Controlled Affiliate and as a result, balances fluctuate as a result of changes in foreign exchange rates. |
| (6) | “Due to Non-Controlled” balances with Non-Controlled Affiliates are reflected in Liabilities Subject to Compromise herein. |
|
|
Page 19 |
|
Quarterly Financial Report as of October 1, 2015 (Unaudited)
Note 9 – Due from/to Affiliates (continued)
| (b) | Intercompany balances among Debtors and Debtor-Controlled Entities and Non-Controlled Affiliates (continued) |
The following table presents a summary of Due from/to Non-Controlled Affiliates for Debtors as of October 1, 2015:
| LBHI | LBSF | LCPI | Other Debtors | Total Debtors | ||||||||||||||||||||||||||||||||||||
| $ in millions |
Due from | Due to | Due from | Due to | Due from | Due to | Due from | Due to | Due from | Due to | ||||||||||||||||||||||||||||||
| Europe |
||||||||||||||||||||||||||||||||||||||||
| Lehman Brothers Treasury Co B.V. (1) |
$ | 2,292 | $ | (24,238 | ) | $ | 715 | $ | — | $ | — | $ | — | $ | 115 | $ | — | $ | 3,122 | $ | (24,238 | ) | ||||||||||||||||||
| Lehman Brothers Finance S.A. |
8,922 | (720 | ) | — | — | 0 | — | 1 | — | 8,923 | (720 | ) | ||||||||||||||||||||||||||||
| Lehman Brothers Bankhaus A.G. |
1,219 | (33 | ) | — | (113 | ) | — | (111 | ) | 27 | — | 1,246 | (256 | ) | ||||||||||||||||||||||||||
| LB UK RE Holdings Limited |
786 | — | — | — | — | — | — | — | 786 | — | ||||||||||||||||||||||||||||||
| Lehman Brothers (Luxembourg) S.A. |
368 | — | — | — | — | — | — | — | 368 | — | ||||||||||||||||||||||||||||||
| Thayer Properties Limited |
231 | — | — | — | — | (0 | ) | — | — | 231 | (0 | ) | ||||||||||||||||||||||||||||
| SMF No 1 Limited |
197 | — | — | — | — | — | — | — | 197 | — | ||||||||||||||||||||||||||||||
| LB (PTG) Ltd |
192 | — | — | — | 0 | — | (0 | ) | — | 192 | — | |||||||||||||||||||||||||||||
| LB Lease & Finance No.1 Ltd |
135 | — | — | — | — | — | — | — | 135 | — | ||||||||||||||||||||||||||||||
| LB (Luxembourg) Equity Finance S.A |
52 | (59 | ) | — | — | — | — | — | — | 52 | (59 | ) | ||||||||||||||||||||||||||||
| Longmeade Limited |
12 | — | — | — | — | (60 | ) | — | — | 12 | (60 | ) | ||||||||||||||||||||||||||||
| LB RE Financing No.2 Limited (2) |
0 | (4,765 | ) | — | — | — | — | — | — | 0 | (4,765 | ) | ||||||||||||||||||||||||||||
| Lehman Brothers Limited |
0 | (255 | ) | — | (2 | ) | — | (1 | ) | 0 | (0 | ) | 0 | (259 | ) | |||||||||||||||||||||||||
| Lehman Brothers International (Europe) Inc (3) |
— | (788 | ) | — | (571 | ) | — | — | — | — | (1,359 | ) | ||||||||||||||||||||||||||||
| LB RE Financing No.3 Limited |
— | — | 535 | — | — | — | — | — | 535 | — | ||||||||||||||||||||||||||||||
| Lehman Re Limited |
— | (69 | ) | — | (8 | ) | — | — | — | (7 | ) | — | (83 | ) | ||||||||||||||||||||||||||
| Wood Street Investments Ltd |
— | (194 | ) | — | — | — | — | — | — | — | (194 | ) | ||||||||||||||||||||||||||||
| LB Holdings Intermediate 2 Ltd |
— | (216 | ) | — | — | — | — | — | — | — | (216 | ) | ||||||||||||||||||||||||||||
| LB UK Holdings Limited |
— | (432 | ) | — | — | — | — | — | — | — | (432 | ) | ||||||||||||||||||||||||||||
| Eldon Street Holdings Limited |
— | (451 | ) | — | — | — | (0 | ) | — | 0 | — | (451 | ) | |||||||||||||||||||||||||||
| Storm Funding Ltd |
— | (163 | ) | — | (3 | ) | — | (46 | ) | — | — | — | (212 | ) | ||||||||||||||||||||||||||
| Asia |
||||||||||||||||||||||||||||||||||||||||
| Lehman Brothers Asia Holdings Limited |
3,312 | (1 | ) | — | — | — | — | 77 | (4 | ) | 3,389 | (5 | ) | |||||||||||||||||||||||||||
| LB Commercial Corp. Asia Limited |
1,059 | — | 8 | — | — | (1 | ) | 52 | (68 | ) | 1,119 | (69 | ) | |||||||||||||||||||||||||||
| LB Asia Pacific (Singapore) PTE |
366 | — | — | — | — | — | — | — | 366 | — | ||||||||||||||||||||||||||||||
| LB Investments PTE Ltd |
267 | — | — | — | — | — | — | — | 267 | — | ||||||||||||||||||||||||||||||
| LB Asia Capital Company |
25 | (0 | ) | 29 | — | 134 | — | 149 | — | 336 | (0 | ) | ||||||||||||||||||||||||||||
| LB Securities Asia Limited |
0 | (145 | ) | — | — | — | — | 0 | — | 0 | (145 | ) | ||||||||||||||||||||||||||||
| Lehman Brothers Japan Inc. |
— | (125 | ) | — | (136 | ) | — | — | 18 | — | 18 | (261 | ) | |||||||||||||||||||||||||||
| Lehman Brothers Asia Limited |
— | (133 | ) | — | — | — | (0 | ) | — | 0 | — | (133 | ) | |||||||||||||||||||||||||||
| Other |
||||||||||||||||||||||||||||||||||||||||
| Claims held by third parties (4) |
— | (7,101 | ) | — | (79 | ) | — | (426 | ) | — | 0 | — | (7,606 | ) | ||||||||||||||||||||||||||
| Other |
511 | (343 | ) | 16 | (93 | ) | 4 | (29 | ) | 17 | (19 | ) | 547 | (485 | ) | |||||||||||||||||||||||||
|
|
|
|
|
|
|
|
|
|
|
|
|
|
|
|
|
|
|
|
|
|||||||||||||||||||||
| Total |
$ | 19,946 | $ | (40,230 | ) | $ | 1,302 | $ | (1,005 | ) | $ | 138 | $ | (673 | ) | $ | 455 | $ | (99 | ) | $ | 21,841 | $ | (42,007 | ) | |||||||||||||||
|
|
|
|
|
|
|
|
|
|
|
|
|
|
|
|
|
|
|
|
|
|||||||||||||||||||||
| (1) | LBT is included in the defined term “Non-Controlled Affiliates,” but LBHI has no direct or indirect equity interest in LBT. |
| (2) | Distributions from LBHI to LB RE Financing No.2 Limited (“FIN2”) are subsequently remitted from FIN2 to LB RE Financing No. 1 Limited (“FIN1”); FIN1 then pays these monies to LBHI to satisfy its obligations. |
| (3) | LBHI and other Debtors own allowed claims against LBIE in the aggregate face amounts of $302 million and $104 million, respectively. |
| (4) | “Claims held by third parties” represent claims, net of distributions, originally held by Non-Controlled Affiliates, according to their respective settlement agreements with the Company, that are currently held by third parties, including: ($ in millions) |
| Total | ||||||||||||||||
| Orignal creditor |
LBHI | LBSF | LCPI | Debtors | ||||||||||||
| Lehman Brothers Bankhaus A.G. |
$ | (5,206 | ) | $ | (0 | ) | $ | (234 | ) | $ | (5,441 | ) | ||||
| Lehman Brothers Securities NV |
(539 | ) | (47 | ) | (11 | ) | (598 | ) | ||||||||
| Storm Funding Ltd |
(558 | ) | — | — | (558 | ) | ||||||||||
| LB Asia Capital Company |
(436 | ) | — | — | (436 | ) | ||||||||||
| Lehman Re Limited |
(234 | ) | (9 | ) | (123 | ) | (366 | ) | ||||||||
| Other |
(127 | ) | (22 | ) | (58 | ) | (207 | ) | ||||||||
|
|
|
|
|
|
|
|
|
|||||||||
| Total Claims held by third parties |
$ | (7,101 | ) | $ | (79 | ) | $ | (426 | ) | $ | (7,606 | ) | ||||
|
|
|
|
|
|
|
|
|
|||||||||
|
|
Page 20 |
|
Quarterly Financial Report as of October 1, 2015 (Unaudited)
Note 9 – Due from/to Affiliates (continued)
(b) Intercompany balances among Debtors and Debtor-Controlled Entities and Non-Controlled Affiliates (continued)
The following table presents, on an aggregate basis for Debtors and Debtor-Controlled Entities, admitted claims, receivables, and collections to date from Non-Controlled Affiliates:
| Admitted | Admitted and | |||||||||||||||||
| Claims in | Unsettled | Collections | Net | |||||||||||||||
| Local | Local | Filed Claims | To Date in | Receivables | ||||||||||||||
| $ in millions |
Currency | Currency | in USD | USD (6) | in USD | |||||||||||||
| Europe |
||||||||||||||||||
| Lehman Brothers Finance S.A. |
CHF | 9,582 | $ | 9,870 | $ | (933 | ) | $ | 8,936 | |||||||||
| Lehman Brothers Treasury Co B.V. |
USD | 4,342 | 4,342 | (1,303 | ) | 3,038 | ||||||||||||
| Lehman Brothers Treasury Co B.V. (1) |
Various | N/A | 113 | (29 | ) | 84 | ||||||||||||
| Lehman Brothers Bankhaus A.G. |
EUR | 203 | 227 | (200 | ) | 28 | ||||||||||||
| Lehman Brothers Bankhaus A.G.—Assigned (2) |
EUR | 8,842 | 9,890 | (8,671 | ) | 1,219 | ||||||||||||
| LB UK RE Holdings Limited |
GBP | 1,188 | 1,798 | (1,005 | ) | 793 | ||||||||||||
| Lehman Brothers (Luxembourg) S.A. |
EUR | 759 | 849 | (481 | ) | 368 | ||||||||||||
| LB Holdings Intermediate 2 Ltd (3) (5) |
— | — | 826 | — | 826 | |||||||||||||
| Lehman Brothers International (Europe) Inc |
GBP | 350 | 534 | (534 | ) | — | ||||||||||||
| LB RE Financing No.3 Limited |
GBP | 353 | 535 | — | 535 | |||||||||||||
| LB Commercial Mortgage Conduit Ltd |
GBP | 240 | 363 | (287 | ) | 76 | ||||||||||||
| Thayer Properties Limited |
GBP | 172 | 260 | (28 | ) | 231 | ||||||||||||
| LB (PTG) Ltd |
GBP | 170 | 257 | (65 | ) | 192 | ||||||||||||
| Lehman Brothers Holdings Plc (4) |
GBP | 158 | 251 | (10 | ) | 241 | ||||||||||||
| SMF No 1 Limited |
EUR | 202 | 227 | (30 | ) | 197 | ||||||||||||
| LB Lease & Finance No.1 Ltd |
GBP | 122 | 184 | (49 | ) | 135 | ||||||||||||
| LB (Luxembourg) Equity Finance S.A |
EUR | 96 | 107 | (55 | ) | 52 | ||||||||||||
| Monaco NPL (No.1) Limited |
GBP | 62 | 94 | (30 | ) | 64 | ||||||||||||
| Yellow Real Estate Ltd |
USD | 89 | 89 | (89 | ) | — | ||||||||||||
| Longmeade Limited |
GBP | 43 | 65 | (21 | ) | 44 | ||||||||||||
| Asia |
||||||||||||||||||
| Lehman Brothers Asia Holdings Limited (4) |
HKD | 82,330 | 10,635 | (6,955 | ) | 3,680 | ||||||||||||
| LB Asia Capital Company |
HKD | 3,279 | 423 | (87 | ) | 336 | ||||||||||||
| LB Asia Pacific (Singapore) PTE (5) |
USD | 366 | 366 | — | 366 | |||||||||||||
| LB Commercial Corp. Asia Limited |
HKD | 18,920 | 2,441 | (1,318 | ) | 1,123 | ||||||||||||
| LB Investments PTE Ltd (5) |
USD | 456 | 456 | (189 | ) | 267 | ||||||||||||
| LB Securities Asia Limited |
HKD | 2,023 | 261 | (261 | ) | — | ||||||||||||
| Lehman Brothers Japan Inc. |
JPY | 17,249 | 144 | (118 | ) | 26 | ||||||||||||
| GKI Development Inc. |
KRW | 103,363 | 88 | (77 | ) | 11 | ||||||||||||
| Lehman Brothers Australia Ltd (4) |
AUD | 104 | 79 | — | 79 | |||||||||||||
| Sail Investor PTE Ltd |
USD | 63 | 63 | (57 | ) | 6 | ||||||||||||
| Other |
598 | (207 | ) | 391 | ||||||||||||||
|
|
|
|
|
|
|
|||||||||||||
| Total |
$ | 46,435 | $ | (23,091 | ) | $ | 23,344 | |||||||||||
|
|
|
|
|
|
|
|||||||||||||
| (1) | Represents claims against Lehman Brothers Treasury Co B.V. that were admitted in eight different currencies. |
| (2) | Includes gross claims against Lehman Brothers Bankhaus A.G. of € 8.773 billion that were assigned as a result of the Harmonizing Resolution, net of €7.316 billion of distributions received by owners of the claims prior to the claims’ assignments to LBHI. €541 million of gross claims are in the process of being assigned to LBHI and are not reflected in the above table. (Refer to the Bankhaus Creditors’ Settlement herein for additional information). |
| (3) | “Admitted and Unsettled Filed Claims in USD” includes the unsettled historical receivable balances where the filed claims have not yet been admitted. |
|
|
Page 21 |
|
Quarterly Financial Report as of October 1, 2015 (Unaudited)
Note 9 – Due from/to Affiliates (continued)
(b) Intercompany balances among Debtors and Debtor-Controlled Entities and Non-Controlled Affiliates (continued)
| (4) | Amounts in “Admitted Claims in Local Currency” represent the allowed claims with Non-Controlled Affiliates. |
| (5) | Included are allowed claims that are deemed subordinated against LB Asia Pacific (Singapore) PTE of $366 million and LB Investments PTE Ltd of $6 million. A filed subordinated claim by LB Holdings Scottish LP 3 of $6.139 billion against LB Holdings Intermediates 2 Ltd is fully reserved in the Balance Sheets. |
| (6) | “Collections to Date in USD” include distributions received on the claims prior to the assignments of the claims to LBHI and Debtor-Controlled Entities. |
| (7) | Other claims against Lehman Brothers Finance S.A., Lehman Brothers Bankhaus A.G., Lehman Brothers Treasury Co B.V. and Lehman Brothers International (Europe) Inc., acquired through settlements with third parties are included in Affiliate Claims receivables in the Balance Sheets (refer to Note 7 – Receivables from Controlled Affiliates and Other Assets for additional information). |
|
|
Page 22 |
|
Quarterly Financial Report as of October 1, 2015 (Unaudited)
Note 9 – Due from/to Affiliates (continued)
(c) Settlements with Non-Controlled Affiliates
|
|
Page 23 |
|
Quarterly Financial Report as of October 1, 2015 (Unaudited)
Note 9 – Due from/to Affiliates (continued)
(c) Settlements with Non-Controlled Affiliates (continued)
|
|
Page 24 |
|
Quarterly Financial Report as of October 1, 2015 (Unaudited)
Note 9 – Due from/to Affiliates (continued)
|
|
Page 25 |
|
Quarterly Financial Report as of October 1, 2015 (Unaudited)
Note 10 – Payables to Debtors and Debtor-Controlled Entities and Other Liabilities
Payables to Debtors and Debtor-Controlled Entities and Other Liabilities includes: (i) $3.1 billion related to certain post-petition activities between and among Debtors and Debtor-Controlled Entities, with the corresponding assets reflected in Receivables from Debtors and Debtor-Controlled Entities and Other Assets and (ii) $390 million of other liabilities.
The following table summarizes the main components of Payables to Debtors and Debtor-Controlled Entities and Other Liabilities as of October 1, 2015:
| Total Debtors | ||||||||||||||||||||||||||||
| Debtors | Debtor- | and Debtor- | ||||||||||||||||||||||||||
| $ in millions |
LBHI | LCPI | LBSF | Other Debtors |
Total | Controlled Entities |
Controlled Entities |
|||||||||||||||||||||
| Encumbered Financial Inventory (1) |
$ | — | $ | — | $ | — | $ | — | $ | — | $ | 300 | $ | 300 | ||||||||||||||
| Secured Notes (2) |
1,693 | 200 | 10 | — | 1,903 | — | 1,903 | |||||||||||||||||||||
| PIK Notes (3) |
— | — | — | — | — | 39 | 39 | |||||||||||||||||||||
| Fundings and other activities (4) |
355 | 263 | 9 | 19 | 647 | 203 | 849 | |||||||||||||||||||||
|
|
|
|
|
|
|
|
|
|
|
|
|
|
|
|||||||||||||||
| Payables to Debtors and Debtor-Controlled Entities |
2,048 | 463 | 19 | 19 | 2,550 | 541 | 3,091 | |||||||||||||||||||||
| Distributions on Allowed Claims (not remitted) |
90 | 0 | 0 | 0 | 91 | — | 91 | |||||||||||||||||||||
| Misdirected wires |
55 | — | — | — | 55 | — | 55 | |||||||||||||||||||||
| Other |
110 | 13 | (0 | ) | 0 | 124 | 121 | 244 | ||||||||||||||||||||
|
|
|
|
|
|
|
|
|
|
|
|
|
|
|
|||||||||||||||
| Total Other Liabilities |
256 | 13 | 0 | 0 | 270 | 121 | 390 | |||||||||||||||||||||
|
|
|
|
|
|
|
|
|
|
|
|
|
|
|
|||||||||||||||
| Total Payables to Debtors and Debtor-Controlled Entities and other liabilities |
$ | 2,305 | $ | 476 | $ | 19 | $ | 20 | $ | 2,820 | $ | 662 | $ | 3,482 | ||||||||||||||
|
|
|
|
|
|
|
|
|
|
|
|
|
|
|
|||||||||||||||
Refer to Note 7—Receivables from Debtors and Debtor-Controlled Entities and Other Assets for footnote explanations.
|
|
Page 26 |
|
Quarterly Financial Report as of October 1, 2015 (Unaudited)
Note 11 – Taxes Payable
|
|
Page 27 |
|
Quarterly Financial Report as of October 1, 2015 (Unaudited)
Note 12 – Liabilities Subject to Compromise
The table below presents the Company’s estimates of claim values as of October 1, 2015 by claim category, and the changes in estimates since the previously filed Quarterly Financial Report as of June 30, 2015:
| ($ in billions) | Period Ending October 1, 2015 | October 1, 2015 Claims Balance | ||||||||||||||||||||||||||||||
| Claim Category |
June 30, 2015 Claims Balance |
Allowed Claims |
Change in Estimated Active Claims |
October 1, 2015 Claims Balance |
LBHI | LCPI | LBSF | Other Debtors |
||||||||||||||||||||||||
| Direct Claims: |
||||||||||||||||||||||||||||||||
| Debt |
$ | 99.2 | $ | — | $ | — | $ | 99.2 | $ | 98.5 | $ | — | $ | — | $ | 0.7 | ||||||||||||||||
| Derivatives |
25.1 | 0.3 | (0.4 | ) | 25.0 | 0.0 | 0.0 | 22.5 | 2.5 | |||||||||||||||||||||||
| Other |
14.0 | 0.0 | (0.4 | ) | 13.6 | 6.3 | 6.7 | 0.1 | 0.5 | |||||||||||||||||||||||
|
|
|
|
|
|
|
|
|
|
|
|
|
|
|
|
|
|||||||||||||||||
| Total Direct Claims |
138.3 | 0.3 | (0.7 | ) | 137.9 | 104.9 | 6.8 | 22.6 | 3.7 | |||||||||||||||||||||||
|
|
|
|
|
|
|
|
|
|
|
|
|
|
|
|
|
|||||||||||||||||
| Affiliate Claims Direct |
107.8 | 0.0 | (0.1 | ) | 107.8 | 58.8 | 23.1 | 20.5 | 5.3 | |||||||||||||||||||||||
| Affiliate Guarantee Claims |
12.7 | 0.0 | — | 12.7 | 12.7 | — | — | — | ||||||||||||||||||||||||
| Third Party Guarantee Claims |
69.8 | 0.6 | (0.8 | ) | 69.7 | 69.7 | — | — | — | |||||||||||||||||||||||
|
|
|
|
|
|
|
|
|
|
|
|
|
|
|
|
|
|||||||||||||||||
| Total Liabilities Subject to Compromise |
328.7 | 1.0 | (1.6 | ) | 328.1 | 246.1 | 29.8 | 43.1 | 9.1 | |||||||||||||||||||||||
|
|
|
|
|
|
|
|
|
|
|
|
|
|
|
|
|
|||||||||||||||||
| Taxes Payable |
0.3 | — | (0.1 | ) | 0.2 | 0.4 | 0.0 | (0.2 | ) | (0.0 | ) | |||||||||||||||||||||
| Secured Claims Payable to Third parties |
2.0 | — | — | 2.0 | 2.0 | — | — | — | ||||||||||||||||||||||||
|
|
|
|
|
|
|
|
|
|
|
|
|
|
|
|
|
|||||||||||||||||
| Total Claims |
$ | 331.0 | $ | 1.0 | $ | (1.7 | ) | $ | 330.3 | $ | 248.5 | $ | 29.9 | $ | 42.9 | $ | 9.1 | |||||||||||||||
|
|
|
|
|
|
|
|
|
|
|
|
|
|
|
|
|
|||||||||||||||||
| Allowed Claims |
318.6 | 1.0 | — | 319.6 | 240.6 | 29.8 | 40.7 | 8.4 | ||||||||||||||||||||||||
| Estimated Unresolved Claims to be Allowed |
12.4 | — | (1.7 | ) | 10.8 | 7.9 | 0.0 | 2.1 | 0.7 | |||||||||||||||||||||||
|
|
|
|
|
|
|
|
|
|
|
|
|
|
|
|
|
|||||||||||||||||
| Total Claims |
$ | 331.0 | $ | 1.0 | $ | (1.7 | ) | $ | 330.3 | $ | 248.5 | $ | 29.9 | $ | 42.9 | $ | 9.1 | |||||||||||||||
|
|
|
|
|
|
|
|
|
|
|
|
|
|
|
|
|
|||||||||||||||||
| Less : Claims Distributions and other reductions (1)(2) |
(128.2 | ) | (80.8 | ) | (23.4 | ) | (16.8 | ) | (7.2 | ) | ||||||||||||||||||||||
| Post Petition Interest paid (2) |
(0.2 | ) | — | — | — | (0.2 | ) | |||||||||||||||||||||||||
|
|
|
|
|
|
|
|
|
|
|
|||||||||||||||||||||||
| Net Claim Liability at October 1, 2015 |
$ | 201.9 | $ | 167.7 | $ | 6.4 | $ | 26.1 | $ | 1.7 | ||||||||||||||||||||||
|
|
|
|
|
|
|
|
|
|
|
|||||||||||||||||||||||
All values that are exactly zero are shown as “-”. Values between zero and $0.5 million appear as “0”. Totals may not foot due to rounding.
| (1) | Claim Distributions and other reductions include (i) distributions on allowed claims, (ii) reductions of the liabilities related to certain satisfied claims, (iii) the assignment of claims to their respective parents, and (iv) certain netting agreements between Debtors and Non-Controlled Affiliates. |
| (2) | Claims Distributions and other reductions and Post-Petition Interest paid include: |
| Total | Other | |||||||||||||||||||
| ($ in billions) |
Debtors | LBHI | LCPI | LBSF | Debtors | |||||||||||||||
| Claims Distributions and Post Petition Interest paid |
$ | 105.4 | $ | 68.3 | $ | 17.8 | $ | 12.9 | $ | 6.3 | ||||||||||
| Other Reductions |
||||||||||||||||||||
| Intercompany Funding Adjustments |
7.9 | — | 4.1 | 3.0 | 0.8 | |||||||||||||||
| Plan Adjustments |
(0.6 | ) | (2.6 | ) | 1.0 | 0.8 | 0.3 | |||||||||||||
| Assignment of Claims (a) |
5.4 | 5.3 | 0.1 | — | — | |||||||||||||||
| Third Party Guarantees Satisfied (b) |
8.4 | 8.4 | — | — | — | |||||||||||||||
| Freddie Mac Settlement |
1.1 | 1.1 | — | — | — | |||||||||||||||
| Convenience Claims and other |
0.9 | 0.3 | 0.4 | 0.1 | 0.0 | |||||||||||||||
|
|
|
|
|
|
|
|
|
|
|
|||||||||||
| Total Claims Distributions and other reductions and Post Petition Interest paid |
$ | 128.4 | $ | 80.8 | $ | 23.4 | $ | 16.8 | $ | 7.4 | ||||||||||
|
|
|
|
|
|
|
|
|
|
|
|||||||||||
| (a) | Claims assigned by Non-Controlled Affiliates (primarily LBSN of $3.2 billion and UK Financing of $2.1 billion), net of distributions, to LBHI in connection with settlement agreements with Non-Controlled Affiliates. |
| (b) | Allowed Guarantee claims (primarily Bankhaus $7.9 billion, LOTC $0.2 billion and LBCC $0.2 billion), net of distributions, deemed satisfied as a result of distributions to creditors from the combination of the primary obligor and LBHI as the guarantor. |
|
|
Page 28 |
|
Quarterly Financial Report as of October 1, 2015 (Unaudited)
Note 12 – Liabilities Subject to Compromise (continued)
|
|
Page 29 |
|
Quarterly Financial Report as of October 1, 2015 (Unaudited)
Note 13 – Legal Proceedings
|
|
Page 30 |
|
Quarterly Financial Report as of October 1, 2015 (Unaudited)
Note 13 – Legal Proceedings (continued)
|
|
Page 31 |
|
Quarterly Financial Report as of October 1, 2015 (Unaudited)
|
|
Page 32 |
|
Quarterly Financial Report as of October 1, 2015 (Unaudited)
III. Balance Sheets
LEHMAN BROTHERS HOLDINGS INC. and Other Debtors and Debtor-Controlled Entities
Balance Sheets As of October 1, 2015
(Unaudited)
| ($ in millions) |
Lehman Brothers Holdings Inc. 08-13555 |
Lehman Brothers Special Financing Inc. 08-13888 |
Lehman Brothers Commodity Services Inc. 08-13885 |
Lehman Brothers Commercial Corporation 08-13901 |
Lehman Brothers OTC Derivatives Inc. 08-13893 |
Lehman Brothers Financial Products Inc. 08-13902 |
Lehman Brothers Derivative Products Inc. 08-13899 |
Lehman Commercial Paper Inc. 08-13900 |
Luxembourg Residential Properties Loan Finance S.a.r.l. 09-10108 |
Other Debtors (2) |
Total Debtor Entities (1) |
Total Debtor- Controlled Entities (3) |
Total Company |
|||||||||||||||||||||||||||||||||||||||||||
| Assets |
||||||||||||||||||||||||||||||||||||||||||||||||||||||||
| Cash and short-term investments |
$ | 67 | $ | 15 | $ | 0 | $ | 6 | $ | 4 | $ | 22 | $ | 169 | $ | 17 | $ | 2 | $ | 72 | $ | 374 | $ | 316 | $ | 690 | ||||||||||||||||||||||||||||||
| Cash and short-term investments pledged or restricted |
3,611 | 1,059 | 100 | 83 | 1 | 0 | 3 | 30 | 0 | 152 | 5,039 | 77 | 5,116 | |||||||||||||||||||||||||||||||||||||||||||
| Financial instruments and other inventory positions: |
||||||||||||||||||||||||||||||||||||||||||||||||||||||||
| Commercial Real Estate |
61 | 0 | — | — | — | — | — | 225 | — | — | 287 | 403 | 690 | |||||||||||||||||||||||||||||||||||||||||||
| Loans and Residential Real Estate |
67 | — | — | — | — | — | — | 74 | — | — | 140 | 43 | 183 | |||||||||||||||||||||||||||||||||||||||||||
| Principal investments |
1 | — | — | — | — | — | — | 3 | — | — | 4 | 1,387 | 1,391 | |||||||||||||||||||||||||||||||||||||||||||
| Derivative Receivables and Related Assets |
— | 154 | 0 | 4 | 0 | — | — | — | — | 27 | 185 | 1 | 186 | |||||||||||||||||||||||||||||||||||||||||||
|
|
|
|
|
|
|
|
|
|
|
|
|
|
|
|
|
|
|
|
|
|
|
|
|
|
|
|||||||||||||||||||||||||||||||
| Total Financial instruments and other inventory positions |
129 | 154 | 0 | 4 | 0 | — | — | 302 | — | 27 | 616 | 1,834 | 2,450 | |||||||||||||||||||||||||||||||||||||||||||
| Subrogated Receivables from Affiliates and Third Parties |
1,989 | — | — | — | — | — | — | — | — | — | 1,989 | — | 1,989 | |||||||||||||||||||||||||||||||||||||||||||
| Receivables from Debtors and Debtor-Controlled Entities and other assets |
620 | 890 | 0 | 220 | 572 | 210 | 0 | 349 | 1 | 7 | 2,868 | 643 | 3,512 | |||||||||||||||||||||||||||||||||||||||||||
| Investments in Affiliates |
(27,273 | ) | 183 | — | — | — | — | — | 405 | — | (189 | ) | (26,874 | ) | (22,480 | ) | (49,354 | ) | ||||||||||||||||||||||||||||||||||||||
| Due from Affiliates: |
||||||||||||||||||||||||||||||||||||||||||||||||||||||||
| Debtors and Debtor-Controlled Entities |
28,943 | 508 | 302 | 15 | 0 | — | 1 | 5,022 | 0 | 389 | 35,181 | 4,398 | 39,579 | |||||||||||||||||||||||||||||||||||||||||||
| Non-Controlled Affiliates |
19,945 | 1,302 | 131 | 306 | — | 0 | 0 | 138 | — | 18 | 21,841 | 1,504 | 23,345 | |||||||||||||||||||||||||||||||||||||||||||
|
|
|
|
|
|
|
|
|
|
|
|
|
|
|
|
|
|
|
|
|
|
|
|
|
|
|
|||||||||||||||||||||||||||||||
| Total Due from Affiliates |
48,889 | 1,810 | 433 | 322 | 0 | 0 | 1 | 5,160 | 0 | 407 | 57,022 | 5,902 | 62,924 | |||||||||||||||||||||||||||||||||||||||||||
|
|
|
|
|
|
|
|
|
|
|
|
|
|
|
|
|
|
|
|
|
|
|
|
|
|
|
|||||||||||||||||||||||||||||||
| Total Assets |
$ | 28,032 | $ | 4,110 | $ | 533 | $ | 634 | $ | 577 | $ | 232 | $ | 174 | $ | 6,262 | $ | 2 | $ | 476 | $ | 41,034 | $ | (13,707 | ) | $ | 27,326 | |||||||||||||||||||||||||||||
|
|
|
|
|
|
|
|
|
|
|
|
|
|
|
|
|
|
|
|
|
|
|
|
|
|
|
|||||||||||||||||||||||||||||||
| Liabilities and Stockholders’ Equity Liabilities |
||||||||||||||||||||||||||||||||||||||||||||||||||||||||
| Payables to Debtors and Debtor-Controlled Entities and other liabilities |
$ | 2,306 | $ | 19 | $ | 1 | $ | 1 | $ | 1 | $ | 0 | $ | 0 | $ | 476 | $ | 0 | $ | 17 | $ | 2,821 | $ | 662 | $ | 3,483 | ||||||||||||||||||||||||||||||
| Due to Affiliates: |
||||||||||||||||||||||||||||||||||||||||||||||||||||||||
| Debtor-Controlled Entities |
— | — | — | — | — | — | — | 0 | — | — | 0 | 12,616 | 12,616 | |||||||||||||||||||||||||||||||||||||||||||
| Non-Controlled Affiliates |
— | — | — | — | — | — | — | — | — | — | — | 567 | 567 | |||||||||||||||||||||||||||||||||||||||||||
|
|
|
|
|
|
|
|
|
|
|
|
|
|
|
|
|
|
|
|
|
|
|
|
|
|
|
|||||||||||||||||||||||||||||||
| Total Due to Affiliates |
— | — | — | — | — | — | — | 0 | — | — | 0 | 13,183 | 13,183 | |||||||||||||||||||||||||||||||||||||||||||
| Secured Claims Payable to Third Parties |
2,036 | — | — | — | — | — | — | — | — | — | 2,036 | — | 2,036 | |||||||||||||||||||||||||||||||||||||||||||
| Taxes Payable |
389 | (188 | ) | (22 | ) | (6 | ) | 37 | (13 | ) | 1 | 25 | — | (2 | ) | 221 | 93 | 314 | ||||||||||||||||||||||||||||||||||||||
| Liabilities Subject to Compromise |
165,287 | 26,290 | 373 | 334 | 77 | 0 | 4 | 6,395 | 173 | 747 | 199,679 | 0 | 199,679 | |||||||||||||||||||||||||||||||||||||||||||
|
|
|
|
|
|
|
|
|
|
|
|
|
|
|
|
|
|
|
|
|
|
|
|
|
|
|
|||||||||||||||||||||||||||||||
| Total Liabilities |
170,018 | 26,121 | 352 | 328 | 115 | (12 | ) | 6 | 6,896 | 173 | 761 | 204,757 | 13,939 | 218,696 | ||||||||||||||||||||||||||||||||||||||||||
| Stockholders’ Equity |
(141,986 | ) | (22,010 | ) | 181 | 306 | 462 | 244 | 168 | (634 | ) | (171 | ) | (285 | ) | (163,723 | ) | (27,646 | ) | (191,369 | ) | |||||||||||||||||||||||||||||||||||
|
|
|
|
|
|
|
|
|
|
|
|
|
|
|
|
|
|
|
|
|
|
|
|
|
|
|
|||||||||||||||||||||||||||||||
| Total Liabilities and Stockholders’ Equity |
$ | 28,032 | $ | 4,110 | $ | 533 | $ | 634 | $ | 577 | $ | 232 | $ | 174 | $ | 6,262 | $ | 2 | $ | 476 | $ | 41,034 | $ | (13,707 | ) | $ | 27,326 | |||||||||||||||||||||||||||||
|
|
|
|
|
|
|
|
|
|
|
|
|
|
|
|
|
|
|
|
|
|
|
|
|
|
|
|||||||||||||||||||||||||||||||
|
|
|
|
|
|
|
|||||||||||||||||||||||||||||||||||||||||||||||||||
See accompanying Notes to Balance Sheets
Note: All values that are exactly zero are shown as “—”. Values between zero and $ 500,000 appear as “0”.
| (1) | Balances for Debtors do not reflect the impact of eliminations of intercompany balances and investments in subsidiaries. |
| (2) | Certain Other Debtor’s Balance Sheets are presented on page 34. |
| (3) | Certain Debtor-Controlled Entities’ Balance Sheets are presented on page 35. |
|
|
Page 33 |
|
Quarterly Financial Report as of October 1, 2015 (Unaudited)
LEHMAN BROTHERS HOLDINGS INC. and Other Debtors and Debtor-Controlled Entities
Balance Sheets As of October 1, 2015 (Certain Other Debtors)
(Unaudited)
| ($ in millions) |
LB 745 LLC 08-13600 |
CES Aviation LLC 08-13905 |
CES Aviation V 08-13906 |
CES Aviation IX 08-13907 |
Structured Asset Securities Corporation 09-10558 |
East Dover Ltd 08-13908 |
Lehman Scottish Finance LP 08-13904 |
LB Rose Ranch LLC 09-10560 |
LB 2080 Kalakaua Owners LLC 09-12516 |
BNC Mortgage LLC 09-10137 |
LB Somerset LLC 09-17503 |
LB Preferred Somerset LLC 09-17505 |
PAMI Statler Arms LLC 08-13664 |
MERIT LLC 09-17331 |
Other Debtors (1) |
|||||||||||||||||||||||||||||||||||||||||||||
| Assets |
||||||||||||||||||||||||||||||||||||||||||||||||||||||||||||
| Cash and short-term investments |
$ | 51 | $ | 4 | $ | — | $ | — | $ | 0 | $ | (0 | ) | $ | 0 | $ | (1 | ) | $ | (0 | ) | $ | 13 | $ | — | $ | — | $ | 0 | $ | 5 | $ | 72 | |||||||||||||||||||||||||||
| Cash and short-term investments pledged or restricted |
0 | 1 | 1 | 1 | 140 | 0 | 2 | 1 | — | 3 | — | — | — | 4 | 152 | |||||||||||||||||||||||||||||||||||||||||||||
| Financial instruments and other inventory positions: |
||||||||||||||||||||||||||||||||||||||||||||||||||||||||||||
| Commercial Real Estate |
— | — | — | — | — | — | — | — | — | — | — | — | — | — | — | |||||||||||||||||||||||||||||||||||||||||||||
| Loans and Residential Real Estate |
— | — | — | — | — | — | — | — | — | — | — | — | — | — | — | |||||||||||||||||||||||||||||||||||||||||||||
| Principal investments |
— | — | — | — | — | — | — | — | — | — | — | — | — | — | — | |||||||||||||||||||||||||||||||||||||||||||||
| Derivative Receivables and Related Assets |
— | — | — | — | — | — | — | — | — | — | — | — | — | 27 | 27 | |||||||||||||||||||||||||||||||||||||||||||||
|
|
|
|
|
|
|
|
|
|
|
|
|
|
|
|
|
|
|
|
|
|
|
|
|
|
|
|
|
|
|
|||||||||||||||||||||||||||||||
| Total Financial instruments and other inventory positions |
— | — | — | — | — | — | — | — | — | — | — | — | — | 27 | 27 | |||||||||||||||||||||||||||||||||||||||||||||
| Subrogated Receivables from Affiliates and Third Parties |
— | — | — | — | — | — | — | — | — | — | — | — | — | — | — | |||||||||||||||||||||||||||||||||||||||||||||
| Receivables from Debtors and Debtor-Controlled Entities and other assets |
— | — | — | — | 0 | 4 | — | 4 | 0 | — | — | 0 | — | — | 7 | |||||||||||||||||||||||||||||||||||||||||||||
| Investments in Affiliates |
— | — | — | — | — | — | (189 | ) | — | — | — | — | — | — | — | (189 | ) | |||||||||||||||||||||||||||||||||||||||||||
| Due from Affiliates: |
||||||||||||||||||||||||||||||||||||||||||||||||||||||||||||
| Debtors and Debtor-Controlled Entities |
138 | — | 0 | — | 154 | — | 67 | — | — | 1 | — | — | — | 28 | 389 | |||||||||||||||||||||||||||||||||||||||||||||
| Non-Controlled Affiliates |
0 | — | — | — | — | — | — | — | — | — | — | — | — | 17 | 18 | |||||||||||||||||||||||||||||||||||||||||||||
|
|
|
|
|
|
|
|
|
|
|
|
|
|
|
|
|
|
|
|
|
|
|
|
|
|
|
|
|
|
|
|||||||||||||||||||||||||||||||
| Total Due from Affiliates |
139 | — | 0 | — | 154 | — | 67 | — | — | 1 | — | — | — | 45 | 407 | |||||||||||||||||||||||||||||||||||||||||||||
|
|
|
|
|
|
|
|
|
|
|
|
|
|
|
|
|
|
|
|
|
|
|
|
|
|
|
|
|
|
|
|||||||||||||||||||||||||||||||
| Total Assets |
$ | 190 | $ | 5 | $ | 1 | $ | 1 | $ | 294 | $ | 4 | $ | (121 | ) | $ | 4 | $ | 0 | $ | 17 | $ | — | $ | 0 | $ | 0 | $ | 80 | $ | 476 | |||||||||||||||||||||||||||||
|
|
|
|
|
|
|
|
|
|
|
|
|
|
|
|
|
|
|
|
|
|
|
|
|
|
|
|
|
|
|
|||||||||||||||||||||||||||||||
| Liabilities and Stockholders’ Equity Liabilities |
||||||||||||||||||||||||||||||||||||||||||||||||||||||||||||
| Payables to Debtors and Debtor-Controlled Entities and other liabilities |
$ | 0 | $ | 1 | $ | 1 | $ | 1 | $ | 4 | $ | 0 | $ | 2 | $ | 1 | $ | 0 | $ | 3 | $ | 0 | $ | 0 | $ | 0 | $ | 4 | $ | 17 | ||||||||||||||||||||||||||||||
| Due to Affiliates: |
||||||||||||||||||||||||||||||||||||||||||||||||||||||||||||
| Debtor-Controlled Entities |
— | — | — | — | — | — | — | — | — | — | — | — | — | — | — | |||||||||||||||||||||||||||||||||||||||||||||
| Non-Controlled Affiliates |
— | — | — | — | — | — | — | — | — | — | — | — | — | — | — | |||||||||||||||||||||||||||||||||||||||||||||
|
|
|
|
|
|
|
|
|
|
|
|
|
|
|
|
|
|
|
|
|
|
|
|
|
|
|
|
|
|
|
|||||||||||||||||||||||||||||||
| Total Due to Affiliates |
— | — | — | — | — | — | — | — | — | — | — | — | — | — | — | |||||||||||||||||||||||||||||||||||||||||||||
| Secured Claims Payable to Third Parties |
— | — | — | — | — | — | — | — | — | — | — | — | — | — | — | |||||||||||||||||||||||||||||||||||||||||||||
| Taxes Payable |
— | — | — | — | (2 | ) | — | — | — | (0 | ) | (0 | ) | — | — | — | — | (2 | ) | |||||||||||||||||||||||||||||||||||||||||
| Liabilities Subject to Compromise |
0 | — | 4 | 3 | 412 | 2 | — | 2 | 32 | 5 | 7 | 10 | — | 270 | 747 | |||||||||||||||||||||||||||||||||||||||||||||
|
|
|
|
|
|
|
|
|
|
|
|
|
|
|
|
|
|
|
|
|
|
|
|
|
|
|
|
|
|
|
|||||||||||||||||||||||||||||||
| Total Liabilities |
0 | 1 | 5 | 4 | 413 | 3 | 2 | 3 | 32 | 7 | 8 | 10 | 0 | 274 | 761 | |||||||||||||||||||||||||||||||||||||||||||||
| Stockholders’ Equity |
190 | 4 | (4 | ) | (3 | ) | (119 | ) | 1 | (122 | ) | 1 | (31 | ) | 10 | (8 | ) | (10 | ) | 0 | (193 | ) | (285 | ) | ||||||||||||||||||||||||||||||||||||
|
|
|
|
|
|
|
|
|
|
|
|
|
|
|
|
|
|
|
|
|
|
|
|
|
|
|
|
|
|
|
|||||||||||||||||||||||||||||||
| Total Liabilities and Stockholders’ Equity |
$ | 190 | $ | 5 | $ | 1 | $ | 1 | $ | 294 | $ | 4 | $ | (121 | ) | $ | 4 | $ | 0 | $ | 17 | $ | — | $ | 0 | $ | 0 | $ | 80 | $ | 476 | |||||||||||||||||||||||||||||
|
|
|
|
|
|
|
|
|
|
|
|
|
|
|
|
|
|
|
|
|
|
|
|
|
|
|
|
|
|
|
|||||||||||||||||||||||||||||||
|
|
|
|||||||||||||||||||||||||||||||||||||||||||||||||||||||||||
See accompanying Notes to Balance Sheets
Note: All values that are exactly zero are shown as “—”. Values between zero and $500,000 appear as “0”.
| (1) | Balances for Debtors do not reflect the impact of eliminations of intercompany balances and investments in subsidiaries. |
|
|
Page 34 |
|
Quarterly Financial Report as of October 1, 2015 (Unaudited)
LEHMAN BROTHERS HOLDINGS INC. and NON DEBTOR ENTITIES
Balance Sheets As of October 1, 2015 (Debtor-Controlled Entities)
(Unaudited)
| ($ in millions) |
Lehman ALI Inc. (2) |
Property Asset Management Inc. (3) |
LB I Group Inc. (3) |
Lehman Brothers Bancorp Inc. (3) |
PAMI Holdings LLC |
314 Common- wealth Ave Inc. (3) |
LB U.K. Holdings (Delaware) Inc. |
PAMI ALI LLC |
Lux Finance Sarl |
Other Debtor- Controlled Entities |
Debtor - Controlled Group Elims (1) |
Total Debtor- Controlled Entities |
||||||||||||||||||||||||||||||||||||
| Assets |
||||||||||||||||||||||||||||||||||||||||||||||||
| Cash and short-term investments |
$ | 42 | $ | 1 | $ | 20 | $ | 96 | $ | 6 | $ | 0 | $ | 5 | $ | 2 | $ | 1 | $ | 143 | $ | — | $ | 316 | ||||||||||||||||||||||||
| Cash and short-term investments pledged or restricted |
2 | 5 | 0 | 2 | 4 | — | — | 10 | — | 54 | — | 77 | ||||||||||||||||||||||||||||||||||||
| Financial instruments and other inventory positions: |
||||||||||||||||||||||||||||||||||||||||||||||||
| Commercial Real Estate |
(12 | ) | 134 | — | 0 | 225 | (0 | ) | (0 | ) | 29 | — | 28 | — | 403 | |||||||||||||||||||||||||||||||||
| Loans and Residential Real Estate |
42 | 0 | 1 | 0 | — | — | — | — | — | — | — | 43 | ||||||||||||||||||||||||||||||||||||
| Principal investments |
0 | — | 1,078 | — | — | — | (0 | ) | 1 | — | 307 | — | 1,387 | |||||||||||||||||||||||||||||||||||
| Derivative Receivables and Related Assets |
— | — | — | — | — | — | — | — | — | 1 | — | 1 | ||||||||||||||||||||||||||||||||||||
|
|
|
|
|
|
|
|
|
|
|
|
|
|
|
|
|
|
|
|
|
|
|
|
|
|||||||||||||||||||||||||
| Total Financial instruments and other inventory positions |
30 | 134 | 1,079 | 0 | 225 | (0 | ) | (0 | ) | 30 | — | 337 | — | 1,834 | ||||||||||||||||||||||||||||||||||
| Subrogated Receivables from Affiliates and Third Parties |
— | — | — | — | — | — | — | — | — | — | — | — | ||||||||||||||||||||||||||||||||||||
| Receivables from Debtors and Debtor-Controlled Entities and other assets |
215 | 0 | 32 | 76 | 0 | 91 | 76 | 26 | — | 267 | (141 | ) | 643 | |||||||||||||||||||||||||||||||||||
| Investments in Affiliates |
(26,932 | ) | 1 | 0 | 10 | — | (85 | ) | 57 | (217 | ) | — | (108 | ) | 4,795 | (22,480 | ) | |||||||||||||||||||||||||||||||
| Due from Affiliates: |
||||||||||||||||||||||||||||||||||||||||||||||||
| Debtors and Debtor-Controlled Entities |
3,331 | 0 | 554 | — | — | 178 | 899 | 698 | — | 1,551 | (2,813 | ) | 4,398 | |||||||||||||||||||||||||||||||||||
| Non-Controlled Affiliates |
0 | 0 | 1 | 1 | — | 15 | 383 | 32 | 749 | 323 | — | 1,504 | ||||||||||||||||||||||||||||||||||||
|
|
|
|
|
|
|
|
|
|
|
|
|
|
|
|
|
|
|
|
|
|
|
|
|
|||||||||||||||||||||||||
| Total Due from Affiliates |
3,332 | 0 | 554 | 1 | — | 193 | 1,281 | 731 | 749 | 1,873 | (2,813 | ) | 5,902 | |||||||||||||||||||||||||||||||||||
|
|
|
|
|
|
|
|
|
|
|
|
|
|
|
|
|
|
|
|
|
|
|
|
|
|||||||||||||||||||||||||
| Total Assets |
$ | (23,311 | ) | $ | 141 | $ | 1,685 | $ | 185 | $ | 235 | $ | 199 | $ | 1,420 | $ | 582 | $ | 750 | $ | 2,566 | $ | 1,841 | $ | (13,707 | ) | ||||||||||||||||||||||
|
|
|
|
|
|
|
|
|
|
|
|
|
|
|
|
|
|
|
|
|
|
|
|
|
|||||||||||||||||||||||||
| Liabilities and Stockholders’ Equity Liabilities |
||||||||||||||||||||||||||||||||||||||||||||||||
| Payables to Debtors and Debtor-Controlled Entities and other liabilities |
$ | 40 | $ | 5 | $ | 304 | $ | 65 | $ | 2 | $ | 0 | $ | 22 | $ | 77 | $ | — | $ | 289 | $ | (140 | ) | $ | 662 | |||||||||||||||||||||||
| Due to Affiliates: |
||||||||||||||||||||||||||||||||||||||||||||||||
| Debtor-Controlled Entities |
3,153 | — | 3,400 | 71 | — | 925 | 929 | 3,138 | 939 | 2,874 | (2,813 | ) | 12,616 | |||||||||||||||||||||||||||||||||||
| Non-Controlled Affiliates |
1 | — | 32 | 14 | — | — | 79 | 8 | — | 432 | — | 567 | ||||||||||||||||||||||||||||||||||||
|
|
|
|
|
|
|
|
|
|
|
|
|
|
|
|
|
|
|
|
|
|
|
|
|
|||||||||||||||||||||||||
| Total Due to Affiliates |
3,154 | — | 3,432 | 86 | — | 925 | 1,009 | 3,146 | 939 | 3,306 | (2,813 | ) | 13,183 | |||||||||||||||||||||||||||||||||||
| Secured Claims Payable to Third Parties |
— | — | — | — | — | — | — | — | — | — | — | — | ||||||||||||||||||||||||||||||||||||
| Taxes Payable |
68 | — | 5 | — | — | 10 | (18 | ) | 27 | — | — | — | 93 | |||||||||||||||||||||||||||||||||||
| Liabilities Subject to Compromise |
— | — | — | — | — | — | — | — | — | 0 | — | 0 | ||||||||||||||||||||||||||||||||||||
|
|
|
|
|
|
|
|
|
|
|
|
|
|
|
|
|
|
|
|
|
|
|
|
|
|||||||||||||||||||||||||
| Total Liabilities |
3,263 | 5 | 3,741 | 150 | 2 | 935 | 1,013 | 3,250 | 939 | 3,595 | (2,953 | ) | 13,939 | |||||||||||||||||||||||||||||||||||
| Stockholders’ Equity |
(26,574 | ) | 137 | (2,056 | ) | 35 | 233 | (736 | ) | 407 | (2,668 | ) | (189 | ) | (1,028 | ) | 4,795 | (27,646 | ) | |||||||||||||||||||||||||||||
|
|
|
|
|
|
|
|
|
|
|
|
|
|
|
|
|
|
|
|
|
|
|
|
|
|||||||||||||||||||||||||
| Total Liabilities and Stockholders’ Equity |
$ | (23,311 | ) | $ | 141 | $ | 1,685 | $ | 185 | $ | 235 | $ | 199 | $ | 1,420 | $ | 582 | $ | 750 | $ | 2,566 | $ | 1,841 | $ | (13,707 | ) | ||||||||||||||||||||||
|
|
|
|
|
|
|
|
|
|
|
|
|
|
|
|
|
|
|
|
|
|
|
|
|
|||||||||||||||||||||||||
|
|
|
|||||||||||||||||||||||||||||||||||||||||||||||
See accompanying Notes to Balance Sheets
Note: All values that are exactly zero are shown as “—”. Values between zero and $ 500,000 appear as “0”.
| (1) | Balances reflect the impact of eliminations of (i) intercompany balances only between Debtor-Controlled Entities and (ii) investments in subsidiaries only between Debtor-Controlled Entities. |
| (2) | Lehman Ali Inc is reflected on a consolidated basis excluding wholly owned subsidiaries that are Debtor entities, 314 Commonwealth Ave Inc, and Pami ALI LLC. |
| (3) | Entities are reflected on a consolidated basis, e.g. Property Asset Management Inc. includes its wholly owned subsidiary, Orbit RE LLC. |
|
|
Page 35 |
|
Quarterly Financial Report as of October 1, 2015 (Unaudited)
IV. Accompanying Schedules
Commercial Real Estate – by Product Type (1)
| $ in millions |
Lehman Brothers Holdings Inc. |
Lehman Commercial Paper Inc. |
Total Debtor Entities |
Property Asset Management Inc. |
PAMI Holdings LLC |
Other Debtor- Controlled Entities |
Total LBHI Controlled Entities |
Cost and Unpaid Principal Balances (2) |
||||||||||||||||||||||||||
| Commercial Real Estate |
||||||||||||||||||||||||||||||||||
| North America |
||||||||||||||||||||||||||||||||||
| Whole loans |
||||||||||||||||||||||||||||||||||
| Senior |
$ | 0 | $ | 28 | $ | 28 | $ | — | $ | — | $ | — | $ | 28 | $ | 35 | ||||||||||||||||||
| Equity |
— | — | — | 50 | 103 | 18 | 171 | 346 | ||||||||||||||||||||||||||
| Real Estate Owned and Other |
46 | 62 | 108 | 84 | 122 | 13 | 327 | 1,195 | ||||||||||||||||||||||||||
|
|
|
|
|
|
|
|
|
|
|
|
|
|
|
|
|
|||||||||||||||||||
| Subtotal |
46 | 89 | 136 | 134 | 225 | 31 | 525 | 1,576 | ||||||||||||||||||||||||||
| Europe |
||||||||||||||||||||||||||||||||||
| Whole loans |
||||||||||||||||||||||||||||||||||
| B-notes/Mezzanine |
— | 79 | 79 | — | — | — | 79 | 169 | ||||||||||||||||||||||||||
| Equity |
— | 57 | 57 | — | — | 13 | 70 | 178 | ||||||||||||||||||||||||||
| Other |
14 | — | 14 | — | — | 1 | 15 | 6 | ||||||||||||||||||||||||||
|
|
|
|
|
|
|
|
|
|
|
|
|
|
|
|
|
|||||||||||||||||||
| Subtotal |
14 | 136 | 151 | — | — | 14 | 164 | 353 | ||||||||||||||||||||||||||
|
|
|
|
|
|
|
|
|
|
|
|
|
|
|
|
|
|||||||||||||||||||
| Total Commercial Real Estate |
$ | 61 | $ | 225 | $ | 286 | $ | 134 | $ | 225 | $ | 45 | $ | 690 | $ | 1,929 | ||||||||||||||||||
|
|
|
|
|
|
|
|
|
|
|
|
|
|
|
|
|
|||||||||||||||||||
|
|
|
|
|
|
|
|||||||||||||||||||||||||||||
Notes:
| (1) | Refer to the accompanying Notes to the Balance Sheets for further discussion on valuation and additional disclosures. |
| (2) | Cost information primarily includes: (i) for whole loans and corporate loans, the remaining outstanding principal balance; (ii) for equity, the total acquisition amount net of distributions deemed return of capital; (iii) for REO, the cost/unpaid principal balance as determined in (i) or (ii) as of the date of ownership of the property plus or minus principal balance changes subsequent to ownership. There are 6 portfolio investments recorded at zero recovery value with a cost/ unpaid principal balance of approximately $57 million that are not included in the schedule above. |
|
|
Page 36 |
|
Quarterly Financial Report as of October 1, 2015 (Unaudited)
Commercial Real Estate – By Property Type and Region (1)
| $ in millions |
North America |
Europe | Total | Cost and Unpaid Principal Balances (2) |
||||||||||||
| Commercial Real Estate |
||||||||||||||||
| Senior Whole Loans |
||||||||||||||||
| Office/Industrial |
$ | 2 | $ | — | $ | 2 | $ | 3 | ||||||||
| Hotel |
11 | — | 11 | 10 | ||||||||||||
| Land/Other |
14 | — | 14 | 22 | ||||||||||||
|
|
|
|
|
|
|
|
|
|||||||||
| Total Senior Whole Loans by Type |
28 | — | 28 | 35 | ||||||||||||
| B-Note/Mezz Whole Loans |
||||||||||||||||
| Office/Industrial |
— | 79 | 79 | 206 | ||||||||||||
|
|
|
|
|
|
|
|
|
|||||||||
| Total B-Notes/Mezz Whole Loans by Type |
— | 79 | 79 | 206 | ||||||||||||
| Equity |
||||||||||||||||
| Office/Industrial |
33 | 3 | 36 | 25 | ||||||||||||
| Hotel |
— | 10 | 10 | 73 | ||||||||||||
| Multi-family |
8 | — | 8 | 3 | ||||||||||||
| Mixed-use |
— | 57 | 57 | 68 | ||||||||||||
| Condominium |
86 | — | 86 | 234 | ||||||||||||
| Land/Other |
44 | — | 44 | 85 | ||||||||||||
|
|
|
|
|
|
|
|
|
|||||||||
| Total Equity by Type |
171 | 70 | 240 | 488 | ||||||||||||
| Real Estate Owned |
||||||||||||||||
| Hotel |
131 | — | 131 | 156 | ||||||||||||
| Land |
173 | — | 173 | 974 | ||||||||||||
| Other |
23 | 15 | 38 | 70 | ||||||||||||
|
|
|
|
|
|
|
|
|
|||||||||
| Total Real Estate Owned by Type |
328 | 15 | 343 | 1,200 | ||||||||||||
|
|
|
|
|
|
|
|
|
|||||||||
| Total Commercial Real Estate |
$ | 526 | $ | 164 | $ | 690 | $ | 1,929 | ||||||||
|
|
|
|
|
|
|
|
|
|||||||||
Notes:
| (1) | Refer to the accompanying Notes to the Balance Sheets for further discussion on valuation and additional disclosures. |
| (2) | Cost information primarily includes: (i) for whole loans and corporate loans, the remaining outstanding principal balance; (ii) for equity, the total acquisition amount net of distributions deemed return of capital; (iii) for REO, the cost/unpaid principal balance as determined in (i) or (ii) as of the date of ownership of the property plus or minus principal balance changes subsequent to ownership. There are 6 portfolio investments recorded at zero recovery value with a cost/ unpaid principal balance of approximately $ 57 million that are not included in the schedule above. |
|
|
Page 37 |
|
Quarterly Financial Report as of October 1, 2015 (Unaudited)
Loans (by Maturity Date) and Residential Real Estate (1)
| $ in millions | Debtor Entities | |||||||||||||||
| Lehman | Debtor - | Total LBHI- | ||||||||||||||
| Lehman Brothers | Commercial | Controlled | Controlled | |||||||||||||
| Maturity Date by Year |
Holdings Inc. | Paper Inc. | Entities | Entities | ||||||||||||
| Notional (2) | ||||||||||||||||
| 2015 |
$ | — | $ | — | $ | 24 | $ | 24 | ||||||||
| 2016 |
3 | — | — | 3 | ||||||||||||
| 2017 and over |
4 | 301 | — | 305 | ||||||||||||
|
|
|
|
|
|
|
|
|
|||||||||
| Subtotal Loans |
7 | 301 | 24 | 332 | ||||||||||||
|
|
|
|
|
|
|
|
|
|||||||||
| Residential Real Estate (3) |
266 | 0 | 56 | 323 | ||||||||||||
|
|
|
|
|
|
|
|
|
|||||||||
| Total Loans and Residential Real Estate |
$ | 273 | $ | 301 | $ | 81 | $ | 655 | ||||||||
|
|
|
|
|
|
|
|
|
|||||||||
| Recovery Value | ||||||||||||||||
| 2015 |
$ | — | $ | — | $ | 23 | $ | 23 | ||||||||
| 2016 |
3 | — | — | 3 | ||||||||||||
| 2017 and over (4) |
1 | 73 | — | 73 | ||||||||||||
|
|
|
|
|
|
|
|
|
|||||||||
| Subtotal Loans |
3 | 73 | 23 | 99 | ||||||||||||
|
|
|
|
|
|
|
|
|
|||||||||
| Equity positions - Loans |
41 | 1 | 1 | 42 | ||||||||||||
| Residential Real Estate |
23 | 0 | 19 | 42 | ||||||||||||
|
|
|
|
|
|
|
|
|
|||||||||
| Total Loans and Residential Real Estate |
$ | 67 | $ | 74 | $ | 43 | $ | 183 | ||||||||
|
|
|
|
|
|
|
|
|
|||||||||
Notes:
| (1) | This schedule reflects loans and residential real estate assets that are included on the Balance Sheets. Refer to the accompanying Notes to the Balance Sheets for further discussion on valuation and additional disclosures. |
| (2) | Represents the remaining outstanding principal balance on only Loans by stated maturity dates. |
| (3) | Cost information primarily represents: (i) for whole loans (RV $0.2 million / Cost $0.3 million), the remaining outstanding or unpaid principal balance; and (ii) for mortgage backed securities (“MBS”) (RV $40.5 million / Cost $ 322.4 million), the initial Class Principal amount. MBS consists of Excess Spread, Residual, Interest-Only and Subordinated tranches. Cost information is not included for legal claims, mortgage servicing rights and MBS with zero recovery value. |
| (4) | Includes approximately $37 million in LCPI related to defaulted securities with past maturity dates. |
|
|
Page 38 |
|
Quarterly Financial Report as of October 1, 2015 (Unaudited)
Private Equity / Principal Investments – by Legal Entity and Product Type
| $ in millions | Total (1) | Assets held for the benefit of LCPI (3) |
Total per Balance Sheets |
|||||||||
| By Legal Entity |
||||||||||||
| Debtors: |
||||||||||||
| Lehman Brothers Holdings Inc. |
$ | 1 | $ | — | $ | 1 | ||||||
| Lehman Commercial Paper Inc. |
303 | (300 | ) | 3 | ||||||||
|
|
|
|
|
|
|
|||||||
| Total Debtors |
304 | (300 | ) | 4 | ||||||||
| Debtor-Controlled: |
||||||||||||
| LB I Group Inc. (2) |
778 | 300 | 1,078 | |||||||||
| Other Debtor-Controlled |
309 | — | 309 | |||||||||
|
|
|
|
|
|
|
|||||||
| Total Debtor-Controlled |
1,087 | 300 | 1,387 | |||||||||
|
|
|
|
|
|
|
|||||||
| Total |
$ | 1,391 | $ | — | $ | 1,391 | ||||||
|
|
|
|
|
|
|
|||||||
| By Product Type |
||||||||||||
| Private Equity / Diversified Funds |
$ | 1,081 | ||||||||||
| Real Estate Funds |
279 | |||||||||||
| Other |
30 | |||||||||||
|
|
|
|||||||||||
| Total |
$ | 1,391 | ||||||||||
|
|
|
|||||||||||
| Investments at cost (4) |
$ | 1,748 | ||||||||||
| Unpaid Principal Balances (5) |
$ | 42 | ||||||||||
Notes:
| (1) | The amounts include the unencumbered assets held by a legal entity and the economic interests in the assets held by another legal entity. Refer to the accompanying Notes to the Balance Sheets for further discussion on valuation and additional disclosures. |
| (2) | LB I Group Inc. (read LB “one” Group Inc.) is a major Debtor-Controlled entity. LB I Group Inc. is presented on a consolidated basis. |
| (3) | “Assets held for the benefit of LCPI” represents a reconciliation of the assets encumbered from LB I Group to LCPI. |
| (4) | Cost information primarily includes: (i) for direct equity investments and hedge funds, the total amount funded net of distributions deemed return of capital; (ii) for partnership interests with no redemptions, the original amount funded; (iii) for partnership interests with redemptions or distributions, the ratio of cost to recovery value for the underlying portfolio assets applied to the Net Asset Value for the Company’s positions; and (iv) value for assets that have been recorded at de minimis recovery value amounts. |
| (5) | Represents the remaining outstanding principal balance on corporate loans. |
|
|
Page 39 |
|
Quarterly Financial Report as of October 1, 2015 (Unaudited)
Derivative Assets and Liabilities (1)
| $ in millions |
Lehman Brothers Holdings Inc. |
LB 745 LLC |
Lehman Brothers Special Financing Inc. |
Lehman Brothers Commodity Services Inc. |
Lehman Brothers OTC Derivatives Inc. |
Lehman Brothers Commercial Corporation |
Lehman Commercial Paper Inc. |
Lehman Brothers Financial Products Inc. |
Lehman Brothers Derivative Products Inc. |
Merit LLC |
Total Debtors |
|||||||||||||||||||||||||||||||||
| Assets - Receivables, Net |
||||||||||||||||||||||||||||||||||||||||||||
| Open |
$ | — | $ | — | $ | 78 | $ | — | $ | — | $ | — | $ | — | $ | — | $ | — | $ | — | $ | 78 | ||||||||||||||||||||||
| Terminated / Matured |
— | — | 43 | 0 | — | 4 | — | — | — | — | 47 | |||||||||||||||||||||||||||||||||
|
|
|
|
|
|
|
|
|
|
|
|
|
|
|
|
|
|
|
|
|
|
|
|||||||||||||||||||||||
| Total |
— | — | 120 | 0 | — | 4 | — | — | — | — | 124 | |||||||||||||||||||||||||||||||||
| Other Derivative Related Assets (2) |
— | — | 34 | — | — | — | — | — | — | 27 | 60 | |||||||||||||||||||||||||||||||||
|
|
|
|
|
|
|
|
|
|
|
|
|
|
|
|
|
|
|
|
|
|
|
|||||||||||||||||||||||
| Total Derivatives and Related Assets |
$ | — | $ | — | $ | 154 | $ | 0 | $ | — | $ | 4 | $ | — | $ | — | $ | — | $ | 27 | $ | 185 | ||||||||||||||||||||||
|
|
|
|
|
|
|
|
|
|
|
|
|
|
|
|
|
|
|
|
|
|
|
|||||||||||||||||||||||
| # of Counterparty contracts |
||||||||||||||||||||||||||||||||||||||||||||
| Open |
— | — | 78 | — | — | — | — | — | — | — | 78 | |||||||||||||||||||||||||||||||||
| Termed / Matured |
— | — | 274 | 1 | 1 | 5 | — | 23 | 2 | — | 306 | |||||||||||||||||||||||||||||||||
|
|
|
|
|
|
|
|
|
|
|
|
|
|
|
|
|
|
|
|
|
|
|
|||||||||||||||||||||||
| Total |
— | — | 352 | 1 | 1 | 5 | — | 23 | 2 | — | 384 | |||||||||||||||||||||||||||||||||
|
|
|
|
|
|
|
|
|
|
|
|
|
|
|
|
|
|
|
|
|
|
|
|||||||||||||||||||||||
| SPV Receivables (3)
|
$
|
—
|
|
$
|
—
|
|
$
|
23
|
|
$
|
—
|
|
$
|
—
|
|
$
|
—
|
|
$
|
—
|
|
$
|
—
|
|
$
|
—
|
|
$
|
—
|
|
$
|
23
|
| |||||||||||
| Liabilities - Payables |
||||||||||||||||||||||||||||||||||||||||||||
| Agreed (4) |
$ | (22 | ) | $ | (2 | ) | $ | (20,162 | ) | $ | (1,347 | ) | $ | (499 | ) | $ | (385 | ) | $ | (39 | ) | $ | (57 | ) | $ | (77 | ) | $ | — | $ | (22,591 | ) | ||||||||||||
| Pending Resolution (5) |
— | — | (2,295 | ) | (49 | ) | (0 | ) | (102 | ) | — | — | (2 | ) | — | (2,449 | ) | |||||||||||||||||||||||||||
|
|
|
|
|
|
|
|
|
|
|
|
|
|
|
|
|
|
|
|
|
|
|
|||||||||||||||||||||||
| Total |
$ | (22 | ) | $ | (2 | ) | $ | (22,457 | ) | $ | (1,397 | ) | $ | (499 | ) | $ | (487 | ) | $ | (39 | ) | $ | (57 | ) | $ | (79 | ) | $ | — | $ | (25,039 | ) | ||||||||||||
|
|
|
|
|
|
|
|
|
|
|
|
|
|
|
|
|
|
|
|
|
|
|
|||||||||||||||||||||||
| # of Counterparty contracts |
4 | 1 | 2,360 | 251 | 161 | 192 | 9 | 14 | 93 | — | 3,085 | |||||||||||||||||||||||||||||||||
Notes:
| (1) | Refer to the accompanying Notes to the Balance Sheets for further discussion regarding derivative amounts recorded. Derivatives liabilities are presented prior to distributions on allowed claims. |
| (2) | Amounts primarily include notes in various special purpose vehicles, deposits with various brokers for OTC hedges and equity positions in various corporations. |
| (3) | Represents the portion of derivatives receivables resulting from transactions with counterparties deemed as special purpose vehicles including receivables from entities that structurally subordinate the rights of the Debtor. |
| (4) | Agreed is defined as claims that are recorded at values agreed upon with counterparties and classified as allowed or accepted as filed. |
| (5) | Pending Resolution are recorded at expected claim amounts estimated by the Company. |
|
|
Page 40 |
|
Quarterly Financial Report as of October 1, 2015 (Unaudited)
Significant Restructurings, Settlements, Sales, Wind-down, or Liquidations
July 1, 2015 – October 1, 2015
| $ millions |
Cash Collected |
Post-Seventh Distribution Cash Flow Estimates (1) |
6/30/2015 Balance Sheets Value (2) |
Realized Gain / (Loss) Relative to Post Seventh Distribution Cash Flow Estimate |
Realized Gain / (Loss) Relative to 6/30/15 Balance Sheets Value |
|||||||||||||||
| Loans and Residential Real Estate |
||||||||||||||||||||
| Other Loans |
$ | 20 | $ | 17 | $ | 20 | $ | 3 | $ | 0 | ||||||||||
| Other Residential Real Estate |
4 | 0 | 0 | 4 | 4 | |||||||||||||||
|
|
|
|
|
|
|
|
|
|
|
|||||||||||
| Total Loans and Residential Real Estate |
$ | 24 | $ | 17 | $ | 20 | $ | 6 | $ | 4 | ||||||||||
|
|
|
|
|
|
|
|
|
|
|
|||||||||||
| Private Equity / Principal Investments |
||||||||||||||||||||
| Peroleum Realty Investment Partners |
$ | 41 | $ | 32 | $ | 32 | $ | 9 | $ | 9 | ||||||||||
| Other Direct sales |
7 | 7 | 6 | — | 1 | |||||||||||||||
| GP and LP Stakes in PE and Hedge Funds |
10 | 10 | 10 | — | — | |||||||||||||||
|
|
|
|
|
|
|
|
|
|
|
|||||||||||
| Total Private Equity / Principal Investments |
$ | 58 | $ | 49 | $ | 48 | $ | 9 | $ | 10 | ||||||||||
|
|
|
|
|
|
|
|
|
|
|
|||||||||||
| Derivatives |
||||||||||||||||||||
| Other sales |
$ | 92 | $ | 73 | $ | 87 | $ | 19 | $ | 5 | ||||||||||
|
|
|
|
|
|
|
|
|
|
|
|||||||||||
| Total Derivatives |
$ | 92 | $ | 73 | $ | 87 | $ | 19 | $ | 5 | ||||||||||
|
|
|
|
|
|
|
|
|
|
|
|||||||||||
| Real Estate |
||||||||||||||||||||
| Other sales |
$ | 118 | $ | 104 | $ | 108 | $ | 13 | $ | 10 | ||||||||||
|
|
|
|
|
|
|
|
|
|
|
|||||||||||
| Total Real Estate |
$ | 118 | $ | 104 | $ | 108 | $ | 13 | $ | 10 | ||||||||||
|
|
|
|
|
|
|
|
|
|
|
|||||||||||
| Total Significant Monetizations |
$ | 292 | $ | 244 | $ | 262 | $ | 48 | $ | 29 | ||||||||||
|
|
|
|
|
|
|
|
|
|
|
|||||||||||
All values that are exactly zero are shown as “-”. Values between zero and $0.5 million appear as “0”. Totals may not foot due to rounding.
| (1) | Represents estimated recoveries reflected in the Post Seventh Distribution Cash Flow Estimates for the asset. |
| (2) | Represents the recorded value reported on the prior period Balance Sheets (as of June 30, 2015) for the asset. |
|
|
Page 41 |
|
Quarterly Financial Report as of October 1, 2015 (Unaudited)
V. Post-Eighth Distribution Cash Flow Estimates
Table of Contents
| A. | Basis of Presentation | 43 | ||||
| B. | Highlights | 46 | ||||
| C. | Summary – Post-D8 Cash Flow Estimates | 47 | ||||
| D. | Recoveries from Non-Controlled Affiliates | 48 | ||||
| E. | Operating Expenses | 50 | ||||
| F. | Post-D8 Cash Flow Estimates | 52 | ||||
|
|
Page 42 |
|
Quarterly Financial Report as of October 1, 2015 (Unaudited)
A. Basis of Presentation
|
|
Page 43 |
|
Quarterly Financial Report as of October 1, 2015 (Unaudited)
Key Assumptions (continued)
|
|
Page 44 |
|
Quarterly Financial Report as of October 1, 2015 (Unaudited)
Presentation Differences
|
|
Page 45 |
|
Quarterly Financial Report as of October 1, 2015 (Unaudited)
B. Highlights
Estimated Recoveries
Total estimates of aggregate gross recoveries, before operating disbursements and payments in satisfaction of secured, priority, administrative and unsecured claims of Debtors and liabilities of Debtor-Controlled Entities, increased by $0.5 billion to $96.0 billion in the Post-D8 Cash Flow Estimates as compared to $95.5 billion in the Post-D7 CFE(3). Net of operating disbursements, total estimated net recoveries increased by $0.5 billion to $92.4 billion(3). This increase in the Company’s estimated recoveries was primarily driven by increases in estimated recoveries from Non-Controlled Affiliates in Europe and Asia.
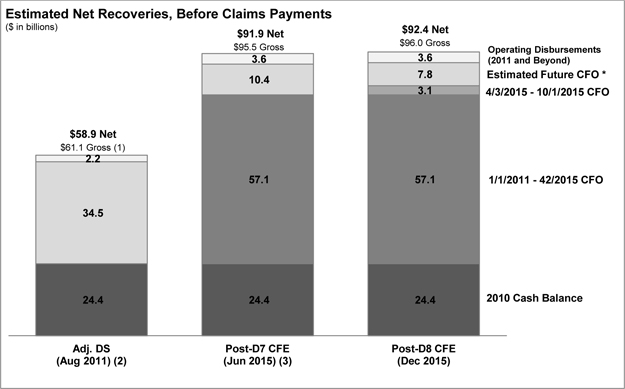
| (*) | CFO refers to Cash From Operations |
| (1) | Refer to the “Responses to Questions Received From Creditors” posted to www.lehman-docket.com on October 30, 2014, for a reconciliation of these figures. |
| (2) | Estimates included in DS Exhibit 7, adjusted for certain Presentation Adjustments (refer to the 2012+ CFE for further information). |
| (3) | For ease of comparison, Estimated Future CFO for the Post-D7 CFE has been adjusted to reflect the exclusion of estimated recoveries of $226 million from assigned intercompany claims related to LBSN (refer to Note 9 in the Notes to the Balance Sheets), as these recoveries are excluded from the Post-D8 Cash Flow Estimates. |
|
|
Page 46 |
|
Quarterly Financial Report as of October 1, 2015 (Unaudited)
C. Summary – Post-D8 Cash Flow Estimates
The Company estimates that Total Post-D8 Cash From Operations will be $7.8 billion, an increase in estimates of $0.5 billion compared to estimates presented in the Post-D7 CFE. This increase is driven by a $462 million increase in estimated recoveries from Non-Controlled Affiliates, primarily in Europe and Asia, as well as increased estimates for certain assets in the Loans and Private Equity / Principal Investments portfolios.
These increases were partially offset by (i) a $50 million reduction in estimates for the Commercial Real Estate portfolio, driven by market-related adjustments to certain land assets, (ii) a $29 million reduction in Other, driven by variation margin paid as part of the Company’s foreign currency hedging program due to the strengthening of British Pound and Euro versus the US Dollar, and (iii) a $32 million increase in Operating Expenses, largely driven by anticipated increases in resources required for the Company’s litigation activities as well as increased estimates for formula-driven Incentive Fees.
Cash activities between the seventh Plan distribution (“D7”) and D8 included (i) the collection of $2.0 billion of recoveries from Non-Controlled Affiliates, driven by recoveries from LBAH, LB Bankhaus, and the monetization of claims against Lehman Brothers Inc., and (ii) the monetization of inventory of $1.3 billion, primarily in the Private Equity/Principal Investments and Commercial Real Estate portfolios, partially offset by (iii) operating expenses of $135 million, including professional fees related to the Company’s claims mitigation and litigation activities.
Of the $2.7 billion of Estimated Net Receipts remaining Post-D8, the Company anticipates that over 75% will be collected by the end of 2016.
| Post-D7 | Less: | Transfers, | Post-D8 | |||||||||||||||||
| ($ in millions) | Cash Flow | Cash Activity | Recovery Value | Reclassifications, | Cash Flow | |||||||||||||||
| Estimates | 4/2/15-10/1/15 | Change | Adjustments (a) | Estimates | ||||||||||||||||
| Net Receipts |
||||||||||||||||||||
| Commercial Real Estate |
$ | 1,144 | $ | (404 | ) | $ | (50 | ) | $ | — | $ | 690 | ||||||||
| Loans (Corporate & Residential) |
181 | (47 | ) | 49 | — | 183 | ||||||||||||||
| Private Equity / Principal Investments |
1,985 | (632 | ) | 38 | — | 1,392 | ||||||||||||||
| Derivatives |
341 | (171 | ) | 16 | — | 186 | ||||||||||||||
| Other |
268 | (11 | ) | (29 | ) | 18 | 246 | |||||||||||||
|
|
|
|
|
|
|
|
|
|
|
|||||||||||
| Sub-Total - Net Receipts |
$ | 3,918 | $ | (1,264 | ) | $ | 24 | $ | 18 | $ | 2,696 | |||||||||
| Recoveries From Non-Controlled Affiliates |
||||||||||||||||||||
| Europe |
$ | 5,242 | $ | (978 | ) | $ | 254 | $ | (244 | ) | $ | 4,275 | ||||||||
| Asia |
2,143 | (692 | ) | 204 | — | 1,654 | ||||||||||||||
| LBI |
295 | (299 | ) | 4 | — | 0 | ||||||||||||||
|
|
|
|
|
|
|
|
|
|
|
|||||||||||
| Sub-Total - Recoveries From Non-Controlled Affiliates |
$ | 7,680 | $ | (1,969 | ) | $ | 462 | $ | (244 | ) | $ | 5,930 | ||||||||
| Operating Expenses |
||||||||||||||||||||
| Professional Fees |
$ | (390 | ) | $ | 75 | $ | (19 | ) | $ | — | $ | (334 | ) | |||||||
| Compensation & Benefits |
(252 | ) | 30 | (6 | ) | — | (228 | ) | ||||||||||||
| Incentive Fees |
(168 | ) | 11 | (6 | ) | — | (163 | ) | ||||||||||||
| Other Administrative Expenses |
(113 | ) | 20 | (1 | ) | — | (94 | ) | ||||||||||||
|
|
|
|
|
|
|
|
|
|
|
|||||||||||
| Sub-Total - Operating Expenses |
$ | (922 | ) | $ | 135 | $ | (32 | ) | $ | — | $ | (819 | ) | |||||||
| Total Cash From Operations (CFO) |
$ | 10,676 | $ | (3,098 | ) | $ | 454 | $ | (226 | ) | $ | 7,806 | ||||||||
|
|
|
|
|
|
|
|
|
|
|
|||||||||||
|
|
|
|
|
|||||||||||||||||
| (a) | For ease of comparison, estimated recoveries of $226 million related to LBSN, which had previously been included in the Post-D7 CFE are shown in the table above as an adjustment, as estimated recoveries related to LBSN are excluded from the Post-D8 Cash Flow Estimates. Refer to Note 9 in the Notes to the Balance Sheets for further information on LBSN. |
|
|
Page 47 |
|
Quarterly Financial Report as of October 1, 2015 (Unaudited)
D. Recoveries from Non-Controlled Affiliates
The Company estimates that Post-D8 Recoveries from Non-Controlled Affiliates will be $5.9 billion, which reflects an increase in estimates of $0.5 billion compared to Total Recoveries from Non-Controlled Affiliates presented in the Post-D7 CFE.
Basis of Presentation
| ($ in millions) | Post-D7 | Less: | Transfers, | Post-D8 | ||||||||||||||||
| Cash Flow | Prior Period | Estimate | Reclassifications, | Cash Flow | ||||||||||||||||
| Estimates | Activity | Changes | Adjustments | Estimates | ||||||||||||||||
| Recoveries from Non-Controlled Affiliates |
||||||||||||||||||||
| Europe (a) |
$ | 5,242 | $ | (978 | ) | $ | 254 | $ | (244 | ) | $ | 4,275 | ||||||||
| Asia |
2,143 | (692 | ) | 204 | — | 1,654 | ||||||||||||||
| LBI |
295 | (299 | ) | 4 | — | 0 | ||||||||||||||
|
|
|
|
|
|
|
|
|
|
|
|||||||||||
| Total - Recoveries from Non-Controlled Affiliates |
$ | 7,680 | $ | (1,969 | ) | $ | 462 | $ | (244 | ) | $ | 5,930 | ||||||||
| (a) | For ease of comparison, estimated recoveries from European Non-Controlled Affiliates reflect an adjustment of $226 million to exclude estimated recoveries from LBSN that were previously included in the Post-D7 CFE. |
|
|
Page 48 |
|
Quarterly Financial Report as of October 1, 2015 (Unaudited)
Recoveries from Non-Controlled Affiliates (continued)
|
|
Page 49 |
|
Quarterly Financial Report as of October 1, 2015 (Unaudited)
E. Operating Expenses
The Company estimates that Post-D8 Operating Expenses will be $0.8 billion, which reflects an increase in estimates of $32 million compared to Total Operating Expenses presented in the Post-D7 CFE.
| ($ in millions) | Post-D7 | Less: | Post-D8 | |||||||||||||||||
| Cash Flow | Prior Period | Estimate | Reclasses / | Cash Flow | ||||||||||||||||
| Estimates | Activity | Changes | Transfers | Estimates | ||||||||||||||||
| Operating Expenses |
||||||||||||||||||||
| Professional Fees |
$ | (390 | ) | $ | 75 | $ | (19 | ) | $ | — | $ | (334 | ) | |||||||
| Compensation and Benefits |
(252 | ) | 30 | (6 | ) | — | (228 | ) | ||||||||||||
| Incentive Fees |
(168 | ) | 11 | (6 | ) | — | (163 | ) | ||||||||||||
| Other Administrative Expenses |
(113 | ) | 20 | (1 | ) | — | (94 | ) | ||||||||||||
|
|
|
|
|
|
|
|
|
|
|
|||||||||||
| Total - Operating Expenses |
$ | (922 | ) | $ | 135 | $ | (32 | ) | $ | — | $ | (819 | ) | |||||||
|
|
Page 50 |
|
Quarterly Financial Report as of October 1, 2015 (Unaudited)
Operating Expenses (continued)
|
|
Page 51 |
|
Quarterly Financial Report as of October 1, 2015 (Unaudited)
F. Post-D8 Cash Flow Estimates
LBHI
The Company estimates that Total Post-D8 Cash From Operations, including Intercompany Receipts, at LBHI will be $7.6 billion, which reflects an increase in estimates of $0.6 billion compared to estimates presented in the Post-D7 CFE.
| Post-D7 | Less: | Transfers, | Post-D8 | |||||||||||||||||
| ($ in millions) | Cash Flow | Cash Activity | Recovery Value | Reclassifications, | Cash Flow | |||||||||||||||
| Estimates | 4/2/15-10/1/15 | Change | Adjustments (a) | Estimates | ||||||||||||||||
| Net Receipts |
||||||||||||||||||||
| Commercial Real Estate |
$ | 101 | $ | (54 | ) | $ | 14 | $ | — | $ | 61 | |||||||||
| Loans (Corporate & Residential) |
76 | (19 | ) | 10 | — | 67 | ||||||||||||||
| Private Equity / Principal Investments |
6 | (3 | ) | (3 | ) | — | 1 | |||||||||||||
| Derivatives |
— | — | — | — | — | |||||||||||||||
| Other |
252 | 28 | (86 | ) | — | 194 | ||||||||||||||
|
|
|
|
|
|
|
|
|
|
|
|||||||||||
| Sub-Total - Net Receipts |
$ | 435 | $ | (48 | ) | $ | (65 | ) | $ | — | $ | 322 | ||||||||
| Recoveries From Non-Controlled Affiliates |
||||||||||||||||||||
| Europe |
$ | 3,409 | $ | (880 | ) | $ | 167 | $ | (136 | ) | $ | 2,561 | ||||||||
| Asia |
1,879 | (631 | ) | 201 | 51 | 1,500 | ||||||||||||||
| LBI |
213 | (209 | ) | (3 | ) | — | 0 | |||||||||||||
|
|
|
|
|
|
|
|
|
|
|
|||||||||||
| Sub-Total - Recoveries From Non-Controlled Affiliates |
$ | 5,500 | $ | (1,720 | ) | $ | 365 | $ | (85 | ) | $ | 4,061 | ||||||||
| Operating Expenses |
||||||||||||||||||||
| Professional Fees |
$ | (266 | ) | $ | 48 | $ | 1 | $ | — | $ | (217 | ) | ||||||||
| Compensation & Benefits |
(147 | ) | 15 | (1 | ) | — | (133 | ) | ||||||||||||
| Incentive Fees |
(108 | ) | 7 | (8 | ) | — | (109 | ) | ||||||||||||
| Other Administrative Expenses |
(60 | ) | 8 | 2 | — | (50 | ) | |||||||||||||
|
|
|
|
|
|
|
|
|
|
|
|||||||||||
| Sub-Total - Operating Expenses |
$ | (581 | ) | $ | 79 | $ | (6 | ) | $ | — | $ | (508 | ) | |||||||
| Total Cash From Operations (CFO) |
$ | 5,354 | $ | (1,689 | ) | $ | 295 | $ | (85 | ) | $ | 3,875 | ||||||||
|
|
|
|
|
|
|
|
|
|
|
|||||||||||
| Pre-Petition Intercompany Receipts from Controlled Entities |
5,394 | (1,348 | ) | $ | 109 | 31 | 4,186 | |||||||||||||
| Net Post-Petition Intercompany Receipts from / (Payables to) Controlled Entities |
(1,611 | ) | (169 | ) | 46 | (104 | ) | (1,837 | ) | |||||||||||
| Investments in Affiliates |
1,495 | (203 | ) | 106 | (59 | ) | 1,340 | |||||||||||||
| Total CFO + Intercompany Receipts |
$ | 10,632 | $ | (3,408 | ) | $ | 556 | $ | (216 | ) | $ | 7,563 | ||||||||
|
|
|
|
|
|
|
|
|
|
|
|||||||||||
|
|
|
|
|
|||||||||||||||||
| (a) | For ease of comparison, estimated recoveries of $226 million related to LBSN, which had previously been included in the Post-D7 CFE are shown in the table above as an adjustment, as estimated recoveries related to LBSN are excluded from the Post-D8 Cash Flow Estimates. Refer to Note 9 in the Notes to the Balance Sheets for further information on LBSN. |
|
|
Page 52 |
|
Quarterly Financial Report as of October 1, 2015 (Unaudited)
LBHI (continued)
|
|
Page 53 |
|
Quarterly Financial Report as of October 1, 2015 (Unaudited)
LCPI
The Company estimates that Total Post-D8 Cash From Operations, including Intercompany Receipts, at LCPI will be $1.2 billion, which reflects an increase in estimates of $67 million compared to estimates presented in the Post-D7 CFE.
| Post-D7 | Less: | Transfers, | Post-D8 | |||||||||||||||||
| ($ in millions) | Cash Flow | Cash Activity | Recovery Value | Reclassifications, | Cash Flow | |||||||||||||||
| Estimates | 4/2/15-10/1/15 | Change | Adjustments | Estimates | ||||||||||||||||
| Net Receipts |
||||||||||||||||||||
| Commercial Real Estate |
$ | 374 | $ | (129 | ) | $ | (20 | ) | $ | — | $ | 225 | ||||||||
| Loans (Corporate & Residential) |
65 | (23 | ) | 31 | — | 74 | ||||||||||||||
| Private Equity / Principal Investments |
39 | (46 | ) | 10 | — | 3 | ||||||||||||||
| Derivatives |
— | — | — | — | — | |||||||||||||||
| Other |
4 | 2 | 1 | — | 7 | |||||||||||||||
|
|
|
|
|
|
|
|
|
|
|
|||||||||||
| Sub-Total - Net Receipts |
$ | 482 | $ | (196 | ) | $ | 23 | $ | — | $ | 309 | |||||||||
| Recoveries From Non-Controlled Affiliates |
||||||||||||||||||||
| Europe |
$ | 20 | $ | (0 | ) | $ | 3 | $ | — | $ | 23 | |||||||||
| Asia |
3 | (3 | ) | (0 | ) | — | 0 | |||||||||||||
| LBI |
1 | (1 | ) | 0 | — | 0 | ||||||||||||||
|
|
|
|
|
|
|
|
|
|
|
|||||||||||
| Sub-Total - Recoveries From Non-Controlled Affiliates |
$ | 25 | $ | (4 | ) | $ | 3 | $ | — | $ | 23 | |||||||||
| Operating Expenses |
||||||||||||||||||||
| Professional Fees |
$ | (13 | ) | $ | 4 | $ | 0 | $ | — | $ | (8 | ) | ||||||||
| Compensation & Benefits |
(13 | ) | 4 | (1 | ) | — | (10 | ) | ||||||||||||
| Incentive Fees |
(29 | ) | 2 | (1 | ) | — | (28 | ) | ||||||||||||
| Other Administrative Expenses |
(8 | ) | 3 | (0 | ) | — | (5 | ) | ||||||||||||
|
|
|
|
|
|
|
|
|
|
|
|||||||||||
| Sub-Total - Operating Expenses |
$ | (62 | ) | $ | 13 | $ | (2 | ) | $ | — | $ | (51 | ) | |||||||
| Total Cash From Operations (CFO) |
$ | 445 | $ | (187 | ) | $ | 23 | $ | — | $ | 281 | |||||||||
|
|
|
|
|
|
|
|
|
|
|
|||||||||||
| Pre-Petition Intercompany Receipts from Controlled Entities |
726 | (87 | ) | $ | 49 | — | 688 | |||||||||||||
| Net Post-Petition Intercompany Receipts from / (Payables to) Controlled Entities |
(4 | ) | (154 | ) | (22 | ) | — | (180 | ) | |||||||||||
| Investments in Affiliates |
633 | (228 | ) | 17 | — | 422 | ||||||||||||||
| Total CFO + Intercompany Receipts |
$ | 1,800 | $ | (656 | ) | $ | 67 | $ | — | $ | 1,211 | |||||||||
|
|
|
|
|
|
|
|
|
|
|
|||||||||||
|
|
|
|
|
|||||||||||||||||
|
|
Page 54 |
|
Quarterly Financial Report as of October 1, 2015 (Unaudited)
LCPI (continued)
|
|
Page 55 |
|
Quarterly Financial Report as of October 1, 2015 (Unaudited)
LBSF
The Company estimates that Total Post-D8 Cash From Operations, including Intercompany Receipts, at LBSF will be $1.1 billion, which reflects an increase in estimates of $18 million compared to estimates presented in the Post-D7 CFE.
| Post-D7 | Less: | Transfers, | Post-D8 | |||||||||||||||||
| ($ in millions) | Cash Flow | Cash Activity | Recovery Value | Reclassifications, | Cash Flow | |||||||||||||||
| Estimates | 4/2/15-10/1/15 | Change | Adjustments (a) | Estimates | ||||||||||||||||
| Net Receipts |
||||||||||||||||||||
| Commercial Real Estate |
$ | — | $ | — | $ | — | $ | — | $ | — | ||||||||||
| Loans (Corporate & Residential) |
0 | (0 | ) | 0 | — | — | ||||||||||||||
| Private Equity / Principal Investments |
— | — | — | — | — | |||||||||||||||
| Derivatives |
294 | (156 | ) | 17 | — | 154 | ||||||||||||||
| Other |
7 | (39 | ) | 40 | 18 | 27 | ||||||||||||||
|
|
|
|
|
|
|
|
|
|
|
|||||||||||
| Sub-Total - Net Receipts |
$ | 301 | $ | (195 | ) | $ | 57 | $ | 18 | $ | 181 | |||||||||
| Recoveries From Non-Controlled Affiliates |
||||||||||||||||||||
| Europe |
$ | 85 | $ | (22 | ) | $ | 0 | $ | (19 | ) | $ | 44 | ||||||||
| Asia |
3 | (2 | ) | 0 | — | 1 | ||||||||||||||
| LBI |
0 | (0 | ) | 0 | — | 0 | ||||||||||||||
|
|
|
|
|
|
|
|
|
|
|
|||||||||||
| Sub-Total - Recoveries From Non-Controlled Affiliates |
$ | 88 | $ | (23 | ) | $ | 0 | $ | (19 | ) | $ | 45 | ||||||||
| Operating Expenses |
||||||||||||||||||||
| Professional Fees |
$ | (90 | ) | $ | 14 | $ | (20 | ) | $ | — | $ | (96 | ) | |||||||
| Compensation & Benefits |
(51 | ) | 4 | (3 | ) | — | (51 | ) | ||||||||||||
| Incentive Fees |
(21 | ) | 1 | 0 | — | (19 | ) | |||||||||||||
| Other Administrative Expenses |
(27 | ) | 4 | (0 | ) | — | (23 | ) | ||||||||||||
|
|
|
|
|
|
|
|
|
|
|
|||||||||||
| Sub-Total - Operating Expenses |
$ | (189 | ) | $ | 23 | $ | (22 | ) | $ | — | $ | (188 | ) | |||||||
| Total Cash From Operations (CFO) |
$ | 201 | $ | (196 | ) | $ | 35 | $ | (1 | ) | $ | 38 | ||||||||
|
|
|
|
|
|
|
|
|
|
|
|||||||||||
| Pre-Petition Intercompany Receipts from Controlled Entities |
136 | (31 | ) | $ | 17 | — | 122 | |||||||||||||
| Net Post-Petition Intercompany Receipts from / (Payables to) Controlled Entities |
578 | 369 | (35 | ) | 2 | 914 | ||||||||||||||
| Investments in Affiliates |
1 | — | 1 | — | 2 | |||||||||||||||
| Total CFO + Intercompany Receipts |
$ | 916 | $ | 142 | $ | 18 | $ | 1 | $ | 1,076 | ||||||||||
|
|
|
|
|
|
|
|
|
|
|
|||||||||||
|
|
|
|
|
|||||||||||||||||
| (a) | Transfers, Reclassifications, Adjustments include the reclassification of certain receivables from LBT from Recoveries to Non-Controlled Affiliates to Other Assets. |
|
|
Page 56 |
|
Quarterly Financial Report as of October 1, 2015 (Unaudited)
LBSF (continued)
|
|
Page 57 |
|
Quarterly Financial Report as of October 1, 2015 (Unaudited)
Other Debtors
| Total | ||||||||||||||||||||||||||||||||||||
| ($ in millions) | Other | Other | ||||||||||||||||||||||||||||||||||
| LOTC | LBCC | LBCS | Lux Resi | LBFP | Merit | LBDP | Debtors | Debtors | ||||||||||||||||||||||||||||
| POST-D8 CASH FLOW ESTIMATES |
||||||||||||||||||||||||||||||||||||
| Net Receipts |
||||||||||||||||||||||||||||||||||||
| Commercial Real Estate |
$ | — | $ | — | $ | — | $ | — | $ | — | $ | — | $ | — | $ | — | $ | — | ||||||||||||||||||
| Loans (Corporate & Residential) |
— | — | — | — | — | — | — | — | — | |||||||||||||||||||||||||||
| Private Equity / Principal Investments |
— | — | — | — | — | — | — | — | — | |||||||||||||||||||||||||||
| Derivatives |
— | 4 | 0 | — | — | 27 | — | — | 31 | |||||||||||||||||||||||||||
| Other |
1 | 0 | 0 | — | 0 | — | 0 | — | 2 | |||||||||||||||||||||||||||
|
|
|
|
|
|
|
|
|
|
|
|
|
|
|
|
|
|
|
|||||||||||||||||||
| Sub-Total - Net Receipts |
$ | 1 | $ | 4 | $ | 0 | $ | — | $ | 0 | $ | 27 | $ | 0 | $ | — | $ | 32 | ||||||||||||||||||
| Recoveries From Non-Controlled Affiliates |
||||||||||||||||||||||||||||||||||||
| Europe |
$ | — | $ | 9 | $ | 55 | $ | — | $ | — | $ | 24 | $ | — | $ | 1 | $ | 88 | ||||||||||||||||||
| Asia |
— | 48 | 0 | — | 0 | — | 0 | 0 | 48 | |||||||||||||||||||||||||||
| LBI |
— | — | 0 | — | — | — | — | 0 | 0 | |||||||||||||||||||||||||||
|
|
|
|
|
|
|
|
|
|
|
|
|
|
|
|
|
|
|
|||||||||||||||||||
| Sub-Total - Recoveries From Non-Controlled Affiliates |
$ | — | $ | 57 | $ | 55 | $ | — | $ | 0 | $ | 24 | $ | 0 | $ | 1 | $ | 136 | ||||||||||||||||||
| Operating Expenses |
||||||||||||||||||||||||||||||||||||
| Professional Fees |
$ | (1 | ) | $ | (3 | ) | $ | (3 | ) | $ | — | $ | (0 | ) | $ | (0 | ) | $ | (0 | ) | $ | (1 | ) | $ | (8 | ) | ||||||||||
| Compensation & Benefits |
(2 | ) | (2 | ) | (2 | ) | — | (1 | ) | (0 | ) | (1 | ) | (3 | ) | (12 | ) | |||||||||||||||||||
| Incentive Fees |
(1 | ) | (2 | ) | (4 | ) | — | (0 | ) | (0 | ) | (0 | ) | (0 | ) | (8 | ) | |||||||||||||||||||
| Other Administrative Expenses |
(1 | ) | (1 | ) | (1 | ) | — | (1 | ) | (0 | ) | (1 | ) | (2 | ) | (7 | ) | |||||||||||||||||||
|
|
|
|
|
|
|
|
|
|
|
|
|
|
|
|
|
|
|
|||||||||||||||||||
| Sub-Total - Operating Expenses |
$ | (5 | ) | $ | (8 | ) | $ | (10 | ) | $ | — | $ | (3 | ) | $ | (1 | ) | $ | (3 | ) | $ | (7 | ) | $ | (35 | ) | ||||||||||
| Total Cash From Operations (CFO) |
$ | (3 | ) | $ | 54 | $ | 45 | $ | — | $ | (3 | ) | $ | 49 | $ | (3 | ) | $ | (6 | ) | $ | 133 | ||||||||||||||
|
|
|
|
|
|
|
|
|
|
|
|
|
|
|
|
|
|
|
|||||||||||||||||||
| Pre-Petition Intercompany Receipts from Controlled Entities |
$ | 0 | $ | 1 | $ | 12 | $ | 0 | $ | (0 | ) | $ | 1 | $ | 0 | 101 | 114 | |||||||||||||||||||
| Net Post-Petition Intercompany Receipts from / (Payables to) Controlled Entities |
533 | 223 | 7 | (0 | ) | 214 | (4 | ) | (1 | ) | (12 | ) | 959 | |||||||||||||||||||||||
| Investments in Affiliates |
— | — | — | — | — | — | — | 0 | 0 | |||||||||||||||||||||||||||
| Total Post-D8 CFO + Intercompany Receipts |
$ | 529 | $ | 277 | $ | 63 | $ | (0 | ) | $ | 211 | $ | 47 | $ | (4 | ) | $ | 82 | $ | 1,206 | ||||||||||||||||
|
|
|
|
|
|
|
|
|
|
|
|
|
|
|
|
|
|
|
|||||||||||||||||||
|
|
|
|
|
|
|
|
|
|
|
|
|
|
|
|
|
|
|
|||||||||||||||||||
| Cash Activities, 4/2/15-10/1/15 |
$ | 108 | $ | (5 | ) | $ | 43 | $ | — | $ | (117 | ) | $ | 6 | $ | 122 | $ | 54 | $ | 212 | ||||||||||||||||
| Transfers, Reclassifications, Adjustments |
— | 0 | — | — | — | — | — | — | 0 | |||||||||||||||||||||||||||
|
|
|
|
|
|
|
|
|
|
|
|
|
|
|
|
|
|
|
|||||||||||||||||||
| Total Post-D8, including Prior Period Activity |
$ | 637 | $ | 272 | $ | 106 | $ | (0 | ) | $ | 94 | $ | 53 | $ | 118 | $ | 136 | $ | 1,418 | |||||||||||||||||
| Total Post-D7 CFE |
641 | 271 | 99 | (0 | ) | 93 | 57 | 122 | 136 | 1,420 | ||||||||||||||||||||||||||
| Variance, Post-D8 (including Prior Period) vs. Post-D7 |
(4 | ) | 2 | 7 | (0 | ) | 1 | (4 | ) | (3 | ) | 0 | (1 | ) | ||||||||||||||||||||||
|
|
Page 58 |
|
Quarterly Financial Report as of October 1, 2015 (Unaudited)
Debtor-Controlled Entities
| Post-D7 | Less: | Transfers, | Post-D8 | |||||||||||||||||
| ($ in millions) | Cash Flow | Cash Activity | Recovery Value | Reclassifications, | Cash Flow | |||||||||||||||
| Estimates | 4/2/15-10/1/15 | Change | Adjustments (a) | Estimates | ||||||||||||||||
| Net Receipts |
||||||||||||||||||||
| Commercial Real Estate |
$ | 669 | $ | (221 | ) | $ | (44 | ) | $ | — | $ | 404 | ||||||||
| Loans (Corporate & Residential) |
39 | (4 | ) | 7 | — | 43 | ||||||||||||||
| Private Equity / Principal Investments |
1,940 | (583 | ) | 31 | — | 1,388 | ||||||||||||||
| Derivatives |
1 | (8 | ) | 8 | — | 1 | ||||||||||||||
| Other |
2 | 0 | 14 | — | 16 | |||||||||||||||
|
|
|
|
|
|
|
|
|
|
|
|||||||||||
| Sub-Total - Net Receipts |
$ | 2,652 | $ | (816 | ) | $ | 15 | $ | — | $ | 1,851 | |||||||||
| Recoveries From Non-Controlled Affiliates |
||||||||||||||||||||
| Europe |
$ | 1,627 | $ | (54 | ) | $ | 76 | $ | (89 | ) | $ | 1,560 | ||||||||
| Asia |
193 | (34 | ) | (4 | ) | (51 | ) | 104 | ||||||||||||
| LBI |
64 | (71 | ) | 6 | — | (0 | ) | |||||||||||||
|
|
|
|
|
|
|
|
|
|
|
|||||||||||
| Sub-Total - Recoveries From Non-Controlled Affiliates |
$ | 1,884 | $ | (159 | ) | $ | 78 | $ | (140 | ) | $ | 1,664 | ||||||||
| Operating Expenses |
||||||||||||||||||||
| Professional Fees |
$ | (9 | ) | $ | 5 | $ | (1 | ) | $ | — | $ | (6 | ) | |||||||
| Compensation & Benefits |
(31 | ) | 4 | 5 | — | (22 | ) | |||||||||||||
| Incentive Fees |
— | — | — | — | — | |||||||||||||||
| Other Administrative Expenses |
(13 | ) | 2 | 1 | — | (10 | ) | |||||||||||||
|
|
|
|
|
|
|
|
|
|
|
|||||||||||
| Sub-Total - Operating Expenses |
$ | (53 | ) | $ | 11 | $ | 5 | $ | — | $ | (37 | ) | ||||||||
| Total Cash From Operations (CFO) |
$ | 4,483 | $ | (963 | ) | $ | 98 | $ | (140 | ) | $ | 3,478 | ||||||||
|
|
|
|
|
|
|
|
|
|
|
|||||||||||
| Pre-Petition Intercompany Receipts from Controlled Entities |
668 | (267 | ) | $ | 48 | (15 | ) | 434 | ||||||||||||
| Net Post-Petition Intercompany Receipts from / (Payables to) Controlled Entities |
(56 | ) | 81 | 18 | 102 | 144 | ||||||||||||||
| Investments in Affiliates |
445 | — | 22 | — | 466 | |||||||||||||||
| Total CFO + Intercompany Receipts |
$ | 5,540 | $ | (1,150 | ) | $ | 185 | $ | (53 | ) | $ | 4,522 | ||||||||
|
|
|
|
|
|
|
|
|
|
|
|||||||||||
|
|
|
|
|
|||||||||||||||||
| (a) | Transfers, Reclassifications, Adjustments include numerous assignments of Non-Controlled Affiliate claims from Debtor-Controlled Entities to Debtors, in accordance with the Company’s planned operational wind down and entity simplification activities. |
|
|
Page 59 |
|
Quarterly Financial Report as of October 1, 2015 (Unaudited)
Debtor-Controlled Entities (continued)
|
|
Page 60 |
|
Serious News for Serious Traders! Try StreetInsider.com Premium Free!
You May Also Be Interested In
- LuxUrban Hotels (LUXH) Appoints Andrew Schwartz to its Board
- Foghorn Therapeutics (FHTX) Announces Appointment of Kristian Humer as Chief Financial Officer
Create E-mail Alert Related Categories
SEC FilingsRelated Entities
Lehman BrothersSign up for StreetInsider Free!
Receive full access to all new and archived articles, unlimited portfolio tracking, e-mail alerts, custom newswires and RSS feeds - and more!
