

Form 8-K Carlyle Group L.P. For: Feb 11
 Tweet
Tweet Share
Share�
�
UNITED STATES
SECURITIES AND EXCHANGE COMMISSION
Washington, DC 20549
�
�
FORM 8-K
�
�
CURRENT REPORT
Pursuant to Section�13 OR 15(d) of the
Securities Exchange Act of 1934
Date of Report (Date of earliest event reported): February 11, 2015
�
�
The Carlyle Group L.P.
(Exact name of registrant as specified in its charter)
�
�
�
| Delaware | � | 001-35538 | � | 45-2832612 |
| (State or Other Jurisdiction of Incorporation) |
� | (Commission File Number) |
� | (IRS Employer Identification No.) |
| 1001 Pennsylvania Avenue, NW Washington, D.C. |
� | 20004-2505 | ||
| (Address of Principal Executive Offices) | � | (Zip Code) | ||
(202) 729-5626
(Registrant�s Telephone Number, Including Area Code)
Not Applicable
(Former Name or Former Address, if Changed Since Last Report)
�
�
Check the appropriate box below if the Form 8-K filing is intended to simultaneously satisfy the filing obligation of the registrant under any of the following provisions:
�
| � | Written communications pursuant to Rule 425 under the Securities Act (17 CFR 230.425) |
�
| � | Soliciting material pursuant to Rule 14a-12 under the Exchange Act (17 CFR 240.14a-12) |
�
| � | Pre-commencement communications pursuant to Rule 14d-2(b) under the Exchange Act (17 CFR 240.14d-2(b)) |
�
| � | Pre-commencement communications pursuant to Rule 13e-4(c) under the Exchange Act (17 CFR 240.13e-4(c)) |
�
�
�
| Item�2.02 | Results of Operations and Financial Condition. |
On February 11, 2015, The Carlyle Group L.P. issued a summary press release and a detailed earnings presentation announcing financial results for the full year and fourth quarter ended December 31, 2014. The summary press release and the earnings presentation are furnished as Exhibit 99.1 and Exhibit 99.2, respectively, to this Report.
As provided in General Instruction B.2 of Form�8-K, the information in this Item�2.02 and the exhibits incorporated herein in this Form�8-K shall not be deemed to be �filed� for purposes of Section�18 of the Securities Exchange Act of 1934, as amended, nor shall they be deemed to be incorporated by reference in any filing under the Securities Act of 1933, as amended, except as shall be expressly set forth by specific reference in such a filing.
�
| Item�9.01 | Financial Statements and Exhibits. |
�
| (d) | Exhibits. |
�
| Exhibit�No. |
�� | Description |
| 99.1 | �� | Summary press release of The Carlyle Group L.P., dated February 11, 2015. |
| 99.2 | �� | Earnings presentation of The Carlyle Group L.P., dated February 11, 2015. |
SIGNATURE
Pursuant to the requirements of the Securities Exchange Act of 1934, the registrant has duly caused this report to be signed on its behalf by the undersigned hereunto duly authorized.
�
| � | THE CARLYLE GROUP L.P. | |||||
| � | � | By: | � | Carlyle�Group�Management�L.L.C., | ||
| � | � | � | its general partner | |||
| Date: February 11, 2015 | � | � | By: | � | /s/ Curtis L. Buser | |
| � | � | Name: | � | Curtis L. Buser | ||
| � | � | Title: | � | Chief Financial Officer | ||
EXHIBIT INDEX
�
| Exhibit�No. |
�� | Description |
| Exhibit�99.1 | �� | Summary press release of The Carlyle Group L.P., dated February 11, 2015. |
| Exhibit�99.2 | �� | Earnings presentation of The Carlyle Group L.P., dated February 11, 2015. |
Exhibit 99.1
�
�

The Carlyle Group Announces Fourth Quarter and Full Year 2014 Financial Results
Washington, DC, February�11, 2015 � Global alternative asset manager The Carlyle Group L.P. (NASDAQ: CG) today reported its unaudited results for the full year and fourth quarter, ended December�31, 2014.
Carlyle Co-CEO David M. Rubenstein said, �This was our best year as a public company. Carlyle generated our highest level of Distributable Earnings since going public. We are pleased to be able to pay a full year distribution of $2.09 to Carlyle common unitholders for 2014. Beginning with the first quarter of 2015, we are adjusting our distribution policy and will distribute approximately 75% of our post-tax Distributable Earnings on a quarterly basis instead of through a year-end true up.�
Carlyle Co-CEO William E. Conway, Jr. said, �The past year was exceptional for realizations and returning capital to our limited partners. With our major funds reloaded, we are well positioned to take advantage of market volatility, particularly in the energy sector. Perhaps our best performing large buyout fund was in Europe, where our third European fund appreciated 9% for the quarter and 46% for the year.�
In addition to this release, Carlyle issued a full detailed presentation of its fourth quarter and full year 2014 results, which can be viewed on the investor relations section of our website at ir.carlyle.com.
Distribution
The Board of Directors has declared a quarterly distribution of $1.61 per common unit to holders of record at the close of business on February�23, 2015, payable on March�6, 2015.
Conference Call
Carlyle will host a conference call at 8:30 a.m. EST on Wednesday, February�11, 2015 to announce its fourth quarter and full year 2014 financial results.
The call may be accessed by dialing +1 (800)�850-2903 (U.S.) or +1 (253)�237-1169 (international) and referencing �The Carlyle Group Financial Results Call.� The conference call will be webcast simultaneously via a link on Carlyle�s investor relations website at ir.carlyle.com and an archived replay of the webcast also will be available on the website soon after the live call.
About The Carlyle Group
The Carlyle Group (NASDAQ: CG) is a global alternative asset manager with $194 billion of assets under management across 128 funds and 142 fund of funds vehicles as of December�31, 2014. Carlyle�s purpose is to invest wisely and create value on behalf of its investors, many of whom are public pensions. Carlyle invests across four segments � Corporate Private Equity, Real Assets, Global Market Strategies and Investment Solutions � in Africa, Asia, Australia, Europe, the Middle East, North America and South America. Carlyle has expertise in various industries, including: aerospace, defense�& government services, consumer�& retail, energy, financial
�
Page��|��1
services, healthcare, industrial, real estate, technology�& business services, telecommunications�& media and transportation. The Carlyle Group employs more than 1,650 people in 40 offices across six continents.
Forward Looking Statements
This press release may contain forward-looking statements within the meaning of Section�27A of the Securities Act of 1933 and Section�21E of the Securities Exchange Act of 1934. These statements include, but are not limited to, statements related to our expectations regarding the performance of our business, our financial results, our liquidity and capital resources and other non-historical statements. You can identify these forward-looking statements by the use of words such as �outlook,� �believes,� �expects,� �potential,� �continues,� �may,� �will,� �should,� �seeks,� �approximately,� �predicts,� �intends,� �plans,� �estimates,� �anticipates� or the negative version of these words or other comparable words. These statements are subject to risks, uncertainties and assumptions, including those described under the section entitled �Risk Factors� in our Annual Report on Form 10-K for the year ended December�31, 2013 filed with the SEC on February�27, 2014, as such factors may be updated from time to time in our periodic filings with the SEC, which are accessible on the SEC�s website at www.sec.gov. These factors should not be construed as exhaustive and should be read in conjunction with the other cautionary statements that are included in this release and in our filings with the SEC. We undertake no obligation to publicly update or review any forward-looking statements, whether as a result of new information, future developments or otherwise, except as required by applicable law.
This release does not constitute an offer for any Carlyle fund.
Contacts:
�
| Public Market Investor Relations | �� | Media |
| Daniel Harris | �� | Elizabeth Gill |
| Phone: +1 (212) 813-4527 | �� | Phone: +1 (202) 729-5385 |
| [email protected] | �� | [email protected] |
| Web: www.carlyle.com | �� | |
| Videos: www.youtube.com/onecarlyle | �� | |
| Tweets: www.twitter.com/onecarlyle | �� | |
| Podcasts: www.carlyle.com/about-carlyle/market-commentary | ||
�
Page��|��2
Exhibit 99.2
�
�

February�11, 2015
�
The Carlyle Group Announces Fourth Quarter and Full Year 2014 Financial Results
�
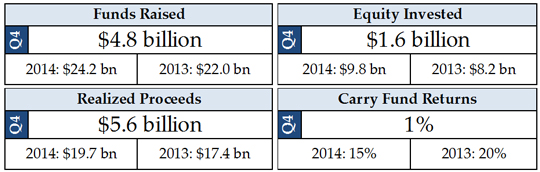
| � | � | � | Distributable Earnings of $973 million for 2014 were 16% higher than 2013, and $2.78 per common unit on a post-tax basis; Distributable Earnings of $311 million in Q4 2014, and $0.91 per common unit on a post-tax basis |
�
| � | � | � | $4.8 billion in new capital raised in Q4 2014 and $24.2 billion raised in 2014, up from $22.0�billion in 2013 |
�
| � | � | � | $5.6 billion in realized proceeds in Q4 2014 and $19.7 billion realized in 2014, up from $17.4�billion in 2013 |
�
| � | � | � | $1.6 billion in equity invested in Q4 2014 and $9.8 billion invested in 2014, up from $8.2�billion invested in 2013 |
�
| � | � | � | Declared a quarterly distribution of $1.61 per common unit for Q4 2014 for an aggregate distribution of $2.09 per common unit for 2014 |
�
| � | � | � | Economic Net Income of $181 million and $962 million on a pre-tax basis, or $0.56 and $2.68 per Adjusted Unit on a post-tax basis, for Q4 2014 and 2014, respectively |
�
| � | � | � | U.S. GAAP net income attributable to The Carlyle Group L.P. of $16 million and $86 million, or $0.23 and $1.23 per common unit on a diluted basis, for Q4 2014 and 2014, respectively |
Washington, DC � Global alternative asset manager The Carlyle Group L.P. (NASDAQ: CG) today reported its unaudited results for the full year and fourth quarter ended December�31, 2014.
Carlyle Co-CEO David M. Rubenstein said, �This was our best year as a public company. Carlyle generated our highest level of Distributable Earnings since going public. We are pleased to be able to pay a full year distribution of $2.09 to Carlyle common unitholders for 2014. Beginning with the first quarter of 2015, we are adjusting our distribution policy and will distribute approximately 75% of our post-tax Distributable Earnings on a quarterly basis instead of through a year-end true up.�
�
Page��|��1
Carlyle Co-CEO William E. Conway, Jr. said, �The past year was exceptional for realizations and returning capital to our limited partners. With our major funds reloaded, we are well positioned to take advantage of market volatility, particularly in the energy sector. Perhaps our best performing large buyout fund was in Europe, where our third European fund appreciated 9% for the quarter and 46% for the year.�
U.S. GAAP results for Q4 2014 and 2014, respectively, included income/(loss) before provision for income taxes of ($197) million and $992 million, and net income attributable to the common unitholders through The Carlyle Group L.P. of $16 million and $86�million, or net income per common unit of $0.23 and $1.23, on a diluted basis. Total balance sheet assets were $36.0 billion as of December�31, 2014.
�
| Fourth Quarter Distribution |
The Board of Directors has declared a quarterly distribution of $1.61 per common unit to holders of record at the close of business on February�23, 2015, payable on March�6, 2015.
Including the $1.61 per common unit distribution payable on March�6, 2015, the Board of Directors has declared $2.09 in aggregate distributions per common unit for the 2014 fiscal year, reflecting a 75% payout on $2.78 in full year post-tax Distributable Earnings per common unit.
Distribution Policy
Distributions for the 2014 fiscal year, including the fourth quarter distribution, were determined in accordance with Carlyle�s distribution policy in effect for the 2014 fiscal year. Commencing with distributions for the 2015 fiscal year, it is Carlyle�s intention to cause Carlyle Holdings to make quarterly distributions to its partners, including The Carlyle Group L.P.�s wholly owned subsidiaries, that will enable The Carlyle Group L.P. to pay a quarterly distribution of approximately 75% of Distributable Earnings per common unit, net of taxes and amounts payable under the tax receivable agreement, for the quarter. Carlyle�s general partner may adjust the distribution for amounts determined to be necessary or appropriate to provide for the conduct of its business, to make appropriate investments in its business and its funds or to comply with applicable law or any of its financing agreements, or to provide for future cash requirements such as tax-related payments, clawback obligations and distributions to unitholders for any ensuing quarter. The amount to be distributed could also be adjusted upward in any one quarter. The declaration and payment of any distributions is at the sole discretion of Carlyle�s general partner, which may change or eliminate the distribution policy at any time.
�
Page��|��2
| Performance Metrics |
Carlyle evaluates the underlying performance of its business on four key metrics: funds raised, equity invested, carry fund returns and realized proceeds for fund investors. The table below highlights the results of these metrics for Q4 2014 and the full years of 2014 and 2013.
�
Note: Equity Invested and Realized Proceeds reflect carry funds only.
During Q4 2014, within its carry funds, Carlyle generated realized proceeds of $5.6 billion from 150 investments across 36 carry funds. Carlyle invested $1.6 billion of equity in 105 new or follow-on investments across 27 carry funds in Q4 2014. For 2014, Carlyle realized proceeds of $19.7 billion and invested $9.8 billion.
�
| � | � | � | � | Segment | �� | � | �� | Realized Proceeds | �� | � | �� | Equity Invested | ||||||||
| � | � | �� | �� | # of Investments | �� | # of Funds | �� | $ millions |
�� | �� | # of Investments | �� | # of Funds | �� | $ millions | |||||
| � |
|
� | Corporate Private Equity | �� | �� | 40 | �� | 18 | �� | $4,212 | �� | �� | 16 | �� | 12 |
�� | $593 | |||
| � | � | Global Market Strategies |
�� | �� | 30 | �� | 4 | �� | $141 | �� | �� | 5 | �� | 2 | �� | $86 | ||||
| � | � | Real Assets |
�� | �� | 83 | �� | 14 | �� | $1,271 | �� | �� | 84 | �� | 13 | �� | $942 | ||||
| � | � | � | ||||||||||||||||||
| � | � | Carlyle | �� | �� | 150 | �� | 36 | �� | $5,624 | �� | �� | 105 | �� | 27 | �� | $1,620 | ||||
| � | � | � | ||||||||||||||||||
| � | � | Corporate Private Equity | �� | �� | 101 | �� | 23 | �� | $14,273 | �� | �� | 57 | �� | 22 | �� | $6,776 | ||||
| � | � | Global Market Strategies |
�� | �� | 48 | �� | 6 | �� | $747 | �� | �� | 12 | �� | 3 | �� | $557 | ||||
| � | � | Real Assets |
�� | �� | 157 | �� | 16 | �� | $4,665 | �� | �� | 149 | �� | 17 | �� | $2,504 | ||||
| � | � | � | ||||||||||||||||||
| � | � | Carlyle |
�� | �� | 298 | �� | 45 | �� | $19,685 | �� | �� | 217 | �� | 42 | �� | $9,837 | ||||
| � | � | � | ||||||||||||||||||

Note: The columns may not sum as some investments cross segment lines, but are only counted one time for Carlyle results.
�
Page��|��3
| Carlyle All Segment Results |
�
| � | � | Distributable Earnings (DE): $311 million for Q4 2014 and $973 million for 2014 |
�
| � | o� | Distributable Earnings were $973 million for 2014, 16% higher than 2013. On a post-tax basis, Carlyle generated DE of $0.91 and $2.78 per common unit for Q4 2014 and 2014, respectively. |
�
| � | o� | Fee-Related Earnings (FRE) were $67 million for Q4 2014 compared to $39 million in Q4 2013 due to higher management fees and lower discretionary, cash-based compensation expense. FRE of $247 million in 2014 were 62% higher than 2013, and were positively impacted by catch-up management fee and transaction fee revenue. |
�
| � | o� | Realized Net Performance Fees were $264 million for Q4 2014, compared to $355 million in Q4 2013. Realized net performance fees were $733 million in 2014, 9% higher than 2013. For Q4 2014, realized net performance fees were positively impacted by exits in RAC Limited, Axalta Coating Systems, PQ Corporation and HD Supply, among others, and by U.S. Real Estate asset dispositions. |
�
| � | o� | Realized Investment Income/(Loss) was ($20) million in Q4 2014, driven by losses on certain international Real Estate investments and Urbplan. For 2014, realized investment loss was ($6) million compared to realized investment income of $11 million in 2013. |
�
| � | � | Economic Net Income (ENI): $181 million for Q4 2014 and $962 million for 2014 |
�
| � | o� | Economic Net Income was $962 million for 2014, which was 25% lower than 2013. ENI was particularly elevated in 2013 as two significant funds crossed into a full carry position. Q4 2014 ENI was impacted by the absence of hedge fund performance fees and negative performance fees in legacy energy funds. On a post-tax basis, Carlyle generated ENI per Adjusted Unit of $0.56 for Q4 2014 and $2.68 for 2014. The fourth quarter ENI tax benefit was $2 million, primarily driven by the reversal of carry in energy-related funds. |
�
| � | o� | Q4 2014 ENI was positively impacted by appreciation of 1% in Carlyle�s carry fund portfolio. Corporate Private Equity carry funds appreciated 7%, while Global Market Strategies carry funds declined by 2% and Real Assets carry funds declined by 8% compared to the end of Q3 2014. Total carry fund appreciation was 15% for 2014, compared to 20% in 2013. |
�
| The Carlyle Group L.P. - All Segments | �� | Quarter | �� | �����Annual����� | �� | ����% Change���� | ||||||||||||||
| � | �� | � |
�� | � | ||||||||||||||||
| $ in millions, except per unit data and where noted | �� | Q4�2013�� | �� | Q1�2014�� | �� | Q2�2014�� | �� | Q3�2014���� | �� | Q4�2014�� | �� | 2014 | �� | 2013 | �� | ��QoQ�� | �� | YoY | �� | Annual |
| �� | � | �� | � | �� | � | �� | � | �� | � | �� | � | �� | � | �� | � | |||||
| Revenues |
�� | 1,394��� | �� | 897��� | �� | 900��� | �� | 577��� | �� | 649��� | �� | 3,022 | �� | 3,369 | �� | 13% | �� | (53%) | �� | (10%)�� |
| � Expenses |
�� | 832��� | �� | 585��� | �� | 611��� | �� | 396��� | �� | 468��� | �� | 2,060 | �� | 2,084 | �� | 18% | �� | (44%) | �� | (1%)�� |
| � Economic Net Income * |
�� | 562��� | �� | 312��� | �� | 289��� | �� | 181��� | �� | 181��� | �� | 962 | �� | 1,285 | �� | (0%) | �� | (68%) | �� | (25%)�� |
| � | �� | � | �� | � | �� | � | �� | � | �� | � | �� | � | �� | � | �� | � | �� | � | �� | � |
| � Fee-Related Earnings |
�� | 39��� | �� | 37��� | �� | 80��� | �� | 62��� | �� | 67��� | �� | 247 | �� | 152 | �� | 9% | �� | 74% | �� | 62%�� |
| � | �� | � | �� | � | �� | � | �� | � | �� | � | �� | � | �� | � | �� | � | �� | � | �� | � |
| � Net Performance Fees * |
�� | 578��� | �� | 296��� | �� | 233��� | �� | 139��� | �� | 138��� | �� | 807 | �� | 1,191 | �� | (1%) | �� | (76%) | �� | (32%)�� |
| � | �� | � | �� | � | �� | � | �� | � | �� | � | �� | � | �� | � | �� | � | �� | � | �� | � |
| � Realized Net Performance Fees * |
�� | 355��� | �� | 140��� | �� | 231��� | �� | 98��� | �� | 264�� | �� | 733 | �� | 675 | �� | 170% | �� | (26%) | �� | 9%�� |
| � | �� | � | �� | � | �� | � | �� | � | �� | � | �� | � | �� | � | �� | � | �� | � | �� | � |
| � Distributable Earnings * |
�� | 400��� | �� | 183��� | �� | 323��� | �� | 157��� | �� | 311��� | �� | 973 | �� | 837 | �� | 98% | �� | (22%) | �� | 16%�� |
| � | �� | � | �� | � | �� | � | �� | � | �� | � | �� | � | �� | � | �� | � | �� | � | �� | � |
| � Distributable Earnings per common unit (after taxes) |
�� | $1.18 | �� | $0.52�� | �� | $0.93�� | �� | $0.44�� | �� | $0.91�� | �� | $2.78 | �� | $2.50 | �� | �� | �� | |||
| � Distribution per common unit |
�� | $1.40 | �� | $0.16�� | �� | $0.16�� | �� | $0.16�� | �� | $1.61�� | �� | $2.09 | �� | $1.88 | �� | �� | �� | |||
| � Total Assets Under Management ($ in billions) |
�� | 188.8�� | �� | 198.9�� | �� | 202.7�� | �� | 202.6�� | �� | 194.5�� | �� | � | �� | � | �� | (4%) | �� | 3% | �� | 3%�� |
| � Fee-Earning Assets Under Management ($ in billions) |
�� | 139.9�� | �� | 142.1�� | �� | 145.6�� | �� | 140.2�� | �� | 135.6�� | �� | � | �� | � | �� | (3%) | �� | (3%) | �� | (3%)�� |
| �� | �� | �� | �� | �� | � | �� | �� | �� | �� | �� | ||||||||||
Note: Totals may not sum due to rounding.
* In Q4 2014, we reclassified certain tax expenses associated with carried interest attributable to former partners and employees as a component of performance fee related compensation expense. Prior periods have been reclassified to conform with our new presentation. Previously reported after-tax DE per common unit is unaffected by this change. See Appendix I and II for our reclassified quarterly results.
�
Page��|��4
| Carry Fund Performance and Net Accrued Performance Fees |
The Carlyle Group carry fund valuations increased 1% during the fourth quarter of 2014. Over the past twelve months, Carlyle�s carry fund portfolio increased 15%. Carlyle�s public portfolio appreciated 7% during Q4 2014, while its private portfolio depreciated 1%. Excluding the impact of energy-related funds on the portfolio, total and public appreciation would have been 6% and 19%, respectively. Carlyle�s portfolio was primarily impacted by appreciation in Carlyle Partners V and Carlyle Europe Partners III, largely offset by depreciation in NGP X, Energy III and Energy IV. Energy was a negative contributor to quarterly appreciation, but its impact on financial results was partially mitigated by the lower economics of our interests in the performance fees from Legacy Energy funds, which range from 16% to 40%, with a weighted average of 20% based on remaining fair value invested.
Net accrued performance fees of $1.8 billion declined from $1.9 billion at the end of Q3 2014 and were largely unchanged compared to Q4 2013. As of Q4 2014, energy-related net accrued performance fees, across Natural Resources, Legacy Energy, and Global Market Strategies, were $60 million, or approximately 3% of total firm net accrued performance fees.
�
| � | �� | 2013 | � | 2014 | � | Annual | � | Net Accrued Performance�Fees | ||||||||||||||
| �� | � |
� | � |
� | � |
� | � | |||||||||||||||
| Fund Valuations ($ in millions) |
�� | 1Q | � | 2Q | � | 3Q | � | 4Q | � | 1Q | � | 2Q | � | 3Q | � | 4Q | � | 2013 | � | 2014 | � | 2014 |
| � |
� | � |
� | � |
� | � | ||||||||||||||||
| �� | � | � | � | � | � | � | � | � | � | � | ||||||||||||
| Overall Carry Fund Appreciation |
�� | 7% | � | 3% | � | 4% | � | 6% | � | 6% | � | 5% | � | 3% | � | 1% | � | 20% | � | 15% | � | |
| �� | � | � | � | � | � | � | � | � | � | � | ||||||||||||
| Corporate Private Equity |
�� | 9% | � | 5% | � | 5% | � | 9% | � | 8% | � | 5% | � | 3% | � | 7% | � | 30% | � | 23% | � | $1,488 |
| Buyout (3) |
�� | 9% | � | 5% | � | 5% | � | 9% | � | 8% | � | 5% | � | 3% | � | 7% | � | 30% | � | 23% | � | $1,422 |
| Growth Capital (3) |
�� | 2% | � | 2% | � | 7% | � | 20% | � | 0% | � | 13% | � | 8% | � | 1% | � | 32% | � | 25% | � | $66 |
| �� | � | � | � | � | � | � | � | � | � | � | ||||||||||||
| Real Assets |
�� | 3% | � | (2%) | � | 1% | � | (1%) | � | 2% | � | 3% | � | 2% | � | (8%) | � | 1% | � | (2%) | � | $163 |
| Real Estate (3) |
�� | 1% | � | 0% | � | 3% | � | 1% | � | 2% | � | 4% | � | 4% | � | 8% | � | 5% | � | 18% | � | $127 |
| Natural Resources (1,2,3) |
�� | � | � | � | � | � | � | 3% | � | (8%) | � | � | (13%) | � | $29 | |||||||
| Legacy Energy (3) |
�� | 4% | � | (3%) | � | 0% | � | (3%) | � | 1% | � | 2% | � | 0% | � | (17%) | � | (2%) | � | (12%) | � | $7 |
| �� | � | � | � | � | � | � | � | � | � | � | ||||||||||||
| Global Market Strategies |
�� | 9% | � | 8% | � | 2% | � | 10% | � | 3% | � | 12% | � | 6% | � | (2%) | � | 28% | � | 20% | � | $70 |
| �� | � | � | � | � | � | � | � | � | � | � | ||||||||||||
| Non-Carry Fund / Other |
�� | � | � | � | � | � | � | � | � | � | � | $31 | ||||||||||
| �� | � | � | � | � | � | � | � | � | � | � | ||||||||||||
| �� | � | � | � | � | � | � | � | � | � | � | � | |||||||||||
| Net Accrued Performance Fees |
�� | � | � | � | � | � | � | � | � | � | � | $1,752 | ||||||||||
| �� | � | � | � | � | � | � | � | � | � | � | � | |||||||||||
| � | �� | � | � | � | � | � | � | � | � | � | � | � | � | � | � | � | � | � | � | � | � | � |
Note: Carlyle�s �carry funds� refer to (i)�those investment funds that we advise, including the buyout funds, growth capital funds, real estate funds, infrastructure funds, certain energy funds and distressed debt and mezzanine funds (but excluding our structured credit funds, hedge funds, business development companies, mutual funds, and fund of funds vehicles), where we receive a special residual allocation of income, which we refer to as a carried interest, in the event that specified investment returns are achieved by the fund and (ii)�those investment funds advised by NGP from which we are entitled to receive a carried interest. Note: Appreciation / (Depreciation) represents unrealized gain / (losses) for the period on a total return basis before fees and expenses. The percentage of return is calculated as: ending remaining investment fair market value plus net investment outflow (sales proceeds minus net purchases) minus beginning remaining investment fair market value divided by beginning remaining investment fair market value. Fund only, does not include co-investment. The Global Market Strategies segment includes carry funds only and does not include structured credit funds, hedge funds, business development companies, and mutual funds.
(1) Natural Resources is comprised of NGP, infrastructure, power, and international energy funds.
(2) NGP X was previously categorized as an NGP management fee fund, but as of July�1, 2014, is categorized as a Natural Resources carry fund. Results include NGP X since July�1, 2014.
(3) We generally earn performance fees (or carried interest) from our carry funds representing a 20% allocation of profits generated on third-party capital after returning the invested capital, the allocation of preferred returns of generally 8% or 9% and return of certain fund costs. Our net interest in the performance fees after allocations to our investment professionals or other parties varies based on each fund. For our Corporate Private Equity, Global Market Strategies, Real Estate and Natural Resources carry funds (excluding NGP) our net interest in performance fees is generally 55%. Our net interest in the performance fees from our NGP carry funds ranges from 40% to 47.5%. Our net interest in the performance fees from our Legacy Energy carry funds generally ranges from 16% to 40%, with a weighted average of 20% based on remaining fair value invested.
�
Page��|��5
| Assets Under Management and Remaining Fair Value of Capital |
�
| � | � | Total Assets Under Management: $194.5 billion as of Q4 2014 (+3% in 2014) |
�
| � | o� | Major drivers of change versus Q3 2014: New capital commitments (+$4.3 billion), offset by net distributions (-$8.1 billion), foreign exchange loss (-$1.8 billion), net redemptions (-$0.9 billion), market depreciation (-$0.7 billion) and changes in CLO/other structured products par value (-$0.6 billion). |
�
| � | o� | Total Dry Powder of $57.9 billion as of Q4 2014, comprised of $24.4 billion in Corporate Private Equity, $1.5 billion in Global Market Strategies, $15.7 billion in Real Assets and $16.2 billion in Investment Solutions. |
�
| � | � | Fee-Earning Assets Under Management: $135.6 billion as of Q4 2014 (-3% in 2014) |
�
| � | o� | Major drivers of change versus Q3 2014: inflows, including fee-paying commitments (+$4.0 billion) and changes in CLO/other structured products par value (+$0.4 billion), offset by net distributions and outflows (-$5.2 billion), foreign exchange loss (-$1.8 billion), market depreciation (-$1.1 billion) and net redemptions (-$0.9 billion). |
�
| � | o� | Since the end of Q3 2014, Fee-Earning AUM has been positively impacted by the addition of new commitments in Carlyle�s latest vintage U.S. Real Estate fund and Europe buyout fund, new international energy fund and new CLOs, in addition to other fundraising activity across the Carlyle platform. |
�
| � | o� | As of Q4 2014, there was $9.4 billion of newly raised capital for which we have not yet commenced charging management fees. |
�
| � | � | Remaining Fair Value of Capital (carry funds only) as of Q4 2014: $63.3 billion |
�
| � | o� | Current Multiple of Invested Capital (MOIC) of remaining fair value of capital: 1.3x. |
�
| � | o� | Remaining fair value of capital in the ground in investments made in 2010 or earlier: 37% of total fair value. |
�
| � | o� | AUM in-carry ratio as of the end of Q4 2014: 63%. |
�
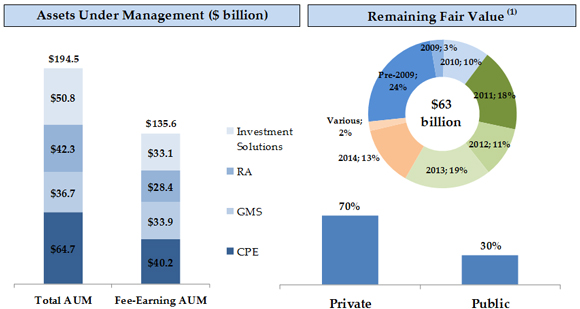
(1) Fair value of remaining carry fund capital in the ground, by vintage. Totals may not sum due to rounding.
Data as of December�31, 2014.
�
Page��|��6
| Non-GAAP Operating Results |
Carlyle�s non-GAAP results for Q4 2014 are provided in the table below:
�
| Carlyle Group Summary | �� | � | � | |
| $ in millions, except unit and per unit amounts | �� | � | � | |
| Economic Net income | �� | Q4�2014� | � | |
| � |
� | |||
| Economic Net Income (pre-tax) |
�� | ��$ | 180.5��� | �� |
| Plus: Benefit for income taxes (1) |
�� | � | 1.7��� | �� |
| �� | � |
� |
� | |
| Economic Net Income, After Taxes |
�� | ��$ | ������������������������182.2�� � | �� |
| �� | � |
� |
� | |
| Adjusted Units (in millions) (2) |
�� | � | 323.5��� | �� |
| Economic Net Income, After Taxes per Adjusted Unit |
�� | ��$ | 0.56��� | �� |
| Distributable Earnings |
�� | |||
| � |
� | |||
| Distributable Earnings |
�� | ��$ | 310.6��� | �� |
| Less: Estimated foreign, state, and local taxes (3) |
�� | � | 13.0��� | �� |
| �� | � |
� |
� | |
| Distributable Earnings, After Taxes |
�� | ��$ | 297.6��� | �� |
| �� | � |
� |
� | |
| Allocating Distributable Earnings for only public unitholders of The Carlyle Group L.P. |
�� | |||
| Distributable Earnings to The Carlyle Group L.P. |
�� | ��$ | 64.1��� | �� |
| Less: Estimated current corporate income taxes (4) |
�� | � | 1.3�� | �� |
| �� | � |
� |
� | |
| Distributable Earnings to The Carlyle Group L.P. net of corporate income taxes |
�� | ��$ | 62.8�� | �� |
| �� | � |
� |
� | |
| Units in public float (in millions)(5) |
�� | � | 68.9��� | �� |
| Distributable Earnings, net, per The Carlyle Group L.P. common unit outstanding |
�� | ��$ | 0.91��� | �� |
| � |
� | |||
(1) Represents the implied benefit for income taxes that was calculated using a similar methodology applied in calculating the tax provision for The Carlyle Group L.P., without any reduction for noncontrolling interests.
(2)�For information regarding our calculation of Adjusted Units, please see page 30.
(3) Represents the implied provision for current income taxes that was calculated using a similar methodology applied in calculating the current tax provision for The Carlyle Group L.P., without any reduction for noncontrolling interests.
(4)�Represents current corporate income taxes payable upon distributable earnings allocated to Carlyle Holdings I GP Inc. and estimated current Tax Receivable Agreement payments owed.
(5) Includes 1,148,616 common units that we estimate will be issued in February 2015 in connection with the vesting of deferred restricted common units, an exchange of Carlyle Holdings partnership units, and an acquisition earnout. These newly issued units are included in this calculation because they will participate in the unitholder distribution that will be paid in March 2015.
�
Page��|��7
| Corporate Private Equity (CPE) |
�
�

�
| � | � | Distributable Earnings (DE): $263 million for Q4 2014 and $790 million for 2014. |
�
| � | o� | Fee-Related Earnings were $33 million in Q4 2014 and $129 million for 2014, compared to $4 million in Q4 2013 and $9 million for 2013. The increase in Q4 2014 was driven by higher relative management fees compared to Q4 2013, as well as lower compensation expense due to lower than projected annual bonus payments. |
�
| � | o� | Realized Net Performance Fees were $223 million for Q4 2014 and $644 million for 2014, compared to $271 million and $513 million for Q4 2013 and 2013, respectively. Carlyle Partners V and Carlyle Europe Partners III generated the majority of CPE performance fees in Q4, with additional positive impact from Carlyle Partners IV and certain coinvestment vehicles. |
�
| � | � | Economic Net Income (ENI): $236 million for Q4 2014 and $862 million for 2014. The decline in both periods compared to Q4 2013 and 2013 is largely attributable to the impact in 2013 of Carlyle Europe Partners III and Carlyle Asia Partners III transitioning through the catch up phase and into a full carry position, which increased Q4 2013 net performance fees by $350 million. |
�
| � | o� | CPE carry fund valuations increased 7% in Q4 2014 and 23% for 2014, compared to an increase of 9% in Q4 2013 and 30% for 2013. |
�
| � | o� | Net Performance Fees of $208 million for Q4 2014 and $744 million for 2014, compared to $535 million for Q4 2013 and $1.0 billion for 2013. |
�
| � | � | Total Assets Under Management (AUM): $64.7 billion as of Q4 2014. |
�
| � | o� | Funds Raised in Q4 2014 of $2.7 billion include additional closings of our latest vintage Europe and Japan buyout funds and our latest Europe technology fund. |
�
| � | o� | Fee-Earning Assets Under Management were $40.2 billion as of Q4 2014, 6% lower than the $43.0 billion as of Q4 2013, with $4.8 billion in inflows, including fee-paying commitments, offset by $6.5 billion in outflows, including distributions and basis step downs, and $1.3 billion in foreign exchange loss. |
�
| Corporate Private Equity | �� | Quarter | �� | Annual | �� | % Change | ||||||||||||||
| � | �� | � |
�� | � | ||||||||||||||||
| $ in millions, except where noted | �� | Q4�2013�� | �� | Q1�2014�� | �� | Q2�2014�� | �� | Q3�2014�� | �� | Q4�2014����� | �� | 2014 | �� | 2013 | �� | ��QoQ�� | �� | YoY | �� | ��Annual�� |
| �� | �� | �� | �� | �� | � | �� | � |
�� | � |
�� | � | |||||||||
| � Economic Net Income |
�� | 549 | �� | 258 | �� | 208 | �� | 159 | �� | 236� | �� | 862 | �� | 1,054 | �� | 49% | �� | (57%) | �� | (18%)� |
| � | �� | � | �� | � | �� | � | �� | � | �� | � | �� | � | �� | � | �� | � | �� | � | �� | � |
| � Fee-Related Earnings |
�� | 4 | �� | 12 | �� | 45 | �� | 38 | �� | 33� | �� | 129 | �� | 9 | �� | (13%) | �� | NM | �� | NM� |
| � | �� | � | �� | � | �� | � | �� | � | �� | � | �� | � | �� | � | �� | � | �� | � | �� | � |
| � Net Performance Fees |
�� | 535 | �� | 246 | �� | 167 | �� | 124 | �� | 208� | �� | 744 | �� | 1,026 | �� | 68% | �� | (61%) | �� | (27%)� |
| � | �� | � | �� | � | �� | � | �� | � | �� | � | �� | � | �� | � | �� | � | �� | � | �� | � |
| � Realized Net Performance Fees |
�� | 271 | �� | 133 | �� | 215 | �� | 72 | �� | 223� | �� | 644 | �� | 513 | �� | 208% | �� | (18%) | �� | 26%� |
| � | �� | � | �� | � | �� | � | �� | � | �� | � | �� | � | �� | � | �� | � | �� | � | �� | � |
| � Distributable Earnings |
�� | 286 | �� | 148 | �� | 262 | �� | 117 | �� | 263� | �� | 790 | �� | 538 | �� | 126% | �� | (8%) | �� | 47%� |
| � | �� | � | �� | � | �� | � | �� | � | �� | � | �� | � | �� | � | �� | � | �� | � | �� | � |
| � Total Assets Under Management ($ in billions) |
�� | 64.9 | �� | 64.5 | �� | 64.5 | �� | 63.6 | �� | 64.7� | �� | � | �� | � | �� | 2% | �� | (0%) | �� | (0%)� |
| � Fee-Earning Assets Under Management ($ in billions) |
�� | 43.0 | �� | 42.9 | �� | 43.0 | �� | 42.0 | �� | 40.2� | �� | � | �� | � | �� | (4%) | �� | (6%) | �� | (6%)� |
| �� | �� | �� | �� | �� | � | �� | �� | �� | �� | �� | ||||||||||
Note: Totals may not sum due to rounding.
�
Page��|��8
| Global Market Strategies (GMS) |
�
�

Note: Funds Raised excludes acquisitions, but includes hedge funds, mutual fund and CLOs/other structured products. Equity Invested and Realized Proceeds are for carry funds only.
�
�
| � | � | Distributable Earnings (DE): $24 million for Q4 2014 and $91 million for 2014. |
�
| � | o� | Fee-Related Earnings were $18 million in Q4 2014 and $64 million in 2014, compared to $21 million in Q4 2013 and $86 million in 2013. The decline in Q4 2014 was driven primarily by lower management fees owing to $8 million in subordinated management fees realized in Q4 2013 that did not recur. The decline in full year FRE is largely attributable to lower management fees and higher annual compensation expenses compared to 2013, primarily attributable to the addition of new employees related to new products in 2014. |
�
| � | o� | Realized Net Performance Fees were $5 million for Q4 2014 and $19 million in 2014, compared to $79 million for Q4 2013 and $110 million in 2013. Realized net performance fees declined compared to both periods due to the absence of realized net performance fees from our hedge fund partnerships, which totaled $77 million in Q4 2013 and $85 million in 2013. |
�
| � | o� | Realized Investment Income was $2 million for Q4 2014 and $8 million for 2014. |
�
| � | � | Economic Net Income (ENI): $13 million for Q4 2014 and $115 million for 2014. |
�
| � | o� | GMS carry fund valuations decreased 2% in Q4 2014, compared with 10% appreciation in Q4 2013. The asset-weighted hedge fund performance of our reported funds was -9% in Q4 2014. |
�
| � | o� | Net Performance Fees of $1 million for Q4 2014 and $60 million for 2014, compared to $43 million for Q4 2013 and $129 million for 2013. Relative to Q4 2013, net performance fees in Q4 2014 were negatively impacted by the lack of hedge fund performance fees and lower carry fund performance. |
�
| � | � | Total Assets Under Management (AUM): $36.7 billion as of Q4 2014 (+4% in 2014). |
�
| � | o� | Fee-Earning AUM of $33.9 billion increased 1% versus Q4 2013. |
�
| � | o� | Total hedge fund AUM ended Q4 2014 at $13.4 billion. Net redemption notifications received during Q4 2014 will reduce January�1, 2015 hedge fund AUM by approximately $2.2 billion. |
�
| � | o� | GMS carry fund AUM ended Q4 2014 at $4.0 billion. |
�
| � | o� | Total structured credit and other products AUM ended Q4 2014 at $18.5 billion. |
�
| Global Market Strategies | �� | Quarter | �� | Annual | �� | % Change | ||||||||||||||
| � |
�� | � |
�� | � | ||||||||||||||||
| $ in millions, except where noted | �� | Q4�2013 | �� | Q1�2014 | �� | Q2�2014 | �� | Q3�2014�� | � | Q4�2014�� | �� | 2014 | �� | 2013 | �� | QoQ | �� | YoY | � | Annual |
| �� | �� | �� | �� | � | �� | � |
�� | � | ||||||||||||
| � Economic Net Income |
�� | 67 | �� | 56 | �� | 44 | �� | 1� | � | 13� | �� | 115 | �� | 228 | �� | NM | �� | (80%) | � | (49%)�� |
| � | �� | � | �� | � | �� | � | �� | � | � | � | �� | � | �� | � | �� | � | �� | � | � | � |
| � Fee-Related Earnings |
�� | 21 | �� | 17 | �� | 17 | �� | 14� | � | 18� | �� | 64 | �� | 86 | �� | 29% | �� | (18%) | � | (25%)�� |
| � | �� | � | �� | � | �� | � | �� | � | � | � | �� | � | �� | � | �� | � | �� | � | � | � |
| � Net Performance Fees |
�� | 43 | �� | 39 | �� | 28 | �� | (8)� | � | 1� | �� | 60 | �� | 129 | �� | 106% | �� | (99%) | � | (54%)�� |
| � | �� | � | �� | � | �� | � | �� | � | � | � | �� | � | �� | � | �� | � | �� | � | � | � |
| � Realized Net Performance Fees |
�� | 79 | �� | 5 | �� | 4 | �� | 5� | � | 5� | �� | 19 | �� | 110 | �� | (10%) | �� | (94%) | � | (83%)�� |
| � | �� | � | �� | � | �� | � | �� | � | � | � | �� | � | �� | � | �� | � | �� | � | � | � |
| � Distributable Earnings |
�� | 102 | �� | 22 | �� | 22 | �� | 23� | � | 24� | �� | 91 | �� | 214 | �� | 4% | �� | (77%) | � | (57%)�� |
| � | �� | � | �� | � | �� | � | �� | � | � | � | �� | � | �� | � | �� | � | �� | � | � | � |
| � Total Assets Under Management ($ in billions) |
�� | 35.5 | �� | 36.5 | �� | 38.2 | �� | 38.9� | � | 36.7� | �� | � | �� | � | �� | (6%) | �� | 4% | � | 4%�� |
| � | ||||||||||||||||||||
| � Fee-Earning Assets Under Management ($ in billions) |
�� | 33.4 | �� | 34.3 | �� | 35.4 | �� | 34.8� | � | 33.9� | �� | � | �� | � | �� | (3%) | �� | 1% | � | 1%�� |
| � | ||||||||||||||||||||
| � | �� | � | �� | � | �� | � | �� | � | � | � | �� | � | �� | � | �� | � | �� | � | � | � |
| � Funds Raised, excluding hedge funds ($ in billions) |
�� | 0.7 | �� | 1.5 | �� | 1.7 | �� | 1.4� | � | 1.2� | �� | 5.9 | �� | 4.7 | �� | (14%) | �� | 72% | � | � |
| � Hedge Fund Net Inflows ($ in billions) |
�� | (0.2) | �� | 0.3 | �� | 0.5 | �� | 0.3� | � | (0.1)� | �� | 1.0 | �� | 1.0 | �� | (117%) | �� | 76% | � | � |
| �� | �� | �� | �� | � | � | �� | �� | �� | �� | � | ||||||||||
Note: Totals may not sum due to rounding. Funds Raised excludes the impact of acquisitions.
�
Page��|��9
| Real Assets (RA) |
�
�

Note:�Funds�Raised�excludes�acquisitions.�Equity�Invested�and�Realized�Proceeds�are� for�carry�funds�only.
�
| � | � | Distributable Earnings (DE): $12 million for Q4 2014 and $48 million for 2014. |
�
| � | o� | Fee-Related Earnings were $10 million in Q4 2014 and $22 million for 2014, compared to $3 million in Q4 2013 and $25 million in 2013. The increase in Q4 2014 Fee-Related Earnings is primarily attributable to higher management fees driven by our latest vintage U.S. Real Estate and our international energy funds. In Q4 2014, Real Assets generated $5 million in catch-up management fee revenue, driven primarily by additional closings in the latest vintage U.S. Real Estate fund. |
�
| � | o� | Realized Net Performance Fees were $31 million for Q4 2014 and $58 million for 2014, compared to $1 million in Q4 2013 and $45 million in 2013. During 2014, U.S. Real Estate funds had realized net performance fees of $40 million, compared to $7 million in 2013. |
�
| � | o� | Realized Investment Income/(Loss) was ($29) million for Q4 2014 and ($32) million for 2014, attributable to realized losses on a mezzanine loan investment to one of our European Real Estate funds and our investment in Urbplan. At December�31, 2014, our remaining investment in the mezzanine loan was approximately 24�million Euros and in Urbplan was approximately $21 million. However, we estimate that Urbplan will require approximately $25�million of additional capital in 2015 to complete its expected business turnaround. |
�
| � | � | Economic Net Income/(Loss) (ENI): ($76) million for Q4 2014 and ($59) million for 2014. |
�
| � | o� | Real Assets carry fund valuations depreciated 8% in Q4 2014 and 2% in 2014, compared to a decline of 1% in Q4 2013 and an increase of 1% in 2013. In Q4 2014, Real Estate carry funds increased 8%, Natural Resources carry funds declined 8%, and Legacy Energy carry funds declined 17%. |
�
| � | o� | Net Performance Fees of ($72) million for Q4 2014 and ($13) million for 2014, compared to ($3) million for Q4 2013 and $31 million for 2013, with the decline primarily driven by losses in energy-related funds. |
�
| � | o� | Unrealized investment income of $20 million for Q4 2014 was primarily driven by the reclassification of prior unrealized losses to realized losses during Q4 2014. |
�
| � | � | Total Assets Under Management (AUM): $42.3 billion as of Q4 2014 (+9% in 2014). |
�
| � | o� | Funds Raised in Q4 2014 of $1.8 billion were driven largely by closings in our latest vintage U.S. Real Estate and power funds, our new international energy fund and NGP�s latest generation energy fund, NGP XI. |
�
| � | o� | Fee-Earning AUM of $28.4 billion was unchanged versus Q4 2013. Fee-Earning AUM does not yet include $3.5 billion of funds raised for NGP XI through Q4 2014. |
�
| Real Assets | �� | Quarter | �� | Annual | �� | % Change | ||||||||||||||
| � | �� | � |
�� | � | ||||||||||||||||
| $ in millions, except where noted | �� | Q4�2013 | �� | Q1�2014 | �� | Q2�2014 | �� | Q3�2014 | �� | Q4�2014 | �� | 2014 | �� | 2013 | �� | QoQ | �� | YoY | �� | Annual |
| �� | �� | �� | �� | �� | � | �� | � |
�� | � | |||||||||||
| � Economic Net Income/(Loss) |
�� | (65) | �� | (17) | �� | 23 | �� | 11 | �� | (76) | �� | (59) | �� | (34) | �� | NM | �� | (16%) | �� | (74%)�� |
| � | �� | � | �� | � | �� | � | �� | � | �� | � | �� | � | �� | � | �� | � | �� | � | �� | � |
| � Fee-Related Earnings |
�� | 3 | �� | (0) | �� | 9 | �� | 3 | �� | 10 | �� | 22 | �� | 25 | �� | 274% | �� | 248% | �� | (13%)�� |
| � | �� | � | �� | � | �� | � | �� | � | �� | � | �� | � | �� | � | �� | � | �� | � | �� | � |
| � Net Performance Fees |
�� | (3) | �� | 6 | �� | 33 | �� | 20 | �� | (72) | �� | (13) | �� | 31 | �� | NM | �� | NM | �� | (142%)�� |
| � | �� | � | �� | � | �� | � | �� | � | �� | � | �� | � | �� | � | �� | � | �� | � | �� | � |
| � Realized Net Performance Fees |
�� | 1 | �� | 0 | �� | 9 | �� | 19 | �� | 31 | �� | 58 | �� | 45 | �� | 66% | �� | NM | �� | 31%�� |
| � | �� | � | �� | � | �� | � | �� | � | �� | � | �� | � | �� | � | �� | � | �� | � | �� | � |
| � Distributable Earnings |
�� | (2) | �� | 2 | �� | 26 | �� | 8 | �� | 12 | �� | 48 | �� | 46 | �� | 45% | �� | 604% | �� | 3%�� |
| � | �� | � | �� | � | �� | � | �� | � | �� | � | �� | � | �� | � | �� | � | �� | � | �� | � |
| � Total Assets Under Management ($ in billions) |
�� | 38.7 | �� | 40.7 | �� | 43.3 | �� | 45.8 | �� | 42.3 | �� | � | �� | � | �� | (8%) | �� | 9% | �� | 9%�� |
| � Fee-Earning Assets Under Management ($ in billions) |
�� | 28.4 | �� | 27.4 | �� | 27.9 | �� | 28.2 | �� | 28.4 | �� | � | �� | � | �� | 1% | �� | (0%) | �� | (0%)�� |
| �� | �� | �� | �� | �� | � | �� | �� | �� | �� | �� | ||||||||||
Note: Totals may not sum due to rounding.
�
Page��|��10
| Investment Solutions |
�
| � | � | Distributable Earnings (DE): $12 million for Q4 2014 and $44 million for 2014. |
�
| � | o� | Fee-Related Earnings were $6 million for Q4 2014 and $32 million for 2014, compared to $10 million for Q4 2013 and $32 million for 2013, with higher management fees offset by higher compensation and general and administrative expenses related to investments in our infrastructure to integrate various acquired businesses into Investment Solutions. |
�
| � | o� | Realized Net Performance Fees were $5 million for Q4 2014 and $12 million for 2014, compared to $4 million in Q4 2013 and $7 million in 2013. |
�
| � | � | Economic Net Income (ENI): $7 million for Q4 2014 and $45 million for 2014. |
�
| � | o� | Economic Net Income in 2014 increased 19% over 2013, largely driven by higher net performance fees at AlpInvest and the impact of the Diversified Global Asset Management (DGAM) and Metropolitan Real Estate (MRE) acquisitions. |
�
| � | � | During Q4 2014, we reclassified certain tax expenses associated with carried interest attributable to former partners and employees as a component of performance fee related compensation expense. All prior interim periods have been reclassified to conform with our new presentation. As a result of this change, for Investment Solutions for full year 2014, ENI decreased $25.3 million and DE decreased $5.2 million. However, there was no impact on Carlyle�s after-tax ENI per Adjusted Unit or after-tax DE per common unit. See Appendix�I and II for more information regarding our reclassified quarterly results. |
�
| � | � | Total Assets Under Management (AUM): $50.8 billion as of Q4 2014 (+2% in 2014). |
�
| � | o� | Total AUM declined 6% from Q3 2014 due to negative foreign exchange impact of $1.1 billion, distributions of $2.7 billion, and net redemptions of $0.9 billion, partially offset by $1.2 billion in market appreciation. |
�
| � | o� | Fee-Earning AUM of $33.1 billion declined 6% versus Q4 2013, as $5.9 billion of inflows, including fee-paying commitments and $2.9 billion in acquisition related Fee-Earning AUM, were partially offset by $6.3 billion in outflows including distributions, $3.8 billion in foreign exchange losses and $1.0 billion in net redemptions. |
�
| Investment Solutions | �� | Quarter | �� | Annual | �� | % Change | ||||||||||||||
| � | �� | � |
�� | � | ||||||||||||||||
| $ in millions, except where noted | �� | Q4�2013�(1) | �� | Q1�2014�(2) | �� | Q2�2014 | �� | Q3�2014�� | �� | Q4�2014 | �� | 2014 | �� | 2013 | �� | QoQ | �� | YoY | �� | Annual |
| �� | �� | �� | �� | �� | � | �� | � |
�� | � | |||||||||||
| � Economic Net Income (Loss) (3) |
�� | 12 | �� | 14 | �� | 14 | �� | 10 | �� | 7 | �� | 45 | �� | 38 | �� | (29%) | �� | (43%) | �� | 19%�� |
| � | �� | � | �� | � | �� | � | �� | � | �� | � | �� | � | �� | � | �� | � | �� | � | �� | � |
| � Fee-Related Earnings |
�� | 10 | �� | 9 | �� | 9 | �� | 8 | �� | 6 | �� | 32 | �� | 32 | �� | (16%) | �� | (37%) | �� | (0%)�� |
| � | �� | � | �� | � | �� | � | �� | � | �� | � | �� | � | �� | � | �� | � | �� | � | �� | � |
| � Net Performance Fees (3) |
�� | 2 | �� | 6 | �� | 6 | �� | 4 | �� | 2 | �� | 17 | �� | 6 | �� | (46%) | �� | (17%) | �� | 183%�� |
| � | �� | � | �� | � | �� | � | �� | � | �� | � | �� | � | �� | � | �� | � | �� | � | �� | � |
| � Realized Net Performance Fees (3) |
�� | 4 | �� | 2 | �� | 3 | �� | 2 | �� | 5 | �� | 12 | �� | 7 | �� | 200% | �� | 42% | �� | 62%�� |
| � | �� | � | �� | � | �� | � | �� | � | �� | � | �� | � | �� | � | �� | � | �� | � | �� | � |
| � Distributable Earnings (3) |
�� | 14 | �� | 11 | �� | 12 | �� | 9 | �� | 12 | �� | 44 | �� | 40 | �� | 26% | �� | (15%) | �� | 11%�� |
| � | �� | � | �� | � | �� | � | �� | � | �� | � | �� | � | �� | � | �� | � | �� | � | �� | � |
| � Total Assets Under Management ($ in billions) |
�� | 49.8 | �� | 57.2 | �� | 56.7 | �� | 54.3 | �� | 50.8 | �� | � | �� | � | �� | (6%) | �� | 2% | �� | 2%�� |
| � Fee-Earning Assets Under Management ($ in billions) |
�� | 35.1 | �� | 37.5 | �� | 39.4 | �� | 35.3 | �� | 33.1 | �� | � | �� | � | �� | (6%) | �� | (6%) | �� | (6%)�� |
| �� | �� | �� | �� | �� | � | �� | �� | �� | �� | �� | ||||||||||
Note: Totals may not sum due to rounding.
(1) - During Q4 2013, Carlyle acquired Metropolitan Real Estate Equity Management, LLC (MRE). As such, amounts since the acquisition include the financial results of MRE.
(2) - During Q1 2014, Carlyle acquired Diversified Global Asset Management Corporation (DGAM). As such, amounts since the acquisition include the financial results of DGAM.
(3) - In Q4 2014, we reclassified certain tax expenses associated with carried interest attributable to former partners and employees as a component of performance fee related compensation expense. Prior periods have been reclassified to conform with our new presentation. See Appendix I and II for our reclassified quarterly results.
�
Page��|��11
| Balance Sheet Highlights |
The amounts presented below exclude the effect of U.S. GAAP consolidation eliminations on investments and accrued performance fees, as well as cash and debt associated with Carlyle�s consolidated funds. All data is as of December�31, 2014.
�
| � | � | Cash and Cash Equivalents of $1.2 billion. |
| � | � | On-balance sheet investments attributable to unitholders of $361 million, excluding the equity investment by Carlyle in NGP Energy Capital Management. |
| � | � | Net accrued performance fees attributable to unitholders of $1.8 billion. These performance fees are comprised of $3.8 billion of gross accrued performance fees, less $0.1 billion in accrued giveback obligation, $1.8 billion in accrued performance fee compensation and non-controlling interest and $0.1 billion of net accrued performance fees realized in December 2014 and collected in January 2015. |
| � | � | Loans payable and senior notes totaling $1.1 billion. |
Conference Call
Carlyle will host a conference call at 8:30 a.m. EST on Wednesday, February�11, 2015 to announce its fourth quarter and full year 2014 financial results.
The call may be accessed by dialing +1 (800)�850-2903 (U.S.) or +1 (253)�237-1169 (international) and referencing �The Carlyle Group Financial Results Call.� The conference call will be webcast simultaneously via a link on Carlyle�s investor relations website at ir.carlyle.com and an archived replay of the webcast also will be available on the website soon after the live call.
About The Carlyle Group
The Carlyle Group (NASDAQ: CG) is a global alternative asset manager with $194 billion of assets under management across 128 funds and 142 fund of funds vehicles as of December�31, 2014. Carlyle�s purpose is to invest wisely and create value on behalf of its investors, many of whom are public pensions. Carlyle invests across four segments � Corporate Private Equity, Real Assets, Global Market Strategies and Investment Solutions � in Africa, Asia, Australia, Europe, the Middle East, North America and South America. Carlyle has expertise in various industries, including: aerospace, defense�& government services, consumer�& retail, energy, financial services, healthcare, industrial, Real Estate, technology�& business services, telecommunications�& media and transportation. The Carlyle Group employs more than 1,650 people in 40 offices across six continents.
Web: www.carlyle.com
�
Page��|��12
Videos: www.youtube.com/onecarlyle
Tweets: www.twitter.com/onecarlyle
Podcasts: www.carlyle.com/about-carlyle/market-commentary
Contacts:
Public Market Investor Relations
Daniel Harris
Phone: 212-813-4527
Media
Elizabeth Gill
Phone: 202-729-5385
�
Page��|��13
Forward Looking Statements
This press release may contain forward-looking statements within the meaning of Section�27A of the Securities Act of 1933 and Section�21E of the Securities Exchange Act of 1934. These statements include, but are not limited to, statements related to our expectations regarding the performance of our business, our financial results, our liquidity and capital resources and other non-historical statements. You can identify these forward-looking statements by the use of words such as �outlook,� �believes,� �expects,� �potential,� �continues,� �may,� �will,� �should,� �seeks,� �approximately,� �predicts,� �intends,� �plans,� �estimates,� �anticipates� or the negative version of these words or other comparable words. These statements are subject to risks, uncertainties and assumptions, including those described under the section entitled �Risk Factors� in our Annual Report on Form 10-K for the year ended December�31, 2013 filed with the SEC on February�27, 2014, as such factors may be updated from time to time in our periodic filings with the SEC, which are accessible on the SEC�s website at www.sec.gov. These factors should not be construed as exhaustive and should be read in conjunction with the other cautionary statements that are included in this release and in our filings with the SEC. We undertake no obligation to publicly update or review any forward-looking statements, whether as a result of new information, future developments or otherwise, except as required by applicable law.
This release does not constitute an offer for any Carlyle fund.
�
Page��|��14
The Carlyle Group L.P.
GAAP Statement of Operations (Unaudited)
�
| � | � | ����������Three�Months�Ended��� ������� | � | � | � | � | � | � | ����������Year�Ended����� ����� | � | ||||||||||
| � | � | Dec 31, 2014 |
� | � | Dec 31, 2013 |
� | � | � | � | � | � | Dec 31, 2014 |
� | � | Dec 31, 2013 |
� | ||||
| � | � | (Dollars in millions, except unit and per unit data) | � | |||||||||||||||||
| Revenues |
� | � | � | � | � | � | ||||||||||||||
| Fund management fees |
� | ��$ | 281.3�� | �� | � | ��$ | 253.1�� | �� | � | � | � | ��$ | 1,166.3�� | �� | � | ��$ | 984.6�� | �� | ||
| Performance fees |
� | � | � | � | � | � | ||||||||||||||
| Realized |
� | � | 484.8�� | �� | � | � | 612.1�� | �� | � | � | � | � | 1,328.7�� | �� | � | � | 1,176.7�� | �� | ||
| Unrealized |
� | � | (160.7)� | �� | � | � | 541.2�� | �� | � | � | � | � | 345.7�� | �� | � | � | 1,198.6�� | �� | ||
| � | � |
� |
� | � | � |
� |
� | � | � | � | � |
� |
� | � | � |
� |
� | |||
| Total performance fees |
� | � | 324.1�� | �� | � | � | 1,153.3�� | �� | � | � | � | � | 1,674.4�� | �� | � | � | 2,375.3�� | �� | ||
| Investment income (loss) |
� | � | � | � | � | � | ||||||||||||||
| Realized |
� | � | (5.7)� | �� | � | � | 9.0�� | �� | � | � | � | � | 23.7�� | �� | � | � | 14.4�� | �� | ||
| Unrealized |
� | � | (35.1)� | �� | � | � | (6.6)� | �� | � | � | � | � | (30.9)� | �� | � | � | 4.4�� | �� | ||
| � | � |
� |
� | � | � |
� |
� | � | � | � | � |
� |
� | � | � |
� |
� | |||
| Total investment income (loss) |
� | � | (40.8)� | �� | � | � | 2.4�� | �� | � | � | � | � | (7.2)� | �� | � | � | 18.8�� | �� | ||
| Interest and other income |
� | � | 4.0�� | �� | � | � | 2.7�� | �� | � | � | � | � | 20.6�� | �� | � | � | 11.9�� | �� | ||
| Interest and other income of Consolidated Funds |
� | � | 227.5�� | �� | � | � | 219.8�� | �� | � | � | � | � | 956.0�� | �� | � | � | 1,043.1�� | �� | ||
| Revenue of a consolidated real estate VIE |
� | � | 43.0�� | �� | � | � | 7.5�� | �� | � | � | � | � | 70.2�� | �� | � | � | 7.5�� | �� | ||
| � | � |
� |
� | � | � |
� |
� | � | � | � | � |
� |
� | � | � |
� |
� | |||
| Total revenues |
� | � | 839.1�� | �� | � | � | 1,638.8�� | �� | � | � | � | � | 3,880.3�� | �� | � | � | 4,441.2�� | �� | ||
| Expenses |
� | � | � | � | � | � | ||||||||||||||
| Compensation and benefits |
� | � | � | � | � | � | ||||||||||||||
| Base compensation |
� | � | 173.2�� | �� | � | � | 181.7�� | �� | � | � | � | � | 789.0�� | �� | � | � | 738.0�� | �� | ||
| Equity-based compensation |
� | � | 81.1�� | �� | � | � | 65.4�� | �� | � | � | � | � | 344.0�� | �� | � | � | 322.4�� | �� | ||
| Performance fee related |
� | � | � | � | � | � | ||||||||||||||
| Realized |
� | � | 222.4�� | �� | � | � | 307.0�� | �� | � | � | � | � | 590.7�� | �� | � | � | 539.2�� | �� | ||
| Unrealized |
� | � | (34.1)� | �� | � | � | 270.0�� | �� | � | � | � | � | 282.2�� | �� | � | � | 644.5�� | �� | ||
| � | � |
� |
� | � | � |
� |
� | � | � | � | � |
� |
� | � | � |
� |
� | |||
| Total compensation and benefits |
� | � | 442.6�� | �� | � | � | 824.1�� | �� | � | � | � | � | 2,005.9�� | �� | � | � | 2,244.1�� | �� | ||
| General, administrative and other expenses |
� | � | 156.4�� | �� | � | � | 128.3�� | �� | � | � | � | � | 526.8�� | �� | � | � | 496.4�� | �� | ||
| Interest |
� | � | 14.6�� | �� | � | � | 11.7�� | �� | � | � | � | � | 55.7�� | �� | � | � | 45.5�� | �� | ||
| Interest and other expenses of Consolidated Funds |
� | � | 285.6�� | �� | � | � | 221.6�� | �� | � | � | � | � | 1,042.0�� | �� | � | � | 890.6�� | �� | ||
| Interest and other expenses of a consolidated real estate VIE |
� | � | 45.8�� | �� | � | � | 33.8�� | �� | � | � | � | � | 175.3�� | �� | � | � | 33.8�� | �� | ||
| Other non-operating (income) expense |
� | � | (16.3)� | �� | � | � | (18.4)� | �� | � | � | � | � | (30.3)� | �� | � | � | (16.5)� | �� | ||
| � | � |
� |
� | � | � |
� |
� | � | � | � | � |
� |
� | � | � |
� |
� | |||
| Total expenses |
� | � | 928.7�� | �� | � | � | 1,201.1�� | �� | � | � | � | � | 3,775.4�� | �� | � | � | 3,693.9�� | �� | ||
| Other income |
� | � | � | � | � | � | ||||||||||||||
| Net investment gains (losses) of Consolidated Funds |
� | � | (107.5)� | �� | � | � | 276.6�� | �� | � | � | � | � | 887.0�� | �� | � | � | 696.7�� | �� | ||
| � | � |
� |
� | � | � |
� |
� | � | � | � | � |
� |
� | � | � |
� |
� | |||
| Income (Loss) before provision for income taxes |
� | � | (197.1)� | �� | � | � | 714.3�� | �� | � | � | � | � | 991.9�� | �� | � | � | 1,444.0�� | �� | ||
| Provision for income taxes |
� | � | 12.9�� | �� | � | � | 36.8�� | �� | � | � | � | � | 76.8�� | �� | � | � | 96.2�� | �� | ||
| � | � |
� |
� | � | � |
� |
� | � | � | � | � |
� |
� | � | � |
� |
� | |||
| Net income (loss) |
� | � | (210.0)� | �� | � | � | 677.5�� | �� | � | � | � | � | 915.1�� | �� | � | � | 1,347.8�� | �� | ||
| Net income (loss) attributable to non-controlling interests in consolidated entities |
� | � | (261.9)� | �� | � | � | 234.6�� | �� | � | � | � | � | 485.5�� | �� | � | � | 676.0�� | �� | ||
| � | � |
� |
� | � | � |
� |
� | � | � | � | � |
� |
� | � | � |
� |
� | |||
| Net income attributable to Carlyle Holdings |
� | � | 51.9�� | �� | � | � | 442.9�� | �� | � | � | � | � | 429.6�� | �� | � | �$ | 671.8�� | �� | ||
| Net income attributable to non-controlling interests in Carlyle Holdings |
� | � | 35.6�� | �� | � | � | 371.6�� | �� | � | � | � | � | 343.8�� | �� | � | � | 567.7�� | �� | ||
| � | � |
� |
� | � | � |
� |
� | � | � | � | � |
� |
� | � | � |
� |
� | |||
| Net income attributable to The Carlyle Group L.P. |
� | ��$ | 16.3�� | �� | � | ��$ | 71.3�� | �� | � | � | � | �$ | 85.8�� | �� | � | �$ | 104.1�� | �� | ||
| � | � |
� |
� | � | � |
� |
� | � | � | � | � |
� |
� | � | � |
� |
� | |||
| Net income attributable to The Carlyle Group L.P. per common unit |
� | � | � | � | � | � | ||||||||||||||
| Basic (1) |
� | ��$ | 0.24�� | �� | � | ��$ | 1.45�� | �� | � | � | � | �$ | 1.35�� | �� | � | �$ | 2.24�� | �� | ||
| � | � |
� |
� | � | � |
� |
� | � | � | � | � |
� |
� | � | � |
� |
� | |||
| Diluted (1)�(2) |
� | ��$ | 0.23�� | �� | � | ��$ | 1.17�� | �� | � | � | � | �$ | 1.23�� | �� | � | �$ | 2.05�� | �� | ||
| � | � |
� |
� | � | � |
� |
� | � | � | � | � |
� |
� | � | � |
� |
� | |||
| Weighted-average common units |
� | � | � | � | � | � | ||||||||||||||
| Basic |
� | � | 66,841,549�� | �� | � | � | 48,426,158�� | �� | � | � | � | � | 62,788,634�� | �� | � | � | 46,135,229�� | �� | ||
| � | � |
� |
� | � | � |
� |
� | � | � | � | � |
� |
� | � | � |
� |
� | |||
| Diluted |
� | � | 298,047,512�� | �� | � | � | 285,665,602�� | �� | � | � | � | � | 68,461,157�� | �� | � | � | 278,250,489�� | �� | ||
| � | � |
� |
� | � | � |
� |
� | � | � | � | � |
� |
� | � | � |
� |
� | |||
(1) - Excluded from net income attributable to The Carlyle Group L.P. was approximately $0.3 million and $1.3 million that was allocable to participating securities under the two-class method for the three months and year ended December�31, 2014, respectively, and $1.0 million and $0.9 million for the three months and year ended December�31, 2013, respectively.
(2) - Included in net income attributable to The Carlyle Group L.P. per common unit on a fully diluted basis is incremental net income from the assumed exchange of Carlyle Holdings partnership units of $51.1 million, $264.3 million and $465.9 million for the three months ended December�31, 2014, the three months ended December�31, 2013 and the year ended December�31, 2013, respectively.
�
Page��|��15
Total Segment Information (Unaudited)
The following table sets forth information in the format used by management when making resource deployment decisions and in assessing the performance of our segments. The information below is the aggregate results of our four segments.
�
| � | �� | Three Months Ended | � | �� | Year Ended | � | ||||||||||||||
| � | �� | �����Dec�31,����� 2014 |
� | �� | �����Dec�31,����� 2013 |
� | �� | �����Sept�30,����� 2014 |
� | �� | �����Dec�31,����� 2014 |
� | �� | �����Dec�31,����� 2013 |
� | |||||
| � | �� | (Dollars in millions) | � | |||||||||||||||||
| Segment Revenues |
�� | �� | �� | �� | �� | |||||||||||||||
| Fund level fee revenues |
�� | �� | �� | �� | �� | |||||||||||||||
| Fund management fees |
�� | ��$ | 304.9�� | �� | �� | ��$ | 283.5�� | �� | �� | ��$ | 318.8�� | �� | �� | ��$ | 1,229.3�� | �� | �� | ��$ | 1,054.7�� | �� |
| Portfolio advisory fees, net |
�� | � | 8.5�� | �� | �� | � | 10.6�� | �� | �� | � | 4.1�� | �� | �� | � | 20.1�� | �� | �� | � | 25.9�� | �� |
| Transaction fees, net |
�� | � | 2.7�� | �� | �� | � | 1.6�� | �� | �� | � | 17.8�� | �� | �� | � | 53.2�� | �� | �� | � | 24.7�� | �� |
| �� | � |
� |
� | �� | � |
� |
� | �� | � |
� |
� | �� | � |
� |
� | �� | � |
� |
� | |
| Total fee revenues |
�� | � | 316.1�� | �� | �� | � | 295.7�� | �� | �� | � | 340.7�� | �� | �� | � | 1,302.6�� | �� | �� | � | 1,105.3�� | �� |
| Performance fees |
�� | �� | �� | �� | �� | |||||||||||||||
| Realized |
�� | � | 488.2�� | �� | �� | � | 584.0�� | �� | �� | � | 175.3�� | �� | �� | � | 1,323.7�� | �� | �� | � | 1,128.6�� | �� |
| Unrealized |
�� | � | (158.4)� | �� | �� | � | 560.3�� | �� | �� | � | 48.6�� | �� | �� | � | 384.2�� | �� | �� | � | 1,164.7�� | �� |
| �� | � |
� |
� | �� | � |
� |
� | �� | � |
� |
� | �� | � |
� |
� | �� | � |
� |
� | |
| Total performance fees |
�� | � | 329.8�� | �� | �� | � | 1,144.3�� | �� | �� | � | 223.9�� | �� | �� | � | 1,707.9�� | �� | �� | � | 2,293.3�� | �� |
| Investment income (loss) |
�� | �� | �� | �� | �� | |||||||||||||||
| Realized |
�� | � | (20.2)� | �� | �� | � | 6.0�� | �� | �� | � | (2.7)� | �� | �� | � | (6.1)� | �� | �� | � | 10.6�� | �� |
| Unrealized |
�� | � | 18.2�� | �� | �� | � | (55.7)� | �� | �� | � | 6.2�� | �� | �� | � | (5.0)� | �� | �� | � | (53.2)� | �� |
| �� | � |
� |
� | �� | � |
� |
� | �� | � |
� |
� | �� | � |
� |
� | �� | � |
� |
� | |
| Total investment income (loss) |
�� | � | (2.0)� | �� | �� | � | (49.7)� | �� | �� | � | 3.5�� | �� | �� | � | (11.1)� | �� | �� | � | (42.6)� | �� |
| Interest and other income |
�� | � | 4.9�� | �� | �� | � | 3.9�� | �� | �� | � | 8.5�� | �� | �� | � | 22.6�� | �� | �� | � | 12.9�� | �� |
| �� | � |
� |
� | �� | � |
� |
� | �� | � |
� |
� | �� | � |
� |
� | �� | � |
� |
� | |
| Total revenues |
�� | � | 648.8�� | �� | �� | � | 1,394.2�� | �� | �� | � | 576.6�� | �� | �� | � | 3,022.0�� | �� | �� | � | 3,368.9�� | �� |
| Segment Expenses |
�� | �� | �� | �� | �� | |||||||||||||||
| Compensation and benefits |
�� | �� | �� | �� | �� | |||||||||||||||
| Direct base compensation |
�� | � | 97.8�� | �� | �� | � | 115.6�� | �� | �� | � | 138.3�� | �� | �� | � | 494.0�� | �� | �� | � | 436.0�� | �� |
| Indirect base compensation |
�� | � | 48.2�� | �� | �� | � | 43.0�� | �� | �� | � | 47.0�� | �� | �� | � | 188.5�� | �� | �� | � | 152.8�� | �� |
| Equity-based compensation |
�� | � | 23.1�� | �� | �� | � | 4.9�� | �� | �� | � | 23.8�� | �� | �� | � | 80.4�� | �� | �� | � | 15.7�� | �� |
| Performance fee related |
�� | �� | �� | �� | �� | |||||||||||||||
| Realized |
�� | � | 224.6�� | �� | �� | � | 228.8�� | �� | �� | � | 77.5�� | �� | �� | � | 590.9�� | �� | �� | � | 454.1�� | �� |
| Unrealized |
�� | � | (33.2)� | �� | �� | � | 337.6�� | �� | �� | � | 7.2�� | �� | �� | � | 309.6�� | �� | �� | � | 647.8�� | �� |
| �� | � |
� |
� | �� | � |
� |
� | �� | � |
� |
� | �� | � |
� |
� | �� | � |
� |
� | |
| Total compensation and benefits |
�� | � | 360.5�� | �� | �� | � | 729.9�� | �� | �� | � | 293.8�� | �� | �� | � | 1,663.4�� | �� | �� | � | 1,706.4�� | �� |
| General, administrative, and other indirect expenses |
�� | � | 87.3�� | �� | �� | � | 85.1�� | �� | �� | � | 82.1�� | �� | �� | � | 318.1�� | �� | �� | � | 309.4�� | �� |
| Depreciation and amortization expense |
�� | � | 6.0�� | �� | �� | � | 5.6�� | �� | �� | � | 5.4�� | �� | �� | � | 22.4�� | �� | �� | � | 24.3�� | �� |
| Interest expense |
�� | � | 14.5�� | �� | �� | � | 11.7�� | �� | �� | � | 14.5�� | �� | �� | � | 55.7�� | �� | �� | � | 43.6�� | �� |
| �� | � |
� |
� | �� | � |
� |
� | �� | � |
� |
� | �� | � |
� |
� | �� | � |
� |
� | |
| Total expenses |
�� | � | 468.3�� | �� | �� | � | 832.3�� | �� | �� | � | 395.8�� | �� | �� | � | 2,059.6�� | �� | �� | � | 2,083.7�� | �� |
| �� | � |
� |
� | �� | � |
� |
� | �� | � |
� |
� | �� | � |
� |
� | �� | � |
� |
� | |
| Economic Net Income (1) |
�� | ��$ | 180.5�� | �� | �� | ��$ | 561.9�� | �� | �� | ��$ | 180.8�� | �� | �� | ��$ | 962.4�� | �� | �� | ��$ | 1,285.2�� | �� |
| �� | � |
� |
� | �� | � |
� |
� | �� | � |
� |
� | �� | � |
� |
� | �� | � |
� |
� | |
| (-) Net Performance Fees (1) |
�� | � | 138.4�� | �� | �� | � | 577.9�� | �� | �� | � | 139.2�� | �� | �� | � | 807.4�� | �� | �� | � | 1,191.4�� | �� |
| (-) Investment Income (Loss) |
�� | � | (2.0)� | �� | �� | � | (49.7)� | �� | �� | � | 3.5�� | �� | �� | � | (11.1)� | �� | �� | � | (42.6)� | �� |
| (+) Equity-based compensation |
�� | � | 23.1�� | �� | �� | � | 4.9�� | �� | �� | � | 23.8�� | �� | �� | � | 80.4�� | �� | �� | � | 15.7�� | �� |
| �� | � |
� |
� | �� | � |
� |
� | �� | � |
� |
� | �� | � |
� |
� | �� | � |
� |
� | |
| (=) Fee Related Earnings |
�� | ��$ | 67.2�� | �� | �� | ��$ | 38.6�� | �� | �� | ��$ | 61.9�� | �� | �� | ��$ | 246.5�� | �� | �� | ��$ | 152.1�� | �� |
| �� | � |
� |
� | �� | � |
� |
� | �� | � |
� |
� | �� | � |
� |
� | �� | � |
� |
� | |
| (+) Realized Net Performance Fees (1) |
�� | � | 263.6�� | �� | �� | � | 355.2�� | �� | �� | � | 97.8�� | �� | �� | � | 732.8�� | �� | �� | � | 674.5�� | �� |
| (+) Realized Investment Income (Loss) |
�� | � | (20.2)� | �� | �� | � | 6.0�� | �� | �� | � | (2.7)� | �� | �� | � | (6.1)� | �� | �� | � | 10.6�� | �� |
| �� | � |
� |
� | �� | � |
� |
� | �� | � |
� |
� | �� | � |
� |
� | �� | � |
� |
� | |
| (=) Distributable Earnings (1) |
�� | ��$ | 310.6�� | �� | �� | ��$ | 399.8�� | �� | �� | ��$ | 157.0�� | �� | �� | ��$ | 973.2�� | �� | �� | ��$ | 837.2�� | �� |
| �� | � |
� |
� | �� | � |
� |
� | �� | � |
� |
� | �� | � |
� |
� | �� | � |
� |
� | |
(1) - In Q4 2014, we reclassified certain tax expenses associated with carried interest attributable to former partners and employees as a component of performance fee related compensation expense. Prior periods have been reclassified to conform with our new presentation. See Appendix I and II for our reclassified quarterly results.
�
Page��|��16
Total Segment Information (Unaudited), cont
�
| � | �� | Three Months Ended | � | |||||||||||||||||||||||||
| � | �� | � | � | �� | � | � | �� | � | � | �� | � | � | �� | � | � | �� | Dec 31, 2014 vs. | � | ||||||||||
| � | �� | Dec 31, 2013 |
� | �� | Mar 31, 2014 |
� | �� | Jun 30, 2014 |
� | �� | Sept 30, 2014 |
� | �� | Dec 31, 2014 |
� | �� | Dec�31,�2013 | � | �� | Sept�30,�2014 | � | |||||||
| � | �� | (Dollars in millions) | � | |||||||||||||||||||||||||
| Economic Net Income, Total Segments |
�� | �� | �� | �� | �� | �� | �� | |||||||||||||||||||||
| Revenues |
�� | �� | �� | �� | �� | �� | �� | |||||||||||||||||||||
| Segment fee revenues |
�� | �� | �� | �� | �� | �� | �� | |||||||||||||||||||||
| Fund management fees |
�� | ��$ | 283.5�� | �� | �� | ��$ | 287.8�� | �� | �� | ��$ | 317.8�� | �� | �� | ��$ | 318.8�� | �� | �� | ��$ | 304.9�� | �� | �� | ��$ | 21.4�� | �� | �� | ��$ | (13.9)� | �� |
| Portfolio advisory fees, net |
�� | � | 10.6�� | �� | �� | � | 3.8�� | �� | �� | � | 3.7�� | �� | �� | � | 4.1�� | �� | �� | � | 8.5�� | �� | �� | � | (2.1)� | �� | �� | � | 4.4�� | �� |
| Transaction fees, net |
�� | � | 1.6�� | �� | �� | � | 3.2�� | �� | �� | � | 29.5�� | �� | �� | � | 17.8�� | �� | �� | � | 2.7�� | �� | �� | � | 1.1�� | �� | �� | � | (15.1)� | �� |
| �� | � |
� |
� | �� | � |
� |
� | �� | � |
� |
� | �� | � |
� |
� | �� | � |
� |
� | �� | � |
� |
� | �� | � |
� |
� | |
| Total fee revenues |
�� | � | 295.7�� | �� | �� | � | 294.8�� | �� | �� | � | 351.0�� | �� | �� | � | 340.7�� | �� | �� | � | 316.1�� | �� | �� | � | 20.4�� | �� | �� | � | (24.6)� | �� |
| Performance fees |
�� | �� | �� | �� | �� | �� | �� | |||||||||||||||||||||
| Realized |
�� | � | 584.0�� | �� | �� | � | 249.4�� | �� | �� | � | 410.8�� | �� | �� | � | 175.3�� | �� | �� | � | 488.2�� | �� | �� | � | (95.8)� | �� | �� | � | 312.9�� | �� |
| Unrealized |
�� | � | 560.3�� | �� | �� | � | 355.7�� | �� | �� | � | 138.3�� | �� | �� | � | 48.6�� | �� | �� | � | (158.4)� | �� | �� | � | (718.7)� | �� | �� | � | (207.0)� | �� |
| �� | � |
� |
� | �� | � |
� |
� | �� | � |
� |
� | �� | � |
� |
� | �� | � |
� |
� | �� | � |
� |
� | �� | � |
� |
� | |
| Total performance fees |
�� | � | 1,144.3�� | �� | �� | � | 605.1�� | �� | �� | � | 549.1�� | �� | �� | � | 223.9�� | �� | �� | � | 329.8�� | �� | �� | � | (814.5)� | �� | �� | � | 105.9�� | �� |
| Investment income (loss) |
�� | �� | �� | �� | �� | �� | �� | |||||||||||||||||||||
| Realized |
�� | � | 6.0�� | �� | �� | � | 5.3�� | �� | �� | � | 11.5�� | �� | �� | � | (2.7)� | �� | �� | � | (20.2)� | �� | �� | � | (26.2)� | �� | �� | � | (17.5)� | �� |
| Unrealized |
�� | � | (55.7)� | �� | �� | � | (13.2)� | �� | �� | � | (16.2)� | �� | �� | � | 6.2�� | �� | �� | � | 18.2�� | �� | �� | � | 73.9�� | �� | �� | � | 12.0�� | �� |
| �� | � |
� |
� | �� | � |
� |
� | �� | � |
� |
� | �� | � |
� |
� | �� | � |
� |
� | �� | � |
� |
� | �� | � |
� |
� | |
| Total investment income (loss) |
�� | � | (49.7)� | �� | �� | � | (7.9)� | �� | �� | � | (4.7)� | �� | �� | � | 3.5�� | �� | �� | � | (2.0)� | �� | �� | � | 47.7�� | �� | �� | � | (5.5)� | �� |
| Interest and other income |
�� | � | 3.9�� | �� | �� | � | 4.5�� | �� | �� | � | 4.7�� | �� | �� | � | 8.5�� | �� | �� | � | 4.9�� | �� | �� | � | 1.0�� | �� | �� | � | (3.6)� | �� |
| �� | � |
� |
� | �� | � |
� |
� | �� | � |
� |
� | �� | � |
� |
� | �� | � |
� |
� | �� | � |
� |
� | �� | � |
� |
� | |
| Total revenues |
�� | � | 1,394.2�� | �� | �� | � | 896.5�� | �� | �� | � | 900.1�� | �� | �� | � | 576.6�� | �� | �� | � | 648.8�� | �� | �� | � | (745.4)� | �� | �� | � | 72.2�� | �� |
| Expenses |
�� | �� | �� | �� | �� | �� | �� | |||||||||||||||||||||
| Compensation and benefits |
�� | �� | �� | �� | �� | �� | �� | |||||||||||||||||||||
| Direct base compensation |
�� | � | 115.6�� | �� | �� | � | 126.7�� | �� | �� | � | 131.2�� | �� | �� | � | 138.3�� | �� | �� | � | 97.8�� | �� | �� | � | (17.8)� | �� | �� | � | (40.5)� | �� |
| Indirect base compensation |
�� | � | 43.0�� | �� | �� | � | 46.1�� | �� | �� | � | 47.2�� | �� | �� | � | 47.0�� | �� | �� | � | 48.2�� | �� | �� | � | 5.2�� | �� | �� | � | 1.2�� | �� |
| Equity-based compensation |
�� | � | 4.9�� | �� | �� | � | 14.0�� | �� | �� | � | 19.5�� | �� | �� | � | 23.8�� | �� | �� | � | 23.1�� | �� | �� | � | 18.2�� | �� | �� | � | (0.7)� | �� |
| Performance fee related |
�� | �� | �� | �� | �� | �� | �� | |||||||||||||||||||||
| Realized |
�� | � | 228.8�� | �� | �� | � | 109.3�� | �� | �� | � | 179.5�� | �� | �� | � | 77.5�� | �� | �� | � | 224.6�� | �� | �� | � | (4.2)� | �� | �� | � | 147.1�� | �� |
| Unrealized |
�� | � | 337.6�� | �� | �� | � | 199.4�� | �� | �� | � | 136.2�� | �� | �� | � | 7.2�� | �� | �� | � | (33.2)� | �� | �� | � | (370.8)� | �� | �� | � | (40.4)� | �� |
| �� | � |
� |
� | �� | � |
� |
� | �� | � |
� |
� | �� | � |
� |
� | �� | � |
� |
� | �� | � |
� |
� | �� | � |
� |
� | |
| Total compensation and benefits |
�� | � | 729.9�� | �� | �� | � | 495.5�� | �� | �� | � | 513.6�� | �� | �� | � | 293.8�� | �� | �� | � | 360.5�� | �� | �� | � | (369.4)� | �� | �� | � | 66.7�� | �� |
| General, administrative, and other indirect expenses |
�� | � | 85.1�� | �� | �� | � | 71.7�� | �� | �� | � | 77.0�� | �� | �� | � | 82.1�� | �� | �� | � | 87.3�� | �� | �� | � | 2.2�� | �� | �� | � | 5.2�� | �� |
| Depreciation and amortization expense |
�� | � | 5.6�� | �� | �� | � | 5.4�� | �� | �� | � | 5.6�� | �� | �� | � | 5.4�� | �� | �� | � | 6.0�� | �� | �� | � | 0.4�� | �� | �� | � | 0.6�� | �� |
| Interest expense |
�� | � | 11.7�� | �� | �� | � | 12.2�� | �� | �� | � | 14.5�� | �� | �� | � | 14.5�� | �� | �� | � | 14.5�� | �� | �� | � | 2.8�� | �� | �� | � | -����� | �� |
| �� | � |
� |
� | �� | � |
� |
� | �� | � |
� |
� | �� | � |
� |
� | �� | � |
� |
� | �� | � |
� |
� | �� | � |
� |
� | |
| Total expenses |
�� | � | 832.3�� | �� | �� | � | 584.8�� | �� | �� | � | 610.7�� | �� | �� | � | 395.8�� | �� | �� | � | 468.3�� | �� | �� | � | (364.0)� | �� | �� | � | 72.5�� | �� |
| �� | � |
� |
� | �� | � |
� |
� | �� | � |
� |
� | �� | � |
� |
� | �� | � |
� |
� | �� | � |
� |
� | �� | � |
� |
� | |
| Economic Net Income (1) |
�� | ��$ | 561.9�� | �� | �� | ��$ | 311.7�� | �� | �� | ��$ | 289.4�� | �� | �� | ��$ | 180.8�� | �� | �� | ��$ | 180.5�� | �� | �� | ��$ | (381.4)� | �� | �� | ��$ | (0.3)� | �� |
| �� | � |
� |
� | �� | � |
� |
� | �� | � |
� |
� | �� | � |
� |
� | �� | � |
� |
� | �� | � |
� |
� | �� | � |
� |
� | |
| (-) Net Performance Fees (1) |
�� | � | 577.9�� | �� | �� | � | 296.4�� | �� | �� | � | 233.4�� | �� | �� | � | 139.2�� | �� | �� | � | 138.4�� | �� | �� | � | (439.5)� | �� | �� | � | (0.8)� | �� |
| (-) Investment Income (Loss) |
�� | � | (49.7)� | �� | �� | � | (7.9)� | �� | �� | � | (4.7)� | �� | �� | � | 3.5�� | �� | �� | � | (2.0)� | �� | �� | � | 47.7�� | �� | �� | � | (5.5)� | �� |
| (+) Equity-based compensation |
�� | � | 4.9�� | �� | �� | � | 14.0�� | �� | �� | � | 19.5�� | �� | �� | � | 23.8�� | �� | �� | � | 23.1�� | �� | �� | � | 18.2�� | �� | �� | � | (0.7)� | �� |
| �� | � |
� |
� | �� | � |
� |
� | �� | � |
� |
� | �� | � |
� |
� | �� | � |
� |
� | �� | � |
� |
� | �� | � |
� |
� | |
| (=) Fee Related Earnings |
�� | ��$ | ��������38.6�� | �� | �� | ��$ | ��������37.2�� | �� | �� | ��$ | ��������80.2�� | �� | �� | ��$ | ��������61.9�� | �� | �� | ��$ | ��������67.2�� | �� | �� | ��$ | ��������28.6�� | �� | �� | ��$ | ��������5.3�� | �� |
| �� | � |
� |
� | �� | � |
� |
� | �� | � |
� |
� | �� | � |
� |
� | �� | � |
� |
� | �� | � |
� |
� | �� | � |
� |
� | |
| (+) Realized Net Performance Fees (1) |
�� | � | 355.2�� | �� | �� | � | 140.1�� | �� | �� | � | 231.3�� | �� | �� | � | 97.8�� | �� | �� | � | 263.6�� | �� | �� | � | (91.6)� | �� | �� | � | 165.8�� | �� |
| (+) Realized Investment Income (Loss) |
�� | � | 6.0�� | �� | �� | � | 5.3�� | �� | �� | � | 11.5�� | �� | �� | � | (2.7)� | �� | �� | � | (20.2)� | �� | �� | � | (26.2)� | �� | �� | � | (17.5)� | �� |
| �� | � |
� |
� | �� | � |
� |
� | �� | � |
� |
� | �� | � |
� |
� | �� | � |
� |
� | �� | � |
� |
� | �� | � |
� |
� | |
| (=) Distributable Earnings (1) |
�� | ��$ | 399.8�� | �� | �� | ��$ | 182.6�� | �� | �� | ��$ | 323.0�� | �� | �� | ��$ | 157.0�� | �� | �� | ��$ | 310.6�� | �� | �� | ��$ | (89.2)� | �� | �� | ��$ | 153.6�� | �� |
| �� | � |
� |
� | �� | � |
� |
� | �� | � |
� |
� | �� | � |
� |
� | �� | � |
� |
� | �� | � |
� |
� | �� | � |
� |
� | |
(1) - In Q4 2014, we reclassified certain tax expenses associated with carried interest attributable to former partners and employees as a component of performance fee related compensation expense. Prior periods have been reclassified to conform with our new presentation. See Appendix I and II for our reclassified quarterly results.
�
Page��|��17
Corporate Private Equity Segment Results (Unaudited)
�
| � | �� | Three Months Ended | � | |||||||||||||||||||||||||
| � | �� | � | � | �� | � | � | �� | � | � | �� | � | � | �� | � | � | �� | Dec 31, 2014 vs. | � | ||||||||||
| � | �� | Dec 31, 2013 |
� | �� | Mar�31, 2014 |
� | �� | Jun�30, 2014 |
� | �� | Sept�30, 2014 |
� | �� | Dec�31, 2014 |
� | �� | ��Dec�31,�2013�� | � | �� | ��Sept�30,�2014�� | � | |||||||
| Corporate Private Equity | �� | (Dollars in millions) | � | |||||||||||||||||||||||||
| Revenues |
�� | �� | �� | �� | �� | �� | �� | |||||||||||||||||||||
| Segment fee revenues |
�� | �� | �� | �� | �� | �� | �� | |||||||||||||||||||||
| Fund management fees |
�� | ��$ | ����123.5�� | �� | �� | ��$ | ����129.8�� | �� | �� | ��$ | ����147.2�� | �� | �� | ��$ | ����151.5�� | �� | �� | ��$ | ����136.3�� | �� | �� | ��$ | ����12.8�� | �� | �� | ��$ | (15.2)� | �� |
| Portfolio advisory fees, net |
�� | � | 9.5�� | �� | �� | � | 3.5�� | �� | �� | � | 3.3�� | �� | �� | � | 3.8�� | �� | �� | � | 7.8�� | �� | �� | � | (1.7)� | �� | �� | � | 4.0�� | �� |
| Transaction fees, net |
�� | � | 0.6�� | �� | �� | � | 3.2�� | �� | �� | � | 29.4�� | �� | �� | � | 17.0�� | �� | �� | � | 1.8�� | �� | �� | � | 1.2�� | �� | �� | � | (15.2)� | �� |
| �� | � |
� |
� | �� | � |
� |
� | �� | � |
� |
� | �� | � |
� |
� | �� | � |
� |
� | �� | � |
� |
� | �� | � |
� |
� | |
| Total fee revenues |
�� | � | 133.6�� | �� | �� | � | 136.5�� | �� | �� | � | 179.9�� | �� | �� | � | 172.3�� | �� | �� | � | 145.9�� | �� | �� | � | 12.3�� | �� | �� | � | (26.4)� | �� |
| Performance fees |
�� | �� | �� | �� | �� | �� | �� | |||||||||||||||||||||
| Realized |
�� | � | 471.7�� | �� | �� | � | 234.7�� | �� | �� | � | 387.7�� | �� | �� | � | 125.0�� | �� | �� | � | 408.9�� | �� | �� | � | (62.8)� | �� | �� | � | 283.9�� | �� |
| Unrealized |
�� | � | 538.1�� | �� | �� | � | 212.9�� | �� | �� | � | (76.2)� | �� | �� | � | 100.8�� | �� | �� | � | (40.3)� | �� | �� | � | (578.4)� | �� | �� | � | (141.1)� | �� |
| �� | � |
� |
� | �� | � |
� |
� | �� | � |
� |
� | �� | � |
� |
� | �� | � |
� |
� | �� | � |
� |
� | �� | � |
� |
� | |
| Total performance fees |
�� | � | 1,009.8�� | �� | �� | � | 447.6�� | �� | �� | � | 311.5�� | �� | �� | � | 225.8�� | �� | �� | � | 368.6�� | �� | �� | � | (641.2)� | �� | �� | � | 142.8�� | �� |
| Investment income (loss) |
�� | �� | �� | �� | �� | �� | �� | |||||||||||||||||||||
| Realized |
�� | � | 10.7�� | �� | �� | � | 1.9�� | �� | �� | � | 2.0�� | �� | �� | � | 6.4�� | �� | �� | � | 7.4�� | �� | �� | � | (3.3)� | �� | �� | � | ����������������1.0�� | �� |
| Unrealized |
�� | � | (0.3)� | �� | �� | � | 5.4�� | �� | �� | � | 4.0�� | �� | �� | � | 3.8�� | �� | �� | � | 0.7�� | �� | �� | � | 1.0�� | �� | �� | � | (3.1)� | �� |
| �� | � |
� |
� | �� | � |
� |
� | �� | � |
� |
� | �� | � |
� |
� | �� | � |
� |
� | �� | � |
� |
� | �� | � |
� |
� | |
| Total investment income (loss) |
�� | � | 10.4�� | �� | �� | � | 7.3�� | �� | �� | � | 6.0�� | �� | �� | � | 10.2�� | �� | �� | � | 8.1�� | �� | �� | � | (2.3)� | �� | �� | � | (2.1)� | �� |
| Interest and other income |
�� | � | 2.3�� | �� | �� | � | 2.2�� | �� | �� | � | 1.8�� | �� | �� | � | 4.7�� | �� | �� | � | 2.1�� | �� | �� | � | (0.2)� | �� | �� | � | (2.6)� | �� |
| �� | � |
� |
� | �� | � |
� |
� | �� | � |
� |
� | �� | � |
� |
� | �� | � |
� |
� | �� | � |
� |
� | �� | � |
� |
� | |
| Total revenues |
�� | � | 1,156.1�� | �� | �� | � | 593.6�� | �� | �� | � | 499.2�� | �� | �� | � | 413.0�� | �� | �� | � | 524.7�� | �� | �� | � | (631.4)� | �� | �� | � | 111.7�� | �� |
| Expenses |
�� | �� | �� | �� | �� | �� | �� | |||||||||||||||||||||
| Compensation and benefits |
�� | �� | �� | �� | �� | �� | �� | |||||||||||||||||||||
| Direct base compensation |
�� | � | 53.7�� | �� | �� | � | 59.5�� | �� | �� | � | 62.9�� | �� | �� | � | 67.0�� | �� | �� | � | 33.0�� | �� | �� | � | (20.7)� | �� | �� | � | (34.0)� | �� |
| Indirect base compensation |
�� | � | 25.6�� | �� | �� | � | 22.0�� | �� | �� | � | 25.5�� | �� | �� | � | 25.9�� | �� | �� | � | 28.4�� | �� | �� | � | 2.8�� | �� | �� | � | 2.5�� | �� |
| Equity-based compensation |
�� | � | 1.5�� | �� | �� | � | 7.1�� | �� | �� | � | 10.1�� | �� | �� | � | 12.9�� | �� | �� | � | 12.4�� | �� | �� | � | 10.9�� | �� | �� | � | (0.5)� | �� |
| Performance fee related |
�� | �� | �� | �� | �� | �� | �� | |||||||||||||||||||||
| Realized |
�� | � | 200.4�� | �� | �� | � | 101.3�� | �� | �� | � | 172.4�� | �� | �� | � | 52.7�� | �� | �� | � | 186.1�� | �� | �� | � | (14.3)� | �� | �� | � | 133.4�� | �� |
| Unrealized |
�� | � | 274.0�� | �� | �� | � | 100.5�� | �� | �� | � | (27.8)� | �� | �� | � | 49.4�� | �� | �� | � | (25.0)� | �� | �� | � | (299.0)� | �� | �� | � | (74.4)� | �� |
| �� | � |
� |
� | �� | � |
� |
� | �� | � |
� |
� | �� | � |
� |
� | �� | � |
� |
� | �� | � |
� |
� | �� | � |
� |
� | |
| Total compensation and benefits |
�� | � | 555.2�� | �� | �� | � | 290.4�� | �� | �� | � | 243.1�� | �� | �� | � | 207.9�� | �� | �� | � | 234.9�� | �� | �� | � | (320.3)� | �� | �� | � | 27.0�� | �� |
| General, administrative, and other indirect expenses |
�� | � | 42.6�� | �� | �� | � | 35.4�� | �� | �� | � | 37.7�� | �� | �� | � | 35.5�� | �� | �� | � | 42.5�� | �� | �� | � | (0.1)� | �� | �� | � | 7.0�� | �� |
| Depreciation and amortization expense |
�� | � | 3.0�� | �� | �� | � | 2.7�� | �� | �� | � | 2.7�� | �� | �� | � | 2.7�� | �� | �� | � | 2.9�� | �� | �� | � | (0.1)� | �� | �� | � | 0.2�� | �� |
| Interest expense |
�� | � | 6.7�� | �� | �� | � | 6.7�� | �� | �� | � | 8.0�� | �� | �� | � | 7.9�� | �� | �� | � | 8.0�� | �� | �� | � | 1.3�� | �� | �� | � | 0.1�� | �� |
| �� | � |
� |
� | �� | � |
� |
� | �� | � |
� |
� | �� | � |
� |
� | �� | � |
� |
� | �� | � |
� |
� | �� | � |
� |
� | |
| Total expenses |
�� | � | 607.5�� | �� | �� | � | 335.2�� | �� | �� | � | 291.5�� | �� | �� | � | 254.0�� | �� | �� | � | 288.3�� | �� | �� | � | (319.2)� | �� | �� | � | 34.3�� | �� |
| �� | � |
� |
� | �� | � |
� |
� | �� | � |
� |
� | �� | � |
� |
� | �� | � |
� |
� | �� | � |
� |
� | �� | � |
� |
� | |
| Economic Net Income |
�� | ��$ | 548.6�� | �� | �� | ��$ | 258.4�� | �� | �� | ��$ | 207.7�� | �� | �� | ��$ | 159.0�� | �� | �� | ��$ | 236.4�� | �� | �� | ��$ | (312.2)� | �� | �� | ��$ | 77.4�� | �� |
| �� | � |
� |
� | �� | � |
� |
� | �� | � |
� |
� | �� | � |
� |
� | �� | � |
� |
� | �� | � |
� |
� | �� | � |
� |
� | |
| (-) Net Performance Fees |
�� | � | 535.4�� | �� | �� | � | 245.8�� | �� | �� | � | 166.9�� | �� | �� | � | 123.7�� | �� | �� | � | 207.5�� | �� | �� | � | (327.9)� | �� | �� | � | 83.8�� | �� |
| (-) Investment Income |
�� | � | 10.4�� | �� | �� | � | 7.3�� | �� | �� | � | 6.0�� | �� | �� | � | 10.2�� | �� | �� | � | 8.1�� | �� | �� | � | (2.3)� | �� | �� | � | (2.1)� | �� |
| (+) Equity-based compensation |
�� | � | 1.5�� | �� | �� | � | 7.1�� | �� | �� | � | 10.1�� | �� | �� | � | 12.9�� | �� | �� | � | 12.4�� | �� | �� | � | 10.9�� | �� | �� | � | (0.5)� | �� |
| �� | � |
� |
� | �� | � |
� |
� | �� | � |
� |
� | �� | � |
� |
� | �� | � |
� |
� | �� | � |
� |
� | �� | � |
� |
� | |
| (=) Fee Related Earnings |
�� | ��$ | 4.3�� | �� | �� | ��$ | 12.4�� | �� | �� | ��$ | 44.9�� | �� | �� | ��$ | 38.0�� | �� | �� | ��$ | 33.2�� | �� | �� | ��$ | 28.9�� | �� | �� | ��$ | (4.8)� | �� |
| �� | � |
� |
� | �� | � |
� |
� | �� | � |
� |
� | �� | � |
� |
� | �� | � |
� |
� | �� | � |
� |
� | �� | � |
� |
� | |
| (+) Realized Net Performance Fees |
�� | � | 271.3�� | �� | �� | � | 133.4�� | �� | �� | � | 215.3�� | �� | �� | � | 72.3�� | �� | �� | � | 222.8�� | �� | �� | � | (48.5)� | �� | �� | � | 150.5�� | �� |
| (+) Realized Investment Income |
�� | � | 10.7�� | �� | �� | � | 1.9�� | �� | �� | � | 2.0�� | �� | �� | � | 6.4�� | �� | �� | � | 7.4�� | �� | �� | � | (3.3)� | �� | �� | � | 1.0�� | �� |
| �� | � |
� |
� | �� | � |
� |
� | �� | � |
� |
� | �� | � |
� |
� | �� | � |
� |
� | �� | � |
� |
� | �� | � |
� |
� | |
| (=) Distributable Earnings |
�� | ��$ | 286.3�� | �� | �� | ��$ | 147.7�� | �� | �� | ��$ | 262.2�� | �� | �� | ��$ | 116.7�� | �� | �� | ��$ | 263.4�� | �� | �� | ��$ | (22.9)� | �� | �� | ��$ | 146.7�� | �� |
| �� | � |
� |
� | �� | � |
� |
� | �� | � |
� |
� | �� | � |
� |
� | �� | � |
� |
� | �� | � |
� |
� | �� | � |
� |
� | |
�
Page��|��18
Global Market Strategies Segment Results (Unaudited)
�
| � | �� | Three Months Ended | � | |||||||||||||||||||||||||
| � | �� | � | � | �� | � | � | �� | � | � | �� | � | � | �� | � | � | �� | Dec 31, 2014 vs. | � | ||||||||||
| � | �� | Dec�31, 2013 |
� | �� | Mar�31, 2014 |
� | �� | Jun�30, 2014 |
� | �� | Sept�30, 2014 |
� | �� | Dec�31, 2014 |
� | �� | ��Dec�31,�2013�� | � | �� | ��Sept�30,�2014�� | � | |||||||
| Global Market Strategies | �� | (Dollars in millions) | � | |||||||||||||||||||||||||
| Revenues |
�� | �� | �� | �� | �� | �� | �� | |||||||||||||||||||||
| Segment fee revenues |
�� | �� | �� | �� | �� | �� | �� | |||||||||||||||||||||
| Fund management fees |
�� | ��$ | ������69.4�� | �� | �� | ��$ | ������63.2�� | �� | �� | ��$ | ������64.1�� | �� | �� | ��$ | ������65.6�� | �� | �� | ��$ | ��66.4�� | �� | �� | ��$ | (3.0)� | �� | �� | ��$ | 0.8�� | �� |
| Portfolio advisory fees, net |
�� | � | 0.6�� | �� | �� | � | 0.1�� | �� | �� | � | 0.1�� | �� | �� | � | 0.2�� | �� | �� | � | 0.5�� | �� | �� | � | (0.1)� | �� | �� | � | 0.3�� | �� |
| Transaction fees, net |
�� | � | -������ | �� | �� | � | -������ | �� | �� | � | -������ | �� | �� | � | 0.2�� | �� | �� | � | -������ | �� | �� | � | -������ | �� | �� | � | (0.2)� | �� |
| �� | � |
� |
� | �� | � |
� |
� | �� | � |
� |
� | �� | � |
� |
� | �� | � |
� |
� | �� | � |
� |
� | �� | � |
� |
� | |
| Total fee revenues |
�� | � | 70.0�� | �� | �� | � | 63.3�� | �� | �� | � | 64.2�� | �� | �� | � | 66.0�� | �� | �� | � | 66.9�� | �� | �� | � | (3.1)� | �� | �� | � | 0.9�� | �� |
| Performance fees |
�� | �� | �� | �� | �� | �� | �� | |||||||||||||||||||||
| Realized |
�� | � | 104.1�� | �� | �� | � | 8.3�� | �� | �� | � | 6.7�� | �� | �� | � | 11.3�� | �� | �� | � | 9.7�� | �� | �� | � | (94.4)� | �� | �� | � | (1.6)� | �� |
| Unrealized |
�� | � | (41.3)� | �� | �� | � | 49.5�� | �� | �� | � | 45.6�� | �� | �� | � | (10.8)� | �� | �� | � | (7.8)� | �� | �� | � | 33.5�� | �� | �� | � | 3.0�� | �� |
| �� | � |
� |
� | �� | � |
� |
� | �� | � |
� |
� | �� | � |
� |
� | �� | � |
� |
� | �� | � |
� |
� | �� | � |
� |
� | |
| Total performance fees |
�� | � | 62.8�� | �� | �� | � | 57.8�� | �� | �� | � | 52.3�� | �� | �� | � | 0.5�� | �� | �� | � | 1.9�� | �� | �� | � | (60.9)� | �� | �� | � | 1.4�� | �� |
| Investment income (loss) |
�� | �� | �� | �� | �� | �� | �� | |||||||||||||||||||||
| Realized |
�� | � | 1.4�� | �� | �� | � | 1.3�� | �� | �� | � | 1.4�� | �� | �� | � | 4.1�� | �� | �� | � | 1.6�� | �� | �� | � | 0.2�� | �� | �� | � | (2.5)� | �� |
| Unrealized |
�� | � | 2.1�� | �� | �� | � | 1.9�� | �� | �� | � | 1.2�� | �� | �� | � | (4.3)� | �� | �� | � | (2.4)� | �� | �� | � | (4.5)� | �� | �� | � | 1.9�� | �� |
| �� | � |
� |
� | �� | � |
� |
� | �� | � |
� |
� | �� | � |
� |
� | �� | � |
� |
� | �� | � |
� |
� | �� | � |
� |
� | |
| Total investment income (loss) |
�� | � | 3.5�� | �� | �� | � | 3.2�� | �� | �� | � | 2.6�� | �� | �� | � | (0.2)� | �� | �� | � | (0.8)� | �� | �� | � | (4.3)� | �� | �� | � | (0.6)� | �� |
| Interest and other income |
�� | � | 0.9�� | �� | �� | � | 1.3�� | �� | �� | � | 1.5�� | �� | �� | � | 1.9�� | �� | �� | � | 1.1�� | �� | �� | � | 0.2�� | �� | �� | � | (0.8)� | �� |
| �� | � |
� |
� | �� | � |
� |
� | �� | � |
� |
� | �� | � |
� |
� | �� | � |
� |
� | �� | � |
� |
� | �� | � |
� |
� | |
| Total revenues |
�� | � | 137.2�� | �� | �� | � | 125.6�� | �� | �� | � | 120.6�� | �� | �� | � | 68.2�� | �� | �� | � | 69.1�� | �� | �� | � | (68.1)� | �� | �� | � | 0.9�� | �� |
| Expenses |
�� | �� | �� | �� | �� | �� | �� | |||||||||||||||||||||
| Compensation and benefits |
�� | �� | �� | �� | �� | �� | �� | |||||||||||||||||||||
| Direct base compensation |
�� | � | 25.4�� | �� | �� | � | 27.5�� | �� | �� | � | 26.3�� | �� | �� | � | 29.9�� | �� | �� | � | 26.9�� | �� | �� | � | 1.5�� | �� | �� | � | (3.0)� | �� |
| Indirect base compensation |
�� | � | 6.9�� | �� | �� | � | 6.0�� | �� | �� | � | 6.0�� | �� | �� | � | 6.9�� | �� | �� | � | 5.7�� | �� | �� | � | (1.2)� | �� | �� | � | (1.2)� | �� |
| Equity-based compensation |
�� | � | 1.4�� | �� | �� | � | 2.7�� | �� | �� | � | 3.2�� | �� | �� | � | 4.0�� | �� | �� | � | 4.0�� | �� | �� | � | 2.6�� | �� | �� | � | -������ | �� |
| Performance fee related |
�� | �� | �� | �� | �� | �� | �� | |||||||||||||||||||||
| Realized |
�� | � | 24.9�� | �� | �� | � | 3.8�� | �� | �� | � | 2.5�� | �� | �� | � | 6.1�� | �� | �� | � | 5.0�� | �� | �� | � | (19.9)� | �� | �� | � | (1.1)� | �� |
| Unrealized |
�� | � | (5.2)� | �� | �� | � | 14.8�� | �� | �� | � | 21.6�� | �� | �� | � | 2.6�� | �� | �� | � | (3.6)� | �� | �� | � | 1.6�� | �� | �� | � | (6.2)� | �� |
| �� | � |
� |
� | �� | � |
� |
� | �� | � |
� |
� | �� | � |
� |
� | �� | � |
� |
� | �� | � |
� |
� | �� | � |
� |
� | |
| Total compensation and benefits |
�� | � | 53.4�� | �� | �� | � | 54.8�� | �� | �� | � | 59.6�� | �� | �� | � | 49.5�� | �� | �� | � | 38.0�� | �� | �� | � | (15.4)� | �� | �� | � | (11.5)� | �� |
| General, administrative, and other indirect expenses |
�� | � | 14.1�� | �� | �� | � | 11.6�� | �� | �� | � | 13.0�� | �� | �� | � | 14.0�� | �� | �� | � | 14.3�� | �� | �� | � | 0.2�� | �� | �� | � | 0.3�� | �� |
| Depreciation and amortization expense |
�� | � | 1.0�� | �� | �� | � | 0.9�� | �� | �� | � | 1.0�� | �� | �� | � | 1.0�� | �� | �� | � | 1.1�� | �� | �� | � | 0.1�� | �� | �� | � | 0.1�� | �� |
| Interest expense |
�� | � | 2.2�� | �� | �� | � | 2.1�� | �� | �� | � | 2.6�� | �� | �� | � | 2.5�� | �� | �� | � | 2.5�� | �� | �� | � | 0.3�� | �� | �� | � | -������ | �� |
| �� | � |
� |
� | �� | � |
� |
� | �� | � |
� |
� | �� | � |
� |
� | �� | � |
� |
� | �� | � |
� |
� | �� | � |
� |
� | |
| Total expenses |
�� | � | 70.7�� | �� | �� | � | 69.4�� | �� | �� | � | 76.2�� | �� | �� | � | 67.0�� | �� | �� | � | 55.9�� | �� | �� | � | (14.8)� | �� | �� | � | (11.1)� | �� |
| �� | � |
� |
� | �� | � |
� |
� | �� | � |
� |
� | �� | � |
� |
� | �� | � |
� |
� | �� | � |
� |
� | �� | � |
� |
� | |
| Economic Net Income |
�� | ��$ | 66.5�� | �� | �� | ��$ | 56.2�� | �� | �� | ��$ | 44.4�� | �� | �� | ��$ | 1.2�� | �� | �� | ��$ | 13.2�� | �� | �� | ��$ | (53.3)� | �� | �� | ��$ | 12.0�� | �� |
| �� | � |
� |
� | �� | � |
� |
� | �� | � |
� |
� | �� | � |
� |
� | �� | � |
� |
� | �� | � |
� |
� | �� | � |
� |
� | |
| (-) Net Performance Fees |
�� | � | 43.1�� | �� | �� | � | 39.2�� | �� | �� | � | 28.2�� | �� | �� | � | (8.2)� | �� | �� | � | 0.5�� | �� | �� | � | (42.6)� | �� | �� | � | 8.7�� | �� |
| (-) Investment Income (Loss) |
�� | � | 3.5�� | �� | �� | � | 3.2�� | �� | �� | � | 2.6�� | �� | �� | � | (0.2)� | �� | �� | � | (0.8)� | �� | �� | � | (4.3)� | �� | �� | � | (0.6)� | �� |
| (+) Equity-based compensation |
�� | � | 1.4�� | �� | �� | � | 2.7�� | �� | �� | � | 3.2�� | �� | �� | � | 4.0�� | �� | �� | � | 4.0�� | �� | �� | � | 2.6�� | �� | �� | � | 0.0�� | �� |
| �� | � |
� |
� | �� | � |
� |
� | �� | � |
� |
� | �� | � |
� |
� | �� | � |
� |
� | �� | � |
� |
� | �� | � |
� |
� | |
| (=) Fee Related Earnings |
�� | ��$ | 21.3�� | �� | �� | ��$ | 16.5�� | �� | �� | ��$ | 16.8�� | �� | �� | ��$ | 13.6�� | �� | �� | ��$ | 17.5�� | �� | �� | ��$ | (3.8)� | �� | �� | ��$ | 3.9�� | �� |
| �� | � |
� |
� | �� | � |
� |
� | �� | � |
� |
� | �� | � |
� |
� | �� | � |
� |
� | �� | � |
� |
� | �� | � |
� |
� | |
| (+) Realized Net Performance Fees |
�� | � | 79.2�� | �� | �� | � | 4.5�� | �� | �� | � | 4.2�� | �� | �� | � | 5.2�� | �� | �� | � | 4.7�� | �� | �� | � | (74.5)� | �� | �� | � | (0.5)� | �� |
| (+) Realized Investment Income |
�� | � | 1.4�� | �� | �� | � | 1.3�� | �� | �� | � | 1.4�� | �� | �� | � | 4.1�� | �� | �� | � | 1.6�� | �� | �� | � | 0.2�� | �� | �� | � | (2.5)� | �� |
| �� | � |
� |
� | �� | � |
� |
� | �� | � |
� |
� | �� | � |
� |
� | �� | � |
� |
� | �� | � |
� |
� | �� | � |
� |
� | |
| (=) Distributable Earnings |
�� | ��$ | 101.9�� | �� | �� | ��$ | 22.3�� | �� | �� | ��$ | 22.4�� | �� | �� | ��$ | 22.9�� | �� | �� | ��$ | 23.8�� | �� | �� | ��$ | (78.1)� | �� | �� | ��$ | 0.9�� | �� |
| �� | � |
� |
� | �� | � |
� |
� | �� | � |
� |
� | �� | � |
� |
� | �� | � |
� |
� | �� | � |
� |
� | �� | � |
� |
� | |
�
Page��|��19
Real Assets Segment Results (Unaudited)
�
| � | �� | Three Months Ended | � | |||||||||||||||||||||||||
| � | �� | � | � | �� | � | � | �� | � | � | �� | � | � | �� | � | � | �� | Dec 31, 2014 vs. | � | ||||||||||
| � | �� | Dec�31, 2013 |
� | �� | Mar�31, 2014 |
� | �� | Jun�30, 2014 |
� | �� | Sept�30, 2014 |
� | �� | Dec�31, 2014 |
� | �� | ��Dec�31,�2013�� | � | �� | ��Sept�30,�2014�� | � | |||||||
| Real Assets | �� | (Dollars in millions) | � | |||||||||||||||||||||||||
| Revenues |
�� | �� | �� | �� | �� | �� | �� | |||||||||||||||||||||
| Segment fee revenues |
�� | �� | �� | �� | �� | �� | �� | |||||||||||||||||||||
| Fund management fees |
�� | ��$ | ��������48.2�� | �� | �� | ��$ | ��������50.3�� | �� | �� | ��$ | 59.6�� | �� | �� | ��$ | ��������55.7�� | �� | �� | ��$ | ��������58.2�� | �� | �� | ��$ | ����10.0�� | �� | �� | ��$ | 2.5�� | �� |
| Portfolio advisory fees, net |
�� | � | 0.5�� | �� | �� | � | 0.2�� | �� | �� | � | 0.3�� | �� | �� | � | 0.1�� | �� | �� | � | 0.2�� | �� | �� | � | (0.3)� | �� | �� | � | 0.1�� | �� |
| Transaction fees, net |
�� | � | 1.0�� | �� | �� | � | -������ | �� | �� | � | 0.1�� | �� | �� | � | 0.6�� | �� | �� | � | 0.9�� | �� | �� | � | (0.1)� | �� | �� | � | 0.3�� | �� |
| �� | � |
� |
� | �� | � |
� |
� | �� | � |
� |
� | �� | � |
� |
� | �� | � |
� |
� | �� | � |
� |
� | �� | � |
� |
� | |
| Total fee revenues |
�� | � | 49.7�� | �� | �� | � | 50.5�� | �� | �� | � | 60.0�� | �� | �� | � | 56.4�� | �� | �� | � | 59.3�� | �� | �� | � | 9.6�� | �� | �� | � | 2.9�� | �� |
| Performance fees |
�� | �� | �� | �� | �� | �� | �� | |||||||||||||||||||||
| Realized |
�� | � | (3.6)� | �� | �� | � | 0.5�� | �� | �� | � | 9.4�� | �� | �� | � | 28.4�� | �� | �� | � | 50.2�� | �� | �� | � | 53.8�� | �� | �� | � | 21.8�� | �� |
| Unrealized |
�� | � | 15.2�� | �� | �� | � | 14.0�� | �� | �� | � | 46.4�� | �� | �� | � | 9.5�� | �� | �� | � | (109.4)� | �� | �� | � | (124.6)� | �� | �� | � | (118.9)� | �� |
| �� | � |
� |
� | �� | � |
� |
� | �� | � |
� |
� | �� | � |
� |
� | �� | � |
� |
� | �� | � |
� |
� | �� | � |
� |
� | |
| Total performance fees |
�� | � | 11.6�� | �� | �� | � | 14.5�� | �� | �� | � | 55.8�� | �� | �� | � | 37.9�� | �� | �� | � | (59.2)� | �� | �� | � | (70.8)� | �� | �� | � | (97.1)� | �� |
| Investment income (loss) |
�� | �� | �� | �� | �� | �� | �� | |||||||||||||||||||||
| Realized |
�� | � | (6.1)� | �� | �� | � | 2.1�� | �� | �� | � | 8.1�� | �� | �� | � | (13.2)� | �� | �� | � | (29.2)� | �� | �� | � | (23.1)� | �� | �� | � | (16.0)� | �� |
| Unrealized |
�� | � | (57.6)� | �� | �� | � | (20.6)� | �� | �� | � | (21.6)� | �� | �� | � | 6.7�� | �� | �� | � | 19.8�� | �� | �� | � | 77.4�� | �� | �� | � | 13.1�� | �� |
| �� | � |
� |
� | �� | � |
� |
� | �� | � |
� |
� | �� | � |
� |
� | �� | � |
� |
� | �� | � |
� |
� | �� | � |
� |
� | |
| Total investment income (loss) |
�� | � | (63.7)� | �� | �� | � | (18.5)� | �� | �� | � | (13.5)� | �� | �� | � | (6.5)� | �� | �� | � | (9.4)� | �� | �� | � | 54.3�� | �� | �� | � | (2.9)� | �� |
| Interest and other income |
�� | � | 0.7�� | �� | �� | � | 0.7�� | �� | �� | � | 1.2�� | �� | �� | � | 1.4�� | �� | �� | � | 1.4�� | �� | �� | � | 0.7�� | �� | �� | � | -������ | �� |
| �� | � |
� |
� | �� | � |
� |
� | �� | � |
� |
� | �� | � |
� |
� | �� | � |
� |
� | �� | � |
� |
� | �� | � |
� |
� | |
| Total revenues |
�� | � | (1.7)� | �� | �� | � | 47.2�� | �� | �� | � | 103.5�� | �� | �� | � | 89.2�� | �� | �� | � | (7.9)� | �� | �� | � | (6.2)� | �� | �� | � | (97.1)� | �� |
| Expenses |
�� | �� | �� | �� | �� | �� | �� | |||||||||||||||||||||
| Compensation and benefits |
�� | �� | �� | �� | �� | �� | �� | |||||||||||||||||||||
| Direct base compensation |
�� | � | 17.0�� | �� | �� | � | 18.7�� | �� | �� | � | 21.3�� | �� | �� | � | 20.7�� | �� | �� | � | 14.5�� | �� | �� | � | (2.5)� | �� | �� | � | (6.2)� | �� |
| Indirect base compensation |
�� | � | 8.6�� | �� | �� | � | 14.3�� | �� | �� | � | 11.7�� | �� | �� | � | 9.9�� | �� | �� | � | 12.6�� | �� | �� | � | 4.0�� | �� | �� | � | 2.7�� | �� |
| Equity-based compensation |
�� | � | 1.6�� | �� | �� | � | 3.5�� | �� | �� | � | 5.1�� | �� | �� | � | 5.4�� | �� | �� | � | 5.2�� | �� | �� | � | 3.6�� | �� | �� | � | (0.2)� | �� |
| Performance fee related |
�� | �� | �� | �� | �� | �� | �� | |||||||||||||||||||||
| Realized |
�� | � | (4.5)� | �� | �� | � | 0.2�� | �� | �� | � | 0.5�� | �� | �� | � | 9.9�� | �� | �� | � | 19.5�� | �� | �� | � | 24.0�� | �� | �� | � | 9.6�� | �� |
| Unrealized |
�� | � | 19.1� | �� | �� | � | 8.4�� | �� | �� | � | 22.8�� | �� | �� | � | 8.0�� | �� | �� | � | (7.1)� | �� | �� | � | (26.2)� | �� | �� | � | (15.1)� | �� |
| �� | � |
� |
� | �� | � |
� |
� | �� | � |
� |
� | �� | � |
� |
� | �� | � |
� |
� | �� | � |
� |
� | �� | � |
� |
� | |
| Total compensation and benefits |
�� | � | 41.8�� | �� | �� | � | 45.1�� | �� | �� | � | 61.4�� | �� | �� | � | 53.9�� | �� | �� | � | 44.7�� | �� | �� | � | 2.9�� | �� | �� | � | (9.2)� | �� |
| General, administrative, and other indirect expenses |
�� | � | 18.7�� | �� | �� | � | 15.5�� | �� | �� | � | 15.7�� | �� | �� | � | 21.1�� | �� | �� | � | 19.9�� | �� | �� | � | 1.2�� | �� | �� | � | (1.2)� | �� |
| Depreciation and amortization expense |
�� | � | 1.0�� | �� | �� | � | 0.9�� | �� | �� | � | 0.9�� | �� | �� | � | 0.8�� | �� | �� | � | 1.0�� | �� | �� | � | -������ | �� | �� | � | 0.2�� | �� |
| Interest expense |
�� | � | 2.2�� | �� | �� | � | 2.2�� | �� | �� | � | 2.5�� | �� | �� | � | 2.6�� | �� | �� | � | 2.6�� | �� | �� | � | 0.4�� | �� | �� | � | -������ | �� |
| �� | � |
� |
� | �� | � |
� |
� | �� | � |
� |
� | �� | � |
� |
� | �� | � |
� |
� | �� | � |
� |
� | �� | � |
� |
� | |
| Total expenses |
�� | � | 63.7�� | �� | �� | � | 63.7�� | �� | �� | � | 80.5�� | �� | �� | � | 78.4�� | �� | �� | � | 68.2�� | �� | �� | � | 4.5�� | �� | �� | � | (10.2)� | �� |
| �� | � |
� |
� | �� | � |
� |
� | �� | � |
� |
� | �� | � |
� |
� | �� | � |
� |
� | �� | � |
� |
� | �� | � |
� |
� | |
| Economic Net Income (Loss) |
�� | ��$ | (65.4)� | �� | �� | ��$ | (16.5)� | �� | �� | ��$ | 23.0�� | �� | �� | ��$ | 10.8�� | �� | �� | ��$ | (76.1)� | �� | �� | ��$ | (10.7)� | �� | �� | ��$ | (86.9)� | �� |
| �� | � |
� |
� | �� | � |
� |
� | �� | � |
� |
� | �� | � |
� |
� | �� | � |
� |
� | �� | � |
� |
� | �� | � |
� |
� | |
| (-) Net Performance Fees |
�� | � | (3.0)� | �� | �� | � | 5.9�� | �� | �� | � | 32.5�� | �� | �� | � | 20.0�� | �� | �� | � | (71.6)� | �� | �� | � | (68.6)� | �� | �� | � | (91.6)� | �� |
| (-) Investment Income (Loss) |
�� | � | (63.7)� | �� | �� | � | (18.5)� | �� | �� | � | (13.5)� | �� | �� | � | (6.5)� | �� | �� | � | (9.4)� | �� | �� | � | 54.3�� | �� | �� | � | (2.9)� | �� |
| (+) Equity-based compensation |
�� | � | 1.6�� | �� | �� | � | 3.5�� | �� | �� | � | 5.1�� | �� | �� | � | 5.4�� | �� | �� | � | 5.2�� | �� | �� | � | 3.6�� | �� | �� | � | (0.2)� | �� |
| �� | � |
� |
� | �� | � |
� |
� | �� | � |
� |
� | �� | � |
� |
� | �� | � |
� |
� | �� | � |
� |
� | �� | � |
� |
� | |
| (=) Fee Related Earnings |
�� | ��$ | 2.9�� | �� | �� | ��$ | (0.4)� | �� | �� | ��$ | 9.1�� | �� | �� | ��$ | 2.7�� | �� | �� | ��$ | 10.1�� | �� | �� | ��$ | 7.2�� | �� | �� | ��$ | 7.4�� | �� |
| �� | � |
� |
� | �� | � |
� |
� | �� | � |
� |
� | �� | � |
� |
� | �� | � |
� |
� | �� | � |
� |
� | �� | � |
� |
� | |
| (+) Realized Net Performance Fees |
�� | � | 0.9�� | �� | �� | � | 0.3�� | �� | �� | � | 8.9�� | �� | �� | � | 18.5�� | �� | �� | � | 30.7�� | �� | �� | � | 29.8�� | �� | �� | � | 12.2�� | �� |
| (+) Realized Investment Income (Loss) |
�� | � | (6.1)� | �� | �� | � | 2.1�� | �� | �� | � | 8.1�� | �� | �� | � | (13.2)� | �� | �� | � | (29.2)� | �� | �� | � | (23.1)� | �� | �� | � | (16.0)� | �� |
| �� | � |
� |
� | �� | � |
� |
� | �� | � |
� |
� | �� | � |
� |
� | �� | � |
� |
� | �� | � |
� |
� | �� | � |
� |
� | |
| (=) Distributable Earnings |
�� | ��$ | (2.3)� | �� | �� | ��$ | 2.0�� | �� | �� | ��$ | ��������26.1�� | �� | �� | ��$ | 8.0�� | �� | �� | ��$ | 11.6�� | �� | �� | ��$ | 13.9�� | �� | �� | ��$ | 3.6�� | �� |
| �� | � |
� |
� | �� | � |
� |
� | �� | � |
� |
� | �� | � |
� |
� | �� | � |
� |
� | �� | � |
� |
� | �� | � |
� |
� | |
�
Page��|��20
Investment Solutions Segment Results (Unaudited)
�
| � | �� | Three Months Ended | � | |||||||||||||||||||||||||
| � | �� | � | � | �� | � | � | �� | � | � | �� | � | � | �� | � | � | �� | Dec�31,�2014�vs. | � | ||||||||||
| � | �� | Dec�31, 2013 |
� | �� | Mar�31, 2014� (1) |
� | �� | Jun�30, 2014 |
� | �� | Sept�30, 2014 |
� | �� | Dec�31, 2014 |
� | �� | ��Dec�31,�2013�� | � | �� | ��Sept�30,�2014�� | � | |||||||
| Investment Solutions | �� | (Dollars in millions) | � | |||||||||||||||||||||||||
| Revenues |
�� | �� | �� | �� | �� | �� | �� | |||||||||||||||||||||
| Segment fee revenues |
�� | �� | �� | �� | �� | �� | �� | |||||||||||||||||||||
| Fund management fees |
�� | ��$ | ��������42.4�� | �� | �� | ��$ | ��������44.5�� | �� | �� | ��$ | ��������46.9�� | �� | �� | ��$ | ��������46.0�� | �� | �� | ��$ | ��������44.0�� | �� | �� | ��$ | ��������1.6�� | �� | �� | ��$ | ��������(2.0)� | �� |
| Portfolio advisory fees, net |
�� | � | -������ | �� | �� | � | -������ | �� | �� | � | -������ | �� | �� | � | -������ | �� | �� | � | -������ | �� | �� | � | -������ | �� | �� | � | -������ | �� |
| Transaction fees, net |
�� | � | -������ | �� | �� | � | -������ | �� | �� | � | -������ | �� | �� | � | -������ | �� | �� | � | -������ | �� | �� | � | -������ | �� | �� | � | -������ | �� |
| �� | � |
� |
� | �� | � |
� |
� | �� | � |
� |
� | �� | � |
� |
� | �� | � |
� |
� | �� | � |
� |
� | �� | � |
� |
� | |
| Total fee revenues |
�� | � | 42.4�� | �� | �� | � | 44.5�� | �� | �� | � | 46.9�� | �� | �� | � | 46.0�� | �� | �� | � | 44.0�� | �� | �� | � | 1.6�� | �� | �� | � | (2.0)� | �� |
| Performance fees |
�� | �� | �� | �� | �� | �� | �� | |||||||||||||||||||||
| Realized |
�� | � | 11.8�� | �� | �� | � | 5.9�� | �� | �� | � | 7.0�� | �� | �� | � | 10.6�� | �� | �� | � | 19.4�� | �� | �� | � | 7.6�� | �� | �� | � | 8.8�� | �� |
| Unrealized |
�� | � | 48.3�� | �� | �� | � | 79.3�� | �� | �� | � | 122.5�� | �� | �� | � | (50.9)� | �� | �� | � | (0.9)� | �� | �� | � | (49.2)� | �� | �� | � | 50.0�� | �� |
| �� | � |
� |
� | �� | � |
� |
� | �� | � |
� |
� | �� | � |
� |
� | �� | � |
� |
� | �� | � |
� |
� | �� | � |
� |
� | |
| Total performance fees |
�� | � | 60.1�� | �� | �� | � | 85.2�� | �� | �� | � | 129.5�� | �� | �� | � | (40.3)� | �� | �� | � | 18.5�� | �� | �� | � | (41.6)� | �� | �� | � | 58.8�� | �� |
| Investment income |
�� | �� | �� | �� | �� | �� | �� | |||||||||||||||||||||
| Realized |
�� | � | -������ | �� | �� | � | -������ | �� | �� | � | -������ | �� | �� | � | -������ | �� | �� | � | -������ | �� | �� | � | -������ | �� | �� | � | -������ | �� |
| Unrealized |
�� | � | 0.1�� | �� | �� | � | 0.1�� | �� | �� | � | 0.2�� | �� | �� | � | -������ | �� | �� | � | 0.1�� | �� | �� | � | -������ | �� | �� | � | 0.1�� | �� |
| �� | � |
� |
� | �� | � |
� |
� | �� | � |
� |
� | �� | � |
� |
� | �� | � |
� |
� | �� | � |
� |
� | �� | � |
� |
� | |
| Total investment income |
�� | � | 0.1�� | �� | �� | � | 0.1�� | �� | �� | � | 0.2�� | �� | �� | � | -������ | �� | �� | � | 0.1�� | �� | �� | � | -������ | �� | �� | � | 0.1�� | �� |
| Interest and other income |
�� | � | -������ | �� | �� | � | 0.3�� | �� | �� | � | 0.2�� | �� | �� | � | 0.5�� | �� | �� | � | 0.3�� | �� | �� | � | 0.3�� | �� | �� | � | (0.2)� | �� |
| �� | � |
� |
� | �� | � |
� |
� | �� | � |
� |
� | �� | � |
� |
� | �� | � |
� |
� | �� | � |
� |
� | �� | � |
� |
� | |
| Total revenues |
�� | � | 102.6�� | �� | �� | � | 130.1�� | �� | �� | � | 176.8�� | �� | �� | � | 6.2�� | �� | �� | � | 62.9�� | �� | �� | � | (39.7)� | �� | �� | � | 56.7�� | �� |
| Expenses |
�� | �� | �� | �� | �� | �� | �� | |||||||||||||||||||||
| Compensation and benefits |
�� | �� | �� | �� | �� | �� | �� | |||||||||||||||||||||
| Direct base compensation |
�� | � | 19.5�� | �� | �� | � | 21.0�� | �� | �� | � | 20.7�� | �� | �� | � | 20.7�� | �� | �� | � | 23.4�� | �� | �� | � | 3.9�� | �� | �� | � | 2.7�� | �� |
| Indirect base compensation |
�� | � | 1.9�� | �� | �� | � | 3.8�� | �� | �� | � | 4.0�� | �� | �� | � | 4.3�� | �� | �� | � | 1.5�� | �� | �� | � | (0.4)� | �� | �� | � | (2.8)� | �� |
| Equity-based compensation |
�� | � | 0.4�� | �� | �� | � | 0.7�� | �� | �� | � | 1.1�� | �� | �� | � | 1.5�� | �� | �� | � | 1.5�� | �� | �� | � | 1.1�� | �� | �� | � | -������ | �� |
| Performance fee related |
�� | �� | �� | �� | �� | �� | �� | |||||||||||||||||||||
| Realized |
�� | � | 8.0�� | �� | �� | � | 4.0�� | �� | �� | � | 4.1�� | �� | �� | � | 8.8�� | �� | �� | � | 14.0�� | �� | �� | � | 6.0�� | �� | �� | � | 5.2�� | �� |
| Unrealized |
�� | � | 49.7�� | �� | �� | � | 75.7�� | �� | �� | � | 119.6�� | �� | �� | � | (52.8)� | �� | �� | � | 2.5�� | �� | �� | � | (47.2)� | �� | �� | � | 55.3�� | �� |
| �� | � |
� |
� | �� | � |
� |
� | �� | � |
� |
� | �� | � |
� |
� | �� | � |
� |
� | �� | � |
� |
� | �� | � |
� |
� | |
| Total compensation and benefits |
�� | � | 79.5�� | �� | �� | � | 105.2�� | �� | �� | � | 149.5�� | �� | �� | � | (17.5)� | �� | �� | � | 42.9�� | �� | �� | � | (36.6)� | �� | �� | � | 60.4�� | �� |
| General, administrative, and other indirect expenses |
�� | � | 9.7�� | �� | �� | � | 9.2�� | �� | �� | � | 10.6�� | �� | �� | � | 11.5�� | �� | �� | � | 10.6�� | �� | �� | � | 0.9�� | �� | �� | � | (0.9)� | �� |
| Depreciation and amortization expense |
�� | � | 0.6�� | �� | �� | � | 0.9�� | �� | �� | � | 1.0�� | �� | �� | � | 0.9�� | �� | �� | � | 1.0�� | �� | �� | � | 0.4�� | �� | �� | � | 0.1�� | �� |
| Interest expense |
�� | � | 0.6�� | �� | �� | � | 1.2�� | �� | �� | � | 1.4�� | �� | �� | � | 1.5�� | �� | �� | � | 1.4�� | �� | �� | � | 0.8�� | �� | �� | � | (0.1)� | �� |
| �� | � |
� |
� | �� | � |
� |
� | �� | � |
� |
� | �� | � |
� |
� | �� | � |
� |
� | �� | � |
� |
� | �� | � |
� |
� | |
| Total expenses |
�� | � | 90.4�� | �� | �� | � | 116.5�� | �� | �� | � | 162.5�� | �� | �� | � | (3.6)� | �� | �� | � | 55.9�� | �� | �� | � | (34.5)� | �� | �� | � | 59.5�� | �� |
| �� | � |
� |
� | �� | � |
� |
� | �� | � |
� |
� | �� | � |
� |
� | �� | � |
� |
� | �� | � |
� |
� | �� | � |
� |
� | |
| Economic Net Income (Loss) (2) |
�� | ��$ | 12.2�� | �� | �� | ��$ | 13.6�� | �� | �� | ��$ | 14.3�� | �� | �� | ��$ | 9.8�� | �� | �� | ��$ | 7.0�� | �� | �� | ��$ | (5.2)� | �� | �� | ��$ | (2.8)� | �� |
| �� | � |
� |
� | �� | � |
� |
� | �� | � |
� |
� | �� | � |
� |
� | �� | � |
� |
� | �� | � |
� |
� | �� | � |
� |
� | |
| (-) Net Performance Fees (2) |
�� | � | 2.4�� | �� | �� | � | 5.5�� | �� | �� | � | 5.8�� | �� | �� | � | 3.7�� | �� | �� | � | 2.0�� | �� | �� | � | (0.4)� | �� | �� | � | (1.7)� | �� |
| (-) Investment Income |
�� | � | 0.1�� | �� | �� | � | 0.1�� | �� | �� | � | 0.2�� | �� | �� | � | -������ | �� | �� | � | 0.1�� | �� | �� | � | -������ | �� | �� | � | 0.1�� | �� |
| (+) Equity-based compensation |
�� | � | 0.4�� | �� | �� | � | 0.7�� | �� | �� | � | 1.1�� | �� | �� | � | 1.5�� | �� | �� | � | 1.5�� | �� | �� | � | 1.1�� | �� | �� | � | -������ | �� |
| �� | � |
� |
� | �� | � |
� |
� | �� | � |
� |
� | �� | � |
� |
� | �� | � |
� |
� | �� | � |
� |
� | �� | � |
� |
� | |
| (=) Fee Related Earnings |
�� | ��$ | 10.1�� | �� | �� | ��$ | 8.7�� | �� | �� | ��$ | 9.4�� | �� | �� | ��$ | 7.6�� | �� | �� | ��$ | 6.4�� | �� | �� | ��$ | (3.7)� | �� | �� | ��$ | (1.2)� | �� |
| �� | � |
� |
� | �� | � |
� |
� | �� | � |
� |
� | �� | � |
� |
� | �� | � |
� |
� | �� | � |
� |
� | �� | � |
� |
� | |
| (+) Realized Net Performance Fees (2) |
�� | � | 3.8�� | �� | �� | � | 1.9�� | �� | �� | � | 2.9�� | �� | �� | � | 1.8�� | �� | �� | � | 5.4�� | �� | �� | � | 1.6�� | �� | �� | � | 3.6�� | �� |
| (+) Realized Investment Income |
�� | � | -������ | �� | �� | � | -������ | �� | �� | � | -������ | �� | �� | � | -������ | �� | �� | � | -������ | �� | �� | � | -������ | �� | �� | � | -������ | �� |
| �� | � |
� |
� | �� | � |
� |
� | �� | � |
� |
� | �� | � |
� |
� | �� | � |
� |
� | �� | � |
� |
� | �� | � |
� |
� | |
| (=) Distributable Earnings (2) |
�� | ��$ | 13.9�� | �� | �� | ��$ | 10.6�� | �� | �� | ��$ | 12.3�� | �� | �� | ��$ | 9.4�� | �� | �� | ��$ | 11.8�� | �� | �� | ��$ | (2.1)� | �� | �� | ��$ | 2.4�� | �� |
| �� | � |
� |
� | �� | � |
� |
� | �� | � |
� |
� | �� | � |
� |
� | �� | � |
� |
� | �� | � |
� |
� | �� | � |
� |
� | |
(1) - During Q1 2014, Carlyle acquired Diversified Global Asset Management Corporation (DGAM). As such, amounts since the acquisition include the financial results of DGAM.
(2) - In Q4 2014, we reclassified certain tax expenses associated with carried interest attributable to former partners and employees as a component of performance fee related compensation expense. Prior periods have been reclassified to conform with our new presentation. See Appendix I and II for our reclassified quarterly results.
�
Page��|��21
Total Assets Under Management Roll Forward (Unaudited)
�
| � | � | Corporate Private Equity | � | � | Global Market Strategies (8) | � | � | Real Assets | � | � | Investment Solutions (9) | � | � | Total | � | |||||||||||||||||||||||||||||||||||||||||||||
| (USD�in�millions) | � | Available Capital |
� | � | Fair�Value of Capital |
� | � | Total AUM |
� | � | Available Capital |
� | � | Fair�Value of Capital |
� | � | Total AUM |
� | � | Available Capital |
� | � | Fair�Value of Capital |
� | � | Total AUM |
� | � | Available Capital |
� | � | Fair�Value of Capital |
� | � | Total AUM |
� | � | Available Capital |
� | � | Fair�Value of Capital |
� | � | Total AUM |
� | |||||||||||||||
| � | � |
� |
� | � | � |
� |
� | � | � |
� |
� | � | � |
� |
� | � | � |
� |
� | |||||||||||||||||||||||||||||||||||||||||
| Balance, As of September�30, 2014 |
� | ��$ | ��22,753�� | �� | � | ��$ | 40,826�� | �� | � | ��$ | 63,579�� | �� | � | ��$ | 1,448�� | �� | � | ��$ | 37,476�� | �� | � | ��$ | 38,924�� | �� | � | ��$ | 14,541�� | �� | � | ��$ | 31,239�� | �� | � | ��$ | 45,780�� | �� | � | ��$ | 17,613�� | �� | � | ��$ | 36,673�� | �� | � | ��$ | 54,286�� | �� | � | ��$ | 56,355�� | �� | � | ��$ | 146,214�� | �� | � | ��$ | 202,569�� | �� |
| Commitments (1) |
� | � | 2,667�� | �� | � | � | -������ | �� | � | � | 2,667�� | �� | � | � | 61�� | �� | � | � | -������ | �� | � | � | 61�� | �� | � | � | 1,511�� | �� | � | � | -������ | �� | � | � | 1,511�� | �� | � | � | 33�� | �� | � | � | -������ | �� | � | � | 33�� | �� | � | � | 4,272�� | �� | � | � | -������ | �� | � | � | 4,272�� | �� |
| Capital Called, net (2) |
� | � | (856)� | �� | � | � | 834�� | �� | � | � | (22)� | �� | � | � | (102)� | �� | � | � | (96)� | �� | � | � | (198)� | �� | � | � | (1,037)� | �� | � | � | 1,112�� | �� | � | � | 75�� | �� | � | � | (1,262)� | �� | � | � | 1,162�� | �� | � | � | (100)� | �� | � | � | (3,257)� | �� | � | � | 3,012�� | �� | � | � | (245)� | �� |
| Distributions (3) |
� | � | 92�� | �� | � | � | (3,635)� | �� | � | � | (3,543)� | �� | � | � | 105�� | �� | � | � | (168)� | �� | � | � | (63)� | �� | � | � | 719�� | �� | � | � | (2,472)� | �� | � | � | (1,753)� | �� | � | � | 135�� | �� | � | � | (2,852)� | �� | � | � | (2,717)� | �� | � | � | 1,051�� | �� | � | � | (9,127)� | �� | � | � | (8,076)� | �� |
| Subscriptions, net of Redemptions (4) |
� | � | -������ | �� | � | � | -������ | �� | � | � | -������ | �� | � | � | -������ | �� | � | � | (57)� | �� | � | � | (57)� | �� | � | � | -������ | �� | � | � | -������ | �� | � | � | -������ | �� | � | � | -������ | �� | � | � | (854)� | �� | � | � | (854)� | �� | � | � | -������ | �� | � | � | (911)� | �� | � | � | (911)� | �� |
| Changes in CLO collateral balances (5) |
� | � | -������ | �� | � | � | -������ | �� | � | � | -������ | �� | � | � | -������ | �� | � | � | (616)� | �� | � | � | (616)� | �� | � | � | -������ | �� | � | � | -������ | �� | � | � | -������ | �� | � | � | -������ | �� | � | � | -������ | �� | � | � | -������ | �� | � | � | -������ | �� | � | � | (616)� | �� | � | � | (616)� | �� |
| Market Appreciation/(Depreciation) (6) |
� | � | -������ | �� | � | � | 2,688�� | �� | � | � | 2,688�� | �� | � | � | -������ | �� | � | � | (1,417)� | �� | � | � | (1,417)� | �� | � | � | -������ | �� | � | � | (3,179)� | �� | � | � | (3,179)� | �� | � | � | -������ | �� | � | � | 1,182�� | �� | � | � | 1,182�� | �� | � | � | -������ | �� | � | � | (726)� | �� | � | � | (726)� | �� |
| Foreign Exchange and other (7) |
� | � | (217)� | �� | � | � | (484)� | �� | � | � | (701)� | �� | � | � | -������ | �� | � | � | 107�� | �� | � | � | 107�� | �� | � | � | (20)� | �� | � | � | (119)� | �� | � | � | (139)� | �� | � | � | (313)� | �� | � | � | (748)� | �� | � | � | (1,061)� | �� | � | � | (550)� | �� | � | � | (1,244)� | �� | � | � | (1,794)� | �� |
| � | � |
� |
� | � | � |
� |
� | � | � |
� |
� | � | � |
� |
� | � | � |
� |
� | |||||||||||||||||||||||||||||||||||||||||
| Balance, As of December�31, 2014 |
� | ��$ | 24,439�� | �� | � | ��$ | 40,229�� | �� | � | ��$ | 64,668�� | �� | � | ��$ | 1,512�� | �� | � | ��$ | 35,229�� | �� | � | ��$ | 36,741�� | �� | � | ��$ | 15,714�� | �� | � | ��$ | 26,581�� | �� | � | ��$ | 42,295�� | �� | � | ��$ | 16,206�� | �� | � | ��$ | 34,563�� | �� | � | ��$ | 50,769�� | �� | � | ��$ | 57,871�� | �� | � | ��$ | 136,602�� | �� | � | ��$ | 194,473�� | �� |
| � | � |
� |
� | � | � |
� |
� | � | � |
� |
� | � | � |
� |
� | � | � |
� |
� | |||||||||||||||||||||||||||||||||||||||||
| Balance, As of December�31, 2013 |
� | ��$ | 24,743�� | �� | � | ��$ | 40,122�� | �� | � | ��$ | 64,865�� | �� | � | ��$ | 1,458�� | �� | � | ��$ | 34,019�� | �� | � | ��$ | 35,477�� | �� | � | ��$ | 8,754�� | �� | � | ��$ | 29,910�� | �� | � | ��$ | 38,664�� | �� | � | ��$ | 17,063�� | �� | � | ��$ | 32,741�� | �� | � | ��$ | 49,804�� | �� | � | ��$ | 52,018�� | �� | � | ��$ | 136,792�� | �� | � | ��$ | 188,810�� | �� |
| Acquisitions |
� | � | -������ | �� | � | � | -������ | �� | � | � | -������ | �� | � | � | -������ | �� | � | � | -������ | �� | � | � | -������ | �� | � | � | -������ | �� | � | � | -������ | �� | � | � | -������ | �� | � | � | -������ | �� | � | � | 2,993�� | �� | � | � | 2,993�� | �� | � | � | -������ | �� | � | � | 2,993�� | �� | � | � | 2,993�� | �� |
| Commitments (1) |
� | � | 6,663�� | �� | � | � | -������ | �� | � | � | 6,663�� | �� | � | � | 150�� | �� | � | � | -������ | �� | � | � | 150�� | �� | � | � | 8,888�� | �� | � | � | -������ | �� | � | � | 8,888�� | �� | � | � | 4,605�� | �� | � | � | -������ | �� | � | � | 4,605�� | �� | � | � | 20,306�� | �� | � | � | -������ | �� | � | � | 20,306�� | �� |
| Capital Called, net (2) |
� | � | (7,380)� | �� | � | � | 6,818�� | �� | � | � | (562)� | �� | � | � | (566)� | �� | � | � | 812�� | �� | � | � | 246�� | �� | � | � | (3,612)� | �� | � | � | 4,081�� | �� | � | � | 469�� | �� | � | � | (4,857)� | �� | � | � | 4,487�� | �� | � | � | (370)� | �� | � | � | (16,415)� | �� | � | � | 16,198�� | �� | � | � | (217)� | �� |
| Distributions (3) |
� | � | 997�� | �� | � | � | (14,742)� | �� | � | � | (13,745)� | �� | � | � | 474�� | �� | � | � | (887)� | �� | � | � | (413)� | �� | � | � | 1,751�� | �� | � | � | (8,698)� | �� | � | � | (6,947)� | �� | � | � | 428�� | �� | � | � | (9,903)� | �� | � | � | (9,475)� | �� | � | � | 3,650�� | �� | � | � | (34,230)� | �� | � | � | (30,580)� | �� |
| Subscriptions, net of Redemptions (4) |
� | � | -������ | �� | � | � | -������ | �� | � | � | -������ | �� | � | � | -������ | �� | � | � | 924�� | �� | � | � | 924�� | �� | � | � | -������ | �� | � | � | -������ | �� | � | � | -������ | �� | � | � | -������ | �� | � | � | (1,084)� | �� | � | � | (1,084)� | �� | � | � | -������ | �� | � | � | (160)� | �� | � | � | (160)� | �� |
| Changes in CLO collateral balances (5) |
� | � | -������ | �� | � | � | -������ | �� | � | � | -������ | �� | � | � | -������ | �� | � | � | 2,087�� | �� | � | � | 2,087�� | �� | � | � | -������ | �� | � | � | -������ | �� | � | � | -������ | �� | � | � | -������ | �� | � | � | -������ | �� | � | � | -������ | �� | � | � | -������ | �� | � | � | 2,087�� | �� | � | � | 2,087�� | �� |
| Market Appreciation/(Depreciation) (6) |
� | � | -������ | �� | � | � | 9,330�� | �� | � | � | 9,330�� | �� | � | � | -������ | �� | � | � | (1,237)� | �� | � | � | (1,237)� | �� | � | � | -������ | �� | � | � | 1,577�� | �� | � | � | 1,577�� | �� | � | � | -������ | �� | � | � | 6,999�� | �� | � | � | 6,999�� | �� | � | � | -������ | �� | � | � | 16,669�� | �� | � | � | 16,669�� | �� |
| Foreign Exchange and other (7) |
� | � | (584)� | �� | � | � | (1,299)� | �� | � | � | (1,883)� | �� | � | � | (4)� | �� | � | � | (489)� | �� | � | � | (493)� | �� | � | � | (67)� | �� | � | � | (289)� | �� | � | � | (356)� | �� | � | � | (1,033)� | �� | � | � | (1,670)� | �� | � | � | (2,703)� | �� | � | � | (1,688)� | �� | � | � | (3,747)� | �� | � | � | (5,435)� | �� |
| � | � |
� |
� | � | � |
� |
� | � | � |
� |
� | � | � |
� |
� | � | � |
� |
� | |||||||||||||||||||||||||||||||||||||||||
| Balance, As of December�31, 2014 |
� | ��$ | 24,439�� | �� | � | ��$ | 40,229�� | �� | � | ��$ | 64,668�� | �� | � | ��$ | 1,512�� | �� | � | ��$ | 35,229�� | �� | � | ��$ | 36,741�� | �� | � | ��$ | 15,714�� | �� | � | ��$ | 26,581�� | �� | � | ��$ | 42,295�� | �� | � | ��$ | 16,206�� | �� | � | ��$ | 34,563�� | �� | � | ��$ | 50,769�� | �� | � | ��$ | 57,871�� | �� | � | ��$ | 136,602�� | �� | � | ��$ | 194,473�� | �� |
| � | � |
� |
� | � | � |
� |
� | � | � |
� |
� | � | � |
� |
� | � | � |
� |
� | |||||||||||||||||||||||||||||||||||||||||
(1) Represents capital raised by our carry funds, NGP management fee funds and fund of funds vehicles, net of expired available capital.
(2) Represents capital called by our carry funds, NGP management fee funds and fund of funds vehicles, net of fund fees and expenses and investments in our business development companies. Equity invested amounts may vary from capital called due to timing differences between investment acquisition and capital call dates.
(3) Represents distributions from our carry funds, NGP management fee funds and fund of funds vehicles, net of amounts recycled and distributions from our business development companies. Distributions are based on when proceeds are actually distributed to investors, which may differ from when they are realized.
(4) Represents the net result of subscriptions to and redemptions from our hedge funds, mutual funds, and fund of hedge funds vehicles. Net redemption notifications received during Q4 2014 will reduce January�1, 2015 hedge fund AUM by approximately $2.2 billion.
(5) Represents the change in the aggregate collateral balance and principal cash at par of the CLOs/structured products.
(6) Market Appreciation/(Depreciation) represents realized and unrealized gains (losses) on portfolio investments and changes in the net asset value of our hedge funds, mutual funds, and fund of hedge funds vehicles.
(7) Represents the impact of foreign exchange rate fluctuations on the translation of our non-U.S. dollar denominated funds and other changes in AUM. Activity during the period is translated at the average rate for the period. Ending balances are translated at the spot rate as of the period end.
(8) Ending balance is comprised of approximately $18.5 billion from our structured credit /other structured product funds, $13.4 billion in our hedge funds, $4.0 billion (including $1.5 billion of Available Capital) in our carry funds, $0.9 billion from our business development companies, and $0.1 billion in our mutual funds. Net redemption notifications received during Q4 2014 will reduce January�1, 2015 hedge fund AUM by approximately $2.2 billion.
(9) The fair market values for our Investment Solutions fund of funds vehicles are based on the latest available valuations of the underlying limited partnership interests (in most cases as of September�30, 2014) as provided by their general partners, plus the net cash flows since the latest valuation, up to December�31, 2014.
�
Page��|��22
Fee-Earning AUM Roll Forward (Unaudited)
�
| � | �� | For the Three Months Ended December�31, 2014 | � | |||||||||||||||||
| (USD in millions) | �� | Corporate ��Private�Equity�� |
� | �� | Global Market ��Strategies�� |
� | �� | Real ��Assets�(7)�� |
� | �� | ��Investment�� Solutions |
� | �� | ��Total�� | � | |||||
| �� | � |
� |
� | |||||||||||||||||
| Fee-earning AUM |
�� | �� | �� | �� | �� | |||||||||||||||
| Balance, Beginning of Period |
�� | ��$ | 41,951�� | �� | �� | ��$ | 34,815�� | �� | �� | ��$ | 28,174�� | �� | �� | ��$ | 35,274�� | �� | �� | ��$ | 140,214�� | �� |
| Inflows, including Fee-paying Commitments(1) |
�� | � | 574�� | �� | �� | � | (311)� | �� | �� | � | 2,203�� | �� | �� | � | 1,510�� | �� | �� | � | 3,976�� | �� |
| Outflows, including Distributions(2) |
�� | � | (1,795)� | �� | �� | � | (7)� | �� | �� | � | (1,873)� | �� | �� | � | (1,543)� | �� | �� | � | (5,218)� | �� |
| Subscriptions, net of Redemptions (3) |
�� | � | -������ | �� | �� | � | (36)� | �� | �� | � | -������ | �� | �� | � | (849)� | �� | �� | � | (885)� | �� |
| Changes in CLO collateral balances (4) |
�� | � | -������ | �� | �� | � | 359�� | �� | �� | � | -������ | �� | �� | � | -������ | �� | �� | � | 359�� | �� |
| Market Appreciation/(Depreciation) (5) |
�� | � | 163�� | �� | �� | � | (1,294)� | �� | �� | � | 6�� | �� | �� | � | 18�� | �� | �� | � | (1,107)� | �� |
| Foreign Exchange and other (6) |
�� | � | (644)� | �� | �� | � | 372�� | �� | �� | � | (159)� | �� | �� | � | (1,328)� | �� | �� | � | (1,759)� | �� |
| �� | � |
� |
� | |||||||||||||||||
| Balance, End of Period |
�� | ��$ | 40,249�� | �� | �� | ��$ | 33,898�� | �� | �� | ��$ | 28,351�� | �� | �� | ��$ | 33,082�� | �� | �� | ��$ | 135,580�� | �� |
| �� | � |
� |
� | |||||||||||||||||
| � | �� | For the Year Ended December�31, 2014 | � | |||||||||||||||||
| (USD in millions) | �� | ��Corporate�� Equity |
� | �� | Global Market ��Strategies�� |
� | �� | Real ��Assets�(7)�� |
� | �� | ��Investment�� Solutions |
� | �� | ��Total�� | � | |||||
| �� | � |
� |
� | |||||||||||||||||
| Fee-earning AUM |
�� | �� | �� | �� | �� | |||||||||||||||
| Balance, Beginning of Period |
�� | ����$ | 43,033�� | �� | �� | $ | 33,411�� | �� | �� | $ | 28,438�� | �� | �� | $ | 35,067�� | �� | �� | $ | 139,949�� | �� |
| Acquisitions |
�� | � | -������ | �� | �� | � | -������ | �� | �� | � | -������ | �� | �� | � | 2,894�� | �� | �� | � | 2,894�� | �� |
| Inflows, including Fee-paying Commitments(1) |
�� | � | 4,824�� | �� | �� | � | 2�� | �� | �� | � | 6,126�� | �� | �� | � | 5,941�� | �� | �� | � | 16,893�� | �� |
| Outflows, including Distributions(2) |
�� | � | (6,529)� | �� | �� | � | (479)� | �� | �� | � | (5,864)� | �� | �� | � | (6,291)� | �� | �� | � | (19,163)� | �� |
| Subscriptions, net of Redemptions (3) |
�� | � | -������ | �� | �� | � | 767�� | �� | �� | � | -������ | �� | �� | � | (1,044)� | �� | �� | � | (277)� | �� |
| Changes in CLO collateral balances (4) |
�� | � | -������ | �� | �� | � | 1,887�� | �� | �� | � | -������ | �� | �� | � | -������ | �� | �� | � | 1,887�� | �� |
| Market Appreciation/(Depreciation) (5) |
�� | � | 198�� | �� | �� | � | (1,548)� | �� | �� | � | (6)� | �� | �� | � | 292�� | �� | �� | � | (1,064)� | �� |
| Foreign Exchange and other (6) |
�� | � | (1,277)� | �� | �� | � | (142)� | �� | �� | � | (343)� | �� | �� | � | (3,777)� | �� | �� | � | (5,539)� | �� |
| �� | � |
� |
� | |||||||||||||||||
| Balance, End of Period |
�� | ����$ | ��������40,249�� | �� | �� | $ | ��������33,898�� | �� | �� | $ | ��������28,351�� | �� | �� | $ | ��������33,082�� | �� | �� | $ | ��������135,580�� | �� |
| �� | � |
� |
� | |||||||||||||||||
(1) Inflows represent limited partner capital raised and capital invested by our carry funds, NGP management fee funds, and fund of funds vehicles outside the investment period, weighted-average investment period or commitment fee period, and capital invested in our business development companies.
(2) Outflows represent limited partner distributions from our carry funds, NGP management fee funds, and fund of funds vehicles and changes in basis for our carry funds and fund of funds vehicles where the investment period, weighted-average investment period or commitment fee period has expired, and distributions from our business development companies.
(3) Represents the net result of subscriptions to and redemptions from our hedge funds, mutual funds and fund of hedge funds vehicles. Net redemption notifications received during Q4 2014 will reduce January�1, 2015 hedge fund AUM by approximately $2.2 billion.
(4)�Represents the change in the aggregate Fee-earning collateral balances at par of our CLOs/structured products, as of the quarterly cut-off dates.
(5) Market Appreciation/ (Depreciation) represents changes in the net asset value of our hedge funds, mutual funds and fund of hedge funds vehicles, and realized and unrealized gains (losses) on portfolio investments in our carry funds and fund of funds vehicles based on the lower of cost or fair value.
(6) Includes onboarding of fully committed existing funds from another manager and represents the impact of foreign exchange rate fluctuations on the translation of our non-U.S. dollar denominated funds. Activity during the period is translated at the average rate for the period. Ending balances are translated at the spot rate as of the period end.
(7) Energy II, Energy III, Energy IV, Renew I and Renew II (collectively, the �Legacy Energy Funds�), are managed with Riverstone Holdings LLC and its affiliates. Affiliates of both Carlyle and Riverstone act as investment advisers to each of the Legacy Energy Funds. With the exception of Energy IV and Renew II, where Carlyle has a minority representation on the funds� management committees, management of each of the Legacy Energy Funds is vested in committees with equal representation by Carlyle and Riverstone, and the consent of representatives of both Carlyle and Riverstone is required for investment decisions. As of December�31, 2014, the Legacy Energy Funds had, in the aggregate, approximately $9.9 billion in AUM and $7.2 billion in Fee-earning AUM. NGP VII, NGP VIII, NGP IX, or in the case of NGP M&R, NGP ETP I, NGP ETP II and NGPC, certain affiliated entities (collectively, the �NGP management fee funds�) and NGP X, NGP GAP and NGP XI (collectively, �carry funds�), are managed by NGP Energy Capital Management. As of December�31, 2014, the NGP management fee funds and carry funds had, in the aggregate, approximately $14.6 billion in AUM and $8.7 billion in Fee-earning AUM.
�
Page��|��23
Corporate Private Equity and Real Assets Fund Performance (Unaudited)
The fund return information reflected in this discussion and analysis is not indicative of the performance of The Carlyle Group L.P. and is also not necessarily indicative of the future performance of any particular fund. An investment in The Carlyle Group L.P. is not an investment in any of our funds. There can be no assurance that any of our existing or future funds will achieve similar returns.
�
| � | � | � | � | � | � | � | TOTAL INVESTMENTS | � | REALIZED/PARTIALLY�REALIZED INVESTMENTS�(5) |
� | ||||||||||||||||||||||||||||||
| � | � | � | � |
� |
� | � |
� |
� | ||||||||||||||||||||||||||||||||
| � | � | � | � | � | � | � | as of December�31, 2014 | � | as of December�31, 2014 | � | ||||||||||||||||||||||||||||||
| � | � | � | � |
� |
� | � |
� |
� | ||||||||||||||||||||||||||||||||
| � | � | ��Fund � ��Inception � ��Date�(1) |
� | Committed � Capital |
� | � | ��Cumulative � ��Invested � ��Capital�(2) |
� | � | Total�Fair � Value (3) |
� | � | MOIC � (4) |
� | � | Gross � IRR�(7) |
� | � | Net � IRR�(8) |
� | � ��Cumulative ��Invested�� Capital (2) |
� | �� | Total�Fair � Value�(3) |
� | �� | MOIC � (4) |
� | �� | Gross�� IRR�(7)�� |
� | |||||||||
| � | � |
� | � |
� |
� | |||||||||||||||||||||||||||||||||||
| Corporate Private Equity | � | � | � | (Reported in Local Currency, in Millions) | � | (Reported in Local Currency, in Millions) | � | |||||||||||||||||||||||||||||||||
| Fully Invested Funds�(6) |
� | � | � | � | � | � | � | � | �� | �� | �� | |||||||||||||||||||||||||||||
| CP II |
� | 10/1994 | � | $ | 1,331.1 | �� | � | ��$ | 1,362.4 | �� | � | $ | 4,072.2 | �� | � | � | 3.0x | �� | � | � | 34% | �� | � | 25% | � | ��$ | 1,362.4 | �� | �� | $ | 4,072.2 | �� | �� | � | 3.0x | �� | �� | � | 34% | �� |
| CP III |
� | 2/2000 | � | $ | 3,912.7 | �� | � | ��$ | 4,031.6 | �� | � | $ | 10,146.9 | �� | � | � | 2.5x | �� | � | � | 27% | �� | � | 21% | � | ��$ | 4,031.6 | �� | �� | $ | 10,146.9 | �� | �� | � | 2.5x | �� | �� | � | 27% | �� |
| CP IV |
� | 12/2004 | � | $ | 7,850.0 | �� | � | ��$ | 7,612.6 | �� | � | $ | 17,758.8 | �� | � | � | 2.3x | �� | � | � | 16% | �� | � | 13% | � | ��$ | 6,367.9 | �� | �� | $ | 16,588.7 | �� | �� | � | 2.6x | �� | �� | � | 19% | �� |
| CP V |
� | 5/2007 | � | $ | 13,719.7 | �� | � | ��$ | 12,796.5 | �� | � | $ | 24,241.5 | �� | � | � | 1.9x | �� | � | � | 19% | �� | � | 15% | � | ��$ | 5,984.1 | �� | �� | $ | 13,367.7 | �� | �� | � | 2.2x | �� | �� | � | 23% | �� |
| CEP I |
� | 12/1997 | � | � | 1,003.6 | �� | � | ��� | 981.6 | �� | � | � | 2,126.5 | �� | � | � | 2.2x | �� | � | � | 18% | �� | � | 11% | � | ��� | 981.6 | �� | �� | � | 2,126.5 | �� | �� | � | 2.2x | �� | �� | � | 18% | �� |
| CEP II |
� | 9/2003 | � | � | 1,805.4 | �� | � | ��� | 2,048.8 | �� | � | � | 3,984.4 | �� | � | � | 1.9x | �� | � | � | 37% | �� | � | 20% | � | ��� | 1,329.1 | �� | �� | � | 3,311.3 | �� | �� | � | 2.5x | �� | �� | � | 59% | �� |
| CEP III |
� | 12/2006 | � | � | 5,294.9 | �� | � | ��� | 4,988.0 | �� | � | � | 9,662.6 | �� | � | � | 1.9x | �� | � | � | 18% | �� | � | 13% | � | ��� | 1,989.4 | �� | �� | � | 5,279.5 | �� | �� | � | 2.7x | �� | �� | � | 27% | �� |
| CAP I |
� | 12/1998 | � | $ | 750.0 | �� | � | ��$ | 627.7 | �� | � | $ | 2,492.6 | �� | � | � | 4.0x | �� | � | � | 25% | �� | � | 18% | � | ��$ | 627.7 | �� | �� | $ | 2,492.6 | �� | �� | � | 4.0x | �� | �� | � | 25% | �� |
| CAP II |
� | 2/2006 | � | $ | 1,810.0 | �� | � | ��$ | 1,628.6 | �� | � | $ | 2,761.0 | �� | � | � | 1.7x | �� | � | � | 11% | �� | � | 8% | � | ��$ | 720.0 | �� | �� | $ | 2,117.4 | �� | �� | � | 2.9x | �� | �� | � | 24% | �� |
| CAP III |
� | 5/2008 | � | $ | 2,551.6 | �� | � | ��$ | 2,512.2 | �� | � | $ | 3,855.8 | �� | � | � | 1.5x | �� | � | � | 17% | �� | � | 10% | � | ��$ | 984.4 | �� | �� | $ | 1,931.7 | �� | �� | � | 2.0x | �� | �� | � | 22% | �� |
| CJP I |
� | 10/2001 | � | � | 50,000.0 | �� | � | ��� | 47,291.4 | �� | � | � | 137,266.0 | �� | � | � | 2.9x | �� | � | � | 61% | �� | � | 37% | � | ��� | 39,756.6 | �� | �� | � | 131,454.6 | �� | �� | � | 3.3x | �� | �� | � | 65% | �� |
| CJP II |
� | 7/2006 | � | � | 165,600.0 | �� | � | ��� | 141,866.7 | �� | � | � | 173,486.9 | �� | � | � | 1.2x | �� | � | � | 5% | �� | � | 1% | � | ��� | 64,306.1 | �� | �� | � | 89,674.4 | �� | �� | � | 1.4x | �� | �� | � | 7% | �� |
| CGFSP I |
� | 9/2008 | � | $ | 1,100.2 | �� | � | ��$ | 1,052.5 | �� | � | $ | 1,816.9 | �� | � | � | 1.7x | �� | � | � | 19% | �� | � | 12% | � | ��$ | 218.1 | �� | �� | $ | 529.8 | �� | �� | � | 2.4x | �� | �� | � | 28% | �� |
| CETP II |
� | 2/2007 | � | � | 521.6 | �� | � | ��� | 431.5 | �� | � | � | 920.6 | �� | � | � | 2.1x | �� | � | � | 25% | �� | � | 16% | � | ��� | 149.8 | �� | �� | � | 538.7 | �� | �� | � | 3.6x | �� | �� | � | 34% | �� |
| CAGP IV |
� | 6/2008 | � | $ | 1,041.4 | �� | � | ��$ | 807.3 | �� | � | $ | 1,159.4 | �� | � | � | 1.4x | �� | � | � | 15% | �� | � | 8% | � | ��$ | 155.0 | �� | �� | $ | 370.0 | �� | �� | � | 2.4x | �� | �� | � | 33% | �� |
| All Other Funds(9) |
� | Various | � | � | ��$ | 3,733.2 | �� | � | $ | 5,803.2 | �� | � | � | 1.6x | �� | � | � | 17% | �� | � | 7% | � | ��$ | 2,817.1 | �� | �� | $ | 4,756.1 | �� | �� | � | 1.7x | �� | �� | � | 20% | �� | |||
| Coinvestments and Other(10) |
� | Various | � | � | ��$ | 8,040.2 | �� | � | $ | 19,975.4 | �� | � | � | 2.5x | �� | � | � | 36% | �� | � | 33% | � | ��$ | 5,003.3 | �� | �� | $ | 15,656.8 | �� | �� | � | 3.1x | �� | �� | � | 36% | �� | |||
| � | � | � | � |
� |
� | � |
� |
� | ||||||||||||||||||||||||||||||||
| Total Fully Invested Funds |
� | � | � | ��$ | 56,008.2 | �� | � | $ | 116,878.0 | �� | � | � | 2.1x | �� | � | � | 27% | �� | � | 19% | � | ��$ | 34,447.3 | �� | �� | $ | 87,495.9 | �� | �� | � | 2.5x | �� | �� | � | 29% | �� | ||||
| � | � | � | � |
� |
� | � |
� |
� | ||||||||||||||||||||||||||||||||
| Funds in the Investment Period�(6) |
� | � | � | � | � | � | � | � | �� | �� | �� | |||||||||||||||||||||||||||||
| CP VI (12) |
� | 5/2012 | � | $ | 13,000.0 | �� | � | ��$ | 3,813.7 | �� | � | $ | 3,865.9 | �� | � | � | 1.0x | �� | � | � | n/m | �� | � | n/m | � | �� | �� | �� | ||||||||||||
| CEP IV (12) |
� | 8/2013 | � | � | 1,576.9 | �� | � | ��� | 191.8 | �� | � | � | 185.8 | �� | � | � | 1.0x | �� | � | � | n/m | �� | � | n/m | � | �� | �� | �� | ||||||||||||
| CAP IV (12) |
� | 11/2012 | � | $ | 3,880.4 | �� | � | ��$ | 591.0 | �� | � | $ | 564.3 | �� | � | � | 1.0x | �� | � | � | n/m | �� | � | n/m | � | �� | �� | �� | ||||||||||||
| CEOF I |
� | 5/2011 | � | $ | 1,119.1 | �� | � | ��$ | 770.3 | �� | � | $ | 1,166.1 | �� | � | � | 1.5x | �� | � | � | 35% | �� | � | 23% | � | �� | �� | �� | ||||||||||||
| CGFSP II (12) |
� | 4/2013 | � | $ | 1,000.0 | �� | � | ��$ | 90.4 | �� | � | $ | 119.4 | �� | � | � | 1.3x | �� | � | � | n/m | �� | � | n/m | � | �� | �� | �� | ||||||||||||
| All Other Funds(11) |
� | Various | � | � | ��$ | 983.7 | �� | � | $ | 985.7 | �� | � | � | 1.0x | �� | � | � | (1%) | �� | � | (15%) | � | �� | �� | �� | |||||||||||||||
| � | � | � | � |
� |
� | � |
� |
� | ||||||||||||||||||||||||||||||||
| Total Funds in the Investment Period |
� | � | ��$ | 6,481.2 | �� | � | $ | 6,926.2 | �� | � | � | 1.1x | �� | � | � | 9% | �� | � | (7%) | � | ��$ | 161.0 | �� | �� | $ | 519.5 | �� | �� | � | 3.2x | �� | �� | � | 78% | �� | |||||
| � | � | � | � |
� |
� | � |
� |
� | ||||||||||||||||||||||||||||||||
| TOTAL CORPORATE PRIVATE EQUITY(13) |
�� |
� | ��$ | 62,489.4 | �� | � | $ | 123,804.2 | �� | � | � | 2.0x | �� | � | � | 27% | �� | � | 19% | � | ��$ | 34,608.3 | �� | �� | $ | 88,015.5 | �� | �� | � | 2.5x | �� | �� | � | 29% | �� | |||||
| � | � | � | � |
� |
� | � |
� |
� | ||||||||||||||||||||||||||||||||
| � | � | � | � | � | � | � | TOTAL INVESTMENTS | � | REALIZED/PARTIALLY REALIZED INVESTMENTS (5) |
� | ||||||||||||||||||||||||||||||
| � | � | � | � |
� |
� | � |
� |
� | ||||||||||||||||||||||||||||||||
| � | � | � | � | � | � | � | as of December�31, 2014 | � | as of December�31, 2014 | � | ||||||||||||||||||||||||||||||
| � | � | � | � |
� |
� | � |
� |
� | ||||||||||||||||||||||||||||||||
| � | � | ��Fund � ��Inception � ��Date (1) |
� | Committed � Capital |
� | � | ��Cumulative
� ��Invested � ��Capital (2) |
� | � | Total�Fair � Value�(3) |
� | � | MOIC � (4) |
� | � | Gross � IRR (7) |
� | � | Net � IRR�(8) |
� | � ��Cumulative � ��Invested � ��Capital (2) |
� | �� | Total�Fair � Value�(3) |
� | �� | MOIC � (4) |
� | �� | Gross��
� IRR�(7)�� |
� | |||||||||
| Real Assets | � | � | � | (Reported in Local Currency, in Millions) | � | (Reported in Local Currency, in Millions) | � | |||||||||||||||||||||||||||||||||
| Fully Invested Funds�(6) |
� | � | � | � | � | � | � | � | �� | �� | �� | |||||||||||||||||||||||||||||
| CRP III |
� | 11/2000 | � | $ | 564.1 | �� | � | ��$ | 522.5 | �� | � | $ | 1,448.1 | �� | � | � | 2.8x | �� | � | � | 44% | �� | � | 30% | � | ��$ | 522.5 | �� | �� | $ | 1,448.1 | �� | �� | � | 2.8x | �� | �� | � | 44% | �� |
| CRP IV |
� | 12/2004 | � | $ | 950.0 | �� | � | ��$ | 1,198.6 | �� | � | $ | 1,461.8 | �� | � | � | 1.2x | �� | � | � | 4% | �� | � | 0% | � | ��$ | 479.4 | �� | �� | $ | 550.4 | �� | �� | � | 1.1x | �� | �� | � | 10% | �� |
| CRP V |
� | 11/2006 | � | $ | 3,000.0 | �� | � | ��$ | 3,290.4 | �� | � | $ | 4,827.7 | �� | � | � | 1.5x | �� | � | � | 11% | �� | � | 8% | � | ��$ | 2,690.5 | �� | �� | $ | 4,055.0 | �� | �� | � | 1.5x | �� | �� | � | 13% | �� |
| CRP VI |
� | 9/2010 | � | $ | 2,340.0 | �� | � | ��$ | 1,862.1 | �� | � | $ | 2,897.8 | �� | � | � | 1.6x | �� | � | � | 34% | �� | � | 22% | � | ��$ | 598.5 | �� | �� | $ | 1,154.0 | �� | �� | � | 1.9x | �� | �� | � | 39% | �� |
| CEREP I |
� | 3/2002 | � | � | 426.6 | �� | � | ��� | 517.0 | �� | � | � | 691.5 | �� | � | � | 1.3x | �� | � | � | 12% | �� | � | 7% | � | ��� | 517.0 | �� | �� | � | 691.5 | �� | �� | � | 1.3x | �� | �� | � | 12% | �� |
| CEREP II |
� | 4/2005 | � | � | 762.7 | �� | � | ��� | 833.8 | �� | � | � | 128.1 | �� | � | � | 0.2x | �� | � | � | n/a | �� | � | n/a | � | ��� | 594.1 | �� | �� | � | 130.6 | �� | �� | � | 0.2x | �� | �� | � | n/a | �� |
| CEREP III |
� | 5/2007 | � | � | 2,229.5 | �� | � | ��� | 1,981.6 | �� | � | � | 1,985.4 | �� | � | � | 1.0x | �� | � | � | 0% | �� | � | (4%) | � | ��� | 567.8 | �� | �� | � | 710.3 | �� | �� | � | 1.3x | �� | �� | � | 6% | �� |
| CIP |
� | 9/2006 | � | $ | 1,143.7 | �� | � | ��$ | 1,011.7 | �� | � | $ | 1,224.3 | �� | � | � | 1.2x | �� | � | � | 5% | �� | � | 2% | � | ��$ | 180.7 | �� | �� | $ | -���� | �� | �� | � | 0.0x | �� | �� | � | n/a | �� |
| NGP X (23) |
� | 1/2012 | � | $ | 3,586.0 | �� | � | ��$ | 2,458.8 | �� | � | $ | 2,965.9 | �� | � | � | 1.2x | �� | � | � | 14% | �� | � | 8% | � | ��$ | 272.2 | �� | �� | $ | 674.5 | �� | �� | � | 2.5x | �� | �� | � | 75% | �� |
| Energy II |
� | 7/2002 | � | $ | 1,100.0 | �� | � | ��$ | 1,334.8 | �� | � | $ | 3,259.5 | �� | � | � | 2.4x | �� | � | � | 81% | �� | � | 55% | � | ��$ | 827.4 | �� | �� | $ | 3,131.6 | �� | �� | � | 3.8x | �� | �� | � | 105% | �� |
| Energy III |
� | 10/2005 | � | $ | 3,800.0 | �� | � | ��$ | 3,559.9 | �� | � | $ | 5,861.8 | �� | � | � | 1.6x | �� | � | � | 11% | �� | � | 8% | � | ��$ | 1,545.4 | �� | �� | $ | 4,052.7 | �� | �� | � | 2.6x | �� | �� | � | 26% | �� |
| Energy IV |
� | 12/2007 | � | $ | 5,979.1 | �� | � | ��$ | 5,786.3 | �� | � | $ | 8,317.5 | �� | � | � | 1.4x | �� | � | � | 14% | �� | � | 9% | � | ��$ | 2,522.4 | �� | �� | $ | 4,764.0 | �� | �� | � | 1.9x | �� | �� | � | 28% | �� |
| Renew II |
� | 3/2008 | � | $ | 3,417.5 | �� | � | ��$ | 2,808.8 | �� | � | $ | 4,013.1 | �� | � | � | 1.4x | �� | � | � | 11% | �� | � | 8% | � | ��$ | 643.1 | �� | �� | $ | 842.7 | �� | �� | � | 1.3x | �� | �� | � | 13% | �� |
| All Other Funds(14) |
� | Various | � | � | ��$ | 2,824.8 | �� | � | $ | 3,049.5 | �� | � | � | 1.1x | �� | � | � | 3% | �� | � | (2%) | � | ��$ | 2,167.1 | �� | �� | $ | 2,306.7 | �� | �� | � | 1.1x | �� | �� | � | 3% | �� | |||
| Coinvestments and Other(10) |
� | Various | � | � | ��$ | 5,271.9 | �� | � | $ | 8,252.4 | �� | � | � | 1.6x | �� | � | � | 17% | �� | � | 13% | � | ��$ | 2,100.3 | �� | �� | $ | 4,460.4 | �� | �� | � | 2.1x | �� | �� | � | 28% | �� | |||
| � | � | � | � |
� |
� | � |
� |
� | ||||||||||||||||||||||||||||||||
| Total Fully Invested Funds |
� | � | � | ��$ | 35,963.2 | �� | � | $ | 50,973.6 | �� | � | � | 1.4x | �� | � | � | 13% | �� | � | 8% | � | ��$ | 16,580.9 | �� | �� | $ | 29,294.2 | �� | �� | � | 1.8x | �� | �� | � | 23% | �� | ||||
| � | � | � | � |
� |
� | � |
� |
� | ||||||||||||||||||||||||||||||||
| Funds in the Investment Period�(6) |
� | � | � | � | � | � | � | � | �� | �� | �� | |||||||||||||||||||||||||||||
| CRP VII (12) |
� | 3/2014 | � | $ | 2,662.1 | �� | � | ��$ | 195.1 | �� | � | $ | 187.3 | �� | � | � | 1.0x | �� | � | � | n/m | �� | � | n/m | � | �� | �� | �� | ||||||||||||
| CIEP I (12) |
� | 9/2013 | � | $ | 2,159.1 | �� | � | ��$ | 341.7 | �� | � | $ | 294.5 | �� | � | � | 0.9x | �� | � | � | n/m | �� | � | n/m | � | �� | �� | �� | ||||||||||||
| NGP XI (12) |
� | 6/2014 | � | $ | 4,244.2 | �� | � | ��$ | 18.0 | �� | � | $ | 18.0 | �� | � | � | 1.0x | �� | � | � | n/m | �� | � | n/m | � | �� | �� | �� | ||||||||||||
| All Other Funds(15) |
� | Various | � | � | ��$ | 97.9 | �� | � | $ | 93.1 | �� | � | � | 1.0x | �� | � | � | n/m | �� | � | n/m | � | �� | �� | �� | |||||||||||||||
| � | � | � | � |
� |
� | � |
� |
� | ||||||||||||||||||||||||||||||||
| Total Funds in the Investment Period |
� | � | � | ��$ | 652.6 | �� | � | $ | 592.9 | �� | � | � | 0.9x | �� | � | � | (34% | )� | � | (66%) | � | ��$ | -���� | �� | �� | $ | -���� | �� | �� | � | n/a | �� | �� | � | n/a | �� | ||||
| � | � | � | � |
� |
� | � |
� |
� | ||||||||||||||||||||||||||||||||
| TOTAL Real Assets�(13) |
� | � | � | ��$ | 36,615.9 | �� | � | $ | 51,566.5 | �� | � | � | 1.4x | �� | � | � | 13% | �� | � | 8% | � | ��$ | 16,580.9 | �� | �� | $ | 29,294.2 | �� | �� | � | 1.8x | �� | �� | � | 23% | �� | ||||
| � | � | � | � |
� |
� | � |
� |
� | ||||||||||||||||||||||||||||||||
�
Page��|��24
Global Markets Strategies Carry Funds and Investment Solutions (Unaudited)
�
| � | � | � | � | � | � | � | TOTAL INVESTMENTS | |||||||||||||
| � | � | � | � |
� | ||||||||||||||||
| � | � | � | � | � | � | � | as of December�31, 2014 | |||||||||||||
| � | � | Fund | � | Committed |
� | � | Cumulative | � | � | Total�Fair |
� | � | MOIC�(4) |
� | Gross�IRR�(7) |
� | Net�IRR�(8) | |||
| � | � | Inception | � | � | Invested�Capital | � | � | � | � | � | ||||||||||
| � | � | Date (16) | � | Capital | � | � | (17) | � | � | Value (3) | � | � | � | � | ||||||
| � | � | |||||||||||||||||||
| � | � | ������������������������ (Reported in Local Currency, in Millions) | ||||||||||||||||||
| Global Market Strategies |
� | � | � | � | � | � | � | |||||||||||||
| CSP II |
� | 6/2007 | � | $ | 1,352.3 | �� | � | $ | 1,352.3 | �� | � | $ | 2,426.0 | �� | � | 1.8x | � | 17% | � | 12% |
| CEMOF I |
� | 12/2010 | � | $ | 1,382.5 | �� | � | $ | 1,043.1 | �� | � | $ | 1,364.1 | �� | � | 1.3x | � | 26% | � | 14% |
| � | � | � | � | � | � | � | TOTAL INVESTMENTS | |||||||||||||
| � | � | � | � |
� | ||||||||||||||||
| � | � | � | � | � | � | � | as of December�31, 2014 | |||||||||||||
| � | � | � | � |
� | ||||||||||||||||
| � | � | � | � | � | � | � | Cumulative | � | � | � | � | � | � | � | � | � | � | |||
| � | � | Vintage | � | � | Invested Capital | � | � | Total�Fair | � | � | � | � | ||||||||
| � | � | Year | � | Fund Size | � | � | (2)(20) | � | � | Value�(3)(20) | � | � | MOIC (4) | � | Gross IRR (7) | � | Net IRR (8) | |||
| � | � | |||||||||||||||||||
| Investment Solutions (19) | � | ��������������������� ���(Reported in Local Currency, in Millions) | ||||||||||||||||||
| ����Fully Committed Funds (18) |
� | � | � | � | � | � | � | |||||||||||||
| Main Fund I - Fund Investments |
� | 2000 | � | � | 5,174.6 | �� | � | ��� | 4,120.0 | �� | � | � | 6,727.6 | �� | � | 1.6x | � | 12% | � | 12% |
| Main Fund II - Fund Investments |
� | 2003 | � | � | 4,545.0 | �� | � | ��� | 4,697.5 | �� | � | � | 7,201.4 | �� | � | 1.5x | � | 10% | � | 10% |
| Main Fund III - Fund Investments |
� | 2005 | � | � | 11,500.0 | �� | � | ��� | 11,789.8 | �� | � | � | 16,831.2 | �� | � | 1.4x | � | 9% | � | 9% |
| Main Fund IV - Fund Investments |
� | 2009 | � | � | 4,880.0 | �� | � | ��� | 3,131.9 | �� | � | � | 3,878.0 | �� | � | 1.2x | � | 13% | � | 12% |
| Main Fund I - Secondary Investments |
� | 2002 | � | � | 519.4 | �� | � | ��� | 483.7 | �� | � | � | 905.7 | �� | � | 1.9x | � | 56% | � | 52% |
| Main Fund II - Secondary Investments |
� | 2003 | � | � | 998.4 | �� | � | ��� | 978.3 | �� | � | � | 1,789.0 | �� | � | 1.8x | � | 27% | � | 26% |
| Main Fund III - Secondary Investments |
� | 2006 | � | � | 2,250.0 | �� | � | ��� | 2,265.8 | �� | � | � | 3,204.3 | �� | � | 1.4x | � | 10% | � | 10% |
| Main Fund IV - Secondary Investments |
� | 2010 | � | � | 1,856.4 | �� | � | ��� | 1,818.3 | �� | � | � | 2,746.9 | �� | � | 1.5x | � | 20% | � | 19% |
| Main Fund II - Co-Investments |
� | 2003 | � | � | 1,090.0 | �� | � | ��� | 909.5 | �� | � | � | 2,472.1 | �� | � | 2.7x | � | 44% | � | 42% |
| Main Fund III - Co-Investments |
� | 2006 | � | � | 2,760.0 | �� | � | ��� | 2,712.7 | �� | � | � | 3,729.7 | �� | � | 1.4x | � | 6% | � | 5% |
| Main Fund IV - Co-Investments |
� | 2010 | � | � | 1,475.0 | �� | � | ��� | 1,301.4 | �� | � | � | 2,424.6 | �� | � | 1.9x | � | 22% | � | 20% |
| Main Fund V - Co-Investments |
� | 2012 | � | � | 1,122.2 | �� | � | ��� | 957.2 | �� | � | � | 1,385.0 | �� | � | 1.4x | � | 41% | � | 37% |
| Main Fund II - Mezzanine Investments |
� | 2004 | � | � | 700.0 | �� | � | ��� | 742.6 | �� | � | � | 1,018.2 | �� | � | 1.4x | � | 8% | � | 7% |
| Main Fund III - Mezzanine Investments |
� | 2006 | � | � | 2,000.0 | �� | � | ��� | 1,700.8 | �� | � | � | 2,257.4 | �� | � | 1.3x | � | 11% | � | 9% |
| All Other Funds (21) |
� | Various | � | � | ��� | 1,760.5 | �� | � | � | 2,467.8 | �� | � | 1.4x | � | 16% | � | 13% | |||
| � | � | � | � |
� | ||||||||||||||||
| ����Total Fully Committed Funds |
� | � | � | ��� | 39,370.2 | �� | � | � | 59,038.8 | �� | � | 1.5x | � | 12% | � | 12% | ||||
| � | � | � | � |
� | ||||||||||||||||
| ����Funds in the Commitment Period |
� | � | � | � | � | � | � | |||||||||||||
| Main Fund V - Fund Investments |
� | 2012 | � | � | 5,080.0 | �� | � | ��� | 983.9 | �� | � | � | 962.2 | �� | � | 1.0x | � | (3%) | � | (7%) |
| Main Fund V - Secondary Investments |
� | 2011 | � | � | 3,793.0 | �� | � | ��� | 1,566.0 | �� | � | � | 2,237.5 | �� | � | 1.4x | � | 31% | � | 28% |
| All Other Funds (21) |
� | Various | � | � | ��� | 72.3 | �� | � | � | 72.1 | �� | � | 1.0x | � | (1%) | � | (11%) | |||
| � | � | � | � |
� | ||||||||||||||||
| ����Total Funds in the Commitment Period |
� | � | � | ��� | 2,622.2 | �� | � | � | 3,271.8 | �� | � | 1.2x | � | 24% | � | 20% | ||||
| � | � | � | � |
� | ||||||||||||||||
| TOTAL INVESTMENT SOLUTIONS |
� | � | � | ��� | 41,992.4 | �� | � | � | 62,310.6 | �� | � | 1.5x | � | 13% | � | 12% | ||||
| � | � | � | � |
� | ||||||||||||||||
| TOTAL INVESTMENT SOLUTIONS (USD) (22) |
� | � | � | ��$ | 50,813.6 | �� | � | $ | 75,400.0 | �� | � | 1.5x | � | � | ||||||
| � | � | � | � |
� |
� | � | ||||||||||||||
�
Page��|��25
(1) The data presented herein that provides �inception to date� performance results of our segments relates to the period following the formation of the first fund within each segment. For our Corporate Private Equity segment our first fund was formed in 1990. For our Real Assets segment our first fund was formed in 1997.
(2) Represents the original cost of all capital called for investments since inception of the fund.
(3) Represents all realized proceeds combined with remaining fair value, before management fees, expenses and carried interest.
(4)�Multiple of invested capital (�MOIC�) represents total fair value, before management fees, expenses and carried interest, divided by cumulative invested capital.
(5) An investment is considered realized when the investment fund has completely exited, and ceases to own an interest in, the investment. An investment is considered partially realized when the total amount of proceeds received in respect of such investment, including dividends, interest or other distributions and/or return of capital, represents at least 85% of invested capital and such investment is not yet fully realized. Because part of our value creation strategy involves pursuing best exit alternatives, we believe information regarding Realized/Partially Realized MOIC and Gross IRR, when considered together with the other investment performance metrics presented, provides investors with meaningful information regarding our investment performance by removing the impact of investments where significant realization activity has not yet occurred. Realized/Partially Realized MOIC and Gross IRR have limitations as measures of investment performance, and should not be considered in isolation. Such limitations include the fact that these measures do not include the performance of earlier stage and other investments that do not satisfy the criteria provided above. The exclusion of such investments will have a positive impact on Realized/Partially Realized MOIC and Gross IRR in instances when the MOIC and Gross IRR in respect of such investments are less than the aggregate MOIC and Gross IRR. Our measurements of Realized/Partially Realized MOIC and Gross IRR may not be comparable to those of other companies that use similarly titled measures. We do not present Realized/Partially Realized performance information separately for funds that are still in the investment period because of the relatively insignificant level of realizations for funds of this type. However, to the extent such funds have had realizations, they are included in the Realized/Partially Realized performance information presented for Total Corporate Private Equity and Total Real Assets.
(6) Fully Invested funds are past the expiration date of the investment period as defined in the respective limited partnership agreement. In instances where a successor fund has had its first capital call, the predecessor fund is categorized as fully invested.
(7) Gross Internal Rate of Return (�Gross IRR�) represents the annualized IRR for the period indicated on Limited Partner invested capital based on contributions, distributions and unrealized value before management fees, expenses and carried interest.
(8) Net Internal Rate of Return (�Net IRR�) represents the annualized IRR for the period indicated on Limited Partner invested capital based on contributions, distributions and unrealized value after management fees, expenses and carried interest.
(9) Aggregate includes the following funds: CP I, CMG, CVP I, CVP II, CUSGF III, CEVP, CETP I, CAVP I, CAVP II, CAGP III, Mexico and MENA.
(10) Includes coinvestments and certain other stand-alone investments arranged by us.
(11) Aggregate includes the following funds: CJP III, CSABF, CSSAF, CBPF, CPF I, CCI and CETP III.
(12) Returns are not considered meaningful, as the investment period commenced in May 2012 for CP VI, November 2012 for CAP IV, April 2013 for CGFSP II, August 2013 for CEP IV, September 2013 for CIEP I, March 2014 for CRP VII, and June 2014 for NGP XI.
(13) For purposes of aggregation, funds that report in foreign currency have been converted to U.S. dollars at the reporting period spot rate.
(14)�Aggregate includes the following funds: CRP I, CRP II, CAREP I, CAREP II, CRCP I, CPOCP, Energy I and Renew I.
(15) Aggregate includes the following funds: CPP II and NGP GAP.
(16) The data presented herein that provides �inception to date� performance results for CSP II and CEMOF I related to the period following the formation of the funds in June 2007 and December 2010, respectively.
(17) Represents the original cost of investments net of investment level recallable proceeds which is adjusted to reflect recyclability of invested capital for the purpose of calculating the fund MOIC.
(18) Fully Committed funds are past the expiration date of the commitment period as defined in the respective limited partnership agreement. In instances where a successor fund has had its first capital call, the predecessor fund is categorized as fully committed.
(19)�Includes private equity and mezzanine primary fund investments, secondary fund investments and co-investments originated by the AlpInvest team. Excluded from the performance information shown are a) investments that were not originated by AlpInvest, b) Direct Investments, which was spun off from AlpInvest in 2005 and c) Metropolitan Real Estate fund of funds vehicles. As of December�31, 2014, these excluded investments represent $0.6 billion of AUM at AlpInvest and $2.0 billion of AUM at Metropolitan.
(20) For purposes of aggregation, funds that report in foreign currency have been converted to Euro at the reporting period spot rate.
(21) Aggregate includes Main Fund I�Co-Investments, Main Fund I�Mezzanine Investments, AlpInvest CleanTech Funds and funds which are not included as part of a main fund.
(22) Represents the U.S. dollar equivalent balance translated at the spot rate as of period end.
(23) NGP X was previously categorized as an NGP management fee fund, but as of July 1, 2014, is categorized as a Natural Resources carry fund.
�
Page��|��26
Remaining Fair Value Analysis
�
| � | � | Remaining � Fair�Value(1) |
� | � | Unrealized � MOIC(2) |
� | Total � MOIC(3) |
� | % � Invested(4) |
� | In Accrued � Carry/ � (Clawback)(5) |
� | LTM � Realized � Carry(6) |
� | Catch � up�Rate |
� | Fee � Initiation � Date(7) |
� | � | Quarters � Since�Fee � Initiation |
� | Original � Investment � Period�End�Date | ||
| � | � |
� | ||||||||||||||||||||||
| � | � | As of December 31, 2014 | � | � | � | � | � | � | � | � | � | |||||||||||||
| � | � | (Reported in Local Currency, in Millions) | � | � | � | � | � | � | � | � | � | |||||||||||||
| Corporate Private Equity |
� | � | � | � | � | � | � | � | � | � | ||||||||||||||
| CP V |
� | ��$ | 12,655.4 | �� | � | 2.0x | � | 1.9x | � | 93% | � | � | � | � | � | 100% | � | � | Nov-07 | �� | � | 29 | � | May-13 |
| CEP III |
� | ��� | 4,652.2 | �� | � | 1.8x | � | 1.9x | � | 94% | � | � | � | � | � | 100% | � | � | Dec-07 | �� | � | 29 | � | Dec-12 |
| CP VI |
� | ��$ | 3,890.7 | �� | � | 1.0x | � | 1.0x | � | 29% | � | � | � | 100% | � | � | Oct-13 | �� | � | 5 | � | May-18 | ||
| CP IV |
� | ��$ | 2,465.1 | �� | � | 1.3x | � | 2.3x | � | 97% | � | � | � | � | � | 80% | � | � | Dec-05 | �� | � | 37 | � | Dec-10 |
| CAP III |
� | ��$ | 2,132.2 | �� | � | 1.4x | � | 1.5x | � | 98% | � | � | � | � | 100% | � | � | Dec-08 | �� | � | 25 | � | May-14 | |
| CGFSP I |
� | ��$ | 1,096.3 | �� | � | 1.4x | � | 1.7x | � | 96% | � | � | � | � | � | 100% | � | � | Oct-08 | �� | � | 25 | � | Sep-14 |
| CEOF I |
� | ��$ | 1,028.9 | �� | � | 1.3x | � | 1.5x | � | 69% | � | � | � | � | 80% | � | � | Dec-11 | �� | � | 13 | � | May-17 | |
| CAP II |
� | ��$ | 998.7 | �� | � | 1.0x | � | 1.7x | � | 90% | � | (�) | � | � | 80% | � | � | Oct-06 | �� | � | 33 | � | Feb-12 | |
| CAGP IV |
� | ��$ | 821.0 | �� | � | 1.3x | � | 1.4x | � | 78% | � | � | � | 100% | � | � | Dec-08 | �� | � | 25 | � | Jun-14 | ||
| CJP II |
� | ��� | ��96,331.2 | �� | � | 1.2x | � | 1.2x | � | 86% | � | � | � | 80% | � | � | Oct-06 | �� | � | 33 | � | Jul-12 | ||
| CEP II |
� | ��� | 589.3 | �� | � | 0.9x | � | 1.9x | � | 113% | � | � | � | � | 80% | � | � | Sep-03 | �� | � | 46 | � | Sep-08 | |
| CAP IV |
� | ��$ | 581.3 | �� | � | 1.0x | � | 1.0x | � | 15% | � | � | � | 100% | � | � | Dec-13 | �� | � | 5 | � | Nov-18 | ||
| CETP II |
� | ��� | 435.7 | �� | � | 1.5x | � | 2.1x | � | 83% | � | � | � | � | � | 100% | � | � | Jan-08 | �� | � | 28 | � | Jul-13 |
| CEP IV |
� | ��� | 188.2 | �� | � | 1.0x | � | 1.0x | � | 12% | � | � | � | 100% | � | � | Dec-14 | �� | � | 1 | � | Aug-19 | ||
| CGFSP II |
� | ��$ | 116.8 | �� | � | 1.4x | � | 1.3x | � | 9% | � | � | � | 100% | � | � | Dec-13 | �� | � | 5 | � | Dec-17 | ||
| All Other Funds (8) |
� | ��$ | 2,005.8 | �� | � | 1.0x | � | 2.2x | � | � | n/m | � | n/m | � | � | � | � | |||||||
| Coinvestment and Other (9) |
� | ��$ | 4,517.5 | �� | � | 1.7x | � | 2.5x | � | � | n/m | � | n/m | � | � | � | � | |||||||
| � | � |
� |
� | � | � | � | � | � | � | |||||||||||||||
| Total Corporate Private Equity (12) |
� | ��$ | 40,211.2 | �� | � | 1.5x | � | 2.0x | � | � | � | � | � | � | � | |||||||||
| � | � |
� |
� | � | � | � | � | � | � | |||||||||||||||
| Real Assets |
� | � | � | � | � | � | � | � | � | � | ||||||||||||||
| Energy IV |
� | ��$ | 3,378.6 | �� | � | 1.0x | � | 1.4x | � | 97% | � | � | � | � | � | 80% | � | � | Feb-08 | �� | � | 28 | � | Dec-13 |
| NGP X |
� | ��$ | 2,590.4 | �� | � | 1.2x | � | 1.2x | � | 69% | � | � | � | � | 80% | � | � | Oct-12 | �� | � | 9 | � | May-17 | |
| Renew II |
� | ��$ | 2,368.5 | �� | � | 1.3x | � | 1.4x | � | 82% | � | (�) | � | � | 80% | � | � | Nov-08 | �� | � | 25 | � | May-14 | |
| CRP VI |
� | ��$ | 1,766.2 | �� | � | 1.4x | � | 1.6x | � | 80% | � | � | � | � | � | 50% | � | � | Dec-11 | �� | � | 13 | � | Mar-16 |
| CEREP III |
� | ��� | 1,320.7 | �� | � | 0.9x | � | 1.0x | � | 89% | � | � | � | 67% | � | � | Oct-07 | �� | � | 29 | � | May-11 | ||
| Energy III |
� | ��$ | 1,425.8 | �� | � | 0.7x | � | 1.6x | � | 94% | � | (�) | � | � | 80% | � | � | Nov-05 | �� | � | 37 | � | Oct-11 | |
| CRP V |
� | ��$ | 1,067.5 | �� | � | 1.5x | � | 1.5x | � | 110% | � | � | � | 50% | � | � | Nov-06 | �� | � | 33 | � | Nov-11 | ||
| CIP |
� | ��$ | 965.5 | �� | � | 1.0x | � | 1.2x | � | 88% | � | � | � | 80% | � | � | Oct-06 | �� | � | 33 | � | Sep-12 | ||
| CRP IV |
� | ��$ | 902.1 | �� | � | 1.3x | � | 1.2x | � | 126% | � | � | � | 50% | � | � | Dec-05 | �� | � | 37 | � | Dec-09 | ||
| CIEP I |
� | ��$ | 308.6 | �� | � | 0.9x | � | 0.9x | � | 16% | � | � | � | 80% | � | � | Oct-13 | �� | � | 5 | � | Sep-19 | ||
| CRP III |
� | ��$ | 297.1 | �� | � | 48.2x | � | 2.8x | � | 93% | � | � | � | � | � | 50% | � | � | Dec-01 | �� | � | 53 | � | May-05 |
| CRP VII |
� | ��$ | 190.5 | �� | � | 1.0x | � | 1.0x | � | 7% | � | � | � | 80% | � | � | Oct-14 | �� | � | 1 | � | Mar-19 | ||
| Energy II |
� | ��$ | 139.9 | �� | � | 0.3x | � | 2.4x | � | 121% | � | (�) | � | � | 80% | � | � | Jan-03 | �� | � | 48 | � | Jul-08 | |
| All Other Funds (10) |
� | ��$ | 465.8 | �� | � | 0.8x | � | 0.9x | � | � | n/m | � | n/m | � | � | � | � | |||||||
| Coinvestment and Other (9) |
� | ��$ | 3,214.0 | �� | � | 1.0x | � | 1.6x | � | � | n/m | � | n/m | � | � | � | � | |||||||
| � | � |
� |
� | � | � | � | � | � | � | |||||||||||||||
| Total Real Assets (12) |
� | ��$ | 20,678.6 | �� | � | 1.0x | � | 1.4x | � | � | � | � | � | � | � | |||||||||
| � | � |
� |
� | � | � | � | � | � | � | |||||||||||||||
| Global Market Strategies |
� | � | � | � | � | � | � | � | � | � | ||||||||||||||
| CEMOF I |
� | ��$ | 1,004.4 | �� | � | 1.1x | � | 1.3x | � | 75% | � | � | � | � | 100% | � | � | Dec-10 | �� | � | 17 | � | Dec-15 | |
| CSP II |
� | ��$ | 404.4 | �� | � | 0.9x | � | 1.8x | � | 100% | � | � | � | � | � | 80% | � | � | Dec-07 | �� | � | 29 | � | Jun-11 |
| All Other Funds (11) |
� | ��$ | 675.4 | �� | � | 1.1x | � | 1.5x | � | � | n/m | � | n/m | � | � | � | � | |||||||
| Coinvestment and Other (9) |
� | ��$ | 375.4 | �� | � | 1.1x | � | 1.2x | � | � | n/m | � | n/m | � | � | � | � | |||||||
| � | � |
� |
� | � | � | � | � | � | � | |||||||||||||||
| Total Global Market Strategies |
� | ��$ | 2,459.5 | �� | � | 1.1x | � | 1.5x | � | � | � | � | � | � | � | |||||||||
| � | � |
� |
� | � | � | � | � | � | � | |||||||||||||||
(1) Net asset value of our carry funds. Reflects significant funds with remaining fair value of greater than $100 million.
(2) Unrealized multiple of invested capital (�MOIC�) represents remaining fair market value, before management fees, expenses and carried interest, divided by investment cost.
(3) Total MOIC represents total fair value, before management fees, expenses and carried interest, divided by cumulative invested capital. For certain funds, represents the original cost of investments net of investment-level recallable proceeds, which is adjusted to reflect recyclability of invested capital for the purpose of calculating the fund MOIC.
(4) Represents cumulative equity invested as of the reporting period divided by total commitments. Amount can be greater than 100% due to the re-investment of recallable distributions to fund investors.
(5) Fund has accrued carry/(clawback) as of the reporting period.
(6)�Fund has realized carry in the last twelve months.
(7) Represents the date of the first capital contribution for management fees.
(8) Aggregate includes the following funds: CMG, CP I, CP II, CP III, CEP I, CAP I, CBPF, CJP I, CJP III, CEVP, CETP I, CETP III, CCI, CAVP I, CAVP II, CAGP III, Mexico, MENA, CSABF, CSSAF, CPF, CVP I, CVP II, and CUSGF III. In Accrued Carry/(Clawback) and LTM Realized Carry not indicated because the indicator does not apply to each fund within the aggregate.
(9) Includes co-investments, prefund investments and certain other stand-alone investments arranged by us. In Accrued Carry/(Clawback) and LTM Realized Carry not indicated because the indicator does not apply to each fund within the aggregate.
(10) Aggregate includes the following funds: CRP I, CRP II, CRCP I, CEREP I, CEREP II, CAREP I, CAREP II, CPOCP I, CPP II, NGP XI, NGP GAP, Energy I and Renew I. In Accrued Carry/(Clawback) and LTM Realized Carry not indicated because the indicator does not apply to each fund within the aggregate.
(11) Aggregate includes the following funds: CSP I, CSP III, CMP I, and CMP II. In Accrued Carry/(Clawback) and LTM Realized Carry not indicated because the indicator does not apply to each fund within the aggregate.
(12) For purposes of aggregation, funds that report in foreign currency have been converted to U.S. dollars at the reporting period spot rate.
�
Page��|��27
Largest Publicly Traded Positions in Carry Funds
�
| ����Rank���� | �� | Largest Publicly Traded Equity Positions |
�� | Fund(s) |
�� | Q4�2014�Value� (1,2) | � | |
| 1 | �� | Axalta Coating Systems | �� | CP V, CEP III | �� | ��$ | 4,191,267,811�� | �� |
| 2 | �� | CommScope, Inc. | �� | CP V, CEP III | �� | � | 2,310,783,425�� | �� |
| 3 | �� | Booz Allen Hamilton, Inc. | �� | CP V, CMP II | �� | � | 1,391,760,756�� | �� |
| 4 | �� | Altice S.A. | �� | CEP III, CEP II | �� | � | 1,038,314,678�� | �� |
| 5 | �� | Pattern Energy Group Holdings, L.P. | �� | RENEW II | �� | � | 1,035,418,630�� | �� |
| 6 | �� | Freescale Semiconductor, Inc. | �� | CP IV, CEP II, CAP II, CJP I | �� | � | 787,462,332�� | �� |
| 7 | �� | Healthscope Limited | �� | CAP III, CP V | �� | � | 731,089,932�� | �� |
| 8 | �� | Foresight Energy LP | �� | ENERGY III | �� | � | 628,007,966�� | �� |
| 9 | �� | The Nielsen Company | �� | CP IV, CEP II | �� | � | 598,094,191�� | �� |
| 10 | �� | USA Compression | �� | ENERGY IV | �� | � | 360,145,758�� | �� |
| �� | Top 10 Positions | �� | �� | � | 13,072,345,478�� | �� | ||
| �� | Total Public Equity Portfolio (carry fund only) | �� | �� | � | ��������18,800,905,341�� | �� | ||
| �� | % of public portfolio in top 10 positions | �� | �� | � | 70%� | �� | ||
| � |
� | |||||||
(1) Includes gross fund only investment results including external coinvestment. May include portion of private business in value.
(2) In U.S. dollars, or converted to U.S. dollars at the prevailing exchange rate on the last day of the fiscal period.
Note: Includes all classes of shares irrespective of trading status.
�
Page��|��28
Reconciliation for Economic Net Income and Distributable Earnings (Unaudited)
�
| � | � | Three Months Ended | � | � | Year Ended | � | ||||||||||
| � | � | ������Dec�31,������ | � | � | ������Dec�31,������ | � | � | ������Dec�31,������ | � | � | ������Dec�31,������ | � | ||||
| � | � | � 2014 |
� | � | � 2013 |
� | � | � 2014 |
� | � | � 2013 |
� | ||||
| � | � | (Dollars in millions) | � | |||||||||||||
| Income (Loss) before provision for income taxes |
� | ��$ | (197.1)� | �� | � | ��$ | 714.3�� | �� | � | ��$ | 991.9�� | �� | � | ��$ | 1,444.0�� | �� |
| Adjustments: |
� | � | � | � | ||||||||||||
| Equity-based compensation issued in conjunction with the initial public offering, acquisitions and strategic investments |
� | � | 59.5�� | �� | � | � | 63.0�� | �� | � | � | 269.2�� | �� | � | � | 314.4�� | �� |
| Acquisition related charges and amortization of intangibles |
� | � | 75.9�� | �� | � | � | 50.9�� | �� | � | � | 242.5�� | �� | � | � | 260.4�� | �� |
| Other non-operating expenses (income) |
� | � | (16.3)� | �� | � | � | (18.4)� | �� | � | � | (30.3)� | �� | � | � | (16.5)� | �� |
| Tax expense associated with performance fee compensation |
� | � | (1.8)� | �� | � | � | (14.0)� | �� | � | � | (25.3)� | �� | � | � | (34.9)� | �� |
| Net income attributable to non-controlling interests in consolidated entities |
� | � | 261.9�� | �� | � | � | (234.6)� | �� | � | � | (485.5)� | �� | � | � | (676.0)� | �� |
| Other adjustments |
� | � | (1.6)� | �� | � | � | 0.7�� | �� | � | � | (0.1)� | �� | � | � | (6.2)� | �� |
| � | � |
� |
� | � | � |
� |
� | � | � |
� |
� | � | � |
� |
� | |
| Economic Net Income |
� | ��$ | 180.5�� | �� | � | ��$ | 561.9�� | �� | � | ��$ | 962.4�� | �� | � | ��$ | 1,285.2�� | �� |
| � | � |
� |
� | � | � |
� |
� | � | � |
� |
� | � | � |
� |
� | |
| Net performance fees |
� | � | 138.4�� | �� | � | � | 577.9�� | �� | � | � | 807.4�� | �� | � | � | 1,191.4�� | �� |
| Investment income (loss) |
� | � | (2.0)� | �� | � | � | (49.7)� | �� | � | � | (11.1)� | �� | � | � | (42.6)� | �� |
| Equity-based compensation |
� | � | 23.1�� | �� | � | � | 4.9�� | �� | � | � | 80.4�� | �� | � | � | 15.7�� | �� |
| � | � |
� |
� | � | � |
� |
� | � | � |
� |
� | � | � |
� |
� | |
| Fee Related Earnings |
� | ��$ | 67.2�� | �� | � | ��$ | 38.6�� | �� | � | ��$ | 246.5�� | �� | � | ��$ | 152.1�� | �� |
| � | � |
� |
� | � | � |
� |
� | � | � |
� |
� | � | � |
� |
� | |
| Realized performance fees, net of related compensation |
� | � | 263.6�� | �� | � | � | 355.2�� | �� | � | � | 732.8�� | �� | � | � | 674.5�� | �� |
| Realized investment income (loss) |
� | � | (20.2)� | �� | � | � | 6.0�� | �� | � | � | (6.1)� | �� | � | � | 10.6�� | �� |
| � | � |
� |
� | � | � |
� |
� | � | � |
� |
� | � | � |
� |
� | |
| Distributable Earnings |
� | ��$ | 310.6�� | �� | � | ��$ | 399.8�� | �� | � | ��$ | 973.2�� | �� | � | ��$ | 837.2�� | �� |
| � | � |
� |
� | � | � |
� |
� | � | � |
� |
� | � | � |
� |
� | |
| Depreciation and amortization expense |
� | � | 6.0�� | �� | � | � | 5.6�� | �� | � | � | 22.4�� | �� | � | � | 24.3�� | �� |
| Interest expense |
� | � | 14.5�� | �� | � | � | 11.7�� | �� | � | � | 55.7�� | �� | � | � | 43.6�� | �� |
| � | � |
� |
� | � | � |
� |
� | � | � |
� |
� | � | � |
� |
� | |
| Adjusted EBITDA |
� | ��$ | 331.1�� | �� | � | ��$ | 417.1�� | �� | � | ��$ | 1,051.3�� | �� | � | ��$ | 905.1�� | �� |
| � | � |
� |
� | � | � |
� |
� | � | � |
� |
� | � | � |
� |
� | |
�
�
�
�
�
�
Page��|��29
Reconciliation for Economic Net income and Distributable Earnings, cont.
(Unaudited)
�
| � | �� | ����Three�Months���� Ended |
� | �� | ������Year�Ended������ | � | ||
| � | �� | Dec 31, | � | �� | Dec 31, | � | ||
| � | �� | 2014 | � | �� | 2014 | � | ||
| � | �� | (Dollars�in�millions,�except�unit�and�per�unit�amounts) | � | |||||
| Economic Net Income |
�� | ��$ | ��������������������180.5�� | �� | �� | ��$ | ��������������������962.4�� | �� |
| Less (Add): Provision (Benefit) for Income Taxes |
�� | � | (1.7)� | �� | �� | � | 90.9�� | �� |
| �� | � |
� |
� | �� | � |
� |
� | |
| Economic Net Income, After Taxes |
�� | ��$ | 182.2�� | �� | �� | ��$ | 871.5�� | �� |
| �� | � |
� |
� | �� | � |
� |
� | |
| Economic Net Income, After Taxes per Adjusted Unit(1)(3) |
�� | ��$ | 0.56�� | �� | �� | ��$ | 2.68�� | �� |
| �� | � |
� |
� | �� | � |
� |
� | |
| Distributable Earnings |
�� | ��$ | 310.6�� | �� | �� | ��$ | 973.2�� | �� |
| Less: Estimated foreign, state, and local taxes |
�� | � | 13.0�� | �� | �� | � | 63.9�� | �� |
| �� | � |
� |
� | �� | � |
� |
� | |
| Distributable Earnings, After Taxes |
�� | ��$ | 297.6�� | �� | �� | ��$ | 909.3�� | �� |
| �� | � |
� |
� | �� | � |
� |
� | |
| Distributable Earnings to The Carlyle Group L.P. |
�� | ��$ | 64.1�� | �� | �� | ��$ | 195.9�� | �� |
| Less: Estimated current corporate income taxes and TRA payments |
�� | � | 1.3�� | �� | �� | � | 4.0�� | �� |
| �� | � |
� |
� | �� | � |
� |
� | |
| Distributable Earnings to The Carlyle Group L.P. net of corporate income taxes |
�� | ��$ | 62.8�� | �� | �� | ��$ | 191.9�� | �� |
| �� | � |
� |
� | �� | � |
� |
� | |
| Distributable Earnings, net, per The Carlyle Group L.P. common unit outstanding(2)(3) |
�� | ��$ | 0.91�� | �� | �� | ��$ | 2.78�� | �� |
| �� | � |
� |
� | �� | � |
� |
� | |
�
| (1) | Adjusted Units were determined as follows: |
�
| The Carlyle Group L.P. common units outstanding |
�� | � | 67,761,012�� | �� | �� | �� | � | 67,761,012�� | �� | |
| Carlyle Holdings partnership units not held by The Carlyle Group L.P. |
�� | � | ����������������������251,195,295�� | �� | �� | �� | � | ������������������251,195,295�� | �� | |
| Dilutive effect of unvested deferred restricted common units |
�� | � | 4,447,811�� | �� | �� | �� | � | 5,258,516�� | �� | |
| Contingently issuable Carlyle Holdings partnership units and common units |
�� | � | 138,926�� | �� | �� | �� | � | 414,007�� | �� | |
| �� | � |
� |
� | �� | �� | � |
� |
� | ||
| Total Adjusted Units |
�� | � | 323,543,044�� | �� | �� | �� | � | 324,628,830�� | �� | |
| �� | � |
� |
� | �� | �� | � |
� |
� |
�
| (2) | As of December�31, 2014, there were 67,761,012 outstanding common units of The Carlyle Group L.P. In February 2015, an additional estimated 1,148,616 common units will be issued in connection with the vesting of deferred restricted common units, an exchange of Carlyle Holdings partnership units and an acquisition earnout. For purposes of this calculation, those common units have been added to the common units outstanding as of December�31, 2014, resulting in total common units of 68,909,628. |
| (3) | In Q4 2014, we reclassified certain tax expenses associated with carried interest attributable to former partners and employees as a component of performance fee related compensation expense. Prior periods have been reclassified to conform with our new presentation. Previously reported after-tax ENI per Adjusted Unit and after-tax DE per common unit are unaffected by this change. See Appendix I and II for our reclassified quarterly results. |
�
Page��|��30
The Carlyle Group L.P.
GAAP Balance Sheet (Unaudited)
�
| � | �� | As of December�31, 2014 | � | |||||||||||||
| � | �� | Consolidated Operating Entities |
� | �� | Consolidated Funds |
� | �� | Eliminations | � | �� | Consolidated | � | ||||
| � | �� | (Dollars in millions) | � | |||||||||||||
| Assets |
�� | �� | �� | �� | ||||||||||||
| Cash and cash equivalents |
�� | ��$ | ��������1,242.0�� | �� | �� | ��$ | ��������-������ | �� | �� | ��$ | -������ | �� | �� | ��$ | 1,242.0�� | �� |
| Cash and cash equivalents held at Consolidated Funds |
�� | � | -������ | �� | �� | � | 1,551.1�� | �� | �� | � | -������ | �� | �� | � | 1,551.1�� | �� |
| Restricted cash |
�� | � | 59.7�� | �� | �� | � | -������ | �� | �� | � | -������ | �� | �� | � | 59.7�� | �� |
| Restricted cash and securities of Consolidated Funds |
�� | � | -������ | �� | �� | � | 14.9�� | �� | �� | � | -������ | �� | �� | � | 14.9�� | �� |
| Accrued performance fees |
�� | � | 3,808.9�� | �� | �� | � | -������ | �� | �� | � | (13.3)� | �� | �� | � | 3,795.6�� | �� |
| Investments |
�� | � | 1,114.9�� | �� | �� | � | -������ | �� | �� | � | (183.3)� | �� | �� | � | 931.6�� | �� |
| Investments of Consolidated Funds |
�� | � | -������ | �� | �� | � | 26,028.7�� | �� | �� | � | 0.1�� | �� | �� | � | 26,028.8�� | �� |
| Due from affiliates and other receivables, net |
�� | � | 215.8�� | �� | �� | � | -������ | �� | �� | � | (16.4)� | �� | �� | � | 199.4�� | �� |
| Due from affiliates and other receivables of Consolidated Funds, net |
�� | � | -������ | �� | �� | � | 1,213.2�� | �� | �� | � | -������ | �� | �� | � | 1,213.2�� | �� |
| Receivables and inventory of a consolidated real estate VIE |
�� | � | 163.9�� | �� | �� | � | -������ | �� | �� | � | -������ | �� | �� | � | 163.9�� | �� |
| Fixed assets, net |
�� | � | 75.4�� | �� | �� | � | -������ | �� | �� | � | -������ | �� | �� | � | 75.4�� | �� |
| Deposits and other |
�� | � | 57.3�� | �� | �� | � | 1.9�� | �� | �� | � | -������ | �� | �� | � | 59.2�� | �� |
| Other assets of a consolidated real estate VIE |
�� | � | 86.4�� | �� | �� | � | -������ | �� | �� | � | -������ | �� | �� | � | 86.4�� | �� |
| Intangible assets, net |
�� | � | 442.1�� | �� | �� | � | -������ | �� | �� | � | -������ | �� | �� | � | 442.1�� | �� |
| Deferred tax assets |
�� | � | 131.0�� | �� | �� | � | -������ | �� | �� | � | -������ | �� | �� | � | 131.0�� | �� |
| �� | � |
� |
� | �� | � |
� |
� | �� | � |
� |
� | �� | � |
� |
� | |
| Total assets |
�� | ��$ | 7,397.4�� | �� | �� | ��$ | 28,809.8�� | �� | �� | ��$ | (212.9)� | �� | �� | ��$ | 35,994.3�� | �� |
| �� | � |
� |
� | �� | � |
� |
� | �� | � |
� |
� | �� | � |
� |
� | |
| Liabilities and partners� capital |
�� | �� | �� | �� | ||||||||||||
| Loans payable |
�� | ��$ | 40.2�� | �� | �� | ��$ | -������ | �� | �� | ��$ | -������ | �� | �� | $ | 40.2�� | �� |
| 3.875% Senior Notes due 2023 |
�� | � | 499.9�� | �� | �� | � | -������ | �� | �� | � | -������ | �� | �� | � | 499.9�� | �� |
| 5.625% Senior Notes due 2043 |
�� | � | 606.8�� | �� | �� | � | -������ | �� | �� | � | -������ | �� | �� | � | 606.8�� | �� |
| Loans payable of Consolidated Funds |
�� | � | -������ | �� | �� | � | 16,219.8�� | �� | �� | � | (167.6)� | �� | �� | � | 16,052.2�� | �� |
| Loans payable of a consolidated real estate VIE at fair value (principal amount of $243.6) |
�� | � | 146.2�� | �� | �� | � | -������ | �� | �� | � | -������ | �� | �� | � | 146.2�� | �� |
| Accounts payable, accrued expenses and other liabilities |
�� | � | 446.8�� | �� | �� | � | -������ | �� | �� | � | (50.6)� | �� | �� | � | 396.2�� | �� |
| Accrued compensation and benefits |
�� | � | 2,312.5�� | �� | �� | � | -������ | �� | �� | � | -������ | �� | �� | � | 2,312.5�� | �� |
| Due to affiliates |
�� | � | 183.6�� | �� | �� | � | 1.0�� | �� | �� | � | (0.4)� | �� | �� | � | 184.2�� | �� |
| Deferred revenue |
�� | � | 93.9�� | �� | �� | � | -������ | �� | �� | � | (0.2)� | �� | �� | � | 93.7�� | �� |
| Deferred tax liabilities |
�� | � | 112.2�� | �� | �� | � | -������ | �� | �� | � | -������ | �� | �� | � | 112.2�� | �� |
| Other liabilities of Consolidated Funds |
�� | � | -������ | �� | �� | � | 2,548.0�� | �� | �� | � | (43.1)� | �� | �� | � | 2,504.9�� | �� |
| Other liabilities of a consolidated real estate VIE |
�� | � | 84.9�� | �� | �� | � | -������ | �� | �� | � | -������ | �� | �� | � | 84.9�� | �� |
| Accrued giveback obligations |
�� | � | 113.4�� | �� | �� | � | -������ | �� | �� | � | (9.0)� | �� | �� | � | 104.4�� | �� |
| �� | � |
� |
� | �� | � |
� |
� | �� | � |
� |
� | �� | � |
� |
� | |
| Total liabilities |
�� | � | 4,640.4�� | �� | �� | � | 18,768.8�� | �� | �� | � | (270.9)� | �� | �� | � | 23,138.3�� | �� |
| Redeemable non-controlling interests in consolidated entities |
�� | � | 8.4�� | �� | �� | � | 3,753.1�� | �� | �� | � | -������ | �� | �� | � | 3,761.5�� | �� |
| Total partners� capital |
�� | � | 2,748.6�� | �� | �� | � | 6,287.9�� | �� | �� | � | 58.0�� | �� | �� | � | 9,094.5�� | �� |
| �� | � |
� |
� | �� | � |
� |
� | �� | � |
� |
� | �� | � |
� |
� | |
| Total liabilities and partners� capital |
�� | ��$ | 7,397.4�� | �� | �� | ��$ | 28,809.8�� | �� | �� | ��$ | (212.9)� | �� | �� | ��$ | 35,994.3�� | �� |
| �� | � |
� |
� | �� | � |
� |
� | �� | � |
� |
� | �� | � |
� |
� | |
�
Page��|��31
Appendix I: Revised Quarterly Results for Investment Solutions (Unaudited)
�
| � | � | Mar�31, 2013 |
� | � | Jun�30, 2013 |
� | � | Sept�30, 2013�(1) |
� | � | Dec�31, 2013�(2) |
� | � | Mar�31, 2014�(3) |
� | � | Jun�30, 2014 |
� | � | Sept�30, 2014 |
� | � | Dec�31, 2014 |
� | ||||||||
| Investment Solutions | � | (Dollars in millions) | � | |||||||||||||||||||||||||||||
| Revenues |
� | � | � | � | � | � | � | � | ||||||||||||||||||||||||
| Segment fee revenues |
� | � | � | � | � | � | � | � | ||||||||||||||||||||||||
| Fund management fees |
� | ��$ | ��������18.5�� | �� | � | ��$ | ��������20.9�� | �� | � | ��$ | ��������37.2�� | �� | � | ��$ | ��������42.4�� | �� | � | ��$ | ��������44.5�� | �� | � | ��$ | ��������46.9�� | �� | � | ��$ | ��������46.0�� | �� | � | ��$ | ��������44.0�� | �� |
| Portfolio advisory fees, net |
� | � | -������ | �� | � | � | -������ | �� | � | � | -������ | �� | � | � | -������ | �� | � | � | -������ | �� | � | � | -������ | �� | � | � | -������ | �� | � | � | -������ | �� |
| Transaction fees, net |
� | � | -������ | �� | � | � | -������ | �� | � | � | -������ | �� | � | � | -������ | �� | � | � | -������ | �� | � | � | -������ | �� | � | � | -������ | �� | � | � | -������ | �� |
| � | � |
� |
� | � | � |
� |
� | � | � |
� |
� | � | � |
� |
� | � | � |
� |
� | � | � |
� |
� | � | � |
� |
� | � | � |
� |
� | |
| Total fee revenues |
� | � | 18.5�� | �� | � | � | 20.9�� | �� | � | � | 37.2�� | �� | � | � | 42.4�� | �� | � | � | 44.5�� | �� | � | � | 46.9�� | �� | � | � | 46.0�� | �� | � | � | 44.0�� | �� |
| Performance fees |
� | � | � | � | � | � | � | � | ||||||||||||||||||||||||
| Realized |
� | � | 1.5�� | �� | � | � | 2.7�� | �� | � | � | 5.7�� | �� | � | � | 11.8�� | �� | � | � | 5.9�� | �� | � | � | 7.0�� | �� | � | � | 10.6�� | �� | � | � | 19.4�� | �� |
| Unrealized |
� | � | 21.3�� | �� | � | � | 21.3�� | �� | � | � | 38.9�� | �� | � | � | 48.3�� | �� | � | � | 79.3�� | �� | � | � | 122.5�� | �� | � | � | (50.9)� | �� | � | � | (0.9)� | �� |
| � | � |
� |
� | � | � |
� |
� | � | � |
� |
� | � | � |
� |
� | � | � |
� |
� | � | � |
� |
� | � | � |
� |
� | � | � |
� |
� | |
| Total performance fees |
� | � | 22.8�� | �� | � | � | 24.0�� | �� | � | � | 44.6�� | �� | � | � | 60.1�� | �� | � | � | 85.2�� | �� | � | � | 129.5�� | �� | � | � | (40.3)� | �� | � | � | 18.5�� | �� |
| Investment income (loss) |
� | � | � | � | � | � | � | � | ||||||||||||||||||||||||
| Realized |
� | � | -������ | �� | � | � | -������ | �� | � | � | -������ | �� | � | � | -������ | �� | � | � | -������ | �� | � | � | -������ | �� | � | � | -������ | �� | � | � | -������ | �� |
| Unrealized |
� | � | (0.1)� | �� | � | � | 0.1�� | �� | � | � | 0.1�� | �� | � | � | 0.1�� | �� | � | � | 0.1�� | �� | � | � | 0.2�� | �� | � | � | -������ | �� | � | � | 0.1�� | �� |
| � | � |
� |
� | � | � |
� |
� | � | � |
� |
� | � | � |
� |
� | � | � |
� |
� | � | � |
� |
� | � | � |
� |
� | � | � |
� |
� | |
| Total investment income (loss) |
� | � | (0.1)� | �� | � | � | 0.1�� | �� | � | � | 0.1�� | �� | � | � | 0.1�� | �� | � | � | 0.1�� | �� | � | � | 0.2�� | �� | � | � | -������ | �� | � | � | 0.1�� | �� |
| Interest and other income |
� | � | -������ | �� | � | � | 0.2�� | �� | � | � | -������ | �� | � | � | -������ | �� | � | � | 0.3�� | �� | � | � | 0.2�� | �� | � | � | 0.5�� | �� | � | � | 0.3�� | �� |
| � | � |
� |
� | � | � |
� |
� | � | � |
� |
� | � | � |
� |
� | � | � |
� |
� | � | � |
� |
� | � | � |
� |
� | � | � |
� |
� | |
| Total revenues |
� | � | 41.2�� | �� | � | � | 45.2�� | �� | � | � | 81.9�� | �� | � | � | 102.6�� | �� | � | � | 130.1�� | �� | � | � | 176.8�� | �� | � | � | 6.2�� | �� | � | � | 62.9�� | �� |
| Expenses |
� | � | � | � | � | � | � | � | ||||||||||||||||||||||||
| Compensation and benefits |
� | � | � | � | � | � | � | � | ||||||||||||||||||||||||
| Direct base compensation |
� | � | 9.4�� | �� | � | � | 7.9�� | �� | � | � | 16.8�� | �� | � | � | 19.5�� | �� | � | � | 21.0�� | �� | � | � | 20.7�� | �� | � | � | 20.7�� | �� | � | � | 23.4�� | �� |
| Indirect base compensation |
� | � | 1.3�� | �� | � | � | 1.3�� | �� | � | � | 1.1�� | �� | � | � | 1.9�� | �� | � | � | 3.8�� | �� | � | � | 4.0�� | �� | � | � | 4.3�� | �� | � | � | 1.5�� | �� |
| Equity-based compensation |
� | � | 0.1�� | �� | � | � | 0.1�� | �� | � | � | 0.1�� | �� | � | � | 0.4�� | �� | � | � | 0.7�� | �� | � | � | 1.1�� | �� | � | � | 1.5�� | �� | � | � | 1.5�� | �� |
| Performance fee related |
� | � | � | � | � | � | � | � | ||||||||||||||||||||||||
| Realized |
� | � | 1.2�� | �� | � | � | 1.8�� | �� | � | � | 3.3�� | �� | � | � | 8.0�� | �� | � | � | 4.0�� | �� | � | � | 4.1�� | �� | � | � | 8.8�� | �� | � | � | 14.0�� | �� |
| Unrealized |
� | � | 21.1�� | �� | � | � | 20.7�� | �� | � | � | 39.7�� | �� | � | � | 49.7�� | �� | � | � | 75.7�� | �� | � | � | 119.6�� | �� | � | � | (52.8)� | �� | � | � | 2.5�� | �� |
| � | � |
� |
� | � | � |
� |
� | � | � |
� |
� | � | � |
� |
� | � | � |
� |
� | � | � |
� |
� | � | � |
� |
� | � | � |
� |
� | |
| Total compensation and benefits |
� | � | 33.1�� | �� | � | � | 31.8�� | �� | � | � | 61.0�� | �� | � | � | 79.5�� | �� | � | � | 105.2�� | �� | � | � | 149.5�� | �� | � | � | (17.5)� | �� | � | � | 42.9�� | �� |
| General, administrative, and other indirect expenses |
� | � | 3.4�� | �� | � | � | 4.4�� | �� | � | � | 5.7�� | �� | � | � | 9.7�� | �� | � | � | 9.2�� | �� | � | � | 10.6�� | �� | � | � | 11.5�� | �� | � | � | 10.6�� | �� |
| Depreciation and amortization expense |
� | � | 0.5�� | �� | � | � | 0.5�� | �� | � | � | 0.7�� | �� | � | � | 0.6�� | �� | � | � | 0.9�� | �� | � | � | 1.0�� | �� | � | � | 0.9�� | �� | � | � | 1.0�� | �� |
| Interest expense |
� | � | 0.5�� | �� | � | � | 0.6�� | �� | � | � | 0.6�� | �� | � | � | 0.6�� | �� | � | � | 1.2�� | �� | � | � | 1.4�� | �� | � | � | 1.5�� | �� | � | � | 1.4�� | �� |
| � | � |
� |
� | � | � |
� |
� | � | � |
� |
� | � | � |
� |
� | � | � |
� |
� | � | � |
� |
� | � | � |
� |
� | � | � |
� |
� | |
| Total expenses |
� | � | 37.5�� | �� | � | � | 37.3�� | �� | � | � | 68.0�� | �� | � | � | 90.4�� | �� | � | � | 116.5�� | �� | � | � | 162.5�� | �� | � | � | (3.6)� | �� | � | � | 55.9�� | �� |
| � | � |
� |
� | � | � |
� |
� | � | � |
� |
� | � | � |
� |
� | � | � |
� |
� | � | � |
� |
� | � | � |
� |
� | � | � |
� |
� | |
| Economic Net Income (4) |
� | ��$ | 3.7�� | �� | � | ��$ | 7.9�� | �� | � | ��$ | 13.9�� | �� | � | ��$ | 12.2�� | �� | � | ��$ | 13.6�� | �� | � | ��$ | 14.3�� | �� | � | ��$ | 9.8�� | �� | � | ��$ | 7.0�� | �� |
| � | � |
� |
� | � | � |
� |
� | � | � |
� |
� | � | � |
� |
� | � | � |
� |
� | � | � |
� |
� | � | � |
� |
� | � | � |
� |
� | |
| (-) Net Performance Fees (4) |
� | � | 0.5�� | �� | � | � | 1.5�� | �� | � | � | 1.6�� | �� | � | � | 2.4�� | �� | � | � | 5.5�� | �� | � | � | 5.8�� | �� | � | � | 3.7�� | �� | � | � | 2.0�� | �� |
| (-) Investment Income (Loss) |
� | � | (0.1)� | �� | � | � | 0.1�� | �� | � | � | 0.1�� | �� | � | � | 0.1�� | �� | � | � | 0.1�� | �� | � | � | 0.2�� | �� | � | � | -������ | �� | � | � | 0.1�� | �� |
| (+) Equity-based compensation |
� | � | 0.1�� | �� | � | � | 0.1�� | �� | � | � | 0.1�� | �� | � | � | 0.4�� | �� | � | � | 0.7�� | �� | � | � | 1.1�� | �� | � | � | 1.5�� | �� | � | � | 1.5�� | �� |
| � | � |
� |
� | � | � |
� |
� | � | � |
� |
� | � | � |
� |
� | � | � |
� |
� | � | � |
� |
� | � | � |
� |
� | � | � |
� |
� | |
| (=) Fee Related Earnings |
� | ��$ | 3.4�� | �� | � | ��$ | 6.4�� | �� | � | ��$ | 12.3�� | �� | � | ��$ | 10.1�� | �� | � | ��$ | 8.7�� | �� | � | ��$ | 9.4�� | �� | � | ��$ | 7.6�� | �� | � | ��$ | 6.4�� | �� |
| (+)�Realized�Net�Performance�Fees�(4) |
� | � | 0.3�� | �� | � | � | 0.9�� | �� | � | � | 2.4�� | �� | � | � | 3.8�� | �� | � | � | 1.9�� | �� | � | � | 2.9�� | �� | � | � | 1.8�� | �� | � | � | 5.4�� | �� |
| (+) Realized Investment Income |
� | � | -������ | �� | � | � | -������ | �� | � | � | -������ | �� | � | � | -������ | �� | � | � | -������ | �� | � | � | -������ | �� | � | � | -������ | �� | � | � | -������ | �� |
| � | � |
� |
� | � | � |
� |
� | � | � |
� |
� | � | � |
� |
� | � | � |
� |
� | � | � |
� |
� | � | � |
� |
� | � | � |
� |
� | |
| (=) Distributable Earnings (4) |
� | ��$ | 3.7�� | �� | � | ��$ | 7.3�� | �� | � | ��$ | 14.7�� | �� | � | ��$ | 13.9�� | �� | � | ��$ | 10.6�� | �� | � | ��$ | 12.3�� | �� | � | ��$ | 9.4�� | �� | � | ��$ | 11.8�� | �� |
| � | � |
� |
� | � | � |
� |
� | � | � |
� |
� | � | � |
� |
� | � | � |
� |
� | � | � |
� |
� | � | � |
� |
� | � | � |
� |
� | |
(1) - During Q3 2013, Carlyle acquired the remaining 40% ownership interest in AlpInvest. As such, amounts since the acquisition represent 100% of the financial results of AlpInvest. Prior to Q3 2013, amounts represent Carlyle�s 60% economic interest in Alpinvest.
(2) - During Q4 2013, Carlyle acquired Metropolitan Real Estate Equity Management, LLC (MRE). As such, amounts since the acquisition include the financial results of MRE.
(3) - During Q1 2014, Carlyle acquired Diversified Global Asset Management Corporation (DGAM). As such, amounts since the acquisition include the financial results of DGAM.
(4) - In Q4 2014, we reclassified certain tax expenses associated with carried interest attributable to former partners and employees as a component of performance fee related compensation expense. Prior periods have been reclassified to conform with our new presentation.
�
Page��|��32
Appendix II: Revised Reconciliation for Economic Net income and Distributable Earnings (Unaudited)
($ in millions, except per unit amounts)
�
| Economic Net income | �� | Q1�2013� | � | �� | Q2�2013� | � | �� | Q3�2013� | � | �� | Q4�2013� | � | �� | Q1�2014� | � | �� | Q2�2014� | � | �� | Q3�2014� | � | �� | Q4�2014� | � | ||||||||
| � |
� | |||||||||||||||||||||||||||||||
| Economic Net Income (pre-tax) |
�� | ��$ | ��388.7�� | �� | �� | ��$ | ��150.8�� | �� | �� | ��$ | ��183.8�� | �� | �� | ��$ | ��561.9�� | �� | �� | ��$ | ��311.7�� | �� | �� | ��$ | ��289.4�� | �� | �� | ��$ | ��180.8�� | �� | �� | ��$ | ��180.5�� | �� |
| Less (Plus): Provision (Benefit) for income taxes(1) |
�� | � | 69.1�� | �� | �� | � | 27.6�� | �� | �� | � | 23.6�� | �� | �� | � | 41.9�� | �� | �� | � | 36.2�� | �� | �� | � | 52.8�� | �� | �� | � | 3.6�� | �� | �� | � | (1.7)� | �� |
| �� | � |
� |
� | |||||||||||||||||||||||||||||
| Economic Net Income, After Taxes |
�� | ��$ | 319.6�� | �� | �� | ��$ | 123.2�� | �� | �� | ��$ | 160.2�� | �� | �� | ��$ | 520.0�� | �� | �� | ��$ | 275.5�� | �� | �� | ��$ | 236.6�� | �� | �� | ��$ | 177.2�� | �� | �� | ��$ | 182.2�� | �� |
| �� | � |
� |
� | |||||||||||||||||||||||||||||
| Adjusted Units (in millions) |
�� | � | 313.9�� | �� | �� | � | 316.8�� | �� | �� | � | 315.0�� | �� | �� | � | 317.3�� | �� | �� | � | 323.8�� | �� | �� | � | 323.3�� | �� | �� | � | 323.8�� | �� | �� | � | 323.5�� | �� |
| Economic Net Income, After Taxes per Adjusted Unit |
�� | ��$ | 1.02�� | �� | �� | ��$ | 0.39�� | �� | �� | ��$ | 0.51�� | �� | �� | ��$ | 1.64�� | �� | �� | ��$ | 0.85�� | �� | �� | ��$ | 0.73�� | �� | �� | ��$ | 0.55�� | �� | �� | ��$ | 0.56�� | �� |
| Distributable Earnings |
�� | �� | �� | �� | �� | �� | �� | �� | ||||||||||||||||||||||||
| � |
� | |||||||||||||||||||||||||||||||
| Distributable Earnings |
�� | ��$ | 170.8�� | �� | �� | ��$ | 162.6�� | �� | �� | ��$ | 104.0�� | �� | �� | ��$ | 399.8�� | �� | �� | ��$ | 182.6�� | �� | �� | ��$ | 323.0�� | �� | �� | ��$ | 157.0�� | �� | �� | ��$ | 310.6�� | �� |
| Less: Estimated foreign, state, and local taxes(2) |
�� | � | 13.4�� | �� | �� | � | 6.3�� | �� | �� | � | 14.2�� | �� | �� | � | 20.7�� | �� | �� | � | 13.3�� | �� | �� | � | 23.5�� | �� | �� | � | 14.1�� | �� | �� | � | 13.0�� | �� |
| �� | � |
� |
� | |||||||||||||||||||||||||||||
| Distributable Earnings, After Taxes |
�� | ��$ | 157.4�� | �� | �� | ��$ | 156.3�� | �� | �� | ��$ | 89.8�� | �� | �� | ��$ | 379.1�� | �� | �� | ��$ | 169.3�� | �� | �� | ��$ | 299.5�� | �� | �� | ��$ | 142.9�� | �� | �� | ��$ | 297.6�� | �� |
| �� | � |
� |
� | |||||||||||||||||||||||||||||
| Allocating Distributable Earnings for only public unitholders of The Carlyle Group L.P. |
�� | �� | �� | �� | �� | �� | �� | �� | ||||||||||||||||||||||||
| Distributable Earnings to The Carlyle Group L.P. |
�� | ��$ | 23.5�� | �� | �� | ��$ | 24.6�� | �� | �� | ��$ | 14.2�� | �� | �� | ��$ | 61.0�� | �� | �� | ��$ | 35.6�� | �� | �� | ��$ | 63.4�� | �� | �� | ��$ | 30.4�� | �� | �� | ��$ | 64.1�� | �� |
| Less (Plus): Estimated current corporate income taxes (benefit)(3) |
�� | � | 1.9�� | �� | �� | � | (1.2)� | �� | �� | � | (1.8)� | �� | �� | � | 1.8�� | �� | �� | � | 0.8�� | �� | �� | � | 1.0�� | �� | �� | � | 0.9�� | �� | �� | � | 1.3�� | �� |
| �� | � |
� |
� | |||||||||||||||||||||||||||||
| Distributable Earnings to The Carlyle Group L.P. net of corporate income taxes |
�� | ��$ | 21.6�� | �� | �� | ��$ | 25.8�� | �� | �� | ��$ | 16.0�� | �� | �� | ��$ | 59.2�� | �� | �� | ��$ | 34.8�� | �� | �� | ��$ | 62.4�� | �� | �� | ��$ | 29.5�� | �� | �� | ��$ | 62.8�� | �� |
| �� | � |
� |
� | |||||||||||||||||||||||||||||
| Units in public float (in millions) |
�� | � | 46.1�� | �� | �� | � | 49.0�� | �� | �� | � | 49.3�� | �� | �� | � | 50.3�� | �� | �� | � | 66.9�� | �� | �� | � | 67.4�� | �� | �� | � | 67.8�� | �� | �� | � | 68.9�� | �� |
| Distributable Earnings, net, per The Carlyle Group L.P. common unit outstanding |
�� | ��$ | 0.47�� | �� | �� | ��$ | 0.53�� | �� | �� | ��$ | 0.32�� | �� | �� | ��$ | 1.18�� | �� | �� | ��$ | 0.52�� | �� | �� | ��$ | 0.93�� | �� | �� | ��$ | 0.44�� | �� | �� | ��$ | 0.91�� | �� |
| � |
� | |||||||||||||||||||||||||||||||
(1) Represents the implied benefit for income taxes that was calculated using a similar methodology applied in calculating the tax provision for The Carlyle Group L.P., without any reduction for noncontrolling interests.
(2) Represents the implied provision for current income taxes that was calculated using a similar methodology applied in calculating the current tax provision for The Carlyle Group L.P., without any reduction for noncontrolling interests.
(3) Represents current corporate income taxes payable upon distributable earnings allocated to Carlyle Holdings I GP Inc. and estimated current Tax Receivable Agreement payments owed.
�
Page��|��33
The Carlyle Group L.P.
Non-GAAP Financial Information and Other Key Terms
Non-GAAP Financial Information
Carlyle discloses in this press release the following financial measures that are calculated and presented on the basis of methodologies other than in accordance with generally accepted accounting principles in the United States of America:
�
| � | � | � | Economic net income or �ENI,� represents segment net income which includes certain tax expense associated with performance fee compensation and excludes the impact of all other income taxes, acquisition-related items including amortization of acquired intangibles and contingent consideration taking the form of earn-outs, charges associated with equity-based compensation issued in Carlyle�s initial public offering or in acquisitions or strategic investments, corporate actions and infrequently occurring or unusual events. In Q4 2014, Carlyle reclassified certain tax expenses associated with carried interest attributable to former partners and employees as a component of performance fee related compensation expense; all prior periods have been reclassified to conform with the current presentation. Carlyle believes the inclusion or exclusion of these items provides investors with a meaningful indication of its core operating performance. For segment reporting purposes, revenues and expenses, and accordingly segment net income, are presented on a basis that deconsolidates certain Carlyle funds, related co-investment entities and CLOs (referred to collectively as the �Consolidated Funds�) that Carlyle consolidates in its consolidated financial statements pursuant to U.S. GAAP. Total Segment ENI equals the aggregate of ENI for all segments. ENI and its components are evaluated regularly by management in making resource deployment decisions and in assessing performance of Carlyle�s four segments and for compensation. Carlyle believes that reporting ENI is helpful to understanding its business and that investors should review the same supplemental financial measure that management uses to analyze its segment performance. |
�
| � | � | � | Fee-Related Earnings is a component of ENI and is used to measure Carlyle�s operating profitability excluding equity-based compensation, performance fees, investment income from investments in Carlyle�s funds and performance fee related compensation. Accordingly, Fee-Related Earnings reflect the ability of the business to cover direct base compensation and operating expenses from fee revenues other than performance fees. Fee-Related Earnings are reported as part of Carlyle�s segment results. Carlyle uses Fee-Related Earnings from operations to measure its profitability from fund management fees. |
�
| � | � | � | Distributable Earnings is a component of ENI representing total ENI less net performance fees and investment income plus realized net performance fees and realized investment income and excluding equity-based compensation. Distributable Earnings is intended to show the amount of net realized earnings without the effects of consolidation of the Consolidated Funds. Distributable Earnings is derived from Carlyle�s segment reported results and is an additional measure to assess performance and amounts potentially available for distribution from Carlyle Holdings to its unitholders. In Q4 2014, as a result of Carlyle reclassifying certain |
�
Page��|��34
| � | tax expenses associated with carried interest attributable to former partners and employees as a component of realized performance fee related compensation expense, the amounts for Distributable Earnings are different than previously reported; all prior periods have been reclassified to conform with the current presentation. |
�
| � | � | � | Adjusted EBITDA is a component of ENI and is used to measure Carlyle�s ability to cover recurring operating expenses from cash earnings. Adjusted EBITDA is computed as ENI excluding unrealized performance fees, unrealized performance fee compensation, unrealized investment income, depreciation and amortization expense, interest expense and equity-based compensation. In Q4 2014, as a result of Carlyle reclassifying certain tax expenses associated with carried interest attributable to former partners and employees as a component of realized and unrealized performance fee related compensation expense, the amounts for Adjusted EBITDA are different than previously reported; all prior periods have been recast to conform with the current presentation. |
Income before provision for income taxes is the GAAP financial measure most comparable to ENI, Fee-Related Earnings, Distributable Earnings, and Adjusted EBITDA. Reconciliations of these non-GAAP financial measures to income before provision for income taxes are included within this press release. These non-GAAP financial measures should be considered in addition to and not as a substitute for, or superior to, financial measures presented in accordance with U.S. GAAP.
Other Key Terms
�Assets under management� or �AUM� refers to the assets managed by Carlyle. AUM equals the sum of the following:
(a) the fair value of the capital invested in Carlyle carry funds, co-investment vehicles, NGP management fee funds and fund of funds vehicles plus the capital that Carlyle is entitled to call from investors in those funds and vehicles (including Carlyle commitments to those funds and vehicles and those of senior Carlyle professionals and employees) pursuant to the terms of their capital commitments to those funds and vehicles;
(b) the amount of aggregate collateral balance and principal cash at par or aggregate principal amount of the notes of our CLOs and other structured products (inclusive of all positions);
(c) the net asset value (pre-redemptions and subscriptions) of Carlyle�s long/short credit, emerging markets, multi-product macroeconomic, mutual fund, fund of hedge funds vehicles and other hedge funds; and
(d) the gross assets (including assets acquired with leverage) of our business development companies.
AUM includes certain energy and renewable resources funds that Carlyle jointly advises with Riverstone Holdings L.L.C. (�Riverstone�) and certain NGP management fee funds and carry funds
�
Page��|��35
advised by NGP Energy Capital Management. Carlyle�s calculation of AUM (but not Fee-Earning AUM) includes uncalled commitments to, and the fair value of invested capital in, investment funds from Carlyle and its personnel, regardless of whether such commitments or invested capital are subject to management or performance fees.
�Available capital,� commonly known as �dry powder,� for Carlyle�s carry funds and NGP management fee funds refers to the amount of capital commitments available to be called for investments. Amounts previously called may be added back to available capital following certain distributions.
�Carlyle funds,� �our funds� and �our investment funds� refer to the investment funds and vehicles advised by Carlyle.
�Carry funds� refers to (i)�those investment funds that Carlyle advises, including the buyout funds, growth capital funds, real estate funds, infrastructure funds, certain energy funds and distressed debt and mezzanine funds (but excluding Carlyle�s structured credit/other structured product funds, hedge funds, business development companies, mutual fund and fund of funds vehicles), where Carlyle receives a special residual allocation of income, which is referred to as a �carried interest,� in the event that specified investment returns are achieved by the fund and (ii)�those investment funds advised by NGP from which we are entitled to receive a carried interest.
�Catch-up management fees� refer to those amounts of management fees charged to fund investors in subsequent closings of a fund which apply to the time period between the fee initiation date and the subsequent closing date.
�Expired available capital� occurs when a fund has passed the investment and follow-on periods and can no longer invest capital into new or existing deals. Any remaining available capital, typically a result of either recycled distributions or specific reserves established for the follow-on period that are not drawn, can only be called for fees and expenses and is therefore removed from the total AUM calculation.
�Fee-Earning assets under management� or �Fee-Earning AUM� refers to the assets managed by Carlyle from which Carlyle derives recurring fund management fees. Fee-Earning AUM generally equals the sum of:
(a) for certain carry funds and co-investment vehicles where the investment period has not expired and Metropolitan fund of funds vehicles where the weighted-average investment period of the underlying funds has not expired, the amount of limited partner capital commitments, for AlpInvest fund of funds vehicles, the amount of external investor capital commitments during the commitment period, and for NGP management fee funds and carry funds advised by NGP, the amount of investor capital commitments before the first investment realization;
�
Page��|��36
(b) for substantially all carry funds and certain co-investment vehicles where the investment period has expired and Metropolitan fund of funds vehicles where the weighted-average investment period of the underlying funds has expired, the remaining amount of limited partner invested capital and for NGP management fee funds and carry funds advised by NGP where the first investment has been realized, the amount of partner commitments less realized and written-off investments;
(c) the amount of aggregate Fee-Earning collateral balance at par of our collateralized loan obligations (�CLOs�), as defined in the fund indentures (typically exclusive of equities and defaulted positions) as of the quarterly cut-off date for each CLO, and aggregate principal amount of the notes of our other structured products;
(d) the gross assets (including assets acquired with leverage) of our business development companies;
(e) the net asset value of our mutual fund or external investor portion of the net asset value (pre-redemptions and subscriptions) of our long/short credit, emerging markets, multi-product macroeconomic, fund of hedge funds vehicles, and other hedge funds; and
(f) for AlpInvest fund of funds vehicles where the commitment fee period has expired and certain carry funds where the investment period has expired, the lower of cost or fair value of invested capital.
Fee-Earning AUM includes certain energy and renewable resources carry funds that Carlyle jointly advises with Riverstone and certain NGP management fee funds and carry funds advised by NGP Energy Capital Management. Fee-Earning AUM includes only those assets which earn a material fee.
For Carlyle�s carry funds, co-investment vehicles, NGP management fee funds and fund of funds vehicles, total AUM includes the fair value of the capital invested, whereas Fee-Earning AUM includes the amount of capital commitments or the remaining amount of invested capital at cost, depending on whether the investment period for the fund has expired. As such, Fee-Earning AUM may be greater than total AUM when the aggregate fair value of the remaining investments is less than the cost of those investments.
�Fund of funds vehicles� refers to those funds, accounts and vehicles advised by AlpInvest Partners B.V., Metropolitan Real Estate Equity Management, LLC, and Diversified Global Asset Management Corporation.
�NGP management fee funds� refer to those funds advised by NGP Energy Capital Management (together with its affiliates and subsidiaries) from which we only receive management fees.
�
Page��|��37
�Net accrued performance fees� refers to the accrued performance fees that are attributable to Carlyle�s unitholders. This balance is comprised of accrued performance fees less: accrued giveback obligations, accrued performance fee compensation (inclusive of related tax obligations), and accrued performance fees attributable to non-controlling interests. This balance also excludes net accrued performance fees that have been realized but will be collected in subsequent periods.
�Net performance fees� refers to the performance fees from Carlyle funds and fund of funds vehicles net of the portion allocated to Carlyle investment professionals (including related tax expense) which is reflected as performance fee related compensation expense.
�Performance fees� consist principally of carried interest from carry funds and certain fund of funds vehicles and incentive fees or allocations from certain of our Global Market Strategies funds. Carlyle is generally entitled to a 20% allocation (or 1.8% to 10% in the case of most of the fund of funds vehicles) of the net realized income or gain as a carried interest after returning the invested capital, the allocation of preferred returns of generally 8% to 9% and the return of certain fund costs (subject to catch-up provisions as set forth in the fund limited partnership agreement). Carried interest revenue, which is a component of performance fees in Carlyle�s consolidated financial statements, is recognized by Carlyle upon appreciation of the valuation of the applicable funds� investments above certain return hurdles as set forth in each respective partnership agreement and is based on the amount that would be due to Carlyle pursuant to the fund partnership agreement at each period end as if the funds were liquidated at such date.
�Realized net performance fees� refers to the realized performance fees from Carlyle funds and fund of funds vehicles net of the portion allocated to Carlyle investment professionals (including related tax expense) which is reflected as realized performance fee related compensation expense.
�VIE� refers to a variable interest entity, as that term is defined in Accounting Standards Codification Topic 810, Consolidation.
�
Page��|��38
Create E-mail Alert Related Categories
SEC FilingsRelated Entities
The Carlyle GroupSign up for StreetInsider Free!
Receive full access to all new and archived articles, unlimited portfolio tracking, e-mail alerts, custom newswires and RSS feeds - and more!
