

Form 6-K UBS AG For: Oct 28
 Tweet
Tweet Share
Share�
�
UNITED STATES
SECURITIES AND EXCHANGE COMMISSION
Washington, D.C. 20549
�
�
FORM 6-K
�
�
REPORT OF FOREIGN PRIVATE ISSUER
PURSUANT TO RULE 13a-16 OR 15d-16
UNDER THE SECURITIES EXCHANGE ACT OF 1934
Date: October�28, 2014
�
�
UBS AG
Commission File Number: 1-15060
UBS Group AG
(Registrants� Names)
�
�
Bahnhofstrasse 45, Zurich, Switzerland
(Address of principal executive office)
�
�
Indicate by check mark whether the registrant files or will file annual reports under cover of Form 20-F or Form 40-F.
Form 20-F��x������������Form 40-F���
This Form 6-K consists of the presentation materials related to the Third Quarter 2014 Results of UBS AG, which appear immediately following this page.
�
�
�
 October 28,
2014 Third
quarter 2014 results |
 Cautionary statement
regarding forward-looking statements 1
This presentation contains statements that constitute �forward-looking
statements,� including but not limited to management�s outlook for UBS�s financial performance and
statements relating to the anticipated effect of transactions and strategic initiatives on
UBS�s business and future development. While these forward-looking statements
represent UBS�s judgments and expectations concerning the matters described, a number of
risks, uncertainties and other important factors could cause actual developments and
results to differ materially from UBS�s expectations. These factors include, but are not limited to: (i) the degree to which UBS is successful in executing
its announced strategic plans, including its efficiency initiatives and its planned further
reduction in its Basel III risk-weighted assets (RWA) and leverage ratio denominator
(LRD); (ii) developments in the markets in which UBS operates or to which it is exposed,
including movements in securities prices or liquidity, credit spreads, currency exchange
rates and interest rates and the effect of economic conditions and market developments on the financial position or creditworthiness of UBS�s clients and
counterparties; (iii) changes in the availability of capital and funding, including any changes
in UBS�s credit spreads and ratings, or arising from requirements for bail-in debt
or loss-absorbing capital; (iv) changes in or the implementation of financial legislation
and regulation in Switzerland, the US, the UK and other financial centers that may
impose more stringent capital (including leverage ratio), liquidity and funding requirements,
incremental tax requirements, additional levies, limitations on permitted activities,
constraints on remuneration or other measures; (v) uncertainty as to when and to what degree the Swiss Financial Market Supervisory Authority (FINMA) will
approve reductions to the incremental RWA resulting from the supplemental operational risk
capital analysis mutually agreed to by UBS and FINMA, or will approve a limited reduction
of capital requirements due to measures to reduce resolvability risk; (vi) the degree to which UBS is successful in executing the announced creation of a new
Swiss banking subsidiary, a holding company for the UBS Group (including the pending offer to
exchange shares of UBS AG for shares of such holding company), a US intermediate holding
company, changes in the operating model of UBS Limited and other changes which UBS may make in its legal entity structure and operating model,
including the possible consequences of such changes, and the potential need to make other
changes to the legal structure or booking model of UBS Group in response to legal and
regulatory requirements, including capital requirements, resolvability requirements and proposals in Switzerland and other countries for mandatory structural
reform of banks; (vii) changes in UBS�s competitive position, including whether
differences in regulatory capital and other requirements among the major financial centers
will adversely affect UBS�s ability to compete in certain lines of business; (viii) the
liability to which UBS may be exposed, or possible constraints or sanctions that regulatory
authorities might impose on UBS, due to litigation, contractual claims and regulatory
investigations; (ix) the effects on UBS�s cross-border banking business of tax or
regulatory developments and of possible changes in UBS�s policies and practices relating
to this business; (x) UBS�s ability to retain and attract the employees necessary to
generate revenues and to manage, support and control its businesses, which may be affected by
competitive factors including differences in compensation practices; (xi) changes in
accounting or tax standards or policies, and determinations or interpretations affecting the recognition of gain or loss, the valuation of goodwill, the recognition
of deferred tax assets and other matters; (xii) limitations on the effectiveness of UBS�s
internal processes for risk management, risk control, measurement and modeling, and of
financial models generally; (xiii) whether UBS will be successful in keeping pace with competitors in updating its technology, particularly in trading businesses; (xiv)
the occurrence of operational failures, such as fraud, unauthorized trading and systems
failures; and (xv) the effect that these or other factors or unanticipated events may
have on our reputation and the additional consequences that this may have on our business and
performance. The sequence in which the factors above are presented is not indicative of
their likelihood of occurrence or the potential magnitude of their consequences. Our business and financial performance could be affected by other factors
identified in our past and future filings and reports, including those filed with the SEC. More
detailed information about those factors is set forth in documents furnished by UBS and
filings made by UBS with the SEC, including UBS�s Annual Report on Form 20-F for the year ended 31 December 2013. UBS is not under any obligation to (and
������� This presentation and the information contained
herein are provided solely for information purposes, and are not to be construed as a solicitation of an offer
to buy or sell any securities or other financial instruments in Switzerland, the United States
or any other jurisdiction. No investment decision relating to securities of or relating
to UBS AG or its affiliates should be made on the basis of this document. Refer to UBS's third quarter 2014 report and its Annual report on Form 20-F for the year
ended 31 December 2013. No representation or warranty is made or implied concerning, and UBS
assumes no responsibility for, the accuracy, completeness, reliability or comparability
of the information contained herein relating to third parties, which is based solely on publicly available information. UBS undertakes no obligation to update
the information contained herein.
� UBS 2014. The key symbol and UBS are among the registered and unregistered trademarks of
UBS. All rights reserved. Disclaimer: expressly disclaims any obligation to) update or
alter its forward-looking statements, whether as a result of new information, future events, or otherwise. |
 2
3Q14 highlights�Group
Strong underlying results; significant DTA write-up and litigation
provisions
Refer to slide 36 for details about adjusted and underlying numbers, Basel III numbers and FX
rates in this presentation Underlying
profit before tax (PBT) CHF 1.7 billion
Net profit attributable to UBS shareholders CHF 762 million, diluted EPS CHF 0.20
Provisions for litigation, regulatory and similar matters CHF 1,836 million
Net upward revaluation of deferred tax assets CHF 1,420 million
PBT negative CHF 554 million, adjusted PBT negative CHF 424 million
WM, WMA, R&C and Global AM all reported higher PBT QoQ and YoY
Strong net new money CHF 14.4 billion from our wealth management
businesses
Basel III fully applied CET1 ratio 13.7%, post-stress ratio remained above 10%,
fully applied Swiss SRB leverage ratio 4.2%, CHF 7 billion reduction in RWA
|
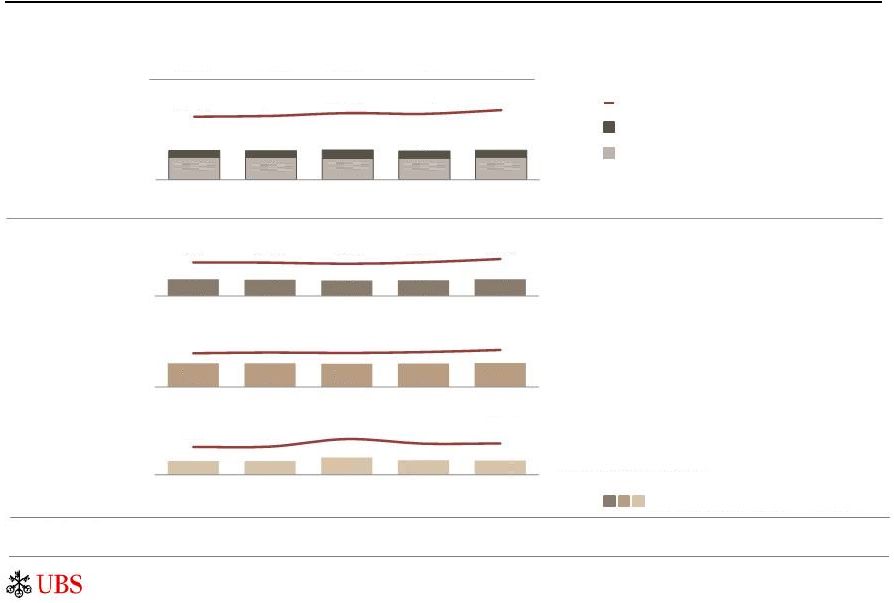
 Our wealth management
franchise is unrivaled Refer to slide 36 for details about adjusted and underlying
numbers, Basel III numbers and FX rates in this presentation CHF 1.9 trillion invested
assets; combined adjusted PBT >CHF 1 billion 3
Profit before tax
adjusted, CHF million
Invested assets
CHF billion
Operating income
CHF million
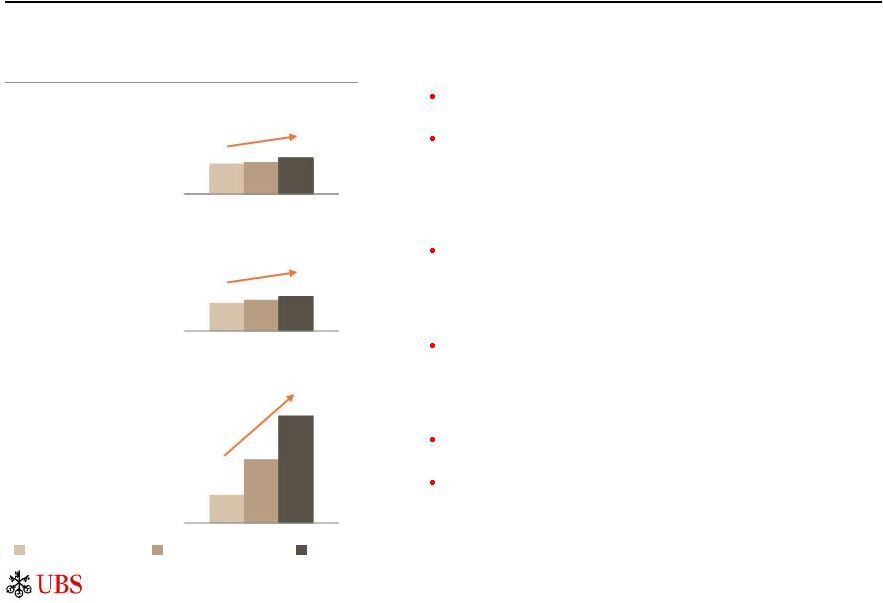
Leading global franchise with superior growth prospects
and a unique global footprint
1,610
1,837
3,810
1,779
2,031
3,447
3Q13
WM
WMA
3Q14
3Q13
832
1,015
3Q14
+22%
3Q14
1,936
3Q13
1,702
+11%
+14%
248
215
767
617
970
871
966
831 |
 4
3Q14
highlights�business
divisions
1
Strong performance with underlying PBT up YoY in all businesses
Refer to slide 36 for details about adjusted and underlying numbers, Basel III numbers and FX
rates in this presentation 1 Figures on an adjusted basis unless otherwise stated; 2
Refer to page 118 of the 3Q14 report for details on funding valuation adjustments (FVA)
Wealth Management:
Highest PBT since 2Q09 CHF 767 million
�
NNM CHF 9.8 billion, positive in all regions
Wealth Management Americas:
�
Record
income
on
record
FA
productivity
with
USD
1.1
million
in
annualized
revenues
per
FA
Retail & Corporate:
�
All KPIs within target ranges for 3Q14 and 9M14
Global Asset Management:
�
PBT up 41% QoQ and 16% YoY
Investment Bank:
�
Provisions for litigation, regulatory and similar matters CHF 1,687 million
Corporate Center:
implementation
of
FVA
2
�
Non-core and Legacy Portfolio RWA decreased 19%
Strong performance, PBT USD 267 million and NNM USD 4.9 billion
Highest PBT since 3Q10 CHF 446 million
Strong performance, PBT CHF 151 million and NNM CHF 3.8 billion ex-MM
Strong underlying PBT CHF 494 million, up 47% YoY
Reported pre-tax loss CHF 793 million; CHF 252 million net loss resulting from the
|
 Key messages
The fundamental earnings power of our unrivaled franchise is evident
�
WM/WMA combined adjusted PBT >CHF 1 billion
�
Strong performance in Retail & Corporate with all KPIs within target ranges
�
Solid Investment Bank and Global AM performance despite challenging market conditions
Results include provisions for litigation, regulatory and similar matters
�
We continue to seek resolution of open issues
�
Timing of full resolution of complex industry-wide issues is difficult to predict
We will continue executing our strategy and are well positioned for growth
�
Seizing current revenue opportunities and positioned for future economic recovery
�
Improving efficiency will release resources to invest for growth
�
Continued reduction in the Non-core and Legacy Portfolio
Our capital position is strong and our businesses are highly capital accretive
�
Continued capital strength in an evolving regulatory environment
�
Share-for-share exchange offer in progress creating eligibility for capital
rebate �
Committed
to
payout
ratio
of
at
least
50%
subject
to
maintaining
our
capital
targets
1
5
1
Payout
ratio
of
at
least
50%
conditional
on
both
fully
applied
CET1
ratio
of
minimum
13%
and
fully
applied
CET1
ratio
of
minimum
10%
post-stress |
 6
Group results
Refer to slide 36 for details about adjusted and underlying numbers, Basel III numbers and FX
rates in this presentation 1 Refer to page 118 of the 3Q14 report for details on funding
valuation adjustments (FVA) CHF million
3Q13
2Q14
3Q14
Total operating income
6,261
7,147
6,876
Total operating expenses
5,906
5,929
7,430
Profit before tax as reported
356
1,218
(554)
of
which:
own
credit
on
financial
liabilities
designated
at
fair
value
(147)
72
61
of which: gains on sales of real estate
207
1
0
of which: gain on disposals
0
43
0
of which: impairment of a financial investment available-for-sale
0
0
(48)
of which: net restructuring charges
(188)
(89)
(176)
of
which:
credit
related
to
changes
to
a
retiree
benefit
plan
in
the
US
0
0
33
Adjusted profit before tax
484
1,191
(424)
of which: provisions for litigation, regulatory and similar matters
(586)
(254)
(1,836)
of which: impairment of certain disputed receivables and other items
0
(53)
26
of which: net loss associated with implementation of FVA
-
-
(267)
Underlying profit before tax
1,070
1,498
1,653
Profit before tax as reported
356
1,218
(554)
Tax (expense)/benefit
222
(314)
1,317
Net profit attributable to preferred noteholders/non-controlling interests
(1)
(112)
(1)
Net profit attributable to UBS shareholders
577
792
762
Diluted EPS (CHF)
0.15
0.21
0.20
Return on Equity (RoE) (%)
4.9
6.4
6.1
Total book value per share (CHF)
12.58
13.20
13.54
Tangible book value per share (CHF)
10.89
11.54
11.78
1 |
 6.6
9.0
5.0
10.7
9.8
FY12
FY13
3Q13
2Q14
3Q14
Operating income and profit before tax
CHF million
Net new money
CHF billion
7
Wealth Management
Highest adjusted PBT since 2Q09; NNM CHF 9.8 billion, positive in all regions
Operating income up 6%
Recurring income up 8% to CHF 1,548 million on higher
recurring net fee income and higher net interest income
Transaction-based income up 1% to CHF 479 million
Strong net new money at CHF 9.8 billion
Positive NNM in all regions, CHF 7.8 billion from APAC
Balanced NNM inflows, UHNW share of NNM at 58%
Annualized NNM growth rate of 4.2%
Adjusted cost/income ratio 62%
Adjusted expenses CHF 1,264 million, down 17%
following lower charges for litigation, regulatory and
similar matters of CHF 14 million in 3Q14, down from
CHF 291 million in 2Q14
Excluding charges for litigation, regulatory and similar
matters, the business exercised good expense control in
the quarter
Refer to slide 36 for details about adjusted and underlying numbers, Basel III numbers and FX
rates in this presentation Operating income (as reported)
Profit before tax (as reported)
Profit before tax (adjusted)
Quarterly
average
Profit before tax (adjusted),
further excluding provisions for
litigation, regulatory and
similar matters
Mandate penetration
CHF 7.3 billion in net mandate sales, penetration up
from 24.2% to 24.5%
1,837
1,921
2,031
555
355
707
617
393
767
3Q13
2Q14
3Q14
684
684
781 |
 8
Wealth Management�revenue by source
Increased gross margin on highest quarterly operating income since 3Q08
3Q14
3Q13
1Q14
2Q14
4Q13
Income (CHF million)
Gross margin (bps)
Recurring income as a % of income
Net
interest
income
Recurring net
fee income
Transaction-
based and other
income
Increase mainly due to higher revenues
allocated from Group Treasury and higher net
interest income from Lombard lending
Positive effect from invested asset growth,�
pricing measures and mandate sales more than
offset impact of cross-border asset outflows
Higher FX related trading income partially offset
by first-time fees paid to R&C for net client
shifts and referral fees
Gross margin components (bps)
871
886
899
928
966
Invested assets
CHF billion
Wealth
Management
1
Gross margin components on the slide do not add up to total due to rounding
77%
77%
72%
75%
76%
85
85
87
84
1,837
1,859
1,943
1,919
2,031
24
23
22
23
24
517
513
496
518
569
41
41
40
40
41
891
911
897
922
978
20
20
25
21
20
429
434
551
479
484
86
1 |
 5.2
8.4
7.1
9.1
5.1
2.4
7.0
5.0
8.9
7.8
0.1
(1.4)
(2.2)
(0.6)
1.0
0.1
(1.6)
(2.5)
(0.7)
1.1
4.6
13.3
9.2
16.0
13.1
5.5
0.8
11.0
5.3
0.9
1.8
0.3
8.7
0.8
1.8
2.1
0.3
4.4
2.2
0.4
0.6
0.1
3.3
0.3
0.7
5.1
8.5
7.4
9.6
5.7
86
86
85
83
83
3Q13
4Q13
1Q14
2Q14
3Q14
74
74
85
78
83
3Q13
4Q13
1Q14
2Q14
3Q14
92
91
90
89
91
3Q13
4Q13
1Q14
2Q14
3Q14
90
92
93
92
97
3Q13
4Q13
1Q14
2Q14
3Q14
52
51
55
52
57
3Q13
4Q13
1Q14
2Q14
3Q14
1
Based on the Wealth Management business area structure; refer to page 25 of the 3Q14 financial
report for more information Gross
margin
bps
9
Net new
money
CHF billion
Invested assets
CHF billion
1,463
808
745
Client advisors
FTE
30.9.14
Europe
Emerging Markets
of which: UHNW
Wealth Management�by region
1
Switzerland
Asia Pacific
1,189
765
478
358
258
174
165
Net new
money
growth rate
% |
 5.5
4.8
2.1
(2.5)
4.9
5.7
6.3
5.4
5.7
5.6
FY12
FY13
3Q13
2Q14
3Q14
10
Wealth Management Americas
Refer to slide 36 for details about adjusted and underlying numbers, Basel III numbers and FX
rates in this presentation USD 4.9 billion net new money
Strong same store NNM and improved
net recruiting
Annualized NNM growth rate of 1.9%
Adjusted cost/income ratio 86%
Adjusted expenses decreased slightly to USD 1,651
million
Charges for litigation, regulatory and similar matters
remained elevated at USD 50 million
Operating income up 1%
Record recurring income as net interest income rose 6%
to USD 276 million on continued� growth in lending
balances, recurring net fee income increased 3% to
USD 1,197 million on higher managed account assets
Transaction-based income decreased 5% on seasonally
lower client activity
NNM excl. dividends & interest
Dividends & interest
Operating income (as reported)
Quarterly
average
Profit before tax (as reported)
Profit before tax (adjusted)
11.2
11.1
7.5
3.2
Continued strong FA productivity
Record annualized revenue per FA of USD 1.1 million
Invested assets per FA of USD 143 million
Adjusted PBT USD 267 million on record income and record FA productivity
Operating income and profit before tax
USD million
Net new money
USD billion
10.5
1,748
1,898
1,919
218
238
254
232
246
267
3Q13
2Q14
3Q14 |
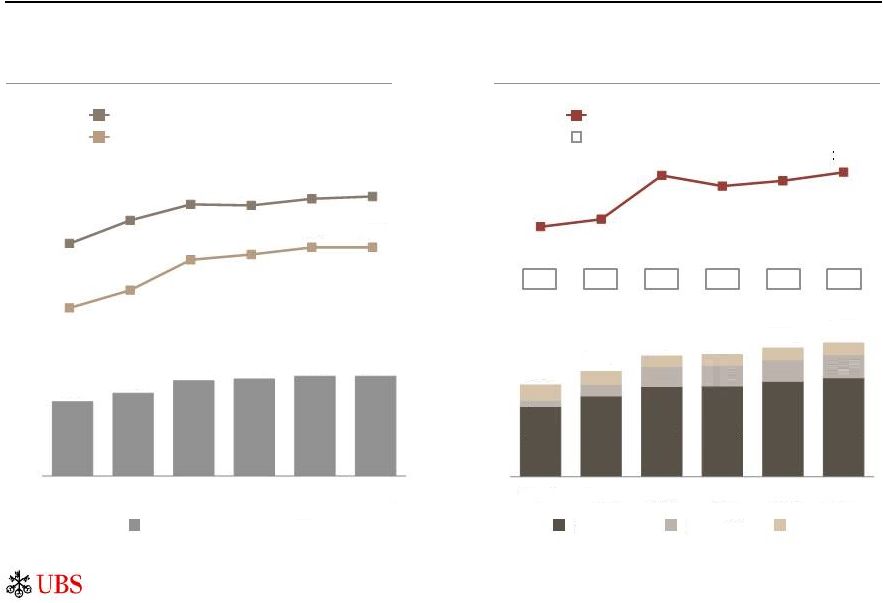 11
Wealth Management Americas�FA productivity and lending
Record invested assets and revenue per FA
Invested assets and FA productivity (USD)
NII
1
and lending balance
2
(USD)
Invested assets per FA
Annualized revenue per FA
Mortgages
Other
5
Credit lines
4
Credit loss (expense)/recovery
Net interest income
3
(5)
(16)
(2)
19
(9)
1 Net interest income 2 Period-end balances; 3 Total WMA net interest income excluding the
following effective interest rate adjustments from mortgage-backed securities
in
the
available-for-sale
portfolio
(USD):
4Q11
(3)
million,
4Q12
2
million,
4Q13
7
million,
1Q14
(9)
million,
2Q14
(3)
million
and
3Q14
4
million;
4
Mostly
collateralized; 5 Mainly margin loans
Invested assets (USD billion)
(1)
109
119
136
139
143
143
859
967
1,042
1,037
1,068
1,079
221
228
269
259
264
272
756
843
970
987
1,017
1,016
4Q11
4Q12
4Q13
1Q14
2Q14
3Q14
22.8
26.1
29.2
29.4
30.9
32.1
2.0
3.8
6.4
6.7
7.0
7.4
29.7
34.1
39.1
39.6
41.7
43.3
4Q11
4Q12
4Q13
1Q14
2Q14
3Q14 |
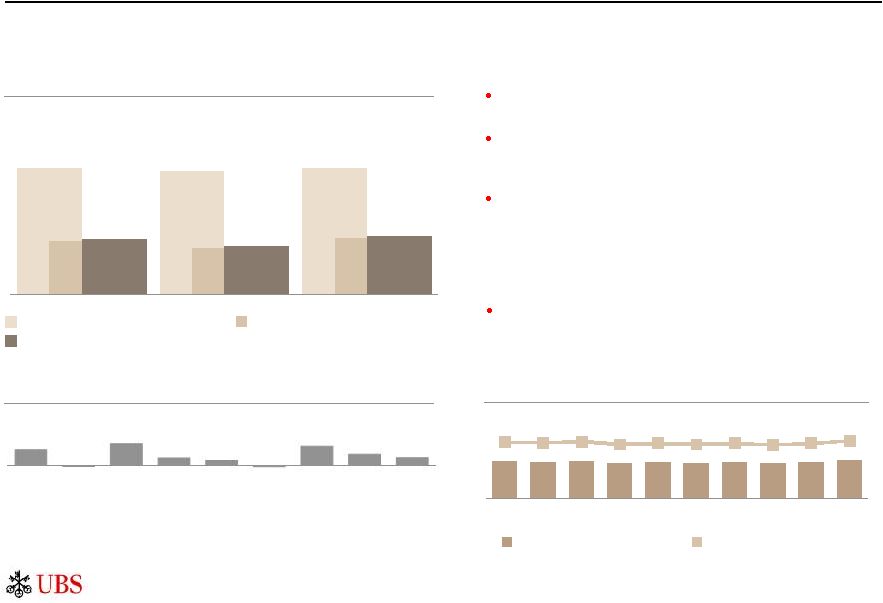 12
Operating income up 2%
Net interest income increased on higher revenues from
Group Treasury and improved loan margin
Transaction-based income increased, driven by the
implementation of client shift and referral fees from
Wealth Management
CHF 33 million net credit loss expense, up from
CHF 8 million, partly due to seasonal effects mainly in
corporates
Adjusted cost/income ratio 52%
Decreased largely due to CHF 48 million lower charges
for provisions for litigation, regulatory and similar
matters and reduced professional fees
Refer to slide 36 for details about adjusted and underlying numbers, Basel III numbers and FX
rates in this presentation 1 Net new business volume
Operating income and profit before tax
CHF million
Operating income (as reported)
Profit before tax (as reported)
Profit before tax (adjusted)
Net interest income, CHF million
Net interest margin, bps
Net interest margin
Highest adjusted PBT since third quarter 2010
NNBV
1
growth rate (retail business)
%, annualized
Retail & Corporate
958
938
958
402
354
426
417
367
446
3Q13
2Q14
3Q14
547
545
556
531
542
531
540
523
541
563
161
159
162
154
157
154
157
153
158
164
2Q12
3Q12
4Q12
1Q13
2Q13
3Q13
4Q13
1Q14
2Q14
3Q14
3.5
(0.3)
4.9
1.7
1.1
(0.3)
4.3
2.5
1.7
3Q12
4Q12
1Q13
2Q13
3Q13
4Q13
1Q14
2Q14
3Q14 |
 13
Investments in mobile and e-banking support business growth
Retail & Corporate
Significant business growth rate
Financial metrics all substantially higher across age groups and
segments for e-banking and mobile banking customers
Higher client loyalty
Lower attrition rate for e-banking clients, especially in higher
wealth segments
Driven by strategic investments
~40% of current R&C strategic IT investments focused on client-
facing digital and multi-channel capabilities
Investments in R&C platform also benefit our WM franchise:
direct use by WM clients booked in Switzerland; Swiss platform
leveraged by clients in other booking centers
1 9M14, for Swiss private clients (retail and WM Switzerland's high net worth clients) active
in both December 2013 and September 2014, excluding rental deposits and single-purpose
accounts
(e.g.
mono-saver
or
mortgages
only);
2
Return
on
business
volume;
3
Net
new
business
volume
Financials by client type
1
Without e-banking
With e-banking only
With e-
and mobile banking
Income per
client account
RoBV
2
NNBV
3
growth
rate per client
account
Higher client satisfaction
Excellent client feedback: continued 5-star Apple App store
ratings, award recognition, positive press coverage
E-banking and mobile banking clients have higher satisfaction,
shown by a strong uplift of the net promoter score, driving UBS
recommendation and new business
1.2x
2.9x
1.3x |
 447
465
489
118
105
154
130
107
151
3Q13
2Q14
3Q14
14
Global Asset Management
PBT up 41% QoQ and 16% YoY; CHF 3.8 billion NNM excluding money markets
WM businesses
Third party
Operating income up 5%
Net management fees up by CHF 35 million, driven by
the sale of a co-investment in global real estate and
increased fees on higher invested assets
Performance fees of CHF 27 million, declined by
CHF 11 million as a decrease in the O'Connor and A&Q
business line were partly offset by increases in
traditional investments and global real estate
Adjusted cost/income ratio 69%
Adjusted operating expenses down 5%, as the prior
quarter included CHF 33 million in charges for litigation,
regulatory and similar matters
Refer to slide 36 for details about adjusted and underlying numbers, Basel III numbers and FX
rates in this presentation 1 Individual NNM channel totals may not add up to total NNM
due to rounding Investment performance:
Gross margin 31 bps
Unchanged as higher revenues were offset by the effect
of a higher invested asset base
Quarterly
average
Operating income (as reported)
Profit before tax (as reported)
Profit before tax (adjusted)
CHF 3.8 billion NNM ex-money market
NNM by channel �
excluding money market
1
CHF billion
Operating income and profit before tax
CHF million
(1.3)
(1.4)
(0.3)
2.9
3.9
(0.2)
0.2
(3.7)
8.7
0.0
FY12
FY13
3Q13
2Q14
3Q14
Strong collective fund performance vs. peers with marked
improvement in equity fund rankings
Increased NNM from WM businesses more than offset by lower
contribution from third parties |
 Underlying PBT CHF
494 million, up 47% YoY 15
Refer to slide 36 for details about adjusted and underlying numbers, Basel III numbers and FX
rates in this presentation 1 Based on phase-in Basel III RWA; 2 Refer to page 118 of
the 3Q14 report for details on funding valuation adjustments (FVA) Adjusted operating
income up 16% YoY Strong delivery in a seasonally slow quarter; up YoY on
strong CCS and equities performance; FX, Rates and
Credit impacted by challenging credit trading conditions
Operating income and profit before tax
1
CHF million
Investment Bank
Adjusted cost/income ratio 161%
Adjusted operating expenses up CHF 1,818 million YoY,
driven by CHF 1,687 million in charges for litigation,
regulatory and similar matters
Underlying operating expenses up 9% YoY on higher
personnel expenses
Operating income (adjusted)
Profit before tax (as reported)
Profit before tax (adjusted)
Profit before tax (underlying)
Focused resource utilization
1,707
2,241
1,985
251
579
(1,284)
335
563
(1,205)
3Q13
2Q14
3Q14
494
CHF million
3Q13
2Q14
3Q14
Profit before tax as reported
251
579
(1,284)
Adjusted profit before tax
335
563
(1,205)
of which: provisions for litigation, regulatory
and similar matters
(2)
(11)
(1,687)
of which: net loss associated with
implementation of FVA
2
-
-
(12)
Underlying profit before tax
337
574
494
3Q13
2Q14
3Q14
Underlying
cost/income ratio (%)
80
74
75
Underlying
RoAE (%)
17
31
27
RWA (CHF billion)
59
68
62
RWA ex-operational risk (CHF billion)
46
47
46
RoRWA
1
(%, gross)
11
14
12
Funded assets (CHF billion)
172
182
173
Swiss SRB LRD
(CHF billion)
-
278
279
Front office staff (FTE)
5,318
5,167
5,285 |
 16
Highest 3Q revenues in equities since 2010; CCS up YoY in all regions
Corporate Client Solutions (CCS)
Advisory up 31%
with balanced mix of M&A and
advisory revenues, strong performance from EMEA and
APAC
Equity capital markets up 20%
with a strong
participation in rights issues and IPOs
Debt
capital
markets
up
15%
as
DCM
improved
across all regions and LCM continued on its momentum
from 1H14
Financing
solutions
up
25%
on
an
improved
performance in the structured financing businesses
Investor Client Services
2�
(ICS)
Equities
up
7%
driven
by
financing
services;
named
"Structured Products House of the Year" and "Corporate
FX
Rates
and
Credit
down
7%
with
slight
improvement in FX, but was more than offset by weaker
credit revenues
Advisory
Debt capital markets
Financing solutions
Risk management
Equities
FX, Rates and Credit
Adjusted income
1
Refer to slide 36 for details about adjusted and underlying numbers, Basel III numbers and FX
rates in this presentation 1 3Q14 Equities results adjusted for a loss of CHF 48 million
(USD 50 million) from an impairment of a financial investment available-for-sale; 2 Refer to the
"Regulatory
and
legal
developments
and
financial
reporting
changes"
section
of
the
3Q14
report
for
more
information
on
the
shift
of
our
exchange
traded
fixed
income
derivatives
execution
business
from
equities
into
foreign
exchange,
rates
and
credit;
3
September
2014
Corporate
Investor
Investment Bank
CHF million
USD million
CHF million
USD million
YoY comparison in USD terms
Services
Client
Solutions
Client
(70)
33
113
149
164
197
185
216
112
143
505
738
3Q13
3Q14
(76)
35
123
161
178
214
202
233
122
153
548
796
3Q13
3Q14
939
1,003
368
341
1,307
1,344
3Q13
3Q14
864
932
338
315
1,202
1,247
3Q13
3Q14
Equity capital markets
Derivatives
House
of
the
Year"
by
Global
Capital
3 |
 17
Corporate Center�Core Functions
Reported profit before tax of negative CHF 190 million
Refer to slide 36 for details about adjusted and underlying numbers, Basel III numbers and FX
rates in this presentation Operating income and profit before tax
CHF million
Operating income CHF 5 million
Operating expenses CHF 194 million
3Q13
4Q13
1Q14
2Q14
3Q14
Treasury income remaining in CC-CF
(219)
(343)
(46)
(55)
(65)
Own credit gain/(loss)
(147)
(94)
88
72
61
Other
169
72
9
6
9
Operating income (as reported)
(197)
(365)
51
23
5
Own credit gain/(loss)
(147)
(94)
88
72
61
Gains on sales of real estate
207
61
23
1
0
Early redemption/buyback of UBS debt
0
(75)
0
0
0
Adjusted operating income
(257)
(257)
(60)
(50)
(56)
Operating expenses (as reported)
282
200
227
(2)
194
Net restructuring charges
(1)
(7)
2
4
16
Adjusted operating expenses
283
207
225
(6)
178
Profit before tax (as reported)
(479)
(565)
(176)
25
(190)
Profit before tax (adjusted)
(540)
(464)
(285)
(44)
(235)
Personnel (after allocation)
1,139
1,055
951
881
916
Net treasury income remaining in Corporate
Center �
Core Functions included CHF 207
million of retained funding costs
Retained funding costs partly offset by
CHF 65 million in gains on cross-currency
basis swaps, interest income CHF 29 million
related to preferred securities and net gains
CHF 25 million related to high-quality liquid
asset portfolios
Increase largely due to net release of
CHF 141 million for provisions, for
litigation, regulatory and similar matters
in 2Q14 and CHF 69 million increase
from the difference between actual
costs incurred and the cost allocations
charged |
 18
Corporate Center�Non-core and Legacy Portfolio
Operating income and profit before tax
Refer to slide 36 for details about adjusted and underlying numbers, Basel III numbers and FX
rates in this presentation 1 Refer to page 118 of the 3Q14 report for details on funding
valuation adjustments (FVA) CHF million
Reported profit before tax of negative CHF 603 million
Operating income
negative CHF 322 million
Operating expenses
CHF 280 million
3Q13
4Q13
1Q14
2Q14
3Q14
Non-core
(120)
(104)
17
(151)
(233)
of which: DVA
(47)
(68)
(19)
(44)
-
of which: FVA/DVA
-
-
-
-
(188)
Legacy Portfolio
21
(36)
13
(15)
(92)
of which: SNB StabFund option
74
(28)
(1)
0
0
Credit loss (expense)/recovery
(1)
11
0
(2)
2
Total operating income
(100)
(130)
29
(167)
(322)
Adjusted operating income
(100)
(130)
29
(167)
(322)
Operating expenses (as reported)
593
317
254
245
280
Net restructuring charges
5
24
9
(2)
10
Credit related to changes to
a retiree benefit plan in the US
0
0
0
0
(3)
Adjusted operating expenses
588
293
245
247
273
Profit before tax (as reported)
(693)
(446)
(225)
(412)
(603)
Profit before tax (adjusted)
(688)
(422)
(216)
(414)
(596)
Personnel (front office)
245
222
195
160
150
Negative income in both Non-core and
Legacy Portfolio largely driven by
CHF 252 million net loss resulting from
the implementation of FVA
Non-core:
CHF 188 million net loss related
to FVA/DVA, of which CHF 175 million was
the net loss upon implementation of FVA
Legacy Portfolio:
Negative income driven
by CHF 77 million net loss upon
implementation of FVA
Increase largely due to charges of CHF 89
million for provisions for litigation,
regulatory and similar matters vs. a net
release of 27 million in 2Q14
2Q14 included an impairment charge of
CHF 78 million related to certain disputed
receivables
1
1
1 |
 Corporate
Center�Non-core
and
Legacy
Portfolio
1
19
Non-core and Legacy Portfolio RWA
CHF billion
Operational
risk
3
Non-core
credit
Non-core
rates
Non-core
other
Legacy
Portfolio
4
Market and credit risk RWA down 17%, LRD down 12% in the quarter
Non-core OTC positions natural decay of RWA
CHF billion
Original
estimate
at
30.9.12
5
Actual at 30.9.14 and updated
projection
for
future
dates
6
1 Refer to pages 68-70 of the 3Q14 report for more information; 2 Pro-forma estimate
for 31.12.12 based on period ending balance; 3 Non-core and Legacy Portfolio
operational risk; 4 Excluding operational risk; 5 Estimates disclosed in the 3Q12 presentation;
6 Estimates based on 30.9.14 data Non-core
Legacy Portfolio
Non-core and Legacy Portfolio Swiss SRB LRD
2
CHF billion
33
30.9.14
44%
95% of Non-core RWA
ex-operational risk are
OTC positions which will
naturally decay over time
12
27
22
17
10
9
8
31.12.15
31.12.16
31.12.17
20.3
3.7
1.8
29.3
9.6
9.2
4.5
1.3
1.3
34.2
14.1
11.3
14.2
23.1
18.4
102.5
51.9
42.1
31.12.12
30.6.14
30.9.14
~255
99
87
~38
22
19
~293
121
106
31.12.12
30.6.14
30.9.14 |
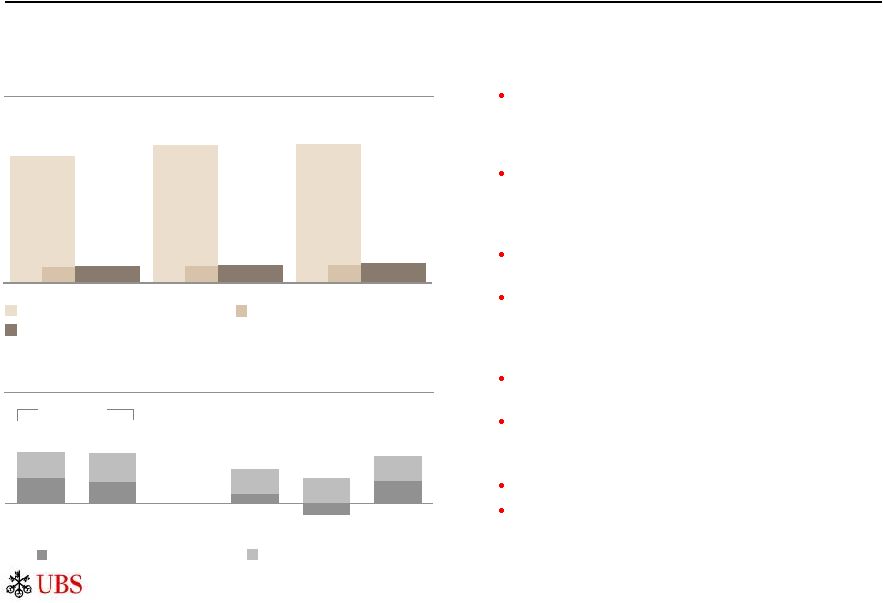
 Corporate Center
cost reductions 20
Core Functions:
CHF
1.0
billion
net
cost
reduction
target
by
2015
1
Adjusted operating expenses before allocations to business divisions
CHF billion
Non-core and Legacy Portfolio:
CHF
0.4
billion
net
cost
reduction
target
by
2015
1
Adjusted operating expenses
CHF billion
Refer to slide 34 in the appendix for details about adjusted numbers; charts illustrative only
and bars not to scale 1 Refer to page 11 of the 2Q14 report for details on our cost
reduction targets Achieved net cost reduction of ~CHF 0.1 billion vs. 9M13
Annualized 9M14 costs lower than previous year primarily
due to decrease in litigation provisions
Achieved net cost reduction of ~CHF 0.2 billion vs. 9M13
Significantly lower provisions for litigation and regulatory
matters
~CHF 0.3 billion of net cost reductions achieved year-to-date
Net cost
reduction
9M13
annualized
adjusted
operating
expenses
9M14
annualized
adjusted
operating
expenses
2.8
Changes in
provisions
for litigation,
regulatory
and similar
matters
Net cost
reduction
FX
movements
Changes in
regulatory
demand of
temporary
nature
9M13
annualized
adjusted
operating
expenses
9M14
annualized
adjusted
operating
expenses
7.8
7.6
1.0
Changes in
provisions
for litigation,
regulatory
and similar
matters
(0.4)
0.3
(0.1)
(0.1)
(0.2)
(1.6) |
 ~0.9
~0.9
~0.4
~0.5
~1.0
~0.8
~1.5
~1.4
~0.7
~1.5
~2.2
Guidance
Actual
Updated restructuring cost guidance
21
1 Initially announced 30.10.12; 2 Additional temporary costs that are necessary to effect our
cost reduction program but not classified as restructuring charges; 3 Refer to page 154
of our 3Q14 report for the definition of restructuring charges; 4 Cumulative total initial guidance for 2011-2013 as announced 23.8.11 and 30.10.12; 5 Refer to
page 11 of our 2Q14 report for details about our cost reduction targets
2011-2013
CHF billion
2014-2015
CHF billion
2016-2017
CHF billion
Actual restructuring expenses have
been lower than guidance
4
2011-2013 restructuring costs
~CHF 0.6 billion below guidance
Committed to our CHF 1.4 billion net cost
reduction
target
for
2015
year-end
run-rate
5
Revised restructuring guidance for 2014-2015
IT infrastructure and simplification investment will
account for ~50% of total restructuring costs and
additional CtA in 2015-2017
2014
2015
Previous
guidance
1
Additional
cost-to-achieve
2
(CtA)
Restructuring
costs
3
(excluded
from
adjusted
results)
2016
2017
Committed to our CHF 0.7 billion net
cost reduction target
5
as we fully exit
the Non-core and Legacy Portfolio
Guidance period extended to
2017 as we invest to offset ongoing
incremental regulatory costs |
 Net tax benefit and
deferred tax assets 1
DTA
figures
are
stated
net
of
DTL;
2
As
of
30.9.14,
the
net
DTA
recognized
on
UBS's
balance
sheet
(CHF
10,074
million)
includes
a
tax
loss
DTA
(CHF 6,860 million) and a DTA for temporary differences (CHF 3,214 million);� 3 DTA annual
revaluations performed in 3Q14 but smaller revaluations can take place at different
times for specific entities based on specific circumstances; 4 As disclosed on page 69 in our
2013 Annual Report, UBS may, depending on our financial performance, increase the future
profit recognition period. Where appropriate, such an extended DTA profit recognition period was applied in 3Q14.
5 years
Year: 1
2
3
4
5
6
8
7
�
Tax loss DTA
1
CHF billion
22
DTA revaluation
3
Illustrative example
Net tax benefit of CHF 1,317 million; DTA potential remains significant
9
6 years
2013
2014
Net
upward
revaluation
of
DTA
for
the
Group
of
CHF
1,420
million
recognized
in
3Q14,
additional
~CHF
0.4
billion
expected
to
be
recognized in 4Q14
The future profit recognition period used for DTA revaluation was extended from 5 years to 6
years Average unrecognized tax loss DTA have a remaining life of ~16 years in the US and
~2 years in Switzerland; unrecognized tax losses have indefinite life in the UK
Total
2
US
RoW
CH
UK
3
6.9
3.6
3.1
0.1
0.1
23.1
16.4
2.8
2.9
1.0
CHF million
Net
deferred
tax
benefit
with
respect
to
recognition
of
DTA
1,420
Other net tax expense in respect of 3Q14 taxable profits
(103)
Net tax benefit
1,317
Extended profit recognition period
4
Unrecognized
Recognized |
 99
107
115
129
~105
~105
62
68
62
14
70
70
64
52
42
76
~40
~25
~400
225
227
219
219
<215
<200
30.9.11
31.12.13
30.6.14
30.9.14
30.9.14
by risk
type
31.12.15
target
31.12.17
target
Swiss SRB capital and leverage ratios
Fully applied CET1 capital ratio of 13.7% and leverage ratio of 4.2%
Swiss SRB RWA and capital ratios
CHF billion
Swiss SRB LRD and leverage ratio
CHF billion
Non-core and Legacy Portfolio
Leverage ratio (fully applied)
Leverage ratio (phase-in)
Swiss SRB total exposure
Refer to slide 36 for details about adjusted and underlying numbers, Basel III numbers and FX
rates in this presentation 1 At the end of the third quarter, our post-stress CET1
capital ratio exceeded our objective of achieving and maintaining a post-stress CET1 capital ratio of at least 10% on a fully
applied
basis.
Refer
to
the
"Capital
management"
section
of
the
3Q14
financial
report
for
more
detail;
2
Includes
CHF
15
billion
for
non-counterparty-related risk; 3 Full exit of Non-core and Legacy Portfolio
equivalent to ~45-55 bps increase in fully applied Swiss SRB leverage ratio based on current fully applied
Swiss SRB leverage ratio numerator and denominator; 4 Based on the rules applicable as of the
announcement of the target (6.5.14) Investment Bank
Other business divisions and
Corporate Center �
Core Functions
Non-core and Legacy Portfolio
CET1
capital
ratio
(fully
applied)
1
Total capital ratio (fully applied)
23
Operational
35%
Market 6%
Credit
2
59%
4.7%
5.3%
5.4%
3.4%
4.2%
4.2%
15.4%
18.1%
18.7%
6.2%
12.8%
13.5%
13.7%
160
121
106
3
1,020
981
985
900
31.12.13
30.6.14
30.9.14
2016
target
4 |
 ~22%
~21%
~35%
24
Currency sensitivites
Group
CC �
Core
Functions
Investment
Bank
CHF
USD
EUR
Other
RWA
Fully applied
LRD
Fully applied
~13%
A 10% depreciation of the Swiss
franc against other currencies
would:
Currency distribution of RWA and LRD
% of total
Percentages on charts may not add up to 100% due to rounding
1 Based on period ending balance as of 30.9.14
USD appreciation/CHF depreciation inflates RWA, balance sheet and LRD
Basel III CET1
(fully applied)
Equity attributable to
shareholders
~15%
~24%
~33%
~25%
~17%
~14%
~46%
~23%
~19%
~12%
~63%
27%
Currency distribution of equity
% of total
~10%
~6%
~35%
~56%
~24%
~67%
~3%
~6%
~3%
~6%
Operational risk RWA (CHF)
~2%
~22%
~55%
~2%
~1%
~8%
~43%
~6%
~42%
Increase fully applied RWA by ~5%
Increase fully applied LRD
1
by ~8%
Increase IFRS equity by ~5%
Increase Basel III fully applied CET1 capital by
~3%
1 |
 Interest rate
sensitivities 1
Our revenues are positively geared to rising interest rates
1 For
all
scenarios,
interest
rate
increases
are
assumed
to
be
equal
across
all
currencies
and
relative
to
implied
forward
rates
based
on
static
balance
sheet
and
constant
FX rates; 2 The estimated impact is for the first year of the relevant interest rate scenario;
3 The estimated impact on OCI only applies to treasury portfolios and does not consider
pension liabilities and assets; 4 Majority of the impact on OCI would be through cash flow hedges, which would not affect regulatory capital
25
~0.7
R&C
~0.4
WM
WMA
~0.2
Scenario
overview
and
incremental
NII
by
business
division
(+100
bps
parallel
increase,
scenario
B)
3M
8Y
10Y
B
C
A
+20 bps
+100 bps
+200 bps
1Y
A
Steepener
(+20 bps to +200 bps)
B
Parallel
(+100 bps)
C
Flattener
(+200 bps to +20 bps)
Annual incremental
net interest income
2
Negative impact
on OCI
3
Negative impact
on regulatory capital
~ 0.2
(all scenarios
4
)
~0.4
~1.7
~1.3
~2.1
~2.3
~2.8
Interest
rate
scenarios:
estimated
impact
on
NII,
OCI
and
regulatory
capital
CHF
billion |
 Indicative timetable
of principal events 1
1 Dates
and
duration
dependent
on
certain
conditions,
acceptance
periods
could
be
extended
one
or
several
times;
2
F-4
registration
statement
publicly
filed;
3 Two simultaneous offers are being conducted in the USA and Switzerland (to include an
international component via a EU prospectus); 4 Subject to shareholder approval through
a General Meeting; 5 Payout ratio of at least 50% conditional on both fully applied CET1 ratio of minimum 13% and our objective of achieving and maintaining a post-
stress CET1 capital ratio of at least 10%
29
Sept:
Swiss
offer
prospectus published; US
offer to exchange /
prospectus for offer
published
2
Cooling-off period
30 Sept to 13 Oct
Initial
acceptance
period
1
14 Oct to 11 Nov
12
Nov:
Publication
of
preliminary interim exchange
offer results
17
Nov:
Publication
of
definitive results
19
Nov:
First
settlement
for
UBS
shares tendered in initial acceptance
period, first trading day of UBS Group
Shares on SIX Swiss Exchange and
NYSE
2
Dec:
Publication
of
preliminary interim
exchange offer results
5
Dec:
Publication
of
definitive results
Additional
acceptance
period
1
17 Nov to 1 Dec
The
exchange
offer
may
take
up
to
three
months
from
the
publication
of
the
Swiss
and
US
prospectuses
3
to
final
settlement
of
the offer, any squeeze-out required thereafter could take several additional months
Shareholders will be able to tender their shares in an initial and additional acceptance
period A key condition for the successful completion of the offer is achieving a 90%
acceptance level by shareholders Enhanced resolvability is expected to result in UBS
qualifying for a capital rebate under Swiss Too-Big-To-Fail legislation
Following
successful
completion
of
the
transaction,
we
expect
to
propose
a
supplementary
capital
return
of
at
least
CHF
0.25
per
share
4
from
the
Group
holding
company,
which
would
be
separate
and
in
addition
to
our
targeted
capital
return
of
at
least
50%
of
net
profit
attributable
to
shareholders
5
9
Dec:
Second
settlement
for
UBS
shares tendered in additional
acceptance period
26
Group holding company: share for share exchange timeline
Initial acceptance period ending on 11 November
1 |
 Key messages
The fundamental earnings power of our unrivaled franchise is evident
�
WM/WMA combined adjusted PBT >CHF 1 billion
�
Strong performance in Retail & Corporate with all KPIs within target ranges
�
Solid Investment Bank and Global AM performance despite challenging market conditions
Results include provisions for litigation, regulatory and similar matters
�
We continue to seek resolution of open issues
�
Timing of full resolution of complex industry-wide issues is difficult to predict
We will continue executing our strategy and are well positioned for growth
�
Seizing current revenue opportunities and positioned for future economic recovery
�
Improving efficiency will release resources to invest for growth
�
Continued
reduction
in
the
Non-core
and
Legacy
Portfolio
Our capital position is strong and our businesses are highly capital accretive
�
Continued capital strength in an evolving regulatory environment
�
Share-for-share exchange offer in progress creating eligibility for capital
rebate �
Committed
to
payout
ratio
of
at
least
50%
subject
to
maintaining
our
capital
targets
1
27
1 Payout
ratio
of
at
least
50%
conditional
on
both
fully
applied
CET1
ratio
of
minimum
13%
and
fully
applied
CET1
ratio
of
minimum
10%
post-stress |
 Appendix
|
       1 The regional
figures do not correspond precisely to the financial statements of the UBS subsidiaries and branches established in the regions because they reflect different
allocation principles; 2 Europe, Middle East, and Africa excluding Switzerland; 3 Refers to
items managed globally 29
Regional performance excluding charges for provisions for litigation, regulatory and similar
matters
1
CHF billion
2Q14
3Q14
2Q14
3Q14
2Q14
3Q14
2Q14
3Q14
2Q14
3Q14
2Q14
3Q14
WM
0.1
0.1
0.4
0.5
1.0
1.0
0.4
0.4
0.0
(0.0)
1.9
2.0
WMA
1.7
1.8
-
-
-
-
-
-
-
-
1.7
1.8
R&C
-
-
-
-
-
-
0.9
1.0
-
-
0.9
1.0
Global AM
0.2
0.2
0.1
0.1
0.1
0.1
0.1
0.1
-
-
0.5
0.5
Investment Bank
0.7
0.6
0.6
0.6
0.7
0.6
0.3
0.2
0.0
(0.1)
2.3
1.9
Corporate Center
-
-
-
-
-
-
-
-
(0.1)
(0.3)
(0.1)
(0.3)
Group
2.6
2.7
1.2
1.2
1.7
1.7
1.7
1.7
(0.1)
(0.4)
7.1
6.9
WM
0.1
0.1
0.3
0.3
0.7
0.7
0.2
0.2
0.0
(0.0)
1.3
1.3
WMA
1.4
1.5
-
-
-
-
-
-
-
-
1.4
1.5
R&C
-
-
-
-
-
-
0.5
0.5
-
-
0.5
0.5
Global AM
0.1
0.1
0.0
0.1
0.1
0.1
0.1
0.1
0.0
0.0
0.3
0.3
Investment Bank
0.5
0.5
0.5
0.4
0.5
0.5
0.2
0.2
0.0
0.0
1.7
1.5
Corporate Center
-
-
-
-
-
-
-
-
0.4
0.4
0.4
0.4
Group
2.2
2.2
0.8
0.8
1.2
1.2
1.0
1.0
0.4
0.4
5.7
5.6
WM
0.0
0.0
0.1
0.2
0.3
0.3
0.2
0.2
0.0
0.0
0.6
0.7
WMA
0.3
0.3
-
-
-
-
-
-
-
-
0.3
0.3
R&C
-
-
-
-
-
-
0.4
0.4
-
-
0.4
0.4
Global AM
0.1
0.1
0.0
0.0
0.0
0.0
0.1
0.0
(0.0)
(0.0)
0.1
0.2
Investment Bank
0.1
0.1
0.2
0.2
0.2
0.1
0.1
0.1
(0.0)
(0.1)
0.6
0.4
Corporate Center
-
-
-
-
-
-
-
-
(0.6)
(0.7)
(0.6)
(0.7)
Group
0.5
0.5
0.3
0.4
0.5
0.4
0.7
0.7
(0.6)
(0.8)
1.5
1.3
Switzerland
Corporate Center
and global�
Total
Operating
income
Operating
expenses
Profit
before tax
Americas
Asia Pacific
EMEA� |
 30
Retained Treasury income in Corporate Center�Core Functions
Treasury
income
retained
in
Corporate
Center
�
Core
Functions
We continue to expect retained funding costs to decline in the mid-term
CHF million
Central funding costs retained in Group Treasury increased as a result of the issuance of CHF
8.8 billion in senior unsecured debt in 3Q14, the negative impact from the WM and
R&C methodology change in the allocation of liquidity and funding costs, and as businesses continued to
reduce their consumption of funding
Retained funding costs expected to decrease to a negligible amount in FY16
Credit spread compression
will drive down costs of the
Group's overall long term
funding along with
declining volumes as we
reduce our balance sheet
We will continue to
maintain a diversified
funding profile and
comfortable LCR and NSFR
ratios
FY13
1Q14
2Q14
3Q14
Gross results (excluding accounting driven adjustments)
664
137
174
235
Allocations to business divisions
(921)
(206)
(243)
(341)
Net revenues
(excluding accounting driven adjustments)
(257)
(69)
(69)
(108)
of which: retained funding costs
(510)
(165)
(182)
(207)
of which: profits retained in Treasury
253
96
113
99
Accounting asymmetry and other adjustments
(645)
23
16
42
Mark-to-market losses from cross currency swaps, macro cash flow
hedge ineffectiveness, Group Treasury FX, debt buyback and other
Net treasury income retained in CC-Core Functions
(902)
(46)
(55)
(65) |
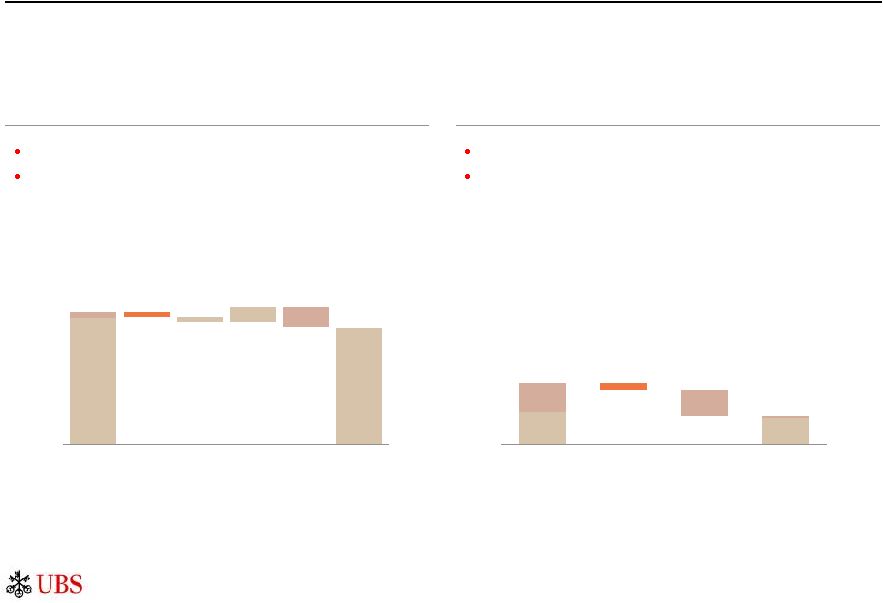
 31
IFRS equity attributable to UBS shareholders
30.6.14
Foreign
currency
translation
(OCI)
30.9.14
Employee share
and share
options plans
(within share
premium)
Cash flow
hedges (OCI)
Net profit
Treasury
shares
Financial
investments
available-for-
sale (OCI)
Defined
benefit plans
(OCI)
Other
QoQ movement
CHF millions, except for per share figures in CHF
Refer to slide 36 for details about adjusted and underlying numbers, Basel III numbers and FX
rates in this presentation Total book value per share:
Tangible book value per share:
11.54
13.20
Equity attributable to UBS shareholders surpasses CHF 50 billion
30.6.14
11.78
13.54
30.9.14
+2.6%
+2.1%
49,532
762
1,195
15
(38)
(889)
232
8
7
50,824 |
 Other (including
net replacement)
Loans
Cash collateral on securities borrowed
and reverse repo agreements
Trading portfolio assets
Financial investments available-
for-sale
Cash, balances with central
banks and due from banks
32
Our balance sheet, funding and liquidity positions are strong
Our balance sheet structure has many characteristics of a AA-rated bank
Refer to slide 36 for details about adjusted and underlying numbers, Basel III numbers and FX
rates in this presentation 1 As of 30.9.14. Refer to liquidity and funding management
section of the 3Q14 report for further detail; 2 As of 30.9.14. Pro-forma ratios using supervisory
guidance from FINMA. Refer to the liquidity and funding management section of the 3Q14
financial report for details about the calculation of UBS�s Basel III LCR and
NSFR Due to banks (12), Short-term
debt issued (34), Trading portfolio
liabilities (28), and Cash collateral
on securities lent
and repo agreements (23)
Long-term debt issued
Due to customers
Total equity
Other liabilities
Strong funding and liquidity
Well diversified by market, tenor and currency with over 59% of funding from deposits
Limited use of short-term wholesale funding
107%
Basel
III
NSFR
2
and
128%
Basel
III
LCR
2
129%
coverage
Asset funding
1
CHF billion
89
53
310
117
130
136
94
402
56
126
Assets
Liabilities and equity |
 Breakdown of changes
in Group RWA 33
30.6.14
Refer to slide 36 for details about adjusted and underlying numbers, Basel III numbers and FX
rates in this presentation 1 Incremental
operational
risk
RWA
based
on
the
supplemental
operational
risk
capital
analysis
mutually
agreed
to
by
UBS
and
FINMA;
2
Refer
to
pages
68-70
of
the
3Q14
By type
CHF billion
30.6.14
By business division
CHF billion
227
219
+4
(5)
227
219
+5
(6)
+4
(10)
30.9.14
�
�
�
Book size and other
�
�
�
FX impact
Non-core and Legacy Portfolio�
�
�
�
Investment Bank
�
�
�
30.9.14
(6)
Corporate
Center
�
Core
Functions
�
�
All other businesses�
�
�
CHF 6.7 billion decrease related to incremental operational risk
RWA�
CHF 1.3 billion increase in market risk RWA due to the annual
recalibration of risks not in VaR
CHF 1.0 billion decrease in credit risk RWA related to right way
risk trades
CHF 4.9 billion reduction in credit risk RWA as the prior quarter
included temporarily higher RWA related to aged trade
settlements
and the sale of certain collateralized loan obligation
(CLO) bond positions in the current quarter
CHF 1.0 billion reduction in market risk RWA, primarily
comprehensive risk measure as a result of the exit of the
majority of the correlation trading portfolio
CHF 1.4 billion higher non-counterparty-related risk RWA,
mainly related to deferred tax assets
CHF 4.6 billion decrease in incremental operational risk� RWA
CHF 2.2 billion reduction in market risk RWA, primarily comprehensive
risk measure as a result of the exit of the majority of the correlation
trading portfolio
CHF 2.8 billion reduction in credit risk RWA primarily due to the sale of
certain
collateralized
loan
obligation
(CLO)
bond
positions
and
termination
of derivative trades
CHF 3.0 billion increase in incremental operational risk� RWA
CHF 1.4 billion higher non-counterparty-related risk RWA mainly due to
deferred tax assets
CHF
5.5
billion
decrease
related
to
incremental
operational
risk
RWA
CHF 2.0 billion lower credit risk RWA, as the prior quarter included
temporarily higher RWA related to aged trade settlements
CHF
1.0
billion
increase
in
market
risk
RWA
primarily
due
to
the
annual
recalibration of risks not in VaR
CHF 1.4 billion increase in incremental operational risk RWA
CHF 2.3 billion increase in credit risk RWA due resulting from the
strengthening of the US dollar versus the Swiss franc and also reflecting
higher RWA related to undrawn commitments
Methodology/model-driven
financial report for more information on Non-core and Legacy Portfolio; 3 Wealth
Management, Wealth Management Americas, Retail & Corporate and Global Asset
Management |
 Corporate Center
adjusted operating expenses before service allocation
34
CC -
Core Functions -
adjusted expenses before service allocation
to business divisions and CC -
Non-core and Legacy Portfolio
1Q13
2Q13
3Q13
4Q13
1Q14
2Q14
3Q14
9M13
9M14
FY13
CHF million
Personnel expenses
1,101
1,006
955
1,007
959
904
875
3,063
2,739
4,070
General and administrative expense
910
849
1,022
970
947
806
1,014
2,781
2,767
3,750
Depreciation and impairment of property and equipment
161
180
170
185
179
184
178
511
542
696
Amortization and impairment of intangible assets
1
1
1
1
1
1
2
3
4
4
Total adjusted operating expenses before service allocation to
business divisions and CC -
Non-core and Legacy Portfolio
2,173
2,036
2,148
2,163
2,087
1,895
2,069
6,357
6,051
8,520
Net allocations to business divisions
(1,931)
(1,915)
(1,865)
(1,956)
(1,862)
(1,902)
(1,892)
(5,711)
(5,655)
(7,667)
of which: Wealth Management
498
484
460
521
464
504
490
1,443
1,457
(1,964)
of which: Wealth Management Americas
274
267
264
268
250
264
265
806
778
(1,074)
of which: Retail & Corporate
316
306
305
319
275
282
268
927
825
(1,246)
of which: Global Asset Management
128
123
126
123
113
114
116
377
342
(499)
of which: Investment Bank
557
562
560
589
632
621
626
1,678
1,879
(2,267)
of which: CC -
Non-core and Legacy Portfolio
157
173
150
136
129
117
126
480
372
(616)
Total adjusted operating expenses
242
121
283
207
225
(6)
178
646
397
853 |
 35
Adjusted results
Adjusting items
Business division / Corporate Center
3Q13
2Q14
3Q14
FY13
CHF million
Operating income as reported (Group)
6,261
7,147
6,876
27,732
Of which:
Own credit on financial liabilities designated at fair value
Corporate Center -
Core Functions
(147)
72
61
(283)
Gains on sales of real estate
Corporate Center -
Core Functions
207
1
0
288
Corporate Center -
Core Functions
0
0
0
(194)
Corporate Center -
Non-core and Legacy Portfolio
0
0
0
27
Gain from the partial sale of our investment in Markit
Investment Bank
0
43
0
0
Impairment of financial investments available-for-sale
Investment Bank
0
0
(48)
34
Investment Bank
0
0
0
55
Corporate Center -
Core Functions
0
0
0
(24)
Operating income adjusted (Group)
6,201
7,031
6,863
27,829
Operating expenses as reported (Group)
5,906
5,929
7,430
24,461
Of which:
Wealth Management
62
38
60
178
Wealth Management Americas
13
7
15
59
Retail & Corporate
15
13
20
54
Global Asset Management
12
2
5
43
Investment Bank
84
27
50
210
Corporate Center -
Core Functions
(1)
4
16
(6)
Corporate Center -
Non-core and Legacy Portfolio
5
(2)
10
235
Wealth Management Americas
0
0
(3)
0
Global Asset Management
0
0
(8)
0
Investment Bank
0
0
(19)
0
Corporate Center -
Non-core and Legacy Portfolio
0
0
(3)
0
Operating expenses adjusted (Group)
5,718
5,840
7,287
23,689
Operating profit/(loss) before tax as reported
356
1,218
(554)
3,272
Operating profit/(loss) before tax adjusted
484
1,191
(424)
4,141
Net loss related to the buyback of debt in public tender offer
Net restructuring charges
Credit related to changes to a retiree benefit plan in the US
Net gain on sale of remaining proprietary trading business |
 Important
information related to numbers shown in this presentation
36
Use of adjusted numbers
Unless otherwise indicated, �adjusted� figures exclude the adjustment items listed on
the previous slide, to the extent applicable, on a Group and business division level. Adjusted
results are a non-GAAP financial measure as defined by SEC regulations. Refer to pages
12-13 of the 3Q14 financial report for an overview of adjusted numbers. Use of underlying numbers
Unless otherwise indicated, �underlying� figures exclude the adjusting items listed
on the previous slide as well as charges for provisions for litigation, regulatory and similar matters,
net losses associated with the implementation of FVA, impairment charges related to certain
disputed receivables and other expenses, to the extent applicable, on a Group and
business division level. Adjusted results are a non-GAAP financial measure as defined by
SEC regulations. Refer to the "Group Performance" and "Investment Bank" sections of the
3Q14 financial report for more information on underlying numbers. Basel III RWA, Basel III capital and Basel III liquidity ratios
Basel III numbers are based on the BIS Basel III framework, as applicable for Swiss
Systemically relevant banks (SRB). Numbers in the presentation are SRB Basel III numbers unless
otherwise stated. Our fully applied and phase-in Swiss SRB Basel III and BIS Basel III
capital components have the same basis of calculation, except for differences disclosed on page
84 of the 3Q14 financial report.
Basel III risk-weighted assets in the presentation are calculated on the basis of Basel III
fully applied unless otherwise stated. Our RWA under BIS Basel III are the same as under
Swiss SRB Basel III.
Leverage ratio and leverage ratio denominator in this presentation are calculated on the basis
of fully applied Swiss SRB Basel III, unless otherwise stated.
From 1Q13 Basel III requirements apply. All Basel III numbers prior to 1Q13 are on a
pro-forma basis. Some of the models applied when calculating pro-forma information required
regulatory approval and included estimates (discussed with our primary regulator) of the effect
of these new capital charges.
Refer to the �Capital Management� section in the 3Q14 financial report for more
information.
Currency translation
Monthly income statement items of foreign operations with a functional currency other than
Swiss francs are translated with month-end rates into Swiss francs. Refer to �Note 17
Currency translation rates� in the 3Q14 financial report for more information.
Rounding
Numbers presented throughout this presentation may not add up precisely to the totals provided
in the tables and text. Percentages, percent changes and absolute variances are
calculated based on rounded figures displayed in the tables and text and may not precisely
reflect the percentages, percent changes and absolute variances that would be derived
based on figures that are not rounded.
|
This Form 6-K is hereby incorporated by reference into (1)�each of the registration statements of UBS�AG on Form�F-3 (Registration Number 333-178960) and Form�S-8 (Registration Numbers 333-49210; 333-49212; 333-127183; 333-127184; 333-162798; 333-162799; 333-162800; 333-178539; 333-178540; 333-178541; and 333-178543) and into each prospectus outstanding under any of the foregoing registration statements, (2)�the registration statement of UBS Group AG on Form F-4 (Registration Number 333-199011) and into each prospectus outstanding thereunder, (3)�any outstanding offering circular or similar document issued or authorized by UBS�AG that incorporates by reference any Form�6-K�s of UBS�AG that are incorporated into its registration statements filed with the SEC, and (4)�the base prospectus of Corporate Asset Backed Corporation (�CABCO�) dated June�23, 2004 (Registration Number�333-111572), the Form�8-K of CABCO filed and dated June�23, 2004 (SEC�File Number�001-13444), and the Prospectus Supplements relating to the CABCO Series�2004-101 Trust dated May�10, 2004 and May�17, 2004 (Registration Number�033-91744 and 033-91744-05).
SIGNATURES
Pursuant to the requirements of the Securities Exchange Act of 1934, the registrant has duly caused this report to be signed on its behalf by the undersigned, thereunto duly authorized.
�
| UBS AG | ||
| By: | � | /s/ David Kelly |
| Name: | � | David Kelly |
| Title: | � | Managing Director |
| By: | � | /s/ Sarah M. Starkweather |
| Name: | � | Sarah M. Starkweather |
| Title: | � | Executive Director |
| UBS Group AG | ||
| By: | � | /s/ David Kelly |
| Name: | � | David Kelly |
| Title: | � | Managing Director |
| By: | � | /s/ Sarah M. Starkweather |
| Name: | � | Sarah M. Starkweather |
| Title: | � | Executive Director |
Date: October�28, 2014
Serious News for Serious Traders! Try StreetInsider.com Premium Free!
You May Also Be Interested In
- UBS AG (UBSG:SW) (UBS) PT Lowered to CHF28 at RBC Capital
- UBS Group AG (UBSG:SW) (UBS) PT Raised to CHF21 at Barclays
- Citi Downgrades UBS AG (UBSG:SW) (UBS) to Neutral
Create E-mail Alert Related Categories
SEC FilingsRelated Entities
UBSSign up for StreetInsider Free!
Receive full access to all new and archived articles, unlimited portfolio tracking, e-mail alerts, custom newswires and RSS feeds - and more!
