

Form 6-K NOMURA HOLDINGS INC For: Feb 09
 Tweet
Tweet Share
ShareTable of Contents
FORM 6-K
U.S. SECURITIES AND EXCHANGE COMMISSION
Washington, D.C. 20549
Report of Foreign Private Issuer
Pursuant to Rule 13a-16 or 15d-16 of
the Securities Exchange Act of 1934
Commission File Number: 1-15270
For the month of February 2016
NOMURA HOLDINGS, INC.
(Translation of registrant’s name into English)
9-1, Nihonbashi 1-chome
Chuo-ku, Tokyo 103-8645
Japan
(Address of principal executive offices)
Indicate by check mark whether the registrant files or will file annual reports under cover Form 20-F or Form 40-F.
Form 20-F X Form 40-F
Indicate by check mark if the registrant is submitting the Form 6-K in paper as permitted by Regulation S-T Rule 101(b)(1):
Indicate by check mark if the registrant is submitting the Form 6-K in paper as permitted by Regulation S-T Rule 101(b)(7):
Table of Contents
Information furnished on this form:
Exhibit Number
| 1. | Consolidated Results of Operations (US GAAP), Third quarter, year ending March 2016 |
Table of Contents
SIGNATURES
Pursuant to the requirements of the Securities Exchange Act of 1934, the registrant has duly caused this report to be signed on its behalf by the undersigned, thereunto duly authorized.
| NOMURA HOLDINGS, INC. | ||||
| Date: February 9, 2016 | By: | /s/ Hajime Ikeda | ||
| Hajime Ikeda | ||||
| Senior Managing Director | ||||
Table of Contents
© Nomura Consolidated Results of Operations Third quarter, year ending March 2016 (US GAAP) February 2016 Nomura Holdings, Inc.
Table of Contents
|
|
Outline Presentation Financial Supplement Executive summary (p. 2) Overview of results (p. 3) Business segment results (p. 4) Retail (p. 5-6) Asset Management (p. 7-8) Wholesale (p. 9-11) Non-interest expenses (p. 12) Robust financial position (p. 13) Funding and liquidity (p. 14) Consolidated balance sheet (p.16) Value at risk (p.17) Consolidated financial highlights (p. 18) Consolidated income (p. 19) Main revenue items (p. 20) Consolidated results: Income (loss) before income taxes by segment and region (p. 21) Segment “Other” (p.22) Retail related data (p. 23-26) Asset Management related data (p. 27-28) Wholesale related data (p. 29-30) Number of employees (p. 31)
Table of Contents
|
|
Executive summary
Highlights
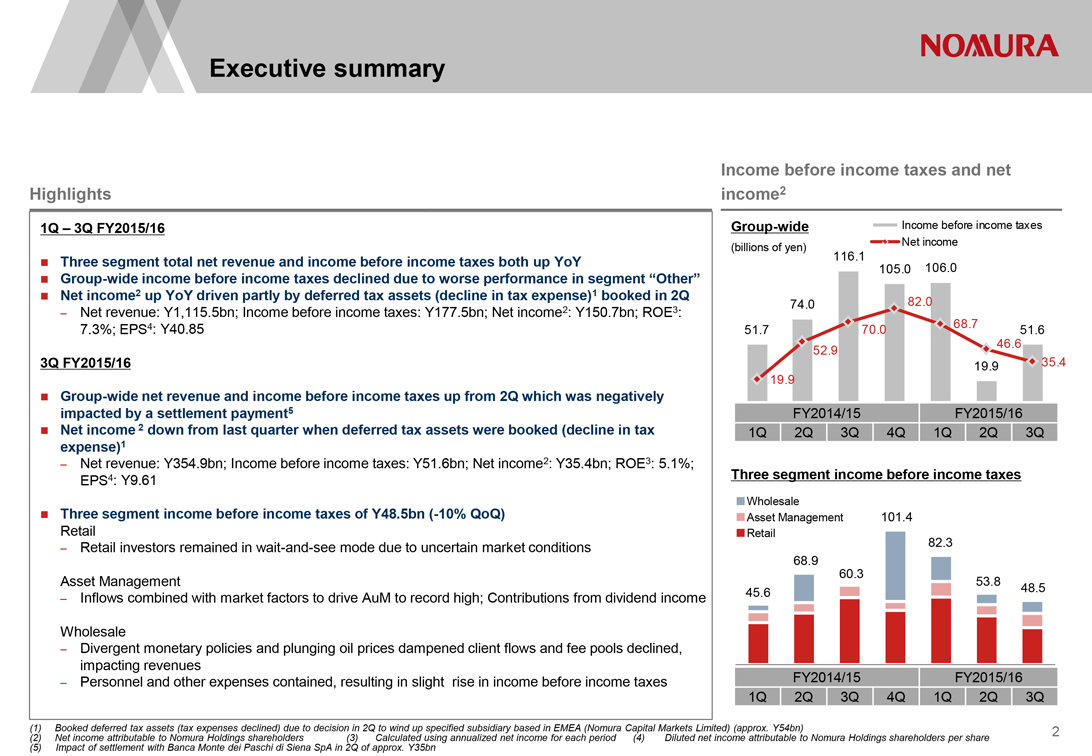
1Q – 3Q FY2015/16
Three segment total net revenue and income before income taxes both up YoY
Group-wide income before income taxes declined due to worse performance in segment “Other” ? Net income2 up YoY driven partly by deferred tax assets (decline in tax expense)1 booked in 2Q
– Net revenue: Y1,115.5bn; Income before income taxes: Y177.5bn; Net income2: Y150.7bn; ROE3: 7.3%; EPS4: Y40.85
3Q FY2015/16
Group-wide net revenue and income before income taxes up from 2Q which was negatively impacted by a settlement payment5 ? Net income 2 down from last quarter when deferred tax assets were booked (decline in tax expense)1
– Net revenue: Y354.9bn; Income before income taxes: Y51.6bn; Net income2: Y35.4bn; ROE3: 5.1%; EPS4: Y9.61
Three segment income before income taxes of Y48.5bn (-10% QoQ)
Retail
– Retail investors remained in wait-and-see mode due to uncertain market conditions
Asset Management
– Inflows combined with market factors to drive AuM to record high; Contributions from dividend income
Wholesale
– Divergent monetary policies and plunging oil prices dampened client flows and fee pools declined, impacting revenues
– Personnel and other expenses contained, resulting in slight rise in income before income taxes
Income before income taxes and net income2
Group-wide Income before income taxes
(billions of yen) Net income
116.1
105.0 106.0
74.0 82.0
51.7 70.0 68.7 51.6
52.9 46.6
19.9 35.4
19.9
FY2014/15 FY2015/16
1Q 2Q 3Q 4Q 1Q 2Q 3Q
Three segment income before income taxes
Wholesale
Asset Management
101.4
Retail
82.3
68.9
60.3
45.6
53.8 48.5
FY2014/15
FY2015/16
1Q
2Q-
3Q
4Q
1Q
2Q
3Q
(1) Booked deferred tax assets (tax expenses declined) due to decision in 2Q to wind up specified subsidiary based in EMEA (Nomura Capital Markets Limited) (approx. Y54bn)
(2) Net income attributable to Nomura Holdings shareholders (3) Calculated using annualized net income for each period (4) Diluted net income attributable to Nomura Holdings shareholders per share 2 (5) Impact of settlement with Banca Monte dei Paschi di Siena SpA in 2Q of approx. Y35bn
| 2 |
|
Table of Contents
|
|
Overview of results
Highlights
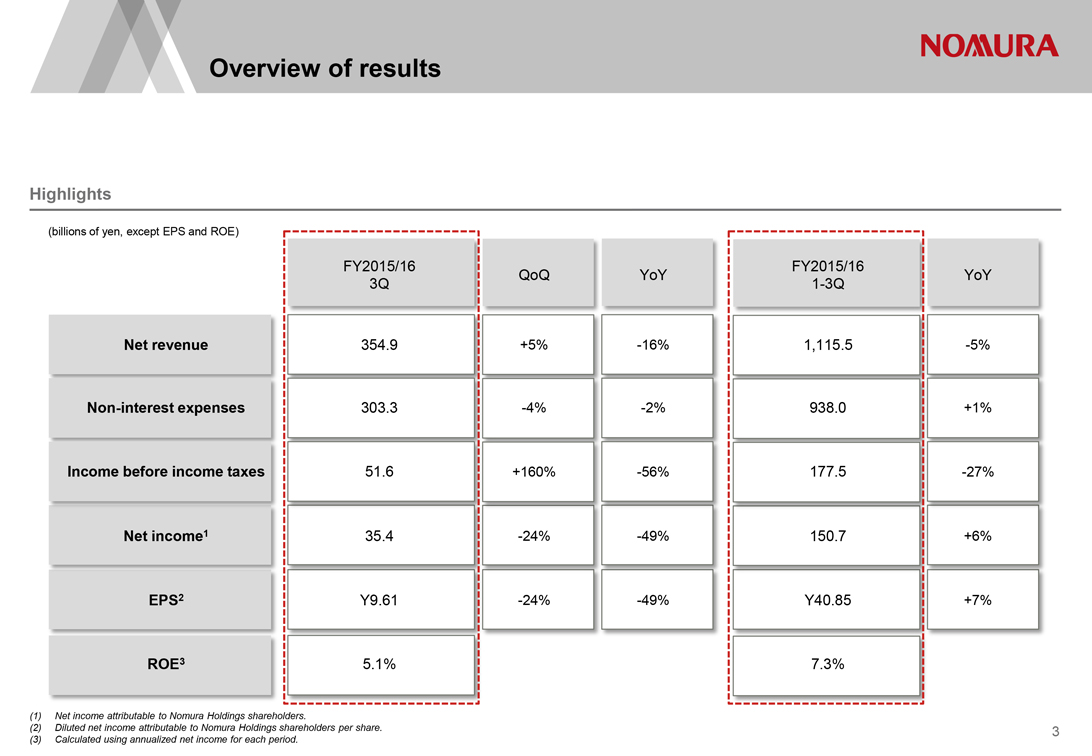
(billions of yen, except EPS and ROE)
FY2015/16 FY2015/16
QoQ YoY YoY
3Q 1-3Q
Net revenue 354.9 +5% -16% 1,115.5 -5%
Non-interest expenses 303.3 -4% -2% 938.0 +1%
Income before income taxes 51.6 +160% -56% 177.5 -27%
Net income1 35.4 -24% -49% 150.7 +6%
EPS2 Y9.61 -24% -49% Y40.85 +7%
ROE3 5.1% 7.3%
| (1) |
|
Net income attributable to Nomura Holdings shareholders. |
| (2) |
|
Diluted net income attributable to Nomura Holdings shareholders per share. |
| (3) |
|
Calculated using annualized net income for each period. |
| 3 |
|
Table of Contents
|
|
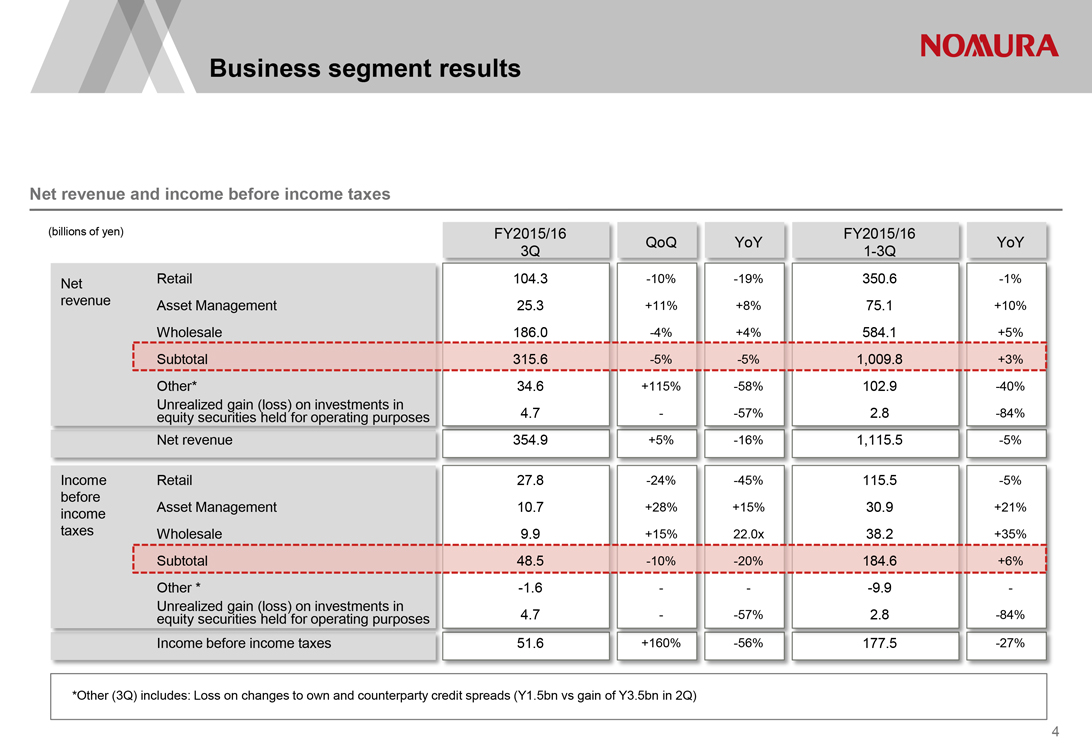
Business segment results
Net revenue and income before income taxes
(billions of yen) FY2015/16 FY2015/16
QoQ YoY YoY
3Q 1-3Q
Net Retail 104.3 -10% -19% 350.6 -1%
revenue Asset Management 25.3 +11% +8% 75.1 +10%
Wholesale 186.0 -4% +4% 584.1 +5%
Subtotal 315.6 -5% -5% 1,009.8 +3%
Other* 34.6 +115% -58% 102.9 -40%
Unrealized gain (loss) on investments in
equity securities held for operating purposes 4.7 — -57% 2.8 -84%
Net revenue 354.9 +5% -16% 1,115.5 -5%
Income Retail 27.8 -24% -45% 115.5 -5%
before
income Asset Management 10.7 +28% +15% 30.9 +21%
taxes Wholesale 9.9 +15% 22.0x 38.2 +35%
Subtotal 48.5 -10% -20% 184.6 +6%
Other * -1.6 —— -9.9 —
Unrealized gain (loss) on investments in
equity securities held for operating purposes 4.7 — -57% 2.8 -84%
Income before income taxes 51.6 +160% -56% 177.5 -27%
*Other (3Q) includes: Loss on changes to own and counterparty credit spreads (Y1.5bn vs gain of Y3.5bn in 2Q)
| 4 |
|
Table of Contents
|
|
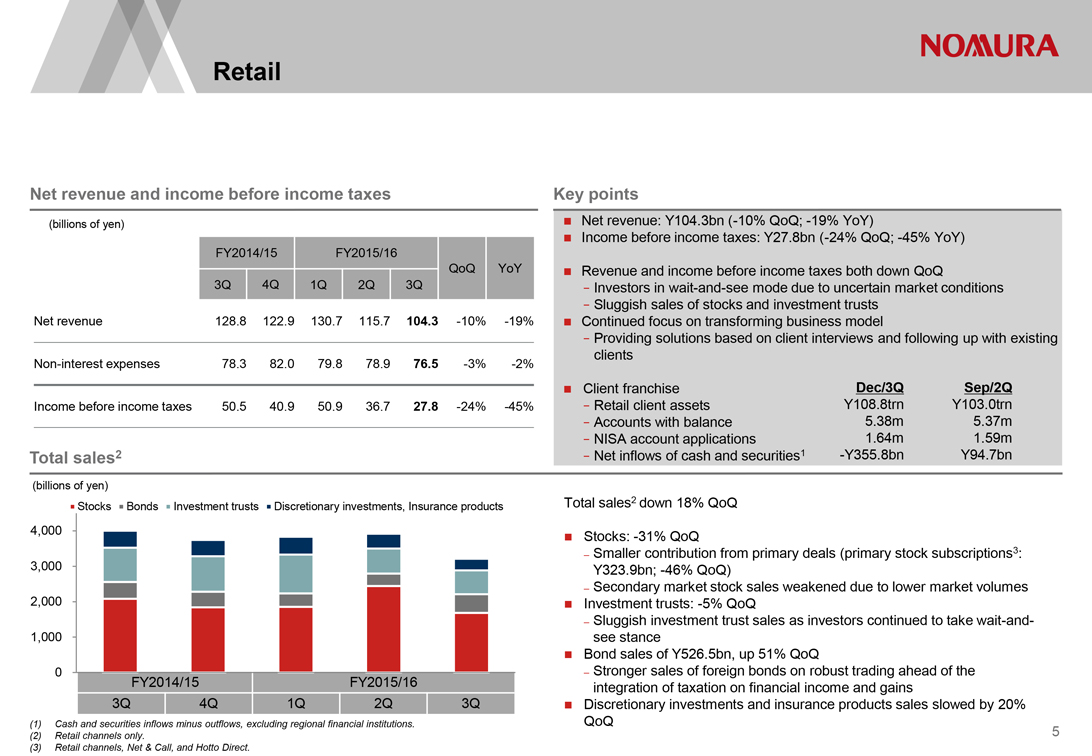
Retail
Net revenue and income before income taxes
(billions of yen)
FY2014/15 FY2015/16
QoQ YoY
3Q 4Q 1Q 2Q 3Q
Net revenue 128.8 122.9 130.7 115.7 104.3 -10% -19%
Non-interest expenses 78.3 82.0 79.8 78.9 76.5 -3% -2%
Income before income taxes 50.5 40.9 50.9 36.7 27.8 -24% -45%
Cash and securities inflows minus outflows, excluding regional financial institutions.
Retail channels only.
Retail channels, Net & Call, and Hotto Direct.
Total sales2
(billions of yen)
Stocks Bonds Investment trusts Discretionary investments, Insurance products
4,000
3,000
2,000
1,000
0
FY2014/15 FY2015/16
3Q 4Q 1Q 2Q 3Q
Key points
Net revenue: Y104.3bn (-10% QoQ; -19% YoY)
Income before income taxes: Y27.8bn (-24% QoQ; -45% YoY)
Revenue and income before income taxes both down QoQ
—Investors in wait-and-see mode due to uncertain market conditions
—Sluggish sales of stocks and investment trusts
Continued focus on transforming business model
—Providing solutions based on client interviews and following up with existing
clients
Client franchise Dec/3Q Sep/2Q
—Retail client assets Y108.8trn Y103.0trn
—Accounts with balance 5.38m 5.37m
—NISA account applications 1.64m 1.59m
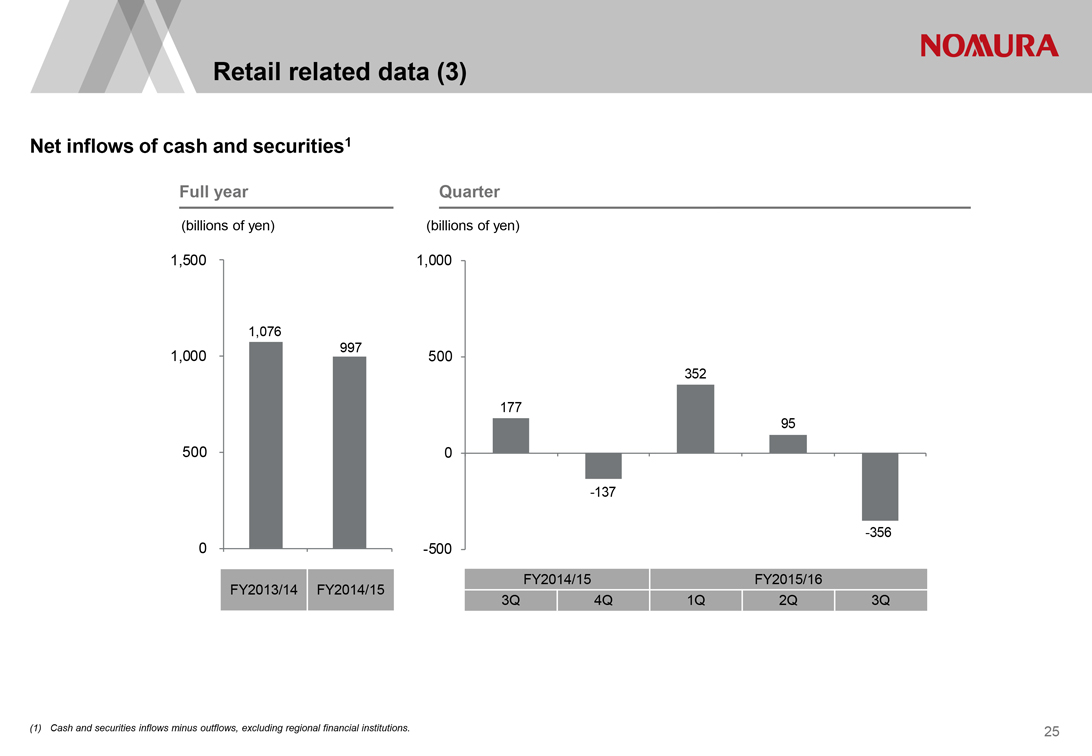
—Net inflows of cash and securities1 -Y355.8bn Y94.7bn
Total sales2 down 18% QoQ
Stocks: -31% QoQ
– Smaller contribution from primary deals (primary stock subscriptions3: Y323.9bn; -46% QoQ)
– Secondary market stock sales weakened due to lower market volumes ? Investment trusts: -5% QoQ
– Sluggish investment trust sales as investors continued to take wait-and-see stance ? Bond sales of Y526.5bn, up 51% QoQ
– Stronger sales of foreign bonds on robust trading ahead of the integration of taxation on financial income and gains ? Discretionary investments and insurance products sales slowed by 20% QoQ
| 5 |
|
Table of Contents
|
|
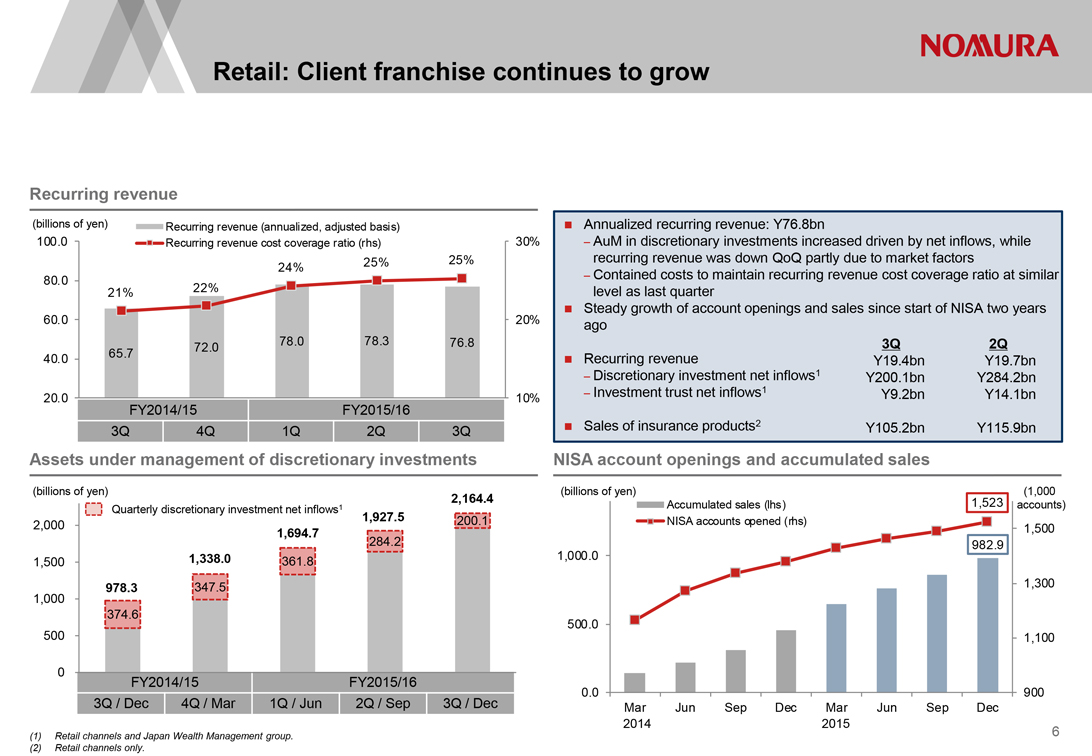
Retail: Client franchise continues to grow
Recurring revenue
(billions of yen) Recurring revenue (annualized, adjusted basis)
100.0 Recurring revenue cost coverage ratio (rhs) 30%
24% 25% 25%
80.0
21% 22%
60.0 20%
72.0 78.0 78.3 76.8
40.0 65.7
20.0 10%
FY2014/15 FY2015/16
3Q 4Q 1Q 2Q 3Q
Assets under management of discretionary investments
(billions of yen) 2,164.4
Quarterly discretionary investment net inflows1
2,000 1,927.5 200.1
1,694.7 284.2
1,500 1,338.0 361.8
978.3 347.5
1,000
374.6
500
0 FY2014/15 FY2015/16
3Q / Dec 4Q / Mar 1Q / Jun 2Q / Sep 3Q / Dec
| (1) |
|
Retail channels and Japan Wealth Management group. |
| (2) |
|
Retail channels only. |
Annualized recurring revenue: Y76.8bn
– AuM in discretionary investments increased driven by net inflows, while
recurring revenue was down QoQ partly due to market factors
– Contained costs to maintain recurring revenue cost coverage ratio at similar
level as last quarter
Steady growth of account openings and sales since start of NISA two years
ago
3Q 2Q
Recurring revenue Y19.4bn Y19.7bn
– Discretionary investment net inflows1 Y200.1bn Y284.2bn
– Investment trust net inflows1 Y9.2bn Y14.1bn
Sales of insurance products2 Y105.2bn Y115.9bn
NISA account openings and accumulated sales
(billions of yen) (1,000
Accumulated sales (lhs) 1,523 accounts)
NISA accounts opened (rhs) 1,500
982.9
1,000.0
1,300
500.0
1,100
0.0 900
Mar Jun Sep Dec Mar Jun Sep Dec
2014 2015
| 6 |
|
Table of Contents
|
|
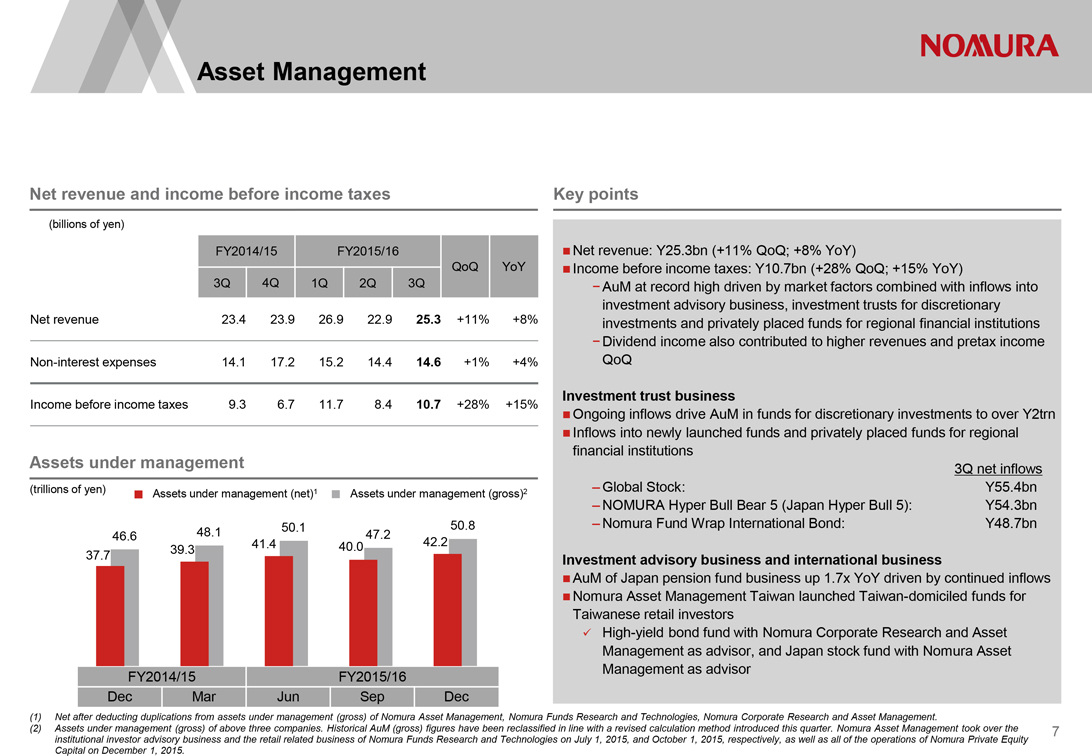
Asset Management
Net revenue and income before income taxes
(billions of yen)
FY2014/15 FY2015/16
QoQ YoY
3Q 4Q 1Q 2Q 3Q
Net revenue 23.4 23.9 26.9 22.9 25.3 +11% +8%
Non-interest expenses 14.1 17.2 15.2 14.4 14.6 +1% +4%
Income before income taxes 9.3 6.7 11.7 8.4 10.7 +28% +15%
Assets under management
(trillions of yen) Assets under management (net)1 Assets under management (gross)2
46.6 48.1 50.1 47.2 50.8
39.3 41.4 40.0 42.2
37.7
FY2014/15 FY2015/16
(1) Net after deducting duplications from assets under management (gross) of Nomura Asset Management, Nomura Funds Research and Technologies, Nomura Corporate Research and Asset Management.
(2) Assets under management (gross) of above three companies. Historical AuM (gross) figures have been reclassified in line with a revised calculation method introduced this quarter. Nomura Asset Management took over the institutional investor advisory business and the retail related business of Nomura Funds Research and Technologies on July 1, 2015, and October 1, 2015, respectively, as well as all of the operations of Nomura Private Equity Capital on December 1, 2015.
Key points
Net revenue: Y25.3bn (+11% QoQ; +8% YoY)
Income before income taxes: Y10.7bn (+28% QoQ; +15% YoY)
- AuM at record high driven by market factors combined with inflows into
investment advisory business, investment trusts for discretionary
investments and privately placed funds for regional financial institutions
- Dividend income also contributed to higher revenues and pretax income
QoQ
Investment trust business
Ongoing inflows drive AuM in funds for discretionary investments to over Y2trn
Inflows into newly launched funds and privately placed funds for regional
financial institutions
3Q net inflows
– Global Stock: Y55.4bn
– NOMURA Hyper Bull Bear 5 (Japan Hyper Bull 5): Y54.3bn
– Nomura Fund Wrap International Bond: Y48.7bn
Investment advisory business and international business
AuM of Japan pension fund business up 1.7x YoY driven by continued inflows
Nomura Asset Management Taiwan launched Taiwan-domiciled funds for
Taiwanese retail investors
High-yield bond fund with Nomura Corporate Research and Asset
Management as advisor, and Japan stock fund with Nomura Asset
Management as advisor
| 7 |
|
Table of Contents
|
|
Asset Management: International business growth
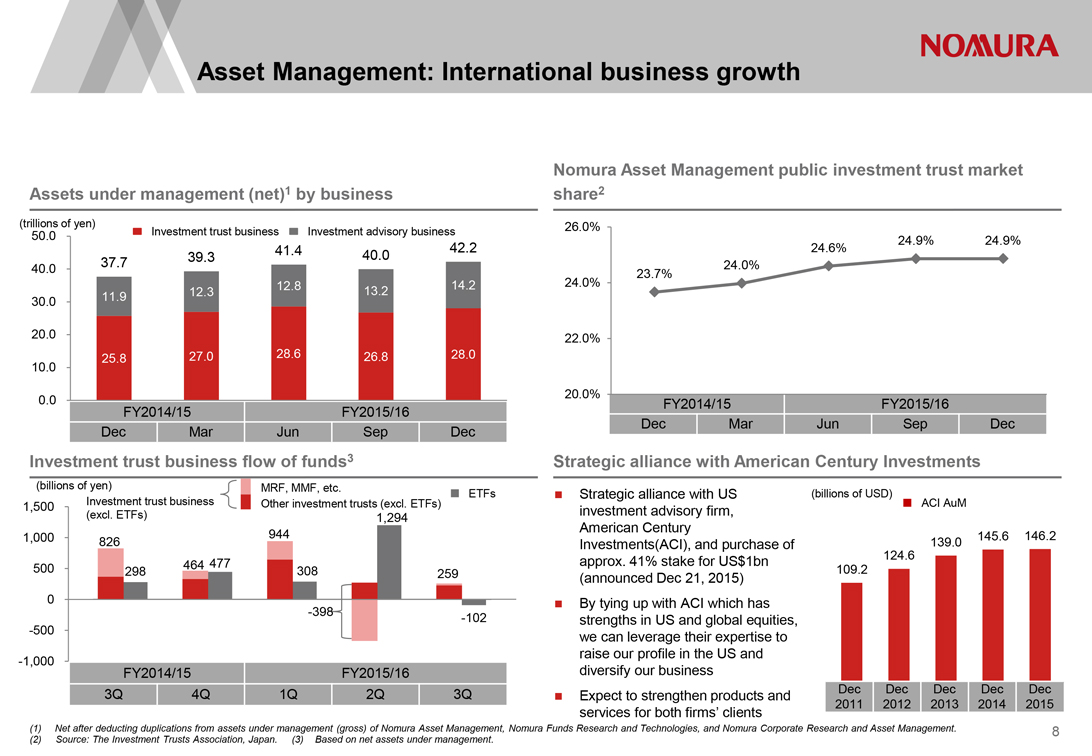
Assets under management (net)1 by business
(trillions of yen)
50.0 Investment trust business Investment advisory business
39.3 41.4 40.0 42.2
40.0 37.7
12.3 12.8 13.2 14.2
30.0 11.9
20.0
10.0 25.8 27.0 28.6 26.8 28.0
0.0
FY2014/15 FY2015/16
Dec Mar Jun Sep Dec
Investment trust business flow of funds3
(billions of yen) MRF, MMF, etc. ETFs
1,500 Investment trust business Other investment trusts (excl. ETFs)
(excl. ETFs) 1,294
1,000 826 944
500 298 464 477 308 259
0
-398 -102
-500
-1,000
FY2014/15 FY2015/16
3Q 4Q 1Q 2Q 3Q
(1) Net after deducting duplications from assets under management (gross) of Nomura Asset Management, Nomura Funds Research and Technologies, and Nomura Corporate Research and Asset Management. (2) Source: The Investment Trusts Association, Japan. (3) Based on net assets under management.
Nomura Asset Management public investment trust market
share2
26.0%
24.6% 24.9% 24.9%
24.0%
24.0% 23.7%
22.0%
20.0% FY2014/15 FY2015/16
Dec Mar Jun Sep Dec
Strategic alliance with American Century Investments
Strategic alliance with US (billions of USD)
investment advisory firm, ACI AuM
American Century
Investments(ACI), and purchase of 139.0 145.6 146.2
approx. 41% stake for US$1bn 124.6
(announced Dec 21, 2015) 109.2
By tying up with ACI which has
strengths in US and global equities,
we can leverage their expertise to
raise our profile in the US and
diversify our business
Expect to strengthen products and Dec Dec Dec Dec Dec
services for both firms’ clients 2011 2012 2013 2014 2015
| 8 |
|
Table of Contents
|
|
Wholesale
Net revenue and income before income taxes
(billions of yen)
FY2014/15 FY2015/16
QoQ YoY
3Q 4Q 1Q 2Q 3Q
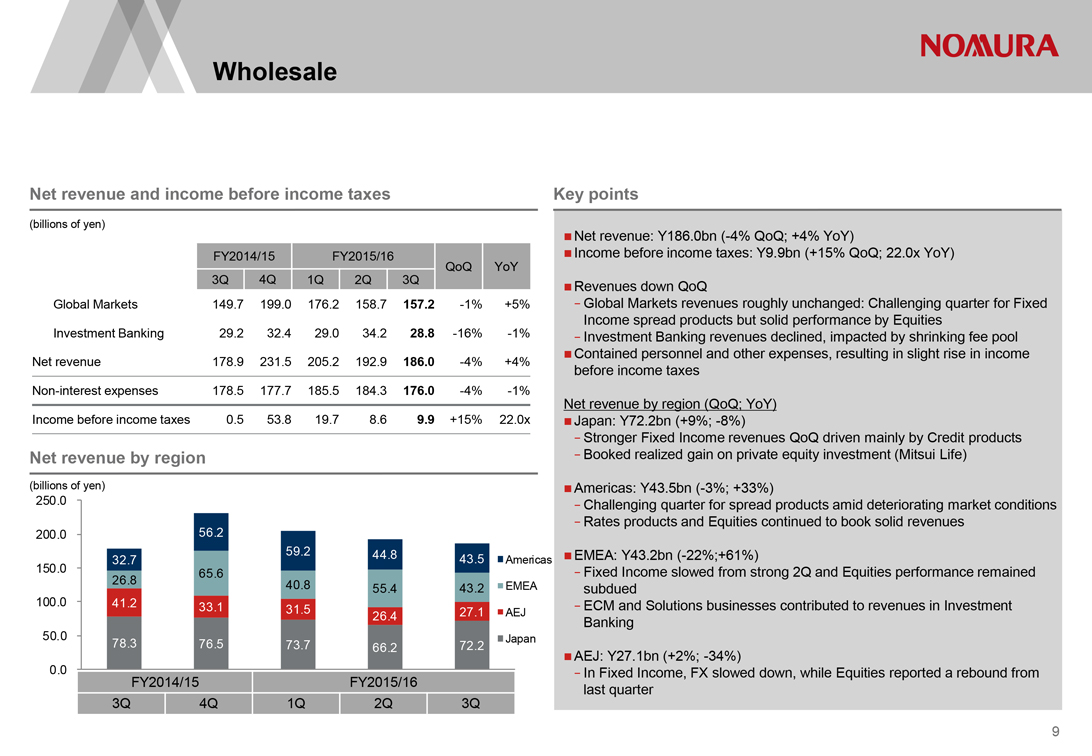
Global Markets 149.7 199.0 176.2 158.7 157.2 -1% +5%
Investment Banking 29.2 32.4 29.0 34.2 28.8 -16% -1%
Net revenue 178.9 231.5 205.2 192.9 186.0 -4% +4%
Non-interest expenses 178.5 177.7 185.5 184.3 176.0 -4% -1%
Income before income taxes 0.5 53.8 19.7 8.6 9.9 +15% 22.0x
Net revenue by region
(billions of yen)
250.0
200.0 56.2
32.7 59.2 44.8 43.5 Americas
150.0 65.6
26.8 40.8 55.4 43.2 EMEA
100.0 41.2 33.1 31.5 26.4 27.1 AEJ
50.0 78.3 76.5 73.7 66.2 72.2 Japan
0.0
FY2014/15 FY2015/16
3Q 4Q 1Q 2Q 3Q
Key points
Net revenue: Y186.0bn (-4% QoQ; +4% YoY)
Income before income taxes: Y9.9bn (+15% QoQ; 22.0x YoY)
Revenues down QoQ
- Global Markets revenues roughly unchanged: Challenging quarter for Fixed Income spread products but solid performance by Equities
- Investment Banking revenues declined, impacted by shrinking fee pool ?Contained personnel and other expenses, resulting in slight rise in income before income taxes
Net revenue by region (QoQ; YoY) ?Japan: Y72.2bn (+9%; -8%)
- Stronger Fixed Income revenues QoQ driven mainly by Credit products
- Booked realized gain on private equity investment (Mitsui Life)
Americas: Y43.5bn (-3%; +33%)
- Challenging quarter for spread products amid deteriorating market conditions
- Rates products and Equities continued to book solid revenues
EMEA: Y43.2bn (-22%;+61%)
- Fixed Income slowed from strong 2Q and Equities performance remained subdued
- ECM and Solutions businesses contributed to revenues in Investment Banking
AEJ: Y27.1bn (+2%; -34%)
- In Fixed Income, FX slowed down, while Equities reported a rebound from last quarter
9
Table of Contents
|
|
Wholesale: Global Markets
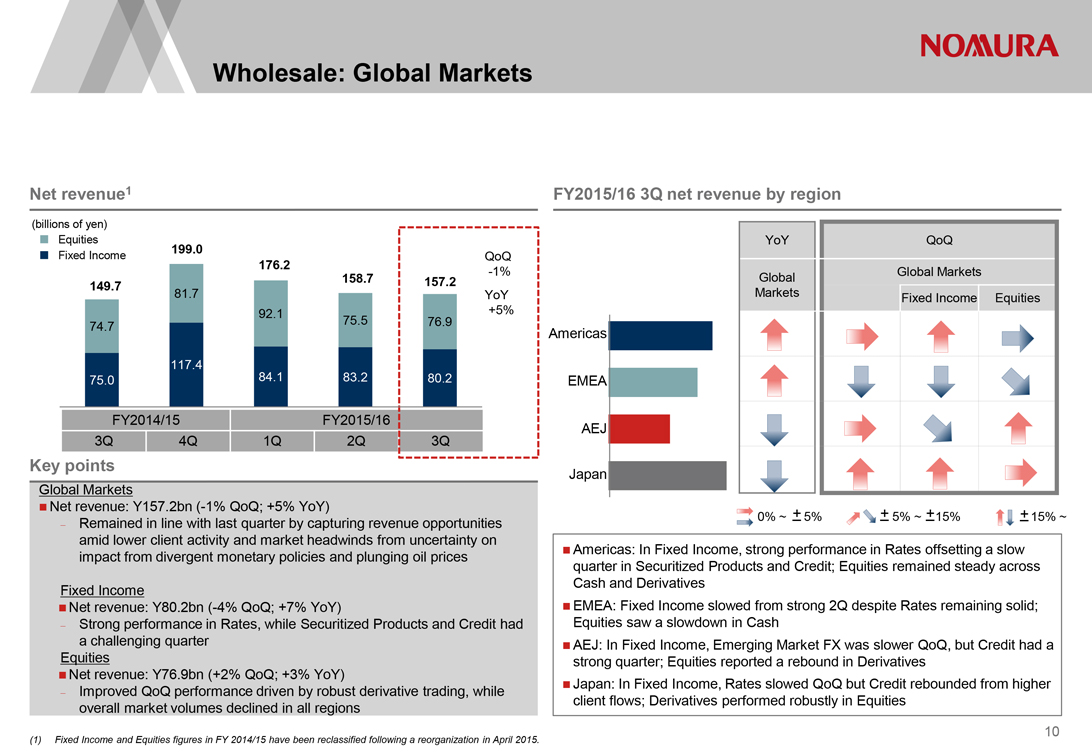
Net revenue1
(billions of yen)
Equities
199.0
Fixed Income QoQ
176.2 -1%
149.7 158.7 157.2
81.7 YoY
92.1 +5%
74.7 75.5 76.9
117.4
75.0 84.1 83.2 80.2
FY2014/15 FY2015/16
3Q 4Q 1Q 2Q 3Q
Key points
Global Markets
Net revenue: Y157.2bn (-1% QoQ; +5% YoY)
- Remained in line with last quarter by capturing revenue opportunities
amid lower client activity and market headwinds from uncertainty on
impact from divergent monetary policies and plunging oil prices
Fixed Income
Net revenue: Y80.2bn (-4% QoQ; +7% YoY)
- Strong performance in Rates, while Securitized Products and Credit had
a challenging quarter
Equities
Net revenue: Y76.9bn (+2% QoQ; +3% YoY)
- Improved QoQ performance driven by robust derivative trading, while
overall market volumes declined in all regions
| (1) |
|
Fixed Income and Equities figures in FY 2014/15 have been reclassified following a reorganization in April 2015. |
FY2015/16 3Q net revenue by region
YoY QoQ
Global Global Markets
Markets Fixed Income Equities
Americas
EMEA
AEJ
Japan
0% ~ – + 5% – + 5% ~ – +15% – + 15% ~
Americas: In Fixed Income, strong performance in Rates offsetting a slow
quarter in Securitized Products and Credit; Equities remained steady across
Cash and Derivatives
EMEA: Fixed Income slowed from strong 2Q despite Rates remaining solid;
Equities saw a slowdown in Cash
AEJ: In Fixed Income, Emerging Market FX was slower QoQ, but Credit had a
strong quarter; Equities reported a rebound in Derivatives
Japan: In Fixed Income, Rates slowed QoQ but Credit rebounded from higher
client flows; Derivatives performed robustly in Equities
10
Table of Contents
|
|
Wholesale: Investment Banking
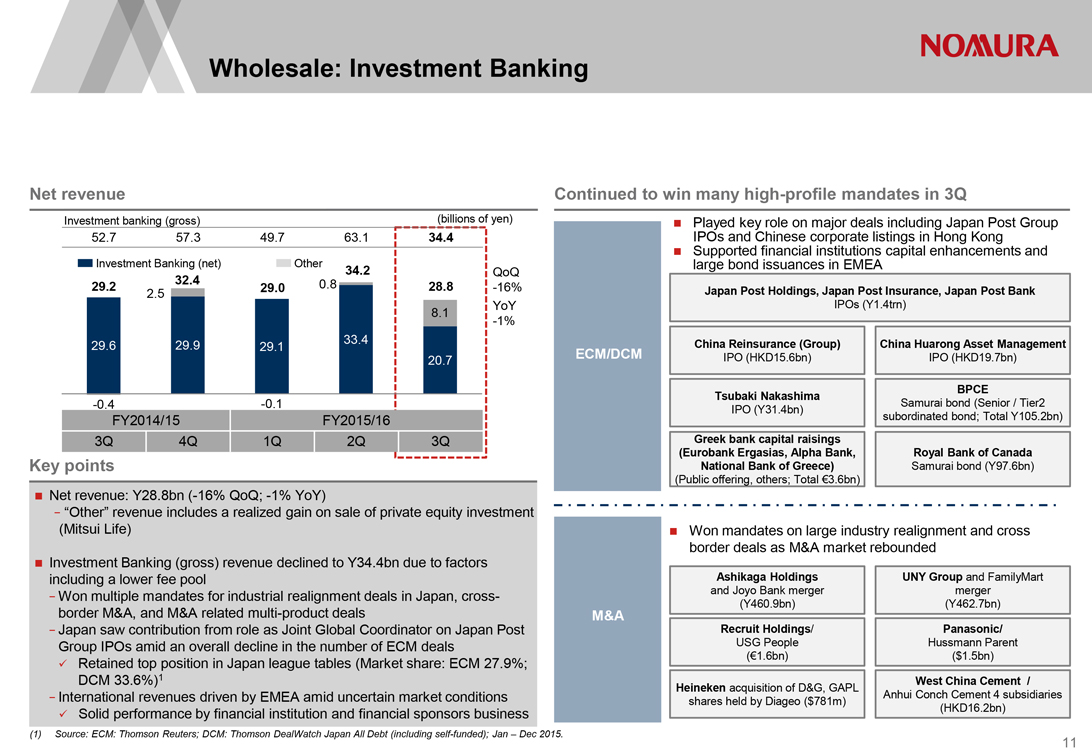
Net revenue
Investment banking (gross) (billions of yen)
52.7 57.3 49.7 63.1 34.4
Investment Banking (net) Other 34.2 QoQ
29.2 32.4 29.0 0.8 28.8 -16%
2.5
8.1 YoY
-1%
29.6 29.9 29.1 33.4
20.7
-0.4 -0.1
FY2014/15 FY2015/16
3Q 4Q 1Q 2Q 3Q
Key points
? Net revenue: Y28.8bn (-16% QoQ; -1% YoY)
—“Other” revenue includes a realized gain on sale of private equity investment
(Mitsui Life)
Investment Banking (gross) revenue declined to Y34.4bn due to factors
including a lower fee pool
—Won multiple mandates for industrial realignment deals in Japan, cross-
border M&A, and M&A related multi-product deals
—Japan saw contribution from role as Joint Global Coordinator on Japan Post
Group IPOs amid an overall decline in the number of ECM deals
Retained top position in Japan league tables (Market share: ECM 27.9%;
DCM 33.6%)1
—International revenues driven by EMEA amid uncertain market conditions
Solid performance by financial institution and financial sponsors business
| (1) |
|
Source: ECM: Thomson Reuters; DCM: Thomson DealWatch Japan All Debt (including self-funded); Jan – Dec 2015. |
Continued to win many high-profile mandates in 3Q
Played key role on major deals including Japan Post Group
IPOs and Chinese corporate listings in Hong Kong
Supported financial institutions capital enhancements and
large bond issuances in EMEA
Japan Post Holdings, Japan Post Insurance, Japan Post Bank
IPOs (Y1.4trn)
China Reinsurance (Group)
China Huarong Asset Management
ECM/DCM
IPO (HKD15.6bn)
IPO (HKD19.7bn)
Tsubaki Nakashima
BPCE
Samurai bond (Senior / Tier2
IPO (Y31.4bn)
subordinated bond; Total Y105.2bn)
Greek bank capital raisings
(Eurobank Ergasias, Alpha Bank,
Royal Bank of Canada
National Bank of Greece)
Samurai bond (Y97.6bn)
(Public offering, others; Total €3.6bn)
Won mandates on large industry realignment and cross
border deals as M&A market rebounded
Ashikaga Holdings
UNY Group and FamilyMart
and Joyo Bank merger
merger
(Y460.9bn)
(Y462.7bn)
M&A
Recruit Holdings/
Panasonic/
USG People
Hussmann Parent
(€1.6bn)
($1.5bn)
Heineken acquisition of D&G, GAPL
West China Cement /
Anhui Conch Cement 4 subsidiaries
shares held by Diageo ($781m)
(HKD16.2bn)
11
Table of Contents
|
|
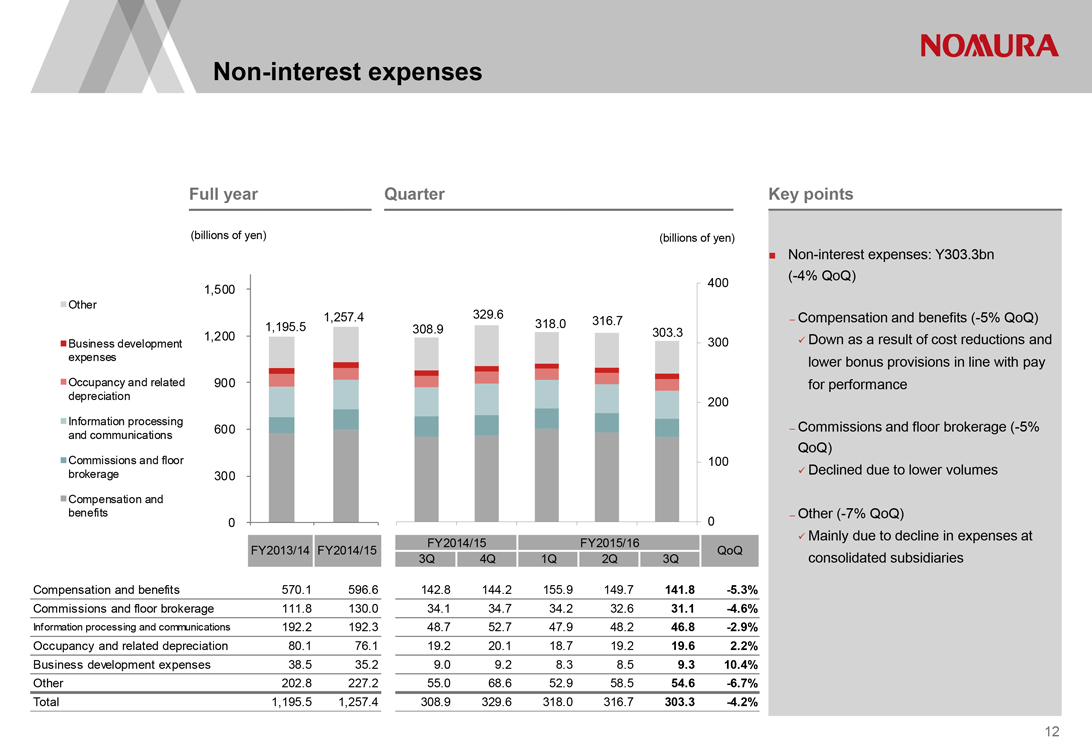
Non-interest expenses
Full year Quarter
(billions of yen) (billions of yen)
1,500 400
Other
1,195.5 1,257.4 308.9 329.6 318.0 316.7 303.3
1,200
Business development 300
expenses
Occupancy and related 900
depreciation 200
Information processing
and communications 600
Commissions and floor 100
brokerage 300
Compensation and
benefits 0 0
FY2014/15 FY2015/16
FY2013/14 FY2014/15 QoQ
3Q 4Q 1Q 2Q 3Q
Compensation and benefits 570.1 596.6 142.8 144.2 155.9 149.7 141.8 -5.3%
Commissions and floor brokerage 111.8 130.0 34.1 34.7 34.2 32.6 31.1 -4.6%
Information processing and communications 192.2 192.3 48.7 52.7 47.9 48.2 46.8 -2.9%
Occupancy and related depreciation 80.1 76.1 19.2 20.1 18.7 19.2 19.6 2.2%
Business development expenses 38.5 35.2 9.0 9.2 8.3 8.5 9.3 10.4%
Other 202.8 227.2 55.0 68.6 52.9 58.5 54.6 -6.7%
Total 1,195.5 1,257.4 308.9 329.6 318.0 316.7 303.3 -4.2%
Key points
Non-interest expenses: Y303.3bn (-4% QoQ)
– Compensation and benefits (-5% QoQ) ? Down as a result of cost reductions and lower bonus provisions in line with pay for performance
– Commissions and floor brokerage (-5% QoQ) ? Declined due to lower volumes
– Other (-7% QoQ)
Mainly due to decline in expenses at consolidated subsidiaries
12
Table of Contents
|
|
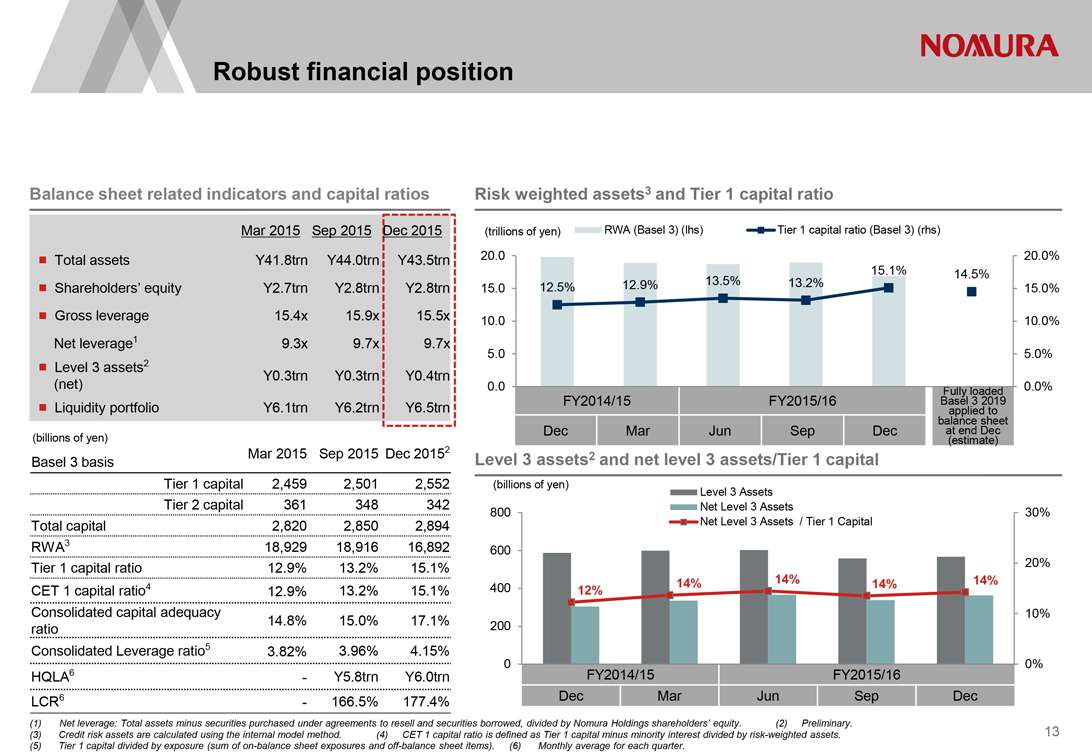
Robust financial position
Balance sheet related indicators and capital ratios
Mar 2015
Sep 2015
Dec 2015
Total assets
Y41.8trn
Y44.0trn
Y43.5trn
Shareholders’ equity
Y2.7trn
Y2.8trn
Y2.8trn
Gross leverage
15.4x
15.9x
15.5x
Net leverage1
9.3x
9.7x
9.7x
Level 3 assets2
(net)
Y0.3trn
Y0.3trn
Y0.4trn
Liquidity portfolio
Y6.1trn
Y6.2trn
Y6.5trn
(billions of yen)
Basel 3 basis
Mar 2015
Sep 2015
Dec 20152
Tier 1 capital
2,459
2,501
2,552
Tier 2 capital
361
348
342
Total capital
2,820
2,850
2,894
RWA3
18,929
18,916
16,892
Tier 1 capital ratio
12.9%
13.2%
15.1%
CET 1 capital ratio4
12.9%
13.2%
15.1%
Consolidated capital adequacy
ratio
14.8%
15.0%
17.1%
Consolidated Leverage ratio5
3.82%
3.96%
4.15%
HQLA6
-
Y5.8trn
Y6.0trn
LCR6
-
166.5%
177.4%
Risk weighted assets3 and Tier 1 capital ratio
(trillions of yen) RWA (Basel 3) (lhs) Tier 1 capital ratio (Basel 3) (rhs)
20.0 20.0%
15.1% 14.5%
15.0 12.5% 12.9% 13.5% 13.2% 15.0%
10.0 10.0%
5.0 5.0%
0.0 Fully loaded 0.0%
FY2014/15 FY2015/16 Basel 3 2019
applied to
balance sheet
Dec Mar Jun Sep Dec at end Dec
(estimate)
Level 3 assets2 and net level 3 assets/Tier 1 capital
(billions of yen) Level 3 Assets
800 Net Level 3 Assets 30%
Net Level 3 Assets / Tier 1 Capital
600
20%
400 12% 14% 14% 14% 14%
10%
200
0 0%
FY2014/15 FY2015/16
Dec Mar Jun Sep Dec
(1) Net leverage: Total assets minus securities purchased under agreements to resell and securities borrowed, divided by Nomura Holdings shareholders’ equity. (2) Preliminary.
(3) Credit risk assets are calculated using the internal model method. (4) CET 1 capital ratio is defined as Tier 1 capital minus minority interest divided by risk-weighted assets (5) Tier 1 capital divided by exposure (sum of on-balance sheet exposures and off-balance sheet items). (6) Monthly average for each quarter.
13
Table of Contents
|
|
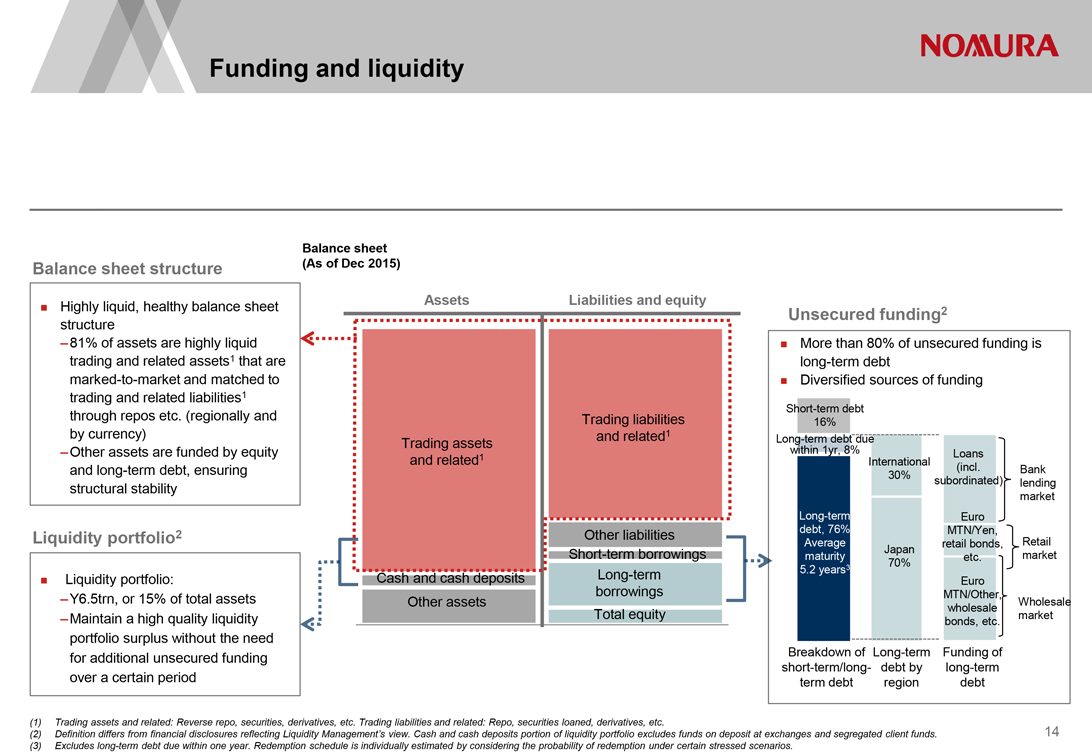
Funding and liquidity
Balance sheet
Balance sheet structure (As of Dec 2015)
Highly liquid, healthy balance sheet Assets Liabilities and equity
? Unsecured funding2
structure
– 81% of assets are highly liquid ? More than 80% of unsecured funding is
trading and related assets1 that are long-term debt
marked-to-market and matched to ? Diversified sources of funding
trading and related liabilities1
through repos etc. (regionally and Trading liabilities Short-term 16% debt
by currency) Trading assets and related1 Long-term debt due
– Other assets are funded by equity within 1yr, 8% Loans
and related1 International
and long-term debt, ensuring 30% (incl. Bank
structural stability subordinated) lending
market
Long-term Euro
debt, 76% MTN/Yen,
Liquidity portfolio2 Other liabilities Average retail bonds, Retail
Short-term borrowings maturity Japan etc. market
70%
Liquidity portfolio: Cash and cash deposits Long-term 5.2 years3 Euro
– Y6.5trn, or 15% of total assets Other assets borrowings MTN/Other, Wholesale
– Maintain a high quality liquidity Total equity bonds, wholesale etc. market
portfolio surplus without the need
for additional unsecured funding Breakdown of Long-term Funding of
short-term/long- debt by long-term
over a certain period term debt region debt
(1) Trading assets and related: Reverse repo, securities, derivatives, etc. Trading liabilities and related: Repo, securities loaned, derivatives, etc.
(2) Definition differs from financial disclosures reflecting Liquidity Management’s view. Cash and cash deposits portion of liquidity portfolio excludes funds on deposit at exchanges and segregated client funds.
(3) Excludes long-term debt due within one year. Redemption schedule is individually estimated by considering the probability of redemption under certain stressed scenarios.
14
Table of Contents
|
|

Financial Supplement
Table of Contents
|
|
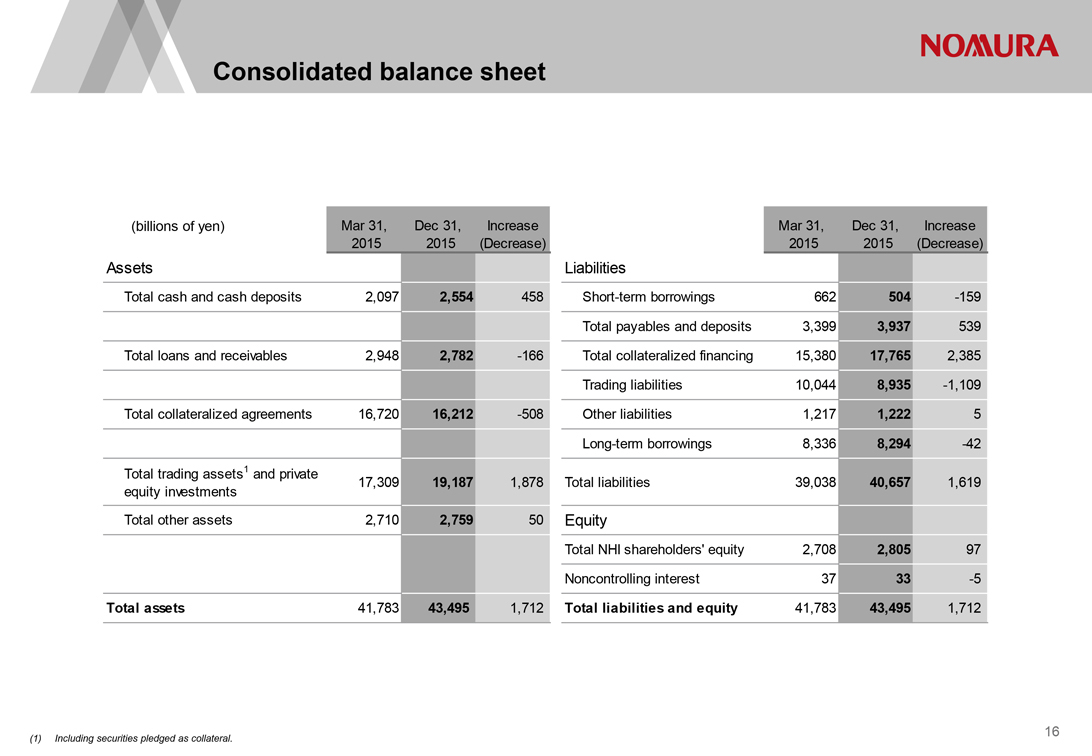
Consolidated balance sheet
(billions of yen) Mar 31, Dec 31, Increase Mar 31, Dec 31, Increase
2015 2015 (Decrease) 2015 2015 (Decrease)
Assets Liabilities
Total cash and cash deposits 2,097 2,554 458 Short-term borrowings 662 504 -159
Total payables and deposits 3,399 3,937 539
Total loans and receivables 2,948 2,782 -166 Total collateralized financing 15,380 17,765 2,385
Trading liabilities
10,044 8,935 -1,109
Total collateralized agreements 16,720 16,212 -508 Other liabilities 1,217 1,222 5
Long-term borrowings 8,336 8,294 -42
Total trading assets1 and private 17,309 19,187 1,878 Total liabilities 39,038 40,657 1,619
equity investments
Total other assets 2,710 2,759 50 Equity
Total NHI shareholders’ equity 2,708 2,805 97
Noncontrolling interest 37 33 -5
Total assets 41,783 43,495 1,712 Total liabilities and equity 41,783 43,495 1,712
| (1) |
|
Including securities pledged as collateral. |
16
Table of Contents
|
|
Nomura
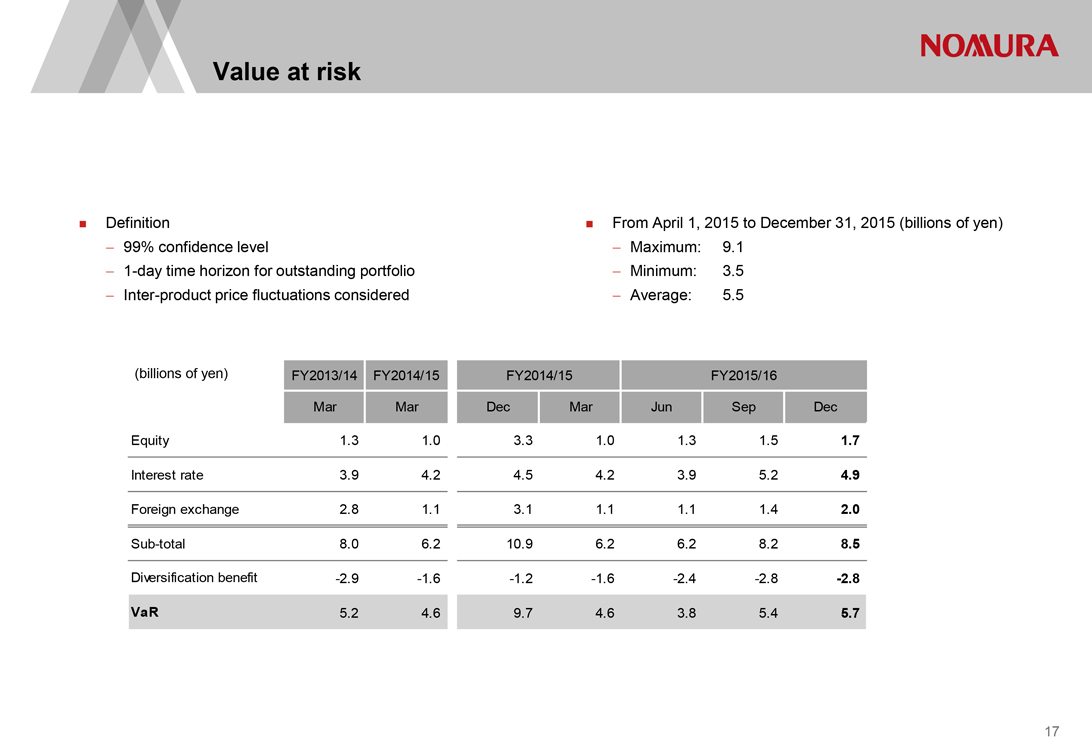
Value at risk
Definition
99% confidence level
1-day time horizon for outstanding portfolio
Inter-product price fluctuations considered
From April 1, 2015 to December 31, 2015 (billions of yen)
Maximum: 9.1
Minimum: 3.5
Average: 5.5
(billions of yen) FY2013/14 FY2014/15 FY2014/15 FY2015/16
Mar Mar Dec Mar Jun Sep Dec
Equity 1.3 1.0 3.3 1.0 1.3 1.5 1.7
Interest rate 3.9 4.2 4.5 4.2 3.9 5.2 4.9
Foreign exchange 2.8 1.1 3.1 1.1 1.1 1.4 2.0
Sub-total 8.0 6.2 10.9 6.2 6.2 8.2 8.5
Diversification benefit -2.9 -1.6 -1.2 -1.6 -2.4 -2.8 -2.8
VaR 5.2 4.6 9.7 4.6 3.8 5.4 5.7
17
Table of Contents
|
|
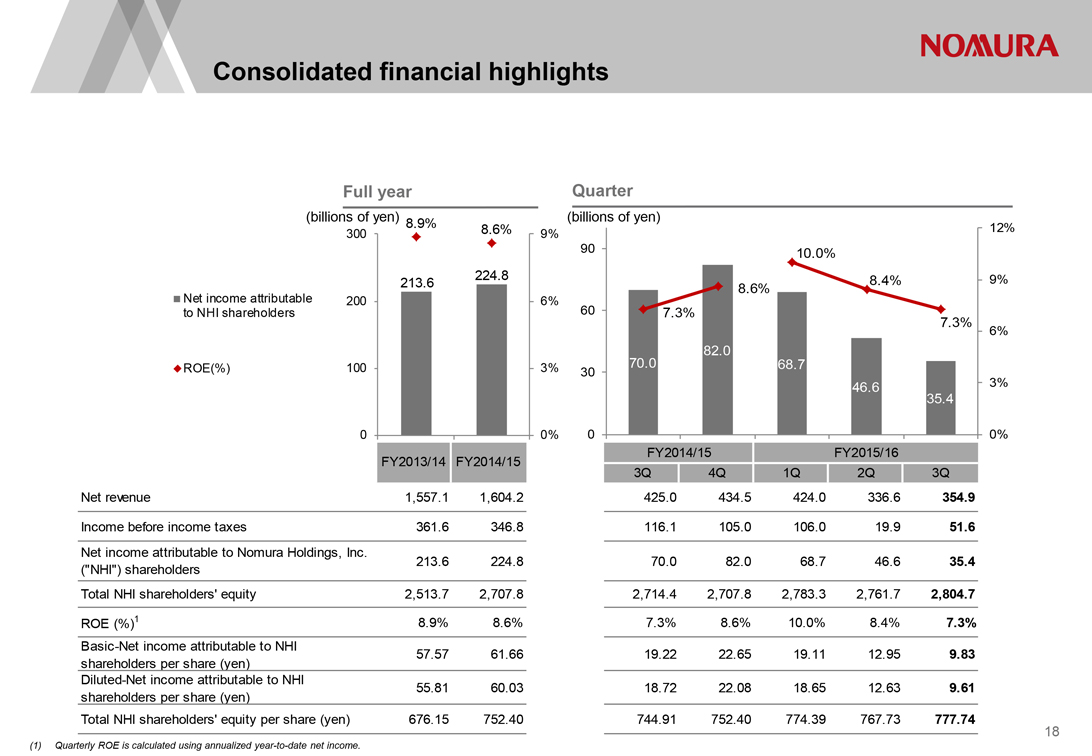
Consolidated financial highlights
Nomura
Full year
(billions of yen) 8.9%
300 8.6% 9%
224.8 213.6
Net income attributable 200 6% to NHI shareholders
ROE(%) 100 3%
0 0%
FY2013/14 FY2014/15
Quarter
(billions of yen)
12%
90 10.0%
8.4% 9%
8.6%
60 7.3%
7.3%
6%
82.0
70.0 68.7
30
46.6 3% 35.4
0 0%
FY2014/15 FY2015/16
3Q 4Q 1Q 2Q 3Q
Net revenue 1,557.1 1,604.2
Income before income taxes 361.6 346.8
Net income attributable to Nomura Holdings, Inc.
(“NHI”) shareholders 213.6 224.8
Total NHI shareholders’ equity 2,513.7 2,707.8
ROE (%)1 8.9% 8.6%
Basic-Net income attributable to NHI 57.57 61.66
shareholders per share (yen)
Diluted-Net income attributable to NHI 55.81 60.03
shareholders per share (yen)
Total NHI shareholders’ equity per share (yen) 676.15 752.40
| 425.0 |
|
434.5 424.0 336.6 354.9 |
| 116.1 |
|
105.0 106.0 19.9 51.6 |
| 70.0 |
|
82.0 68.7 46.6 35.4 |
| 2,714.4 |
|
2,707.8 2,783.3 2,761.7 2,804.7 |
| 7.3% |
|
8.6% 10.0% 8.4% 7.3% |
| 19.22 |
|
22.65 19.11 12.95 9.83 |
| 18.72 |
|
22.08 18.65 12.63 9.61 |
| 744.91 |
|
752.40 774.39 767.73 777.74 |
| (1) |
|
Quarterly ROE is calculated using annualized year-to-date net income. |
18
Table of Contents
|
|
Nomura
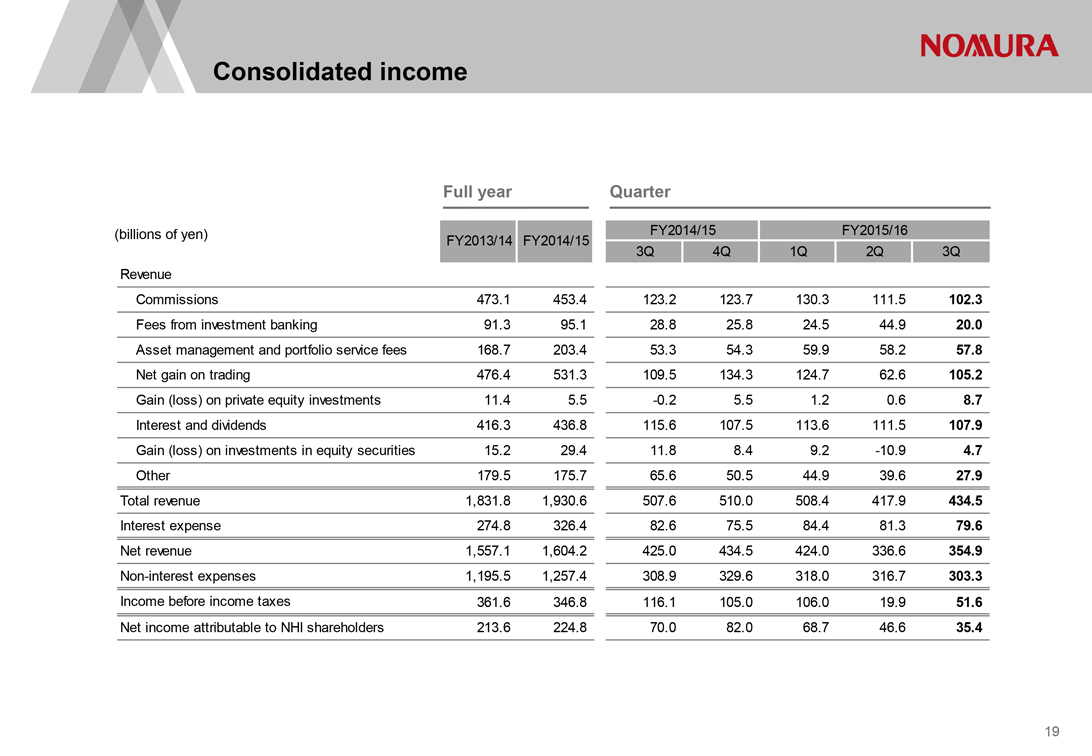
Consolidated income
Full year Quarter
(billions of yen) FY2013/14 FY2014/15 FY2014/15 FY2015/16
3Q 4Q 1Q 2Q 3Q
Revenue
Commissions 473.1 453.4 123.2 123.7 130.3 111.5 102.3
Fees from investment banking 91.3 95.1 28.8 25.8 24.5 44.9 20.0
Asset management and portfolio service fees 168.7 203.4 53.3 54.3 59.9 58.2 57.8
Net gain on trading 476.4 531.3 109.5 134.3 124.7 62.6 105.2
Gain (loss) on private equity investments 11.4 5.5 -0.2 5.5 1.2 0.6 8.7
Interest and dividends 416.3 436.8 115.6 107.5 113.6 111.5 107.9
Gain (loss) on investments in equity securities 15.2 29.4 11.8 8.4 9.2 -10.9 4.7
Other 179.5 175.7 65.6 50.5 44.9 39.6 27.9
Total revenue 1,831.8 1,930.6 507.6 510.0 508.4 417.9 434.5
Interest expense 274.8 326.4 82.6 75.5 84.4 81.3 79.6
Net revenue 1,557.1 1,604.2 425.0 434.5 424.0 336.6 354.9
Non-interest expenses 1,195.5 1,257.4 308.9 329.6 318.0 316.7 303.3
Income before income taxes 361.6 346.8 116.1 105.0 106.0 19.9 51.6
Net income attributable to NHI shareholders 213.6 224.8 70.0 82.0 68.7 46.6 35.4
19
Table of Contents
|
|
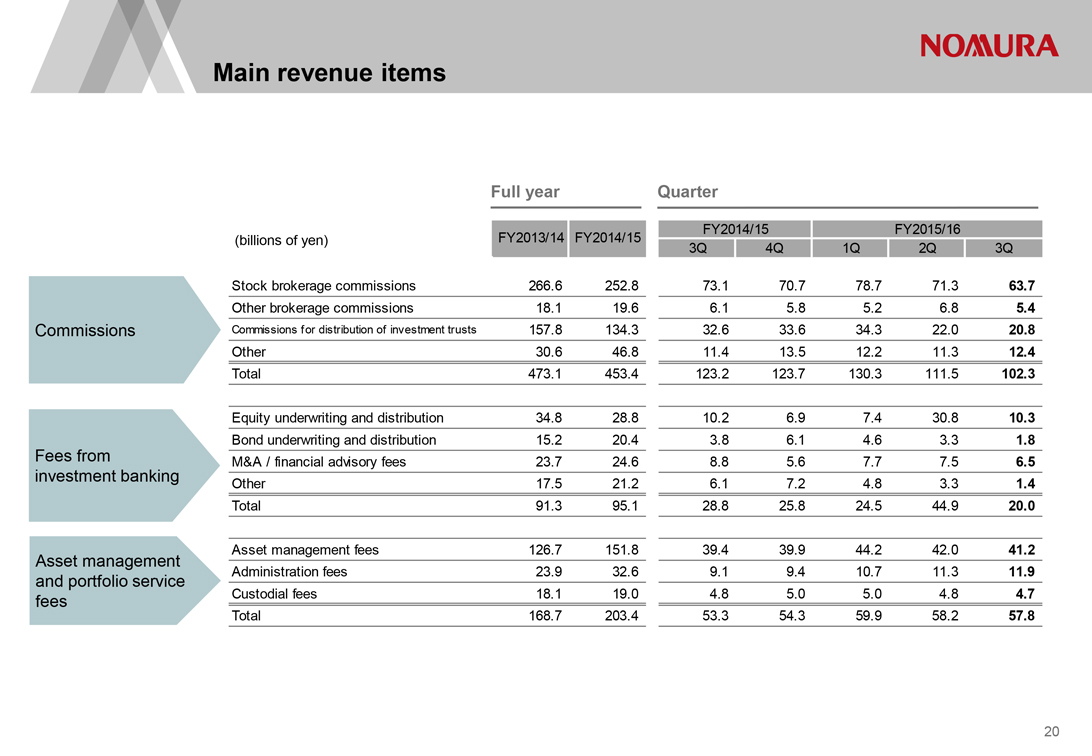
Main revenue items
Nomura
Commissions
Full year Quarter
FY2014/15 FY2015/16
(billions of yen) FY2013/14 FY2014/15 3Q 4Q 1Q 2Q 3Q
Stock brokerage commissions 266.6 252.8 73.1 70.7 78.7 71.3 63.7
Other brokerage commissions 18.1 19.6 6.1 5.8 5.2 6.8 5.4
Commissions for distribution of investment trusts 157.8 134.3 32.6 33.6 34.3 22.0 20.8
Other 30.6 46.8 11.4 13.5 12.2 11.3 12.4
Total 473.1 453.4 123.2 123.7 130.3 111.5 102.3
Fees from investment banking
Equity underwriting and distribution 34.8 28.8 10.2 6.9 7.4 30.8 10.3
Bond underwriting and distribution 15.2 20.4 3.8 6.1 4.6 3.3 1.8
M&A / financial advisory fees 23.7 24.6 8.8 5.6 7.7 7.5 6.5
Other 17.5 21.2 6.1 7.2 4.8 3.3 1.4
Total 91.3 95.1 28.8 25.8 24.5 44.9 20.0
Asset management and portfolio service fees
Asset management fees 126.7 151.8 39.4 39.9 44.2 42.0 41.2
Administration fees 23.9 32.6 9.1 9.4 10.7 11.3 11.9
Custodial fees 18.1 19.0 4.8 5.0 5.0 4.8 4.7
Total 168.7 203.4 53.3 54.3 59.9 58.2 57.8
20
Table of Contents
|
|
Nomura
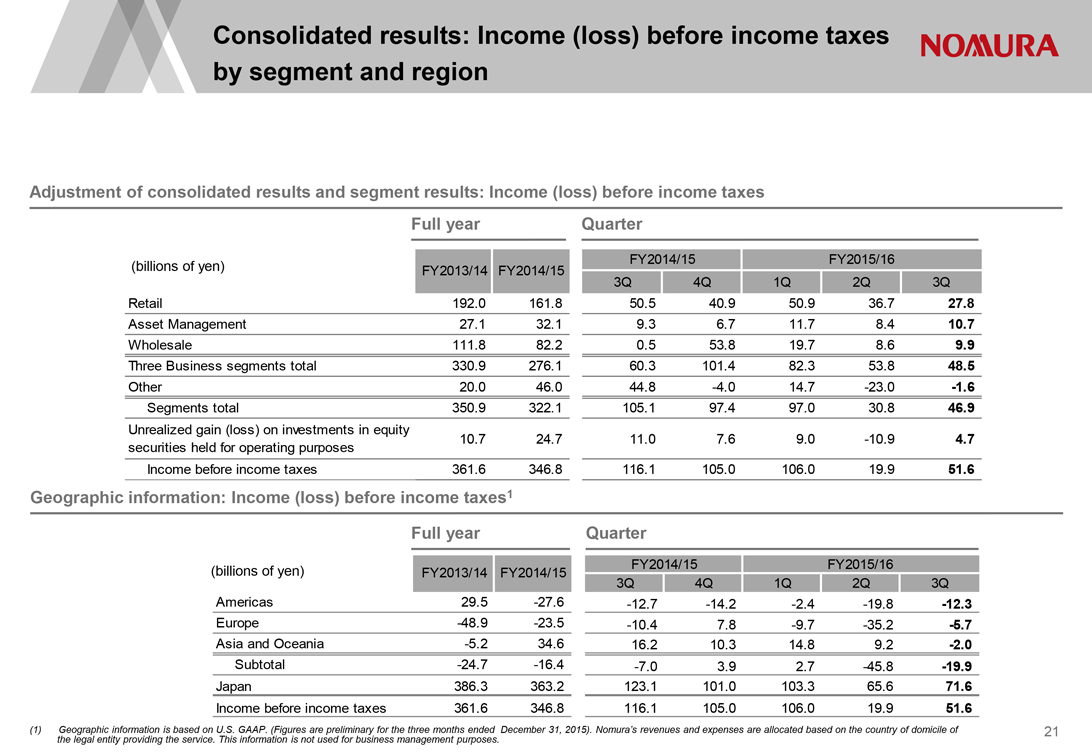
Consolidated results: Income (loss) before income taxes by segment and region
Adjustment of consolidated results and segment results: Income (loss) before income taxes
Full year Quarter
(billions of yen) FY2013/14 FY2014/15 FY2014/15 FY2015/16
3Q 4Q 1Q 2Q 3Q
Retail 192.0 161.8 50.5 40.9 50.9 36.7 27.8
Asset Management 27.1 32.1 9.3 6.7 11.7 8.4 10.7
Wholesale 111.8 82.2 0.5 53.8 19.7 8.6 9.9
Three Business segments total 330.9 276.1 60.3 101.4 82.3 53.8 48.5
Other 20.0 46.0 44.8 -4.0 14.7 -23.0 -1.6
Segments total 350.9 322.1 105.1 97.4 97.0 30.8 46.9
Unrealized gain (loss) on investments in equity
securities held for operating purposes 10.7 24.7 11.0 7.6 9.0 -10.9 4.7
Income before income taxes 361.6 346.8 116.1 105.0 106.0 19.9 51.6
Geographic information: Income (loss) before income taxes1
Full year Quarter
(billions of yen) FY2013/14 FY2014/15 FY2014/15 FY2015/16
3Q 4Q 1Q 2Q 3Q
Americas 29.5 -27.6 -12.7 -14.2 -2.4 -19.8 -12.3
Europe -48.9 -23.5 -10.4 7.8 -9.7 -35.2 -5.7
Asia and Oceania -5.2 34.6 16.2 10.3 14.8 9.2 -2.0
Subtotal -24.7 -16.4 -7.0 3.9 2.7 -45.8 -19.9
Japan 386.3 363.2 123.1 101.0 103.3 65.6 71.6
Income before income taxes 361.6 346.8 116.1 105.0 106.0 19.9 51.6
Geographic information is based on U.S. GAAP. (Figures are preliminary for the three months ended December 31, 2015). Nomura’s revenues and expenses are allocated based on the country of domicile of the legal entity providing the service. This information is not used for business management purposes.
21
Table of Contents
|
|
Nomura
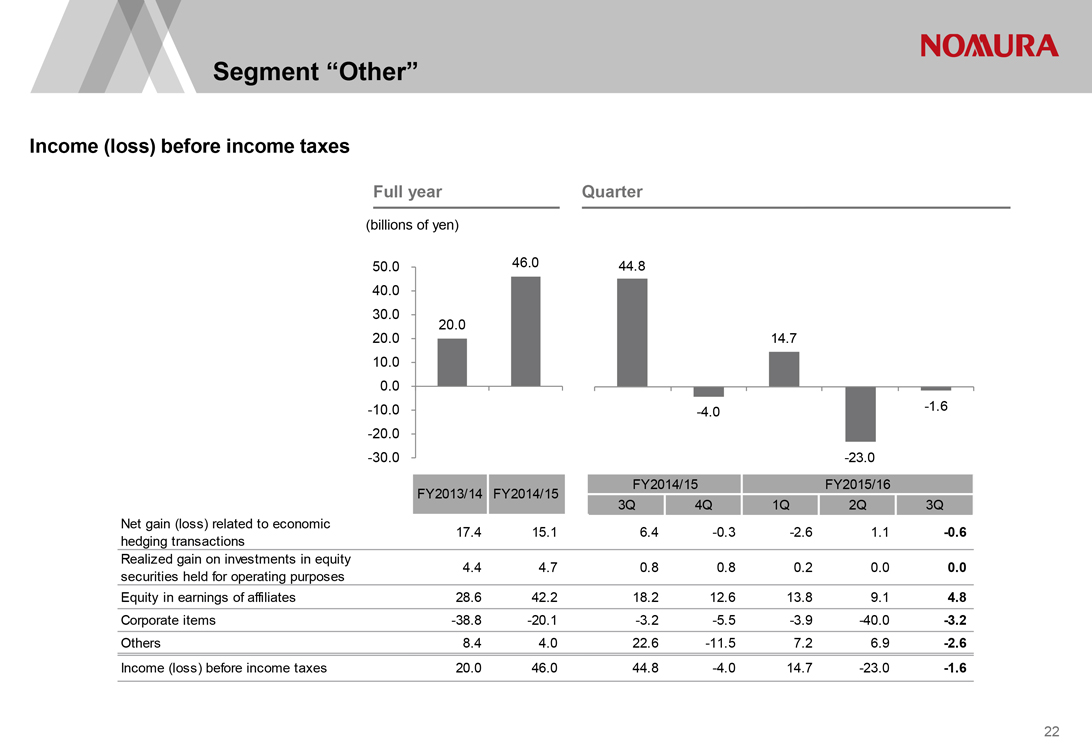
Segment “Other”
Income (loss) before income taxes
Full year Quarter
(billions of yen)
50.0 46.0 44.8 40.0 30.0
20.0 20.0 14.7 10.0
0.0
-10.0 -4.0 -1.6
-20.0
-30.0 -23.0
| 1 |
|
2 |
FY2014/15 FY2015/16 FY2013/14 FY2014/15
3Q 4Q 1Q 2Q 3Q
Net gain (loss) related to economic 17.4 15.1 6.4 -0.3 -2.6 1.1 -0.6
hedging transactions
Realized gain on investments in equity 4.4 4.7 0.8 0.8 0.2 0.0 0.0
securities held for operating purposes
Equity in earnings of affiliates 28.6 42.2 18.2 12.6 13.8 9.1 4.8
Corporate items -38.8 -20.1 -3.2 -5.5 -3.9 -40.0 -3.2
Others 8.4 4.0 22.6 -11.5 7.2 6.9 -2.6
Income (loss) before income taxes 20.0 46.0 44.8 -4.0 14.7 -23.0 -1.6
22
Table of Contents
|
|
Nomura
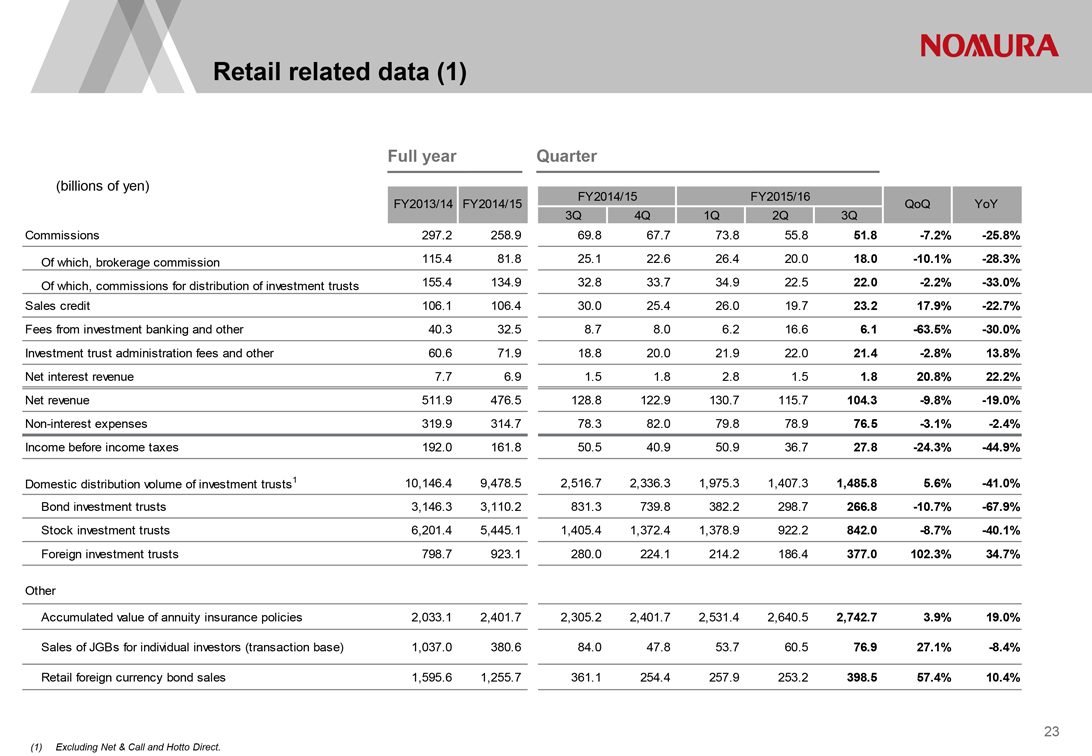
Retail related data (1)
Full year Quarter
(billions of yen)
FY2014/15 FY2015/16
FY2013/14 FY2014/15 QoQ YoY
3Q 4Q 1Q 2Q 3Q
Commissions 297.2 258.9 69.8 67.7 73.8 55.8 51.8 -7.2% -25.8%
Of which, brokerage commission 115.4 81.8 25.1 22.6 26.4 20.0 18.0 -10.1% -28.3%
Of which, commissions for distribution of investment trusts 155.4 134.9 32.8 33.7 34.9 22.5 22.0 -2.2% -33.0%
Sales credit 106.1 106.4 30.0 25.4 26.0 19.7 23.2 17.9% -22.7%
Fees from investment banking and other 40.3 32.5 8.7 8.0 6.2 16.6 6.1 -63.5% -30.0%
Investment trust administration fees and other 60.6 71.9 18.8 20.0 21.9 22.0 21.4 -2.8% 13.8%
Net interest revenue 7.7 6.9 1.5 1.8 2.8 1.5 1.8 20.8% 22.2%
Net revenue 511.9 476.5 128.8 122.9 130.7 115.7 104.3 -9.8% -19.0%
Non-interest expenses 319.9 314.7 78.3 82.0 79.8 78.9 76.5 -3.1% -2.4%
Income before income taxes 192.0 161.8 50.5 40.9 50.9 36.7 27.8 -24.3% -44.9%
Domestic distribution volume of investment trusts1 10,146.4 9,478.5 2,516.7 2,336.3 1,975.3 1,407.3 1,485.8 5.6% -41.0%
Bond investment trusts 3,146.3 3,110.2 831.3 739.8 382.2 298.7 266.8 -10.7% -67.9%
Stock investment trusts 6,201.4 5,445.1 1,405.4 1,372.4 1,378.9 922.2 842.0 -8.7% -40.1%
Foreign investment trusts 798.7 923.1 280.0 224.1 214.2 186.4 377.0 102.3% 34.7%
Other
Accumulated value of annuity insurance policies 2,033.1 2,401.7 2,305.2 2,401.7 2,531.4 2,640.5 2,742.7 3.9% 19.0%
Sales of JGBs for individual investors (transaction base) 1,037.0 380.6 84.0 47.8 53.7 60.5 76.9 27.1% -8.4%
Retail foreign currency bond sales 1,595.6 1,255.7 361.1 254.4 257.9 253.2 398.5 57.4% 10.4%
| (1) |
|
Excluding Net & Call and Hotto Direct. |
23
Table of Contents
|
|
Nomura
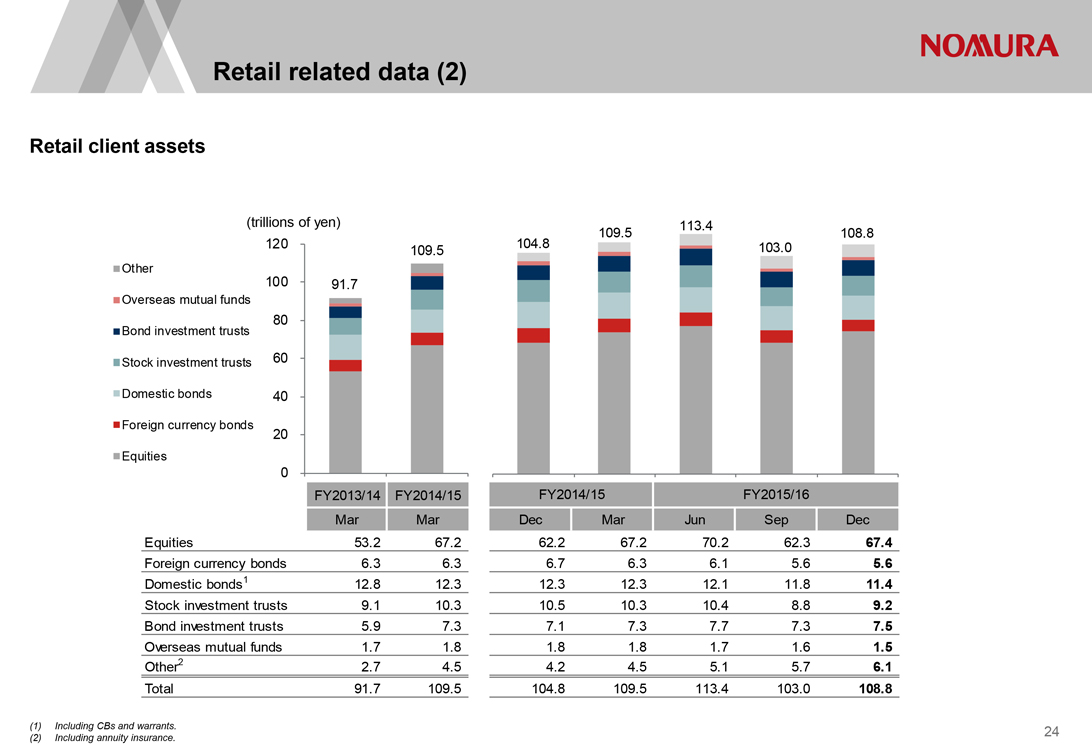
Retail related data (2)
Retail client assets
(trillions of yen) 113.4
109.5 108.8 120 104.8 103.0 109.5
Other 100
91.7
Overseas mutual funds
80
Bond investment trusts Stock investment trusts 60 Domestic bonds 40 Foreign currency bonds
20
Equities
0 23
FY2013/14 FY2014/15 FY2014/15 FY2015/16
Mar Mar Dec Mar Jun Sep Dec
Equities 53.2 67.2 62.2 67.2 70.2 62.3 67.4
Foreign currency bonds 6.3 6.3 6.7 6.3 6.1 5.6 5.6
Domestic bonds1 12.8 12.3 12.3 12.3 12.1 11.8 11.4
Stock investment trusts 9.1 10.3 10.5 10.3 10.4 8.8 9.2
Bond investment trusts 5.9 7.3 7.1 7.3 7.7 7.3 7.5
Overseas mutual funds 1.7 1.8 1.8 1.8 1.7 1.6 1.5
Other2 2.7 4.5 4.2 4.5 5.1 5.7 6.1
Total 91.7 109.5 104.8 109.5 113.4 103.0 108.8
Including CBs and warrants.
Including annuity insurance.
24
Table of Contents
|
|
Nomura
Retail related data (3)
Net inflows of cash and securities1
Full year
(billions of yen)
1,500
1,076
997
1,000
500
0
FY2013/14 FY2014/15
Quarter
(billions of yen)
1,000
500
352
177
95
0
-137
-356
-500
FY2014/15 FY2015/16
3Q 4Q 1Q 2Q 3Q
| (1) |
|
Cash and securities inflows minus outflows, excluding regional financial institutions. |
25
Table of Contents
|
|
Nomura
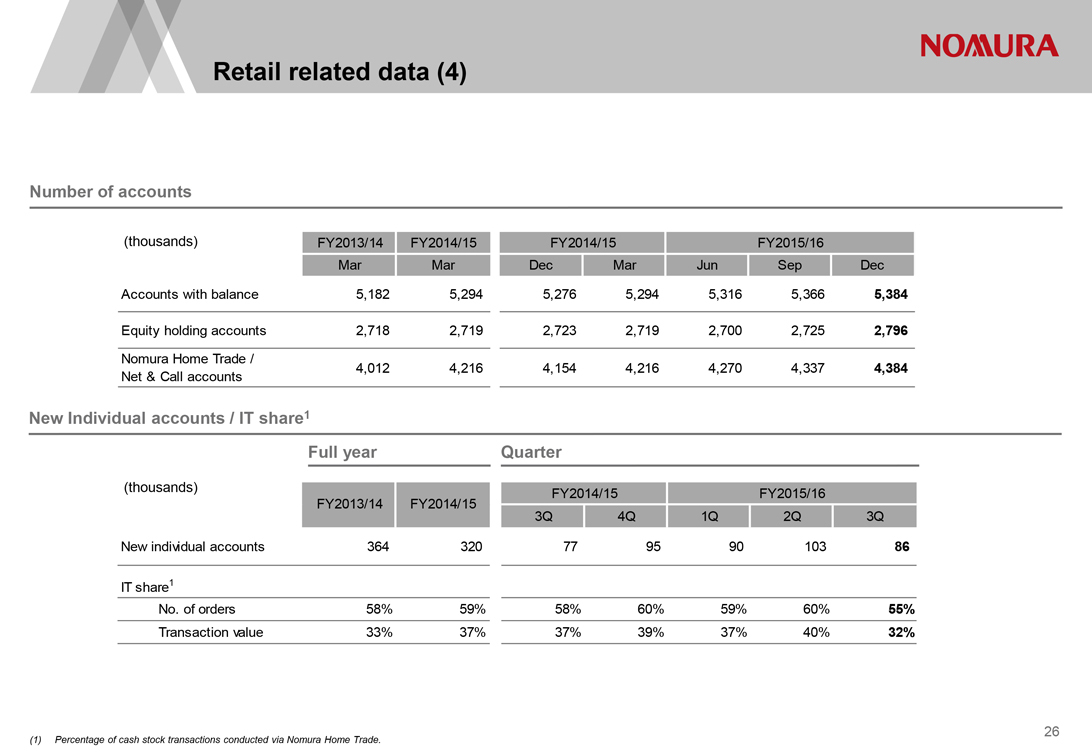
Retail related data (4)
Number of accounts
(thousands) FY2013/14 FY2014/15 FY2014/15 FY2015/16
Mar Mar Dec Mar Jun Sep Dec
Accounts with balance 5,182 5,294 5,276 5,294 5,316 5,366 5,384
Equity holding accounts 2,718 2,719 2,723 2,719 2,700 2,725 2,796
Nomura Home Trade /
Net & Call accounts 4,012 4,216 4,154 4,216 4,270 4,337 4,384
New Individual accounts / IT share1
Full year Quarter
(thousands) FY2014/15 FY2015/16
FY2013/14 FY2014/15
3Q 4Q 1Q 2Q 3Q
New individual accounts 364 320 77 95 90 103 86
IT share1
No. of orders 58% 59% 58% 60% 59% 60% 55%
Transaction value 33% 37% 37% 39% 37% 40% 32%
| (1) |
|
Percentage of cash stock transactions conducted via Nomura Home Trade. |
26
Table of Contents
|
|
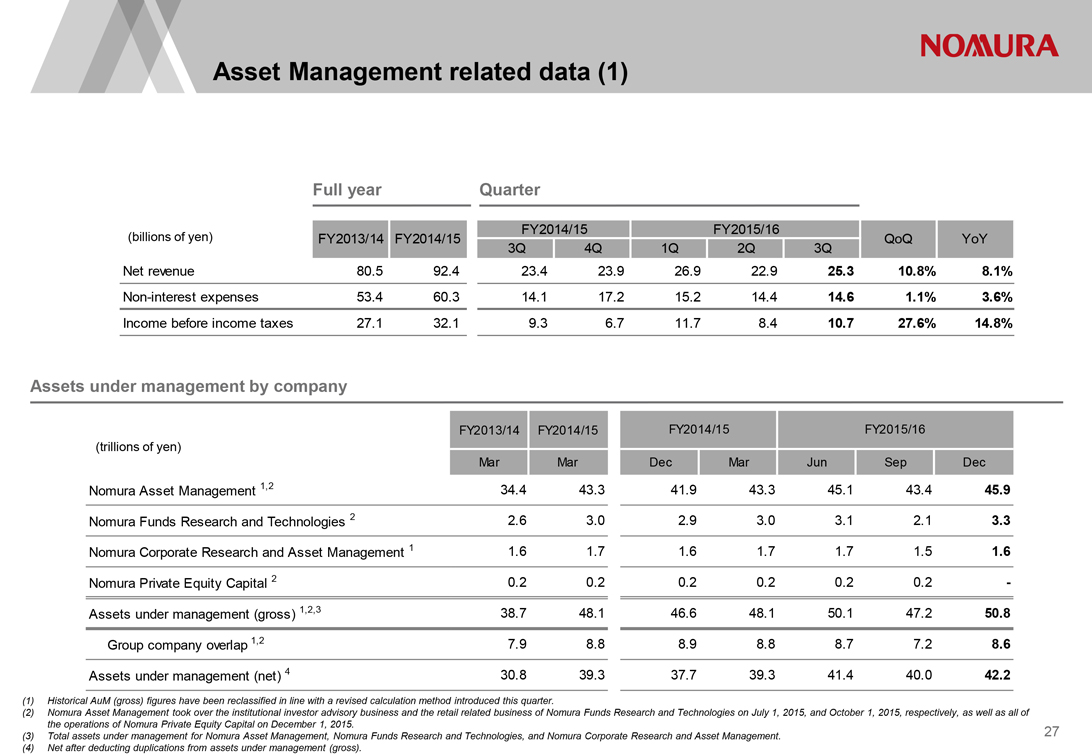
Nomura
Asset Management related data (1)
Full year Quarter
FY2014/15 FY2015/16
(billions of yen) FY2013/14 FY2014/15 QoQ YoY
3Q 4Q 1Q 2Q 3Q
Net revenue 80.5 92.4 23.4 23.9 26.9 22.9 25.3 10.8% 8.1%
Non-interest expenses 53.4 60.3 14.1 17.2 15.2 14.4 14.6 1.1% 3.6%
Income before income taxes 27.1 32.1 9.3 6.7 11.7 8.4 10.7 27.6% 14.8%
Assets under management by company
FY2013/14 FY2014/15 FY2014/15 FY2015/16
(trillions of yen)
Mar Mar Dec Mar Jun Sep Dec
Nomura Asset Management 1,2 34.4 43.3 41.9 43.3 45.1 43.4 45.9
Nomura Funds Research and Technologies 2 2.6 3.0 2.9 3.0 3.1 2.1 3.3
Nomura Corporate Research and Asset Management 1 1.6 1.7 1.6 1.7 1.7 1.5 1.6
Nomura Private Equity Capital 2 0.2 0.2 0.2 0.2 0.2 0.2 -
Assets under management (gross) 1,2,3 38.7 48.1 46.6 48.1 50.1 47.2 50.8
Group company overlap 1,2 7.9 8.8 8.9 8.8 8.7 7.2 8.6
Assets under management (net) 4 30.8 39.3 37.7 39.3 41.4 40.0 42.2
Historical AuM (gross) figures have been reclassified in line with a revised calculation method introduced this quarter.
Nomura Asset Management took over the institutional investor advisory business and the retail related business of Nomura Funds Research and Technologies on July 1, 2015, and October 1, 2015, respectively, as well as all of the operations of Nomura Private Equity Capital on December 1, 2015.
Total assets under management for Nomura Asset Management, Nomura Funds Research and Technologies, and Nomura Corporate Research and Asset Management.
Net after deducting duplications from assets under management (gross).
27
Table of Contents
|
|
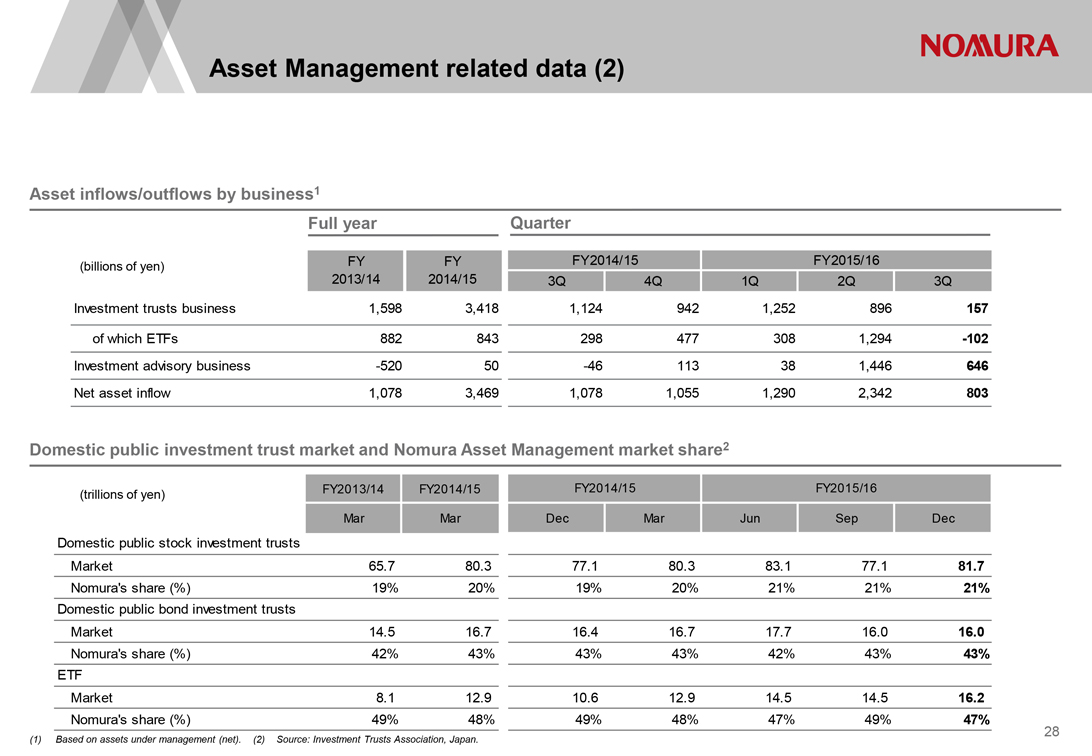
Nomura
Asset Management related data (2)
Asset inflows/outflows by business1
Full year Quarter
(billions of yen) FY FY FY2014/15 FY2015/16
2013/14 2014/15 3Q 4Q 1Q 2Q 3Q
Investment trusts business 1,598 3,418 1,124 942 1,252 896 157
of which ETFs 882 843 298 477 308 1,294 -102
Investment advisory business -520 50 -46 113 38 1,446 646
Net asset inflow 1,078 3,469 1,078 1,055 1,290 2,342 803
Domestic public investment trust market and Nomura Asset Management market share2
(trillions of yen) FY2013/14 FY2014/15 FY2014/15 FY2015/16
Mar Mar Dec Mar Jun Sep Dec
Domestic public stock investment trusts
Market 65.7 80.3 77.1 80.3 83.1 77.1 81.7
Nomura’s share (%) 19% 20% 19% 20% 21% 21% 21%
Domestic public bond investment trusts
Market 14.5 16.7 16.4 16.7 17.7 16.0 16.0
Nomura’s share (%) 42% 43% 43% 43% 42% 43% 43%
ETF
Market 8.1 12.9 10.6 12.9 14.5 14.5 16.2
Nomura’s share (%) 49% 48% 49% 48% 47% 49% 47%
| (1) |
|
Based on assets under management (net). (2) Source: Investment Trusts Association, Japan. |
28
Table of Contents
|
|
Nomura
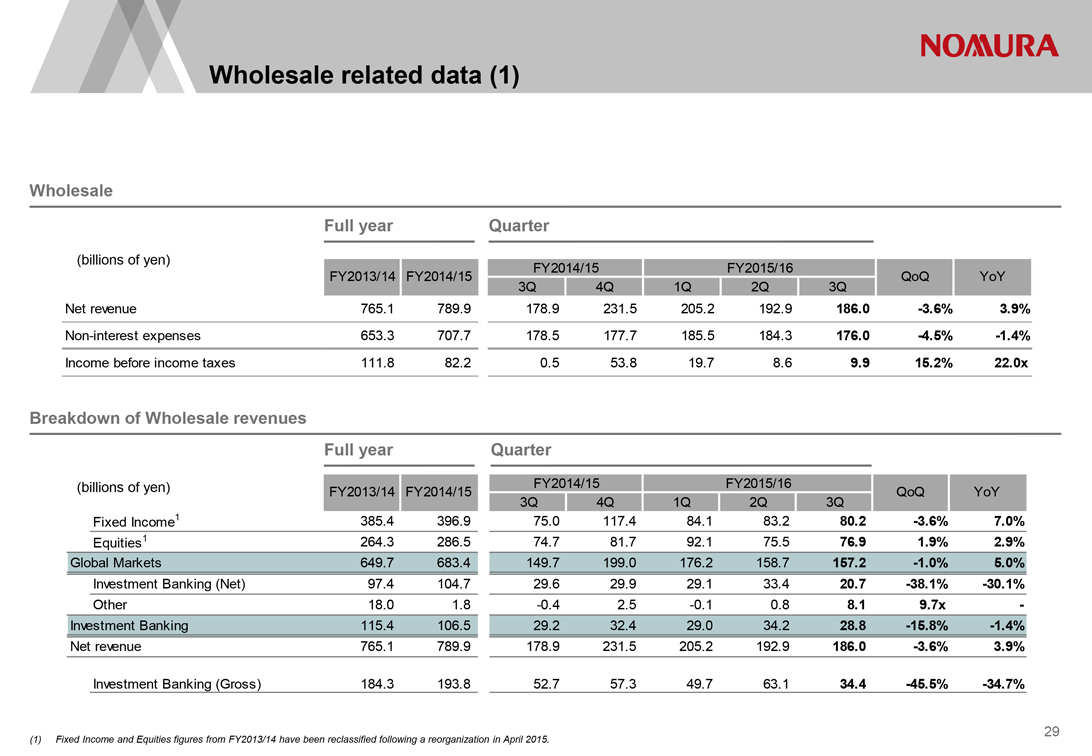
Wholesale related data (1)
Wholesale
Full year Quarter
(billions of yen) FY2014/15 FY2015/16
FY2013/14 FY2014/15 QoQ YoY
3Q 4Q 1Q 2Q 3Q
Net revenue 765.1 789.9 178.9 231.5 205.2 192.9 186.0 -3.6% 3.9%
Non-interest expenses 653.3 707.7 178.5 177.7 185.5 184.3 176.0 -4.5% -1.4%
Income before income taxes 111.8 82.2 0.5 53.8 19.7 8.6 9.9 15.2% 22.0x
Breakdown of Wholesale revenues
Full year Quarter
(billions of yen) FY2013/14 FY2014/15 FY2014/15 FY2015/16 QoQ YoY
3Q 4Q 1Q 2Q 3Q
Fixed Income1 385.4 396.9 75.0 117.4 84.1 83.2 80.2 -3.6% 7.0%
Equities1 264.3 286.5 74.7 81.7 92.1 75.5 76.9 1.9% 2.9%
Global Markets 649.7 683.4 149.7 199.0 176.2 158.7 157.2 -1.0% 5.0%
Investment Banking (Net) 97.4 104.7 29.6 29.9 29.1 33.4 20.7 -38.1% -30.1%
Other 18.0 1.8 -0.4 2.5 -0.1 0.8 8.1 9.7x -
Investment Banking 115.4 106.5 29.2 32.4 29.0 34.2 28.8 -15.8% -1.4%
Net revenue 765.1 789.9 178.9 231.5 205.2 192.9 186.0 -3.6% 3.9%
Investment Banking (Gross) 184.3 193.8 52.7 57.3 49.7 63.1 34.4 -45.5% -34.7%
(1) Fixed Income and Equities figures from FY2013/14 have been reclassified following a reorganization in April 2015.
29
Table of Contents
|
|
Nomura
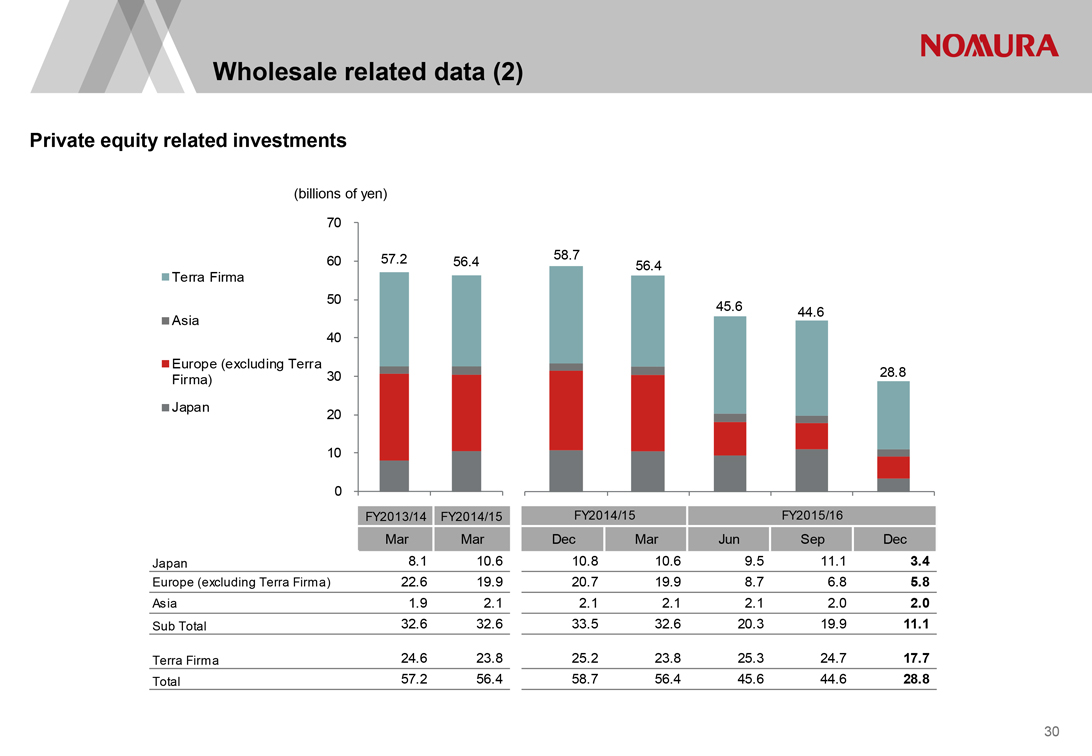
Wholesale related data (2)
Private equity related investments
(billions of yen)
70
60 57.2 58.7
56.4 56.4
Terra Firma
50
Asia 45.6 44.6
40
Europe (excluding Terra
30 28.8
Firma)
Japan
20
10
0
FY2013/14 FY2014/15 FY2014/15 FY2015/16
Mar Mar Dec Mar Jun Sep Dec
Japan 8.1 10.6 10.8 10.6 9.5 11.1 3.4
Europe (excluding Terra Firma) 22.6 19.9 20.7 19.9 8.7 6.8 5.8
Asia 1.9 2.1 2.1 2.1 2.1 2.0 2.0
Sub Total 32.6 32.6 33.5 32.6 20.3 19.9 11.1
Terra Firma 24.6 23.8 25.2 23.8 25.3 24.7 17.7
Total 57.2 56.4 58.7 56.4 45.6 44.6 28.8
30
Table of Contents
|
|
Nomura
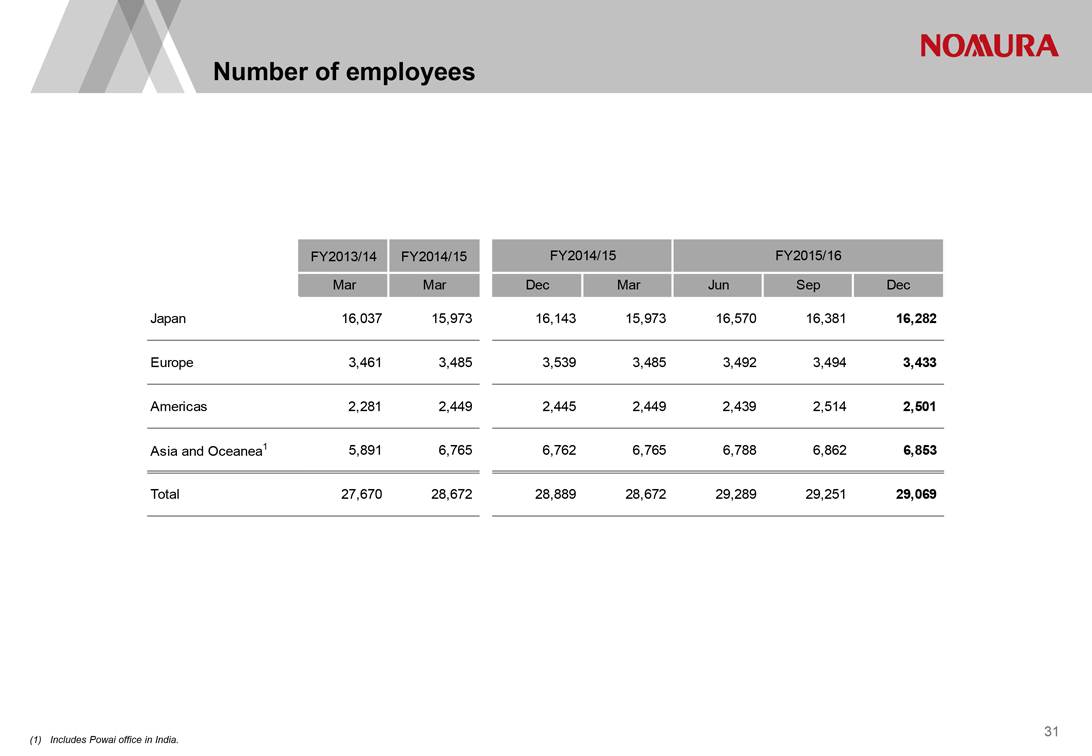
Number of employees
FY2013/14 FY2014/15 FY2014/15 FY2015/16
Mar Mar Dec Mar Jun Sep Dec
Japan 16,037 15,973 16,143 15,973 16,570 16,381 16,282
Europe 3,461 3,485 3,539 3,485 3,492 3,494 3,433
Americas 2,281 2,449 2,445 2,449 2,439 2,514 2,501
Asia and Oceanea1 5,891 6,765 6,762 6,765 6,788 6,862 6,853
Total 27,670 28,672 28,889 28,672 29,289 29,251 29,069
| (1) |
|
Includes Powai office in India. |
31
Table of Contents
|
|
Nomura
Disclaimer
This document is produced by Nomura Holdings, Inc. (“Nomura”).
Nothing in this document shall be considered as an offer to sell or solicitation of an offer to buy any security, commodity or other instrument, including securities issued by Nomura or any affiliate thereof. Offers to sell, sales, solicitations to buy, or purchases of any securities issued by Nomura or any affiliate thereof may only be made or entered into pursuant to appropriate offering materials or a prospectus prepared and distributed according to the laws, regulations, rules and market practices of the jurisdictions in which such offers or sales may be made.
The information and opinions contained in this document have been obtained from sources believed to be reliable, but no representations or warranty, express or implied, are made that such information is accurate or complete and no responsibility or liability can be accepted by Nomura for errors or omissions or for any losses arising from the use of this information.
All rights regarding this document are reserved by Nomura unless otherwise indicated. No part of this document shall be reproduced, stored in a retrieval system or transmitted in any form or by any means, electronic, mechanical, photocopying, recording or otherwise, without the prior written permission of Nomura.
This document contains statements that may constitute, and from time to time our management may make “forward-looking statements” within the meaning of the safe harbor provisions of The Private Securities Litigation Reform Act of 1995. Any such statements must be read in the context of the offering materials pursuant to which any securities may be offered or sold in the United States. These forward-looking statements are not historical facts but instead represent only our belief regarding future events, many of which, by their nature, are inherently uncertain and outside our control. Actual results and financial condition may differ, possibly materially, from what is indicated in those forward-looking statements. You should not place undue reliance on any forward-looking statement and should consider all of the following uncertainties and risk factors, as well as those more fully discussed under Nomura’s most recent Annual Report on Form 20-F and other reports filed with the U.S. Securities and Exchange Commission (“SEC”) that are available on Nomura’s website (http://www.nomura.com) and on the SEC‘s website (http://www.sec.gov); Important risk factors that could cause actual results to differ from those in specific forward-looking statements include, without limitation, economic and market conditions, political events and investor sentiments, liquidity of secondary markets, level and volatility of interest rates, currency exchange rates, security valuations, competitive conditions and size, and the number and timing of transactions.
Forward-looking statements speak only as of the date they are made, and Nomura undertakes no obligation to update any forward-looking statement to reflect the impact of circumstances or events that arise after the date the forward-looking statement was made.
The consolidated financial information in this document is unaudited.
Table of Contents
|
|

Nomura
Nomura Holdings, Inc.
www.nomura.com
Serious News for Serious Traders! Try StreetInsider.com Premium Free!
You May Also Be Interested In
- Nova's Portfolio Selected by Gate-All-Around Manufacturers
- AZZ, Inc. (AZZ) Announces Proposed 4M Share Offering
Create E-mail Alert Related Categories
SEC FilingsRelated Entities
NomuraSign up for StreetInsider Free!
Receive full access to all new and archived articles, unlimited portfolio tracking, e-mail alerts, custom newswires and RSS feeds - and more!
