

Form 6-K NOMURA HOLDINGS INC For: Dec 19
 Tweet
Tweet Share
ShareTable of Contents
�
�
FORM 6-K
U.S. SECURITIES AND EXCHANGE COMMISSION
Washington, D.C. 20549
Report of Foreign Private Issuer
Pursuant to Rule 13a-16 or 15d-16 of
the Securities Exchange Act of 1934
Commission File Number: 1-15270
For the month of December 2014
NOMURA HOLDINGS, INC.
(Translation of registrant�s name into English)
9-1, Nihonbashi 1-chome
Chuo-ku, Tokyo 103-8645
Japan
(Address of principal executive offices)
Indicate by check mark whether the registrant files or will file annual reports under cover Form 20-F or Form 40-F.
Form 20-F ������X������������ Form 40-F��������������
�
Indicate by check mark if the registrant is submitting the Form 6-K in paper as permitted by Regulation S-T Rule 101(b)(1): ������������
Indicate by check mark if the registrant is submitting the Form 6-K in paper as permitted by Regulation S-T Rule 101(b)(7): ������������
�
�
�
�
Table of Contents
Incorporation by Reference
The registrant hereby incorporates Exhibit 1 to this report on Form 6-K by reference (i)�in the prospectus that is part of the Registration Statement on Form F-3 (Registration No.�333-191250) of the registrant and Nomura America Finance, LLC, filed with the Securities and Exchange Commission (�SEC�) on September�19, 2013 and (ii)�in the prospectus that is part of the Registration Statement on Form F-3 (Registration No.�333-186755) of the registrant, filed with the SEC on February�20, 2013.
Information furnished on this form:
�
| Exhibit Number | ||
| 1. | �� | Nomura Holdings, Inc. Interim Operating and Financial Review |
| 15. | �� | Acknowledgment Letter of Ernst & Young ShinNihon LLC |
| 101.INS | �� | XBRL Instance Document |
| 101.SCH | �� | XBRL Taxonomy Extension Schema |
| 101.CAL | �� | XBRL Taxonomy Extension Calculation Linkbase |
| 101.DEF | �� | XBRL Taxonomy Extension Definition Linkbase |
| 101.LAB | �� | XBRL Taxonomy Extension Label Linkbase |
| 101.PRE | �� | XBRL Taxonomy Extension Presentation Linkbase |
Table of Contents
SIGNATURES
Pursuant to the requirements of the Securities Exchange Act of 1934, the registrant has duly caused this report to be signed on its behalf by the undersigned, thereunto duly authorized.
�
| � | NOMURA HOLDINGS, INC. | |||
| Date: December�19, 2014 | � | By: | � | /s/ Hajime Ikeda |
| � | � | Hajime Ikeda | ||
| � | � | Managing Director | ||
Table of Contents
INTERIM OPERATING AND FINANCIAL REVIEW
TABLE OF CONTENTS
�
| �� | � | 1 | �� | |
| �� | � | 2 | �� | |
| �� | � | 3 | �� | |
| �� | � | 5 | �� | |
| �� | ||||
| Consolidated Balance Sheets as of March�31, 2014 and September�30, 2014 |
�� | � | F-2 | �� |
| �� | � | F-5 | �� | |
| �� | � | F-7 | �� | |
| Consolidated Statements of Changes in Equity for the Six Months Ended September�30, 2013 and 2014 |
�� | � | F-8 | �� |
| Consolidated Statements of Cash Flows for the Six Months Ended September�30, 2013 and 2014 |
�� | � | F-9 | �� |
| �� | � | F-10 | �� | |
| �� | � | F-89 | �� | |
Presentation of Financial and Other Information
As used in this Form 6-K, references to the �Company�, �Nomura�, �Nomura Group�, �we�, �us� and �our� are to Nomura Holdings, Inc. and, except as the context otherwise requires, its consolidated subsidiaries. As part of certain line items in Nomura�s financial statements and information included in this Form 6-K, references to �NHI� are to Nomura Holdings, Inc.
Unless otherwise stated, references in this Form 6-K to �yen� and ��� are to the lawful currency of Japan and references to �U.S.�dollars� and �$� are to the lawful currency of the United States of America (�U.S.�).
All ownership data with respect to us presented in this Form 6-K is presented based on the voting interest directly or indirectly held by us. Our voting interest is presented in accordance with Japanese reporting requirements, pursuant to which the amount presented with respect to each subsidiary is the percentage of voting rights of such subsidiary held directly by us or our subsidiaries. For example, wholly-owned subsidiaries of our subsidiaries are listed as 100%, regardless of the level of our direct interest in the intermediate subsidiaries.
Amounts shown within this Form 6-K have been rounded to the nearest indicated digit unless otherwise specified. In tables and graphs with rounded figures, sums may not add up due to rounding.
Except as otherwise indicated, all financial information with respect to us presented in this Form 6-K is presented on a consolidated basis. Our fiscal year ends on March�31 of each year. We prepare interim consolidated financial statements in accordance with U.S. generally accepted accounting principles (�U.S. GAAP�). Our interim consolidated financial statements, including the notes thereto, for the six months ended September�30, 2013 and 2014 are included elsewhere in this Form 6-K. The interim consolidated financial statements included in this Form 6-K have been reviewed in accordance with the standards of the Public Company Accounting Oversight Board (United States) by our independent auditors.
�
1
Table of Contents
Recent Developments in Capital Adequacy Regulations. In December 2010, the Basel Committee on Banking Supervision (�Basel Committee�) issued the overall reform package on capital adequacy ratio, liquidity and leverage ratio from Basel II (�Basel III�) in order to promote a more resilient banking sector. The Basel Committee has been reviewing the Basel III package and has published various proposals. After the implementation of the Capital Adequacy Notice on Final Designated Parent Company revised to be in line with Basel III, the Financial Services Agency of Japan (�FSA�) has been considering further revisions, taking the series of proposals published by the Basel Committee. In addition to Basel III, implementation of new regulations or strengthening of existing regulations have been determined or are under consideration by internal organizations such as the G-20, Financial Stability Board (�FSB�), International Organization of Securities Commissions (�IOSCO�) and Basel Committee, or governmental and self-regulatory organizations in Japan and in virtually all other jurisdictions in which we operate. The FSB and the Basel Committee at the Group of Twenty (�G-20�) summit in November 2011 identified global systemically important bank (�G-SIBs�) on which additional capital requirements will be imposed and update the list of G-SIBs in November of each year. We were not designated as a G-SIB in November 2013 or November 2014. The Basel Committee published updated assessment methodology and the higher loss absorbency requirement on G-SIBs, as well as disclosure requirements on G-SIBs evaluation indices, and such disclosure requirements were made effect by the FSA on March 2014. Also, the Basel Committee developed and published a set of principles on the assessment methodology and the higher loss absorbency requirement for domestic systemically important banks (�D-SIBs�), extending the framework for G-SIBs to D-SIBs. In addition, the FSB and the IOSCO have published assessment methodologies for identifying Non-bank Non-insurer Global Systemically Important Financial Institutions (�NBNI G-SIFIs�), for public consultation.
U.S. Regulatory Changes. In response to the financial markets crisis, governments and regulatory authorities in various jurisdictions have made and continue to make numerous proposals to reform the regulatory framework for, or impose a tax or levy upon, the financial services industry to enhance its resilience against future crises, contribute to the relevant economy generally or for other purposes. In July 2010, the U.S. enacted the Dodd-Frank Wall Street Reform and Consumer Protection Act (the �Dodd-Frank Act�) which is now the subject of a multi-agency rulemaking process. The rulemakings include provisions that (i) create a tighter regulatory framework for OTC derivatives to promote transparency and impose conduct rules in that marketplace; (ii) establish a process for designating nonbank financial firms as Systemically Important Financial Institutions (�SIFIs�), subject to increased (and sometimes new) prudential oversight including early remediation, capital standards, resolution authority and new regulatory fees; (iii) prohibit material conflicts of interest between firms that package and sell asset-backed securities (�ABS�) and firms that invest in ABS; (iv)�establish risk retention requirements for ABS; and (v) a number of executive compensation mandates, including rules to curtail incentive compensation that promotes excessive risk taking. The new regulatory framework for OTC derivatives includes mandates for clearing transactions with designated clearing organizations, exchange trading, new capital requirements, bilateral and variation margin for non-cleared derivatives, reporting and recordkeeping, and internal and external business conduct rules. Some U.S. derivatives rules may be applied extraterritorially and therefore impact some non-U.S. Nomura entities.
Other aspects of the Dodd-Frank Act and related rulemakings include provisions that (i) prohibit deposit-taking banks and their affiliates from engaging in proprietary trading and limit their ability to make investments in hedge funds and private equity funds (the so-called �Volcker Rule�); (ii) empower regulators to liquidate failing nonbank financial companies that are systemically important; (iii) provide for new systemic risk oversight and increased capital requirements for both bank and non-bank SIFIs; (iv) provide for a broader regulatory oversight of hedge funds; and (v) new regulations regarding the role of credit rating agencies, investment advisors and others. To facilitate the transition to the requirements of the Dodd-Frank Act, the Commodity Futures Trading Commission�issued an exemptive order in July 2013 (the �Exemptive Order�) that granted market participants temporary conditional relief from certain provisions of the Commodity Exchange Act, as amended by the Dodd-Frank Act. As the�Exemptive Order expired on December 21, 2013, some U.S. derivatives rules are now being applied extraterritorially and are now therefore impacting some non-U.S. Nomura entities. In addition, Title VII of the Dodd-Frank Act gives the SEC regulatory authority over �security-based swaps� which are defined under the act as swaps based on a single security or loan or a narrow-based group or index of securities. Security-based swaps are included within the definition of �security� under the U.S. Securities and Exchange Act of 1934 and the U.S. Securities Act of 1933. On May 1, 2013, the SEC proposed rules and interpretive guidance addressing cross-border security-based swap activities. Once final, these rules will also be applied extraterritorially and impact some non-U.S. Nomura entities. The exact details of the Dodd-Frank Act implementation and ultimate impact on Nomura�s operations will depend on the form and substance of the final regulations adopted by various governmental agencies and oversight boards. In addition to the rulemakings required by the Dodd-Frank Act, the SEC is considering other rulemakings that will impact Nomura�s U.S. entities. While these rules have not been formally proposed, they have been publicly reported in the U.S. Office of Management and Budget�s (OMB) �Current Regulatory Plan and Unified Agenda of Regulatory and Deregulatory Actions.� The SEC�s Division of Trading and Markets is considering recommending that the SEC propose an amendment to its net capital rule that would prohibit a broker-dealer that carries customer accounts from having a ratio of total assets to regulatory capital in excess of a certain level. The Division of Trading and Markets is also considering a number of changes to equity market structure rules.
�
2
Table of Contents
There is no significant change from the risks as previously disclosed in Part I, Item�3.D �Risk Factors� of our annual report on Form 20-F for the year ended March�31, 2014.
�
3
Table of Contents
Special Note Regarding Forward-Looking Statements
This report contains forward-looking statements that are based on our current expectations, assumptions, estimates and projections about our business, our industry and capital markets around the world. These forward-looking statements are subject to various risks and uncertainties. Generally, these forward-looking statements can be identified by the use of forward-looking terminology such as �may�, �will�, �expect�, �anticipate�, �estimate�, �plan� or similar words. These statements discuss future expectations, identify strategies, contain projections of our results of operations or financial condition, or state other forward-looking information.
Known and unknown risks, uncertainties and other factors may cause our actual results, performance, achievements or financial position to differ materially from any future results, performance, achievements or financial position expressed or implied by any forward-looking statements contained in this report. Such risks, uncertainties and other factors are set forth in �Risk Factors� above and in Item�3.D of our annual report on Form 20-F for the fiscal year ended March�31, 2014, as well as elsewhere in this Form 6-K.
�
4
Table of Contents
Operating and Financial Review and Prospects
Results of Operations�Six Months Ended September�30, 2013 and 2014
The interim consolidated financial statements included in this Form 6-K have not been audited but have been reviewed in accordance with the standards of the Public Company Accounting Oversight Board (United States) by our independent auditors. The unaudited interim consolidated financial statements are prepared on a basis substantially consistent with the audited consolidated financial statements included in our Form 20-F for the fiscal year ended March�31, 2014 filed on June�26, 2014.
Overview
The following table provides selected consolidated statements of income information for the six months ended September�30, 2013 and 2014.
�
| � | �� | Millions of yen except�percentages |
� | |||||
| � | �� | Six�months�ended�September�30 | � | |||||
| � | �� | 2013 | � | � | 2014 | � | ||
| Non-interest revenues: |
�� | � | ||||||
| Commissions |
�� | � | 263,247 | �� | � | � | 208,413 | �� |
| Fees from investment banking |
�� | � | 48,378 | �� | � | � | 40,442 | �� |
| Asset management and portfolio service fees |
�� | � | 83,083 | �� | � | � | 93,839 | �� |
| Net gain on trading |
�� | � | 238,589 | �� | � | � | 287,573 | �� |
| Gain on private equity investments |
�� | � | 753 | �� | � | � | 202 | �� |
| Gain on investments in equity securities |
�� | � | 12,889 | �� | � | � | 9,234 | �� |
| Other |
�� | � | 73,294 | �� | � | � | 59,579 | �� |
| �� | � |
� |
� | � | � |
� |
� | |
| Total non-interest revenues |
�� | � | 720,233 | �� | � | � | 699,282 | �� |
| Net interest revenue |
�� | � | 67,478 | �� | � | � | 45,389 | �� |
| �� | � |
� |
� | � | � |
� |
� | |
| Net revenue |
�� | � | 787,711 | �� | � | � | 744,671 | �� |
| Non-interest expenses |
�� | � | 601,559 | �� | � | � | 618,992 | �� |
| �� | � |
� |
� | � | � |
� |
� | |
| Income before income taxes |
�� | � | 186,152 | �� | � | � | 125,679 | �� |
| Income tax expense |
�� | � | 81,505 | �� | � | � | 51,291 | �� |
| �� | � |
� |
� | � | � |
� |
� | |
| Net income |
�� | � | 104,647 | �� | � | � | 74,388 | �� |
| �� | � |
� |
� | � | � |
� |
� | |
| Less: Net income attributable to noncontrolling interests |
�� | � | 641 | �� | � | � | 1,656 | �� |
| �� | � |
� |
� | � | � |
� |
� | |
| Net income attributable to NHI shareholders |
�� | � | 104,006 | �� | � | � | 72,732 | �� |
| �� | � |
� |
� | � | � |
� |
� | |
| Return on shareholders� equity (annualized)(1) |
�� | � | 8.9 | %� | � | � | 5.7 | %� |
�
| (1) | Calculated as Net income attributable to NHI shareholders divided by average Total NHI shareholders� equity multiplied by two. |
Net revenue decreased by 5.5% from �787,711�million for the six months ended September�30, 2013 to �744,671�million for the six months ended September�30, 2014. Commissions decreased by 20.8%, primarily due to decreasing commissions received from equity and equity-related products and commissions from the distributions of investment trust certificates. Asset management and portfolio service fees increased by 12.9%, primarily due to an increase in assets under management driven by contribution of the new subsidiary company. Net gain on trading increased by 20.5%, primarily due to an increase in the results of debt trading. Other revenue decreased by 18.7%, primarily due to decreasing unrealized gains of the equity securities held for non-trading purposes.
Net interest revenue was �67,478�million for the six months ended September�30, 2013 and �45,389�million for the six months ended September�30, 2014. Net interest revenue is a function of the level and the mix of total assets and liabilities, which includes trading assets and financing and lending transactions, and the level, term structure and volatility of interest rates. Net interest revenue is an integral component of our trading business. In assessing the profitability of our overall business and of our Wholesale operation in particular, we view Net interest revenue and Non-interest revenues in aggregate.
�
5
Table of Contents
Non-interest expenses increased by 2.9% from �601,559�million for the six months ended September�30, 2013 to �618,992�million for the six months ended September�30, 2014.
We are subject to a number of different taxes in Japan and have adopted the consolidation tax system permitted under Japanese tax law. The consolidation tax system only imposes a national tax. Between April�1, 2004 and March�31, 2012, our effective statutory tax rate was 41%. However, as a result of revisions to domestic tax laws, the effective statutory tax rates are 38% for the fiscal years beginning between April�1, 2012 and March�31, 2014, and 36% thereafter. Our foreign subsidiaries are subject to the income tax rates of the countries in which they operate, which are generally lower than those in Japan. Our effective tax rate in any one year is therefore dependent on our geographic mix of profits and losses and also on the specific tax treatment applicable in each location.
For the six months ended September�30, 2013, the difference between the effective statutory tax rate of 38% and the effective tax rate of 43.8% was mainly due to non-deductible expenses, different tax rates and changes in effective statutory tax rates applicable to income (loss) of foreign subsidiaries, whereas non-taxable revenues and a decrease in valuation allowance of foreign subsidiaries reduced the effective tax rate.
For the six months ended September�30, 2014, the difference between the effective statutory tax rate of 36% and the effective tax rate of 40.8% was mainly due to non-deductible expenses, an increase in valuation allowance of foreign subsidiaries, whereas non-taxable revenue reduced the effective tax rate.
Net income attributable to NHI shareholders was �104,006�million for the six months ended September�30, 2013 and �72,732�million for the six months ended September�30, 2014, individually. Our annualized return on shareholder�s equity was 8.9% for the six months ended September�30, 2013 and 5.7% for the six months ended September�30, 2014.
Retail
In Retail, our sales activities continue to focus on providing client consultation services and investment proposals for which we receive commissions and fees from our sales activities. Additionally, we receive operational fees from asset management companies in connection with the administration services of investment trust certificates that we distribute. We also receive agent commissions from insurance companies for the insurance products we sell as an agent.
�
| � | �� | Millions of yen | � | |||||
| � | �� | Six�months�ended�September�30 | � | |||||
| � | �� | 2013 | � | �� | 2014 | � | ||
| Non-interest revenues |
�� | � | 283,200 | �� | �� | � | 222,691 | �� |
| Net interest revenue |
�� | � | 2,872 | �� | �� | � | 2,112 | �� |
| �� | � |
� |
� | �� | � |
� |
� | |
| Net revenue |
�� | � | 286,072 | �� | �� | � | 224,803 | �� |
| Non-interest expenses |
�� | � | 165,011 | �� | �� | � | 154,332 | �� |
| �� | � |
� |
� | �� | � |
� |
� | |
| Income before income taxes |
�� | � | 121,061 | �� | �� | � | 70,471 | �� |
| �� | � |
� |
� | �� | � |
� |
� | |
Net revenue decreased by 21.4% from �286,072�million for the six months ended September�30, 2013 to �224,803�million for the six months ended September�30, 2014, primarily due to decreased sales performance of equities and investment trusts as a result of slow down of the equity markets.
Non-interest expenses decreased by 6.5% from �165,011�million for the six months ended September�30, 2013 to �154,332�million for the six months ended September�30, 2014.
Income before income taxes decreased by 41.8% from �121,061�million for the six months ended September�30, 2013 to �70,471�million for the six months ended September�30, 2014.
�
6
Table of Contents
The following graph shows revenue generated by instrument in terms of Retail non-interest revenues for the six months ended September�30, 2013 and 2014.
�
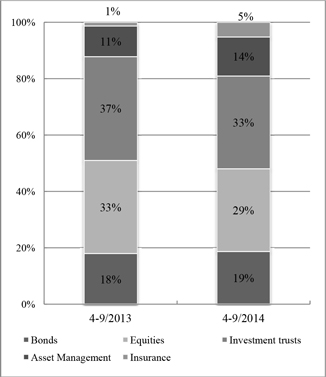
As shown above, the proportion of Retail non-interest revenues from equities decreased from 33% for the six months ended September�30, 2013 to 29% for the six months ended September�30, 2014, primarily due to the slowdown of Japanese equity market environment. The proportion of Retail non-interest revenues from investment trusts and asset management decreased from 48% for the six months ended September�30, 2013 to 47% for the six months ended September�30, 2014. The proportion of Retail non-interest revenues from bonds increased from 18% for the six months ended September�30, 2013 to 19% for the six months ended September�30, 2014. The proportion of Retail non-interest revenues from insurance increased from 1% for the six months ended September�30, 2013 to 5% for the six months ended September�30, 2014.
�
7
Table of Contents
The following graph shows amounts and details regarding the composition of retail client assets as of September�30, 2013 and 2014.
Retail Client Assets
�
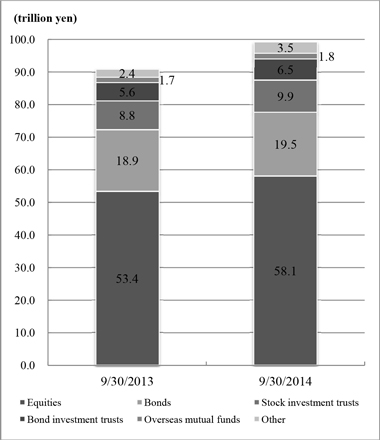
Total retail client assets increased by �8.3 trillion from �90.9 trillion as of September�30, 2013 to �99.3 trillion at September�30, 2014. Retail client assets consist of clients� assets held in our custody and assets relating to insurance products.
Asset Management
Our Asset Management segment is conducted principally through Nomura Asset Management Co., Ltd. (�NAM�). We earn portfolio management fees through the development and management of investment trusts, which are distributed by Nomura Securities Co., Ltd. (�NSC�), other brokers, banks, Japan Post Bank Co., Ltd. and Japan Post Co., Ltd. We also provide investment advisory services for pension funds and other institutional clients. Net revenues generally consist of asset management and portfolio services fees that are attributable to Asset Management.
�
| � | �� | Millions of yen | � | |||||
| � | �� | Six�months�ended�September�30 | � | |||||
| � | �� | 2013 | � | �� | 2014 | � | ||
| Non-interest revenues |
�� | � | 37,238 | �� | �� | � | 43,219 | �� |
| Net interest revenue |
�� | � | 1,562 | �� | �� | � | 1,810 | �� |
| �� | � |
� |
� | �� | � |
� |
� | |
| Net revenue |
�� | � | 38,800 | �� | �� | � | 45,029 | �� |
| Non-interest expenses |
�� | � | 25,937 | �� | �� | � | 28,946 | �� |
| �� | � |
� |
� | �� | � |
� |
� | |
| Income before income taxes |
�� | � | 12,863 | �� | �� | � | 16,083 | �� |
| �� | � |
� |
� | �� | � |
� |
� | |
Net revenue increased by 16.1% from �38,800�million for the six months ended September�30, 2013 to �45,029�million for the six�months ended September�30, 2014.
�
8
Table of Contents
Non-interest expenses increased by 11.6% from �25,937�million for the six months ended September�30, 2013 to �28,946�million for the six months ended September�30, 2014.
Income before income taxes increased by 25.0% from �12,863�million for the six months ended September�30, 2013 to �16,083�million for the six months ended September�30, 2014.
The following table sets forth assets under management of each principal Nomura entity within Asset Management as of September�30, 2013 and 2014.
�
| � | �� | Billions of yen | � | |||||
| � | �� | September�30 | � | |||||
| � | �� | 2013 | � | � | 2014 | � | ||
| Nomura Asset Management Co., Ltd. |
�� | � | 33,107 | �� | � | � | 38,347 | �� |
| Nomura Funds Research and Technologies Co., Ltd. |
�� | � | 2,492 | �� | � | � | 2,612 | �� |
| Nomura Corporate Research and Asset Management Inc. |
�� | � | 1,565 | �� | � | � | 1,590 | �� |
| Nomura Private Equity Capital Co., Ltd. |
�� | � | 153 | �� | � | � | 174 | �� |
| �� | � |
� |
� | � | � |
� |
� | |
| Combined total |
�� | � | 37,315 | �� | � | � | 42,723 | �� |
| �� | � |
� |
� | � | � |
� |
� | |
| Overlapping asset accounts among group companies |
�� | � | (7,295 | )� | � | � | (7,873 | )� |
| �� | � |
� |
� | � | � |
� |
� | |
| Total |
�� | � | ����30,021 | �� | � | � | ����34,850 | �� |
| �� | � |
� |
� | � | � |
� |
� | |
Assets under management increased by 16.1% from �30.0�trillion as of September�30, 2013 to �34.8�trillion as of September�30, 2014, primarily due to inflows into our investment trust business and investment advisory business, and contribution of the new subsidiary company. The greatest proportion of these assets was managed by NAM with assets under management of �38.3�trillion as of September�30, 2014.
Domestic publicly offered investment trust assets included in the assets under management by NAM were �20.1 trillion as of September�30 2014, a �2.7 trillion or 15% increase from September�30, 2013. We saw continuous inflows into our products during the six months ended September�30, 2014. For our investment advisory business, assets under management were �12.1�trillion as of September�30, 2014, a �0.4�trillion or 3% increase from September�30, 2013.
The following table shows NAM�s share, in terms of net asset value, in the Japanese asset management market as of September�30, 2013 and 2014.
�
| � | �� | September�30 | � | |||||
| � | �� | 2013 | � | � | 2014 | � | ||
| Total of publicly offered investment trusts |
�� | � | 23 | %� | � | � | 23 | %� |
| Stock investment trusts |
�� | � | 18 | %� | � | � | 19 | %� |
| Bond investment trusts |
�� | � | 42 | %� | � | � | 43 | %� |
Wholesale
In Wholesale, we are engaged in the sales and trading of debt securities and equity securities and currencies on a global basis to various institutions, providing investment banking services such as the underwriting of bonds and equities as well as mergers and acquisitions and financial advice and investing in private equity businesses with the goal of maximizing returns on these investments by increasing the corporate value of investee companies.
�
| � | �� | Millions of yen | � | |||||
| � | �� | Six�months�ended�September�30 | � | |||||
| � | �� | 2013 | � | �� | 2014 | � | ||
| Non-interest revenues |
�� | � | 313,738 | �� | �� | � | 299,636 | �� |
| Net interest revenue |
�� | � | 64,219 | �� | �� | � | 79,820 | �� |
| �� | � |
� |
� | �� | � |
� |
� | |
| Net revenue |
�� | � | 377,957 | �� | �� | � | 379,456 | �� |
| Non-interest expenses |
�� | � | 327,435 | �� | �� | � | 351,508 | �� |
| �� | � |
� |
� | �� | � |
� |
� | |
| Income (loss) before income taxes |
�� | � | 50,522 | �� | �� | � | 27,948 | �� |
| �� | � |
� |
� | �� | � |
� |
� | |
Net revenue increased by 0.4% from �377,957�million for the six months ended September�30, 2013 to �379,456�million for the six months ended September�30, 2014.
�
9
Table of Contents
Non-interest expenses increased by 7.4% from �327,435�million for the six months ended September�30, 2013 to �351,508�million for the six months ended September�30, 2014.
Income before income taxes decreased by 44.7% from �50,522�million for the six months ended September�30, 2013 to �27,948�million for the six months ended September�30, 2014.
The breakdown of net revenue for Wholesale is as follows:
�
| � | �� | Millions of yen | � | |||||
| � | �� | Six�months�ended�September�30 | � | |||||
| � | �� | 2013 | � | �� | 2014 | � | ||
| Fixed Income |
�� | � | 191,312 | �� | �� | � | 208,610 | �� |
| Equities |
�� | � | 133,615 | �� | �� | � | 126,020 | �� |
| Investment Banking (Net) |
�� | � | 48,899 | �� | �� | � | 45,237 | �� |
| Investment Banking (Other) |
�� | � | 4,131 | �� | �� | � | (411 | )� |
| �� | � |
� |
� | �� | � |
� |
� | |
| Investment Banking |
�� | � | 53,030 | �� | �� | � | 44,826 | �� |
| �� | � |
� |
� | �� | � |
� |
� | |
| Net revenue |
�� | � | 377,957 | �� | �� | � | 379,456 | �� |
| �� | � |
� |
� | �� | � |
� |
� | |
| Investment Banking (Gross) |
�� | � | 92,968 | �� | �� | � | 83,887 | �� |
| �� | � |
� |
� | �� | � |
� |
� | |
For Fixed Income, net revenue increased by 9.0% from �191,312�million for the six months ended September�30, 2013 to �208,610�million for the six�months ended September�30, 2014 due to high performances of FX trading. For Equities, net revenue decreased by 5.7% from �133,615�million for the six months ended September�30, 2013 to �126,020�million for the six�months ended September�30, 2014 due to the slowdown of Japanese equity market environment. For Investment Banking, net revenue decreased by 15.5% from �53,030�million for the six months ended September�30, 2013 to �44,826�million for the six�months ended September�30, 2014, primarily due to a decrease in the volume of capital market transactions in Japan.
Other Operating Results
Other operating results include net gain (loss) related to economic hedging transactions, realized gain (loss) on investments in equity securities held for operating purposes, equity in earnings of affiliates, corporate items, and other financial adjustments. See Note 16 �Segment and geographic information� in our interim consolidated financial statements.
Net revenue was �72,681�million for the six months ended September�30, 2013 and �89,294�million for the six months ended September�30, 2014. Non-interest expenses were �83,176�million for the six months ended September�30, 2013 and �84,206�million for the six months ended September�30, 2014. Loss before income taxes in other operating results was �10,495�million for the six months ended September�30, 2013 and income before income taxes in other operating results was �5,088�million for the six months ended September�30, 2014.
Other operating results for the six months ended September�30, 2014 include losses from changes in the fair value of the financial liabilities, for which the fair value option was elected, attributable to the change in our creditworthiness of �2.2 billion; the negative impact of our own creditworthiness on derivative liabilities, which resulted in losses of �5.5 billion; and gains from changes in counterparty credit spreads of �7.0 billion.
Number of Employees
The following table shows the number of our employees as of September�30, 2013 and 2014.
�
| � | �� | September�30 | � | |||||
| � | �� | 2013 | � | �� | 2014 | � | ||
| Japan |
�� | � | 16,377 | �� | �� | � | 16,244 | �� |
| Europe |
�� | � | 3,459 | �� | �� | � | 3,530 | �� |
| Americas |
�� | � | 2,243 | �� | �� | � | 2,421 | �� |
| Asia and Oceania |
�� | � | 5,945 | �� | �� | � | 6,744 | �� |
| �� | � |
� |
� | �� | � |
� |
� | |
| Total |
�� | � | 28,024 | �� | �� | � | 28,939 | �� |
| �� | � |
� |
� | �� | � |
� |
� | |
�
10
Table of Contents
Summary of Regional Contributions
For a summary of our net revenue, income (loss) before income taxes and long-lived assets by geographic region, see Note 16 �Segment and geographic information� in our interim consolidated financial statements.
Regulatory Capital Requirements
Many of our business activities are subject to statutory capital requirements, including those of Japan, the U.S., the U.K. and certain other countries in which we operate.
Translation Exposure
A significant portion of our business is conducted in currencies other than yen�most significantly, U.S. dollars, British pounds and Euros. We prepare financial statements of each of our consolidated entities in its functional currency, which is the currency of the primary economic environment in which the entity operates. Translation exposure is the risk arising from the effect of fluctuations in exchange rates on the net assets of our foreign subsidiaries. Translation exposure is not recognized in our consolidated statements of income unless and until we dispose of, or liquidate, the relevant foreign subsidiary, which historically has not occurred, and which we do not expect to occur frequently.
Critical Accounting Policies and Estimates
Use of Estimates
In preparing our interim consolidated financial statements, management makes estimates regarding certain financial instrument and investment valuations, the outcome of litigation and tax examinations, the recovery of the carrying value of goodwill, the allowance for doubtful accounts, the realization of deferred tax assets and other matters that affect the reported amounts of assets and liabilities as well as the disclosures in these interim consolidated financial statements. Estimates, by their nature, are based on judgment and available information. Therefore, actual results may differ from estimates, which could have a material impact on the interim consolidated financial statements, and it is possible that such adjustments could occur in the near term.
Fair Value for Financial Instruments
A significant amount of our financial instruments are carried at fair value, with changes in fair value recognized through the consolidated statements of income or the consolidated statements of comprehensive income on a recurring basis. Use of fair value is either specifically required under U.S. GAAP or we make an election to use fair value for certain eligible items under the fair value option.
Other financial assets and financial liabilities are carried at fair value on a nonrecurring basis, where the primary measurement basis is not fair value. Fair value is only used in specific circumstances after initial recognition, such as to measure impairment.
In accordance with Accounting Standards CodificationTM (�ASC�) 820 �Fair Value Measurements and Disclosures�, all financial instruments measured at fair value have been categorized into a three-level hierarchy based on the transparency of valuation inputs used to establish fair value.
Level 1:
Unadjusted quoted prices for identical financial instruments in active markets accessible by Nomura at the measurement date.
Level 2:
Quoted prices in inactive markets or prices containing other inputs which are observable, either directly or indirectly. Valuation techniques using observable inputs reflect assumptions used by market participants in pricing financial instruments and are based on data obtained from independent market sources at the measurement date.
Level 3:
Unobservable inputs that are significant to the fair value measurement of the financial instrument. Valuation techniques using unobservable inputs reflect management�s assumptions about the estimates used by other market participants in valuing similar financial instruments. These valuation techniques are developed based on the best available information at the measurement date.
The availability of inputs observable in the market varies by product and can be affected by a variety of factors. Significant factors include, but are not restricted to the prevalence of similar products in the market, especially for customized products, how established the product is in the market, for example, whether it is a new product or is relatively mature, and the reliability of information provided in the market which would depend, for example, on the frequency and volume of current data. A period of significant change in the market may reduce the availability of observable data. Under such circumstances, financial instruments may be reclassified into a lower level in the fair value hierarchy.
�
11
Table of Contents
Significant judgments used in determining the classification of financial instruments include the nature of the market in which the product would be traded, the underlying risks, the type and liquidity of market data inputs and the nature of observed transactions for similar instruments.
Where valuation models include the use of parameters which are less observable or unobservable in the market, significant management judgment is used in establishing fair value. The valuations for Level 3 financial instruments, therefore, involve a greater degree of judgment than those valuations for Level 1 or Level 2 financial instruments.
Certain criteria management use to determine whether a market is active or inactive include the number of transactions, the frequency that pricing is updated by other market participants, the variability of price quotes among market participants, and the amount of publicly available information.
Level 3 financial assets excluding derivatives as a proportion of total financial assets excluding derivatives, carried at fair value on a recurring basis was 2% as of September�30, 2014 as listed below:
�
| � | �� | Billions of yen, except percentages | � | |||||||||||||||||||||
| � | �� | September�30, 2014 | � | |||||||||||||||||||||
| � | �� | Level�1 | � | �� | Level 2 | � | �� | Level�3 | � | �� | Counterparty and Cash�Collateral Netting |
� | � | Total | � | �� | The�proportion�of Level 3 |
� | ||||||
| Financial assets measured at fair value (Excluding derivative assets) |
�� | � | 11,143 | �� | �� | � | 9,160 | �� | �� | � | 347 | �� | �� | � | ��� | � | � | � | 20,650 | �� | �� | � | 2 | %� |
| Derivative assets |
�� | � | 810 | �� | �� | � | 31,147 | �� | �� | � | 193 | �� | �� | � | (30,054 | )� | � | � | 2,096 | �� | �� | |||
| Derivative liabilities |
�� | � | 772 | �� | �� | � | 30,886 | �� | �� | � | 247 | �� | �� | � | (30,155 | )� | � | � | 1,750 | �� | �� | |||
See Note 2 �Fair value measurements� in our interim consolidated financial statements.
Private equity business
All private equity investments made by investment company subsidiaries pursuant to the provisions of ASC 946 �Financial Services�Investment Companies� (�ASC 946�) are accounted for at fair value, with changes in fair value recognized through our interim consolidated statements of income.
The valuation of unlisted private equity investments requires significant management judgment because the investments, by their nature, have little or no price transparency. Private equity investments are initially carried at cost as an approximation of fair value. Adjustments to carrying value are made if there is third-party evidence of a change in value. Adjustments are also made, in the absence of third party transactions, if it is determined that the expected exit price of the investment is different from carrying value. In reaching that determination, Nomura primarily uses either a discounted cash flow (�DCF�) or market multiple valuation technique. A DCF valuation technique incorporates estimated future cash flows to be generated from the underlying investee, as adjusted for an appropriate growth rate discounted at a weighted average cost of capital. Market multiple valuation techniques include comparables such as Enterprise Value/earnings before interest, taxes, depreciation and amortization ratios, Price/Earnings ratios, Price/Book ratios, Price/Embedded Value ratios and other multiples based on relationships between numbers reported in the financial statements of the investee and the price of comparable companies. A liquidity discount may also be applied to either a DCF or market multiple valuation to reflect the specific characteristics of the investee. Where possible these valuations are compared with the operating cash flows and financial performance of the companies or properties relative to budgets or projections, price/earnings data for similar quoted investee, trends within sectors and/or regions and any specific rights or terms associated with the investment, such as conversion features and liquidation preferences. Private equity investments are generally classified as Level 3 since the valuation inputs such as those mentioned above are usually unobservable.
Any changes to valuations are then stress tested to assess the impact of particular risk factors in order to establish the final estimated valuation. For more information on our private equity activities, see �Private Equity Business� below.
Assets and Liabilities Associated with Investment and Financial Services Business
Exposure to Certain Financial Instruments and Counterparties
Market conditions impact numerous products including securitization products and leveraged finance to which we have certain exposure. We also have exposures to Special Purpose Entities (�SPEs�) and others in the normal course of business.
�
12
Table of Contents
Securitization Products
Our exposure to securitization products consists of commercial mortgage-backed securities (�CMBS�), residential mortgage-backed securities (�RMBS�), and other securitization products. We hold these securitization products in connection with securitization, financing, trading and other activities. The following table provides a summary of our exposure to securitization products by geographic region of the underlying collateral as of September�30, 2014.
�
| � | �� | Millions of yen | � | |||||||||||||||||
| � | �� | September�30, 2014 | � | |||||||||||||||||
| � | �� | Japan | � | �� | Europe | � | �� | Americas | � | �� | Asia�
and Oceania |
� | �� | Total(1) | � | |||||
|
CMBS(2) |
�� | � | 2,062 | �� | �� | � | 24,779 | �� | �� | � | 69,515 | �� | �� | � | ��� | � | �� | � | 96,356 | �� |
|
RMBS(2)(3) |
�� | � | 17,594 | �� | �� | � | 56,509 | �� | �� | � | 342,730 | �� | �� | � | 645 | �� | �� | � | 417,478 | �� |
| Other securitization products(4) |
�� | � | 84,078 | �� | �� | � | 181,997 | �� | �� | � | 199,433 | �� | �� | � | ��� | � | �� | � | 465,508 | �� |
| �� | � |
� |
� | �� | � |
� |
� | �� | � |
� |
� | �� | � |
� |
� | �� | � |
� |
� | |
| Total |
�� | � | 103,734 | �� | �� | � | 263,285 | �� | �� | � | 611,678 | �� | �� | � | 645 | �� | �� | � | 979,342 | �� |
| �� | � |
� |
� | �� | � |
� |
� | �� | � |
� |
� | �� | � |
� |
� | �� | � |
� |
� | |
�
| (1) | The balances shown exclude certain CMBS of �23,166�million for which we transferred financial assets to securitization vehicles where such transfers were accounted for as secured financings rather than sales under ASC 860 �Transfers and Servicing� (�ASC 860�), and in which we have no continuing economic exposure because the beneficial interests in the vehicles have been sold to third parties. |
| (2) | We have �33,472�million exposure, as whole loans and commitments, to U.S. CMBS and RMBS-related business as of September�30, 2014. |
| (3) | The RMBS balance for Americas excludes mortgage pass-through securities and U.S. government guaranteed collateralized mortgage obligations (�CMOs�) of �1,713,438�million, because their credit risks are considered minimal. |
| (4) | Includes collateralized loan obligations (�CLOs�), collateralized debt obligations (�CDOs�) and asset-backed securities (�ABS�) such as those secured on credit card loans, auto loans, student loans and home equity loans. |
The following table provides our exposure to CMBS by geographic region and the external credit ratings of the underlying collateral as of September�30, 2014. Ratings are based on the lowest ratings given by Standard�& Poor�s Financial Services LLC, Moody�s Investors Service, Inc., Fitch Ratings Ltd., Japan Credit Rating Agency, Ltd. or Rating and Investment Information, Inc. as of September�30, 2014.
�
| � | �� | Millions of yen | � | |||||||||||||||||||||||||||||
| � | �� | September�30, 2014 | � | |||||||||||||||||||||||||||||
| � | �� | AAA | � | �� | AA | � | �� | A | � | �� | BBB | � | �� | BB | � | �� | B and lower |
� | �� | Not�rated | � | �� | Total | � | ||||||||
| Japan |
�� | � | ��� | � | �� | � | ��� | � | �� | � | ��� | � | �� | � | ��� | � | �� | � | 302 | �� | �� | � | 1,674 | �� | �� | � | 86 | �� | �� | � | 2,062 | �� |
| Europe |
�� | � | ��� | � | �� | � | ��� | � | �� | � | 3,846 | �� | �� | � | 8,173 | �� | �� | � | 6,191 | �� | �� | � | 6,487 | �� | �� | � | 82 | �� | �� | � | 24,779 | �� |
| Americas |
�� | � | 24,425 | �� | �� | � | 3,413 | �� | �� | � | 12,003 | �� | �� | � | 7,459 | �� | �� | � | 5,761 | �� | �� | � | 15,359 | �� | �� | � | 1,095 | �� | �� | � | 69,515 | �� |
| �� | � |
� |
� | �� | � |
� |
� | �� | � |
� |
� | �� | � |
� |
� | �� | � |
� |
� | �� | � |
� |
� | �� | � |
� |
� | �� | � |
� |
� | |
| Total |
�� | � | 24,425 | �� | �� | � | 3,413 | �� | �� | � | 15,849 | �� | �� | � | 15,632 | �� | �� | � | 12,254 | �� | �� | � | 23,520 | �� | �� | � | 1,263 | �� | �� | � | 96,356 | �� |
| �� | � |
� |
� | �� | � |
� |
� | �� | � |
� |
� | �� | � |
� |
� | �� | � |
� |
� | �� | � |
� |
� | �� | � |
� |
� | �� | � |
� |
� | |
Leveraged Finance
We provide loans to clients in connection with leveraged buy-outs and leveraged buy-ins. As this type of finance is usually initially provided through a commitment, we have both funded and unfunded exposures on these transactions.
The following table sets forth our exposure to leveraged finance by geographic location of the target company as of September�30, 2014.
�
| � | �� | Millions of yen | � | |||||||||
| � | �� | September�30, 2014 | � | |||||||||
| � | �� | Funded | � | �� | Unfunded | � | �� | Total | � | |||
| Europe |
�� | � | 7,763 | �� | �� | � | 11,276 | �� | �� | � | 19,039 | �� |
| Americas |
�� | � | 15,440 | �� | �� | � | 128,753 | �� | �� | � | 144,193 | �� |
| �� | � |
� |
� | �� | � |
� |
� | �� | � |
� |
� | |
| Total |
�� | � | 23,203 | �� | �� | � | 140,029 | �� | �� | � | 163,232 | �� |
| �� | � |
� |
� | �� | � |
� |
� | �� | � |
� |
� | |
�
13
Table of Contents
Special Purpose Entities (�SPEs�)
Our involvement with these entities includes structuring, underwriting, as well as, subject to prevailing market conditions, distributing and selling debt instruments and beneficial interests issued by these entities. In the normal course of securitization and equity derivative activities business, we also act as a transferor of financial assets to, and underwriter, distributor and seller of repackaged financial instruments issued by these entities. We retain, purchase and sell variable interests in SPEs in connection with our market-making, investing and structuring activities. Our other types of involvement with SPEs include guarantee agreements and derivative contracts.
For further discussion on Nomura�s involvement with variable interest entities (�VIEs�), see Note 6 �Securitizations and Variable Interest Entities� in our interim consolidated financial statements.
Accounting Developments
See Note 1 �Summary of accounting policies: New accounting pronouncements recently adopted� in our interim consolidated financial statements.
Private Equity Business
Nomura makes private equity investments primarily in Japan and Europe.
Private equity investments made by certain entities which Nomura consolidates under either a voting interest or variable interest model which are investment companies pursuant to the provisions of ASC 946 are accounted for at fair value, with changes in fair value recognized through the consolidated statements of income. Investment company accounting applied by each of these investment company subsidiaries is retained in our interim consolidated financial statements.
These entities make private equity investments solely for capital appreciation, current income or both rather than to generate strategic operating benefits to Nomura. In accordance with Nomura�s investment policies, non-investment companies within the group may not make investments in entities engaged in non-core businesses if such investments would result in consolidation or application of the equity method of accounting. Such investments may generally only be made by investment company subsidiaries. Non-core businesses are defined as those engaged in activities other than Nomura�s business segments.
Nomura also has a subsidiary which is not an investment company but which makes investments in entities engaged in Nomura�s core businesses. These investments are made for capital appreciation or current income purposes or both and are also carried at fair value, either because of election of the fair value option or other U.S. GAAP requirements.
Private Equity Business in Japan
Nomura makes private equity investments through a wholly-owned subsidiary, Nomura Financial Partners Co., Ltd. (�NFP�). NFP is not an investment company subsidiary as it invests in entities engaged in our core business. We elected the fair value option to account for its 37.1% investment in the common stock of Ashikaga Holdings Co., Ltd.
Private Equity Business in Europe
In Europe, Nomura�s private equity investments primarily comprise legacy investments made by its former Principal Finance Group (�PFG�) now managed by Terra Firma (collectively referred to as the �Terra Firma Investments�), investments in other funds managed by Terra Firma (�Other Terra Firma Funds�) and through other investment company subsidiaries (�Other Investments�).
�
14
Table of Contents
Terra Firma Investments
Nomura contributed our European private equity investments to Terra Firma Capital Partners I (�TFCP I�), a limited partnership which is engaged in the private equity business, in exchange for a limited partnership interest. Terra Firma Investments (GP) Limited, the general partner of TFCP I, which is independent of Nomura, assumed the management and control of these investments.
The Terra Firma Investments are held by entities which are investment company subsidiaries and therefore Nomura accounted for these investments at fair value, with changes in fair value recognized through the interim consolidated statements of income.
Other Terra Firma Funds
In addition to the Terra Firma Investments, Nomura is a 10% investor in a �269 billion private equity fund (�TFCP II�) and a 2% investor in a �717 billion private equity fund (�TFCP�III�), also raised and managed by Terra Firma Capital Partners Limited.
Nomura�s total commitment for TFCP II was originally �26,919�million and reduced to �50�million as a result of adjustments for recyclable distributions. As of September�30, 2014, no amount had been drawn down for investments.
For TFCP III, Nomura�s total commitment was �13,589�million and �13,461�million had been drawn down for investments as of September�30, 2014.
The investments in TFCP II and TFCP III are carried at fair value, with changes in fair value recognized through the interim consolidated statements of income.
Other Investments
Nomura also makes private equity investments through wholly-owned subsidiaries and other consolidated entities which have third party pooling of funds. Certain of these entities are investment company subsidiaries and therefore all of their investments are carried at fair value, with changes in fair value recognized through the interim consolidated statements of income.
�
15
Table of Contents
Deferred Tax Assets Information
Details of deferred tax assets and liabilities
Details of deferred tax assets and liabilities reported within Other assets�Other and Other liabilities respectively in the consolidated balance sheets as of September�30, 2014 are as follows:
�
| � | �� | Millions�of�yen | � | |
| � | �� | September�30,�2014 | � | |
| Deferred tax assets |
�� | |||
| Depreciation, amortization and valuation of fixed assets |
�� | � | 14,432 | �� |
| Investments in subsidiaries and affiliates |
�� | � | 34,428 | �� |
| Valuation of financial instruments |
�� | � | 59,178 | �� |
| Accrued pension and severance costs |
�� | � | 6,167 | �� |
| Other accrued expenses and provisions |
�� | � | 98,506 | �� |
| Operating losses |
�� | � | 456,521 | �� |
| Other |
�� | � | 3,280 | �� |
| �� | � |
� |
� | |
| Gross deferred tax assets |
�� | � | 672,512 | �� |
| Less�Valuation allowance |
�� | � | (518,604 | )� |
| �� | � |
� |
� | |
| Total deferred tax assets |
�� | � | 153,908 | �� |
| �� | � |
� |
� | |
| Deferred tax liabilities |
�� | |||
| Investments in subsidiaries and affiliates |
�� | � | 111,310 | �� |
| Valuation of financial instruments |
�� | � | 52,774 | �� |
| Undistributed earnings of foreign subsidiaries |
�� | � | 736 | �� |
| Valuation of fixed assets |
�� | � | 19,065 | �� |
| Other |
�� | � | 5,962 | �� |
| �� | � |
� |
� | |
| Total deferred tax liabilities |
�� | � | 189,847 | �� |
| �� | � |
� |
� | |
| Net deferred tax assets |
�� | � | (35,939 | )� |
| �� | � |
� |
� | |
Calculation method of deferred tax assets
In accordance with U.S. GAAP, we recognize deferred tax assets to the extent we believe that it is more likely than not that a benefit will be realized. A valuation allowance is provided for tax benefits available to us, which are not deemed more likely than not to be realized.
Legal Proceedings
For a discussion of our litigation and related matters, see Note 15 �Commitments, contingencies and guarantees� in our interim consolidated financial statements.
Liquidity and Capital Resources
Funding and Liquidity Management
Overview
We define liquidity risk as the risk of losses arising from difficulty in securing the necessary funding or from a significantly higher cost of funding than normal levels due to deterioration of the Nomura Group�s creditworthiness or deterioration in market conditions. This risk could arise from Nomura-specific or market-wide events such as inability to access the secured or unsecured debt markets, a deterioration in our credit ratings, a failure to manage unplanned changes in funding requirements, a failure to liquidate assets quickly and with minimal loss in value, or changes in regulatory capital restrictions which may prevent the free flow of funds between different group entities. Our liquidity risk management policy is based on liquidity risk appetite which the Group Integrated Risk Management Committee formulates upon delegation by the Executive Management Board (�EMB�). Nomura�s liquidity risk management, under market-wide stress and in addition, under Nomura-specific stress, seeks to ensure enough continuous liquidity to meet all funding requirements and unsecured debt obligations across one year and one month periods, respectively, without raising funds through unsecured funding or through the liquidation of assets.
We have in place a number of liquidity risk management frameworks that enable us to achieve our primary liquidity objective. These frameworks include (1)�Centralized Control of Residual Cash and Maintenance of Liquidity Portfolio; (2)�Appropriate Funding and Diversification of Funding Sources and Maturities Commensurate with the Composition of Assets; (3)�Management of Credit Lines to Nomura Group Entities; (4)�Implementation of Liquidity Stress Tests; and (5)�Contingency Funding Plan.
Our EMB has the authority to make decisions concerning the group liquidity management. The Chief Financial Officer (�CFO�) has the operational authority and responsibility over our liquidity management based on decisions made by the EMB.
�
16
Table of Contents
1.�Centralized Control of Residual Cash and Maintenance of Liquidity Portfolio.
We centrally control residual cash held at Nomura Group entities for effective liquidity utilization purposes. As for the usage of funds, the CFO decides the maximum amount of available funds, provided without posting any collateral, for allocation within Nomura and the EMB allocates the funds to each business division. Global Treasury monitors the usage by businesses and reports to the EMB.
In order to enable us to transfer funds smoothly between group entities, we limit the issuance of securities by regulated broker-dealers or banking entities within the Nomura Group and seek to raise unsecured funding primarily through the Company or through unregulated subsidiaries. The primary benefits of this strategy include cost minimization, wider investor name recognition and greater flexibility in providing funding to various subsidiaries across the Nomura Group.
To meet any potential liquidity requirement, we maintain a liquidity portfolio in the form of cash and highly liquid, unencumbered securities that may be sold or pledged to provide liquidity. As of September�30, 2014, our liquidity portfolio was �5,793.1 billion which generated a liquidity surplus taking into account stress scenarios.
The following table presents a breakdown of our liquidity portfolio by type of financial assets as of March�31, 2014 and September�30, 2014 and averages maintained for the years ended March�31, 2014 and for six months ended September�30, 2014. Yearly and six months averages are calculated using month-end amounts.
�
| � | �� | Billions of yen | � | |||||||||||||
| � | �� | Average�for year�ended March�31,�2014 |
� | �� | March�31,�2014 | � | �� | Average�for six months�ended September�30,�2014 |
� | �� | September�30,�2014 | � | ||||
| Cash, cash equivalents and time deposits(1) |
�� | � | 1,676.6 | �� | �� | � | 1,497.2 | �� | �� | � | 1,697.7 | �� | �� | � | 1,311.1 | �� |
| Government securities |
�� | � | 4,667.3 | �� | �� | � | 4,483.6 | �� | �� | � | 4,422.3 | �� | �� | � | 4,314.3 | �� |
| Others(2) |
�� | � | 214.9 | �� | �� | � | 146.4 | �� | �� | � | 216.1 | �� | �� | � | 167.6 | �� |
| �� | � |
� |
� | �� | � |
� |
� | �� | � |
� |
� | �� | � |
� |
� | |
| Total liquidity portfolio |
�� | � | 6,558.8 | �� | �� | � | 6,127.2 | �� | �� | � | 6,336.1 | �� | �� | � | 5,793.1 | �� |
| �� | � |
� |
� | �� | � |
� |
� | �� | � |
� |
� | �� | � |
� |
� | |
�
| (1) | Cash, cash equivalents, and time deposits include nostro balances and deposits with both central banks and market counterparties that are readily available to support the liquidity position of Nomura. |
| (2) | Others include other liquid financial assets such as money market funds and U.S. agency securities. |
The following table presents a breakdown of our liquidity portfolio by currency as of March�31, 2014 and September�30, 2014 and averages maintained for the years ended March�31, 2014 and for six months ended September�30, 2014. Yearly and six months averages are calculated using month-end amounts.
�
| � | �� | Billions of yen | � | |||||||||||||
| � | �� | Average�for year�ended March�31,�2014 |
� | �� | March�31,�2014 | � | �� | Average�for six�months�ended September�30,�2014 |
� | �� | September�30,�2014 | � | ||||
| Japanese Yen |
�� | � | 2,463.3 | �� | �� | � | 2,272.3 | �� | �� | � | 2,406.3 | �� | �� | � | 1,906.7 | �� |
| U.S. Dollar |
�� | � | 2,171.5 | �� | �� | � | 2,050.4 | �� | �� | � | 2,227.9 | �� | �� | � | 2,118.4 | �� |
| Euro |
�� | � | 1,015.0 | �� | �� | � | 1,049.0 | �� | �� | � | 1,046.7 | �� | �� | � | 1,236.6 | �� |
| British Pound |
�� | � | 662.4 | �� | �� | � | 568.6 | �� | �� | � | 565.5 | �� | �� | � | 425.5 | �� |
| Others(1) |
�� | � | 246.6 | �� | �� | � | 186.9 | �� | �� | � | 89.6 | �� | �� | � | 105.9 | �� |
| �� | � |
� |
� | �� | � |
� |
� | �� | � |
� |
� | �� | � |
� |
� | |
| Total liquidity portfolio |
�� | � | 6,558.8 | �� | �� | � | 6,127.2 | �� | �� | � | 6,336.1 | �� | �� | � | 5,793.1 | �� |
| �� | � |
� |
� | �� | � |
� |
� | �� | � |
� |
� | �� | � |
� |
� | |
�
| (1) | Includes other currencies such as the Canadian dollar, the Australian dollar and the Swiss franc. |
We assess our liquidity portfolio requirements globally as well as by each major operating entity in the Nomura Group. We primarily maintain our liquidity portfolio at Nomura Holdings, Inc. (�NHI�) and Nomura Securities Co. Ltd (�NSC�), our other major broker-dealer subsidiaries, our bank subsidiaries, and other group entities. In determining the amounts and entities which hold this liquidity portfolio, we consider legal, regulatory and tax restrictions which may impact our ability to freely transfer liquidity across different entities in the Nomura Group.
�
17
Table of Contents
The following table presents a breakdown of our liquidity portfolio by entity as of March�31, 2014 and September�30, 2014.
�
| � | �� | Billions of yen | � | |||||
| � | �� | March�31,�2014 | � | �� | September�30,�2014 | � | ||
| NHI and NSC(1) |
�� | � | 1,900.9 | �� | �� | � | 1,612.0 | �� |
| Major broker-dealer subsidiaries |
�� | � | 2,815.2 | �� | �� | � | 2,847.1 | �� |
| Bank subsidiaries(2) |
�� | � | 1,170.5 | �� | �� | � | 1,081.8 | �� |
| Other group entities |
�� | � | 240.6 | �� | �� | � | 252.1 | �� |
| �� | � |
� |
� | �� | � |
� |
� | |
| Total liquidity portfolio |
�� | � | 6,127.2 | �� | �� | � | 5,793.1 | �� |
| �� | � |
� |
� | �� | � |
� |
� | |
�
| (1) | NSC, a broker dealer located in Japan, holds an account with the Bank of Japan (�BOJ�) and has direct access to the BOJ Lombard facility through which same day funding is available for our securities pool. Any liquidity surplus at NHI is lent to NSC via short-term intercompany loans, which can be unwound immediately when needed. |
| (2) | Includes Nomura Bank International plc (�NBI�), Nomura Singapore Limited and Nomura Bank Luxembourg S.A. |
In addition to our liquidity portfolio, we had �1,923.5 billion of other unencumbered assets comprising mainly unpledged trading assets that can be used as an additional source of secured funding. The aggregate of our liquidity portfolios and other unencumbered assets as of September�30, 2014 was �7,716.6 billion, which represented 279.4% of our total unsecured debt maturing within one year.
�
| � | �� | Billions of yen | � | |||||
| � | �� | March�31,�2014 | � | �� | September�30,�2014 | � | ||
| Net liquidity value of other unencumbered assets |
�� | � | 1,720.3 | �� | �� | � | 1,923.5 | �� |
| Liquidity portfolio |
�� | � | 6,127.2 | �� | �� | � | 5,793.1 | �� |
| �� | � |
� |
� | �� | � |
� |
� | |
| Total |
�� | � | 7,847.5 | �� | �� | � | 7,716.6 | �� |
| �� | � |
� |
� | �� | � |
� |
� | |
2.�Appropriate Funding and Diversification of Funding Sources and Maturities Commensurate with the Composition of Assets
We seek to maintain a surplus of long-term debt and equity above the cash capital requirements of our assets. This enables us to fund our operations for at least one year in a market-wide stress event, without needing to raise unsecured funding or force the liquidation of assets. The amount of liquidity required is based on an internal model which incorporates the following requirements:
�
| � | (i) | Our ability to finance assets using secured funding, including repurchase agreements and securities lending transactions. The cash capital requirements are calculated using conservative estimates of the assets secured borrowing power in stressed scenarios. |
�
| � | (ii) | Goodwill and identifiable intangible assets, property, equipment and other illiquid assets. |
�
| � | (iii) | Collateral requirements on derivative contracts arising as a result of a two-notch downgrade in our credit rating. |
Collateral requirements to support potential increased intraday collateral requirements from our clearing and settlement agents arising as a result of a two-notch downgrade in our credit rating.
In addition, other unencumbered assets held at exchanges for other related requirements are also funded with long-term liquidity.
�
| � | (iv) | Commitments to lend to external counterparties based on the probability of drawdown. |
�
| � | (v) | Capital or other forms of financing in our regulated subsidiaries that is in excess of their long-term cash capital requirements. |
Our internal model takes into account legal, regulatory and tax restrictions that may impact the ability to freely transfer liquidity across the entities within the Nomura Group.
We seek to achieve diversification of our funding by market, instrument type, investors, currency, and staggered maturities in order to reduce unsecured refinancing risk.
We diversify funding by issuing various types of debt instruments�these include both structured loans and notes. Structured notes are debt obligations with returns linked to interest rates, equities, indices, currencies or commodities. We issue structured notes in order to increase the diversity of our debt instruments. We typically hedge the returns we are obliged to pay with derivatives and/or the underlying assets to maintain funding consistency with our unsecured long-term debt. The proportion of our non-yen denominated long-term debt slightly increased to 34.6% of total long-term debt outstanding as of September�30, 2014 from 32.0% as of March�31, 2014.
�
18
Table of Contents
2.1�Short-Term Unsecured Debt
Our short-term unsecured debt consists of short-term bank borrowings (including long-term bank borrowings maturing within one year), other loans, commercial paper, deposits at banking entities, certificates of deposit and debt securities maturing within one year. Deposits at banking entities and certificates of deposit comprise customer deposits and certificates of deposit held by our banking subsidiaries. Short-term unsecured debt includes the current portion of long-term unsecured debt.
The following table presents an analysis of our short-term unsecured debt by type of financial liability as of March�31, 2014 and September�30, 2014.
�
| � | �� | Billions of yen | � | |||||
| � | �� | March�31,�2014 | � | �� | September�30,�2014 | � | ||
| Short-term bank borrowings |
�� | � | 722.5 | �� | �� | � | 673.0 | �� |
| Other loans |
�� | � | 49.2 | �� | �� | � | 19.4 | �� |
| Commercial paper |
�� | � | 246.9 | �� | �� | � | 271.8 | �� |
| Deposits at banking entities |
�� | � | 757.7 | �� | �� | � | 702.1 | �� |
| Certificates of deposit |
�� | � | 240.5 | �� | �� | � | 213.5 | �� |
| Debt securities maturing within one year |
�� | � | 952.5 | �� | �� | � | 882.4 | �� |
| �� | � |
� |
� | �� | � |
� |
� | |
| Total short-term unsecured debt |
�� | � | 2,969.3 | �� | �� | � | 2,762.2 | �� |
| �� | � |
� |
� | �� | � |
� |
� | |
2.2�Long-Term Unsecured Debt
We meet our long-term capital requirements and also achieve both cost-effective funding and an appropriate maturity profile by routinely funding through long-term debt and diversifying across various maturities and currencies.
Our long-term unsecured debt includes senior and subordinated debt issued through U.S. registered shelf offerings and our U.S. registered medium-term note programs, our Euro medium-term note programs, registered shelf offerings in Japan and various other debt programs.
As a globally competitive financial services group in Japan, we have access to multiple global markets and major funding centers. The Company, NSC, Nomura Europe Finance N.V. (�NEF�) and NBI are the main group entities that borrow externally, issue debt instruments and engage in other funding activities. By raising funds to match the currencies and liquidities of our assets or by using foreign exchange swaps as necessary, we pursue optimization of our funding structures.
We use a wide range of products and currencies to ensure that our funding is efficient and well diversified across markets and investor types. Our unsecured senior debt is mostly issued without financial covenants, such as covenants related to adverse changes in our credit ratings, cash flows, results of operations or financial ratios, which could trigger an increase in our cost of financing or accelerate repayment of the debt.
The following table presents an analysis of our long-term unsecured debt by type of financial liability as of March�31, 2014 and September�30, 2014.
�
| � | �� | Billions of yen | � | |||||
| � | �� | March�31,�2014 | � | �� | September�30,�2014 | � | ||
| Long-term deposits at banking entities |
�� | � | 116.0 | �� | �� | � | 140.6 | �� |
| Long-term bank borrowings |
�� | � | 2,057.6 | �� | �� | � | 2,146.7 | �� |
| Other loans |
�� | � | 129.0 | �� | �� | � | 171.5 | �� |
| Debt securities(1) |
�� | � | 3,916.0 | �� | �� | � | 3,826.5 | �� |
| �� | � |
� |
� | �� | � |
� |
� | |
| Total long-term unsecured debt |
�� | � | 6,218.6 | �� | �� | � | 6,285.3 | �� |
| �� | � |
� |
� | �� | � |
� |
� | |
�
| (1) | Excludes long-term debt securities issued by consolidated special purpose entities and similar entities that meet the definition of variable interest entities under ASC 810, �Consolidation� and secured financing transactions recognized within long-term borrowings as a result of transfers of financial assets that are accounted for as financings rather than sales in accordance with ASC 860. |
�
19
Table of Contents
2.3�Maturity Profile
We also seek to maintain an average maturity for plain vanilla instruments greater than or equal to three years. The average maturity for plain vanilla debt securities and borrowings with maturities longer than one year was 3.8 years as of September�30, 2014. A significant amount of our medium-term notes are structured and linked to interest rates, equities, indices, currencies or commodities. These maturities are evaluated based on our internal model and monitored by Global Treasury. Maturities for plain vanilla debt securities and borrowings are evaluated based on contractual maturities. Where there is a possibility that these may be called prior to their scheduled maturity date, maturities are based on our internal stress option adjusted model. This model values the embedded optionality under stress market conditions in order to determine when the debt securities or borrowing is likely to be called.
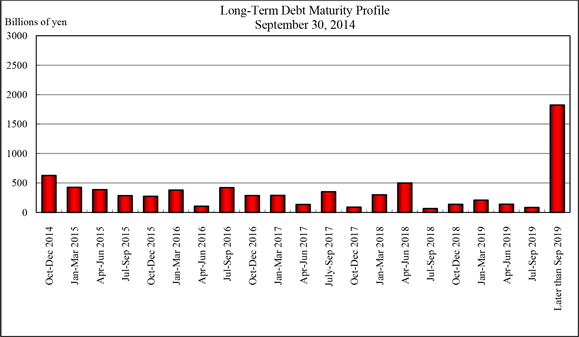
On this basis, the average maturity of structured notes (notes with maturities longer than one year) was 6.4�years as of September�30, 2014. The average maturity of our entire long-term debt portfolio, including plain vanilla debt securities and borrowings, was 4.8 years as of September�30, 2014. The graph below shows the distribution of maturities of our outstanding long-term debt securities and borrowings.
�
�
Redemption schedule is individually estimated by considering the probability of redemption.
2.4�Secured Borrowings
We typically fund our trading activities on a secured basis through secured borrowings, repurchase agreements and Japanese �Gensaki Repo� transactions. We believe these funding activities in the secured markets are more cost-efficient and less credit-rating sensitive than financing in the unsecured market. Also, repurchase agreements tend to be short-term, often overnight. We lower the liquidity risks arising from secured funding by transacting with a diverse group of global counterparties, delivering various types of securities collateral, and actively seeking long-term agreements. For more detail of secured borrowings and repurchase agreements, see Note 4 �Collateralized transactions� in our consolidated financial statements.
3.�Management of Credit Lines to Nomura Group entities
We have committed facility agreements with financial institutions as part of our contingent financing sources. Total unused committed facilities stayed the same at �65.0 billion as of September�30, 2014 from �65.0 billion as of March�31, 2014. We have structured facilities to ensure that the maturity dates of these facilities are distributed evenly throughout the year in order to prevent excessive maturities of facilities in any given period. While the ability to borrow under these facilities is subject to customary lending conditions and covenants, we do not believe that any of the covenant requirements will impair our ability to draw on the facilities. We occasionally test the effectiveness of our drawdown procedures.
�
20
Table of Contents
4.�Implementation of Liquidity Stress Tests
We maintain our liquidity portfolio and monitor the sufficiency of our liquidity based on an internal model which simulates changes in cash outflow under specified stress scenarios to comply with our above mentioned liquidity management policy.
We assess the liquidity requirements of the Nomura Group under various stress scenarios with differing levels of severity over multiple time horizons. We evaluate these requirements under Nomura-specific and broad market-wide events, including potential credit rating downgrades at our parent company and subsidiary levels that may impact us by loss of access to unsecured capital markets, additional collateral posting requirements, limited or no access to secured funding markets and other events. We call this risk analysis our �Maximum Cumulative Outflow (�MCO�)� framework.
The MCO framework is designed to incorporate the primary liquidity risks for Nomura and models the relevant cash flows in the following two primary scenarios:
�
| � | � | � | Stressed scenario�To maintain adequate liquidity during a severe market-wide liquidity event without raising funds through unsecured financing or the liquidation of assets for a year; and |
�
| � | � | � | Acute stress scenario�To maintain adequate liquidity during a severe market-wide liquidity event coupled with credit concerns regarding Nomura�s liquidity position, without raising funds through unsecured funding or the liquidation of assets for one month. |
We assume that Nomura will not be able to liquidate assets or adjust its business model during the time horizons used in each of these scenarios. The MCO framework therefore defines the amount of liquidity required to be held in order to meet our expected liquidity needs in a stress event to a level we believe appropriate based on our liquidity risk appetite.
As of September�30, 2014, our liquidity portfolio exceeded net cash outflows under the stress scenarios described above.
We constantly evaluate and modify our liquidity risk assumptions based on regulatory and market changes. The model we use in order to simulate the impact of stress scenarios includes the following assumptions:
�
| � | � | � | No liquidation of assets; |
�
| � | � | � | No ability to issue additional unsecured funding; |
�
| � | � | � | Upcoming maturities of unsecured debt (maturities less than one year); |
�
| � | � | � | Potential buybacks of our outstanding debt; |
�
| � | � | � | Loss of secured funding lines particularly for less liquid assets, over and above our cash capital estimates; |
�
| � | � | � | Fluctuation of funding needs under normal business circumstances; |
�
| � | � | � | Cash and collateral outflows in a stress event; |
�
| � | � | � | Widening of haircuts on outstanding repo funding; |
�
| � | � | � | Additional collateralization requirements of clearing banks and depositories; |
�
| � | � | � | Drawdown on loan commitments; |
�
| � | � | � | Loss of liquidity from market losses on inventory; and |
�
| � | � | � | Legal and regulatory requirements that can restrict the flow of funds between entities in the Nomura Group. |
We recognize that liquidity standards for financial institutions continues to be the subject of further discussion among relevant supervisory bodies including the Basel Committee. The existing model and simulations upon which we currently rely may need to be reviewed depending on any new development in this area.
In 2008, the Basel Committee published �Principles for Sound Liquidity Risk Management and Supervision� (�Sound Principles�). To complement these principles, the Committee has further strengthened its liquidity framework by developing two minimum standards for funding liquidity. These standards have been developed to achieve two separate but complementary objectives.
The first objective is to promote short-term resilience of a bank�s liquidity risk profile by ensuring that it has sufficient high-quality liquid assets to survive a significant stress scenario lasting for one month. The Committee developed the Liquidity Coverage Ratio (the �LCR�) to achieve this objective.
The second objective is to promote resilience over a longer time horizon by creating additional incentives for banks to fund their activities with more stable sources of funding on an ongoing basis. The Net Stable Funding Ratio (the �NSFR�) has a time horizon of one year and has been developed to provide a sustainable maturity structure of assets and liabilities.
These two standards are comprised mainly of specific parameters which are internationally �harmonised� with prescribed values. Certain parameters, however, contain elements of national discretion to reflect jurisdiction-specific conditions.
After an observation period, the LCR, including any revisions, will be introduced on January�1, 2015. The NSFR, including any revisions, will move to a minimum standard by January�1, 2018.
5.�Contingency Funding Plan
We have developed a detailed contingency funding plan to integrate liquidity risk control into our comprehensive risk management strategy and to enhance the quantitative aspects of our liquidity risk control procedures. As a part of our Contingency Funding Plan (�CFP�), we have developed an approach for analyzing and quantifying the impact of any liquidity crisis. This allows us to estimate the likely impact of both Nomura-specific and market-wide events; and specifies the immediate action to be taken to mitigate any risk. The CFP lists details of key internal and external parties to be contacted and the processes by which information is to be disseminated. This has been developed at a legal entity level in order to capture specific cash requirements at the local level�it assumes that our parent company does not have access to cash that may be trapped at a subsidiary level due to regulatory, legal or tax constraints. We periodically test the effectiveness of our funding plans for different Nomura-specific and market-wide events. We also have access to central banks including, but not exclusively, the BOJ, which provide financing against various types of securities. These operations are accessed in the normal course of business and are an important tool in mitigating contingent risk from market disruptions.
�
21
Table of Contents
Cash Flows
Nomura�s cash flows are primarily generated from operating activities undertaken in connection with our client flows and trading and from financing activities which are closely related to such activities. As a financial institution, growth in operations tends to result in cash outflows from operating activities as well as investing activities, as was generally the case for a number of years. For the six months ended September�30, 2014, we recorded net cash inflows from operating activities and investing activities as discussed in the comparative analysis mentioned below.
The following is the summary information on our consolidated cash flows for the six months ended September�30, 2013 and 2014:
�
| � | �� | Billions of yen | � | |||||
| � | �� | Six�months�ended�September�30 | � | |||||
| � | �� | ��������2013�������� | � | � | ��������2014�������� | � | ||
| Net cash provided by operating activities |
�� | � | 404.8 | �� | � | � | 31.7 | �� |
| Net income |
�� | � | 104.6 | �� | � | � | 74.4 | �� |
| Trading assets and private equity investments |
�� | � | (803.5 | )� | � | � | (775.7 | )� |
| Trading liabilities |
�� | � | 1,131.7 | �� | � | � | (395.7 | )� |
| Securities purchased under agreements to resell, net of securities sold under agreements to repurchase |
�� | � | 224.0 | �� | � | � | 907.2 | �� |
| Securities borrowed, net of securities loaned |
�� | � | (232.4 | )� | � | � | (34.8 | )� |
| Other, net |
�� | � | (19.7 | )� | � | � | 256.3 | �� |
| Net cash provided by (used in) investing activities |
�� | � | (98.1 | )� | � | � | 23.6 | �� |
| Net cash provided by (used in) financing activities |
�� | � | 169.0 | �� | � | � | (134.6 | )� |
| Long-term borrowings, net |
�� | � | 165.8 | �� | � | � | 22.8 | �� |
| Short-term borrowings, net |
�� | � | 59.6 | �� | � | � | (5.2 | )� |
| Other, net |
�� | � | (56.4 | )� | � | � | (152.2 | )� |
| Effect of exchange rate changes on cash and cash equivalents |
�� | � | 17.2 | �� | � | � | 29.3 | �� |
| �� | � |
� |
� | � | � |
� |
� | |
| Net increase (decrease) in cash and cash equivalents |
�� | � | 493.0 | �� | � | � | (50.0 | )� |
| Cash and cash equivalents at beginning of year |
�� | � | 805.1 | �� | � | � | 1,489.8 | �� |
| �� | � |
� |
� | � | � |
� |
� | |
| Cash and cash equivalents at end of period |
�� | � | 1,298.0 | �� | � | � | 1,439.8 | �� |
| �� | � |
� |
� | � | � |
� |
� | |
See the consolidated statements of cash flows in our interim consolidated financial statements for more detailed information.
For the six months ended September�30, 2014, our cash and cash equivalents decreased by �50.0 billion to �1,439.8 billion. Net cash of �134.6 billion was used in financing activities due to cash outflows of �1,188.5 billion by decrease in long-term borrowings, which is included in Long-term borrowings, net. As part of trading activities, while there were net cash outflows of �775.7 billion due to an increase in Trading assets and Private equity investments, these cash outflows were offset by net cash inflows of �907.2 billion from cash inflow due to an increase in Securities purchased under agreements to resell, net of securities sold under agreements to repurchase. As a result, net cash of �31.7 billion was provided by operating activities.
For the six months ended September�30, 2013, our cash and cash equivalents increased by �493.0 billion to �1,298.0 billion. Net cash of �169.0 billion was provided by financing activities due to cash inflows of �225.4 billion by net receipts of Long-term borrowings and Short-term borrowings. As part of trading activities, while there were net cash outflows of �803.5 billion from cash outflows due to an increase in Trading assets and Private equity investments, these cash outflows were offset by net cash inflows of �1,131.7 billion from cash inflow due to an increase in Trading liabilities. As a result, net cash of �404.8 billion was provided by operating activities.
�
22
Table of Contents
Balance Sheet and Financial Leverage
Total assets as of September�30, 2014, were �43,802.1 billion, an increase of �281.8 billion compared with �43,520.3 billion as of March�31, 2014, reflecting increases in Trading assets. Total liabilities as of September�30, 2014, were �41,186.9 billion, an increase of �219.8 billion compared with �40,967.1 billion as of March�31, 2014, reflecting increases in Securities loaned. NHI shareholders� equity as of September�30, 2014, was �2,561.1 billion, an increase of �47.4 billion compared with �2,513.7 billion as of March�31, 2014.
We seek to maintain sufficient capital at all times to withstand losses due to extreme market movements. The EMB is responsible for implementing and enforcing capital policies. This includes the determination of our balance sheet size and required capital levels. We continuously review our equity capital base to ensure that it can support the economic risk inherent in our business. There are also regulatory requirements for minimum capital of entities that operate in regulated securities or banking businesses.
As leverage ratios are commonly used by other financial institutions similar to us, we voluntarily provide a Leverage ratio and Adjusted leverage ratio primarily for benchmarking purposes so that users of our annual report can compare our leverage against other financial institutions. Adjusted leverage ratio is a non-GAAP financial measure that Nomura considers to be a useful supplemental measure of leverage. There are currently no regulatory or statutory reporting requirements which require us to disclose leverage ratios.
The following table sets forth total NHI shareholders� equity, total assets, adjusted assets and leverage ratios:
�
| � | �� | Billions of yen, except ratios | � | |||||
| � | �� | March�31,�2014 | � | � | September�30,�2014 | � | ||
| NHI shareholders� equity |
�� | � | 2,513.7 | �� | � | � | 2,561.1 | �� |
| Total assets |
�� | � | 43,520.3 | �� | � | � | 43,802.1 | �� |
| Adjusted assets(1) |
�� | � | 26,173.3 | �� | � | � | 27,421.4 | �� |
| Leverage ratio(2) |
�� | � | 17.3 | x� | � | � | 17.1 | x� |
| Adjusted leverage ratio(3) |
�� | � | 10.4 | x� | � | � | 10.7 | x� |
�
| (1) | Represents total assets less Securities purchased under agreements to resell and Securities borrowed. Adjusted assets is a non-GAAP financial measure and is calculated as follows: |
�
| � | �� | Billions�of�yen | � | |||||
| � | �� | March�31,�2014 | � | �� | September�30,�2014 | � | ||
| Total assets |
�� | � | 43,520.3 | �� | �� | � | 43,802.1 | �� |
| Less: |
�� | �� | ||||||
| Securities purchased under agreements to resell |
�� | � | 9,617.7 | �� | �� | � | 8,299.8 | �� |
| Securities borrowed |
�� | � | 7,729.3 | �� | �� | � | 8,080.9 | �� |
| �� | � |
� |
� | �� | � |
� |
� | |
| Adjusted assets |
�� | � | 26,173.3 | �� | �� | � | 27,421.4 | �� |
| �� | � |
� |
� | �� | � |
� |
� | |
�
| (2) | Equals total assets divided by NHI shareholders� equity. |
| (3) | Equals adjusted assets divided by NHI shareholders� equity. |
Total assets increased by 0.6% reflecting primarily increases in Trading assets. NHI shareholders� equity increased by 1.9%. Our leverage ratio went down from 17.3 times as of March�31, 2014 to 17.1 times as of September�30, 2014.
Adjusted assets increased due primarily to the increase in Trading assets. As a result, our adjusted leverage ratio went up from 10.4 times as of March�31, 2014 to 10.7 times as of September�30, 2014.
�
23
Table of Contents
Capital Management
Capital Management Policy
We seek to enhance shareholder value and to capture growing business opportunities by maintaining sufficient levels of capital. We review levels of capital as appropriate, taking into consideration the economic risks inherent to operating our businesses, the regulatory requirements, and maintaining our ratings necessary to operate businesses globally.
Dividends
Nomura believes that pursuing a sustainable increase in shareholder value and paying dividends are essential to generating returns to our shareholders. Nomura will strive to pay stable dividends using a consolidated payout ratio of 30 percent as a key indicator.
Dividend payments will be determined taking into account a comprehensive range of factors such as the tightening of Basel regulations and other changes to the regulatory environment, as well as the Company�s consolidated financial performance.
Nomura paid dividend of �6.0�per share for the first half in line with its dividend policy for the fiscal year ended March�31, 2015.
With respect to the retained earnings, in order to implement measures to adapt to regulatory changes and to increase shareholder value, we seek to efficiently invest in business areas where high profitability and growth may reasonably be expected, including the development and expansion of infrastructure.
The following table sets forth the amounts of dividends per share paid by us in respect of the periods indicated:
�
| Fiscal year ended or ending March�31,���������������������������� |
�� | First�Quarter | � | �� | Second�Quarter | � | �� | Third�Quarter | � | �� | Fourth�Quarter | � | �� | Total | � | |||||
| 2010 |
�� | � | ��� | � | �� | � | �4.00 | �� | �� | � | ��� | � | �� | � | 4.00 | �� | �� | � | 8.00 | �� |
| 2011 |
�� | � | ��� | � | �� | � | 4.00 | �� | �� | � | ��� | � | �� | � | 4.00 | �� | �� | � | 8.00 | �� |
| 2012 |
�� | � | ��� | � | �� | � | 4.00 | �� | �� | � | ��� | � | �� | � | 2.00 | �� | �� | � | 6.00 | �� |
| 2013 |
�� | � | ��� | � | �� | � | 2.00 | �� | �� | � | ��� | � | �� | � | 6.00 | �� | �� | � | 8.00 | �� |
| 2014 |
�� | � | ��� | � | �� | � | 8.00 | �� | �� | � | ��� | � | �� | � | 9.00 | �� | �� | � | 17.00 | �� |
| 2015 |
�� | � | ��� | � | �� | � | 6.00 | �� | �� | �� | �� | |||||||||
Stock Repurchases
We consider repurchase of treasury stock as an option in our financial strategy to respond quickly to changes in the business environment and to increase shareholder value. We make announcements immediately after any decision to set up a share buyback program and conduct such programs in accordance with internal guidelines.
On October 28, 2014, we announced a resolution of the Board of Directors to establish a share buyback program in accordance with Article 459-1 of the Companies Act of Japan. The period of repurchase under the program was from November�13, 2014 to January�16, 2015, and we were authorized to purchase up to 40,000,000 shares of our common stock or to a maximum of �28�billion.
�
24
Table of Contents
Consolidated Regulatory Capital Requirements
The FSA established the �Guideline for Financial Conglomerates Supervision� (�Financial Conglomerates Guideline�) in June�2005 and set out the rules on consolidated regulatory capital. We started monitoring our consolidated capital adequacy ratio in accordance with the Financial Conglomerates Guideline from April 2005.
The Company has been assigned as a Final Designated Parent Company who must calculate a consolidated capital adequacy ratio according to the Capital Adequacy Notice on Final Designated Parent Company in April 2011. Since then, we have been calculating our consolidated capital adequacy ratio according to the Capital Adequacy Notice on Final Designated Parent Company. Note that the Capital Adequacy Notice on Final Designated Parent Company has been revised to be in line with Basel 2.5 and Basel III, and we have calculated a Basel III-based consolidated capital adequacy ratio from the end of March 2013. Basel 2.5 includes significant change in calculation method of market risk and Basel III includes redefinition of capital items for the purpose of requiring higher quality of capital and expansion of the scope of credit risk-weighted assets calculation.
In accordance with Article 2 of the Capital Adequacy Notice on Final Designated Parent Company, our consolidated capital adequacy ratio is currently calculated based on the amounts of common equity Tier 1 capital, Tier 1 capital (sum of common equity Tier 1 capital and additional Tier 1 capital), total capital (sum of Tier 1 capital and Tier 2 capital), credit risk-weighted assets, market risk and operational risk. As of September�30, 2014, our common equity Tier 1 capital ratio (common equity Tier 1 capital divided by risk-weighted assets) is 12.7%, Tier 1 capital ratio (Tier 1 capital divided by risk-weighted assets) is 12.7% and consolidated capital adequacy ratio (total capital divided by risk-weighted assets) is 14.7% and we were in compliance with the requirement for each ratio set out in the Capital Adequacy Notice on Final Designated Parent Company (required level as of September�30, 2014 is 4.0% for common equity Tier 1 capital ratio, 5.5% for Tier 1 capital ratio and 8.0% for consolidated capital adequacy ratio).
The following table presents the Company�s consolidated capital adequacy ratio as of March�31, 2014 and September�30, 2014.
�
| � | �� | Billions�of�yen,�except�ratios | � | |||||
| � | �� | March�31,�2014 | � | � | September�30,�2014 | � | ||
| Common equity Tier 1 capital |
�� | � | ������2,314.2 | �� | � | � | ������2,351.9 | �� |
| Tier 1 capital |
�� | � | 2,314.2 | �� | � | � | 2,351.9 | �� |
| Total capital |
�� | � | 2,715.7 | �� | � | � | 2,723.4 | �� |
| Risk-Weighted Assets |
�� | � | ||||||
| Credit risk-weighted assets |
�� | � | 8,034.8 | �� | � | � | 8,209.4 | �� |
| Market risk equivalent assets |
�� | � | 6,999.7 | �� | � | � | 7,656.6 | �� |
| Operational risk equivalent assets |
�� | � | 2,391.5 | �� | � | � | 2,567.8 | �� |
| �� | � |
� |
� | � | � |
� |
� | |
| Total risk-weighted assets |
�� | � | 17,425.9 | �� | � | � | 18,433.8 | �� |
| �� | � |
� |
� | � | � |
� |
� | |
| Consolidated Capital Adequacy Ratios |
�� | � | ||||||
| Common equity Tier 1 capital ratio |
�� | � | 13.2 | %� | � | � | 12.7 | %� |
| Tier 1 capital ratio |
�� | � | 13.2 | %� | � | � | 12.7 | %� |
| Consolidated capital adequacy ratio |
�� | � | 15.5 | %� | � | � | 14.7 | %� |
Common equity Tier 1 capital, additional Tier 1 capital and Tier 2 capital are calculated by deducting regulatory adjustment item from basic item for each capital class, respectively. If the amount of basic item is less than the amount of adjustment item, we need to deduct deficit amount from upper capital class. Each capital item and regulatory adjustment is defined in the Capital Adequacy Notice on Final Designated Parent Company and these new definitions of capital will come into effect gradually by transitional measures.
As of September 30, 2014, capital items for our common equity Tier 1 capital mainly consists of shareholder�s equity relating to the common stock and all or part of subordinated debt which satisfies the requirements under Capital Adequacy Notice on Final Designated Parent Company (such as maturity) is included into capital items for Tier 2 capital. We have not issued any capital instruments which can be included into additional Tier 1 capital.
Regulatory adjustment for our common equity Tier 1 capital mainly consists of a part of intangible assets and expected losses and regulatory adjustment for our Tier 2 capital includes investments in additional Tier 1 capital instruments of other financial institutions and a part of expected losses (Note both items are transitional treatment.). Regulatory adjustment for our additional Tier 1 capital will be included into regulatory adjustment for common equity Tier 1 capital, as we don�t have any outstanding additional Tier 1 capital instruments.
Market risk equivalent assets are calculated by using The Internal Models Approach for market risk. Since the end of December, 2011, we have been required to calculate market risk equivalent assets under the Basel 2.5 rule, which is significantly larger than market risk equivalent assets under the Basel II rule. Also, since the end of March 2013, a part of securitization products is added to the scope of market risk calculation.
�
25
Table of Contents
On the end of March, 2011, we have been calculating credit risk-weighted assets and operational risk equivalent assets by using the foundation Internal Ratings-Based Approach and The Standardized Approach, respectively, with the approval of the FSA. Furthermore, since the end of December, 2012, we started using the Internal Model Method for the exposure calculation of majority of derivative and repurchase transactions instead of the Current Exposure Method or the Comprehensive Method upon approval from the FSA,. Since the end of March 2013, the scope of credit risk-weighted assets calculation has been widened following the implementation of Basel III (e.g., credit risk for credit value adjustment (�CVA�) on derivative exposures, credit risk for central counterparties (�CCPs�) exposures, etc.).
We provide consolidated capital adequacy ratios not only to demonstrate that we are in compliance with the requirements set out in the Capital Adequacy Notice on Final Designated Parent Company but also for benchmarking purposes so that users of our report can compare our capital position against those of other financial groups to which Basel III is applied. Management receives and reviews these capital ratios on a regular basis.
The Basel Committee has issued a series of announcements regarding a Basel III program designed to strengthen the regulatory capital framework in light of weaknesses revealed by the financial crises. The following is a summary of the proposals which are most relevant to us.
On July�13, 2009, the Basel Committee announced its approval of a package of measures designed to strengthen its rules governing trading book capital and to enhance the three pillars of the Basel II framework, which was called �Basel 2.5�. This announcement stated that the Basel Committee�s trading book rules, effective at the end of 2011, would introduce higher capital requirements to capture the credit risk of complex trading activities, which became effective as the end of 2011. Such trading book rules also included a stressed VaR requirement.
On December�16, 2010, in an effort to promote a more resilient banking sector, the Basel Committee issued Basel III, that is, �International framework for liquidity risk measurement, standards and monitoring� and �A�global regulatory framework for more resilient banks and banking systems�. The proposals include raising the quality, consistency and transparency of the capital base; strengthening the risk coverage of the capital framework such as the implementation of a CVA charge for over-the-counter derivative trades; introducing a leverage ratio requirement as a supplemental measure to the risk-based framework; and introducing a series of measures to address concerns over the �procyclicality� of the current framework. The proposals also introduce a minimum liquidity standard including a 30-day liquidity coverage ratio as well as a longer-term structural liquidity ratio. Additional capital, liquidity or other supervisory measures to reduce the externalities created by systemically important institutions are also under review. These standards were implemented from 2013, which includes transitional treatment (i.e. they are phased in gradually from 2013). In addition, after two rounds of public consultation and discussions with the Committee on Payment and Settlement Systems (�CPSS�) and the International Organization of Securities Commissions (�IOSCO�), the Basel Committee has issued interim rules for the capitalization of bank exposures to CCPs on July�25, 2012, which were intended to come into effect as of January 2013 as part of Basel III.
At the G-20 summit in November 2011, the Financial Stability Board (�FSB�) and the Basel Committee announced the list of global systemically important banks (�G-SIBs�) and the additional requirements to the G-SIBs including the recovery and resolution plan. The FSB also announced the group of G-SIBs will be updated annually and published by the FSB each November. In November 2013, the FSB and the Basel Committee have updated the list of G-SIBs. We were not designated as a G-SIBs in November 2012 and November 2013. On the other hand, the FSB and the Basel Committee were asked to work on extending the framework for G-SIBs to domestic systemically important financial institutions (�D-SIBs�) and the Basel Committee developed and published a set of principles on the assessment methodology and the higher loss absorbency requirement for D-SIBs. In addition to the above, the FSB and the IOSCO have published assessment methodologies for identifying Non-bank Non-insurer Global Systemically Important Financial Institutions (NBNI G-SIFIs), for public consultation.
Following the change in international regulatory environment, the FSA introduced rules and notices such as the Capital Adequacy Notice on Final Designated Parent Company on consolidated regulation and supervision of securities companies on a consolidated basis on April�1, 2011 to improve the stability and transparency of Japan�s financial system and ensure the protection of investors. It is expected that such regulation and notice will be revised further to be in line with a series of rules and standards proposed by the Basel Committee, FSB or IOSCO.
�
26
Table of Contents
Credit Ratings
The cost and availability of unsecured funding are generally dependent on credit ratings. Our long-term and short-term debt is rated by several recognized credit rating agencies. We believe that our credit ratings include the credit ratings agencies� assessment of the general operating environment, our positions in the markets in which we operate, reputation, earnings structure, trend and volatility of our earnings, risk management framework, liquidity and capital management. An adverse change in any of these factors could result in a downgrade of our credit ratings, and that could, in turn, increase our borrowing costs and limit our access to the capital markets or require us to post additional collateral and permit counterparties to terminate transactions pursuant to certain contractual obligations. In addition, our credit ratings can have a significant impact on certain of our trading revenues, particularly in those businesses where longer term counterparty performance is critical, such as OTC derivative transactions.
On October�9, 2014, Moody�s upgraded the long-term issuer and senior unsecured debt ratings of the Company to Baa1 from Baa3. Moody�s also upgraded the long-term issuer rating of Nomura Securities Co., Ltd. (�NSC�) to A3 from Baa2.
As of November�30, 2014, the credit ratings of the Company and NSC were as follows:
�
| Nomura Holdings, Inc. |
�� | Short-term�Debt | �� | Long-term�Debt |
| Standard�& Poor�s |
�� | A-2 | �� | BBB+ |
| Moody�s Investors Service |
�� | ��� | �� | Baa1 |
| Fitch Ratings |
�� | F1 | �� | A- |
| Rating and Investment Information, Inc. |
�� | a-1 | �� | A+ |
| Japan Credit Rating Agency, Ltd. |
�� | ��� | �� | AA- |
�
| Nomura Securities Co., Ltd. |
�� | Short-term�Debt | �� | Long-term�Debt |
| Standard�& Poor�s |
�� | A-2 | �� | A- |
| Moody�s Investors Service |
�� | P-2 | �� | A3 |
| Fitch Ratings |
�� | F1 | �� | A- |
| Rating and Investment Information, Inc. |
�� | a-1 | �� | A+ |
| Japan Credit Rating Agency, Ltd. |
�� | ��� | �� | AA- |
Both Rating and Investment Information, Inc. and Japan Credit Rating Agency, Ltd. are credit rating agencies nationally recognized in Japan. We rely on, or utilize, credit ratings on our long-term and short-term debt provided by these Japanese credit rating agencies, as well as Standard�& Poor�s and Moody�s Investors Service, for unsecured funding and other financing purposes and also for our trading and other business activities.
There has been no change to the ratings in the above table since the date indicated.
�
27
Table of Contents
Off-Balance Sheet Arrangements
Off-Balance Sheet Entities
In the normal course of business, we engage in a variety of off-balance sheet arrangements with off-balance sheet entities which may have an impact on Nomura�s future financial position and performance.
Off-balance sheet arrangements with off-balance sheet entities include the following where Nomura has:
�
| � | � | � | an obligation under a guarantee contract; |
�
| � | � | � | a retained or contingent interest in assets transferred to an off-balance sheet entity or similar arrangement that serves to provide credit, liquidity or market risk support to such entity; |
�
| � | � | � | any obligation, including a contingent obligation, under a contract that would be accounted for as a derivative instrument; or |
�
| � | � | � | any obligation, including contingent obligation, arising out of a variable interest in an off-balance sheet entity that is held by, and material to us, where such entity provides financing, liquidity, market risk or credit risk support to, or engages in leasing, hedging or research and development services with us. |
Off-balance sheet entities may take the form of a corporation, partnership, fund, trust or other legal vehicle which is designed to fulfill a limited, specific purpose by its sponsor. We both create or sponsor these entities and also enter into arrangements with entities created or sponsored by others.
Our involvement with these entities includes structuring, underwriting, distributing and selling debt instruments and beneficial interests issued by these entities, subject to prevailing market conditions. In connection with our securitization and equity derivative activities, we also act as a transferor of financial assets to these entities, as well as, underwriter, distributor and seller of asset-repackaged financial instruments issued by these entities. We retain, purchase and sell variable interests in SPEs in connection with our market-making, investing and structuring activities. Our other types of off-balance sheet arrangements include guarantee agreements and derivative contracts. Significant involvement is assessed based on all of our arrangements with these entities, even if the probability of loss, as assessed at the balance sheet date, is remote.
For further information about transactions with VIEs, see Note 6 �Securitizations and Variable Interest Entities� in our interim consolidated financial statements.
Contractual Obligations
Since March�31, 2014, there have been no other material changes outside our ordinary course of business in connection with our standby letters of credit and other guarantees, long-term borrowings and contractual interest payments, operating lease commitments, capital lease commitments, purchase obligations, commitments to extend credit, commitments to invest in partnerships, commitments to purchase aircraft and commitments to purchase real estate.
For further details on our commitments, contingencies and guarantees, see Note 15 �Commitments, contingencies and guarantees� in our interim consolidated financial statements.
�
28
Table of Contents
Quantitative and Qualitative Disclosures about Market Risk
Risk Management
Nomura defines risks as (i)�the potential erosion of Nomura�s capital base due to unexpected losses arising from risks to which its business operations are exposed, such as market risk, credit risk, operational risk and model risk, (ii)�liquidity risk, the potential lack of access to funds or higher cost of funding than normal levels due to a deterioration in Nomura�s creditworthiness or deterioration in market conditions, and (iii)�business risk, the potential failure of revenues to cover costs due to a deterioration in the earnings environment or a deterioration in the efficiency or effectiveness of its business operations.
A fundamental principle established by Nomura is that all employees shall regard themselves as principals of risk management and appropriately manage these risks. Nomura seeks to promote a culture of proactive risk management throughout all levels of the organization and to limit risks to the confines of its risk appetite. The risk management framework that Nomura uses to manage these risks consists of its risk appetite, risk management governance and oversight, the management of financial resources, the management of all risk classes, and processes to measure and control risks. Each of these key components is explained in further detail below.
Risk Appetite
Nomura�s risk appetite defines the type and quantum of risk that Nomura is willing to accept in pursuit of its business objectives. The Risk Management Division and the Finance Division are jointly responsible for developing and proposing risk appetite to the Group Integrated Risk Management Committee (�GIRMC�) for their input and final approval.
Nomura�s risk appetite includes both quantitative measures and qualitative statements of appetite, covering Nomura�s risk classes. It provides an aggregated view of risk and is subject to regular monitoring and breach escalation as appropriate by the owner of the relevant risk appetite statement.
Nomura�s risk appetite is required to be reviewed annually by the GIRMC but may be reviewed on an ad hoc basis, and must specifically be reviewed following any significant changes in Nomura�s strategy. Risk appetite underpins all additional aspects of Nomura�s risk management framework.
Risk Management Governance and Oversight
Committee Governance
Nomura has established a committee structure to facilitate effective business operations and management of Nomura�s risks. The formal governance structure for risk management within Nomura is as follows:
�
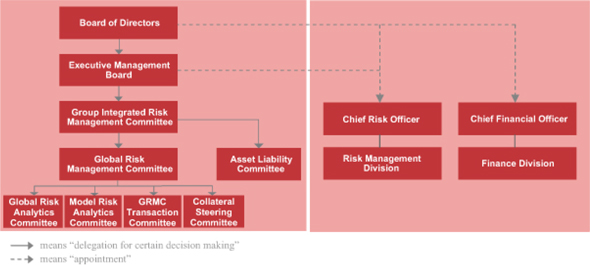
Board of Directors (�BoD�)
The BoD determines the policy for the execution of the business of Nomura and other matters prescribed in laws and regulations, supervises Directors� and Executive Officers� execution of their duties and has authority to adopt, alter or abolish the regulations of the Executive Management Board.
�
29
Table of Contents
Executive Management Board (�EMB�)
The EMB deliberates on and determines management strategy, the allocation of management resources and important management matters of Nomura, and seeks to increase shareholder value by promoting effective use of management resources and unified decision-making with regard to the execution of business. The EMB delegates responsibility for deliberation of matters concerning risk management to the GIRMC. Key responsibilities of the EMB include the following:
�
| � | � | � | Resource Allocation�At the beginning of each financial year, the EMB determines the allocation of management resources and financial resources such as economic capital and unsecured funding to business units and establishes usage limits for these resources; |
�
| � | � | � | Business Plan�At the beginning of each financial year, the EMB approves the business plan and budget of Nomura. Introduction of significant new businesses, changes to business plans, the budget and the allocation of management resources during the year are also approved by the EMB; and |
�
| � | � | � | Reporting�The EMB reports the status of its deliberations to the BoD. |
Group Integrated Risk Management Committee (�GIRMC�)
Upon delegation from the EMB, the GIRMC deliberates on or determines important matters concerning integrated risk management of Nomura to assure the sound and effective management of its businesses. The GIRMC establishes Nomura�s risk appetite and a framework of integrated risk management consistent with Nomura�s risk appetite. The GIRMC supervises Nomura�s risk management by establishing and operating its risk management framework. The GIRMC reports the status of key risk management issues and any other matters deemed necessary by the committee chairman to the BoD and the EMB.
In addition, the GIRMC, upon delegation from the EMB, has established the Risk Management Policy, describing Nomura�s overall risk management framework including the fundamental risk management principles followed by Nomura.
Global Risk Management Committee (�GRMC�)
Upon delegation from the GIRMC, the GRMC deliberates on or determines, based on strategic risk allocation and risk appetite determined by the GIRMC, important matters concerning market, credit or reputational risk management of Nomura in order to assure the sound and effective management of Nomura�s businesses. The GRMC reports to the GIRMC the status of discussions at its meetings and any other matters as deemed necessary by the committee chairman.
Asset Liability Committee (�ALCO�)
Upon delegation from the GIRMC, the ALCO deliberates on, based on Nomura�s risk appetite determined by the GIRMC, balance sheet management, financial resource allocation, liquidity management and related matters. The ALCO reports to the GIRMC the status of discussions at its meetings and any other matters as deemed necessary by the committee chairman.
Global Risk Analytics Committee (�GRAC�) and Model Risk Analytics Committee (�MRAC�)
Upon delegation from the GRMC, the GRAC and the MRAC deliberate on or determine matters concerning the development, management and strategy of risk models and valuation models, respectively. The committees� primary responsibility is to govern and provide oversight of model management, including the approval of new models and significant model changes. Both committees report all significant matters and material decisions taken to the GRMC, on a regular basis.
GRMC Transaction Committee
Upon delegation from the GRMC, the GRMC Transaction Committee deliberates on or approves individual transactions in line with Nomura�s risk appetite in order to assure the sound and effective management of Nomura�s businesses.
Collateral Steering Committee (�CSC�)
Upon delegation from the GRMC, the CSC deliberates on or determines Nomura�s collateral risk management, including concentrations, liquidity, collateral re-use, limits and stress tests, provides direction on Nomura�s collateral strategy and ensures compliance with regulatory collateral requirements.
Chief Risk Officer (�CRO�)
The CRO is responsible for setting the overall strategy and direction of the Risk Management Division. The CRO is responsible for supervising the Risk Management Division and maintaining the effectiveness of the risk management framework independently from the business units within Nomura. The CRO regularly reports on the status of Nomura�s risk management to the GIRMC, and reports to and seeks the approval of the GIRMC on measures required for risk management.
�
30
Table of Contents
Chief Financial Officer (�CFO�)
The CFO is responsible for overall financial strategy of Nomura, and has operational authority and responsibility over Nomura�s liquidity management based on decisions made by the EMB.
Risk Management Division
The Risk Management Division comprises various departments or units in charge of risk management established independently from Nomura�s business units. The Risk Management Division is responsible for establishing and operating risk management processes, establishing and enforcing risk management policies and regulations, verifying the effectiveness of risk management methods, gathering reports from Nomura Group entities, reporting to Executive Officers/Senior Managing Directors and the GIRMC and others, as well as reporting to regulatory bodies and handling regulatory applications concerning risk management methods and other items as necessary. Important risk management issues are closely communicated between members of the Risk Management departments and the CRO. The CRO and/or Deputy CRO regularly attend the EMB and GIRMC meetings to report specific risk issues.
Risk Policy Framework
Policies and procedures are essential tools of governance used by the Risk Management Division. They define principles, rules and standards, and the specific processes that must be adhered to in order to effectively manage risk at Nomura. The Risk Management Division has established a risk policy framework to promote appropriate standards and consistency for risk policies and procedures and to articulate the principles and procedures conducive to effective risk management. All risk management policies and procedures are developed in line with this policy framework and a defined process is followed for any exceptions.
Monitoring, Reporting and Data Integrity
Development, consolidation, monitoring and reporting of risk management information (�risk MI�) are fundamental to the appropriate management of risk. The aim of all risk MI is to provide a basis for sound decision-making, action and escalation as required. The Risk Management Division and the Finance Division are responsible for producing regular risk MI, which reflects the position of Nomura relative to stated risk appetite. Risk MI includes information from across the risk classes defined in the risk management framework and reflect the use of the various risk tools used to identify and assess those risks. The Risk Management Division is responsible for implementing appropriate controls over data integrity for risk MI.
Management of Financial Resources
Nomura has established a framework for management of financial resources in order to adequately manage utilization of these resources. The EMB allocates financial resources to business units at the beginning of each financial year. These allocations are used to set revenue forecasts for each business units. Key components are set out below:
Risk-weighted Assets
The EMB determines a minimum target Tier 1 capital ratio on an annual basis. A key component used in the calculation of the ratio is consolidated risk-weighted assets which are allocated by the EMB to each division and to additional lower levels of the organization. See Item�4.B. �Business Overview�Regulatory Capital Rules� of our annual report on Form 20-F for the fiscal year ended March 31, 2014 and �Consolidated Regulatory Capital Requirements� of this report for further information on our consolidated capital adequacy ratios and risk-weighted assets.
Economic Capital
Nomura�s internal measure of the capital required to support its business is the Nomura Capital Allocation Target (�NCAT�), which is measured as the amount of capital required to absorb unexpected losses over a one-year time horizon under a severely adverse scenario. For quantification purposes, a severely adverse scenario is defined as the unexpected loss computed by risk models at the 99.95th percentile. NCAT consists of i) portfolio NCAT, which captures the risks directly impacting the value of specific positions such as market risk, credit risk, asset liquidity risk and other risks such as event risk to account for portfolio risks not easily covered in a historically calibrated model, and ii) non-portfolio NCAT, which captures the risks not directly affecting the value of specific positions, such as operational risk and business risk. Nomura�s NCAT limit is initially set by the EMB, and the EMB subsequently allocates it to each business division and additional lower levels of the organization.
Available Funds
The CFO decides the maximum amount of available funds, provided without posting of any collateral, for allocation within Nomura and the EMB approves the allocation of the funds to each business division. Global Treasury monitors the usage by businesses and reports to the EMB.
�
31
Table of Contents
Classification and Definition of Risk
Nomura classifies and defines risks as follows and has established departments or units to manage each risk type.
�
| Risk�Category |
�� | Definition |
| Market risk |
�� | Risk of loss arising from fluctuations in the value of financial assets and liabilities (including off-balance sheet items) due to fluctuations in market risk factors (interest rates, foreign exchange rates, prices of securities and others). |
| Credit risk |
�� | Risk of loss arising from an obligor or counterparty�s default, insolvency or administrative proceeding which results in the obligor�s failure to meet its contractual obligations in accordance with agreed terms. This includes both on and off-balance sheet exposures. It is also the risk of loss arising through a credit valuation adjustment (�CVA�) associated with deterioration in the creditworthiness of a counterparty. |
| Operational�risk |
�� | Risk of loss resulting from inadequate or failed internal processes, people and systems or from external events. It excludes strategic risk (the risk of loss as a result of poor strategic business decisions), but includes the risk of breach of legal and regulatory requirements, and the risk of damage to Nomura�s reputation if caused by an operational risk. |
| Model risk |
�� | Risk arising from model errors or incorrect or inappropriate model application, which can lead to financial loss, poor business and strategic decision-making, restatement of external and internal reports, regulatory penalties and damage to Nomura�s reputation. |
| Funding and Liquidity�risk |
�� | Risk of loss arising from difficulty in securing necessary funding or from a significantly higher cost of funding than normal levels due to a deterioration in Nomura�s creditworthiness or a deterioration in market conditions. |
| Business risk |
�� | Risk of failure of revenues to cover costs due to a deterioration in the earnings environment or a deterioration in the efficiency or effectiveness of Nomura�s business operations. Managing business risk is the responsibility of Nomura�s Executive Managing Directors and Senior Managing Directors. |
Market Risk Management
Market risk is the risk of loss arising from fluctuations in the value of financial assets and liabilities (including off-balance sheet items) due to fluctuations in market risk factors (interest rates, foreign exchange rates, prices of securities and others).
Market Risk Management Process
Effective management of market risk requires the ability to analyze a complex and constantly changing global market environment, identify problematic trends and ensure that appropriate action is taken in a timely manner.
Nomura uses a variety of complementary tools to measure, model and aggregate market risk. Nomura�s principal statistical measurement tool to assess and monitor market risk on an ongoing basis is Value at Risk (�VaR�). Limits on VaR are set in line with Nomura�s risk appetite as expressed through economic capital. In addition to VaR, Nomura uses sensitivity analysis and stress testing to measure and analyze its market risk. Sensitivities are measures used to show the potential changes to a portfolio due to standard moves in market risk factors. They are specific to each asset class and cannot usually be aggregated across risk factors. Stress testing enables the analysis of portfolio risks or tail risks, including non-linear behaviors and can be aggregated across risk factors at any level of the group hierarchy, from firmwide level to business division, units or desk levels. Market risk is monitored against a set of approved limits, with daily reports and other management information provided to the business units and senior management.
Value at Risk
VaR is a measure of the potential loss in the value of Nomura�s trading positions due to adverse movements in markets over a defined time horizon with a specified confidence level. Market risks that are incorporated in the VaR model include equity prices, interest rates, credit, foreign exchange rates, and commodities with associated volatilities and correlations.
�
32
Table of Contents
VaR Methodology Assumptions
Nomura uses a single VaR model which has been implemented globally in order to determine the total trading VaR for Nomura. Nomura�s VaR methodology uses historical simulation to estimate potential profit or loss. Historical market moves are repeatedly applied to current exposure, forming a distribution of simulated portfolio returns. From this distribution, potential losses can be estimated at required confidence levels or probabilities.
Nomura uses the same VaR model for both internal risk management purposes and for regulatory reporting of consolidated VaR to the FSA. For internal risk management purposes, VaR is calculated across Nomura at a 99% confidence level and using a 1-day time horizon. For regulatory reporting purposes, Nomura uses the same confidence level but a 10-day time horizon, calculated using actual 10-day historical market moves.
The VaR model uses a default historical time window of two years (520 business days). Nomura uses a weighted VaR, whereby for the calculation of VaR, the probability weight assigned to each measure of estimated profit or loss in the historical simulation scenarios depends on when it occurred. The older the observation, the lower the weight.
In addition, Nomura calculates other measures used to complement VaR under Basel 2.5 regulations. One of these, Stressed-VaR (�SVaR�) is calibrated using a one-year window during a period of financial stress. The SVaR calculation uses one year of market data from that period of financial stress. The one-year window is calibrated to be the one with the largest SVaR, given Nomura�s current portfolio. The historical data used for SVaR is not weighted. All VaR and SVaR numbers are calculated within the same system using equivalent model assumptions.
Nomura�s VaR model uses time series for each individual underlying, whenever available. Whenever a time series cannot be found for a specific underlying, the VaR model will follow a �proxy logic� to map the exposure to an appropriate time series (for example, this would be the case for an option on a recently issued stock). The level of proxying taking place in the VaR model is carefully monitored through internal risk management processes and there is a continual effort to source new time series to use in the VaR calculation.
VaR Backtesting
The performance of Nomura�s VaR model is constantly monitored to ensure that it remains fit for purpose. The main approach for validating VaR is to compare actual 1-day trading losses with the corresponding VaR estimate. Using a 99% VaR measure, 2 or 3 exceptions (i.e., loss is larger than VaR) may be expected to occur each year. Nomura�s VaR model is backtested at a Nomura group level as well as at a number of lower levels, and backtesting results are reviewed on a monthly basis by Nomura�s Risk Management Division.
1-day trading losses did not exceed the 99% VaR estimate at a Nomura group level for the six month ended September�30, 2014.
Limitations and Advantages of VaR
The main advantage of VaR as a risk measure is that it is able to aggregate risk from different asset classes in contrast with other risk measures sensitivities that cannot be easily aggregated directly. The risk from different divisions of Nomura can therefore easily be compared and aggregated using VaR.
As a risk measure, however, VaR has certain limitations. One of the main disadvantages with VaR is that it is a backward-looking risk measure. Using historical market moves to estimate future profits or losses assumes that only events that have actually happened in the past are relevant to analyze the risk of a portfolio.
In addition, VaR only gives an estimate of the loss at a stated 99% confidence level (i.e., in one out of 100 days the loss will be greater than 1-day VaR), but not what the magnitude of loss could be whenever the loss does exceed VaR.
VaR as a risk measure is most appropriate for liquid markets and may understate the financial impact of severe events for which there is no historical precedent or where market liquidity may not be reliable. In particular, historical correlations can break down in extreme markets leading to unexpected relative market moves. This may make positions that offset each other in VaR modeling move in the same direction thus increasing losses.
�
33
Table of Contents
Given the limitations of the VaR model, Nomura uses VaR only as one component of a diverse market risk management process. Other metrics to supplement VaR include stress testing and sensitivity analysis.
VaR metrics
The following graph shows the daily VaR over the last six quarters for substantially all of Nomura�s trading positions:
�
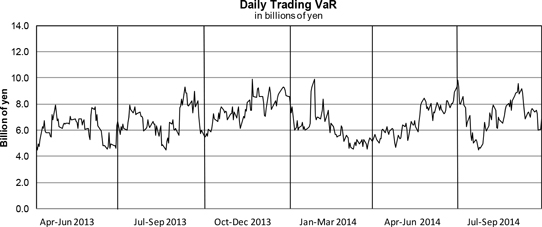
The following tables show the VaR as of each of the dates indicated for substantially all of Nomura�s trading positions:
�
| � | �� | Billions of yen | � | |||||||||
| � | �� | As of | � | |||||||||
| � | �� | Mar.�29, 2013 |
� | � | Mar.�31, 2014 |
� | � | Sep.�30, 2014 |
� | |||
| Equity |
�� | � | 1.26 | �� | � | � | 1.28 | �� | � | � | 1.50 | �� |
| Interest rate |
�� | � | 5.00 | �� | � | � | 3.95 | �� | � | � | 4.25 | �� |
| Foreign exchange |
�� | � | 1.87 | �� | � | � | 2.79 | �� | � | � | 2.70 | �� |
| �� | � |
� |
� | � | � |
� |
� | � | � |
� |
� | |
| Subtotal |
�� | � | 8.14 | �� | � | � | 8.02 | �� | � | � | 8.45 | �� |
| Less: Diversification Benefit |
�� | � | (3.05 | )� | � | � | (2.86 | )� | � | � | (1.62 | )� |
| �� | � |
� |
� | � | � |
� |
� | � | � |
� |
� | |
| VaR |
�� | � | 5.09 | �� | � | � | 5.16 | �� | � | � | 6.83 | �� |
| �� | � |
� |
� | � | � |
� |
� | � | � |
� |
� | |
| � | �� | Billions of yen | � | |||||||||
| � | �� | For the twelve months ended |
� | � | For�the�six months�ended |
� | ||||||
| � | �� | Mar.�29, 2013 |
� | � | Mar.�31, 2014 |
� | � | Sep. 30, 2014 |
� | |||
| Maximum daily VaR(1) |
�� | � | 8.66 | �� | � | � | 9.90 | �� | � | � | 9.84 | �� |
| Average daily VaR(1) |
�� | � | 6.11 | �� | � | � | 6.67 | �� | � | � | 6.92 | �� |
| Minimum daily VaR(1) |
�� | � | 4.33 | �� | � | � | 4.45 | �� | � | � | 4.47 | �� |
�
| (1) | Represents the maximum, average and minimum VaR based on all daily calculations for the twelve months ended March�29, 2013 and March�31, 2014, and for the six months ended September�30, 2014. |
Total VaR increased to �6.83 billion as of September�30, 2014 from �5.16 billion as of March�31, 2014. VaR relating to interest rate risk increased to �4.25 billion as of September�30, 2014, compared to �3.95 billion as of March�31, 2014. VaR relating to equity risk increased to �1.50 billion as of September�30, 2014, compared to �1.28 billion as of March�31, 2014. VaR relating to foreign exchange risk remained relatively unchanged at �2.70 billion as of September�30, 2014, compared to �2.79 billion as of March�31, 2014.
�
34
Table of Contents
Total VaR remained relatively unchanged at �5.16 billion as of March�31, 2014 compared to total VaR as of March�29, 2013. VaR relating to interest rate risk decreased to �3.95 billion as of March�31, 2014, compared to �5.00 billion as of March�29, 2013 due to lower outright interest risk being taken. VaR relating to foreign exchange risk increased to �2.79 billion as of March�31, 2014 from �1.87 billion as of March�29, 2013, driven by changes in the outright foreign exchange risk being taken. VaR relating to equity risk remained relatively unchanged at �1.28 billion as of March�31, 2014 compared to �1.26 billion as of March�29, 2013.
Stress Testing
Nomura conducts market risk stress testing since VaR and sensitivity analysis have limited ability to capture all portfolio risks or tail risks. Stress testing for market risk is conducted daily and weekly, using various scenarios based upon features of trading strategies. Nomura conducts stress testing not only at each desk level, but also at a Nomura group level with a set of common global scenarios in order to capture the impact of market fluctuations on the entire Nomura group.
Non-Trading Risk
A major market risk in Nomura�s non-trading portfolio relates to equity investments held for operating purposes and on a long-term basis. This non-trading portfolio is exposed mainly to volatility in the Japanese stock market. One method that can estimate the market risk in this portfolio is to analyze market sensitivity based on changes in the TOPIX, which is a leading index of prices of stocks on the First Section of the Tokyo Stock Exchange.
Nomura uses regression analysis covering the previous 90 days which tracks and compares fluctuations in the TOPIX and the market value of Nomura�s equity investments held for operating purposes. This analysis indicates that for each 10% change in the TOPIX, the market value of Nomura�s operating equity investments held for operating purposes can be expected to change by �19,721�million at the end of March 2014 and �19,760�million at the end of September 2014. The TOPIX closed at 1,202.89 points at the end of March 2014 and at 1,326.29 points at the end of September 2014. This simulation analyzes data for the entire portfolio of equity investments held for operating purposes at Nomura and therefore actual results may differ from Nomura�s expectations because of price fluctuations of individual equities.
Credit Risk Management
Credit risk is the risk of loss arising from an obligor or counterparty�s default, insolvency or administrative proceeding which results in the obligor�s failure to meet its contractual obligations in accordance with agreed terms. This includes both on and off-balance sheet exposures. It is also the risk of loss arising through a CVA associated with deterioration in the creditworthiness of a counterparty.
Nomura manages credit risk on a global basis and on an individual Nomura legal entity basis.
�
35
Table of Contents
Credit Risk Management Framework
The measurement, monitoring and management of credit risk at Nomura is governed by a set of global policies and procedures. Credit Risk Management (�CRM�), a global function within the Risk Management Division, is responsible for the implementation and maintenance of these policies and procedures. These policies are authorized by the GIRMC and/or Global Risk Strategic Committee (�GRSC�), prescribe the basic principles of credit risk management and set credit limits to counterparties that are formally approved by CRM personnel with the appropriate level of credit authority.
Credit risk is managed by CRM together with various global and regional risk committees. This ensures transparency of material credit risks and compliance with established credit limits, the approval of material extensions of credit and the escalation of risk concentrations to appropriate senior management.
Credit Risk Management Process
CRM operates as a credit risk control function within the Risk Management Division, reporting to the CRO. The process for managing credit risk at Nomura includes:
�
| � | � | � | Evaluation of likelihood that a counterparty defaults on its payments and obligations; |
�
| � | � | � | Assignment of internal ratings to all active counterparties; |
�
| � | � | � | Approval of extensions of credit and establishment of credit limits; |
�
| � | � | � | Measurement, monitoring and management of Nomura�s current and potential future credit exposures; |
�
| � | � | � | Setting credit terms in legal documentation including margin terms; and |
�
| � | � | � | Use of appropriate credit risk mitigants including netting, collateral and hedging. |
The scope of credit risk management includes counterparty trading and various debt or equity instruments including loans, private equity investments, fund investments, investment securities and any other as deemed necessary from a credit risk management perspective. The evaluation of counterparties� creditworthiness involves a thorough due diligence and analysis of the business environments in which they operate, their competitive positions, management and financial strength and flexibility. Credit analysts also take into account the corporate structure and any explicit or implicit credit support. CRM evaluates credit risk not only by counterparty, but also by counterparty group.
Following the credit analysis, CRM estimates the probability of default of a given counterparty or obligor through an alphanumeric ratings scale similar to that used by rating agencies and a corresponding numeric scale. Credit analysts are responsible for assigning and maintaining the internal ratings, ensuring that each rating is reviewed and approved at least annually.
Nomura�s internal rating system employs a range of ratings models to ensure global consistency and accuracy. These models are developed and maintained by the Risk Methodology Group. Internal ratings represent a critical component of Nomura�s approach to managing counterparty credit risk. They are used as key factors in:
�
| � | � | � | Establishing the amount of counterparty credit risk that Nomura is willing to take to an individual counterparty or counterparty group (setting of credit limits); |
�
| � | � | � | Determining the level of delegated authority for setting credit limits (including tenor); |
�
| � | � | � | The frequency of credit reviews (renewal of credit limits); |
�
| � | � | � | Reporting counterparty credit risk to senior management within Nomura; and |
�
| � | � | � | Reporting counterparty credit risk to stakeholders outside of Nomura. |
�
36
Table of Contents
The Credit Risk Control Unit (�CRCU�) is a function that is independent of CRM. It ensures that Nomura�s internal rating system is properly reviewed and validated, reporting any breaks or issues to senior management for timely resolution. The unit is responsible for ensuring that the system remains accurate and predictive of risk and provides periodic reporting on the system to senior management.
Nomura has established an Internal Rating System to be a unified, exhaustive and objective framework to evaluate credit risk. Internal ratings are typically classified into obligor, facility and specialized lending ratings. Each rating classification serves to properly express the credit risk either in terms of probability of default, the level of potential recovery given its position in a capital structure or the probability of repayment under the terms of a specialized lending facility.
For regulatory capital calculation purposes, Nomura has been applying the Foundation Internal Rating Based Approach (�FIRB�) in calculating credit risk weighted assets since the end of March 2011. The Standardized Approach is applied to certain business units or asset types, which are considered immaterial to the calculation of credit risk-weighted assets.
Credit Limits and Risk Measures
Internal ratings form an integral part in the assignment of credit limits to counterparties. Nomura�s credit limit framework is designed to ensure that Nomura takes appropriate credit risk in a manner that is consistent with its overall risk appetite. Global Credit policies define the delegated authority matrices that establish the maximum aggregated limit amounts and tenors that may be set for any single counterparty group based on their internal rating.
Nomura�s main type of counterparty credit risk exposures arise from derivatives transactions or securities financing transactions. Credit exposures against counterparties are managed by means of setting credit limits based upon credit analysis of individual counterparty. Credit risk is managed daily through the monitoring of credit exposure against approved credit limits and the ongoing monitoring of the creditworthiness of Nomura�s counterparties. Any change in circumstance that alters Nomura�s risk appetite for any particular counterparty, sector, industry or country is reflected in changes to the internal rating and credit limit as appropriate.
Nomura�s global credit risk management systems record all credit limits and capture credit exposures to the Nomura�s counterparties allowing CRM to measure, monitor and manage utilization of credit limits, ensure appropriate reporting and escalation of any limit breaches.
For derivatives and securities financing transactions, Nomura measures credit risk primarily by way of a Monte Carlo-based simulation model that determines a Potential Exposure (�PE�) profile at a specified confidence level. The exposure calculation model used for counterparty credit risk management has also been used for the Internal Model Method (�IMM�) based exposure calculation for regulatory capital reporting purposes since the end of December 2012.
Loans and lending commitments are measured and monitored on both a funded and unfunded basis.
Wrong Way Risk
Wrong Way Risk (�WWR�) occurs when exposure to a counterparty is highly correlated with the deterioration of creditworthiness of that counterparty. Nomura has established global policies that govern the management of any WWR exposures. Stress testing is used to support the assessment of any WWR embedded within existing portfolios and adjustments are made to credit exposures and regulatory capital, as appropriate.
Stress Testing
Stress Testing is an integral part of Nomura�s management of credit risk. Regular stress tests are used to support the assessment of credit risks by counterparties, sectors and regions. The stress tests include potential concentrations that are highlighted as a result of applying shocks to risk factors, probabilities of default or rating migrations.
Risk Mitigation
Nomura utilizes financial instruments, agreements and practices to assist in the management of credit risk. Nomura enters into legal agreements, such as the International Swap and Derivatives Association, Inc. (�ISDA�) agreements or equivalent (referred to as �Master Netting Agreements�), with many of its counterparties. Master Netting Agreements allow netting of receivables and payables and reduce losses potentially incurred as a result of a counterparty default. Further reduction in credit risk is achieved through entering into collateral agreements that allow Nomura to obtain collateral from counterparties either upfront or contingent on exposure levels, changes in credit rating or other factors.
�
37
Table of Contents
Credit Risk to Counterparties in Derivatives Transaction
The credit exposures arising from Nomura�s trading-related derivatives as of March�31, 2014 are summarized in the table below, showing the positive fair value of derivative assets by counterparty credit rating and by remaining contractual maturity. The credit ratings are internally determined by Nomura�s CRM.
�
| � | � | Billions of yen | � | |||||||||||||||||||||||||||||||||
| �� | � | Years to Maturity | � | �� | Cross-Maturity Netting(1) |
� | � | Total Fair�Value |
� | �� | Collateral obtained |
� | �� | Replacement cost(3) |
� | |||||||||||||||||||||
| Credit�Rating |
� | Less�than 1�year |
� | �� | 1 to 3 years |
� | �� | 3 to 5 years |
� | �� | 5 to 7 years |
� | �� | More�than 7�years |
� | �� | � | �� | �� | |||||||||||||||||
| � | � | � | � | �� | � | � | �� | � | � | �� | � | � | �� | � | � | �� | � | � | � | (a) | � | �� | (b) | � | �� | (a)-(b) | � | |||||||||
| AAA |
� | � | 13 | �� | �� | � | 32 | �� | �� | � | 69 | �� | �� | � | 23 | �� | �� | � | 66 | �� | �� | � | (57 | )� | � | � | 146 | �� | �� | � | 48 | �� | �� | � | 98 | �� |
| AA |
� | � | 125 | �� | �� | � | 286 | �� | �� | � | 375 | �� | �� | � | 323 | �� | �� | � | 675 | �� | �� | � | (1,342 | )� | � | � | 442 | �� | �� | � | 27 | �� | �� | � | 415 | �� |
| A |
� | � | 512 | �� | �� | � | 452 | �� | �� | � | 548 | �� | �� | � | 397 | �� | �� | � | 949 | �� | �� | � | (2,205 | )� | � | � | 653 | �� | �� | � | 142 | �� | �� | � | 511 | �� |
| BBB |
� | � | 165 | �� | �� | � | 155 | �� | �� | � | 164 | �� | �� | � | 120 | �� | �� | � | 408 | �� | �� | � | (629 | )� | � | � | 383 | �� | �� | � | 136 | �� | �� | � | 247 | �� |
| BB and lower |
� | � | 21 | �� | �� | � | 41 | �� | �� | � | 38 | �� | �� | � | 76 | �� | �� | � | 299 | �� | �� | � | (255 | )� | � | � | 220 | �� | �� | � | 279 | �� | �� | � | 0 | �� |
|
Other(2) |
� | � | 28 | �� | �� | � | 16 | �� | �� | � | 31 | �� | �� | � | 11 | �� | �� | � | 77 | �� | �� | � | (160 | )� | � | � | 3 | �� | �� | � | 23 | �� | �� | � | 0 | �� |
| � | � |
� |
� | �� | � |
� |
� | �� | � |
� |
� | �� | � |
� |
� | �� | � |
� |
� | �� | � |
� |
� | � | � |
� |
� | �� | � |
� |
� | �� | � |
� |
� | |
| Sub-total |
� | � | 864 | �� | �� | � | 982 | �� | �� | � | 1,225 | �� | �� | � | 950 | �� | �� | � | 2,474 | �� | �� | � | (4,648 | )� | � | � | 1,847 | �� | �� | � | 655 | �� | �� | � | 1,271 | �� |
| Listed |
� | � | 525 | �� | �� | � | 160 | �� | �� | � | 30 | �� | �� | � | 1 | �� | �� | � | ��� | �� | �� | � | (258 | )� | � | � | 458 | �� | �� | � | 1 | �� | �� | � | 457 | �� |
| � | � |
� |
� | �� | � |
� |
� | �� | � |
� |
� | �� | � |
� |
� | �� | � |
� |
� | �� | � |
� |
� | � | � |
� |
� | �� | � |
� |
� | �� | � |
� |
� | |
| Total |
� | � | 1,389 | �� | �� | � | 1,142 | �� | �� | � | 1,255 | �� | �� | � | 951 | �� | �� | � | 2,474 | �� | �� | � | (4,906 | )� | � | � | 2,305 | �� | �� | � | 656 | �� | �� | � | 1,728 | �� |
| � | � |
� |
� | �� | � |
� |
� | �� | � |
� |
� | �� | � |
� |
� | �� | � |
� |
� | �� | � |
� |
� | � | � |
� |
� | �� | � |
� |
� | �� | � |
� |
� | |
�
| (1) | Represents netting of derivative liabilities against derivatives assets entered into with the same counterparty across different maturity bands. Derivative assets and derivative liabilities with the same counterparty in the same maturity band are net within the relevant maturity band. Cash collateral netting against net derivative assets in accordance with ASC 210-20 �Balance Sheet�Offsetting� and ASC 815 �Derivatives and Hedging� is also included. |
| (2) | �Other� comprises unrated counterparties and certain portfolio level valuation adjustments not allocated to specific counterparties |
| (3) | Zero balances represent where total collateral received is in excess of the total fair value therefore Nomura�s credit exposure is zero. |
Exposure to certain European peripheral countries
Nomura manages country risk arising from inventory positions, trades with counterparties and any other businesses or products as deemed necessary. A number of European countries have experienced a higher degree of financial stress over the last few years. While this stress has the potential to impact both European and global markets, its impact has been more pronounced in several peripheral countries within the Euro-zone, such as Greece, Ireland, Italy, Portugal and Spain (the �GIIPS countries�) due, primarily, to their economic and fiscal weaknesses.
Financial, economic and structural issues in the GIIPS countries have adversely influenced major global financial markets. Further stress in these countries combined with a sustained market or economic downturn could adversely affect Nomura�s business and could result in substantial future losses.
�
38
Table of Contents
The table below presents information regarding Nomura�s exposure to the GIIPS countries as of September�30, 2014. Country risk exposure is reported based on the location of the counterparty, issuer or underlier�s assets.
�
| � | � | Billions of yen | � | |||||||||||||||||||||||||||||||||||||||||
| � | � | September�30, 2014 | � | |||||||||||||||||||||||||||||||||||||||||
| � | � | Net inventory exposures | � | � | Net counterparty exposures | � | � | � | � | � | Unfunded exposure(7) |
� | � | � | � | � | Less: Hedges(8) |
� | � | Total net exposure |
� | |||||||||||||||||||||||
| � | � | Debt securities(1) |
� | � | Equity securities(2) |
� | � | Equity�and credit derivatives referencing GIIPS underlyings(3) |
� | � | Loans(4) | � | � | Derivative contracts with GIIPS counterparties(5) |
� | � | Securities financing transactions(6) |
� | � | Total gross funded exposure |
� | � | � | Total gross exposure |
� | � | � | |||||||||||||||||
| Greece |
� | � | 9 | �� | � | � | 0 | �� | � | � | (6 | )� | � | � | ��� | � | � | � | 8 | �� | � | � | 1 | �� | � | � | 13 | �� | � | � | ��� | � | � | � | 13 | �� | � | � | 4 | �� | � | � | 8 | �� |
| Sovereign |
� | � | (0 | )� | � | � | ��� | �� | � | � | (3 | )� | � | � | ��� | �� | � | � | 6 | �� | � | � | ��� | �� | � | � | 3 | �� | � | � | ��� | �� | � | � | 3 | �� | � | � | 4 | �� | � | � | (1 | )� |
| Non-sovereign(9) |
� | � | 10 | �� | � | � | 0 | �� | � | � | (3 | )� | � | � | ��� | �� | � | � | 2 | �� | � | � | 1 | �� | � | � | 9 | �� | � | � | ��� | �� | � | � | 9 | �� | � | � | 0 | �� | � | � | 9 | �� |
| � | � |
� |
� | � | � |
� |
� | � | � |
� |
� | � | � |
� |
� | � | � |
� |
� | � | � |
� |
� | � | � |
� |
� | � | � |
� |
� | � | � |
� |
� | � | � |
� |
� | � | � |
� |
� | |
| Ireland |
� | � | 40 | �� | � | � | 0 | �� | � | � | 10 | �� | � | � | ��� | �� | � | � | 0 | �� | � | � | 0 | �� | � | � | 51 | �� | � | � | 1 | �� | � | � | 52 | �� | � | � | 0 | �� | � | � | 51 | �� |
| Sovereign |
� | � | 13 | �� | � | � | ��� | �� | � | � | 6 | �� | � | � | ��� | �� | � | � | 0 | �� | � | � | 0 | �� | � | � | 20 | �� | � | � | ��� | �� | � | � | 20 | �� | � | � | 0 | �� | � | � | 19 | �� |
| Non-sovereign(9) |
� | � | 27 | �� | � | � | 0 | �� | � | � | 4 | �� | � | � | ��� | �� | � | � | 0 | �� | � | � | 0 | �� | � | � | 31 | �� | � | � | 1 | �� | � | � | 32 | �� | � | � | 0 | �� | � | � | 32 | �� |
| � | � |
� |
� | � | � |
� |
� | � | � |
� |
� | � | � |
� |
� | � | � |
� |
� | � | � |
� |
� | � | � |
� |
� | � | � |
� |
� | � | � |
� |
� | � | � |
� |
� | � | � |
� |
� | |
| Italy |
� | � | 99 | �� | � | � | 13 | �� | � | � | (123 | )� | � | � | ��� | �� | � | � | 40 | �� | � | � | 3 | �� | � | � | 33 | �� | � | � | ��� | �� | � | � | 33 | �� | � | � | 31 | �� | � | � | 2 | �� |
| Sovereign |
� | � | 84 | �� | � | � | ��� | �� | � | � | (146 | )� | � | � | ��� | �� | � | � | 26 | �� | � | � | ��� | �� | � | � | (36 | )� | � | � | ��� | �� | � | � | (36 | )� | � | � | 30 | �� | � | � | (66 | )� |
| Non-sovereign(9) |
� | � | 15 | �� | � | � | 13 | �� | � | � | 23 | �� | � | � | ��� | �� | � | � | 14 | �� | � | � | 3 | �� | � | � | 69 | �� | � | � | ��� | �� | � | � | 69 | �� | � | � | 1 | �� | � | � | 68 | �� |
| � | � |
� |
� | � | � |
� |
� | � | � |
� |
� | � | � |
� |
� | � | � |
� |
� | � | � |
� |
� | � | � |
� |
� | � | � |
� |
� | � | � |
� |
� | � | � |
� |
� | � | � |
� |
� | |
| Portugal |
� | � | 27 | �� | � | � | (0 | )� | � | � | (4 | )� | � | � | ��� | �� | � | � | 0 | �� | � | � | 0 | �� | � | � | 22 | �� | � | � | ��� | �� | � | � | 22 | �� | � | � | 1 | �� | � | � | 21 | �� |
| Sovereign |
� | � | 15 | �� | � | � | ��� | �� | � | � | (9 | )� | � | � | ��� | �� | � | � | ��� | �� | � | � | ��� | �� | � | � | 7 | �� | � | � | ��� | �� | � | � | 7 | �� | � | � | 1 | �� | � | � | 6 | �� |
| Non-sovereign(9) |
� | � | 11 | �� | � | � | (0 | )� | � | � | 5 | �� | � | � | ��� | �� | � | � | 0 | �� | � | � | 0 | �� | � | � | 15 | �� | � | � | ��� | �� | � | � | 15 | �� | � | � | 1 | �� | � | � | 15 | �� |
| � | � |
� |
� | � | � |
� |
� | � | � |
� |
� | � | � |
� |
� | � | � |
� |
� | � | � |
� |
� | � | � |
� |
� | � | � |
� |
� | � | � |
� |
� | � | � |
� |
� | � | � |
� |
� | |
| Spain |
� | � | 176 | �� | � | � | (2 | )� | � | � | (136 | )� | � | � | 2 | �� | � | � | 16 | �� | � | � | 6 | �� | � | � | 62 | �� | � | � | ��� | �� | � | � | 62 | �� | � | � | 13 | �� | � | � | 50 | �� |
| Sovereign |
� | � | 78 | �� | � | � | ��� | �� | � | � | (56 | )� | � | � | ��� | �� | � | � | 7 | �� | � | � | ��� | �� | � | � | 29 | �� | � | � | ��� | �� | � | � | 29 | �� | � | � | 8 | �� | � | � | 20 | �� |
| Non-sovereign(9) |
� | � | 98 | �� | � | � | (2 | )� | � | � | (80 | )� | � | � | 2 | �� | � | � | 9 | �� | � | � | 6 | �� | � | � | 34 | �� | � | � | ��� | �� | � | � | 34 | �� | � | � | 4 | �� | � | � | 30 | �� |
| � | � |
� |
� | � | � |
� |
� | � | � |
� |
� | � | � |
� |
� | � | � |
� |
� | � | � |
� |
� | � | � |
� |
� | � | � |
� |
� | � | � |
� |
� | � | � |
� |
� | � | � |
� |
� | |
| Total |
� | � | 351 | �� | � | � | 12 | �� | � | � | (259 | )� | � | � | 2 | �� | � | � | 64 | �� | � | � | 11 | �� | � | � | 181 | �� | � | � | 1 | �� | � | � | 182 | �� | � | � | 50 | �� | � | � | 132 | �� |
| Sovereign |
� | � | 191 | �� | � | � | ��� | �� | � | � | (208 | )� | � | � | ��� | �� | � | � | 39 | �� | � | � | 0 | �� | � | � | 22 | �� | � | � | ��� | �� | � | � | 22 | �� | � | � | 44 | �� | � | � | (22 | )� |
| Non-sovereign(9) |
� | � | 161 | �� | � | � | 12 | �� | � | � | (51 | )� | � | � | 2 | �� | � | � | 25 | �� | � | � | 11 | �� | � | � | 159 | �� | � | � | 1 | �� | � | � | 160 | �� | � | � | 6 | �� | � | � | 154 | �� |
| � | � |
� |
� | � | � |
� |
� | � | � |
� |
� | � | � |
� |
� | � | � |
� |
� | � | � |
� |
� | � | � |
� |
� | � | � |
� |
� | � | � |
� |
� | � | � |
� |
� | � | � |
� |
� | |
�
39
Table of Contents
�
| (1) | Fair value amounts of long and short debt securities by GIIPS issuers. No GIIPS collateral has been used in repurchase-to-maturity transactions outstanding as of September 30, 2014. |
| (2) | Fair value amounts of long and short equity securities by GIIPS issuers. |
| (3) | Net derivatives entered into for market-making and trading purposes which reference GIIPS underlyings and includes both single-name credit default swaps (�CDS�) and other credit derivatives referencing baskets of reference assets, indices or other multiple underlyings. Amounts disclosed are calculated based on notional amounts of the derivatives assuming zero recovery as adjusted for fair value movements. |
Where derivative contracts cover multiple underlyings, including one or more GIIPS countries or both sovereign and non-sovereign underlyings in these countries, the relevant derivatives are disaggregated into their constituent single names for reporting in the table. Exposure for each single name is calculated as the change in mark to market of the product, based on an internally developed model, given the instantaneous default of the relevant reference credit and assuming zero recovery. No specific assumptions are made regarding the order of defaults or collateral coverage.
| (4) | Fair value amounts of loans to GIIPS counterparties. |
| (5) | Derivatives with GIIPS counterparties which are shown net by counterparty and after deduction of cash collateral received of �455.8 billion. |
| (6) | Fair value amounts of reverse repurchase agreements, repurchase agreements, securities borrowing and lending transactions, which are shown net by counterparty and after deduction of securities collateral and cash margin received of �424.9�billion. |
| (7) | Notional amount of unfunded loan commitments with GIIPS borrowers. |
| (8) | Hedges consist primarily of single-name CDS where Nomura has purchased net protection against GIIPS net counterparty credit exposures. Amounts disclosed are calculated based on notional amounts assuming zero recovery as adjusted for fair value movements. |
| (9) | Non-sovereign counterparties are primarily financial institutions located in these countries. |
�
40
Table of Contents
Amounts reported in net inventory exposures and hedges include single-name CDS where Nomura has either purchased or sold credit protection on a single name GIIPS underlying. The following table presents the gross notional value and fair value of these derivatives by relevant GIIPS country and by type of underlying.
�
| � | �� | Billions of yen | � | |||||||||||||
| � | �� | September�30, 2014 | � | |||||||||||||
| � | �� | Purchased protection |
� | � | Sold protection | � | ||||||||||
| � | �� | Notional value |
� | �� | Fair value |
� | � | Notional value |
� | �� | Fair value |
� | ||||
| Greece |
�� | �� | � | �� | ||||||||||||
| Sovereign |
�� | � | ��� | �� | �� | � | ����� | �� | � | � | ��� | �� | �� | � | ����� | � |
| Non-sovereign |
�� | � | 35 | �� | �� | � | (2 | )� | � | � | 36 | �� | �� | � | 2 | �� |
| �� | � |
� |
� | �� | � |
� |
� | � | � |
� |
� | �� | � |
� |
� | |
| �� | � | 35 | �� | �� | � | (2 | )� | � | � | 36 | �� | �� | � | 2 | �� | |
| �� | � |
� |
� | �� | � |
� |
� | � | � |
� |
� | �� | � |
� |
� | |
| Ireland |
�� | �� | � | �� | ||||||||||||
| Sovereign |
�� | � | 170 | �� | �� | � | (3 | ) | � | � | 180 | �� | �� | � | 3 | � |
| Non-sovereign |
�� | � | 81 | �� | �� | � | (5 | )� | � | � | 86 | �� | �� | � | 6 | �� |
| �� | � |
� |
� | �� | � |
� |
� | � | � |
� |
� | �� | � |
� |
� | |
| �� | � | 252 | �� | �� | � | (9 | )� | � | � | 266 | �� | �� | � | 9 | �� | |
| �� | � |
� |
� | �� | � |
� |
� | � | � |
� |
� | �� | � |
� |
� | |
| Italy |
�� | �� | � | �� | ||||||||||||
| Sovereign |
�� | � | 2,330 | �� | �� | � | 35 | �� | � | � | 2,290 | �� | �� | � | (28 | )� |
| Non-sovereign |
�� | � | 575 | �� | �� | � | (23 | )� | � | � | 586 | �� | �� | � | 26 | �� |
| �� | � |
� |
� | �� | � |
� |
� | � | � |
� |
� | �� | � |
� |
� | |
| �� | � | 2,905 | �� | �� | � | 12 | �� | � | � | 2,877 | �� | �� | � | (2 | )� | |
| �� | � |
� |
� | �� | � |
� |
� | � | � |
� |
� | �� | � |
� |
� | |
| Portugal |
�� | �� | � | �� | ||||||||||||
| Sovereign |
�� | � | 244 | �� | �� | � | 2 | �� | � | � | 234 | �� | �� | � | (2 | )� |
| Non-sovereign |
�� | � | 146 | �� | �� | � | (5 | )� | � | � | 149 | �� | �� | � | 6 | �� |
| �� | � |
� |
� | �� | � |
� |
� | � | � |
� |
� | �� | � |
� |
� | |
| �� | � | 390 | �� | �� | � | (4 | )� | � | � | 383 | �� | �� | � | 4 | �� | |
| �� | � |
� |
� | �� | � |
� |
� | � | � |
� |
� | �� | � |
� |
� | |
| Spain |
�� | �� | � | �� | ||||||||||||
| Sovereign |
�� | � | 1,109 | �� | �� | � | (14 | )� | � | � | 1,291 | �� | �� | � | 19 | �� |
| Non-sovereign |
�� | � | 378 | �� | �� | � | (17 | )� | � | � | 411 | �� | �� | � | 18 | �� |
| �� | � |
� |
� | �� | � |
� |
� | � | � |
� |
� | �� | � |
� |
� | |
| �� | � | 1,488 | �� | �� | � | (31 | )� | � | � | 1,702 | �� | �� | � | 37 | �� | |
| �� | � |
� |
� | �� | � |
� |
� | � | � |
� |
� | �� | � |
� |
� | |
| Total |
�� | �� | � | �� | ||||||||||||
| Sovereign |
�� | � | 3,853 | �� | �� | � | 19 | �� | � | � | 3,995 | �� | �� | � | (8 | )� |
| Non-sovereign |
�� | � | 1,215 | �� | �� | � | (53 | )� | � | � | 1,269 | �� | �� | � | 58 | �� |
| �� | � |
� |
� | �� | � |
� |
� | � | � |
� |
� | �� | � |
� |
� | |
| �� | � | 5,068 | �� | �� | � | (33 | )� | � | � | 5,264 | �� | �� | � | 50 | �� | |
| �� | � |
� |
� | �� | � |
� |
� | � | � |
� |
� | �� | � |
� |
� | |
These notional and fair value amounts are not representative of Nomura�s overall exposure as they exclude the impact of master netting agreements and collateralization arrangements in place with the counterparties to these transactions. See Note 3 �Derivative instruments and hedging activities� in our interim consolidated financial statements for more information around the nature of Nomura�s credit derivative activities, including the nature of payout or trigger events under these contracts.
In addition to the above direct exposures to these countries, Nomura also has indirect exposures to these countries as follows:
�
| � | � | � | Exposure to other European sovereign and non-sovereign counterparties such as counterparties in France, Germany and the UK who themselves may have exposures to these countries. These exposures are monitored and mitigated when necessary as part of Nomura�s Credit Risk Management procedures. |
�
| � | � | � | Exposure to redenomination risk if the Euro is no longer used as the currency unit in one or more GIIPS or other Eurozone countries. Nomura monitors and manages redenomination risk through scenario analyses which quantify the potential impact on its GIIPS exposures. |
�
| � | � | � | Additional exposure to replacement risk arising from financial instruments entered into with GIIPS counterparties. Nomura manages and mitigates replacement risk relating to GIIPS counterparties by monitoring exposures on selected counterparties believed to represent the most significant risk, identifying major concentration of risks in order to reduce exposures when possible and being prepared to put in place a pre-emptive plan of action if such an event occurs. |
�
41
Table of Contents
Operational Risk Management
Operational risk is the risk of loss resulting from inadequate or failed internal processes, people, and systems or from external events. It excludes strategic risk (the risk of loss as a result of poor strategic business decisions), but includes the risk of breach of legal and regulatory requirements, and the risk of damage to Nomura�s reputation if caused by an operational risk.
The Three Lines of Defence
Nomura adopts the industry standard �Three Lines of Defence� for the management of operational risk, comprising the following elements:
�
| � | 1) | 1st Line of Defence: The business which owns and manages its risks |
�
| � | 2) | 2nd Line of Defence: The Operational Risk Management (�ORM�) function, which defines and co-ordinates Nomura�s operational risk strategy and framework and provides challenge to the 1st Line of Defence |
�
| � | 3) | 3rd Line of Defence: Internal and External Audit, who provide independent assurance |
Operational Risk Management Framework
An Operational Risk Management Framework has been established in order to allow Nomura to identify, assess, manage, monitor and report on operational risk. The GIRMC, with delegated authority from the EMB has formal oversight over the management of operational risk. Operational risk appetite is defined through a mixture of qualitative appetite statements and quantitative measures utilizing key components of the Operational Risk Management Framework.
This framework is set out below:
Infrastructure of the framework
�
| � | � | � | Policy framework: Sets standards for managing operational risk and details how to monitor adherence to these standards. |
�
| � | � | � | Training and awareness: Action taken by ORM to improve business understanding of operational risk. |
Products and Services
�
| � | � | � | Risk and Control Self-Assessment (�RCSA�): The process used by business units to identify and assess the operational risks to which they are exposed, the controls in place to mitigate risks, and action plans to further reduce risk. |
�
| � | � | � | Scenario Analysis: Process to identify and assess high impact, low probability �tail events�. |
�
| � | � | � | Event Reporting: Process to obtain information on and learn from actual events impacting Nomura and relevant external events. A key step is to identify appropriate action plans to prevent or mitigate future occurrence of events. |
�
| � | � | � | Key Risk Indicators (�KRI�): Metrics which allow monitoring of certain key operational risks and trigger appropriate responses as thresholds are breached. |
Outputs
�
| � | � | � | Analysis and reporting: A key aspect of ORM�s role is to analyze, report, and challenge operational risk information provided by business units, and work with business units to develop action plans to mitigate risks. |
�
| � | � | � | Operational risk capital calculation: Calculate operational risk capital for regulatory reporting purposes and allocate to business units to improve the efficiency on profit versus risks. |
�
42
Table of Contents
Regulatory capital calculation for operational risk
Nomura uses The Standardized Approach for calculating regulatory capital for operational risk. This involves using a three-year average of gross income allocated to business lines, which is multiplied by a fixed percentage (�Beta Factor�) determined by the FSA, to establish the amount of required operational risk capital.
Nomura uses consolidated net revenue as gross income, however for certain consolidated subsidiaries, gross operating profit is used as gross income. Gross income allocation is performed by mapping the net revenue of each business segment as defined in Nomura�s management accounting data to each Basel business line as follows:
�
| Business Line |
�� | Description |
�� | Beta�Factor | � | |
| Retail�Banking |
�� | Retail deposit and loan-related services | �� | � | 12 | %� |
| Commercial�Banking |
�� | Deposit and loan-related services except for Retail Banking business | �� | � | 15 | %� |
| Payment�and�Settlement |
�� | Payment and settlement services for clients� transactions | �� | � | 18 | %� |
| Retail Brokerage |
�� | Securities-related services mainly for individuals | �� | � | 12 | %� |
| Trading and Sales |
�� | Market-related business | �� | � | 18 | %� |
| Corporate Finance |
�� | M&A, underwriting, secondary and private offerings, and other funding services for clients | �� | � | 18 | %� |
| Agency Services |
�� | Agency services for clients such as custody | �� | � | 15 | %� |
| Asset Management |
�� | Fund management services for clients | �� | � | 12 | %� |
Nomura calculates the required amount of operational risk capital for each business line by multiplying the allocated annual gross income amount by the appropriate Beta Factor defined above. The operational risk capital for any gross income amount not allocated to a specific business line is determined by multiplying such unallocated gross income amount by a fixed percentage of�18%.
The total operational risk capital for Nomura is calculated by aggregating the total amount of operational risk capital required for each business line and unallocated amount and by determining a three-year average. Where the aggregated amount for a given year is negative, then the total operational risk capital amount for that year will be calculated as zero.
In any given year, negative amounts in any business line are offset against positive amounts in other business lines. However, negative unallocated amounts are not offset against positive amounts in other business lines and are calculated as zero.
Operational risk capital is calculated at the end of September and March each year.
Model Risk Management
Model risk is the risk arising from model errors or incorrect or inappropriate model application, which can lead to financial loss, poor business and strategic decision-making, restatement of external and internal reports, regulatory penalties and damage to Nomura�s reputation.
Errors can occur at any point from model assumptions through to implementation. In addition, the quality of model outputs depends on the quality of model parameters and any input data. Even a fundamentally sound model producing accurate outputs consistent with the design objective of the model may exhibit high model risk if it is misapplied or misused.
Model Management Framework
The models within the model management framework are defined as either:
�
| � | � | � | valuation models, used for calculating prices and risk sensitivities of Nomura�s positions; or, |
�
| � | � | � | risk models, used by the Risk Management Division for quantifying the risk of a portfolio by calculating the potential losses incurred from a specific type of risk, and used for regulatory or economic capital calculations, limit monitoring, trade approval and management reporting. |
�
43
Table of Contents
Before models are put into official use, the Model Validation Group (�MVG�) is responsible for validating their integrity and comprehensiveness independently from those who design and build them. As part of this validation process, the MVG analyzes a number of factors to assess a model�s suitability, to quantify model risk which is then mitigated by applying model reserves and capital adjustments. Valuation models are developed and maintained by the business units and risk models by the Risk Methodology Group (�RMG�) within the Risk Management Division. Certain models may also be developed by third party providers. The RMG has primary responsibility for the ongoing refinement and improvement of risk models and methodologies within Nomura.
All models are also subject to an annual re-approval process by MVG to ensure they remain suitable. Upon delegation from the GRMC, the MRAC�s and GRAC�s primary responsibility is to govern and provide oversight of model management for valuation and risk models, respectively.
Changes to valuation and risk models
Nomura has documented policies and procedures in place, approved by the GIRMC and/or GRSC, which define the process and validation requirements for implementing changes to valuation and risk models. For changes with an impact above certain materiality thresholds, model approval is required. These materiality thresholds are defined through procedures owned by MVG and reflect Nomura�s model risk appetite. For certain material changes to risk models, backtesting of the new model, parallel running of both models and stress-testing of the new model are required prior to the model being approved.
Funding and Liquidity Risk Management
For further information on funding and liquidity risk management, see �Liquidity and Capital Resources�Funding and Liquidity Management� in this report.
Risk Measures and Controls
Limit Frameworks
The establishment of robust limit monitoring and management is central to appropriate monitoring and management of risk. The limit management frameworks incorporate clear escalation policies to ensure approval of limits at appropriate levels of seniority. The Risk Management Division is responsible for day-to-day operation of these limit frameworks including approval, monitoring, and reporting as required. Business units are responsible for complying with the agreed limits. Limits apply across a range of quantitative measures of risk and across market and credit risks.
New Business Risk Management
The new business approval process represents the starting point for new business in Nomura and exists to support management decision-making and ensure that risks associated with new products and new businesses are identified and managed appropriately. The new business approval process consists of two components:
�
| � | 1) | Transaction committees are in place to provide formal governance over the review and decision-making process for individual transactions. Clear responsibilities are documented for cases of non-adherence. |
�
| � | 2) | The new product approval process allows business unit sponsors to submit applications for new products and obtain input from relevant departments prior to approval of the application. The process is designed to capture and assess risks across all risk classes as a result of the new product or business. |
Stress Testing
Stress testing is a process of assessing the stability or business continuity of Nomura from the view point of capital adequacy, profit and loss impact or liquidity adequacy using plausible scenarios at various levels of the hierarchy from firmwide level to division or desk levels, including those based on sensitivity analysis.
�
44
Table of Contents
Nomura conducts a rigorous programme of stress testing through a comprehensive suite of top-down and bottom-up scenarios, covering different time horizons, severities, scope and methodologies and these are reviewed, run and presented on a regular basis to senior management, who can then take appropriate actions.
Stress testing is categorised either as sensitivity analysis, scenario analysis, firmwide stress testing or reverse stress testing.
�
| � | � | � | Sensitivity analysis is used to quantify the impact of a market move in one or two associated risk factors across all positions (e.g., equity prices or equity prices/equity volatility) using a variety of defined market shocks in order to assess specific risks or potential concentrations; |
�
| � | � | � | Scenario analysis is used to quantify the impact of a specified event on Nomura�s portfolio, combining simultaneous cross- asset market shocks; |
�
| � | � | � | Firmwide stress testing is applied consistently across risk classes, such as market, credit, operational, business and liquidity risks. It is used to assess Nomura�s capital adequacy under severe market scenarios; and |
�
| � | � | � | Reverse stress testing is designed to identify a range of adverse circumstances which could cause Nomura�s business plan to become unviable. Such tests would stress Nomura�s exposures or business models in an �extreme� fashion until the point of capital failure, liquidity failure or business closure. |
Stress tests are run on a regular basis as part of Nomura�s routine risk management process and on an ad hoc basis in response to market events or concerns. Stress testing is regarded as an integral part of Nomura�s risk management governance and used as a tool for forward-looking risk management and decision-making.
�
45
Table of Contents
Interim Consolidated Financial Statements (UNAUDITED)
�
| � | �� | Page | � | |
| Consolidated Balance Sheets as of March�31, 2014 and September�30, 2014 |
�� | � | F-2 | �� |
| �� | � | F-5 | �� | |
| �� | � | F-7 | �� | |
| Consolidated Statements of Changes in Equity for the Six Months Ended September�30, 2013 and 2014 |
�� | � | F-8 | �� |
| Consolidated Statements of Cash Flows for the Six Months Ended September�30, 2013 and 2014 |
�� | � | F-9 | �� |
| �� | � | F-10 | �� | |
| �� | � | F-89 | �� | |
�
F-1
Table of Contents
Interim Consolidated Financial Statements
Consolidated Balance Sheets (UNAUDITED)
�
| � | �� | Millions�of�yen | � | |||||
| � | �� | March�31,�2014 | � | � | September�30,�2014 | � | ||
| ASSETS | �� | � | ||||||
| Cash and cash deposits: |
�� | � | ||||||
| Cash and cash equivalents |
�� | � | 1,489,792 | �� | � | � | 1,439,786 | �� |
| Time deposits |
�� | � | 363,682 | �� | � | � | 224,992 | �� |
| Deposits with stock exchanges and other segregated cash |
�� | � | 335,836 | �� | � | � | 405,134 | �� |
| �� | � |
� |
� | � | � |
� |
� | |
| Total cash and cash deposits |
�� | � | 2,189,310 | �� | � | � | 2,069,912 | �� |
| �� | � |
� |
� | � | � |
� |
� | |
| Loans and receivables: |
�� | � | ||||||
| Loans receivable (including �303,956�million and �282,822�million measured at fair value by applying the fair value option as of March�31, 2014 and September�30, 2014, respectively) |
�� | � | 1,327,875 | �� | � | � | 1,357,346 | �� |
| Receivables from customers (including �2,180�million and �2,248�million measured at fair value by applying the fair value option as of March�31, 2014 and September�30, 2014, respectively) |
�� | � | 64,070 | �� | � | � | 67,002 | �� |
| Receivables from other than customers |
�� | � | 1,181,742 | �� | � | � | 1,266,421 | �� |
| Allowance for doubtful accounts |
�� | � | (3,009 | )� | � | � | (2,754 | )� |
| �� | � |
� |
� | � | � |
� |
� | |
| Total loans and receivables |
�� | � | 2,570,678 | �� | � | � | 2,688,015 | �� |
| �� | � |
� |
� | � | � |
� |
� | |
| Collateralized agreements: |
�� | � | ||||||
| Securities purchased under agreements to resell (including �1,087,138�million and �984,385�million measured at fair value by applying the fair value option as of March�31, 2014 and September�30, 2014, respectively) |
�� | � | 9,617,675 | �� | � | � | 8,299,801 | �� |
| Securities borrowed |
�� | � | 7,729,326 | �� | � | � | 8,080,883 | �� |
| �� | � |
� |
� | � | � |
� |
� | |
| Total collateralized agreements |
�� | � | 17,347,001 | �� | � | � | 16,380,684 | �� |
| �� | � |
� |
� | � | � |
� |
� | |
| Trading assets and private equity investments: |
�� | � | ||||||
| Trading assets (including securities pledged as collateral of �9,266,192�million and �10,673,083�million as of March�31, 2014 and September�30, 2014, respectively; including �9,156�million and �11,684�million measured at fair value by applying the fair value option as of March�31, 2014 and September�30, 2014, respectively) |
�� | � | 18,672,318 | �� | � | � | 20,009,976 | �� |
| Private equity investments (including �3,476�million and �5,716�million measured at fair value by applying the fair value option as of March�31, 2014 and September�30, 2014, respectively) |
�� | � | 41,996 | �� | � | � | 44,723 | �� |
| �� | � |
� |
� | � | � |
� |
� | |
| Total trading assets and private equity investments |
�� | � | 18,714,314 | �� | � | � | 20,054,699 | �� |
| �� | � |
� |
� | � | � |
� |
� | |
| Other assets: |
�� | � | ||||||
| Office buildings, land, equipment and facilities (net of accumulated depreciation and amortization of �350,820�million as of March�31, 2014 and �369,320�million as of September�30, 2014) |
�� | � | 408,917 | �� | � | � | 413,385 | �� |
| Non-trading debt securities |
�� | � | 1,023,746 | �� | � | � | 967,293 | �� |
| Investments in equity securities |
�� | � | 136,740 | �� | � | � | 141,508 | �� |
| Investments in and advances to affiliated companies |
�� | � | 345,434 | �� | � | � | 349,528 | �� |
| Other (including �56,976�million and �67,644�million measured at fair value by applying the fair value option as of March�31, 2014 and September�30, 2014, respectively) |
�� | � | 784,174 | �� | � | � | 737,070 | �� |
| �� | � |
� |
� | � | � |
� |
� | |
| Total other assets |
�� | � | 2,699,011 | �� | � | � | 2,608,784 | �� |
| �� | � |
� |
� | � | � |
� |
� | |
| Total assets |
�� | � | 43,520,314 | �� | � | � | 43,802,094 | �� |
| �� | � |
� |
� | � | � |
� |
� | |
�
F-2
Table of Contents
Consolidated Balance Sheets�(Continued) (UNAUDITED)
�
| � | �� | Millions�of�yen | � | |||||
| � | �� | March�31,�2014 | � | � | September�30,�2014 | � | ||
| LIABILITIES AND EQUITY | �� | � | ||||||
| Short-term borrowings (including �49,279�million and �39,638�million measured at fair value by applying the fair value option as of March�31, 2014 and September�30, 2014, respectively) |
�� | � | 602,131 | �� | � | � | 609,481 | �� |
| Payables and deposits: |
�� | � | ||||||
| Payables to customers |
�� | � | 492,516 | �� | � | � | 651,914 | �� |
| Payables to other than customers |
�� | � | 1,230,176 | �� | � | � | 1,246,609 | �� |
| Deposits received at banks |
�� | � | 1,114,181 | �� | � | � | 1,056,216 | �� |
| �� | � |
� |
� | � | � |
� |
� | |
| Total payables and deposits |
�� | � | 2,836,873 | �� | � | � | 2,954,739 | �� |
| �� | � |
� |
� | � | � |
� |
� | |
| Collateralized financing: |
�� | � | ||||||
| Securities sold under agreements to repurchase (including �530,397�million and �535,816�million measured at fair value by applying the fair value option as of March�31, 2014 and September�30, 2014, respectively) |
�� | � | 13,937,690 | �� | � | � | 13,878,397 | �� |
| Securities loaned |
�� | � | 2,359,809 | �� | � | � | 2,629,628 | �� |
| Other secured borrowings |
�� | � | 814,500 | �� | � | � | 739,014 | �� |
| �� | � |
� |
� | � | � |
� |
� | |
| Total collateralized financing |
�� | � | 17,111,999 | �� | � | � | 17,247,039 | �� |
| �� | � |
� |
� | � | � |
� |
� | |
| Trading liabilities |
�� | � | 11,047,285 | �� | � | � | 10,882,727 | �� |
| Other liabilities (including �1,123�million and �17,377�million measured at fair value by applying the fair value option as of March�31, 2014 and September�30, 2014, respectively) |
�� | � | 1,141,750 | �� | � | � | 1,080,878 | �� |
| Long-term borrowings (including �1,984,986 million�and �2,378,535�million measured at fair value by applying the fair value option as of March�31, 2014 and September�30, 2014, respectively) |
�� | � | 8,227,063 | �� | � | � | 8,412,012 | �� |
| �� | � |
� |
� | � | � |
� |
� | |
| Total liabilities |
�� | � | 40,967,101 | �� | � | � | 41,186,876 | �� |
| �� | � |
� |
� | � | � |
� |
� | |
| Commitments and contingencies (Note 15) |
�� | � | ||||||
| Equity: |
�� | � | ||||||
| Nomura Holdings, Inc. (�NHI�) shareholders� equity: |
�� | � | ||||||
| Common stock |
�� | � | ||||||
| No par value share; |
�� | � | ||||||
| Authorized�6,000,000,000 shares as of March�31, 2014 and September�30, 2014 |
�� | � | ||||||
| Issued�3,822,562,601 shares as of March�31, 2014 and September�30, 2014 |
�� | � | ||||||
| Outstanding�3,717,630,462 shares as of March�31, 2014 and 3,640,236,853�shares as of September�30, 2014 |
�� | � | 594,493 | �� | � | � | 594,493 | �� |
| Additional paid-in capital |
�� | � | 683,638 | �� | � | � | 683,112 | �� |
| Retained earnings |
�� | � | 1,287,003 | �� | � | � | 1,335,236 | �� |
| Accumulated other comprehensive income |
�� | � | 20,636 | �� | � | � | 70,533 | �� |
| �� | � |
� |
� | � | � |
� |
� | |
| Total NHI shareholders� equity before treasury stock |
�� | � | 2,585,770 | �� | � | � | 2,683,374 | �� |
| Common stock held in treasury, at cost�104,932,139 shares as of March�31, 2014 and 182,325,748 shares as of September�30, 2014 |
�� | � | (72,090 | )� | � | � | (122,286 | )� |
| �� | � |
� |
� | � | � |
� |
� | |
| Total NHI shareholders� equity |
�� | � | 2,513,680 | �� | � | � | 2,561,088 | �� |
| �� | � |
� |
� | � | � |
� |
� | |
| Noncontrolling interests |
�� | � | 39,533 | �� | � | � | 54,130 | �� |
| Total equity |
�� | � | 2,553,213 | �� | � | � | 2,615,218 | �� |
| �� | � |
� |
� | � | � |
� |
� | |
| Total liabilities and equity |
�� | � | 43,520,314 | �� | � | � | 43,802,094 | �� |
| �� | � |
� |
� | � | � |
� |
� | |
�
F-3
Table of Contents
Consolidated Balance Sheets�(Continued) (UNAUDITED)
�
The following table presents the classification of consolidated variable interest entities� (�VIEs�) assets and liabilities included in the consolidated balance sheets above. The assets of a consolidated VIE may only be used to settle obligations of that VIE. Creditors do not have any recourse to Nomura beyond the assets held in the VIEs. See Note 6 �Securitizations and Variable Interest Entities� for further information.
�
| � | �� | Billions�of�yen | � | |||||
| � | �� | March�31,�2014 | � | �� | September�30,�2014 | � | ||
| Cash and cash deposits |
�� | � | 18 | �� | �� | � | 21 | �� |
| Trading assets and private equity investments |
�� | � | 751 | �� | �� | � | 897 | �� |
| Other assets |
�� | � | 114 | �� | �� | � | 64 | �� |
| �� | � |
� |
� | �� | � |
� |
� | |
| Total assets |
�� | � | 883 | �� | �� | � | 982 | �� |
| �� | � |
� |
� | �� | � |
� |
� | |
| Trading liabilities |
�� | � | 42 | �� | �� | � | 27 | �� |
| Other liabilities |
�� | � | 27 | �� | �� | � | 15 | �� |
| Borrowings |
�� | � | 424 | �� | �� | � | 640 | �� |
| �� | � |
� |
� | �� | � |
� |
� | |
| Total liabilities |
�� | � | 493 | �� | �� | � | 682 | �� |
| �� | � |
� |
� | �� | � |
� |
� | |
The accompanying notes are an integral part of these interim consolidated financial statements.
�
F-4
Table of Contents
Consolidated Statements of Income (UNAUDITED)
�
| � | �� | Millions�of�yen | � | |||||
| � | �� | Six�months�ended�September�30 | � | |||||
| � | �� | 2013 | � | �� | 2014 | � | ||
| Revenue: |
�� | �� | ||||||
| Commissions |
�� | � | 263,247 | �� | �� | � | 208,413 | �� |
| Fees from investment banking |
�� | � | 48,378 | �� | �� | � | 40,442 | �� |
| Asset management and portfolio service fees |
�� | � | 83,083 | �� | �� | � | 93,839 | �� |
| Net gain on trading |
�� | � | 238,589 | �� | �� | � | 287,573 | �� |
| Gain on private equity investments |
�� | � | 753 | �� | �� | � | 202 | �� |
| Interest and dividends |
�� | � | 213,416 | �� | �� | � | 213,692 | �� |
| Gain on investments in equity securities |
�� | � | 12,889 | �� | �� | � | 9,234 | �� |
| Other |
�� | � | 73,294 | �� | �� | � | 59,579 | �� |
| �� | � |
� |
� | �� | � |
� |
� | |
| Total revenue |
�� | � | 933,649 | �� | �� | � | 912,974 | �� |
| Interest expense |
�� | � | 145,938 | �� | �� | � | 168,303 | �� |
| �� | � |
� |
� | �� | � |
� |
� | |
| Net revenue |
�� | � | 787,711 | �� | �� | � | 744,671 | �� |
| �� | � |
� |
� | �� | � |
� |
� | |
| Non-interest expenses: |
�� | �� | ||||||
| Compensation and benefits |
�� | � | 298,596 | �� | �� | � | 309,590 | �� |
| Commissions and floor brokerage |
�� | � | 55,180 | �� | �� | � | 61,189 | �� |
| Information processing and communications |
�� | � | 94,473 | �� | �� | � | 90,857 | �� |
| Occupancy and related depreciation |
�� | � | 40,614 | �� | �� | � | 36,777 | �� |
| Business development expenses |
�� | � | 17,332 | �� | �� | � | 16,998 | �� |
| Other |
�� | � | 95,364 | �� | �� | � | 103,581 | �� |
| �� | � |
� |
� | �� | � |
� |
� | |
| Total non-interest expenses |
�� | � | 601,559 | �� | �� | � | 618,992 | �� |
| �� | � |
� |
� | �� | � |
� |
� | |
| Income before income taxes |
�� | � | 186,152 | �� | �� | � | 125,679 | �� |
| Income tax expense |
�� | � | 81,505 | �� | �� | � | 51,291 | �� |
| �� | � |
� |
� | �� | � |
� |
� | |
| Net income |
�� | � | 104,647 | �� | �� | � | 74,388 | �� |
| Less: Net income attributable to noncontrolling interests |
�� | � | 641 | �� | �� | � | 1,656 | �� |
| �� | � |
� |
� | �� | � |
� |
� | |
| Net income attributable to NHI shareholders |
�� | � | 104,006 | �� | �� | � | 72,732 | �� |
| �� | � |
� |
� | �� | � |
� |
� | |
| � | �� | Yen | � | |||||
| � | �� | Six�months�ended�September�30 | � | |||||
| � | �� | ����2013���� | � | �� | ����2014���� | � | ||
| Per share of common stock: |
�� | �� | ||||||
| Basic� |
�� | �� | ||||||
| Net income attributable to NHI shareholders per share |
�� | � | 28.07 | �� | �� | � | 19.87 | �� |
| Diluted� |
�� | �� | ||||||
| Net income attributable to NHI shareholders per share |
�� | � | 27.20 | �� | �� | � | 19.34 | �� |
�
The accompanying notes are an integral part of these interim consolidated financial statements.
�
F-5
Table of Contents
Consolidated Statements of Income�(Continued) (UNAUDITED)
�
| � | �� | Millions�of�yen | � | |||||
| � | �� | Three�months�ended�September�30 | � | |||||
| � | �� | 2013 | � | �� | 2014 | � | ||
| Revenue: |
�� | �� | ||||||
| Commissions |
�� | � | 105,613 | �� | �� | � | 112,132 | �� |
| Fees from investment banking |
�� | � | 22,984 | �� | �� | � | 20,620 | �� |
| Asset management and portfolio service fees |
�� | � | 40,702 | �� | �� | � | 48,395 | �� |
| Net gain on trading |
�� | � | 110,180 | �� | �� | � | 129,011 | �� |
| Gain on private equity investments |
�� | � | 703 | �� | �� | � | 489 | �� |
| Interest and dividends |
�� | � | 98,091 | �� | �� | � | 108,775 | �� |
| Gain on investments in equity securities |
�� | � | 5,037 | �� | �� | � | 2,884 | �� |
| Other |
�� | � | 45,069 | �� | �� | � | 28,514 | �� |
| �� | � |
� |
� | �� | � |
� |
� | |
| Total revenue |
�� | � | 428,379 | �� | �� | � | 450,820 | �� |
| Interest expense |
�� | � | 71,989 | �� | �� | � | 76,987 | �� |
| �� | � |
� |
� | �� | � |
� |
� | |
| Net revenue |
�� | � | 356,390 | �� | �� | � | 373,833 | �� |
| �� | � |
� |
� | �� | � |
� |
� | |
| Non-interest expenses: |
�� | �� | ||||||
| Compensation and benefits |
�� | � | 135,391 | �� | �� | � | 140,823 | �� |
| Commissions and floor brokerage |
�� | � | 26,134 | �� | �� | � | 33,599 | �� |
| Information processing and communications |
�� | � | 46,240 | �� | �� | � | 45,961 | �� |
| Occupancy and related depreciation |
�� | � | 20,830 | �� | �� | � | 18,224 | �� |
| Business development expenses |
�� | � | 9,473 | �� | �� | � | 9,071 | �� |
| Other |
�� | � | 45,389 | �� | �� | � | 52,150 | �� |
| �� | � |
� |
� | �� | � |
� |
� | |
| Total non-interest expenses |
�� | � | 283,457 | �� | �� | � | 299,828 | �� |
| �� | � |
� |
� | �� | � |
� |
� | |
| Income before income taxes |
�� | � | 72,933 | �� | �� | � | 74,005 | �� |
| Income tax expense |
�� | � | 34,549 | �� | �� | � | 20,894 | �� |
| �� | � |
� |
� | �� | � |
� |
� | |
| Net income |
�� | � | 38,384 | �� | �� | � | 53,111 | �� |
| Less: Net income attributable to noncontrolling interests |
�� | � | 272 | �� | �� | � | 239 | �� |
| �� | � |
� |
� | �� | � |
� |
� | |
| Net income attributable to NHI shareholders |
�� | � | 38,112 | �� | �� | � | 52,872 | �� |
| �� | � |
� |
� | �� | � |
� |
� | |
| � | �� | Yen | � | |||||
| � | �� | Three�months�ended�September�30 | � | |||||
| � | �� | ��2013�� | � | �� | ��2014�� | � | ||
| Per share of common stock: |
�� | �� | ||||||
| Basic� |
�� | �� | ||||||
| Net income attributable to NHI shareholders per share |
�� | � | 10.29 | �� | �� | � | 14.53 | �� |
| Diluted� |
�� | �� | ||||||
| Net income attributable to NHI shareholders per share |
�� | � | 9.99 | �� | �� | � | 14.15 | �� |
The accompanying notes are an integral part of these interim consolidated financial statements.
�
F-6
Table of Contents
Consolidated Statements of Comprehensive Income (UNAUDITED)
�
| � | �� | Millions�of�yen | � | |||||
| � | �� | Six�months�ended�September�30 | � | |||||
| � | �� | 2013 | � | � | 2014 | � | ||
| Net income |
�� | � | 104,647 | �� | � | � | 74,388 | �� |
| Other comprehensive income: |
�� | � | ||||||
| Change in cumulative translation adjustments, net of tax |
�� | � | 27,431 | �� | � | � | 46,285 | �� |
| Defined benefit pension plans: |
�� | � | ||||||
| Pension liability adjustment |
�� | � | 2,005 | �� | � | � | 374 | �� |
| Deferred income taxes |
�� | � | (703 | )� | � | � | (211 | )� |
| �� | � |
� |
� | � | � |
� |
� | |
| Total |
�� | � | 1,302 | �� | � | � | 163 | �� |
| Non-trading securities: |
�� | � | ||||||
| Net unrealized gain on non-trading securities |
�� | � | 1,469 | �� | � | � | 9,712 | �� |
| Deferred income taxes |
�� | � | (645 | )� | � | � | (2,539 | )� |
| �� | � |
� |
� | � | � |
� |
� | |
| Total |
�� | � | 824 | �� | � | � | 7,173 | �� |
| �� | � |
� |
� | � | � |
� |
� | |
| Total other comprehensive income |
�� | � | 29,557 | �� | � | � | 53,621 | �� |
| �� | � |
� |
� | � | � |
� |
� | |
| Comprehensive income |
�� | � | 134,204 | �� | � | � | 128,009 | �� |
| Less: Comprehensive income attributable to noncontrolling interests |
�� | � | 1,382 | �� | � | � | 5,380 | �� |
| �� | � |
� |
� | � | � |
� |
� | |
| Comprehensive income attributable to NHI shareholders |
�� | � | 132,822 | �� | � | � | 122,629 | �� |
| �� | � |
� |
� | � | � |
� |
� | |
| � | �� | Millions�of�yen | � | |||||
| � | �� | Three�months�ended�September�30 | � | |||||
| � | �� | 2013 | � | � | 2014 | � | ||
| Net income |
�� | � | 38,384 | �� | � | � | 53,111 | �� |
| Other comprehensive income (loss): |
�� | � | ||||||
| Change in cumulative translation adjustments, net of tax |
�� | � | (5,542 | )� | � | � | 58,079 | �� |
| Defined benefit pension plans: |
�� | � | ||||||
| Pension liability adjustment |
�� | � | 449 | �� | � | � | 14 | �� |
| Deferred income taxes |
�� | � | (171 | )� | � | � | (69 | )� |
| �� | � |
� |
� | � | � |
� |
� | |
| Total |
�� | � | 278 | �� | � | � | (55 | )� |
| Non-trading securities: |
�� | � | ||||||
| Net unrealized gain on non-trading securities |
�� | � | 4,471 | �� | � | � | 6,312 | �� |
| Deferred income taxes |
�� | � | (1,286 | )� | � | � | (2,017 | )� |
| �� | � |
� |
� | � | � |
� |
� | |
| Total |
�� | � | 3,185 | �� | � | � | 4,295 | �� |
| �� | � |
� |
� | � | � |
� |
� | |
| Total other comprehensive income (loss) |
�� | � | (2,079 | )� | � | � | 62,319 | �� |
| �� | � |
� |
� | � | � |
� |
� | |
| Comprehensive income |
�� | � | 36,305 | �� | � | � | 115,430 | �� |
| Less: Comprehensive income attributable to noncontrolling interests |
�� | � | 962 | �� | � | � | 3,574 | �� |
| �� | � |
� |
� | � | � |
� |
� | |
| Comprehensive income attributable to NHI shareholders |
�� | � | 35,343 | �� | � | � | 111,856 | �� |
| �� | � |
� |
� | � | � |
� |
� | |
The accompanying notes are an integral part of these interim consolidated financial statements.
�
F-7
Table of Contents
Consolidated Statements of Changes in Equity�(UNAUDITED)
�
| � | �� | Millions�of�yen | � | |||||
| � | �� | Six�months�ended�September�30 | � | |||||
| � | �� | 2013 | � | � | 2014 | � | ||
| Common stock |
�� | � | ||||||
| Balance at beginning of year |
�� | � | 594,493 | �� | � | � | 594,493 | �� |
| �� | � |
� |
� | � | � |
� |
� | |
| Balance at end of period |
�� | � | 594,493 | �� | � | � | 594,493 | �� |
| �� | � |
� |
� | � | � |
� |
� | |
| Additional paid-in capital |
�� | � | ||||||
| Balance at beginning of year |
�� | � | 691,264 | �� | � | � | 683,638 | �� |
| Gain (loss) on sales of treasury stock |
�� | � | (5,439 | )� | � | � | (2,417 | )� |
| Issuance and exercise of common stock options |
�� | � | (3,777 | )� | � | � | 1,891 | �� |
| �� | � |
� |
� | � | � |
� |
� | |
| Balance at end of period |
�� | � | 682,048 | �� | � | � | 683,112 | �� |
| �� | � |
� |
� | � | � |
� |
� | |
| Retained earnings |
�� | � | ||||||
| Balance at beginning of year |
�� | � | 1,136,523 | �� | � | � | 1,287,003 | �� |
| Net income attributable to NHI shareholders |
�� | � | 104,006 | �� | � | � | 72,732 | �� |
| Cash dividends(1) |
�� | � | (29,652 | )� | � | � | (21,841 | )� |
| Gain (loss) on sales of treasury stock |
�� | � | ��� | �� | � | � | (2,658 | )� |
| �� | � |
� |
� | � | � |
� |
� | |
| Balance at end of period |
�� | � | 1,210,877 | �� | � | � | 1,335,236 | �� |
| �� | � |
� |
� | � | � |
� |
� | |
| Accumulated other comprehensive income (loss) |
�� | � | ||||||
| Cumulative translation adjustments |
�� | � | ||||||
| Balance at beginning of year |
�� | � | (38,875 | )� | � | � | 27,704 | �� |
| Net change during the period |
�� | � | 26,902 | �� | � | � | 44,378 | �� |
| �� | � |
� |
� | � | � |
� |
� | |
| Balance at end of period |
�� | � | (11,973 | )� | � | � | 72,082 | �� |
| �� | � |
� |
� | � | � |
� |
� | |
| Defined benefit pension plans |
�� | � | ||||||
| Balance at beginning of year |
�� | � | (28,518 | )� | � | � | (18,809 | )� |
| Pension liability adjustment |
�� | � | 1,302 | �� | � | � | 163 | �� |
| �� | � |
� |
� | � | � |
� |
� | |
| Balance at end of period |
�� | � | (27,216 | )� | � | � | (18,646 | )� |
| �� | � |
� |
� | � | � |
� |
� | |
| Non-trading securities |
�� | � | ||||||
| Balance at beginning of year |
�� | � | 9,998 | �� | � | � | 11,741 | �� |
| Net unrealized gain on non-trading securities |
�� | � | 612 | �� | � | � | 5,356 | �� |
| �� | � |
� |
� | � | � |
� |
� | |
| Balance at end of period |
�� | � | 10,610 | �� | � | � | 17,097 | �� |
| �� | � |
� |
� | � | � |
� |
� | |
| Balance at end of period |
�� | � | (28,579 | )� | � | � | 70,533 | �� |
| �� | � |
� |
� | � | � |
� |
� | |
| Common stock held in treasury |
�� | � | ||||||
| Balance at beginning of year |
�� | � | (70,514 | )� | � | � | (72,090 | )� |
| Repurchases of common stock |
�� | � | (32,493 | )� | � | � | (65,199 | )� |
| Sales of common stock |
�� | � | 8 | �� | � | � | 4 | �� |
| Common stock issued to employees |
�� | � | 22,662 | �� | � | � | 14,999 | �� |
| Other net change in treasury stock |
�� | � | 683 | �� | � | � | ��� | �� |
| �� | � |
� |
� | � | � |
� |
� | |
| Balance at end of period |
�� | � | (79,654 | )� | � | � | (122,286 | )� |
| �� | � |
� |
� | � | � |
� |
� | |
| Total NHI shareholders� equity |
�� | � | ||||||
| �� | � |
� |
� | � | � |
� |
� | |
| Balance at end of period |
�� | � | 2,379,185 | �� | � | � | 2,561,088 | �� |
| �� | � |
� |
� | � | � |
� |
� | |
| Noncontrolling interests |
�� | � | ||||||
| Balance at beginning of year |
�� | � | 24,612 | �� | � | � | 39,533 | �� |
| Cash dividends |
�� | � | (19 | )� | � | � | (19 | )� |
| Net income attributable to noncontrolling interests |
�� | � | 641 | �� | � | � | 1,656 | �� |
| Accumulated other comprehensive income attributable to noncontrolling interests |
�� | � | 741 | �� | � | � | 3,724 | �� |
| Purchase / sale of subsidiary shares, net |
�� | � | ��� | �� | � | � | 5,072 | �� |
| Other net change in noncontrolling interests |
�� | � | 6,142 | �� | � | � | 4,164 | �� |
| �� | � |
� |
� | � | � |
� |
� | |
| Balance at end of period |
�� | � | 32,117 | �� | � | � | 54,130 | �� |
| �� | � |
� |
� | � | � |
� |
� | |
| Total equity |
�� | � | ||||||
| Balance at end of period |
�� | � | 2,411,302 | �� | � | � | 2,615,218 | �� |
| �� | � |
� |
� | � | � |
� |
� | |
�
�
| (1)����Dividends�per�share |
�� | Six�months�ended�September�30,�2013 | �� | � | �8.00 | �� | �� | Three months ended September 30, 2013 | �� | � | �8.00 | �� |
| �� | Six�months�ended�September�30,�2014 |
�� | � | 6.00 | �� | �� | Three months ended September 30, 2014 | �� | � | 6.00 | �� |
The accompanying notes are an integral part of these interim consolidated financial statements.
�
F-8
Table of Contents
Consolidated Statements of Cash Flows (UNAUDITED)
�
| � | �� | Millions�of�yen | � | |||||
| � | �� | Six�months�ended�September�30 | � | |||||
| � | �� | 2013 | � | � | 2014 | � | ||
| Cash flows from operating activities: |
�� | � | ||||||
| Net income |
�� | � | 104,647 | �� | � | � | 74,388 | �� |
| Adjustments to reconcile net income to net cash provided by operating activities: |
�� | � | ||||||
| Depreciation and amortization |
�� | � | 39,853 | �� | � | � | 37,566 | �� |
| Gain on investments in equity securities |
�� | � | (12,889 | )� | � | � | (9,234 | )� |
| Deferred income taxes |
�� | � | 9,523 | �� | � | � | 19,918 | �� |
| Changes in operating assets and liabilities: |
�� | � | ||||||
| Time deposits |
�� | � | 141,920 | �� | � | � | 143,036 | �� |
| Deposits with stock exchanges and other segregated cash |
�� | � | (106,007 | )� | � | � | (49,499 | )� |
| Trading assets and private equity investments |
�� | � | (803,462 | )� | � | � | (775,733 | )� |
| Trading liabilities |
�� | � | 1,131,663 | �� | � | � | (395,689 | )� |
| Securities�purchased�under�agreements�to�resell,�net�of�securities�sold under agreements to repurchase |
�� | � | 224,006 | �� | � | � | 907,217 | �� |
| Securities borrowed, net of securities loaned |
�� | � | (232,396 | )� | � | � | (34,750 | )� |
| Other secured borrowings |
�� | � | 11,732 | �� | � | � | (75,485 | )� |
| Loans and receivables, net of allowance for doubtful accounts |
�� | � | (161,064 | )� | � | � | 9,322 | �� |
| Payables |
�� | � | 347,701 | �� | � | � | 150,424 | �� |
| Bonus accrual |
�� | � | (37,128 | )� | � | � | (53,295 | )� |
| Accrued income taxes, net |
�� | � | (16,873 | )� | � | � | 16,987 | �� |
| Other, net |
�� | � | (236,432 | )� | � | � | 66,521 | �� |
| �� | � |
� |
� | � | � |
� |
� | |
| Net cash provided by operating activities |
�� | � | 404,794 | �� | � | � | 31,694 | �� |
| �� | � |
� |
� | � | � |
� |
� | |
| Cash flows from investing activities: |
�� | � | ||||||
| Payments for purchases of office buildings, land, equipment and facilities |
�� | � | (114,549 | )� | � | � | (72,612 | )� |
| Proceeds from sales of office buildings, land, equipment and facilities |
�� | � | 94,214 | �� | � | � | 41,768 | �� |
| Payments for purchases of investments in equity securities |
�� | � | (100 | )� | � | � | (102 | )� |
| Proceeds from sales of investments in equity securities |
�� | � | 2,304 | �� | � | � | 4,735 | �� |
| Decrease (increase) in loans receivable at banks, net |
�� | � | 3,918 | �� | � | � | (12,464 | )� |
| Decrease (increase) in non-trading debt securities, net |
�� | � | (88,042 | )� | � | � | 68,663 | �� |
| Other, net |
�� | � | 4,146 | �� | � | � | (6,411 | )� |
| �� | � |
� |
� | � | � |
� |
� | |
| Net cash provided by (used in) investing activities |
�� | � | (98,109 | )� | � | � | 23,577 | �� |
| �� | � |
� |
� | � | � |
� |
� | |
| Cash flows from financing activities: |
�� | � | ||||||
| Increase in long-term borrowings |
�� | � | 1,112,884 | �� | � | � | 1,211,301 | �� |
| Decrease in long-term borrowings |
�� | � | (947,062 | )� | � | � | (1,188,488 | )� |
| Increase (decrease) in short-term borrowings, net |
�� | � | 59,590 | �� | � | � | (5,168 | )� |
| Decrease in deposits received at banks, net |
�� | � | (1,891 | )� | � | � | (53,645 | )� |
| Proceeds from sales of common stock held in treasury |
�� | � | 288 | �� | � | � | 78 | �� |
| Payments for repurchases of common stock held in treasury |
�� | � | (32,493 | )� | � | � | (65,199 | )� |
| Payments for cash dividends |
�� | � | (22,285 | )� | � | � | (33,469 | )� |
| �� | � |
� |
� | � | � |
� |
� | |
| Net cash provided by (used in) financing activities |
�� | � | 169,031 | �� | � | � | (134,590 | )� |
| �� | � |
� |
� | � | � |
� |
� | |
| Effect of exchange rate changes on cash and cash equivalents |
�� | � | 17,240 | �� | � | � | 29,313 | �� |
| �� | � |
� |
� | � | � |
� |
� | |
| Net increase (decrease) in cash and cash equivalents |
�� | � | 492,956 | �� | � | � | (50,006 | )� |
| Cash and cash equivalents at beginning of year |
�� | � | 805,087 | �� | � | � | 1,489,792 | �� |
| �� | � |
� |
� | � | � |
� |
� | |
| Cash and cash equivalents at end of period |
�� | � | 1,298,043 | �� | � | � | 1,439,786 | �� |
| �� | � |
� |
� | � | � |
� |
� | |
| Supplemental information: |
�� | � | ||||||
| Cash paid during the period for� |
�� | � | ||||||
| Interest |
�� | � | 154,025 | �� | � | � | 170,522 | �� |
| Income tax payments, net |
�� | � | 88,855 | �� | � | � | 14,386 | �� |
The accompanying notes are an integral part of these interim consolidated financial statements.
�
F-9
Table of Contents
Notes to the Interim Consolidated Financial Statements (UNAUDITED)
1. Summary of accounting policies:
Description of business�
Nomura Holdings, Inc. (the �Company�) and its broker-dealer, banking and other financial services subsidiaries provide investment, financing and related services to individual, institutional and government clients on a global basis. The Company and other entities in which it has a controlling financial interest are collectively referred to as �Nomura� within these interim consolidated financial statements.
Nomura operates its business through various divisions based upon the nature of specific products and services, its main client base and its management structure. Nomura reports operating results through three business segments: Retail, Asset Management and Wholesale.
In its Retail segment, Nomura provides investment consultation services mainly to individual clients in Japan. In its Asset Management segment, Nomura develops and manages investment trusts, and provides investment advisory services. In its Wholesale segment, Nomura is engaged in the sales and trading of debt and equity securities and currencies on a global basis to various institutions, provides investment banking services such as the underwriting of bonds and equities as well as mergers and acquisitions and financial advice and invests in private equity businesses and seeks to maximize returns on the investments by increasing the corporate value of investee companies.
The accounting and financial reporting policies of Nomura conform to U.S. generally accepted accounting principles (�U.S. GAAP�) as applicable to broker dealers. A summary of the significant accounting policies applied by Nomura within these interim consolidated financial statements is provided within in the notes to the consolidated financial statements of Nomura�s annual report on Form 20-F for the year ended March�31, 2014 as filed on June�26, 2014.
New accounting pronouncements recently adopted�
No new accounting pronouncements relevant to Nomura were adopted during the three months ended September�30, 2014.
The following new accounting pronouncements relevant to Nomura were adopted during the three months ended June�30, 2014:
Release of cumulative translation adjustment amounts
In March 2013, the FASB issued amendments to ASC 810-10 �Consolidation�Overall� (�ASC 810-10�) and ASC 830-30 �Foreign Currency Matters�Translation of Financial Statements� (�ASC 830-30�) through issuance of ASU 2013-05 �Parent�s Accounting for the Cumulative Translation Adjustment upon Derecognition of Certain Subsidiaries or Groups of Assets within a Foreign Entity or of an Investment in a Foreign Entity� (�ASU 2013-05�). The amendments resolve diversity in practice about whether guidance in ASC 810-10 or ASC�830-30 applies to the release of cumulative translation adjustment (�CTA�) amounts into earnings when a parent sells part or all of its investment in a foreign entity (or no longer holds a controlling financial interest in a subsidiary).
ASU 2013-05 is effective for fiscal years, and interim periods within those years, beginning after December�15, 2013 with early adoption permitted.
Nomura adopted ASU 2013-05 from April�1, 2014 and these amendments did not have a material impact on these consolidated financial statements.
Investment companies
In June 2013, the FASB issued amendments to ASC 946 �Financial Services�Investment Companies� (�ASC 946�) through issuance of ASU 2013-08 �Amendments to the Scope, Measurement, and Disclosure Requirements� (�ASU 2013-08�). ASU 2013-08 modifies the guidance under ASC 946 for determining whether an entity is an investment company, which is an entity that is required to measure its investments at fair value, including controlling financial interests in investees that are not investment companies. ASU 2013-08 also requires an investment company to measure noncontrolling ownership interests in other investment companies at fair value rather than using the equity method of accounting, and requires certain additional disclosures including information about financial support provided, or contractually required to be provided, by an investment company to any of its investees.
ASU 2013-08 is effective for fiscal years, and interim periods within those years, beginning after December�15, 2013 with early adoption prohibited.
Nomura adopted ASU 2013-08 from April�1, 2014 and these amendments did not have a material impact on these consolidated financial statements.
�
F-10
Table of Contents
Notes to the Interim Consolidated Financial Statements�(Continued) (UNAUDITED)
�
Future accounting developments�
The following new accounting pronouncements relevant to Nomura will be adopted in future periods:
Reporting Discontinued Operations
In April 2014, the FASB issued amendments to ASC 205, �Presentation of Financial Statements� (�ASC 205�) and ASC 360 �Property, Plant and Equipment� (�ASC 360�) through issuance of ASU 2014-08, �Reporting Discontinued Operations and Disclosures of Disposals of Components of an Entity,� (�ASU 2014-08�).�ASU 2014-08 changes the criteria for discontinued operations reporting with the intention of less disposals qualifying and also introduces new presentation and disclosure requirements.
ASU 2014-08 is effective prospectively for all disposals or expected disposals classified as held for sale that occur within annual periods beginning on or after December�15, 2014 and interim periods within those years. Early adoption is permitted, but only for disposals or expected disposals classified as held for sale that have not been reported in financial statements previously issued or available for issue.
Nomura currently plans to adopt ASU 2014-08 from April�1, 2015 and does not expect these amendments to have a material impact on these consolidated financial statements.
Revenue Recognition
In May 2014, the FASB issued ASC 606 �Revenue from Contracts with Customers� (�ASC 606�) as well as amendments to other pronouncements, including ASC 350 �Intangibles�Goodwill and Other�, ASC 360 �Property, Plant, and Equipment�, and ASC 605-35 �Revenue Recognition�Construction-Type and Production-Type Contracts� through issuance of ASU 2014-09 �Revenue from Contracts with Customers� (�ASU 2014-09�). ASU 2014-09 replaces existing revenue recognition guidance in ASC�605 �Revenue Recognition�, replaces certain other industry-specific revenue recognition guidance, specifies the accounting for certain costs to obtain or fulfill a contract with a customer and provides recognition and measurement guidance in relation to sales of non-financial assets. The core principle of ASU 2014-09 is to depict the transfer of goods or services to customers at an amount that reflects the consideration to which an entity expects to be entitled in exchange for those goods or services. It provides guidance on how to achieve this core principle, including how to identify contracts with customers and separate performance obligations in the contract, how to determine and allocate the transaction price to such performance obligations and how to recognize revenue when a performance obligation has been satisfied.
ASU 2014-09 is effective for annual reporting periods, and interim periods within those reporting periods, beginning after December�15, 2016 with early adoption prohibited.
Nomura will adopt ASU 2014-09 from April�1, 2017 and is currently evaluating the potential impact it may have on these consolidated financial statements.
Repurchase agreements and similar transactions
In June 2014, the FASB issued amendments to ASC 860 �Transfers and Servicing� (�ASC 860�) through issuance of ASU�2014-11 �Repurchase-to-Maturity Transactions, Repurchase Financings, and Disclosures� (�ASU 2014-11�). These amendments change the accounting for repurchase-to-maturity transactions which are repurchase agreements where the maturity of the security transferred as collateral matches the maturity of the repurchase agreement. Under ASU 2014-11, all repurchase-to-maturity transactions will be accounted for as secured borrowing transactions in the same way as other repurchase agreements rather than as sales of a financial asset and forward commitment to repurchase. The amendments also change the accounting for repurchase financing arrangements which are transactions involving the transfer of a financial asset to a counterparty executed contemporaneously with a reverse repurchase agreement with the same counterparty. Under ASU 2014-11, all repurchase financings will now be accounted for separately, which will result in secured lending accounting for the reverse repurchase agreement. ASU 2014-11 also introduces new disclosure requirements regarding repurchase agreements and securities lending transactions as well as certain other transactions which involve the transfer of financial assets accounted for as sales and where the transferor retains substantially all of the exposure to the economic return on the transferred assets.
ASU 2014-11 is effective for interim or annual periods beginning after December�15, 2014 with early adoption prohibited. As of adoption date, the accounting for all outstanding repurchase-to-maturity transactions and repurchase financing arrangements is adjusted by means of a cumulative-effect adjustment to the balance sheet and retained earnings.
Nomura will adopt ASU 2014-11 from January�1, 2015 and is currently evaluating the potential impact it may have on these consolidated financial statements.
�
F-11
Table of Contents
Notes to the Interim Consolidated Financial Statements�(Continued) (UNAUDITED)
�
Stock compensation
In June 2014, the FASB issued amendments to ASC 718 �Compensation�Stock Compensation� (�ASC�718�) through issuance of ASU 2014-12 �Accounting for Share-Based Payments When the Terms of an Award Provide That a Performance Target Could Be Achieved after the Requisite Service Period� (�ASU 2014-12�). ASU 2014-12 requires a performance target that affects vesting and that could be achieved after the requisite service period be accounted for as a performance condition based on the existing guidance in ASC 718 rather than as a nonvesting condition that affects the grant-date fair value of the award.
ASU 2014-12 is effective for annual periods, and interim periods within those annual periods, beginning after December�15, 2015 with early adoption permitted. ASU 2014-12 may be applied either by prospectively or retrospectively.
Nomura currently plans to adopt ASU 2014-12 from April�1, 2016 and does not expect these amendments to have a material impact on these consolidated financial statements.
Measurement of the financial assets and the financial liabilities of collateralized financing entities
In August 2014, the FASB issued amendments to ASC 810 �Consolidation� (�ASC�810�) through issuance of ASU 2014-13 �Measuring the Financial Assets and the Financial Liabilities of a Consolidated Collateralized Financing Entity� (�ASU 2014-13�). ASU 2014-13 provides an alternative to ASC 820 �Fair Value Measurements and disclosures� (�ASC 820�) for measuring the fair value of financial assets and the financial liabilities of a consolidated collateralized financing entity. When the measurement alternative is elected, either the fair value of the financial assets or the fair value of the financial liabilities is measured, depending upon which is more observable, with the value of the other side imputed, thus eliminating differences that can arise when each is measured separately.
ASU 2014-13 is effective for annual periods, and interim periods within those annual periods, beginning after December�15, 2015 with early adoption permitted.
Nomura currently plans to adopt ASU 2014-13 from April�1, 2016 and is currently evaluating the potential impact it may have on these consolidated financial statements.
�
F-12
Table of Contents
Notes to the Interim Consolidated Financial Statements�(Continued) (UNAUDITED)
�
2. Fair value measurements:
The fair value of financial instruments
A significant amount of Nomura�s financial instruments are carried at fair value. Financial assets carried at fair value on a recurring basis are reported in the consolidated balance sheets within Trading assets and private equity investments, Loans and receivables, Collateralized agreements and Other assets. Financial liabilities carried at fair value on a recurring basis are reported within Trading liabilities, Short-term borrowings, Payables and deposits, Collateralized financing, Long-term borrowings and Other liabilities.
Other financial assets and financial liabilities are measured at fair value on a nonrecurring basis, where the primary measurement basis is not fair value but where fair value is used in specific circumstances after initial recognition, such as to measure impairment.
In all cases, fair value is determined in accordance with ASC 820 which defines fair value as the amount that would be exchanged to sell a financial asset or transfer a financial liability in an orderly transaction between market participants at the measurement date. It assumes that the transaction occurs in Nomura�s principal market, or in the absence of the principal market, the most advantageous market for the relevant financial assets or financial liabilities.
Fair value is usually determined on an individual financial instrument basis consistent with the unit of account of the financial instrument. However, certain financial instruments managed on a portfolio basis are valued as a portfolio, namely based on the price that would be received to sell a net long position (i.e. a net financial asset) or transfer a net short position (i.e. a net financial liability) consistent with how market participants would price the net risk exposure at the measurement date.
Financial assets carried at fair value also include investments in certain funds where, as a practical expedient, fair value is determined on the basis of net asset value per share (�NAV�per share�) if the NAV per share is calculated in accordance with certain industry standard principles.
Increases and decreases in the fair value of assets and liabilities will significantly impact Nomura�s position, performance, liquidity and capital resources. As explained below, valuation techniques applied contain inherent uncertainties and Nomura is unable to predict the accurate impact of future developments in the market. Where appropriate, Nomura uses economic hedging strategies to mitigate its risk, although these hedges are also subject to unpredictable movements in the market.
Valuation methodology for financial instruments carried at fair value on a recurring basis
The fair value of financial instruments is based on quoted market prices including market indices, broker or dealer quotations or an estimation by management of the expected exit price under current market conditions. Various financial instruments, including cash instruments and over-the-counter (�OTC�) contracts, have bid and offer prices that are observable in the market. These are measured at the point within the bid-offer range which best represents Nomura�s estimate of fair value. Where quoted market prices or broker or dealer quotations are not available, prices for similar instruments or valuation pricing models are considered in the determination of fair value.
Where quoted prices are available in active markets, no valuation adjustments are taken to modify the fair value of assets or liabilities marked using such prices. Other instruments may be measured using valuation techniques, such as valuation pricing models incorporating observable parameters, unobservable parameters or a combination of both. Valuation pricing models use parameters which would be considered by market participants in valuing similar financial instruments.
Valuation pricing models and their underlying assumptions impact the amount and timing of unrealized and realized gains and losses recognized, and the use of different valuation pricing models or underlying assumptions could produce different financial results. Valuation uncertainty results from a variety of factors, including the valuation technique or model selected, the quantitative assumptions used within the valuation model, the inputs into the model, as well as other factors. Valuation adjustments are used to reflect the assessment of this uncertainty. Common valuation adjustments include model reserves, credit adjustments, close-out adjustments, and other appropriate instrument-specific adjustments, such as those to reflect transfer or sale restrictions.
The level of adjustments is largely judgmental and is based on an assessment of the factors that management believe other market participants would use in determining the fair value of similar financial instruments. The type of adjustments taken, the methodology for the calculation of these adjustments, and the inputs for these calculations are reassessed periodically to reflect current market practice and the availability of new information.
�
F-13
Table of Contents
Notes to the Interim Consolidated Financial Statements�(Continued) (UNAUDITED)
�
For example, the fair value of certain financial instruments includes adjustments for credit risk; both with regards to counterparty credit risk on positions held and Nomura�s own creditworthiness on positions issued. Credit risk on financial assets is significantly mitigated by credit enhancements such as collateral and netting arrangements. Any net credit exposure is measured using available and applicable inputs for the relevant counterparty. The same approach is used to measure the credit exposure on Nomura�s financial liabilities as is used to measure counterparty credit risk on Nomura�s financial assets.
Such valuation pricing models are calibrated to the market on a regular basis and inputs used are adjusted for current market conditions and risks. The Global Model Validation Group (�MVG�) within Nomura�s Risk Management Department reviews pricing models and assesses model appropriateness and consistency independently of the front office. The model reviews consider a number of factors about a model�s suitability for valuation and sensitivity of a particular product. Valuation models are calibrated to the market on a periodic basis by comparison to observable market pricing, comparison with alternative models and analysis of risk profiles.
As explained above, any changes in fixed income, equity, foreign exchange and commodity markets can impact Nomura�s estimates of fair value in the future, potentially affecting trading gains and losses. Where financial contracts have longer maturity dates, Nomura�s estimates of fair value may involve greater subjectivity due to the lack of transparent market data.
Fair value hierarchy
All financial instruments measured at fair value, including those carried at fair value using the fair value option, have been categorized into a three-level hierarchy (�fair value hierarchy�) based on the transparency of valuation inputs used by Nomura to estimate fair value. A financial instrument is classified in the fair value hierarchy based on the lowest level of input that is significant to the fair value measurement of the financial instrument. The three levels of the fair value hierarchy are defined as follows, with Level 1 representing the most transparent inputs and Level 3 representing the least transparent inputs:
Level 1:
Unadjusted quoted prices for identical financial instruments in active markets accessible by Nomura at the measurement date.
Level 2:
Quoted prices in inactive markets or prices containing other inputs which are observable, either directly or indirectly. Valuation techniques using observable inputs reflect assumptions used by market participants in pricing financial instruments and are based on data obtained from independent market sources at the measurement date.
Level 3:
Unobservable inputs that are significant to the fair value measurement of the financial instrument. Valuation techniques using unobservable inputs reflect management�s assumptions about the estimates used by other market participants in valuing similar financial instruments. These valuation techniques are developed based on the best available information at the measurement date.
The availability of inputs observable in the market varies by product and can be affected by a variety of factors. Significant factors include, but are not restricted to the prevalence of similar products in the market, especially for customized products, how established the product is in the market, for example, whether it is a new product or is relatively mature, and the reliability of information provided in the market which would depend, for example, on the frequency and volume of current data. A period of significant change in the market may reduce the availability of observable data. Under such circumstances, financial instruments may be reclassified into a lower level in the fair value hierarchy.
Significant judgments used in determining the classification of financial instruments include the nature of the market in which the product would be traded, the underlying risks, the type and liquidity of market data inputs and the nature of observed transactions for similar instruments.
Where valuation models include the use of parameters which are less observable or unobservable in the market, significant management judgment is used in establishing fair value. The valuations for Level 3 financial instruments, therefore, involve a greater degree of judgment than those valuations for Level 1 or Level 2 financial instruments.
Certain criteria management use to determine whether a market is active or inactive include the number of transactions, the frequency that pricing is updated by other market participants, the variability of price quotes among market participants, and the amount of publicly available information.
�
F-14
Table of Contents
Notes to the Interim Consolidated Financial Statements�(Continued) (UNAUDITED)
�
The following tables present the amounts of Nomura�s financial instruments measured at fair value on a recurring basis as of March�31, 2014 and September�30, 2014 within the fair value hierarchy.
�
| � | �� | Billions of yen | � | |||||||||||||||||
| � | �� | March�31, 2014 | � | |||||||||||||||||
| � | �� | Level�1 | � | �� | Level 2 | � | �� | Level�3 | � | �� | Counterparty and Cash Collateral Netting(1) |
� | � | Balance�as�of March�31,�2014 |
� | |||||
| Assets: |
�� | �� | �� | �� | � | |||||||||||||||
| Trading assets and private equity investments(2) |
�� | �� | �� | �� | � | |||||||||||||||
| Equities(3) |
�� | � | 2,176 | �� | �� | � | 655 | �� | �� | � | 68 | �� | �� | � | ��� | � | � | � | 2,899 | �� |
| Private equity investments(3) |
�� | � | ��� | � | �� | � | ��� | � | �� | � | 42 | �� | �� | � | ��� | � | � | � | 42 | �� |
| Japanese government securities |
�� | � | 2,587 | �� | �� | � | ��� | � | �� | � | ��� | � | �� | � | ��� | � | � | � | 2,587 | �� |
| Japanese agency and municipal securities |
�� | � | ��� | � | �� | � | 192 | �� | �� | � | ��� | � | �� | � | ��� | � | � | � | 192 | �� |
| Foreign government, agency and municipal securities |
�� | � | 4,615 | �� | �� | � | 1,378 | �� | �� | � | 26 | �� | �� | � | ��� | � | � | � | 6,019 | �� |
| Bank and corporate debt securities and loans for trading purposes |
�� | � | ��� | � | �� | � | 1,735 | �� | �� | � | 116 | �� | �� | � | ��� | � | � | � | 1,851 | �� |
| Commercial mortgage-backed securities (�CMBS�) |
�� | � | ��� | � | �� | � | 156 | �� | �� | � | 3 | �� | �� | � | ��� | � | � | � | 159 | �� |
| Residential mortgage-backed securities (�RMBS�) |
�� | � | ��� | � | �� | � | 2,221 | �� | �� | � | 3 | �� | �� | � | ��� | � | � | � | 2,224 | �� |
| Real estate-backed securities |
�� | � | ��� | � | �� | � | ��� | � | �� | � | 0 | �� | �� | � | ��� | � | � | � | 0 | �� |
| Collateralized debt obligations (�CDOs�) and other(4) |
�� | � | ��� | � | �� | � | 170 | �� | �� | � | 13 | �� | �� | � | ��� | � | � | � | 183 | �� |
| Investment trust funds and other |
�� | � | 136 | �� | �� | � | 87 | �� | �� | � | 30 | �� | �� | � | ��� | � | � | � | 253 | �� |
| �� | � |
� |
� | �� | � |
� |
� | �� | � |
� |
� | �� | � |
� |
� | � | � |
� |
� | |
| Total trading assets and private equity investments |
�� | � | 9,514 | �� | �� | � | 6,594 | �� | �� | � | 301 | �� | �� | � | ��� | � | � | � | 16,409 | �� |
| �� | � |
� |
� | �� | � |
� |
� | �� | � |
� |
� | �� | � |
� |
� | � | � |
� |
� | |
| Derivative assets(5) |
�� | �� | �� | �� | � | |||||||||||||||
| Equity contracts |
�� | � | 750 | �� | �� | � | 1,102 | �� | �� | � | 70 | �� | �� | � | ��� | � | � | � | 1,922 | �� |
| Interest rate contracts |
�� | � | 11 | �� | �� | � | 19,398 | �� | �� | � | 112 | �� | �� | � | ��� | � | � | � | 19,521 | �� |
| Credit contracts |
�� | � | 4 | �� | �� | � | 1,268 | �� | �� | � | 42 | �� | �� | � | ��� | � | � | � | 1,314 | �� |
| Foreign exchange contracts |
�� | � | ��� | � | �� | � | 3,293 | �� | �� | � | 19 | �� | �� | � | ��� | � | � | � | 3,312 | �� |
| Commodity contracts |
�� | � | 0 | �� | �� | � | 0 | �� | �� | � | 0 | �� | �� | � | ��� | � | � | � | 0 | �� |
| Netting |
�� | � | ��� | � | �� | � | ��� | � | �� | � | ��� | � | �� | � | (23,764 | )� | � | � | (23,764 | )� |
| �� | � |
� |
� | �� | � |
� |
� | �� | � |
� |
� | �� | � |
� |
� | � | � |
� |
� | |
| Total derivative assets |
�� | � | 765 | �� | �� | � | 25,061 | �� | �� | � | 243 | �� | �� | � | (23,764 | )� | � | � | 2,305 | �� |
| �� | � |
� |
� | �� | � |
� |
� | �� | � |
� |
� | �� | � |
� |
� | � | � |
� |
� | |
| Subtotal |
�� | � | 10,279 | �� | �� | � | 31,655 | �� | �� | � | 544 | �� | �� | � | (23,764 | )� | � | � | 18,714 | �� |
| �� | � |
� |
� | �� | � |
� |
� | �� | � |
� |
� | �� | � |
� |
� | � | � |
� |
� | |
| Loans and receivables(6) |
�� | � | ��� | � | �� | � | 280 | �� | �� | � | 26 | �� | �� | � | ��� | � | � | � | 306 | �� |
| Collateralized agreements(7) |
�� | � | ��� | � | �� | � | 1,087 | �� | �� | � | ��� | � | �� | � | ��� | � | � | � | 1,087 | �� |
| Other assets |
�� | �� | �� | �� | � | |||||||||||||||
| Non-trading debt securities |
�� | � | 406 | �� | �� | � | 615 | �� | �� | � | 3 | �� | �� | � | ��� | � | � | � | 1,024 | �� |
| Other(3) |
�� | � | 358 | �� | �� | � | 94 | �� | �� | � | 56 | �� | �� | � | ��� | � | � | � | 508 | �� |
| �� | � |
� |
� | �� | � |
� |
� | �� | � |
� |
� | �� | � |
� |
� | � | � |
� |
� | |
| Total |
�� | � | 11,043 | �� | �� | � | 33,731 | �� | �� | � | 629 | �� | �� | � | (23,764 | )� | � | � | 21,639 | �� |
| �� | � |
� |
� | �� | � |
� |
� | �� | � |
� |
� | �� | � |
� |
� | � | � |
� |
� | |
| Liabilities: |
�� | �� | �� | �� | � | |||||||||||||||
| Trading liabilities |
�� | �� | �� | �� | � | |||||||||||||||
| Equities |
�� | � | 774 | �� | �� | � | 132 | �� | �� | � | 1 | �� | �� | � | ��� | � | � | � | 907 | �� |
| Japanese government securities |
�� | � | 3,046 | �� | �� | � | ��� | � | �� | � | ��� | � | �� | � | ��� | � | � | � | 3,046 | �� |
| Foreign government, agency and municipal securities |
�� | � | 3,831 | �� | �� | � | 688 | �� | �� | � | ��� | � | �� | � | ��� | � | � | � | 4,519 | �� |
| Bank and corporate debt securities |
�� | � | ��� | � | �� | � | 396 | �� | �� | � | 0 | �� | �� | � | ��� | � | � | � | 396 | �� |
| Residential mortgage-backed securities (�RMBS�) |
�� | � | ��� | � | �� | � | 1 | �� | �� | � | ��� | � | �� | � | ��� | � | � | � | 1 | �� |
| Collateralized debt obligations (�CDOs�) and other(4) |
�� | � | ��� | � | �� | � | 0 | �� | �� | � | ��� | � | �� | � | ��� | � | � | � | 0 | �� |
| Investment trust funds and other |
�� | � | 76 | �� | �� | � | 12 | �� | �� | � | ��� | � | �� | � | ��� | � | � | � | 88 | �� |
| �� | � |
� |
� | �� | � |
� |
� | �� | � |
� |
� | �� | � |
� |
� | � | � |
� |
� | |
| Total trading liabilities |
�� | � | 7,727 | �� | �� | � | 1,229 | �� | �� | � | 1 | �� | �� | � | ��� | � | � | � | 8,957 | �� |
| �� | � |
� |
� | �� | � |
� |
� | �� | � |
� |
� | �� | � |
� |
� | � | � |
� |
� | |
| Derivative liabilities(5) |
�� | �� | �� | �� | � | |||||||||||||||
| Equity contracts |
�� | � | 827 | �� | �� | � | 1,368 | �� | �� | � | 59 | �� | �� | � | ��� | � | � | � | 2,254 | �� |
| Interest rate contracts |
�� | � | 10 | �� | �� | � | 19,142 | �� | �� | � | 151 | �� | �� | � | ��� | � | � | � | 19,303 | �� |
| Credit contracts |
�� | � | 4 | �� | �� | � | 1,582 | �� | �� | � | 37 | �� | �� | � | ��� | � | � | � | 1,623 | �� |
| Foreign exchange contracts |
�� | � | ��� | � | �� | � | 2,926 | �� | �� | � | 14 | �� | �� | � | ��� | � | � | � | 2,940 | �� |
| Commodity contracts |
�� | � | 0 | �� | �� | � | 0 | �� | �� | � | 0 | �� | �� | � | ��� | � | � | � | 0 | �� |
| Netting |
�� | � | ��� | � | �� | � | ��� | � | �� | � | ��� | � | �� | � | (24,030 | )� | � | � | (24,030 | )� |
| �� | � |
� |
� | �� | � |
� |
� | �� | � |
� |
� | �� | � |
� |
� | � | � |
� |
� | |
| Total derivative liabilities |
�� | � | 841 | �� | �� | � | 25,018 | �� | �� | � | 261 | �� | �� | � | (24,030 | )� | � | � | 2,090 | �� |
| �� | � |
� |
� | �� | � |
� |
� | �� | � |
� |
� | �� | � |
� |
� | � | � |
� |
� | |
| Subtotal |
�� | � | 8,568 | �� | �� | � | 26,247 | �� | �� | � | 262 | �� | �� | � | (24,030 | )� | � | � | 11,047 | �� |
| �� | � |
� |
� | �� | � |
� |
� | �� | � |
� |
� | �� | � |
� |
� | � | � |
� |
� | |
| Short-term borrowings(8) |
�� | � | ��� | � | �� | � | 46 | �� | �� | � | 3 | �� | �� | � | ��� | � | � | � | 49 | �� |
| Payables and deposits(9) |
�� | � | ��� | � | �� | � | 0 | �� | �� | � | 0 | �� | �� | � | ��� | � | � | � | 0 | �� |
| Collateralized financing(7) |
�� | � | ��� | � | �� | � | 530 | �� | �� | � | ��� | � | �� | � | ��� | � | � | � | 530 | �� |
| Long-term borrowings(8)(10)(11) |
�� | � | 134 | �� | �� | � | 1,439 | �� | �� | � | 394 | �� | �� | � | ��� | � | � | � | 1,967 | �� |
| Other liabilities(12) |
�� | � | 152 | �� | �� | � | 86 | �� | �� | � | ��� | � | �� | � | ��� | � | � | � | 238 | �� |
| �� | � |
� |
� | �� | � |
� |
� | �� | � |
� |
� | �� | � |
� |
� | � | � |
� |
� | |
| Total |
�� | � | 8,854 | �� | �� | � | 28,348 | �� | �� | � | 659 | �� | �� | � | (24,030 | )� | � | � | 13,831 | �� |
| �� | � |
� |
� | �� | � |
� |
� | �� | � |
� |
� | �� | � |
� |
� | � | � |
� |
� | |
�
F-15
Table of Contents
Notes to the Interim Consolidated Financial Statements�(Continued) (UNAUDITED)
�
| � | �� | Billions of yen | � | |||||||||||||||||
| � | �� | September�30, 2014 | � | |||||||||||||||||
| � | �� | Level�1 | � | �� | Level 2 | � | �� | Level�3 | � | �� | Counterparty and�Cash Collateral Netting(1) |
� | � | Balance�as�of September�30, 2014 |
� | |||||
| Assets: |
�� | �� | �� | �� | � | |||||||||||||||
| Trading assets and private equity investments(2) |
�� | �� | �� | �� | � | |||||||||||||||
| Equities(3) |
�� | � | 1,794 | �� | �� | � | 912 | �� | �� | � | 42 | �� | �� | � | ��� | � | � | � | 2,748 | �� |
| Private equity investments(3) |
�� | � | ��� | � | �� | � | ��� | � | �� | � | 45 | �� | �� | � | ��� | � | � | � | 45 | �� |
| Japanese government securities |
�� | � | 3,241 | �� | �� | � | ��� | � | �� | � | ��� | � | �� | � | ��� | � | � | � | 3,241 | �� |
| Japanese agency and municipal securities |
�� | � | ��� | � | �� | � | 168 | �� | �� | � | 0 | �� | �� | � | ��� | � | � | � | 168 | �� |
| Foreign government, agency and municipal securities |
�� | � | 4,920 | �� | �� | � | 1,502 | �� | �� | � | 11 | �� | �� | � | ��� | � | � | � | 6,433 | �� |
| Bank and corporate debt securities and loans for trading�purposes |
�� | � | ��� | � | �� | � | 2,116 | �� | �� | � | 115 | �� | �� | � | ��� | � | � | � | 2,231 | �� |
| Commercial mortgage-backed securities (�CMBS�) |
�� | � | ��� | � | �� | � | 143 | �� | �� | � | 3 | �� | �� | � | ��� | � | � | � | 146 | �� |
| Residential mortgage-backed securities (�RMBS�) |
�� | � | ��� | � | �� | � | 2,130 | �� | �� | � | 1 | �� | �� | � | ��� | � | � | � | 2,131 | �� |
| Real estate-backed securities |
�� | � | ��� | � | �� | � | 29 | �� | �� | � | 0 | �� | �� | � | ��� | � | � | � | 29 | �� |
| Collateralized debt obligations (�CDO�) and other(4) |
�� | � | ��� | � | �� | � | 194 | �� | �� | � | 29 | �� | �� | � | ��� | � | � | � | 223 | �� |
| Investment trust funds and other |
�� | � | 475 | �� | �� | � | 71 | �� | �� | � | 18 | �� | �� | � | ��� | � | � | � | 564 | �� |
| �� | � |
� |
� | �� | � |
� |
� | �� | � |
� |
� | �� | � |
� |
� | � | � |
� |
� | |
| Total trading assets and private equity investments |
�� | � | 10,430 | �� | �� | � | 7,265 | �� | �� | � | 264 | �� | �� | � | ��� | � | � | � | 17,959 | �� |
| �� | � |
� |
� | �� | � |
� |
� | �� | � |
� |
� | �� | � |
� |
� | � | � |
� |
� | |
| Derivative assets(5) |
�� | �� | �� | �� | � | |||||||||||||||
| Equity contracts |
�� | � | 784 | �� | �� | � | 1,212 | �� | �� | � | 53 | �� | �� | � | ��� | � | � | � | 2,049 | �� |
| Interest rate contracts |
�� | � | 21 | �� | �� | � | 24,023 | �� | �� | � | 87 | �� | �� | � | ��� | � | � | � | 24,131 | �� |
| Credit contracts |
�� | � | 5 | �� | �� | � | 1,069 | �� | �� | � | 35 | �� | �� | � | ��� | � | � | � | 1,109 | �� |
| Foreign exchange contracts |
�� | � | 0 | �� | �� | � | 4,843 | �� | �� | � | 18 | �� | �� | � | ��� | � | � | � | 4,861 | �� |
| Commodity contracts |
�� | � | 0 | �� | �� | � | 0 | �� | �� | � | 0 | �� | �� | � | ��� | � | � | � | 0 | �� |
| Netting |
�� | � | ��� | � | �� | � | ��� | � | �� | � | ��� | � | �� | � | (30,054 | )� | � | � | (30,054 | )� |
| �� | � |
� |
� | �� | � |
� |
� | �� | � |
� |
� | �� | � |
� |
� | � | � |
� |
� | |
| Total derivative assets |
�� | � | 810 | �� | �� | � | 31,147 | �� | �� | � | 193 | �� | �� | � | (30,054 | )� | � | � | 2,096 | �� |
| �� | � |
� |
� | �� | � |
� |
� | �� | � |
� |
� | �� | � |
� |
� | � | � |
� |
� | |
| Subtotal |
�� | � | 11,240 | �� | �� | � | 38,412 | �� | �� | � | 457 | �� | �� | � | (30,054 | )� | � | � | 20,055 | �� |
| �� | � |
� |
� | �� | � |
� |
� | �� | � |
� |
� | �� | � |
� |
� | � | � |
� |
� | |
| Loans and receivables(6) |
�� | � | ��� | � | �� | � | 258 | �� | �� | � | 27 | �� | �� | � | ��� | � | � | � | 285 | �� |
| Collateralized agreements(7) |
�� | � | ��� | � | �� | � | 984 | �� | �� | � | ��� | � | �� | � | ��� | � | � | � | 984 | �� |
| Other assets |
�� | �� | �� | �� | � | |||||||||||||||
| Non-trading debt securities |
�� | � | 366 | �� | �� | � | 601 | �� | �� | � | 0 | �� | �� | � | ��� | � | � | � | 967 | �� |
| Other(3) |
�� | � | 347 | �� | �� | � | 52 | �� | �� | � | 56 | �� | �� | � | ��� | � | � | � | 455 | �� |
| �� | � |
� |
� | �� | � |
� |
� | �� | � |
� |
� | �� | � |
� |
� | � | � |
� |
� | |
| Total |
�� | � | 11,953 | �� | �� | � | 40,307 | �� | �� | � | 540 | �� | �� | � | (30,054 | )� | � | � | 22,746 | �� |
| �� | � |
� |
� | �� | � |
� |
� | �� | � |
� |
� | �� | � |
� |
� | � | � |
� |
� | |
| Liabilities: |
�� | �� | �� | �� | � | |||||||||||||||
| Trading liabilities |
�� | �� | �� | �� | � | |||||||||||||||
| Equities |
�� | � | 870 | �� | �� | � | 195 | �� | �� | � | 1 | �� | �� | � | ��� | � | � | � | 1,066 | �� |
| Japanese government securities |
�� | � | 2,894 | �� | �� | � | ��� | � | �� | � | ��� | � | �� | � | ��� | � | � | � | 2,894 | �� |
| Foreign government, agency and municipal securities |
�� | � | 3,873 | �� | �� | � | 771 | �� | �� | � | ��� | � | �� | � | ��� | � | � | � | 4,644 | �� |
| Bank and corporate debt securities |
�� | � | ��� | � | �� | � | 432 | �� | �� | � | 0 | �� | �� | � | ��� | � | � | � | 432 | �� |
| Residential mortgage-backed securities (�RMBS�) |
�� | � | ��� | � | �� | � | 3 | �� | �� | � | ��� | � | �� | � | ��� | � | � | � | 3 | �� |
| Collateralized debt obligations (�CDO�) and other(4) |
�� | � | ��� | � | �� | � | 1 | �� | �� | � | 1 | �� | �� | � | ��� | � | � | � | 2 | �� |
| Investment trust funds and other |
�� | � | 79 | �� | �� | � | 12 | �� | �� | � | ��� | � | �� | � | ��� | � | � | � | 91 | �� |
| �� | � |
� |
� | �� | � |
� |
� | �� | � |
� |
� | �� | � |
� |
� | � | � |
� |
� | |
| Total trading liabilities |
�� | � | 7,716 | �� | �� | � | 1,414 | �� | �� | � | 2 | �� | �� | � | ��� | � | � | � | 9,132 | �� |
| �� | � |
� |
� | �� | � |
� |
� | �� | � |
� |
� | �� | � |
� |
� | � | � |
� |
� | |
| Derivative liabilities(5) |
�� | �� | �� | �� | � | |||||||||||||||
| Equity contracts |
�� | � | 759 | �� | �� | � | 1,348 | �� | �� | � | 61 | �� | �� | � | ��� | � | � | � | 2,168 | �� |
| Interest rate contracts |
�� | � | 9 | �� | �� | � | 23,696 | �� | �� | � | 139 | �� | �� | � | ��� | � | � | � | 23,844 | �� |
| Credit contracts |
�� | � | 4 | �� | �� | � | 1,417 | �� | �� | � | 31 | �� | �� | � | ��� | � | � | � | 1,452 | �� |
| Foreign exchange contracts |
�� | � | 0 | �� | �� | � | 4,425 | �� | �� | � | 16 | �� | �� | � | ��� | � | � | � | 4,441 | �� |
| Commodity contracts |
�� | � | 0 | �� | �� | � | 0 | �� | �� | � | 0 | �� | �� | � | ��� | � | � | � | 0 | �� |
| Netting |
�� | � | ��� | � | �� | � | ��� | � | �� | � | ��� | � | �� | � | (30,155 | )� | � | � | (30,155 | )� |
| �� | � |
� |
� | �� | � |
� |
� | �� | � |
� |
� | �� | � |
� |
� | � | � |
� |
� | |
| Total derivative liabilities |
�� | � | 772 | �� | �� | � | 30,886 | �� | �� | � | 247 | �� | �� | � | (30,155 | )� | � | � | 1,750 | �� |
| �� | � |
� |
� | �� | � |
� |
� | �� | � |
� |
� | �� | � |
� |
� | � | � |
� |
� | |
| Subtotal |
�� | � | 8,488 | �� | �� | � | 32,300 | �� | �� | � | 249 | �� | �� | � | (30,155 | )� | � | � | 10,882 | �� |
| �� | � |
� |
� | �� | � |
� |
� | �� | � |
� |
� | �� | � |
� |
� | � | � |
� |
� | |
| Short-term borrowings(8) |
�� | � | ��� | � | �� | � | 35 | �� | �� | � | 2 | �� | �� | � | ��� | � | � | � | 37 | �� |
| Payables and deposits(9) |
�� | � | ��� | � | �� | � | 0 | �� | �� | � | 0 | �� | �� | � | ��� | � | � | � | 0 | �� |
| Collateralized financing(7) |
�� | � | ��� | � | �� | � | 536 | �� | �� | � | ��� | � | �� | � | ��� | � | � | � | 536 | �� |
| Long-term borrowings(8)(10)(11) |
�� | � | 113 | �� | �� | � | 1,835 | �� | �� | � | 439 | �� | �� | � | ��� | � | � | � | 2,387 | �� |
| Other liabilities(12) |
�� | � | 142 | �� | �� | � | 43 | �� | �� | � | ��� | � | �� | � | ��� | � | � | � | 185 | �� |
| �� | � |
� |
� | �� | � |
� |
� | �� | � |
� |
� | �� | � |
� |
� | � | � |
� |
� | |
| Total |
�� | � | 8,743 | �� | �� | � | 34,749 | �� | �� | � | 690 | �� | �� | � | (30,155 | )� | � | � | 14,027 | �� |
| �� | � |
� |
� | �� | � |
� |
� | �� | � |
� |
� | �� | � |
� |
� | � | � |
� |
� | |
�
�
F-16
Table of Contents
Notes to the Interim Consolidated Financial Statements�(Continued) (UNAUDITED)
�
| (1) | Represents the amount offset under counterparty netting of derivative assets and liabilities as well as cash collateral netting against net derivatives. |
| (2) | Includes investments in certain funds measured at fair value on the basis of NAV per share as a practical expedient. |
| (3) | Includes equity investments that would have been accounted for under the equity method had Nomura not chosen to elect the fair value option. |
| (4) | Includes collateralized loan obligations (�CLOs�) and asset-backed securities (�ABS�) such as those secured on credit card loans, auto loans and student loans. |
| (5) | Each derivative classification includes derivatives referencing multiple risk components. For example, interest rate contracts include complex derivatives referencing interest rate risk as well as foreign exchange risk or other factors such as prepayment rates. Credit contracts include credit default swaps as well as derivatives referencing corporate and government debt securities. |
| (6) | Includes loans for which the fair value option is elected. |
| (7) | Includes collateralized agreements or collateralized financing for which the fair value option is elected. |
| (8) | Includes structured notes for which the fair value option is elected. |
| (9) | Includes embedded derivatives bifurcated from deposits received at banks. If unrealized gains are greater than unrealized losses, deposits are reduced by the excess amount. |
| (10) | Includes embedded derivatives bifurcated from issued structured notes. If unrealized gains are greater than unrealized losses, borrowings are reduced by the excess amount. |
| (11) | Includes liabilities recognized from secured financing transactions that are accounted for as financings rather than sales. Nomura elected the fair value option for these liabilities. |
| (12) | Includes loan commitments for which the fair value option is elected. |
Valuation techniques by major class of financial instrument
The valuation techniques used by Nomura to estimate fair value for major classes of financial instruments, together with the significant inputs which determine classification in the fair value hierarchy, are as follows.
Equities and equity securities reported within Other assets�Equities and equity securities reported within Other assets include direct holdings of both listed and unlisted equity securities, and fund investments. Listed equity securities are valued using quoted prices for identical securities from active markets where available. These valuations should be in line with market practice and therefore can be based on bid/offer prices as applicable or mid-market prices. Nomura determines whether the market is active depending on the sufficiency and frequency of trading activity. Where these securities are classified in Level 1 of the fair value hierarchy, no valuation adjustments are made to fair value. Listed equity securities traded in inactive markets are also generally valued using the exchange price and are classified in Level 2. Whilst rare in practice, Nomura may apply a discount or liquidity adjustment to the exchange price of a listed equity security traded in an inactive market if the exchange price is not considered to be an appropriate representation of fair value. These adjustments are determined by individual security and are not determined or influenced by the size of holding. The amount of such adjustments made to listed equity securities traded in inactive markets was �nil as of March�31, 2014 and September�30, 2014, respectively. Unlisted equity securities are valued using the same methodology as private equity investments described below and are usually classified in Level 3 because significant valuation inputs such as yields and liquidity discounts are unobservable. As a practical expedient, fund investments are generally valued using NAV per share where available. Publicly traded mutual funds which are valued using a daily NAV per share are classified in Level 1. Investments in funds where Nomura has the ability to redeem its investment with the investee at NAV per share as of the balance sheet date or within the near term are classified in Level 2. Investments in funds where Nomura does not have the ability to redeem in the near term or does not know when it can redeem are classified in Level�3. The Direct Capitalization Method (�DCM�) is used as a valuation technique for certain equity investments in real estate funds, with net operating income used as a measure of financial performance which is then applied to a capitalization rate dependent on the characteristics of the underlying real estate. Equity investments which are valued using DCM valuation techniques are generally classified in Level 3 since observable market capitalization rates are usually not available for identical or sufficiently similar real estate to that held within the real estate funds being valued.
Private equity investments�The valuation of unlisted private equity investments requires significant management judgment because the investments, by their nature, have little or no price transparency. Private equity investments are initially carried at cost as an approximation of fair value. Adjustments to carrying value are made if there is third-party evidence of a change in value. Adjustments are also made, in the absence of third-party transactions, if it is determined that the expected exit price of the investment is different from carrying value. In reaching that determination, Nomura primarily uses either a discounted cash flow (�DCF�) or market multiple valuation technique. A DCF valuation technique incorporates estimated future cash flows to be generated from the underlying investee, as adjusted for an appropriate growth rate discounted at a weighted average cost of capital (�WACC�). Market multiple valuation techniques include comparables such as Enterprise Value/earnings before interest, taxes, depreciation and amortization (�EV/EBITDA�) ratios, Price/Earnings (�PE�) ratios, Price/Book ratios, Price/Embedded Value ratios and other multiples based on relationships between numbers reported in the financial statements of the investee and the price of comparable companies. A liquidity discount may also be applied to either a DCF or market multiple valuation to reflect the specific characteristics of the investee. Where possible these valuations are compared with the operating cash flows and financial performance of the investee or properties�relative to budgets or projections, price/earnings data for similar quoted companies, trends within sectors and/or regions and any specific rights or terms associated with the investment, such as conversion features and liquidation preferences. Private equity investments are generally classified in Level 3 since the valuation inputs such as those mentioned above are usually unobservable.
�
F-17
Table of Contents
Notes to the Interim Consolidated Financial Statements�(Continued) (UNAUDITED)
�
Government, agency and municipal securities�Japanese and other G7 government securities are valued using quoted market prices, executable broker or dealer quotations, or alternative pricing sources. These securities are traded in active markets and therefore are classified within Level 1 of the fair value hierarchy. Non-G7 government securities, agency securities and municipal securities are valued using similar pricing sources but are generally classified in Level 2 as they are traded in inactive markets. Certain non-G7 securities may be classified in Level 1 because they are traded in active markets. Certain securities may be classified in Level 3 because they are traded infrequently and there is not sufficient information from comparable securities to classify them in Level 2. These are valued using DCF valuation techniques which include significant unobservable inputs such as credit spreads of the issuer.
Bank and corporate debt securities�The fair value of bank and corporate debt securities is primarily determined using DCF valuation techniques but also using broker or dealer quotations and recent market transactions of identical or similar debt securities, if available. Consideration is given to the nature of the broker and dealer quotations, namely whether these are indicative or executable, the number of available quotations and how these quotations compare to any available recent market activity or alternative pricing sources. The significant valuation inputs used for DCF valuations are yield curves, asset swap spreads, recovery rates and credit spreads of the issuer. Bank and corporate debt securities are generally classified in Level 2 of the fair value hierarchy because these valuation inputs are usually observable or market-corroborated. Certain bank and corporate debt securities will be classified in Level 3 because they are traded infrequently and there is insufficient information from comparable securities to classify them in Level 2, or credit spreads or recovery rates of the issuer used in DCF valuations are unobservable.
Commercial mortgage-backed securities (�CMBS�) and Residential mortgage-backed securities (�RMBS�)�The fair value of CMBS and RMBS is primarily determined using DCF valuation techniques but also using broker or dealer quotations and recent market transactions of identical or similar securities, if available. Consideration is given to the nature of the broker and dealer quotations, namely whether these are indicative or executable, the number of available quotations and how these quotations compare to any available recent market activity or alternative pricing sources. The significant valuation inputs include yields, prepayment rates, default probabilities and loss severities. CMBS and RMBS securities are generally classified in Level 2 because these valuation inputs are observable or market-corroborated. Certain CMBS and RMBS positions will be classified in Level 3 because they are traded infrequently and there is insufficient information from comparable securities to classify them in Level 2, or one or more of the significant valuation inputs used in DCF valuations are unobservable.
Real estate-backed securities�The fair value of real estate-backed securities is estimated using broker or dealer quotations, recent market transactions or by reference to a comparable market index. Consideration is given to the nature of the broker and dealer quotations, namely whether these are indicative or executable, the number of available quotations and how these quotations compare to any available recent market activity or alternative pricing sources. Where all significant inputs are observable, the securities will be classified in Level�2. For certain securities, no direct pricing sources or comparable securities or indices may be available. These securities are valued using DCF or DCM valuation techniques and are classified in Level 3 as the valuation includes significant unobservable valuation inputs such as yields, prepayment rates, default probabilities, loss severities and capitalization rates.
Collateralized debt obligations (�CDOs�) and other�The fair value of CDOs is primarily determined using DCF valuation techniques but also using broker or dealer quotations and recent market transactions of identical or similar securities, if available. Consideration is given to the nature of the broker and dealer quotations, namely whether these are indicative or executable, the number of available quotations and how these quotations compare to any available recent market activity or alternative pricing sources. The significant valuation inputs used include market spread data for each credit rating, yields, prepayment rates, default probabilities and loss severities. CDOs are generally classified in Level 2 of the fair value hierarchy because these valuation inputs are observable or market-corroborated. CDOs will be classified in Level 3 where one or more of the significant valuation inputs used in the DCF valuations are unobservable.
Investment trust funds and other�Investment trust funds are generally valued using NAV per share. Publicly traded funds which are valued using a daily NAV per share are classified in Level 1. For funds that are not publicly traded but Nomura has the ability to redeem its investment with the investee at NAV per share on the balance sheet date or within the near term, the investments are classified in Level 2. Investments where Nomura does not have the ability to redeem in the near term or does not know when it can redeem are classified in Level 3. The fair value of certain other investments reported within Investment trust funds and other is determined using DCF valuation techniques. These investments are classified in Level 3 as the valuation includes significant unobservable valuation inputs such as credit spreads of issuer and correlation.
Derivatives�Equity contracts�Nomura enters into both exchange-traded and OTC equity derivative transactions such as index and equity options, equity basket options and index and equity swaps. The fair value of exchange-traded equity derivatives is primarily determined using an unadjusted exchange price. These derivatives are generally traded in active markets and therefore are classified in Level 1 of the fair value hierarchy. Where these derivatives are not valued at the exchange price due to timing differences, these are classified in Level 2. The fair value of OTC equity derivatives is determined through option models such as Black-Scholes and Monte Carlo simulation. The significant valuation inputs used include equity prices, dividend yields, volatilities and correlations. Valuation adjustments are also made to model valuations in order to reflect counterparty credit risk on derivative assets and Nomura�s own creditworthiness on derivative liabilities. OTC equity derivatives are generally classified in Level 2 because all significant valuation inputs and adjustments are observable or market-corroborated. Certain longer-dated or more complex equity derivatives are classified in Level 3 where dividend yield, volatility or correlation valuation inputs are significant and unobservable.
�
F-18
Table of Contents
Notes to the Interim Consolidated Financial Statements�(Continued) (UNAUDITED)
�
Derivatives�Interest rate contracts�Nomura enters into both exchange-traded and OTC interest rate derivative transactions such as interest rate swaps, currency swaps, interest rate options, forward rate agreements, swaptions, caps and floors. The fair value of exchange-traded interest rate derivatives is primarily determined using an unadjusted exchange price. These derivatives are traded in active markets and therefore are classified in Level 1 of the fair value hierarchy. Where these derivatives are not valued at the exchange price due to timing differences, they are classified in Level 2. The fair value of OTC interest rate derivatives is determined through DCF valuation techniques as well as option models such as Black-Scholes and Monte Carlo simulation. The significant valuation inputs used include interest rates, forward foreign exchange (�FX�) rates, volatilities and correlations. Valuation adjustments are also made to model valuations in order to reflect counterparty credit risk on derivative assets and Nomura�s own creditworthiness on derivative liabilities. OTC interest rate derivatives are generally classified in Level 2 because all significant valuation inputs and adjustments are observable or market-corroborated. Certain longer-dated or more complex OTC interest rate derivatives are classified in Level�3 where forward FX rate, interest rate, volatility or correlation valuation inputs are significant and unobservable.
Derivatives�Credit contracts�Nomura enters into OTC credit derivative transactions such as credit default swaps and credit options on single names, indices or baskets of assets. The fair value of OTC credit derivatives is determined through DCF valuation techniques as well as option models such as Black-Scholes and Monte Carlo simulation. The significant valuation inputs used include interest rates, credit spreads, recovery rates, default probabilities, volatilities and correlations. Valuation adjustments are also made to model valuations in order to reflect counterparty credit risk on derivative assets and Nomura�s own creditworthiness on derivative liabilities. OTC credit derivatives are generally classified in Level 2 of the fair value hierarchy because all significant valuation inputs and adjustments are observable or market-corroborated. Certain longer-dated or more complex OTC credit derivatives are classified in Level 3 where credit spread, recovery rate, volatility or correlation valuation inputs are significant and unobservable.
Derivatives�Foreign exchange contracts�Nomura enters into both exchange-traded and OTC foreign exchange derivative transactions such as foreign exchange forwards and currency options. The fair value of exchange-traded foreign exchange derivatives is primarily determined using an unadjusted exchange price. These derivatives are traded in active markets and therefore are classified in Level 1 of the fair value hierarchy. Where these derivatives are not valued at the exchange price due to timing differences, they are classified in Level 2. The fair value of OTC foreign exchange derivatives is determined through DCF valuation techniques as well as option models such as Black-Scholes and Monte Carlo simulation. The significant valuation inputs used include interest rates, forward FX rates, spot FX rates and volatilities. Valuation adjustments are also made to model valuations in order to reflect counterparty credit risk on derivative assets and Nomura�s own creditworthiness on derivative liabilities. OTC foreign exchange derivatives are generally classified in Level 2 because all significant valuation inputs and adjustments are observable or market-corroborated. Certain longer-dated foreign exchange derivatives are classified in Level 3 where forward FX rate or volatility valuation inputs are significant and unobservable.
Derivatives�Commodity contracts�Nomura enters into OTC commodity derivative transactions such as commodity swaps, commodity forwards and commodity options. The fair value of OTC commodity derivatives is determined through DCF valuation techniques as well as option models such as Black-Scholes and Monte Carlo simulation. The significant valuation inputs used include commodity prices, interest rates, volatilities and correlations. Valuation adjustments are also made to model valuations in order to reflect counterparty credit risk on derivative assets and Nomura�s own creditworthiness on derivative liabilities. OTC commodity derivatives are generally classified in Level 2 of the fair value hierarchy because these valuation inputs and adjustments are observable or market-corroborated.
Loans�The fair value of loans carried at fair value either as trading assets or through election of the fair value option is primarily determined using DCF valuation techniques as quoted prices are typically not available. The significant valuation inputs used are similar to those used in the valuation of corporate debt securities described above. Loans are generally classified in Level 2 of the fair value hierarchy because all significant valuation inputs are observable. Certain loans, however, are classified in Level 3 because they are traded infrequently and there is not sufficient information from comparable securities to classify them in Level 2 or credit spreads of the issuer used in DCF valuations are significant and unobservable.
Collateralized agreements and Collateralized financing�The primary types of collateralized agreement and financing transactions carried at fair value are reverse repurchase and repurchase agreements elected for the fair value option. The fair value of these financial instruments is primarily determined using DCF valuation techniques. The significant valuation inputs used include interest rates and collateral funding spreads such as general collateral or special rates. Reverse repurchase and repurchase agreements are generally classified in Level 2 of the fair value hierarchy because these valuation inputs are usually observable.
Non-trading debt securities�These are debt securities held by certain non-trading subsidiaries in the group and are valued and classified in the fair value hierarchy using the same valuation techniques used for other debt securities classified as Government, agency and municipal securities and Bank and corporate debt securities described above.
�
F-19
Table of Contents
Notes to the Interim Consolidated Financial Statements�(Continued) (UNAUDITED)
�
Short-term and long-term borrowings (�Structured notes�)�Structured notes are debt securities issued by Nomura or by consolidated variable interest entities (�VIEs�) which contain embedded features that alter the return to the investor from simply receiving a fixed or floating rate of interest to a return that depends upon some other variables, such as an equity or equity index, commodity price, foreign exchange rate, credit rating of a third party or a more complex interest rate (i.e., an embedded derivative).
The fair value of structured notes is estimated using a quoted price in an active market for the identical liability if available, and where not available, using a mixture of valuation techniques that use the quoted price of the identical liability when traded as an asset, quoted prices for similar liabilities, similar liabilities when traded as assets, or an internal model which combines DCF valuation techniques and option pricing models, depending on the nature of the embedded features within the structured note. Where an internal model is used, Nomura estimates the fair value of both the underlying debt instrument and the embedded derivative components. The significant valuation inputs used to estimate the fair value of the debt instrument component include yield curves and prepayment rates. The significant valuation inputs used to estimate the fair value of the embedded derivative component are the same as those used for the relevant type of freestanding OTC derivative discussed above. A valuation adjustment is also made to the entire structured note in order to reflect Nomura�s own creditworthiness. To reflect Nomura�s own creditworthiness, the fair value of structured notes includes a credit adjustment of �1 billion as of March�31, 2014 and �3 billion as of September�30, 2014. This adjustment is determined based on recent observable secondary market transactions and executable broker quotes involving Nomura debt instruments and is therefore typically treated as a Level 2 valuation input. Structured notes are generally classified in Level 2 of the fair value hierarchy as all significant valuation inputs and adjustments are observable. Where any unobservable inputs are significant, such as volatilities and correlations used to estimate the fair value of the embedded derivative component, structured notes are classified in Level�3.
Long-term borrowings (�Secured financing transactions�)�Secured financing transactions are liabilities recognized when a transfer of a financial asset does not meet the criteria for sales accounting under ASC 860 and therefore the transaction is accounted for as a secured borrowing. These liabilities are valued using the same valuation techniques that are applied to the transferred financial assets which remain on the consolidated balance sheets and are therefore classified in the same level in the fair value hierarchy as the transferred financial assets. These liabilities do not provide general recourse to Nomura and therefore no adjustment is made to reflect Nomura�s own creditworthiness.
Valuation processes
In order to ensure the appropriateness of any fair value measurement of a financial instrument used within these consolidated financial statements, including those classified in Level 3 within the fair value hierarchy, Nomura operates a governance framework which mandates determination or validation of a fair value measurement by control and support functions independent of the trading businesses assuming the risk of the financial instrument. Such functions within Nomura with direct responsibility for either defining, implementing or maintaining valuation policies and procedures are as follows:
�
| � | � | � | The Product Control Valuations Group (�PCVG�) within Nomura�s Finance Department has primary responsibility for determining and implementing valuation policies and procedures in connection with determination of fair value measurements. In particular, this group will ensure that valuation policies are documented for each type of financial instrument in accordance with U.S. GAAP. While it is the responsibility of market makers and investment professionals in our trading businesses to price our financial instruments, the PCVG are responsible for independently verifying or validating these prices. In the event of a difference in opinion or where the estimate of fair value requires judgment, the valuation used within these consolidated financial statements is made by senior managers independent of the trading businesses. This group reports to the Global Head of Product Control and ultimately to the Chief Financial Officer (�CFO�); |
�
| � | � | � | The Accounting Policy Group within Nomura�s Finance Department defines the group�s accounting policies and procedures in accordance with U.S.�GAAP, including those associated with determination of fair value under ASC 820 and other relevant U.S.�GAAP pronouncements. This group reports to the Global Head of Accounting Policy and ultimately to the CFO; and |
�
| � | � | � | The MVG within Nomura�s Risk Management Department validates the appropriateness and consistency of pricing models used to determine fair value measurements independently of those who design and build the models. This group reports to the Chief Risk Officer. |
The fundamental components of this governance framework over valuation processes within Nomura particularly as it relates to Level 3 financial instruments are the procedures in place for independent price verification, pricing model validation and revenue substantiation.
Independent price verification processes
The key objective of the independent price verification processes within Nomura is to verify the appropriateness of fair value measurements applied to all financial instruments within Nomura. In applying these control processes, observable inputs are used whenever possible and when unobservable inputs are necessary, the processes seek to ensure the valuation technique and inputs are appropriate, reasonable and consistently applied.
�
F-20
Table of Contents
Notes to the Interim Consolidated Financial Statements�(Continued) (UNAUDITED)
�
The independent price verification processes aim to verify the fair value of all positions to external levels on a regular basis. The process will involve obtaining data such as trades, marks and prices from internal and external sources and examining the impact of marking the internal positions at the external prices. Margin disputes within the collateral process will also be investigated to determine if there is any impact on valuations.
Where third-party pricing information sourced from brokers, dealers and consensus pricing services is used as part of the price verification process, consideration is given as to whether that information reflects actual recent market transactions or prices at which transactions involving identical or similar financial instruments are currently executable. If such transactions or prices are not available, the financial instrument will generally be classified in Level 3.
Where there is a lack of observable market information around the inputs used in a fair value measurement, then the PCVG and the MVG will assess the inputs used for reasonableness considering available information including comparable products, surfaces, curves and past trades. Additional valuation adjustments may be taken for the uncertainty in the inputs used, such as correlation and where appropriate trading desks may be asked to execute trades to evidence market levels.
Model review and validation
For more complex financial instruments pricing models are used to determine fair value measurements. The MVG performs an independent model approval process which incorporates a review of the model assumptions across a diverse set of parameters. Considerations include:
�
| � | � | � | Scope of the model (different financial instruments may require different but consistent pricing approaches); |
�
| � | � | � | Mathematical and financial assumptions; |
�
| � | � | � | Full or partial independent benchmarking along with boundary and stability tests, numerical convergence, calibration quality and stability; |
�
| � | � | � | Model integration within Nomura�s trading and risk systems; |
�
| � | � | � | Calculation of risk numbers and risk reporting; and |
�
| � | � | � | Hedging strategies/practical use of the model. |
New models are reviewed and approved by the MVG. The frequency of subsequent MVG reviews (�Model Re-approvals�) is at least annually.
Revenue substantiation
Nomura�s Product Control function also ensures adherence to Nomura�s valuation policies through daily and periodic analytical review of net revenues. This process involves substantiating revenue amounts through explanations and attribution of revenue sources based on the underlying factors such as interest rates, credit spreads, volatilities, foreign exchange rates etc. In combination with the independent price verification processes, this daily, weekly, monthly and quarterly review substantiates the revenues made while helping to identify and resolve potential booking, pricing or risk quantification issues.
Level 3 financial instruments
As described above, the valuation of Level 3 financial assets and liabilities is dependent on certain significant inputs which cannot be observed in the market. Common characteristics of an inactive market include a low number of transactions of the financial instrument, stale or non-current price quotes, price quotes that vary substantially either over time or among market makers, non-executable broker quotes or little publicly released information.
If corroborative evidence is not available to value Level 3 financial instruments, fair value may be established using other equivalent products in the market. The level of correlation between the specific Level 3 financial instrument and the available benchmark instrument is considered as an unobservable parameter. Other techniques for determining an appropriate value for unobservable parameters may consider information such as consensus pricing data among certain market participants, historical trends, extrapolation from observable market data and other information Nomura would expect market participants to use in valuing similar instruments.
Use of reasonably possible alternative input assumptions to value Level 3 financial instruments will significantly influence fair value determination. Ultimately, the uncertainties described above about input assumptions imply that the fair value of Level 3 financial instruments is a judgmental estimate. The specific valuation for each instrument is based on management�s judgment of prevailing market conditions, in accordance with Nomura�s established valuation policies and procedures.
�
F-21
Table of Contents
Notes to the Interim Consolidated Financial Statements�(Continued) (UNAUDITED)
�
Quantitative information regarding significant unobservable inputs and assumptions
The following tables present information about the significant unobservable inputs and assumptions used by Nomura for financial instruments classified in Level 3 as of March�31, 2014 and September�30, 2014. These financial instruments will also typically include observable valuation inputs (i.e. Level 1 or Level 2 valuation inputs) which are not included in the table and are also often hedged using financial instruments which are classified in Level 1 or Level 2 of the fair value hierarchy.
�
| � | �� | March�31, 2014 | ||||||||||
| Financial Instrument |
�� | Fair�value in�billions�of�yen |
� | �� | Valuation technique(s) |
�� | Significant unobservable�inputs |
�� | Range
of valuation�inputs(1) |
� | Weighted Average(2) | |
| Assets: |
�� | �� | �� | �� | � | |||||||
| Trading assets and private equity investments |
�� | �� | �� | �� | � | |||||||
| Equities |
�� | � | 68 | �� | �� | DCF | �� | Liquidity discounts | �� | 11.0���50.0% | � | 18.1% |
| �� | �� | � |
�� | � |
�� | � |
� | � | ||||
| �� | �� | DCM | �� | Capitalization�rates | �� | 6.8���6.9% | � | 6.8% | ||||
| �� | � |
� |
� | �� | � |
�� | � |
�� | � |
� | � | |
| Private equity investments |
�� | � | 42 | �� | �� | Market�multiples | �� | EV/EBITDA ratios Price/Embedded�value�ratios |
�� | 4.5���11.6�x 0.4�x 0.0�� 33.0% |
� | 10.0�x 0.4 x 30.5% |
| �� | � |
� |
� | �� | � |
�� | � |
�� | � |
� | � | |
| Foreign government, agency and municipal securities |
�� | � | 26 | �� | �� | DCF | �� | Credit spreads | �� | 0.0���5.9% | � | 0.5% |
| �� | � |
� |
� | �� | � |
�� | � |
�� | � |
� | � | |
| Bank and corporate debt securities and loans for trading purposes |
�� | � | 116 | �� | �� | DCF | �� | Credit spreads Recovery rates |
�� | 0.0�� 26.6% 0.0�� 74.0% |
� | 4.7% 57.1% |
| �� | � |
� |
� | �� | � |
�� | � |
�� | � |
� | � | |
| Commercial mortgage-backed securities (�CMBS�) |
�� | � | 3 | �� | �� | DCF | �� | Yields | �� | 6.2�� 30.4% | � | 10.1% |
| �� | � |
� |
� | �� | � |
�� | � |
�� | � |
� | � | |
| Residential mortgage-backed securities (�RMBS�) |
�� | � | 3 | �� | �� | DCF | �� | Yields Prepayment�rates Default�probabilities Loss severities |
�� | 0.3�� 10.7% 3.8�� 50.0% 0.0���2.0% 0.1�� 87.2% |
� | 3.7% 12.8% 2.0% 51.2% |
| �� | � |
� |
� | �� | � |
�� | � |
�� | � |
� | � | |
| Collateralized debt obligations (�CDOs�) and other |
�� | � | 13 | �� | �� | DCF | �� | Yields Prepayment rates Default probabilities Loss severities |
�� | 0.0�� 90.9% 0.0�� 20.0% 1.0�� 65.0% 30.0���100.0% |
� | 11.1% 18.5% 3.2% 47.9% |
| �� | � |
� |
� | �� | � |
�� | � |
�� | � |
� | � | |
| Investment trust funds and other |
�� | � | 30 | �� | �� | DCF | �� | Credit spreads Correlations |
�� | 0.0���3.5% 0.50���0.71 |
� | 0.1% 0.61 |
| �� | � |
� |
� | �� | � |
�� | � |
�� | � |
� | � | |
�
F-22
Table of Contents
Notes to the Interim Consolidated Financial Statements�(Continued) (UNAUDITED)
�
| � | �� | March�31, 2014 | ||||||||||
| Financial Instrument |
�� | Fair�value in�billions�of�yen |
� | � | Valuation technique(s) |
�� | Significant unobservable�inputs |
�� | Range
of valuation�inputs(1) |
� | Weighted Average(2) | |
| Derivatives, net: |
�� | � | �� | �� | � | |||||||
| Equity contracts |
�� | � | 11 | �� | � | Option models | �� | Dividend yield Volatilities Correlations |
�� | 0.0���8.2% 6.9�� 59.9% (0.96)�� 0.95 |
� | ��� ��� ��� |
| �� | � |
� |
� | � | � |
�� | � |
�� | � |
� | � | |
| Interest rate contracts |
�� | � | (39 | )� | � | DCF/ Option models |
�� | Interest rates | �� | 0.7���5.2% | � | ��� |
| �� | � | � |
�� | � |
�� | � |
� | � | ||||
| �� | � | Option�models | �� | Volatilities Correlations |
�� | 10.6���23.5% (0.45)�� 0.99 |
� | ��� ��� | ||||
| �� | � |
� |
� | � | � |
�� | � |
�� | � |
� | � | |
| Credit contracts |
�� | � � |
5 � |
� �� |
� | DCF/ Option�models |
�� | Credit spreads Recovery�rates |
�� | 0.0�� 20.9% 20.0�� 90.0% |
� | ��� ��� |
| �� | � | � |
�� | � |
�� | � |
� | � | ||||
| �� | � | Option�models | �� | Volatilities Correlations |
�� | 1.0�� 70.0% 0.26���0.95 |
� | ��� ��� | ||||
| �� | � |
� |
� | � | � |
�� | � |
�� | � |
� | � | |
| Foreign exchange contracts |
�� | � | 5 | �� | � | Option models | �� | Volatilities | �� | 11.2�� 19.1% | � | ��� |
| �� | � |
� |
� | � | � |
�� | � |
�� | � |
� | � | |
| Loans and receivables |
�� | � | 26 | �� | � | DCF | �� | Credit spreads | �� | 0.0% | � | 0.0% |
| �� | � |
� |
� | � | � |
�� | � |
�� | � |
� | � | |
| Other assets |
�� | � | �� | �� | � | |||||||
| Non-trading debt securities |
�� | � | 3 | �� | � | DCF | �� | Credit spreads | �� | 0.1���2.5% | � | 0.8% |
| �� | � |
� |
� | � | � |
�� | � |
�� | � |
� | � | |
|
Other(3) |
�� | � | 56 | �� | � | DCF | �� | WACC | �� | 6.1% | � | 6.1% |
| �� | � | �� | Growth rates Liquidity�discounts |
�� | 1.0% 0.0�� 30.0% |
� | 1.0% 12.7% | |||||
| �� | � | � |
�� | � |
�� | � |
� | � | ||||
| �� | � | Market�multiples | �� | EV/EBITDA ratios PE ratios Price/Book ratios Liquidity discounts |
�� | 3.6���8.3�x 9.6���60.1�x 0.0���5.3�x 30.0% |
� | 4.9�x 24.0�x 1.0 x 30.0% | ||||
| �� | � |
� |
� | � | � |
�� | � |
�� | � |
� | � | |
| Liabilities: |
�� | � | �� | �� | � | |||||||
| Short-term borrowings |
�� | � | 3 | �� | � | DCF | �� | Volatilities Correlations |
�� | 15.3�� 55.5% (0.78)�� 0.94 |
� | ��� ��� |
| �� | � |
� |
� | � | � |
�� | � |
�� | � |
� | � | |
| Long-term borrowings |
�� | � | 394 | �� | � | DCF | �� | Volatilities Correlations |
�� | 10.6�� 55.5% (0.78)�� 0.99 |
� | ��� ��� |
| �� | � |
� |
� | � | � |
�� | � |
�� | � |
� | � | |
�
F-23
Table of Contents
Notes to the Interim Consolidated Financial Statements�(Continued) (UNAUDITED)
�
| � | �� | September�30, 2014 | ||||||||||
| Financial Instrument |
�� | Fair�value in�billions�of�yen |
� | � | Valuation technique(s) |
�� | Significant unobservable�inputs |
�� | Range of valuation�inputs(1) |
� | Weighted Average(2) | |
| Assets: |
�� | � | �� | �� | � | |||||||
| Trading assets and private equity investments |
�� | � | �� | �� | � | |||||||
| Equities |
�� | � | 42 | �� | � | DCF | �� | Liquidity�discounts | �� | 4.6���40.0% | � | 33.1% |
| �� | � |
� |
� | � | � |
�� | � |
�� | � |
� | � | |
| Private equity investments |
�� | � | 45 | �� | � | Market multiples | �� | EV/EBITDA ratios Price/Embedded�value�ratios |
�� | 4.9���11.2x 0.4x 0.0���33.0% |
� | 9.8 x 0.4 x 30.5% |
| �� | � |
� |
� | � | � |
�� | � |
�� | � |
� | � | |
| Foreign government, agency and municipal securities |
�� | � | 11 | �� | � | DCF | �� | Credit spreads | �� | 0.0���5.9% | � | 0.5% |
| �� | � |
� |
� | � | � |
�� | � |
�� | � |
� | � | |
| Bank and corporate debt securities and loans for trading purposes |
�� | � | 115 | �� | � | DCF | �� | Credit spreads Recovery rates |
�� | 0.0���68.0% 0.0���37.0% |
� | 5.6% 25.0% |
| �� | � |
� |
� | � | � |
�� | � |
�� | � |
� | � | |
| Commercial mortgage-backed securities (�CMBS�) |
�� | � | 3 | �� | � | DCF | �� | Yields | �� | 9.9���37.8% | � | 16.6% |
| �� | � |
� |
� | � | � |
�� | � |
�� | � |
� | � | |
| Residential mortgage-backed securities (�RMBS�) |
�� | � | 1 | �� | � | DCF | �� | Yields Prepayment rates |
�� | 0.2���22.4% 2.7���12.0% |
� | 4.0% 7.3% |
| �� | � |
� |
� | � | � |
�� | � |
�� | � |
� | � | |
| Collateralized debt obligations (�CDO�) and other |
�� | � | 29 | �� | � | DCF | �� | Yields Prepayment�rates Default�probabilities Loss severities |
�� | 3.2���20.5% 0.0���20.0% 2.0���65.0% 33.0���100.0% |
� | 9.4% 19.1% 2.9% 32.2% |
| �� | � |
� |
� | � | � |
�� | � |
�� | � |
� | � | |
| Derivatives, net: |
�� | � | �� | �� | � | |||||||
| Equity contracts |
�� | � | (8 | )� | � | Option models | �� | Dividend yield Volatilities Correlations |
�� | 0.0���14.5% 9.5���73.5% (0.90)���0.93 |
� | � � � |
| �� | � |
� |
� | � | � |
�� | � |
�� | � |
� | � | |
| Interest rate contracts |
�� | � | (52 | ) | � | DCF/ Option models |
�� | Interest rates | �� | 0.1���4.1% | � | � |
| �� | � | � |
�� | � |
�� | � |
� | � | ||||
| �� | � | Option�models | �� | Volatilities Correlations |
�� | 11.5���75.0% (0.30)���1.00 |
� | � � | ||||
| �� | � |
� |
� | � | � |
�� | � |
�� | � |
� | � | |
| Credit contracts |
�� | � | 4 | � | � | DCF/ Option models |
�� | Credit spreads Recovery�rates |
�� | 0.0���7.0% 0.0���90.0% |
� | � � |
| �� | � | � |
�� | � |
�� | � |
� | � | ||||
| �� | � | Option�models | �� | Volatilities Correlations |
�� | 1.0���67.0% 0.29���0.95 |
� | � � | ||||
| �� | � |
� |
� | � | � |
�� | � |
�� | � |
� | � | |
| Foreign exchange contracts |
�� | � | 2 | �� | � | Option models | �� | Volatilities | �� | 1.3���18.7% | � | � |
| �� | � |
� |
� | � | � |
�� | � |
�� | � |
� | � | |
| Loans and receivables |
�� | � | 27 | �� | � | DCF | �� | Credit spreads | �� | 0.0���6.9% | � | 0.5% |
| �� | � |
� |
� | � | � |
�� | � |
�� | � |
� | � | |
| Other assets |
�� | � | �� | �� | � | |||||||
|
Other(3) |
�� | � | 56 | �� | � | DCF | �� | WACC Growth rates Credit spreads |
�� | 6.0% 1.0% 0.6�� 2.5% |
� | 6.0% 1.0% 1.4% 10.4% |
| �� | � | � |
�� | � |
�� | � |
� | � | ||||
| �� | � | Market�multiples | �� | EV/EBITDA ratios PE ratios Price/Book ratios Liquidity discounts |
�� | 4.0���9.9�x 11.5���83.9�x 0.0���5.0�x 30.0% |
� | 5.0�x 29.3�x 1.0 x 30.0% | ||||
| �� | � |
� |
� | � | � |
�� | � |
�� | � |
� | � | |
�
F-24
Table of Contents
Notes to the Interim Consolidated Financial Statements�(Continued) (UNAUDITED)
�
| � | �� | September�30, 2014 | ||||||||||
| Financial Instrument |
�� | Fair�value in�billions�of�yen |
� | �� | Valuation technique(s) |
�� | Significant unobservable�inputs |
�� | Range
of valuation�inputs(1) |
�� | Weighted Average(2) | |
| Liabilities: |
�� | �� | �� | �� | �� | |||||||
| Short-term borrowings |
�� | � | 2 | �� | �� | DCF | �� | Volatilities Correlations |
�� | 16.0���44.5% (0.75)�� 0.93 |
�� | � � |
| �� | � |
� |
� | �� | � |
�� | � |
�� | � |
�� | � | |
| Long-term borrowings |
�� | � | 439 | �� | �� | DCF | �� | Yields Prepayment�rates Default�probabilities Loss severities Volatilities Correlations |
�� | 10.3�� 14.0% 20.0% 2.0% 30.0% 11.5�� 44.5% (0.75)�� 0.99 |
�� | � � � � � � |
| �� | � |
� |
� | �� | � |
�� | � |
�� | � |
�� | � | |
�
| (1) | Range information is provided in percentages, coefficients and multiples and represents the highest and lowest level significant unobservable valuation input used to value that type of financial instrument. A wide dispersion in the range does not necessarily reflect increased uncertainty or subjectivity in the valuation input and is typically just a consequence of the different characteristics of the financial instruments themselves. |
| (2) | Weighted average information for non-derivative instruments is calculated by weighting each valuation input by the fair value of the financial instrument. |
| (3) | Valuation technique(s) and unobservable inputs represent those equity securities reported within Other assets. |
Qualitative discussion of the ranges of significant unobservable inputs
The following comments present qualitative discussion about the significant unobservable inputs used by Nomura for financial instruments classified in Level 3.
Derivatives�Equity contracts�The significant unobservable inputs are dividend yield, volatilities and correlations. The range of dividend yields varies as some companies do not pay any dividends, for example due to a lack of profits or as a policy during a growth period, and hence have a zero dividend yield while others may pay a high dividend for example to return money to investors. The range of volatilities is wide as the volatilities of shorter-dated equity derivatives or those based on singles stocks can be higher than those of longer-dated instruments or those based on indices. Correlations represent the relationships between one input and another (�pairs�) and can either be positive or negative amounts. The range of correlations moves from positive to negative because the movement of some pairs is very closely related in the same direction causing high positive correlations while others generally move in opposite directions causing high negative correlations with pairs that have differing relationships throughout the range.
Derivatives�Interest rate contracts�The significant unobservable inputs are interest rates, volatilities and correlations. The range of interest rates is due to interest rates in different countries/currencies being at different levels with some countries having extremely low levels and others being at levels that while still relatively low are less so. The range of volatilities is wide as the volatilities of shorter-dated interest rate derivatives are typically higher than those of longer-dated instruments. The range of correlations moves from positive to negative because the movement of some pairs is very closely related in the same direction causing high positive correlations while others generally move in opposite directions causing high negative correlations with pairs that have differing relationships through the range. Other than for volatilities where the majority of the inputs are away from the higher end of the range, the other significant unobservable inputs are spread across the relevant ranges.
Derivatives�Credit contracts�The significant unobservable inputs are credit spreads, recovery rates, volatilities and correlations. The range of credit spreads is due to the low end of the range arising from exposure to underlying reference names with very limited risk of a default and the high end arising from exposure to underlying reference names with a much greater risk of default. The range of recovery rates varies mainly due to the seniority of the underlying exposure with senior exposures having a higher recovery than subordinated exposures. The range of volatilities is wide as the volatilities of shorter-dated credit contracts are typically higher than those of longer-dated instruments. The correlation range is positive since credit spread moves are generally in the same direction. High positive correlations are those for which the movement is closely related with the correlation falling as the relationship becomes less strong. Other than for volatilities where the majority of inputs are away from the higher end of the range, the other significant unobservable inputs are spread across the relevant ranges.
Derivatives�Foreign exchange contracts�The significant unobservable inputs is volatilities. The range of volatilities is relatively low with the lower end coming from currencies that trade in narrow ranges versus the US dollar. All significant unobservable inputs are spread across the relevant ranges.
�
F-25
Table of Contents
Notes to the Interim Consolidated Financial Statements�(Continued) (UNAUDITED)
�
Short-term borrowings and Long-term borrowings�The significant unobservable inputs are yields, prepayment rates, default probabilities, loss severities, volatilities and correlations. The range of volatilities is wide as the volatilities of shorter-dated instruments are typically higher than those in longer-dated instruments. The range of correlations moves from positive to negative because the movement of some pairs is very closely related in the same direction causing high positive correlations while others generally move in opposite directions causing high negative correlations with pairs that have differing relationships through the range. Other than for volatilities where the majority of inputs are away from the higher end of the range, the other significant unobservable inputs are spread across the relevant ranges.
Sensitivity of fair value to changes in unobservable inputs
For each class of financial instrument described in the above tables, changes in each of the significant unobservable inputs and assumptions used by Nomura will impact upon the determination of a fair value measurement for the financial instrument. The sensitivity of these Level 3 fair value measurements to changes in unobservable inputs and interrelationships between those inputs is described below:
�
| � | � | � | Equities, Private equity investments and equity securities reported within Other assets�When using DCF valuation techniques to determine fair value, a significant increase (decrease) in WACC, credit spreads or liquidity discount in isolation would result in a significantly lower (higher) fair value measurement. Conversely, a significant increase (decrease) in growth rate would result in a corresponding significantly higher (lower) fair value measurement. There is little interrelationship between these measures. When using market multiples to determine fair value, a significant increase (decrease) in the relevant multiples such as PE ratios, EV/EBITDA ratios, Price/Book ratios and Price/Embedded Value ratios in isolation would result in a higher (lower) fair value measurement. Conversely, a significant increase (decrease) in the liquidity discount applied to the holding in isolation would result in a significantly lower (higher) fair value measurement. Generally changes in assumptions around multiples result in a corresponding similar directional change in a fair value measurement, assuming earnings levels remain constant. When using DCM, a significant increase (decrease) in the capitalization rate would result in a significantly lower (higher) fair value measurement. |
�
| � | � | � | Foreign government, agency and municipal securities, Bank and corporate debt securities and loans for trading purposes, Loans and receivables and Non-trading debt securities�Significant increases (decreases) in the credit spreads used in a DCF valuation technique would result in a significantly lower (higher) fair value measurement, while significant increases (decreases) in recovery rates would result in a significantly higher (lower) fair value measurement. |
�
| � | � | � | Commercial mortgage-backed securities (�CMBS�), Residential mortgage-backed securities (�RMBS�) and Collateralized debt obligations (�CDOs�) and other�Significant increases (decreases) in yields, prepayment rates, default probabilities and loss severities used in a DCF valuation technique in isolation would result in a significantly lower (higher) fair value measurement. Generally, a change in default probabilities is accompanied by a directionally similar change in loss severities and a directionally opposite change in prepayment rates. |
�
| � | � | � | Investment trust funds and other�Significant increases (decreases) in credit spreads used in a DCF valuation technique would result in a significantly lower (higher) fair value measurement, while significant increases (decreases) in correlation would result in a significantly higher (lower) fair value measurement. |
�
| � | � | � | Derivatives�Where Nomura is long the underlying risk of a derivative, significant increases (decreases) in the underlying of the derivative, such as interest rates or credit spreads in isolation or significant decreases (increases) in dividend yields would result in a significantly higher (lower) fair value measurement. Where Nomura is short the underlying risk of a derivative, the impact of these changes would have a converse effect on the fair value measurements reported by Nomura. Where Nomura is long optionality, recovery rates or correlation, significant increases (decreases) in volatilities, recovery rates or correlation will generally result in a significantly higher (lower) fair value measurement. Where Nomura is short optionality, recovery rates or correlation, the impact of these changes would have a converse effect on the fair value measurements. |
�
| � | � | � | Short-term borrowings and Long-term borrowings�Significant increase (decreases) in yields, prepayment rates, default probabilities and loss severities in isolation would result in a significant lower (higher) fair value measurement. Generally, a change in default probabilities is accompanied by a directionally similar change in the assumption used for loss severities and a directionally opposite change in prepayment rates. Where Nomura is long optionality or correlation, significant increases (decreases) in volatilities or correlation used in a DCF valuation technique will generally result in a significantly higher (lower) fair value measurement. Where Nomura is short optionality or correlation, the impact of these changes would have a converse effect on the fair value measurements. |
�
F-26
Table of Contents
Notes to the Interim Consolidated Financial Statements�(Continued) (UNAUDITED)
�
Movements in Level 3 financial instruments
The following tables present gains and losses as well as increases and decreases of financial instruments measured at fair value on a recurring basis which Nomura classified in Level 3 for the six and three months ended September�30, 2013 and 2014. Financial instruments classified in Level 3 are often hedged with instruments within Level 1 or Level 2 of the fair value hierarchy. The gains or losses presented below do not reflect the offsetting gains or losses for these hedging instruments. Level 3 financial instruments are also measured using both observable and unobservable inputs. Fair value changes presented below, therefore, reflect realized and unrealized gains and losses resulting from movements in both observable and unobservable parameters.
For the three months ended September�30, 2014, gains and losses related to Level 3 assets did not have a material impact on Nomura�s liquidity and capital resources management.
�
F-27
Table of Contents
Notes to the Interim Consolidated Financial Statements�(Continued) (UNAUDITED)
�
| � | �� | Billions of yen | � | |||||||||||||||||||||||||||||||||||||
| � | �� | Six months ended September�30, 2013 | � | |||||||||||||||||||||||||||||||||||||
| � | �� | Beginning balance as of six�months ended September 30, 2013 |
� | � | Total�gains (losses) recognized in revenue(1) |
� | � | Total gains (losses) recognized in other comprehensive income |
� | � | Purchases�
/ issues(2) |
� | � | Sales
/ redemptions(2) |
� | � | Settlements | � | �� | Foreign exchange movements |
� | � | Transfers into Level 3(3) |
� | � | Transfers out�of Level�3(3) |
� | � | Balance�as�of six�months ended September�30, 2013 |
� | ||||||||||
| Assets: |
�� | � | � | � | � | � | �� | � | � | � | ||||||||||||||||||||||||||||||
| Trading assets and private equity investments |
�� | � | � | � | � | � | �� | � | � | � | ||||||||||||||||||||||||||||||
| Equities |
�� | � | 129 | �� | � | � | 4 | �� | � | � | ��� | �� | � | � | 9 | �� | � | � | (46 | )� | � | � | ��� | � | �� | � | 3 | �� | � | � | 3 | �� | � | � | (0 | )� | � | � | 102 | �� |
| Private equity investments |
�� | � | 87 | �� | � | � | (0 | )� | � | � | ��� | � | � | � | 0 | �� | � | � | (7 | )� | � | � | ��� | � | �� | � | 4 | �� | � | � | ��� | � | � | � | ��� | � | � | � | 84 | �� |
| Japanese agency and municipal securities |
�� | � | 0 | �� | � | � | ��� | � | � | � | ��� | � | � | � | ��� | � | � | � | ��� | � | � | � | ��� | � | �� | � | ��� | � | � | � | ��� | � | � | � | (0 | )� | � | � | ��� | � |
| Foreign government, agency and municipal securities |
�� | � | 91 | �� | � | � | 10 | �� | � | � | ��� | � | � | � | 305 | �� | � | � | (322 | )� | � | � | ��� | � | �� | � | ��� | � | � | � | 8 | �� | � | � | (65 | )� | � | � | 27 | �� |
| Bank and corporate debt securities and loans for trading purposes |
�� | � | 69 | �� | � | � | 0 | �� | � | � | ��� | � | � | � | 116 | �� | � | � | (78 | )� | � | � | ��� | � | �� | � | 1 | �� | � | � | 13 | �� | � | � | (20 | )� | � | � | 101 | �� |
| Commercial mortgage-backed securities (�CMBS�) |
�� | � | 6 | �� | � | � | (0 | )� | � | � | ��� | � | � | � | 4 | �� | � | � | (5 | )� | � | � | ��� | � | �� | � | 0 | �� | � | � | 2 | �� | � | � | (0 | )� | � | � | 7 | �� |
| Residential mortgage-backed securities (�RMBS�) |
�� | � | 4 | �� | � | � | (0 | )� | � | � | ��� | � | � | � | 0 | �� | � | � | (0 | )� | � | � | ��� | � | �� | � | 0 | �� | � | � | 1 | �� | � | � | (2 | )� | � | � | 3 | �� |
| Real estate-backed securities |
�� | � | 68 | �� | � | � | 1 | �� | � | � | ��� | � | � | � | 0 | �� | � | � | (64 | )� | � | � | ��� | � | �� | � | 0 | �� | � | � | ��� | � | � | � | ��� | � | � | � | 5 | �� |
| Collateralized debt obligations (�CDO�) and other |
�� | � | 12 | �� | � | � | (1 | )� | � | � | ��� | � | � | � | 9 | �� | � | � | (9 | )� | � | � | ��� | � | �� | � | 0 | �� | � | � | 2 | �� | � | � | (0 | )� | � | � | 13 | �� |
| Investment trust funds and other |
�� | � | 13 | �� | � | � | 0 | �� | � | � | ��� | � | � | � | 11 | �� | � | � | (5 | )� | � | � | ��� | � | �� | � | 0 | �� | � | � | ��� | � | � | � | (1 | )� | � | � | 18 | �� |
| �� | � |
� |
� | � | � |
� |
� | � | � |
� |
� | � | � |
� |
� | � | � |
� |
� | � | � |
� |
� | �� | � |
� |
� | � | � |
� |
� | � | � |
� |
� | � | � |
� |
� | |
| Total trading assets and private equity investments |
�� | � | 479 | �� | � | � | 14 | �� | � | � | ��� | � | � | � | 454 | �� | � | � | (536 | )� | � | � | ��� | � | �� | � | 8 | �� | � | � | 29 | �� | � | � | (88 | )� | � | � | 360 | �� |
| �� | � |
� |
� | � | � |
� |
� | � | � |
� |
� | � | � |
� |
� | � | � |
� |
� | � | � |
� |
� | �� | � |
� |
� | � | � |
� |
� | � | � |
� |
� | � | � |
� |
� | |
| Derivatives, net(4) |
�� | � | � | � | � | � | �� | � | � | � | ||||||||||||||||||||||||||||||
| Equity contracts |
�� | � | 5 | �� | � | � | (7 | )� | � | � | ��� | � | � | � | ��� | � | � | � | ��� | � | � | � | 18 | �� | �� | � | 0 | �� | � | � | 4 | �� | � | � | (6 | )� | � | � | 14 | �� |
| Interest rate contracts |
�� | � | (54 | )� | � | � | (16 | )� | � | � | ��� | � | � | � | ��� | � | � | � | ��� | � | � | � | 18 | �� | �� | � | (1 | )� | � | � | (3 | )� | � | � | 3 | �� | � | � | (53 | )� |
| Credit contracts |
�� | � | 25 | �� | � | � | (2 | )� | � | � | ��� | � | � | � | ��� | � | � | � | ��� | � | � | � | 6 | �� | �� | � | 1 | �� | � | � | (1 | )� | � | � | (0 | )� | � | � | 29 | �� |
| Foreign exchange contracts |
�� | � | (3 | )� | � | � | (4 | )� | � | � | ��� | � | � | � | ��� | � | � | � | ��� | � | � | � | 7 | �� | �� | � | (0 | )� | � | � | (0 | )� | � | � | 0 | �� | � | � | 0 | �� |
| Commodity contracts |
�� | � | (0 | )� | � | � | (0 | )� | � | � | ��� | � | � | � | ��� | � | � | � | ��� | � | � | � | 0 | �� | �� | � | (0 | )� | � | � | 0 | �� | � | � | ��� | � | � | � | 0 | �� |
| �� | � |
� |
� | � | � |
� |
� | � | � |
� |
� | � | � |
� |
� | � | � |
� |
� | � | � |
� |
� | �� | � |
� |
� | � | � |
� |
� | � | � |
� |
� | � | � |
� |
� | |
| Total derivatives, net |
�� | � | (27 | )� | � | � | (29 | )� | � | � | ��� | � | � | � | ��� | � | � | � | ��� | � | � | � | 49 | �� | �� | � | 0 | �� | � | � | 0 | �� | � | � | (3 | )� | � | � | (10 | )� |
| �� | � |
� |
� | � | � |
� |
� | � | � |
� |
� | � | � |
� |
� | � | � |
� |
� | � | � |
� |
� | �� | � |
� |
� | � | � |
� |
� | � | � |
� |
� | � | � |
� |
� | |
| Subtotal |
�� | � | 452 | �� | � | � | (15 | )� | � | � | ��� | � | � | � | 454 | �� | � | � | (536 | )� | � | � | 49 | �� | �� | � | 8 | �� | � | � | 29 | �� | � | � | (91 | )� | � | � | 350 | �� |
| �� | � |
� |
� | � | � |
� |
� | � | � |
� |
� | � | � |
� |
� | � | � |
� |
� | � | � |
� |
� | �� | � |
� |
� | � | � |
� |
� | � | � |
� |
� | � | � |
� |
� | |
| Loans and receivables |
�� | � | 3 | �� | � | � | (0 | )� | � | � | ��� | � | � | � | 1 | �� | � | � | (2 | )� | � | � | ��� | � | �� | � | 0 | �� | � | � | 0 | �� | � | � | ��� | � | � | � | 2 | �� |
| Other assets |
�� | � | � | � | � | � | �� | � | � | � | ||||||||||||||||||||||||||||||
| Non-trading debt securities |
�� | � | 4 | �� | � | � | (0 | )� | � | � | (0 | )� | � | � | ��� | � | � | � | ��� | � | � | � | ��� | � | �� | � | 0 | �� | � | � | ��� | � | � | � | ��� | � | � | � | 4 | �� |
| Other |
�� | � | 60 | �� | � | � | 3 | �� | � | � | (0 | )� | � | � | 1 | �� | � | � | (3 | )� | � | � | ��� | � | �� | � | 0 | �� | � | � | ��� | � | � | � | (1 | )� | � | � | 60 | �� |
| �� | � |
� |
� | � | � |
� |
� | � | � |
� |
� | � | � |
� |
� | � | � |
� |
� | � | � |
� |
� | �� | � |
� |
� | � | � |
� |
� | � | � |
� |
� | � | � |
� |
� | |
| Total |
�� | � | 519 | �� | � | � | (12 | )� | � | � | (0 | )� | � | � | 456 | �� | � | � | (541 | )� | � | � | 49 | �� | �� | � | 8 | �� | � | � | 29 | �� | � | � | (92 | )� | � | � | 416 | �� |
| �� | � |
� |
� | � | � |
� |
� | � | � |
� |
� | � | � |
� |
� | � | � |
� |
� | � | � |
� |
� | �� | � |
� |
� | � | � |
� |
� | � | � |
� |
� | � | � |
� |
� | |
| Liabilities: |
�� | � | � | � | � | � | �� | � | � | � | ||||||||||||||||||||||||||||||
| Trading liabilities |
�� | � | � | � | � | � | �� | � | � | � | ||||||||||||||||||||||||||||||
| Equities |
�� | � | 0 | �� | � | � | (0 | )� | � | � | ��� | � | � | � | 0 | �� | � | � | (0 | )� | � | � | ��� | � | �� | � | 0 | �� | � | � | 0 | �� | � | � | (0 | )� | � | � | 0 | �� |
| Bank and corporate debt securities |
�� | � | 0 | �� | � | � | 0 | �� | � | � | ��� | � | � | � | (0 | )� | � | � | (0 | )� | � | � | ��� | � | �� | � | 0 | �� | � | � | 0 | �� | � | � | ��� | � | � | � | 0 | �� |
| �� | � |
� |
� | � | � |
� |
� | � | � |
� |
� | � | � |
� |
� | � | � |
� |
� | � | � |
� |
� | �� | � |
� |
� | � | � |
� |
� | � | � |
� |
� | � | � |
� |
� | |
| Total trading liabilities |
�� | � | 0 | �� | � | � | (0 | )� | � | � | ��� | � | � | � | 0 | �� | � | � | (0 | )� | � | � | ��� | � | �� | � | 0 | �� | � | � | 0 | �� | � | � | (0 | )� | � | � | 0 | �� |
| �� | � |
� |
� | � | � |
� |
� | � | � |
� |
� | � | � |
� |
� | � | � |
� |
� | � | � |
� |
� | �� | � |
� |
� | � | � |
� |
� | � | � |
� |
� | � | � |
� |
� | |
| Short-term borrowings |
�� | � | 4 | �� | � | � | (0 | )� | � | � | ��� | � | � | � | 1 | �� | � | � | (3 | )� | � | � | ��� | � | �� | � | ��� | � | � | � | ��� | � | � | � | (2 | )� | � | � | 0 | �� |
| Payables and deposits |
�� | � | 1 | �� | � | � | (0 | )� | � | � | ��� | � | � | � | (0 | )� | � | � | (0 | )� | � | � | ��� | � | �� | � | ��� | � | � | � | ��� | � | � | � | (0 | )� | � | � | 1 | �� |
| Long-term borrowings |
�� | � | 222 | �� | � | � | 43 | �� | � | � | ��� | � | � | � | 251 | �� | � | � | (179 | )� | � | � | ��� | � | �� | � | 1 | �� | � | � | 4 | �� | � | � | (43 | )� | � | � | 213 | �� |
| Other liabilities |
�� | � | 0 | �� | � | � | ��� | � | � | � | ��� | � | � | � | 0 | �� | � | � | (0 | )� | � | � | ��� | � | �� | � | 0 | �� | � | � | ��� | � | � | � | ��� | � | � | � | 0 | �� |
| �� | � |
� |
� | � | � |
� |
� | � | � |
� |
� | � | � |
� |
� | � | � |
� |
� | � | � |
� |
� | �� | � |
� |
� | � | � |
� |
� | � | � |
� |
� | � | � |
� |
� | |
| Total |
�� | � | 227 | �� | � | � | 43 | �� | � | � | ��� | � | � | � | 252 | �� | � | � | (182 | )� | � | � | ��� | � | �� | � | 1 | �� | � | � | 4 | �� | � | � | (45 | )� | � | � | 214 | �� |
| �� | � |
� |
� | � | � |
� |
� | � | � |
� |
� | � | � |
� |
� | � | � |
� |
� | � | � |
� |
� | �� | � |
� |
� | � | � |
� |
� | � | � |
� |
� | � | � |
� |
� | |
�
F-28
Table of Contents
Notes to the Interim Consolidated Financial Statements�(Continued) (UNAUDITED)
�
| � | � | Billions of yen | � | |||||||||||||||||||||||||||||||||||||
| � | � | Six months ended September�30, 2014 | � | |||||||||||||||||||||||||||||||||||||
| � | � | Beginning balance�as�of six�months ended September 30, 2014 |
� | � | Total�gains (losses) recognized in revenue(1) |
� | � | Total gains (losses) recognized in other comprehensive income |
� | � | Purchases�
/ issues(2) |
� | � | Sales
/ redemptions(2) |
� | � | Settlements | � | � | Foreign exchange movements |
� | � | Transfers into Level 3(3) |
� | � | Transfers out�of Level�3(3) |
� | � | Balance�as�of six�months ended September�30, 2014 |
� | ||||||||||
| Assets: |
� | � | � | � | � | � | � | � | � | � | ||||||||||||||||||||||||||||||
| Trading assets and private equity investments |
� | � | � | � | � | � | � | � | � | � | ||||||||||||||||||||||||||||||
| Equities |
� | � | 68 | �� | � | � | 1 | �� | � | � | ��� | � | � | � | 14 | �� | � | � | (36 | )� | � | � | ��� | � | � | � | 1 | �� | � | � | 2 | �� | � | � | (8 | )� | � | � | 42 | �� |
| Private equity investments |
� | � | 42 | �� | � | � | (1 | )� | � | � | ��� | � | � | � | 4 | �� | � | � | (1 | )� | � | � | ��� | � | � | � | 1 | �� | � | � | ��� | � | � | � | ��� | � | � | � | 45 | �� |
| Japanese agency and municipal securities |
� | � | ��� | � | � | � | (0 | )� | � | � | ��� | � | � | � | 0 | �� | � | � | (0 | )� | � | � | ��� | � | � | � | ��� | � | � | � | ��� | � | � | � | ��� | � | � | � | 0 | �� |
| Foreign government, agency and municipal securities |
� | � | 26 | �� | � | � | 7 | �� | � | � | ��� | � | � | � | 122 | �� | � | � | (122 | )� | � | � | ��� | � | � | � | ��� | � | � | � | 5 | �� | � | � | (27 | )� | � | � | 11 | �� |
| Bank and corporate debt securities and loans for trading purposes |
� | � | 116 | �� | � | � | 2 | �� | � | � | ��� | � | � | � | 78 | �� | � | � | (61 | )� | � | � | ��� | � | � | � | 5 | �� | � | � | 11 | �� | � | � | (36 | )� | � | � | 115 | �� |
| Commercial mortgage-backed securities (�CMBS�) |
� | � | 3 | �� | � | � | (0 | )� | � | � | ��� | � | � | � | 6 | �� | � | � | (8 | )� | � | � | ��� | � | � | � | ��� | � | � | � | 2 | �� | � | � | (0 | )� | � | � | 3 | �� |
| Residential mortgage-backed |
� | � | 3 | �� | � | � | (0 | )� | � | � | ��� | � | � | � | 0 | �� | � | � | (3 | )� | � | � | ��� | � | � | � | ��� | � | � | � | 2 | �� | � | � | (1 | )� | � | � | 1 | �� |
| Real estate-backed securities |
� | � | 0 | �� | � | � | (0 | )� | � | � | ��� | � | � | � | 2 | �� | � | � | (0 | )� | � | � | ��� | � | � | � | 0 | �� | � | � | ��� | � | � | � | (2 | )� | � | � | 0 | �� |
| Collateralized debt obligations (�CDO�) and other |
� | � | 13 | �� | � | � | (3 | )� | � | � | ��� | � | � | � | 34 | �� | � | � | (22 | )� | � | � | ��� | � | � | � | 2 | �� | � | � | 9 | �� | � | � | (4 | )� | � | � | 29 | �� |
| Investment trust funds and other |
� | � | 30 | �� | � | � | 1 | �� | � | � | ��� | � | � | � | 1 | �� | � | � | (11 | )� | � | � | ��� | � | � | � | (0 | )� | � | � | ��� | � | � | � | (3 | )� | � | � | 18 | �� |
| � | � |
� |
� | � | � |
� |
� | � | � |
� |
� | � | � |
� |
� | � | � |
� |
� | � | � |
� |
� | � | � |
� |
� | � | � |
� |
� | � | � |
� |
� | � | � |
� |
� | |
| Total trading assets and private equity investments |
� | � | 301 | �� | � | � | 7 | �� | � | � | ��� | � | � | � | 261 | �� | � | � | (264 | )� | � | � | ��� | � | � | � | 9 | �� | � | � | 31 | �� | � | � | (81 | )� | � | � | 264 | �� |
| � | � |
� |
� | � | � |
� |
� | � | � |
� |
� | � | � |
� |
� | � | � |
� |
� | � | � |
� |
� | � | � |
� |
� | � | � |
� |
� | � | � |
� |
� | � | � |
� |
� | |
| Derivatives, net(4) |
� | � | � | � | � | � | � | � | � | � | ||||||||||||||||||||||||||||||
| Equity contracts |
� | � | 11 | �� | � | � | (6 | )� | � | � | ��� | � | � | � | ��� | � | � | � | ��� | � | � | � | (12 | )� | � | � | 0 | �� | � | � | (2 | )� | � | � | 1 | �� | � | � | (8 | )� |
| Interest rate contracts |
� | � | (39 | )� | � | � | (20 | )� | � | � | ��� | � | � | � | ��� | � | � | � | ��� | � | � | � | 8 | �� | � | � | 0 | �� | � | � | (1 | )� | � | � | 0 | �� | � | � | (52 | )� |
| Credit contracts |
� | � | 5 | �� | � | � | (5 | )� | � | � | ��� | � | � | � | ��� | � | � | � | ��� | � | � | � | 5 | �� | � | � | 0 | �� | � | � | (0 | )� | � | � | (1 | )� | � | � | 4 | �� |
| Foreign exchange contracts |
� | � | 5 | �� | � | � | (1 | )� | � | � | ��� | � | � | � | ��� | � | � | � | ��� | � | � | � | (2 | )� | � | � | 0 | �� | � | � | (0 | )� | � | � | 0 | �� | � | � | 2 | �� |
| Commodity contracts |
� | � | 0 | �� | � | � | (0 | )� | � | � | ��� | � | � | � | ��� | � | � | � | ��� | � | � | � | (0 | )� | � | � | 0 | �� | � | � | ��� | � | � | � | ��� | � | � | � | (0 | )� |
| � | � |
� |
� | � | � |
� |
� | � | � |
� |
� | � | � |
� |
� | � | � |
� |
� | � | � |
� |
� | � | � |
� |
� | � | � |
� |
� | � | � |
� |
� | � | � |
� |
� | |
| Total derivatives, net |
� | � | (18 | )� | � | � | (32 | )� | � | � | ��� | � | � | � | ��� | � | � | � | ��� | � | � | � | (1 | )� | � | � | 0 | �� | � | � | (3 | )� | � | � | 0 | �� | � | � | (54 | )� |
| � | � |
� |
� | � | � |
� |
� | � | � |
� |
� | � | � |
� |
� | � | � |
� |
� | � | � |
� |
� | � | � |
� |
� | � | � |
� |
� | � | � |
� |
� | � | � |
� |
� | |
| Subtotal |
� | � | 283 | �� | � | � | (25 | )� | � | � | ��� | � | � | � | 261 | �� | � | � | (264 | )� | � | � | (1 | )� | � | � | 9 | �� | � | � | 28 | �� | � | � | (81 | )� | � | � | 210 | �� |
| � | � |
� |
� | � | � |
� |
� | � | � |
� |
� | � | � |
� |
� | � | � |
� |
� | � | � |
� |
� | � | � |
� |
� | � | � |
� |
� | � | � |
� |
� | � | � |
� |
� | |
| Loans and receivables |
� | � | 26 | �� | � | � | (1 | )� | � | � | ��� | � | � | � | ��� | � | � | � | (0 | )� | � | � | ��� | � | � | � | 2 | �� | � | � | ��� | � | � | � | ��� | � | � | � | 27 | �� |
| Other assets |
� | � | � | � | � | � | � | � | � | � | ||||||||||||||||||||||||||||||
| Non-trading debt securities |
� | � | 3 | �� | � | � | 0 | �� | � | � | (0 | )� | � | � | ��� | � | � | � | (3 | )� | � | � | ��� | � | � | � | 0 | �� | � | � | ��� | � | � | � | ��� | � | � | � | 0 | �� |
| Other |
� | � | 56 | �� | � | � | (0 | )� | � | � | (1 | )� | � | � | 2 | �� | � | � | (1 | )� | � | � | ��� | � | � | � | 0 | �� | � | � | ��� | � | � | � | ��� | � | � | � | 56 | �� |
| � | � |
� |
� | � | � |
� |
� | � | � |
� |
� | � | � |
� |
� | � | � |
� |
� | � | � |
� |
� | � | � |
� |
� | � | � |
� |
� | � | � |
� |
� | � | � |
� |
� | |
| Total |
� | � | 368 | �� | � | � | (26 | )� | � | � | (1 | )� | � | � | 263 | �� | � | � | (268 | )� | � | � | (1 | )� | � | � | 11 | �� | � | � | 28 | �� | � | � | (81 | )� | � | � | 293 | �� |
| � | � |
� |
� | � | � |
� |
� | � | � |
� |
� | � | � |
� |
� | � | � |
� |
� | � | � |
� |
� | � | � |
� |
� | � | � |
� |
� | � | � |
� |
� | � | � |
� |
� | |
| Liabilities: |
� | � | � | � | � | � | � | � | � | � | ||||||||||||||||||||||||||||||
| Trading liabilities |
� | � | � | � | � | � | � | � | � | � | ||||||||||||||||||||||||||||||
| Equities |
� | � | 1 | �� | � | � | 0 | �� | � | � | ��� | � | � | � | 1 | �� | � | � | (0 | )� | � | � | ��� | � | � | � | (0 | )� | � | � | 0 | �� | � | � | (1 | )� | � | � | 1 | �� |
| Bank and corporate debt securities |
� | � | 0 | �� | � | � | (0 | )� | � | � | ��� | � | � | � | 0 | �� | � | � | ��� | � | � | � | ��� | � | � | � | 0 | �� | � | � | ��� | � | � | � | ��� | � | � | � | 0 | �� |
| Collateralized debt obligations (�CDO�) and other |
� | � | ��� | � | � | � | (0 | )� | � | � | ��� | � | � | � | 1 | �� | � | � | (0 | )� | � | � | ��� | � | � | � | 0 | �� | � | � | ��� | � | � | � | ��� | � | � | � | 1 | �� |
| � | � |
� |
� | � | � |
� |
� | � | � |
� |
� | � | � |
� |
� | � | � |
� |
� | � | � |
� |
� | � | � |
� |
� | � | � |
� |
� | � | � |
� |
� | � | � |
� |
� | |
| Total trading liabilities |
� | � | 1 | �� | � | � | 0 | �� | � | � | ��� | � | � | � | 2 | �� | � | � | (0 | )� | � | � | ��� | � | � | � | (0 | )� | � | � | 0 | �� | � | � | (1 | )� | � | � | 2 | �� |
| � | � |
� |
� | � | � |
� |
� | � | � |
� |
� | � | � |
� |
� | � | � |
� |
� | � | � |
� |
� | � | � |
� |
� | � | � |
� |
� | � | � |
� |
� | � | � |
� |
� | |
| Short-term borrowings |
� | � | 3 | �� | � | � | (1 | )� | � | � | ��� | � | � | � | 1 | �� | � | � | (1 | )� | � | � | ��� | � | � | � | ��� | � | � | � | 0 | �� | � | � | (2 | )� | � | � | 2 | �� |
| Payables and deposits |
� | � | 0 | �� | � | � | (0 | )� | � | � | ��� | � | � | � | (0 | )� | � | � | (0 | )� | � | � | ��� | � | � | � | ��� | � | � | � | ��� | � | � | � | (0 | )� | � | � | 0 | �� |
| Long-term borrowings |
� | � | 394 | �� | � | � | (53 | )� | � | � | ��� | � | � | � | 205 | �� | � | � | (237 | )� | � | � | ��� | � | � | � | 4 | �� | � | � | 32 | �� | � | � | (12 | )� | � | � | 439 | �� |
| � | � |
� |
� | � | � |
� |
� | � | � |
� |
� | � | � |
� |
� | � | � |
� |
� | � | � |
� |
� | � | � |
� |
� | � | � |
� |
� | � | � |
� |
� | � | � |
� |
� | |
| Total |
� | � | 398 | �� | � | � | (54 | )� | � | � | ��� | � | � | � | 208 | �� | � | � | (238 | )� | � | � | ��� | � | � | � | 4 | �� | � | � | 32 | �� | � | � | (15 | )� | � | � | 443 | �� |
| � | � |
� |
� | � | � |
� |
� | � | � |
� |
� | � | � |
� |
� | � | � |
� |
� | � | � |
� |
� | � | � |
� |
� | � | � |
� |
� | � | � |
� |
� | � | � |
� |
� | |
�
F-29
Table of Contents
Notes to the Interim Consolidated Financial Statements�(Continued) (UNAUDITED)
�
| � | �� | Billions of yen | � | |||||||||||||||||||||||||||||||||||||
| � | �� | Three months ended September�30, 2013 | � | |||||||||||||||||||||||||||||||||||||
| � | �� | Beginning balance�as�of three�months ended September 30, 2013 |
� | � | Total�gains (losses) recognized in revenue(1) |
� | � | Total gains (losses) recognized in other comprehensive income |
� | � | Purchases�
/ issues(2) |
� | � | Sales
/ redemptions(2) |
� | � | Settlements | � | � | Foreign exchange movements |
� | � | Transfers into Level 3(3) |
� | � | Transfers out�of Level�3(3) |
� | � | Balance�as�of three�months ended September�30, 2013 |
� | ||||||||||
| Assets: |
�� | � | � | � | � | � | � | � | � | � | ||||||||||||||||||||||||||||||
| Trading assets and private equity investments |
�� | � | � | � | � | � | � | � | � | � | ||||||||||||||||||||||||||||||
| Equities |
�� | � | 128 | �� | � | � | 3 | �� | � | � | ��� | �� | � | � | 8 | �� | � | � | (39 | )� | � | � | ��� | �� | � | � | 0 | �� | � | � | 2 | �� | � | � | (0 | )� | � | � | 102 | �� |
| Private equity investments |
�� | � | 88 | �� | � | � | (0 | )� | � | � | ��� | �� | � | � | 0 | �� | � | � | (6 | )� | � | � | ��� | �� | � | � | 2 | �� | � | � | ��� | �� | � | � | ��� | �� | � | � | 84 | �� |
| Japanese agency and municipal securities |
�� | � | 0 | �� | � | � | ��� | �� | � | � | ��� | �� | � | � | ��� | �� | � | � | ��� | �� | � | � | ��� | �� | � | � | ��� | �� | � | � | ��� | �� | � | � | (0 | )� | � | � | ��� | �� |
| Foreign government, agency and municipal securities |
�� | � | 38 | �� | � | � | 8 | �� | � | � | ��� | �� | � | � | 188 | �� | � | � | (199 | )� | � | � | ��� | �� | � | � | ��� | �� | � | � | 8 | �� | � | � | (16 | )� | � | � | 27 | �� |
| Bank and corporate debt securities and loans for trading purposes |
�� | � | 78 | �� | � | � | 1 | �� | � | � | ��� | �� | � | � | 79 | �� | � | � | (54 | )� | � | � | ��� | �� | � | � | (0 | )� | � | � | 12 | �� | � | � | (15 | )� | � | � | 101 | �� |
| Commercial mortgage-backed securities (�CMBS�) |
�� | � | 7 | �� | � | � | (0 | )� | � | � | ��� | �� | � | � | 1 | �� | � | � | (2 | )� | � | � | ��� | �� | � | � | (0 | )� | � | � | 1 | �� | � | � | (0 | )� | � | � | 7 | �� |
| Residential mortgage-backed securities (�RMBS�) |
�� | � | 3 | �� | � | � | (0 | )� | � | � | ��� | �� | � | � | 0 | �� | � | � | (0 | )� | � | � | ��� | �� | � | � | (0 | )� | � | � | 0 | �� | � | � | (0 | )� | � | � | 3 | �� |
| Real estate-backed securities |
�� | � | 66 | �� | � | � | 1 | �� | � | � | ��� | �� | � | � | 0 | �� | � | � | (62 | )� | � | � | ��� | �� | � | � | (0 | )� | � | � | ��� | �� | � | � | ��� | �� | � | � | 5 | �� |
| Collateralized debt obligations (�CDO�) and other |
�� | � | 16 | �� | � | � | (1 | )� | � | � | ��� | �� | � | � | 1 | �� | � | � | (4 | )� | � | � | ��� | �� | � | � | (0 | )� | � | � | 1 | �� | � | � | (0 | )� | � | � | 13 | �� |
| Investment trust funds and other |
�� | � | 14 | �� | � | � | 0 | �� | � | � | ��� | �� | � | � | 5 | �� | � | � | (1 | )� | � | � | ��� | �� | � | � | 0 | �� | � | � | ��� | �� | � | � | ��� | �� | � | � | 18 | �� |
| �� | � |
� |
� | � | � |
� |
� | � | � |
� |
� | � | � |
� |
� | � | � |
� |
� | � | � |
� |
� | � | � |
� |
� | � | � |
� |
� | � | � |
� |
� | � | � |
� |
� | |
| Total trading assets and private equity investments |
�� | � | 438 | �� | � | � | 12 | �� | � | � | ��� | �� | � | � | 282 | �� | � | � | (367 | )� | � | � | ��� | �� | � | � | 2 | �� | � | � | 24 | �� | � | � | (31 | )� | � | � | 360 | �� |
| �� | � |
� |
� | � | � |
� |
� | � | � |
� |
� | � | � |
� |
� | � | � |
� |
� | � | � |
� |
� | � | � |
� |
� | � | � |
� |
� | � | � |
� |
� | � | � |
� |
� | |
| Derivatives, net(4) |
�� | � | � | � | � | � | � | � | � | � | ||||||||||||||||||||||||||||||
| Equity contracts |
�� | � | 12 | �� | � | � | (18 | )� | � | � | ��� | �� | � | � | ��� | �� | � | � | ��� | �� | � | � | 14 | �� | � | � | 0 | �� | � | � | 7 | �� | � | � | (1 | )� | � | � | 14 | �� |
| Interest rate contracts |
�� | � | (52 | )� | � | � | (7 | )� | � | � | ��� | �� | � | � | ��� | �� | � | � | ��� | �� | � | � | 6 | �� | � | � | 0 | �� | � | � | (1 | )� | � | � | 1 | �� | � | � | (53 | )� |
| Credit contracts |
�� | � | 35 | �� | � | � | (4 | )� | � | � | ��� | �� | � | � | ��� | �� | � | � | ��� | �� | � | � | (0 | )� | � | � | (0 | )� | � | � | (2 | )� | � | � | (0 | )� | � | � | 29 | �� |
| Foreign exchange contracts |
�� | � | 2 | �� | � | � | (4 | )� | � | � | ��� | �� | � | � | ��� | �� | � | � | ��� | �� | � | � | 3 | �� | � | � | 0 | �� | � | � | (1 | )� | � | � | (0 | )� | � | � | 0 | �� |
| Commodity contracts |
�� | � | 0 | �� | � | � | 0 | �� | � | � | ��� | �� | � | � | ��� | �� | � | � | ��� | �� | � | � | (0 | )� | � | � | (0 | )� | � | � | ��� | �� | � | � | ��� | �� | � | � | 0 | �� |
| �� | � |
� |
� | � | � |
� |
� | � | � |
� |
� | � | � |
� |
� | � | � |
� |
� | � | � |
� |
� | � | � |
� |
� | � | � |
� |
� | � | � |
� |
� | � | � |
� |
� | |
| Total derivatives, net |
�� | � | (3 | )� | � | � | (33 | )� | � | � | ��� | �� | � | � | ��� | �� | � | � | ��� | �� | � | � | 23 | �� | � | � | 0 | �� | � | � | 3 | �� | � | � | (0 | )� | � | � | (10 | )� |
| �� | � |
� |
� | � | � |
� |
� | � | � |
� |
� | � | � |
� |
� | � | � |
� |
� | � | � |
� |
� | � | � |
� |
� | � | � |
� |
� | � | � |
� |
� | � | � |
� |
� | |
| Subtotal |
�� | � | 435 | �� | � | � | (21 | )� | � | � | ��� | �� | � | � | 282 | �� | � | � | (367 | )� | � | � | 23 | �� | � | � | 2 | �� | � | � | 27 | �� | � | � | (31 | )� | � | � | 350 | �� |
| �� | � |
� |
� | � | � |
� |
� | � | � |
� |
� | � | � |
� |
� | � | � |
� |
� | � | � |
� |
� | � | � |
� |
� | � | � |
� |
� | � | � |
� |
� | � | � |
� |
� | |
| Loans and receivables |
�� | � | 3 | �� | � | � | (0 | )� | � | � | ��� | �� | � | � | ��� | �� | � | � | (1 | )� | � | � | ��� | �� | � | � | 0 | �� | � | � | ��� | �� | � | � | ��� | �� | � | � | 2 | �� |
| Other assets |
�� | � | � | � | � | � | � | � | � | � | ||||||||||||||||||||||||||||||
| Non-trading debt securities |
�� | � | 4 | �� | � | � | (0 | )� | � | � | (0 | )� | � | � | ��� | �� | � | � | ��� | �� | � | � | ��� | �� | � | � | 0 | �� | � | � | ��� | �� | � | � | ��� | �� | � | � | 4 | �� |
| Other |
�� | � | 59 | �� | � | � | 3 | �� | � | � | 0 | �� | � | � | 0 | �� | � | � | (2 | )� | � | � | ��� | �� | � | � | (0 | )� | � | � | ��� | �� | � | � | ��� | �� | � | � | 60 | �� |
| �� | � |
� |
� | � | � |
� |
� | � | � |
� |
� | � | � |
� |
� | � | � |
� |
� | � | � |
� |
� | � | � |
� |
� | � | � |
� |
� | � | � |
� |
� | � | � |
� |
� | |
| Total |
�� | � | 501 | �� | � | � | (18 | )� | � | � | 0 | �� | � | � | 282 | �� | � | � | (370 | )� | � | � | 23 | �� | � | � | 2 | �� | � | � | 27 | �� | � | � | (31 | )� | � | � | 416 | �� |
| �� | � |
� |
� | � | � |
� |
� | � | � |
� |
� | � | � |
� |
� | � | � |
� |
� | � | � |
� |
� | � | � |
� |
� | � | � |
� |
� | � | � |
� |
� | � | � |
� |
� | |
| Liabilities: |
�� | � | � | � | � | � | � | � | � | � | ||||||||||||||||||||||||||||||
| Trading liabilities |
�� | � | � | � | � | � | � | � | � | � | ||||||||||||||||||||||||||||||
| Equities |
�� | � | 0 | �� | � | � | (0 | )� | � | � | ��� | �� | � | � | 0 | �� | � | � | (0 | )� | � | � | ��� | �� | � | � | (0 | )� | � | � | ��� | �� | � | � | (0 | )� | � | � | 0 | �� |
| Bank and corporate debt securities |
�� | � | 0 | �� | � | � | (0 | )� | � | � | ��� | �� | � | � | (0 | )� | � | � | (0 | )� | � | � | ��� | �� | � | � | (0 | )� | � | � | (0 | )� | � | � | ��� | �� | � | � | 0 | �� |
| �� | � |
� |
� | � | � |
� |
� | � | � |
� |
� | � | � |
� |
� | � | � |
� |
� | � | � |
� |
� | � | � |
� |
� | � | � |
� |
� | � | � |
� |
� | � | � |
� |
� | |
| Total trading liabilities |
�� | � | 0 | �� | � | � | (0 | )� | � | � | ��� | �� | � | � | 0 | �� | � | � | (0 | )� | � | � | ��� | �� | � | � | (0 | )� | � | � | (0 | )� | � | � | (0 | )� | � | � | 0 | �� |
| �� | � |
� |
� | � | � |
� |
� | � | � |
� |
� | � | � |
� |
� | � | � |
� |
� | � | � |
� |
� | � | � |
� |
� | � | � |
� |
� | � | � |
� |
� | � | � |
� |
� | |
| Short-term borrowings |
�� | � | 1 | �� | � | � | 0 | �� | � | � | ��� | �� | � | � | 0 | �� | � | � | (0 | )� | � | � | ��� | �� | � | � | ��� | �� | � | � | ��� | �� | � | � | (1 | )� | � | � | 0 | �� |
| Payables and deposits |
�� | � | 1 | �� | � | � | (0 | )� | � | � | ��� | �� | � | � | (0 | )� | � | � | ��� | �� | � | � | ��� | �� | � | � | ��� | �� | � | � | ��� | �� | � | � | (0 | )� | � | � | 1 | �� |
| Long-term borrowings |
�� | � | 204 | �� | � | � | 13 | �� | � | � | ��� | �� | � | � | 146 | �� | � | � | (112 | )� | � | � | ��� | �� | � | � | (0 | )� | � | � | 2 | �� | � | � | (14 | )� | � | � | 213 | �� |
| Other liabilities |
�� | � | ��� | �� | � | � | ��� | �� | � | � | ��� | �� | � | � | 0 | �� | � | � | ��� | �� | � | � | ��� | �� | � | � | ��� | �� | � | � | ��� | �� | � | � | ��� | �� | � | � | 0 | �� |
| �� | � |
� |
� | � | � |
� |
� | � | � |
� |
� | � | � |
� |
� | � | � |
� |
� | � | � |
� |
� | � | � |
� |
� | � | � |
� |
� | � | � |
� |
� | � | � |
� |
� | |
| Total |
�� | � | 206 | �� | � | � | 13 | �� | � | � | ��� | �� | � | � | 146 | �� | � | � | (112 | )� | � | � | ��� | �� | � | � | (0 | )� | � | � | 2 | �� | � | � | (15 | )� | � | � | 214 | �� |
| �� | � |
� |
� | � | � |
� |
� | � | � |
� |
� | � | � |
� |
� | � | � |
� |
� | � | � |
� |
� | � | � |
� |
� | � | � |
� |
� | � | � |
� |
� | � | � |
� |
� | |
�
F-30
Table of Contents
Notes to the Interim Consolidated Financial Statements�(Continued) (UNAUDITED)
�
| � | � | Billions of yen | � | |||||||||||||||||||||||||||||||||||||
| � | � | Three months ended September�30, 2014 | � | |||||||||||||||||||||||||||||||||||||
| � | � | Beginning balance�as�of three�months ended September 30, 2014 |
� | � | Total�gains (losses) recognized in revenue(1) |
� | � | Total gains (losses) recognized in other comprehensive income |
� | � | Purchases�
/ issues(2) |
� | � | Sales
/ redemptions(2) |
� | � | Settlements | � | � | Foreign exchange movements |
� | � | Transfers into Level 3(3) |
� | � | Transfers out�of Level�3(3) |
� | � | Balance�as�of three�months ended September�30, 2014 |
� | ||||||||||
| Assets: |
� | � | � | � | � | � | � | � | � | � | ||||||||||||||||||||||||||||||
| Trading assets and private equity investments |
� | � | � | � | � | � | � | � | � | � | ||||||||||||||||||||||||||||||
| Equities |
� | � | 40 | �� | � | � | 0 | �� | � | � | ��� | � | � | � | 9 | �� | � | � | (7 | )� | � | � | ��� | � | � | � | 2 | �� | � | � | 1 | �� | � | � | (3 | )� | � | � | 42 | �� |
| Private equity investments |
� | � | 44 | �� | � | � | (0 | )� | � | � | ��� | � | � | � | 1 | �� | � | � | (1 | )� | � | � | ��� | � | � | � | 1 | �� | � | � | ��� | � | � | � | ��� | � | � | � | 45 | �� |
| Japanese agency and municipal securities |
� | � | ��� | � | � | � | (0 | )� | � | � | ��� | � | � | � | 0 | �� | � | � | (0 | )� | � | � | ��� | � | � | � | ��� | � | � | � | ��� | � | � | � | ��� | � | � | � | 0 | �� |
| Foreign government, agency and municipal securities |
� | � | 32 | �� | � | � | 1 | �� | � | � | ��� | � | � | � | 26 | �� | � | � | (26 | )� | � | � | ��� | � | � | � | ��� | � | � | � | 0 | �� | � | � | (22 | )� | � | � | 11 | �� |
| Bank and corporate debt securities and loans for trading purposes |
� | � | 118 | �� | � | � | (1 | )� | � | � | ��� | � | � | � | 31 | �� | � | � | (18 | )� | � | � | ��� | � | � | � | 6 | �� | � | � | 3 | �� | � | � | (24 | )� | � | � | 115 | �� |
| Commercial mortgage-backed securities (�CMBS�) |
� | � | 5 | �� | � | � | (0 | )� | � | � | ��� | � | � | � | 3 | �� | � | � | (5 | )� | � | � | ��� | � | � | � | ��� | � | � | � | ��� | � | � | � | ��� | � | � | � | 3 | �� |
| Residential mortgage-backed securities (�RMBS�) |
� | � | 3 | �� | � | � | (0 | )� | � | � | ��� | � | � | � | 0 | �� | � | � | (2 | )� | � | � | ��� | � | � | � | ��� | � | � | � | ��� | � | � | � | ��� | � | � | � | 1 | �� |
| Real estate-backed securities |
� | � | 2 | �� | � | � | (0 | )� | � | � | ��� | � | � | � | ��� | � | � | � | (0 | )� | � | � | ��� | � | � | � | 0 | �� | � | � | ��� | � | � | � | (2 | )� | � | � | 0 | �� |
| Collateralized debt obligations (�CDO�) and other |
� | � | 23 | �� | � | � | (2 | )� | � | � | ��� | � | � | � | 13 | �� | � | � | (12 | )� | � | � | ��� | � | � | � | 2 | �� | � | � | 8 | �� | � | � | (3 | )� | � | � | 29 | �� |
| Investment trust funds and other |
� | � | 28 | �� | � | � | 1 | �� | � | � | ��� | � | � | � | 0 | �� | � | � | (11 | )� | � | � | ��� | � | � | � | 0 | �� | � | � | ��� | � | � | � | (0 | )� | � | � | 18 | �� |
| � | � |
� |
� | � | � |
� |
� | � | � |
� |
� | � | � |
� |
� | � | � |
� |
� | � | � |
� |
� | � | � |
� |
� | � | � |
� |
� | � | � |
� |
� | � | � |
� |
� | |
| Total trading assets and private equity investments |
� | � | 295 | �� | � | � | (1 | )� | � | � | ��� | � | � | � | 83 | �� | � | � | (82 | )� | � | � | ��� | � | � | � | 11 | �� | � | � | 12 | �� | � | � | (54 | )� | � | � | 264 | �� |
| � | � |
� |
� | � | � |
� |
� | � | � |
� |
� | � | � |
� |
� | � | � |
� |
� | � | � |
� |
� | � | � |
� |
� | � | � |
� |
� | � | � |
� |
� | � | � |
� |
� | |
| Derivatives, net(4) |
� | � | � | � | � | � | � | � | � | � | ||||||||||||||||||||||||||||||
| Equity contracts |
� | � | 4 | �� | � | � | (2 | )� | � | � | ��� | � | � | � | ��� | � | � | � | ��� | � | � | � | (9 | )� | � | � | 0 | �� | � | � | (1 | )� | � | � | (0 | )� | � | � | (8 | )� |
| Interest rate contracts |
� | � | (40 | )� | � | � | (7 | )� | � | � | ��� | � | � | � | ��� | � | � | � | ��� | � | � | � | (5 | )� | � | � | 0 | �� | � | � | (1 | )� | � | � | 1 | �� | � | � | (52 | )� |
| Credit contracts |
� | � | 5 | �� | � | � | (4 | )� | � | � | ��� | � | � | � | ��� | � | � | � | ��� | � | � | � | 3 | �� | � | � | 0 | �� | � | � | 1 | �� | � | � | (1 | )� | � | � | 4 | �� |
| Foreign exchange contracts |
� | � | 7 | �� | � | � | (3 | )� | � | � | ��� | � | � | � | ��� | � | � | � | ��� | � | � | � | (2 | )� | � | � | 0 | �� | � | � | ��� | � | � | � | (0 | )� | � | � | 2 | �� |
| Commodity contracts |
� | � | 0 | �� | � | � | (0 | )� | � | � | ��� | � | � | � | ��� | � | � | � | ��� | � | � | � | (0 | )� | � | � | 0 | �� | � | � | ��� | � | � | � | ��� | � | � | � | (0 | )� |
| � | � |
� |
� | � | � |
� |
� | � | � |
� |
� | � | � |
� |
� | � | � |
� |
� | � | � |
� |
� | � | � |
� |
� | � | � |
� |
� | � | � |
� |
� | � | � |
� |
� | |
| Total derivatives, net |
� | � | (24 | )� | � | � | (16 | )� | � | � | ��� | � | � | � | ��� | � | � | � | ��� | � | � | � | (13 | )� | � | � | 0 | �� | � | � | (1 | )� | � | � | (0 | )� | � | � | (54 | )� |
| � | � |
� |
� | � | � |
� |
� | � | � |
� |
� | � | � |
� |
� | � | � |
� |
� | � | � |
� |
� | � | � |
� |
� | � | � |
� |
� | � | � |
� |
� | � | � |
� |
� | |
| Subtotal |
� | � | 271 | �� | � | � | (17 | )� | � | � | ��� | � | � | � | 83 | �� | � | � | (82 | )� | � | � | (13 | )� | � | � | 11 | �� | � | � | 11 | �� | � | � | (54 | )� | � | � | 210 | �� |
| � | � |
� |
� | � | � |
� |
� | � | � |
� |
� | � | � |
� |
� | � | � |
� |
� | � | � |
� |
� | � | � |
� |
� | � | � |
� |
� | � | � |
� |
� | � | � |
� |
� | |
| Loans and receivables |
� | � | 26 | �� | � | � | (1 | )� | � | � | ��� | � | � | � | ��� | � | � | � | (0 | )� | � | � | ��� | � | � | � | 2 | �� | � | � | ��� | � | � | � | ��� | � | � | � | 27 | �� |
| Other assets |
� | � | � | � | � | � | � | � | � | � | ||||||||||||||||||||||||||||||
| Non-trading debt securities |
� | � | 0 | �� | � | � | 0 | �� | � | � | ��� | � | � | � | ��� | � | � | � | (0 | )� | � | � | ��� | � | � | � | 0 | �� | � | � | ��� | � | � | � | ��� | � | � | � | 0 | �� |
| Other |
� | � | 58 | �� | � | � | (0 | )� | � | � | (1 | )� | � | � | 0 | �� | � | � | (1 | )� | � | � | ��� | � | � | � | 0 | �� | � | � | ��� | � | � | � | ��� | � | � | � | 56 | �� |
| � | � |
� |
� | � | � |
� |
� | � | � |
� |
� | � | � |
� |
� | � | � |
� |
� | � | � |
� |
� | � | � |
� |
� | � | � |
� |
� | � | � |
� |
� | � | � |
� |
� | |
| Total |
� | � | 355 | �� | � | � | (18 | )� | � | � | (1 | )� | � | � | 83 | �� | � | � | (83 | )� | � | � | (13 | )� | � | � | 13 | �� | � | � | 11 | �� | � | � | (54 | )� | � | � | 293 | �� |
| � | � |
� |
� | � | � |
� |
� | � | � |
� |
� | � | � |
� |
� | � | � |
� |
� | � | � |
� |
� | � | � |
� |
� | � | � |
� |
� | � | � |
� |
� | � | � |
� |
� | |
| Liabilities: |
� | � | � | � | � | � | � | � | � | � | ||||||||||||||||||||||||||||||
| Trading liabilities |
� | � | � | � | � | � | � | � | � | � | ||||||||||||||||||||||||||||||
| Equities |
� | � | 0 | �� | � | � | 0 | �� | � | � | ��� | � | � | � | 1 | �� | � | � | 0 | �� | � | � | ��� | � | � | � | (0 | )� | � | � | (0 | )� | � | � | (0 | )� | � | � | 1 | �� |
| Bank and corporate debt securities |
� | � | 0 | �� | � | � | (0 | )� | � | � | ��� | � | � | � | 0 | �� | � | � | ��� | � | � | � | ��� | � | � | � | 0 | �� | � | � | ��� | � | � | � | ��� | � | � | � | 0 | �� |
| Collateralized debt obligations (�CDO�) and other |
� | � | ��� | � | � | � | (0 | )� | � | � | ��� | � | � | � | 1 | �� | � | � | (0 | )� | � | � | ��� | � | � | � | 0 | �� | � | � | ��� | � | � | � | ��� | � | � | � | 1 | �� |
| � | � |
� |
� | � | � |
� |
� | � | � |
� |
� | � | � |
� |
� | � | � |
� |
� | � | � |
� |
� | � | � |
� |
� | � | � |
� |
� | � | � |
� |
� | � | � |
� |
� | |
| Total trading liabilities |
� | � | 0 | �� | � | � | (0 | )� | � | � | ��� | � | � | � | 2 | �� | � | � | (0 | )� | � | � | ��� | � | � | � | 0 | �� | � | � | (0 | )� | � | � | (0 | )� | � | � | 2 | �� |
| � | � |
� |
� | � | � |
� |
� | � | � |
� |
� | � | � |
� |
� | � | � |
� |
� | � | � |
� |
� | � | � |
� |
� | � | � |
� |
� | � | � |
� |
� | � | � |
� |
� | |
| Short-term borrowings |
� | � | 2 | �� | � | � | (0 | )� | � | � | ��� | � | � | � | 0 | �� | � | � | (0 | )� | � | � | ��� | � | � | � | ��� | � | � | � | 0 | �� | � | � | (0 | )� | � | � | 2 | �� |
| Payables and deposits |
� | � | 0 | �� | � | � | (0 | )� | � | � | ��� | � | � | � | (0 | )� | � | � | (0 | )� | � | � | ��� | � | � | � | ��� | � | � | � | ��� | � | � | � | (0 | )� | � | � | 0 | �� |
| Long-term borrowings |
� | � | 465 | �� | � | � | (47 | )� | � | � | ��� | � | � | � | 109 | �� | � | � | (190 | )� | � | � | ��� | � | � | � | 4 | �� | � | � | 10 | �� | � | � | (6 | )� | � | � | 439 | �� |
| � | � |
� |
� | � | � |
� |
� | � | � |
� |
� | � | � |
� |
� | � | � |
� |
� | � | � |
� |
� | � | � |
� |
� | � | � |
� |
� | � | � |
� |
� | � | � |
� |
� | |
| Total |
� | � | 467 | �� | � | � | (47 | )� | � | � | ��� | � | � | � | 111 | �� | � | � | (190 | )� | � | � | ��� | � | � | � | 4 | �� | � | � | 10 | �� | � | � | (6 | )� | � | � | 443 | �� |
| � | � |
� |
� | � | � |
� |
� | � | � |
� |
� | � | � |
� |
� | � | � |
� |
� | � | � |
� |
� | � | � |
� |
� | � | � |
� |
� | � | � |
� |
� | � | � |
� |
� | |
�
F-31
Table of Contents
Notes to the Interim Consolidated Financial Statements�(Continued) (UNAUDITED)
�
�
| (1) | Includes gains and losses reported primarily within Net gain on trading, Gain (loss) on private equity investments, and also within Gain (loss) on investments in equity securities, Revenue�Other and Non-interest expenses�Other, Interest and dividends and Interest expense in the consolidated statements of income. |
| (2) | Amounts reported in Purchases / issues include increases in trading liabilities while Sales / redemptions include decreases in trading liabilities. |
| (3) | If financial instruments move from Level 3 to another Level or move from another Level to Level 3, the amount reported in Transfers into Level 3 and Transfers out of Level 3 are the fair value as of the beginning of the quarter during which the movement occurs. Therefore if financial instruments move from another Level to Level 3, all gains/ (losses) during the quarter are included in the table and if financial instruments move from Level 3 to another Level, all gains/ (losses) during the quarter are excluded from the table. |
| (4) | Each derivative classification includes derivatives referencing multiple risk components. For example, interest rate contracts include complex derivatives referencing interest rate risk as well as foreign exchange risk or other factors such as prepayments rates. Credit contracts include credit default swaps as well as derivatives referencing corporate and government debt securities. |
�
F-32
Table of Contents
Notes to the Interim Consolidated Financial Statements�(Continued) (UNAUDITED)
�
Unrealized gains and losses recognized for Level 3 financial instruments
The following tables present the amounts of unrealized gains (losses) for the six and three months ended September�30, 2013 and 2014, relating to those financial instruments which Nomura classified in Level 3 within the fair value hierarchy and that were still held by Nomura at the relevant consolidated balance sheet date.
�
| � | �� | Billions�of�yen | � | |||||
| � | �� | Six�months�ended�September�30 | � | |||||
| � | �� | ��������2013�������� | � | � | ��������2014�������� | � | ||
| � | �� | Unrealized�gains�/ (losses)(1) | � | |||||
| Assets: |
�� | � | ||||||
| Trading assets and private equity investments |
�� | � | ||||||
| Equities |
�� | � | 3 | �� | � | � | (3 | )� |
| Private equity investments |
�� | � | (2 | )� | � | � | (1 | )� |
| Japanese agency and municipal securities |
�� | � | ��� | � | � | � | (0 | )� |
| Foreign government, agency and municipal securities |
�� | � | (2 | )� | � | � | 1 | �� |
| Bank and corporate debt securities and loans for trading purposes |
�� | � | (0 | )� | � | � | 0 | �� |
| Commercial mortgage-backed securities (�CMBS�) |
�� | � | (0 | )� | � | � | 0 | �� |
| Residential mortgage-backed securities (�RMBS�) |
�� | � | 0 | �� | � | � | 0 | �� |
| Real estate-backed securities |
�� | � | 0 | �� | � | � | 0 | �� |
| Collateralized debt obligations (�CDO�) and other |
�� | � | (0 | )� | � | � | (3 | )� |
| Investment trust funds and other |
�� | � | 0 | �� | � | � | 2 | �� |
| �� | � |
� |
� | � | � |
� |
� | |
| Total trading assets and private equity investments |
�� | � | (1 | )� | � | � | (4 | )� |
| �� | � |
� |
� | � | � |
� |
� | |
| Derivatives, net(2) |
�� | � | ||||||
| Equity contracts |
�� | � | 0 | �� | � | � | 14 | �� |
| Interest rate contracts |
�� | � | (15 | )� | � | � | (15 | )� |
| Credit contracts |
�� | � | (1 | )� | � | � | (5 | )� |
| Foreign exchange contracts |
�� | � | (5 | )� | � | � | (3 | )� |
| Commodity contracts |
�� | � | (0 | )� | � | � | (0 | )� |
| �� | � |
� |
� | � | � |
� |
� | |
| Total derivatives, net |
�� | � | (21 | )� | � | � | (9 | )� |
| �� | � |
� |
� | � | � |
� |
� | |
| Subtotal |
�� | � | (22 | )� | � | � | (13 | )� |
| �� | � |
� |
� | � | � |
� |
� | |
| Loans and receivables |
�� | � | (0 | )� | � | � | (0 | )� |
| Other assets |
�� | � | ||||||
| Non-trading debt securities |
�� | � | (0 | )� | � | � | 0 | �� |
| Other |
�� | � | 2 | �� | � | � | (0 | )� |
| �� | � |
� |
� | � | � |
� |
� | |
| Total |
�� | � | (20 | )� | � | � | (13 | )� |
| �� | � |
� |
� | � | � |
� |
� | |
| Liabilities: |
�� | � | ||||||
| Trading liabilities |
�� | � | ||||||
| Equities |
�� | � | (0 | )� | � | � | 0 | �� |
| Bank and corporate debt securities |
�� | � | (0 | )� | � | � | (0 | )� |
| �� | � |
� |
� | � | � |
� |
� | |
| Total trading liabilities |
�� | � | (0 | )� | � | � | 0 | �� |
| �� | � |
� |
� | � | � |
� |
� | |
| Short-term borrowings |
�� | � | 0 | �� | � | � | 0 | �� |
| Payables and deposits |
�� | � | (0 | )� | � | � | (0 | )� |
| Long-term borrowings |
�� | � | 34 | �� | � | � | (39 | )� |
| �� | � |
� |
� | � | � |
� |
� | |
| Total |
�� | � | 34 | �� | � | � | (39 | )� |
| �� | � |
� |
� | � | � |
� |
� | |
�
F-33
Table of Contents
Notes to the Interim Consolidated Financial Statements�(Continued) (UNAUDITED)
�
| � | �� | Billions�of�yen | � | |||||
| � | �� | Three�months�ended�September�30 | � | |||||
| � | �� | ����2013���� | � | � | ����2014���� | � | ||
| � | �� | Unrealized�gains�/� (losses)(1) | � | |||||
| Assets: |
�� | � | ||||||
| Trading assets and private equity investments |
�� | � | ||||||
| Equities |
�� | � | 3 | �� | � | � | 0 | �� |
| Private equity investments |
�� | � | (2 | )� | � | � | (0 | )� |
| Japanese agency and municipal securities |
�� | � | ��� | � | � | � | (0 | )� |
| Foreign government, agency and municipal securities |
�� | � | 0 | �� | � | � | 0 | �� |
| Bank and corporate debt securities and loans for trading purposes |
�� | � | 0 | �� | � | � | 0 | �� |
| Commercial mortgage-backed securities (�CMBS�) |
�� | � | (0 | )� | � | � | (0 | )� |
| Residential mortgage-backed securities (�RMBS�) |
�� | � | (0 | )� | � | � | 0 | �� |
| Real estate-backed securities |
�� | � | 1 | �� | � | � | ��� | � |
| Collateralized debt obligations (�CDO�) and other |
�� | � | (1 | )� | � | � | (2 | )� |
| Investment trust funds and other |
�� | � | 0 | �� | � | � | 1 | �� |
| �� | � |
� |
� | � | � |
� |
� | |
| Total trading assets and private equity investments |
�� | � | 1 | �� | � | � | (1 | )� |
| �� | � |
� |
� | � | � |
� |
� | |
| Derivatives, net(2) |
�� | � | ||||||
| Equity contracts |
�� | � | (14 | )� | � | � | (1 | )� |
| Interest rate contracts |
�� | � | (3 | )� | � | � | (37 | )� |
| Credit contracts |
�� | � | (2 | )� | � | � | (4 | )� |
| Foreign exchange contracts |
�� | � | (5 | )� | � | � | (4 | )� |
| Commodity contracts |
�� | � | 0 | �� | � | � | (0 | )� |
| �� | � |
� |
� | � | � |
� |
� | |
| Total derivatives, net |
�� | � | (24 | )� | � | � | (46 | )� |
| �� | � |
� |
� | � | � |
� |
� | |
| Subtotal |
�� | � | (23 | )� | � | � | (47 | )� |
| �� | � |
� |
� | � | � |
� |
� | |
| Loans and receivables |
�� | � | (0 | )� | � | � | (0 | )� |
| Other assets |
�� | � | ||||||
| Non-trading debt securities |
�� | � | (0 | )� | � | � | 0 | �� |
| Other |
�� | � | 2 | �� | � | � | (0 | )� |
| �� | � |
� |
� | � | � |
� |
� | |
| Total |
�� | � | (21 | )� | � | � | (47 | )� |
| �� | � |
� |
� | � | � |
� |
� | |
| Liabilities: |
�� | � | ||||||
| Trading liabilities |
�� | � | ||||||
| Equities |
�� | � | 0 | �� | � | � | 0 | �� |
| Bank and corporate debt securities |
�� | � | (0 | )� | � | � | (0 | )� |
| �� | � |
� |
� | � | � |
� |
� | |
| Total trading liabilities |
�� | � | 0 | �� | � | � | 0 | �� |
| �� | � |
� |
� | � | � |
� |
� | |
| Short-term borrowings |
�� | � | 0 | �� | � | � | (0 | )� |
| Payables and deposits |
�� | � | (0 | )� | � | � | (0 | )� |
| Long-term borrowings |
�� | � | 15 | �� | � | � | (43 | )� |
| �� | � |
� |
� | � | � |
� |
� | |
| Total |
�� | � | 15 | �� | � | � | (43 | )� |
| �� | � |
� |
� | � | � |
� |
� | |
�
| (1) | Includes gains and losses reported primarily within Net gain on trading, Gain (loss) on private equity investments, and also within Gain (loss) on investments in equity securities, Revenue�Other and Non-interest expenses�Other, Interest and dividends and Interest expense in the consolidated statements of income. |
| (2) | Each derivative classification includes derivatives referencing multiple risk components. For example, interest rate contracts include complex derivatives referencing interest rate risk as well as foreign exchange risk or other factors such as prepayment rates. Credit contracts include credit default swaps as well as derivatives referencing corporate and government debt securities. |
�
F-34
Table of Contents
Notes to the Interim Consolidated Financial Statements�(Continued) (UNAUDITED)
�
Transfers between levels of the fair value hierarchy
Nomura assumes that all transfers of financial instruments from one level to another level within the fair value hierarchy occur at the beginning of the relevant quarter in which the transfer takes place. Amounts reported below therefore represent the fair value of the financial instruments at the beginning of the relevant quarter when the transfer was made.
Transfers between Level 1 and Level 2
For the six months ended September�30, 2013, a total of �427 billion of financial assets (excluding derivative assets) were transferred from Level 1 to Level 2. This comprised primarily �422 billion of equities reported within Trading assets and private equity investments�Equities which were transferred because the observable markets in which these instruments are traded became inactive. During the same period, a total of �25 billion of financial liabilities (excluding derivative liabilities) were transferred from Level 1 to Level 2. This also comprised primarily �24 billion of short sales of equities reported within Trading liabilities which were transferred because the observable markets in which these instruments were traded became inactive.
For the six months ended September�30, 2014, a total of �207 billion of financial assets (excluding derivative assets) were transferred from Level 1 to Level 2. This comprised primarily �191 billion of equities reported within Trading assets and private equity investments�Equities which were transferred because the observable markets in which these instruments are traded became inactive. This also comprised primarily �6 billion of Foreign government, agency and municipal securities and �6 billion of Investment trust funds and other which were transferred because the observable markets in which these instruments are traded became inactive. During the same period, a total of �36 billion of financial liabilities (excluding derivative liabilities) were transferred from Level 1 to Level 2. This also comprised primarily �34 billion of short sales of equities reported within Trading liabilities which were transferred because the observable markets in which these instruments were traded became inactive.
For the three months ended September�30, 2013, a total of �418 billion of financial assets (excluding derivative assets) were transferred from Level 1 to Level 2. This comprised primarily �413 billion of equities reported within Trading assets and private equity investments�Equities which were transferred because the observable markets in which these instruments are traded became inactive. During the same period, a total of �24 billion of financial liabilities (excluding derivative liabilities) were transferred from Level 1 to Level 2. This also comprised primarily �23 billion of short sales of equities reported within Trading liabilities which were transferred because the observable markets in which these instruments were traded became inactive.
For the three months ended September�30, 2014, a total of �42 billion of financial assets (excluding derivative assets) were transferred from Level 1 to Level 2. This comprised primarily �38 billion of equities reported within Trading assets and private equity investments�Equities which were transferred because the observable markets in which these instruments are traded became inactive. During the same period, a total of �21 billion of financial liabilities (excluding derivative liabilities) were transferred from Level 1 to Level 2. This also comprised primarily �21 billion of short sales of equities reported within Trading liabilities which were transferred because the observable markets in which these instruments were traded became inactive.
For the six months ended September�30, 2013, a total of �100 billion of financial assets (excluding derivative assets) were transferred from Level 2 to Level 1. This comprised primarily �94 billion of equities reported within Trading assets and private equity investments�Equities, and �6 billion of Investment trust funds and other which were transferred because the observable markets in which these instruments are traded became active. During the same period, a total of �22 billion of financial liabilities (excluding derivative liabilities) were transferred from Level 2 to Level 1. This also comprised primarily �22 billion of short sales of equities reported within Trading liabilities which were transferred because the observable markets in which these instruments were traded became active.
For the six months ended September�30, 2014, a total of �39 billion of financial assets (excluding derivative assets) were transferred from Level 2 to Level 1. This comprised primarily �35 billion of equities reported within Trading assets and private equity investments�Equities which were transferred because the observable markets in which these instruments are traded became active. During the same period, a total of �18 billion of financial liabilities (excluding derivative liabilities) were transferred from Level 2 to Level 1. This also comprised primarily �18 billion of short sales of equities reported within Trading liabilities which were transferred because the observable markets in which these instruments were traded became active.
For the three months ended September�30, 2013, a total of �87 billion of financial assets (excluding derivative assets) were transferred from Level 2 to Level 1. This comprised primarily �87 billion of equities reported within Trading assets and private equity investments�Equities which were transferred because the observable markets in which these instruments are traded became active. During the same period, a total of �20 billion of financial liabilities (excluding derivative liabilities) were transferred from Level 2 to Level 1. This also comprised primarily �20 billion of short sales of equities reported within Trading liabilities which were transferred because the observable markets in which these instruments were traded became active.
�
F-35
Table of Contents
Notes to the Interim Consolidated Financial Statements�(Continued) (UNAUDITED)
�
For the three months ended September�30, 2014, a total of �16 billion of financial assets (excluding derivative assets) were transferred from Level 2 to Level 1. This comprised primarily �14 billion of equities reported within Trading assets and private equity investments�Equities which were transferred because the observable markets in which these instruments are traded became active. During the same period, a total of �6 billion of financial liabilities (excluding derivative liabilities) were transferred from Level 2 to Level 1. This also comprised primarily �6 billion of short sales of equities reported within Trading liabilities which were transferred because the observable markets in which these instruments were traded became active.
Transfers out of Level 3
For the six months ended September�30, 2013, a total of �88 billion of financial assets (excluding derivative assets) were transferred out of Level 3. This comprised primarily �65 billion of Foreign government, agency and municipal securities which were transferred because certain credit spreads became observable, �20 billion of Bank and corporate debt securities and loans for trading purposes, principally debt securities, which were transferred because certain credit spreads and recovery rates became observable. During the same period, a total of �45 billion of financial liabilities (excluding derivative liabilities) were transferred out of Level 3. This comprised primarily �43 billion of Long term borrowings, principally structured notes, which were transferred because certain yields, prepayment rate, default probability, volatility and correlation valuation inputs became observable.
For the six months ended September�30, 2013, a total of �3 billion of net derivative assets were also transferred out of Level 3. This comprised primarily �6 billion of net equity derivative assets which were transferred because certain dividend yields, volatility and correlation valuation inputs became observable.
For the six months ended September�30, 2014, a total of �81 billion of financial assets (excluding derivative assets) were transferred out of Level 3. This comprised primarily �8 billion of Equities which were transferred because certain liquidity discounts valuation inputs became observable, �27 billion of Foreign government, agency and municipal securities which were transferred because certain credit spread became observable. This also comprised �36 billion of Bank and corporate debt securities and loans for trading purposes, principally debt securities, which were transferred because certain credit spread and recovery rate valuation inputs became observable. During the same period, a total of �15 billion of financial liabilities (excluding derivative liabilities) were transferred out of Level 3. This comprised primarily �12 billion of Long term borrowings, principally structured notes, which were transferred because certain yields, prepayment rates, default probabilities, loss severities, volatility and correlation valuation inputs became observable.
For the six months ended September�30, 2014, the total amount of net derivative liabilities which were transferred out of Level 3 was not significant.
For the three months ended September�30, 2013, a total of �31 billion of financial assets (excluding derivative assets) were transferred out of Level 3. This comprised primarily �16 billion of Foreign government, agency and municipal securities which were transferred because certain credit spreads became observable. This also comprised primarily �15 billion of Bank and corporate debt securities and loans for trading purposes, which were transferred because certain credit spreads and recovery rates became observable. During the same period, a total of �15 billion of financial liabilities (excluding derivative liabilities) were transferred out of Level 3. This comprised primarily �14 billion of Long term borrowings, principally structured notes, which were transferred because certain yields, prepayment rate, default probability, volatility and correlation valuation inputs became observable.
For the three months ended September�30, 2013, the total amount of net derivative contracts which were also transferred out of Level 3 was not significant.
For the three months ended September�30, 2014, a total of �54 billion of financial assets (excluding derivative assets) were transferred out of Level 3. This comprised primarily �22 billion of Foreign government, agency and municipal securities which were transferred because certain credit spread became observable. This also comprised �24 billion of Bank and corporate debt securities and loans for trading purposes, principally debt securities, which were transferred because certain credit spread and recovery rate valuation inputs became observable. During the same period, a total of �6 billion of financial liabilities (excluding derivative liabilities) were transferred out of Level 3. This comprised primarily �6 billion of Long term borrowings, principally structured notes, which were transferred because certain yields, prepayment rates, default probabilities, loss severities, volatility and correlation valuation inputs became observable.
�
F-36
Table of Contents
Notes to the Interim Consolidated Financial Statements�(Continued) (UNAUDITED)
�
For the three months ended September�30, 2014, the total amount of net derivative assets which were transferred out of Level 3 was not significant.
Transfers into Level 3
For the six months ended September�30, 2013, a total of �29 billion of financial assets (excluding derivative assets) were transferred into Level 3. This comprised primarily �8 billion of Foreign government, agency and municipal securities which were transferred because certain credit spreads became unobservable. This also comprised primarily �13 billion of Bank and corporate debt securities and loans for trading purposes, principally loans, which were transferred because certain credit spreads and recovery rates became unobservable. The amount of gains and losses on these transfers reported in Foreign government, agency and municipal securities and Bank and corporate debt securities and loans for trading purposes which were recognized in the quarter when the transfers into Level 3 occurred was not significant. During the same period, the total amount of financial liabilities (excluding derivative liabilities) which were transferred into Level 3 was not significant. The amount of gains and losses on these transfers which were recognized in the quarter when the transfers into Level 3 occurred was not significant.
For the six months ended September�30, 2013, the total amount of net derivative contracts which were transferred into Level 3 was not significant. Losses on these equity contracts and interest rate contracts which were recognized in the quarter when the transfers into Level 3 occurred were �6 billion and �7 billion, respectively.
For the six months ended September�30, 2014, a total of �31 billion of financial assets (excluding derivative assets) were transferred into Level 3. This comprised primarily �5 billion of Foreign government, agency and municipal securities which were transferred because certain credit spread became unobservable and �11 billion of Bank and corporate debt securities and loans for trading purposes which were transferred because certain credit spread and recovery rate valuation inputs became unobservable. This also comprised primarily �9 billion of Collateralized debt obligations (�CDO�) and other which were transferred because certain yields, prepayment rates, default probabilities and loss severities became unobservable. The amount of gains and losses on these transfers reported in Foreign government, agency and municipal securities, Bank and corporate debt securities and loans for trading purposes and Collateralized debt obligations (�CDO�) and other which were recognized in the quarter when the transfer in to Level 3 occurred were not significant. During the same period, a total of �32 billion of financial liabilities (excluding derivative liabilities) were transferred into Level 3. This comprised primarily �32 billion of Long term borrowings, principally structured notes, which were transferred because certain yields, prepayment rates, default probabilities, loss severities, volatility and correlation valuation inputs became unobservable. The amount of gains and losses on these transfers reported in Long term borrowings which were recognized in the quarter when the transfer into Level 3 occurred was not significant.
For the six months ended September�30, 2014, a total of �3 billion of net derivative liabilities were also transferred into Level 3. The amount of gains and losses which were recognized in the quarter when the transfer into Level 3 occurred was not significant.
For the three months ended September�30, 2013, a total of �24 billion of financial assets (excluding derivative assets) were transferred into Level 3. This comprised primarily �8 billion of Foreign government, agency and municipal securities which were transferred because certain credit spreads became unobservable. This also comprised primarily �12 billion of Bank and corporate debt securities and loans for trading purposes, principally loans, which were transferred because certain credit spreads became unobservable. The amount of gains and losses on these transfers reported in Foreign government, agency and municipal securities and Bank and corporate debt securities and loans for trading purposes which were recognized in the quarter when the transfers into Level 3 occurred was not significant. During the same period, the total amount of financial liabilities (excluding derivative liabilities) which were transferred into Level 3 was not significant. The amount of gains and losses on these transfers which were recognized in the quarter when the transfers into Level 3 occurred was not significant.
For the three months ended September�30, 2013, a total of �3 billion of net derivative assets were also transferred into Level 3. This comprised �7 billion of net equity derivative assets which were transferred because certain dividend yields, volatility and correlation valuation inputs became unobservable. Losses on the equity contracts which were recognized in the quarter when the transfers into Level 3 occurred were �5 billion.
For the three months ended September�30, 2014, a total of �12 billion of financial assets (excluding derivative assets) were transferred into Level 3. This comprised primarily �8 billion of Collateralized debt obligations (�CDO�) and other which were transferred because certain yields, prepayment rates, default probabilities and loss severities became unobservable. The amount of gains and losses on these transfers reported in Collateralized debt obligations (�CDO�) and other which were recognized in the quarter when the transfer in to Level 3 occurred were not significant. During the same period, a total of �10 billion of financial liabilities (excluding derivative liabilities) were transferred into Level 3. This comprised primarily �10 billion of Long term borrowings, principally structured notes, which were transferred because certain yields, prepayment rates, default probabilities, loss severities, volatility and correlation valuation inputs became unobservable. The amount of gains and losses on these transfers reported in Long term borrowings which were recognized in the quarter when the transfer into Level 3 occurred was not significant.
For the three months ended September�30, 2014, a total amount of net derivative liabilities which were transferred into Level 3 was not significant. The amount of gains and losses which were recognized in the quarter when the transfer into Level 3 occurred was not significant.
�
F-37
Table of Contents
Notes to the Interim Consolidated Financial Statements�(Continued) (UNAUDITED)
�
Investments in investment funds that calculate NAV per share
In the normal course of business, Nomura invests in non-consolidated funds which meet the definition of investment companies or are similar in nature and which do not have readily determinable fair values. For certain of these investments, Nomura uses NAV per share as the basis for valuation as a practical expedient. Some of these investments are redeemable at different amounts from NAV per share.
The following tables present information on these investments where NAV per share is calculated or disclosed as of March�31, 2014 and September�30, 2014. Investments are presented by major category relevant to the nature of Nomura�s business and risks.
�
| � | �� | Billions of yen | ||||||||||
| � | �� | March�31, 2014 | ||||||||||
| � | �� | Fair� value(1) | � | �� | Unfunded commitments(2) |
� | �� | Redemption�frequency (if�currently�eligible)(3) |
�� | Redemption�notice� period(4) | ||
| Hedge funds |
�� | � | 66 | �� | �� | � | 0 | �� | �� | Monthly | �� | Same�day-95�days |
| Venture capital funds |
�� | � | 4 | �� | �� | � | 1 | � | �� | ��� | �� | ��� |
| Private equity funds |
�� | � | 42 | �� | �� | � | 17 | �� | �� | Quarterly | �� | 30 days |
| Real estate funds |
�� | � | 3 | �� | �� | � | ��� | � | �� | ��� | �� | ��� |
| �� | � |
� |
� | �� | � |
� |
� | �� | �� | |||
| Total |
�� | � | 115 | �� | �� | � | 18 | �� | �� | �� | ||
| �� | � |
� |
� | �� | � |
� |
� | �� | �� | |||
| � | �� | Billions of yen | ||||||||||
| � | �� | September 30, 2014 | ||||||||||
| � | �� | Fair� value(1) | � | �� | Unfunded commitments(2) |
� | �� | Redemption frequency (if�currently�eligible)(3) |
�� | Redemption�notice period(4) | ||
| Hedge funds |
�� | � | 77 | �� | �� | � | 0 | �� | �� | Monthly | �� | Same�day-90�days |
| Venture capital funds |
�� | � | 4 | �� | �� | � | 1 | � | �� | ��� | �� | ��� |
| Private equity funds |
�� | � | 43 | �� | �� | � | 13 | � | �� | ��� | �� | ��� |
| Real estate funds |
�� | � | 1 | �� | �� | � | ��� | � | �� | ��� | �� | ��� |
| �� | � |
� |
� | �� | � |
� |
� | �� | �� | |||
| Total |
�� | � | 125 | �� | �� | � | 14 | �� | �� | �� | ||
| �� | � |
� |
� | �� | � |
� |
� | �� | �� | |||
�
| (1) | Fair value generally determined using NAV per share as a practical expedient. |
| (2) | The contractual amount of any unfunded commitments Nomura is required to make to the entities in which the investment is held. |
| (3) | The range in frequency with which Nomura can redeem investments. |
| (4) | The range in notice period required to be provided before redemption is possible. |
�
F-38
Table of Contents
Notes to the Interim Consolidated Financial Statements�(Continued) (UNAUDITED)
�
Hedge funds:
These investments include funds of funds that invest in multiple asset classes. Nomura has developed the business of issuing structured notes linked to hedge funds. As a result, most of the risks are transferred as pass-through. The fair values of these investments are estimated using the NAV per share of the investments. Although most of these funds can be redeemed within six�months, certain funds cannot be redeemed within six�months due to contractual, liquidity or gating issues. The redemption period cannot be estimated for certain suspended or liquidating funds. Some of these investments contain restrictions against transfers of the investments to third parties.
Venture capital funds:
These investments include primarily start-up funds. The fair values of these investments in this category are estimated using the NAV per share of the investments. Most of these funds cannot be redeemed within six months. The redemption period cannot be estimated for certain suspended or liquidating funds. These investments contain restrictions against transfers of the investments to third parties.
Private equity funds:
These investments are made mainly in various sectors in Europe, United States and Japan. The fair values of these investments in this category are estimated using the NAV per share. Redemption is restricted for most of these investments. Some of these investments contain restrictions against transfers of the investments to third parties.
Real estate funds:
These are investments in commercial and other types of real estate. The fair values of these investments in this category are estimated using the NAV per share of the investments. Redemption is restricted for most of these investments. These investments contain restrictions against transfers of the investments to third parties.
Fair value option for financial assets and financial liabilities
Nomura carries certain eligible financial assets and liabilities at fair value through the election of the fair value option permitted by ASC 815 �Derivatives and Hedging� (�ASC 815�) and ASC 825 �Financial Instruments�. When Nomura elects the fair value option for an eligible item, changes in that item�s fair value are recognized through earnings. Election of the fair value option is generally irrevocable unless an event occurs that gives rise to a new basis of accounting for that instrument.
The financial assets and financial liabilities primarily elected for the fair value option by Nomura, and the reasons for the election, are as follows:
�
| � | � | � | Equity method investments reported within Trading assets and private equity investments and Other assets held for capital appreciation or current income purposes which Nomura generally has an intention to exit rather than hold indefinitely. Nomura elects the fair value option to more appropriately represent the purpose of these investments in these consolidated financial statements. |
�
| � | � | � | Loans reported within Loans and receivables which are risk managed on a fair value basis and loan commitments related to loans receivable for which the fair value option will be elected upon funding. Nomura elects the fair value option to mitigate volatility through earnings caused by the difference in measurement basis that otherwise would arise between loans and the derivatives used to risk manage those instruments. |
�
| � | � | � | Reverse repurchase and repurchase agreements reported within Collateralized agreements and Collateralized financing which are risk managed on a fair value basis. Nomura elects the fair value option to mitigate volatility through earnings caused by the difference in measurement basis that otherwise would arise between the reverse repurchase and repurchase agreements and the derivatives used to risk manage those instruments. |
�
| � | � | � | All structured notes issued on or after April�1, 2008 reported within Short-term borrowings and Long-term borrowings. Nomura elects the fair value option for those structured notes primarily to mitigate the volatility through earnings caused by differences in the measurement basis for structured notes and the derivatives Nomura uses to risk manage those positions. Nomura also elects the fair value option for certain notes issued by consolidated VIEs for the same purpose and for certain structured notes issued prior to April�1, 2008. |
�
| � | � | � | Financial liabilities reported within Long-term borrowings recognized in transactions which are accounted for as secured financing transactions under ASC 860. Nomura elects the fair value option for these financial liabilities to mitigate volatility through earnings that otherwise would arise had this election not been made. Even though Nomura usually has little or no continuing economic exposure to the transferred financial assets, they remain on the consolidated balance sheets and continue to be carried at fair value, with changes in fair value recognized through earnings. |
Interest and dividends arising from financial instruments for which the fair value option has been elected are recognized within Interest and dividends, Interest expense or Net gain on trading.
�
F-39
Table of Contents
Notes to the Interim Consolidated Financial Statements�(Continued) (UNAUDITED)
�
The following tables present gains (losses) due to changes in fair value for financial instruments measured at fair value using the fair value option for the six and three months ended September�30, 2013 and 2014.
�
| � | �� | Billions�of�yen | � | |||||
| � | �� | Six�months�ended�September�30 | � | |||||
| � | �� | 2013 | � | � | 2014 | � | ||
| � | �� | Gains / (Losses)(1) | � | |||||
| Assets: |
�� | � | ||||||
| Trading assets and private equity investments(2) |
�� | � | ||||||
| Trading assets |
�� | � | (0 | )� | � | � | (0 | )� |
| Private equity investments |
�� | � | 0 | �� | � | � | 0 | �� |
| Loans and receivables |
�� | � | 2 | �� | � | � | (5 | )� |
| Collateralized agreements(3) |
�� | � | (1 | )� | � | � | 6 | �� |
| Other assets(2) |
�� | � | 0 | �� | � | � | (6 | )� |
| �� | � |
� |
� | � | � |
� |
� | |
| Total |
�� | � | 1 | �� | � | � | (5 | )� |
| �� | � |
� |
� | � | � |
� |
� | |
| Liabilities: |
�� | � | ||||||
| Short-term borrowings(4) |
�� | � | (1 | )� | � | � | 5 | �� |
| Collateralized financing(3) |
�� | � | 0 | �� | � | � | (0 | )� |
| Long-term borrowings(4)(5) |
�� | � | 51 | �� | � | � | (40 | )� |
| Other liabilities(6) |
�� | � | 0 | �� | � | � | 0 | �� |
| �� | � |
� |
� | � | � |
� |
� | |
| Total |
�� | � | 50 | �� | � | � | (35 | )� |
| �� | � |
� |
� | � | � |
� |
� | |
| � | �� | Billions�of�yen | � | |||||
| � | �� | Three�months�ended�September�30 | � | |||||
| � | �� | 2013 | � | � | 2014 | � | ||
| � | �� | Gains / (Losses)(1) | � | |||||
| Assets: |
�� | � | ||||||
| Trading assets and private equity investments(2) |
�� | � | ||||||
| Trading assets |
�� | � | (0 | )� | � | � | 0 | �� |
| Private equity investments |
�� | � | 0 | �� | � | � | 0 | �� |
| Loans and receivables |
�� | � | 3 | �� | � | � | (3 | )� |
| Collateralized agreements(3) |
�� | � | (3 | )� | � | � | 4 | �� |
| Other assets(2) |
�� | � | (0 | )� | � | � | (3 | )� |
| �� | � |
� |
� | � | � |
� |
� | |
| Total |
�� | � | (0 | )� | � | � | (2 | )� |
| �� | � |
� |
� | � | � |
� |
� | |
| Liabilities: |
�� | � | ||||||
| Short-term borrowings(4) |
�� | � | (2 | )� | � | � | 4 | �� |
| Collateralized financing(3) |
�� | � | 0 | �� | � | � | 0 | �� |
| Long-term borrowings(4)(5) |
�� | � | 3 | �� | � | � | 26 | �� |
| Other liabilities(6) |
�� | � | 0 | �� | � | � | (0 | )� |
| �� | � |
� |
� | � | � |
� |
� | |
| Total |
�� | � | 1 | �� | � | � | 30 | �� |
| �� | � |
� |
� | � | � |
� |
� | |
�
| (1) | Includes gains and losses reported primarily within Net gain on trading, Gain (loss) on private equity investments and Revenue�Other in the consolidated statements of income. |
| (2) | Includes equity investments that would have been accounted for under the equity method had Nomura not chosen to elect the fair value option. |
| (3) | Includes reverse repurchase and repurchase agreements. |
| (4) | Includes structured notes and other financial liabilities. |
| (5) | Includes secured financing transactions arising from transfers of financial assets which did not meet the criteria for sales accounting. |
| (6) | Includes loan commitments. |
Nomura currently carries its investment in the common stock of Ashikaga Holdings Co., Ltd. at fair value through election of the fair value option. Nomura held 37.1% as of September�30, 2014. This investment was reported within Other assets�Other as of September�30, 2014 in the consolidated balance sheets.
�
F-40
Table of Contents
Notes to the Interim Consolidated Financial Statements�(Continued) (UNAUDITED)
�
Nomura calculates the impact of changes in its own creditworthiness on certain financial liabilities for which the fair value option is elected by DCF valuation techniques at a rate which incorporates observable changes in its credit spread.
Gains from changes in the fair value of the financial liabilities for which the fair value option was elected, attributable to the change in its creditworthiness were �3 billion for the six months ended September�30, 2013, mainly due to the changes of Nomura�s credit spread. Losses from changes in the fair value of the financial liabilities for which the fair value option was elected, attributable to the change in its creditworthiness were �2 billion for the six months ended September�30, 2014, mainly because of the tightening of Nomura�s credit spread.
Gains from changes in the fair value of the financial liabilities for which the fair value option was elected, attributable to the change in its creditworthiness were �0 billion for the three months ended September�30, 2013, mainly due to the widening of Nomura�s credit spread. Gains from changes in the fair value of the financial liabilities for which the fair value option was elected, attributable to the change in its creditworthiness were �7 billion for the three months ended September�30, 2014, mainly because of the widening of Nomura�s credit spread.
There was no significant impact on financial assets for which the fair value option was elected attributable to instrument-specific credit risk.
As of March�31, 2014, the fair value of the aggregate unpaid principal balance (which is contractually principally protected) of loans and receivables for which the fair value option was elected was �1 billion more than the principal balance of such loans and receivables. The fair value of the aggregate unpaid principal balance (which is contractually principally protected) of long-term borrowings for which the fair value option was elected was �17 billion more than the principal balance of such long-term borrowings. There were no loans and receivables for which the fair value option was elected that were 90 days or more past due.
As of September�30, 2014, the fair value of the aggregate unpaid principal balance (which is contractually principally protected) of loans and receivables for which the fair value option was elected was �1 billion more than the principal balance of such loans and receivables. The fair value of the aggregate unpaid principal balance (which is contractually principally protected) of long-term borrowings for which the fair value option was elected was �6 billion more than the principal balance of such long-term borrowings. There were no loans and receivables for which the fair value option was elected that were 90 days or more past due.
�
F-41
Table of Contents
Notes to the Interim Consolidated Financial Statements�(Continued) (UNAUDITED)
�
Concentrations of credit risk
Concentrations of credit risk may arise from trading, securities financing transactions and underwriting activities, and may be impacted by changes in political or economic factors. Nomura has credit risk concentrations on bonds issued by the Japanese Government, U.S. Government, Governments within the European Union (�EU�), their states and municipalities, and their agencies. These concentrations generally arise from taking trading positions and are reported within Trading assets in the consolidated balance sheets. Government, agency and municipal securities, including Securities pledged as collateral, represented 20% of total assets as of March�31, 2014 and 22% as of September�30, 2014.
The following tables present geographic allocations of Nomura�s trading assets related to government, agency and municipal securities. See Note 3 �Derivative instruments and hedging activities� for further information regarding the concentration of credit risk for derivatives.
�
| � | �� | Billions of yen | � | |||||||||||||||||
| � | �� | March�31, 2014 | � | |||||||||||||||||
| � | �� | Japan | � | �� | U.S. | � | �� | EU | � | �� | Other | � | �� | Total(1) | � | |||||
| Government, agency and municipal securities |
�� | � | 2,779 | �� | �� | � | 1,666 | �� | �� | � | 3,968 | �� | �� | � | 385 | �� | �� | � | 8,798 | �� |
| � | �� | Billions of yen | � | |||||||||||||||||
| � | �� | September 30, 2014 | � | |||||||||||||||||
| � | �� | Japan | � | �� | U.S. | � | �� | EU | � | �� | Other | � | �� | Total(1) | � | |||||
| Government, agency and municipal securities |
�� | � | 3,409 | �� | �� | � | 2,152 | �� | �� | � | 3,773 | �� | �� | � | 508 | �� | �� | � | 9,842 | �� |
�
| (1) | Other than above, there were �756�billion and �681�billion of government, agency and municipal securities in Other assets�Non-trading debt securities as of March�31, 2014 and September�30, 2014, respectively. The vast majority of these securities are Japanese government, agency and municipal securities. |
Estimated fair value of financial instruments not carried at fair value
Certain financial instruments are not carried at fair value on a recurring basis in the consolidated balance sheets since they are neither held for trading purposes nor are elected for the fair value option. These are typically carried at contractual amounts due or amortized cost.
The carrying value of the majority of the financial instruments detailed below will approximate fair value since they are short-term in nature and contain minimal credit risk. These financial instruments include financial assets reported within Cash and cash equivalents, Time deposits, Deposits with stock exchanges and other segregated cash, Receivables from customers, Receivables from other than customers, Securities purchased under agreements to resell and Securities borrowed and financial liabilities reported within Short-term borrowings, Payables to customers, Payables to other than customers, Deposits received at banks, Securities sold under agreements to repurchase, Securities loaned and Other secured borrowings in the consolidated balance sheets. These would be generally classified in either Level 1 or Level 2 within the fair value hierarchy.
The estimated fair values of other financial instruments which are longer-term in nature or may contain more than minimal credit risk may be different to their carrying value. Financial assets of this type primarily include certain loans which are reported within Loans receivable while financial liabilities primarily include long-term borrowings which are reported within Long-term borrowings. The estimated fair value of loans receivable which are not elected for the fair value option is estimated in the same way as other loans carried at fair value on a recurring basis. Where quoted market prices are available, such market prices are utilized to estimate fair value. The fair value of long-term borrowings which are not elected for the fair value option is estimated in the same way as other borrowings carried at fair value on a recurring basis using quoted market prices where available or by DCF valuation techniques. All of these financial assets and financial liabilities would be generally classified in Level 2 or Level 3 within the fair value hierarchy using the same methodology as is applied to these instruments when they are elected for the fair value option.
�
F-42
Table of Contents
Notes to the Interim Consolidated Financial Statements�(Continued) (UNAUDITED)
�
The following tables present carrying values, fair values and classification within the fair value hierarchy for certain classes of financial instrument of which a portion of the ending balance was carried at fair value as of March�31, 2014 and September�30, 2014.
�
| � | �� | Billions of yen | � | |||||||||||||||||
| � | �� | March�31, 2014(1) | � | |||||||||||||||||
| � | �� | � | � | �� | � | � | �� | Fair value by level | � | |||||||||||
| � | �� | Carrying value |
� | �� | Fair�value | � | �� | Level�1 | � | �� | Level�2 | � | �� | Level�3 | � | |||||
| Assets: |
�� | �� | �� | �� | �� | |||||||||||||||
| Cash and cash equivalents |
�� | � | 1,490 | �� | �� | � | 1,490 | �� | �� | � | 1,490 | �� | �� | � | ��� | � | �� | � | ���� | � |
| Time deposits |
�� | � | 364 | �� | �� | � | 364 | �� | �� | � | ��� | � | �� | � | 364 | �� | �� | � | ��� | � |
| Deposits with stock exchanges and other segregated cash |
�� | � | 336 | �� | �� | � | 336 | �� | �� | � | ��� | � | �� | � | 336 | �� | �� | � | ��� | � |
| Loans receivable(2) |
�� | � | 1,327 | �� | �� | � | 1,326 | �� | �� | � | ��� | � | �� | � | 1,068 | �� | �� | � | 258 | �� |
| Securities purchased under agreements to resell |
�� | � | 9,618 | �� | �� | � | 9,618 | �� | �� | � | ��� | � | �� | � | 9,618 | �� | �� | � | ��� | � |
| Securities borrowed |
�� | � | 7,729 | �� | �� | � | 7,729 | �� | �� | � | ��� | � | �� | � | 7,729 | �� | �� | � | ��� | � |
| �� | � |
� |
� | �� | � |
� |
� | �� | � |
� |
� | �� | � |
� |
� | �� | � |
� |
� | |
| Total Assets |
�� | � | 20,864 | �� | �� | � | 20,863 | �� | �� | � | 1,490 | �� | �� | � | 19,115 | �� | �� | � | 258 | �� |
| �� | � |
� |
� | �� | � |
� |
� | �� | � |
� |
� | �� | � |
� |
� | �� | � |
� |
� | |
| Liabilities: |
�� | �� | �� | �� | �� | |||||||||||||||
| Short-term borrowings |
�� | � | 602 | �� | �� | � | 602 | �� | �� | � | ��� | � | �� | � | 599 | �� | �� | � | 3 | �� |
| Deposits received at banks |
�� | � | 1,114 | �� | �� | � | 1,114 | �� | �� | � | ��� | � | �� | � | 1,114 | �� | �� | � | 0 | �� |
| Securities sold under agreements to repurchase |
�� | � | 13,938 | �� | �� | � | 13,938 | �� | �� | � | ��� | � | �� | � | 13,938 | �� | �� | � | 0 | �� |
| Securities loaned |
�� | � | 2,360 | �� | �� | � | 2,360 | �� | �� | � | ��� | � | �� | � | 2,360 | �� | �� | � | ��� | � |
| Long-term borrowings |
�� | � | 8,227 | �� | �� | � | 8,202 | �� | �� | � | 134 | �� | �� | � | 7,674 | �� | �� | � | 394 | �� |
| �� | � |
� |
� | �� | � |
� |
� | �� | � |
� |
� | �� | � |
� |
� | �� | � |
� |
� | |
| Total Liabilities |
�� | � | 26,241 | �� | �� | � | 26,216 | �� | �� | � | 134 | �� | �� | � | 25,685 | �� | �� | � | 397 | �� |
| �� | � |
� |
� | �� | � |
� |
� | �� | � |
� |
� | �� | � |
� |
� | �� | � |
� |
� | |
| � | �� | Billions of yen | � | |||||||||||||||||
| � | �� | September�30, 2014(1) | � | |||||||||||||||||
| � | �� | � | � | �� | � | � | �� | Fair value by level | � | |||||||||||
| � | �� | Carrying value |
� | �� | Fair�value | � | �� | Level�1 | � | �� | Level�2 | � | �� | Level�3 | � | |||||
| Assets: |
�� | �� | �� | �� | �� | |||||||||||||||
| Cash and cash equivalents |
�� | � | 1,440 | �� | �� | � | 1,440 | �� | �� | � | 1,440 | �� | �� | � | ��� | � | �� | � | ��� | � |
| Time deposits |
�� | � | 225 | �� | �� | � | 225 | �� | �� | � | ��� | � | �� | � | 225 | �� | �� | � | ��� | � |
| Deposits with stock exchanges and other segregated cash |
�� | � | 405 | �� | �� | � | 405 | �� | �� | � | ��� | � | �� | � | 405 | �� | �� | � | ��� | � |
| Loans receivable(2) |
�� | � | 1,357 | �� | �� | � | 1,358 | �� | �� | � | ��� | � | �� | � | 1,120 | �� | �� | � | 238 | �� |
| Securities purchased under agreements to resell |
�� | � | 8,300 | �� | �� | � | 8,300 | �� | �� | � | ��� | � | �� | � | 8,300 | �� | �� | � | ��� | � |
| Securities borrowed |
�� | � | 8,081 | �� | �� | � | 8,081 | �� | �� | � | ��� | � | �� | � | 8,081 | �� | �� | � | ��� | � |
| �� | � |
� |
� | �� | � |
� |
� | �� | � |
� |
� | �� | � |
� |
� | �� | � |
� |
� | |
| Total Assets |
�� | � | 19,808 | �� | �� | � | 19,809 | �� | �� | � | 1,440 | �� | �� | � | 18,131 | �� | �� | � | 238 | �� |
| �� | � |
� |
� | �� | � |
� |
� | �� | � |
� |
� | �� | � |
� |
� | �� | � |
� |
� | |
| Liabilities: |
�� | �� | �� | �� | �� | |||||||||||||||
| Short-term borrowings |
�� | � | 609 | �� | �� | � | 609 | �� | �� | � | ��� | � | �� | � | 607 | �� | �� | � | 2 | �� |
| Deposits received at banks |
�� | � | 1,056 | �� | �� | � | 1,056 | �� | �� | � | ��� | � | �� | � | 1,056 | �� | �� | � | 0 | �� |
| Securities sold under agreements to repurchase |
�� | � | 13,878 | �� | �� | � | 13,878 | �� | �� | � | ��� | � | �� | � | 13,873 | �� | �� | � | 5 | �� |
| Securities loaned |
�� | � | 2,630 | �� | �� | � | 2,630 | �� | �� | � | ��� | � | �� | � | 2,630 | �� | �� | � | ��� | � |
| Long-term borrowings |
�� | � | 8,412 | �� | �� | � | 8,390 | �� | �� | � | 113 | �� | �� | � | 7,838 | �� | �� | � | 439 | �� |
| �� | � |
� |
� | �� | � |
� |
� | �� | � |
� |
� | �� | � |
� |
� | �� | � |
� |
� | |
| Total Liabilities |
�� | � | 26,585 | �� | �� | � | 26,563 | �� | �� | � | 113 | �� | �� | � | 26,004 | �� | �� | � | 446 | �� |
| �� | � |
� |
� | �� | � |
� |
� | �� | � |
� |
� | �� | � |
� |
� | �� | � |
� |
� | |
�
| (1) | Includes financial instruments which are carried at fair value on a recurring basis. |
| (2) | Carrying values are shown after deducting relevant allowances for loan losses. |
Assets and liabilities measured at fair value on a nonrecurring basis
In addition to financial instruments carried at fair value on a recurring basis, Nomura also measures other financial and non-financial assets and liabilities at fair value on a nonrecurring basis, where the primary measurement basis is not fair value. Fair value is only used in specific circumstances after initial recognition such as to measure impairment.
As of March�31, 2014, goodwill allocated to a certain reporting unit was measured at fair value on a nonrecurring basis. The relevant goodwill, which is reported within Other assets�Other in the consolidated balance sheets, was written down to its estimated fair value of �3 billion as a result of this impairment. Fair value was determined using a DCF valuation technique and consequently, this nonrecurring fair value measurement was determined using valuation inputs which would be classified in Level 3 of the fair value hierarchy.
As of September�30, 2014, goodwill allocated to a certain reporting unit was measured at fair value on a nonrecurring basis. The relevant goodwill, which is reported within Other assets�Other in the consolidated balance sheets, was wholly impaired. Fair value was determined using a DCF valuation technique and consequently, this nonrecurring fair value measurement was determined using valuation inputs which would be classified in Level 3 of the fair value hierarchy.
�
F-43
Table of Contents
Notes to the Interim Consolidated Financial Statements�(Continued) (UNAUDITED)
�
3. Derivative instruments and hedging activities:
Nomura uses a variety of derivative financial instruments, including futures, forwards, options and swaps, for both trading and non-trading purposes.
Derivatives used for trading purposes
In the normal course of business, Nomura enters into transactions involving derivative financial instruments to meet client needs, for trading purposes, and to reduce its own exposure to loss due to adverse fluctuations in interest rates, currency exchange rates and market prices of securities. These financial instruments include contractual agreements such as commitments to swap interest payment streams, exchange currencies or purchase or sell securities and other financial instruments on specific terms at specific future dates.
Nomura maintains active trading positions in a variety of derivative financial instruments. Most of Nomura�s trading activities are client oriented. Nomura utilizes a variety of derivative financial instruments as a means of bridging clients� specific financial needs and investors� demands in the securities markets. Nomura also actively trades securities and various derivatives to assist its clients in adjusting their risk profiles as markets change. In performing these activities, Nomura carries an inventory of capital markets instruments and maintains its access to market liquidity by quoting bid and offer prices to and trading with other market makers. These activities are essential to provide clients with securities and other capital markets products at competitive prices.
Futures and forward contracts are commitments to either purchase or sell securities, foreign currency or other capital market instruments at a specific future date for a specified price and may be settled in cash or through delivery. Foreign exchange contracts include spot and forward contracts and involve the exchange of two currencies at a rate agreed by the contracting parties. Risks arise from the possible inability of counterparties to meet the terms of their contracts and from movements in market prices. Futures contracts are executed through regulated exchanges which clear and guarantee performance of counterparties. Accordingly, credit risk associated with futures contracts is considered minimal. In contrast, forward contracts are generally negotiated between two counterparties and, therefore, are subject to the performance of the related counterparties.
Options are contracts that grant the purchaser, for a premium payment, the right to either purchase or sell a financial instrument at a specified price within a specified period of time or on a specified date from or to the writer of the option. The writer of options receives premiums and bears the risk of unfavorable changes in the market price of the financial instruments underlying the options.
Swaps are contractual agreements in which two counterparties agree to exchange certain cash flows, at specified future dates, based on an agreed contract. Certain agreements may result in combined interest rate and foreign currency exposures. Entering into swap agreements may involve the risk of credit losses in the event of counterparty default.
To the extent these derivative financial instruments are economically hedging financial instruments or securities positions of Nomura, the overall risk of loss may be fully or partly mitigated by the hedged position.
Nomura seeks to minimize its exposure to market risk arising from its use of these derivative financial instruments through various control policies and procedures, including position limits, monitoring procedures and hedging strategies whereby Nomura enters into offsetting or other positions in a variety of financial instruments.
Derivatives used for non-trading purposes
Nomura�s principal objectives in using derivatives for non-trading purposes are to manage interest rate risk, to modify the interest rate characteristics of certain financial liabilities, to manage net investment exposure to fluctuations in foreign exchange rates arising from certain foreign operations and to mitigate equity price risk arising from certain stock-based compensation awards given to employees.
Credit risk associated with derivatives utilized for non-trading purposes is controlled and managed in the same way as credit risk associated with derivatives utilized for trading purposes.
Nomura designates derivative financial instruments as fair value hedges of interest rate risk arising from specific financial liabilities. These derivatives are effective in reducing the risk associated with the exposure being hedged and they are highly correlated with changes in the fair value of the underlying hedged item, both at inception and throughout the life of the hedge contract. Changes in fair value of the hedging derivatives are reported together with those of the hedged liabilities through the consolidated statements of income within Interest expense.
Derivative financial instruments designated as hedges of the net investment in foreign operations relate to specific subsidiaries with non-Japanese yen functional currencies. When determining the effectiveness of net investment hedges, the effective portion of the change in fair value of the hedging derivative is determined by changes in spot exchange rates and is reported through NHI shareholders� equity within Accumulated other comprehensive income (loss). Changes in fair value of the hedging derivatives attributable to changes in the difference between the forward rate and spot rate are excluded from the measure of hedge effectiveness and are reported in the consolidated statements of income within Revenue�Other.
�
F-44
Table of Contents
Notes to the Interim Consolidated Financial Statements�(Continued) (UNAUDITED)
�
Concentrations of credit risk for derivatives
The following tables present Nomura�s significant concentration of exposures to credit risk in OTC derivatives with financial institutions including transactions cleared through central counterparties. The gross fair value of derivative assets represents the maximum amount of loss due to credit risk that Nomura would incur if the counterparties of Nomura failed to perform in accordance with the terms of the instruments and any collateral or other security Nomura held in relation to those instruments proved to be of no value.
�
| � | �� | Billions of yen | � | |||||||||||||
| � | �� | March�31, 2014 | � | |||||||||||||
| � | �� | Gross�fair�value�of derivative�assets |
� | �� | Impact�of master�netting agreements |
� | � | Impact�of collateral |
� | � | Net�exposure�to credit�risk |
� | ||||
| Financial institutions |
�� | � | �20,355 | �� | �� | � | (18,481 | )� | � | � | (936 | )� | � | � | 938 | �� |
| � | �� | Billions of yen | � | |||||||||||||
| � | �� | September 30, 2014 | � | |||||||||||||
| � | �� | Gross�fair�value�of derivative�assets |
� | �� | Impact�of master�netting agreements |
� | � | Impact�of collateral |
� | � | Net�exposure�to credit�risk |
� | ||||
| Financial institutions |
�� | � | 25,615 | �� | �� | � | (23,476 | )� | � | � | (1,246 | )� | � | � | 893 | �� |
�
F-45
Table of Contents
Notes to the Interim Consolidated Financial Statements�(Continued) (UNAUDITED)
�
Derivative activities
The following tables quantify the volume of Nomura�s derivative activity through a disclosure of notional amounts, in comparison with the fair value of those derivatives. All amounts are disclosed on a gross basis, prior to counterparty netting of derivative assets and liabilities and cash collateral netting against net derivatives.
�
| � | �� | Billions�of�yen | � | |||||||||||||
| � | �� | March�31,�2014 | � | |||||||||||||
| � | �� | Derivative�assets | � | �� | Derivative�liabilities | � | ||||||||||
| � | �� | Notional | � | �� | Fair�value | � | �� | Notional(1) | � | �� | Fair� value(1) | � | ||||
| Derivatives used for trading and non-trading purposes(2)(3): |
�� | �� | �� | �� | ||||||||||||
| Equity contracts |
�� | � | 15,761 | �� | �� | � | 1,922 | �� | �� | � | 14,911 | �� | �� | � | 2,254 | �� |
| Interest rate contracts |
�� | � | 1,132,306 | �� | �� | � | 19,459 | �� | �� | � | 1,098,406 | �� | �� | � | 19,249 | �� |
| Credit contracts |
�� | � | 38,136 | �� | �� | � | 1,314 | �� | �� | � | 40,310 | �� | �� | � | 1,623 | �� |
| Foreign exchange contracts |
�� | � | 108,595 | �� | �� | � | 3,312 | �� | �� | � | 113,915 | �� | �� | � | 2,938 | �� |
| Commodity contracts |
�� | � | 46 | �� | �� | � | 0 | �� | �� | � | 37 | �� | �� | � | 0 | �� |
| �� | � |
� |
� | �� | � |
� |
� | �� | � |
� |
� | �� | � |
� |
� | |
| Total |
�� | � | 1,294,844 | �� | �� | � | 26,007 | �� | �� | � | 1,267,579 | �� | �� | � | 26,064 | �� |
| �� | � |
� |
� | �� | � |
� |
� | �� | � |
� |
� | �� | � |
� |
� | |
| Derivatives designated as hedging instruments: |
�� | �� | �� | �� | ||||||||||||
| Interest rate contracts |
�� | � | 2,143 | �� | �� | � | 62 | �� | �� | � | 296 | �� | �� | � | 2 | �� |
| Foreign exchange contracts |
�� | � | 109 | �� | �� | � | 0 | �� | �� | � | 116 | �� | �� | � | 2 | �� |
| �� | � |
� |
� | �� | � |
� |
� | �� | � |
� |
� | �� | � |
� |
� | |
| Total |
�� | � | 2,252 | �� | �� | � | 62 | �� | �� | � | 412 | �� | �� | � | 4 | �� |
| �� | � |
� |
� | �� | � |
� |
� | �� | � |
� |
� | �� | � |
� |
� | |
| Total derivatives |
�� | � | 1,297,096 | �� | �� | � | 26,069 | �� | �� | � | 1,267,991 | �� | �� | � | 26,068 | �� |
| �� | � |
� |
� | �� | � |
� |
� | �� | � |
� |
� | �� | � |
� |
� | |
| � | �� | Billions�of�yen | � | |||||||||||||
| � | �� | September�30,�2014 | � | |||||||||||||
| � | �� | Derivative�assets | � | �� | Derivative�liabilities | � | ||||||||||
| � | �� | Notional | � | �� | Fair�value | � | �� | Notional(1) | � | �� | Fair� value(1) | � | ||||
| Derivatives used for trading and non-trading purposes(2)(3): |
�� | �� | �� | �� | ||||||||||||
| Equity contracts |
�� | � | 16,947 | �� | �� | � | 2,049 | �� | �� | � | 18,282 | �� | �� | � | 2,168 | �� |
| Interest rate contracts |
�� | � | 1,306,641 | �� | �� | � | 24,068 | �� | �� | � | 1,297,946 | �� | �� | � | 23,862 | �� |
| Credit contracts |
�� | � | 37,565 | �� | �� | � | 1,109 | �� | �� | � | 37,206 | �� | �� | � | 1,452 | �� |
| Foreign exchange contracts |
�� | � | 128,653 | �� | �� | � | 4,860 | �� | �� | � | 127,017 | �� | �� | � | 4,436 | �� |
| Commodity contracts |
�� | � | 38 | �� | �� | � | 0 | �� | �� | � | 31 | �� | �� | � | 0 | �� |
| �� | � |
� |
� | �� | � |
� |
� | �� | � |
� |
� | �� | � |
� |
� | |
| Total |
�� | � | 1,489,844 | �� | �� | � | 32,086 | �� | �� | � | 1,480,482 | �� | �� | � | 31,918 | �� |
| �� | � |
� |
� | �� | � |
� |
� | �� | � |
� |
� | �� | � |
� |
� | |
| Derivatives designated as hedging instruments: |
�� | �� | �� | �� | ||||||||||||
| Interest rate contracts |
�� | � | 1,919 | �� | �� | � | 63 | �� | �� | � | 241 | �� | �� | � | 1 | �� |
| Foreign exchange contracts |
�� | � | 46 | �� | �� | � | 1 | �� | �� | � | 202 | �� | �� | � | 5 | �� |
| �� | � |
� |
� | �� | � |
� |
� | �� | � |
� |
� | �� | � |
� |
� | |
| Total |
�� | � | 1,965 | �� | �� | � | 64 | �� | �� | � | 443 | �� | �� | � | 6 | �� |
| �� | � |
� |
� | �� | � |
� |
� | �� | � |
� |
� | �� | � |
� |
� | |
| Total derivatives |
�� | � | 1,491,809 | �� | �� | � | 32,150 | �� | �� | � | 1,480,925 | �� | �� | � | 31,924 | �� |
| �� | � |
� |
� | �� | � |
� |
� | �� | � |
� |
� | �� | � |
� |
� | |
�
| (1) | Includes the amount of embedded derivatives bifurcated in accordance with ASC 815. |
| (2) | Each derivative classification includes derivatives referencing multiple risk components. For example, interest rate contracts include complex derivatives referencing interest rate risk as well as foreign exchange risk or other factors such as prepayment rates. Credit contracts include credit default swaps as well as derivatives referencing corporate and government securities. |
| (3) | As of March�31, 2014 and September�30, 2014, the amounts reported include derivatives used for non-trading purposes which are not designated as fair value or net investment hedges. These amounts have not been separately presented since such amounts were not significant. |
Changes in fair value are recognized either through earnings or other comprehensive income depending on the purpose for which the derivatives are used.
�
F-46
Table of Contents
Notes to the Interim Consolidated Financial Statements�(Continued) (UNAUDITED)
�
Offsetting of derivatives
��������Counterparty credit risk associated with derivative financial instruments is controlled by Nomura through credit approvals, limits and monitoring procedures. To reduce the risk of loss, Nomura requires collateral, principally cash collateral and government securities, for certain derivative transactions. In certain cases, Nomura may agree for such collateral to be posted to a third-party custodian under a control agreement that enables Nomura to take control of such collateral in the event of counterparty default. From an economic standpoint, Nomura evaluates default risk exposure net of related collateral. Furthermore, OTC derivative transactions are typically documented under industry standard master netting agreements which reduce Nomura�s credit exposure to counterparties as they permit the close-out and offset of transactions and collateral amounts in the event of default of the counterparty. For certain OTC centrally-cleared and exchange-traded derivatives, the clearing or membership agreements entered into by Nomura provide similar rights to Nomura in the event of default of the relevant central clearing party or exchange. In order to support the enforceability of the close-out and offsetting rights within these agreements, Nomura generally seeks to obtain an external legal opinion.
For certain types of counterparties and in certain jurisdictions, Nomura may enter into derivative transactions which are not documented under a master netting agreement. Similarly, even when derivatives are documented under such agreements, Nomura may not have yet sought evidence, or may not be able to obtain evidence to determine with sufficient certainty that close-out and offsetting rights are legally enforceable. This may be the case where relevant local laws specifically prohibit such close-out and offsetting rights, or where local laws are complex, ambiguous or silent on the enforceability of such rights. This may include derivative transactions executed with certain foreign governments, agencies, municipalities, central clearing counterparties, exchanges and pension funds.
Nomura considers the enforceability of a master netting agreement in determining how credit risk arising from transactions with a specific counterparty is hedged, how counterparty credit exposures are calculated and applied to credit limits and the extent and nature of collateral requirements from the counterparty.
Derivative assets and liabilities with the same counterparty documented under a master netting agreement are offset in the consolidated balance sheets where the specific criteria defined by ASC 210-20 �Balance Sheet�Offsetting� (�ASC 210-20�) and ASC�815 are met. These criteria include requirements around the legal enforceability of such close-out and offset rights under the master netting agreement. In addition, fair value amounts recognized for the right to reclaim cash collateral (a receivable) and the obligation to return cash collateral (a payable) are also offset against net derivative liabilities and net derivative assets, respectively where certain additional criteria are met.
The following table presents information about offsetting of derivatives and related collateral amounts in the consolidated balance sheets by type of derivative contract, together with the extent to which master netting agreements entered into with counterparties, central clearing counterparties or exchanges permit additional offsetting of derivatives and collateral in the event of counterparty default. Derivative transactions which are not documented under a master netting agreement or are documented under a master netting agreement for which Nomura does not have sufficient evidence of enforceability are not offset in the following table.
�
F-47
Table of Contents
Notes to the Interim Consolidated Financial Statements�(Continued) (UNAUDITED)
�
| � | �� | Billions of yen | � | � | Billions of yen | � | ||||||||||
| � | �� | March�31, 2014 | � | � | September�30, 2014 | � | ||||||||||
| � | �� | Derivative assets |
� | � | Derivative liabilities(1) |
� | � | Derivative assets |
� | � | Derivative liabilities(1) |
� | ||||
| Equity contracts |
�� | � | � | � | ||||||||||||
| OTC settled bilaterally |
�� | � | 1,162 | �� | � | � | 1,418 | �� | � | � | 1,261 | �� | � | � | 1,401 | �� |
| OTC centrally-cleared |
�� | � | ��� | � | � | � | ��� | � | � | � | ��� | � | � | � | ��� | � |
| Exchange-traded |
�� | � | 760 | �� | � | � | 836 | �� | � | � | 788 | �� | � | � | 767 | �� |
| Interest rate contracts |
�� | � | � | � | ||||||||||||
| OTC settled bilaterally |
�� | � | 10,485 | �� | � | � | 10,281 | �� | � | � | 11,313 | �� | � | � | 11,096 | �� |
| OTC centrally-cleared |
�� | � | 9,025 | �� | � | � | 8,961 | �� | � | � | 12,797 | �� | � | � | 12,758 | �� |
| Exchange-traded |
�� | � | 11 | �� | � | � | 9 | �� | � | � | 21 | �� | � | � | 9 | �� |
| Credit contracts |
�� | � | � | � | ||||||||||||
| OTC settled bilaterally |
�� | � | 1,180 | �� | � | � | 1,491 | �� | � | � | 972 | �� | � | � | 1,321 | �� |
| OTC centrally-cleared |
�� | � | 130 | �� | � | � | 128 | �� | � | � | 132 | �� | � | � | 127 | �� |
| Exchange-traded |
�� | � | 4 | �� | � | � | 4 | �� | � | � | 5 | �� | � | � | 4 | �� |
| Foreign exchange contracts |
�� | � | � | � | ||||||||||||
| OTC settled bilaterally |
�� | � | 3,296 | �� | � | � | 2,923 | �� | � | � | 4,846 | �� | � | � | 4,426 | �� |
| OTC centrally-cleared |
�� | � | 12 | �� | � | � | 13 | �� | � | � | 11 | �� | � | � | 11 | �� |
| Exchange-traded |
�� | � | 4 | �� | � | � | 4 | �� | � | � | 4 | �� | � | � | 4 | �� |
| Commodity contracts |
�� | � | � | � | ||||||||||||
| OTC settled bilaterally |
�� | � | 0 | �� | � | � | 0 | �� | � | � | 0 | �� | � | � | 0 | �� |
| OTC centrally-cleared |
�� | � | ��� | � | � | � | ��� | � | � | � | ��� | � | � | � | ��� | � |
| Exchange-traded |
�� | � | 0 | �� | � | � | 0 | �� | � | � | 0 | �� | � | � | 0 | �� |
| �� | � |
� |
� | � | � |
� |
� | � | � |
� |
� | � | � |
� |
� | |
| Total gross derivative balances(2) |
�� | � | 26,069 | �� | � | � | 26,068 | �� | � | � | 32,150 | �� | � | � | 31,924 | �� |
| Less: Amounts offset in the consolidated balance sheets(3) |
�� | � | (23,764 | )� | � | � | (24,030 | )� | � | � | (30,054 | )� | � | � | (30,155 | )� |
| �� | � |
� |
� | � | � |
� |
� | � | � |
� |
� | � | � |
� |
� | |
| Total net amounts reported on the face of the consolidated balance sheets(4) |
�� | � | 2,305 | �� | � | � | 2,038 | �� | � | � | 2,096 | �� | � | � | 1,769 | �� |
| Less: Additional amounts not offset in the consolidated balance sheets(5) |
�� | � | � | � | ||||||||||||
| Financial instruments and non-cash collateral |
�� | � | (168 | )� | � | � | (44 | )� | � | � | (183 | )� | � | � | (20 | )� |
| Cash collateral(6) |
�� | � | (0 | )� | � | � | (0 | )� | � | � | ��� | �� | � | � | (0 | )� |
| �� | � |
� |
� | � | � |
� |
� | � | � |
� |
� | � | � |
� |
� | |
| Net amount |
�� | � | 2,137 | �� | � | � | 1,994 | �� | � | � | 1,913 | �� | � | � | 1,749 | �� |
| �� | � |
� |
� | � | � |
� |
� | � | � |
� |
� | � | � |
� |
� | |
�
| (1) | Includes the amount of embedded derivatives bifurcated in accordance with ASC 815. |
| (2) | Includes all gross derivative asset and liability balances irrespective of whether they are transacted under a master netting agreement or whether Nomura has obtained sufficient evidence of enforceability of the master netting agreement. As of March�31, 2014, the gross balance of derivative assets and derivative liabilities which are not documented under master netting agreements or are documented under master netting agreements for which Nomura has not yet obtained sufficient evidence of enforceability was �744�billion and �808 billion, respectively. As of September�30, 2014, the gross balance of such derivative assets and derivative liabilities was �1,016 billion and �1,082 billion, respectively. |
| (3) | Represents amounts offset through counterparty netting of derivative assets and liabilities as well as cash collateral netting against net derivatives under master netting and similar agreements for which Nomura has obtained sufficient evidence of enforceability in accordance with ASC 815. As of March�31, 2014, Nomura offset a total of �1,283 billion of cash collateral receivables against net derivative liabilities and �1,017�billion of cash collateral payables against net derivative assets. As of September�30, 2014, Nomura offset a total of �1,464 billion of cash collateral receivables against net derivative liabilities and �1,363 billion of cash collateral payables against net derivative assets. |
| (4) | Net derivative assets and net derivative liabilities are generally reported within Trading assets and private equity investments�Trading assets and Trading liabilities, respectively in the consolidated balance sheet. Bifurcated embedded derivatives are reported within Short-term borrowings or Long-term borrowings depending on the maturity of the underlying host contract. |
| (5) | Represents amounts which are not permitted to be offset on the face of the consolidated balance sheets in accordance with ASC 210-20 and ASC 815 but which provide Nomura with a legally enforceable right of offset in the event of counterparty default. Amounts relating to derivative and collateral agreements where Nomura has not yet obtained sufficient evidence of enforceability of such offsetting rights are excluded. |
| (6) | As of March�31, 2014, a total of �203 billion of cash collateral receivables and �643 billion of cash collateral payables, including amounts reported in the table, have not been offset against net derivatives. As of September�30, 2014, a total of �131 billion of cash collateral receivables and �583 billion of cash collateral payables, including amounts reported in the table, have not been offset against net derivatives. |
�
F-48
Table of Contents
Notes to the Interim Consolidated Financial Statements�(Continued) (UNAUDITED)
�
Derivatives used for trading purposes
Derivative financial instruments used for trading purposes, including bifurcated embedded derivatives, are carried at fair value with changes in fair value recognized through the consolidated statements of income within Revenue�Net gain on trading.
The following tables present amounts included in the consolidated statements of income related to derivatives used for trading and non-trading purposes by type of underlying derivative contract.
�
| � | �� | Billions�of�yen | � | |||||
| � | �� | Six�months�ended�September�30 | � | |||||
| � | �� | 2013 | � | � | 2014 | � | ||
| Derivatives used for trading and non-trading purposes(1)(2): |
�� | � | ||||||
| Equity contracts |
�� | � | 18 | �� | � | � | (160 | )� |
| Interest rate contracts |
�� | � | 35 | �� | � | � | (58 | )� |
| Credit contracts |
�� | � | (37 | )� | � | � | (9 | )� |
| Foreign exchange contracts |
�� | � | (119 | )� | � | � | (57 | )� |
| Commodity contracts |
�� | � | 1 | �� | � | � | 0 | �� |
| �� | � |
� |
� | � | � |
� |
� | |
| Total |
�� | � | (102 | )� | � | � | (284 | )� |
| �� | � |
� |
� | � | � |
� |
� | |
| � | �� | Billions�of�yen | � | |||||
| � | �� | Three�months�ended�September�30 | � | |||||
| � | �� | 2013 | � | � | 2014 | � | ||
| Derivatives used for trading and non-trading purposes(1)(2): |
�� | � | ||||||
| Equity contracts |
�� | � | (46 | )� | � | � | (129 | )� |
| Interest rate contracts |
�� | � | (76 | )� | � | � | 14 | �� |
| Credit contracts |
�� | � | (38 | )� | � | � | 10 | �� |
| Foreign exchange contracts |
�� | � | 40 | �� | � | � | (66 | )� |
| Commodity contracts |
�� | � | (0 | )� | � | � | 0 | �� |
| �� | � |
� |
� | � | � |
� |
� | |
| Total |
�� | � | (120 | )� | � | � | (171 | )� |
| �� | � |
� |
� | � | � |
� |
� | |
�
| (1) | Each derivative classification includes derivatives referencing multiple risk components. For example, interest rate contracts include complex derivatives referencing interest rate risk as well as foreign exchange risk or other factors such as prepayment rates. Credit contracts include credit default swaps as well as derivatives referencing corporate and government securities. |
| (2) | Includes net gains (losses) on derivatives used for non-trading purposes which are not designated as fair value or net investment hedges. For the six and three months ended September�30, 2013 and 2014, these amounts have not been separately presented as net gains (losses) for these non-trading derivatives were not significant. |
�
F-49
Table of Contents
Notes to the Interim Consolidated Financial Statements�(Continued) (UNAUDITED)
�
Fair value hedges
Nomura issues Japanese yen and foreign currency denominated debt with both fixed and floating interest rates. Nomura generally enters into swap agreements to convert fixed rate interest payments on its debt obligations to a floating rate and applies fair value hedge accounting to these instruments. Derivative financial instruments designated as fair value hedges are carried at fair value. Changes in fair value of the hedging derivatives are recognized together with those of the hedged liabilities in the consolidated statements of income within Interest expense.
The following tables present amounts included in the consolidated statements of income related to derivatives designated as fair value hedges by type of underlying derivative contract and the nature of the hedged item.
�
| � | �� | Billions�of�yen | � | |||||
| � | �� | Six�months�ended�September�30 | � | |||||
| � | �� | 2013 | � | � | 2014 | � | ||
| Derivatives designated as hedging instruments: |
�� | � | ||||||
| Interest rate contracts |
�� | � | (5 | )� | � | � | 13 | �� |
| �� | � |
� |
� | � | � |
� |
� | |
| Total |
�� | � | (5 | )� | � | � | 13 | �� |
| �� | � |
� |
� | � | � |
� |
� | |
| Hedged items: |
�� | � | ||||||
| Long-term borrowings |
�� | � | 5 | �� | � | � | (13 | )� |
| �� | � |
� |
� | � | � |
� |
� | |
| Total |
�� | � | 5 | �� | � | � | (13 | )� |
| �� | � |
� |
� | � | � |
� |
� | |
| � | �� | Billions�of�yen | � | |||||
| � | �� | Three�months�ended�September�30 | � | |||||
| � | �� | 2013 | � | � | 2014 | � | ||
| Derivatives designated as hedging instruments: |
�� | � | ||||||
| Interest rate contracts |
�� | � | 7 | �� | � | � | 3 | �� |
| �� | � |
� |
� | � | � |
� |
� | |
| Total |
�� | � | 7 | �� | � | � | 3 | �� |
| �� | � |
� |
� | � | � |
� |
� | |
| Hedged items: |
�� | � | ||||||
| Long-term borrowings |
�� | � | (7 | )� | � | � | (3 | )� |
| �� | � |
� |
� | � | � |
� |
� | |
| Total |
�� | � | (7 | )� | � | � | (3 | )� |
| �� | � |
� |
� | � | � |
� |
� | |
�
F-50
Table of Contents
Notes to the Interim Consolidated Financial Statements�(Continued) (UNAUDITED)
�
Net investment hedges
Nomura designates foreign currency forwards and foreign currency denominated long-term debt as hedges of certain subsidiaries with significant foreign exchange risks and applies hedge accounting to these instruments. Accordingly, the effective hedging portion of the foreign exchange gains (losses) arising from the derivative contracts and non-derivative financial products designated as hedges is recognized through the consolidated statements of comprehensive income within Other comprehensive income (loss)�Change in cumulative translation adjustments, net of tax. This is offset by the foreign exchange adjustments arising from consolidation of the relevant foreign subsidiaries.
The following tables present gains (losses) from derivatives and non-derivatives designated as net investment hedges included in the consolidated statements of comprehensive income.
�
| � | �� | Billions�of�yen | � | |||||
| � | �� | Six�months�ended�September�30 | � | |||||
| � | �� | 2013 | � | � | 2014 | � | ||
| Hedging instruments: |
�� | � | ||||||
| Foreign exchange contracts |
�� | � | (1 | )� | � | � | 1 | �� |
| �� | � |
� |
� | � | � |
� |
� | |
| Total |
�� | � | (1 | )� | � | � | 1 | �� |
| �� | � |
� |
� | � | � |
� |
� | |
| � | �� | Billions�of�yen | � | |||||
| � | �� | Three�months�ended�September�30 | � | |||||
| � | �� | 2013 | � | � | 2014 | � | ||
| Hedging instruments: |
�� | � | ||||||
| Foreign exchange contracts |
�� | � | (2 | )� | � | � | 6 | �� |
| �� | � |
� |
� | � | � |
� |
� | |
| Total |
�� | � | (2 | )� | � | � | 6 | �� |
| �� | � |
� |
� | � | � |
� |
� | |
�
| (1) | The portion of the gains (losses) representing the amount of hedge ineffectiveness and the amount excluded from the assessment of hedge effectiveness are recognized within Revenue�Other in the consolidated statements of income. The amount of gains (losses) was not significant during the six months ended September�30, 2013 and 2014. The amount of gains (losses) was not significant during the three months ended September�30, 2013 and 2014. |
Derivatives containing credit risk related contingent features
Nomura enters into certain OTC derivatives and other agreements containing credit risk related contingent features. These features would require Nomura to post additional collateral or settle the instrument upon occurrence of a credit event, the most common of which would be a downgrade in the Company�s long-term credit rating.
The aggregate fair value of all derivative instruments with credit risk related contingent features that were in a liability position as of March�31, 2014, was �973 billion with related collateral pledged of �747 billion. In the event of a one-notch downgrade to Nomura�s long-term credit rating in effect as of March�31, 2014, the aggregate fair value of assets that would have been required to be posted as additional collateral or that would have been needed to settle the instruments immediately was �102 billion.
The aggregate fair value of all derivative instruments with credit risk related contingent features that were in a liability position as of September�30, 2014, was �957 billion with related collateral pledged of �829 billion. In the event of a one-notch downgrade to Nomura�s long-term credit rating in effect as of September�30, 2014, the aggregate fair value of assets that would have been required to be posted as additional collateral or that would have been needed to settle the instruments immediately was �64 billion.
�
F-51
Table of Contents
Notes to the Interim Consolidated Financial Statements�(Continued) (UNAUDITED)
�
Credit derivatives
Credit derivatives are derivative instruments in which one or more of their underlyings are related to the credit risk of a specified entity (or group of entities) or an index based on the credit risk of a group of entities that expose the seller of credit protection to potential loss from credit risk related events specified in the contract.
Written credit derivatives are instruments or embedded features where Nomura assumes third party credit risk, either as guarantor in a guarantee-type contract, or as the party that provides credit protection in an option-type contract, credit default swap, or any other credit derivative contract.
Nomura enters into credit derivatives as part of its normal trading activities as both purchaser and seller of protection for credit risk mitigation, proprietary trading positions and for client transactions.
The most significant type of credit derivatives used by Nomura are single-name credit default swaps where settlement of the derivative is based on the credit risk of a single third party. Nomura also writes credit derivatives linked to the performance of credit default indices and issues other credit risk related portfolio products.
Nomura would have to perform under a credit derivative contract if a credit event as defined in the respective contract occurs. Typical credit events include bankruptcy, failure to pay and restructuring of obligations of the reference asset.
Credit derivative contracts written by Nomura are either cash or physically settled. In cash-settled instruments, once payment is made upon an event of a default, the contract usually terminates with no further payments due. Nomura generally has no right to assume the reference assets of the counterparty in exchange for payment, nor does Nomura usually have any direct recourse to the actual issuers of the reference assets to recover the amount paid. In physically settled contracts, upon a default event, Nomura takes delivery of the reference asset in return for payment of the full notional amount of the contract.
Nomura actively monitors and manages its credit derivative exposures. Where protection is sold, risks may be mitigated by purchasing credit protection from other third parties either on identical underlying reference assets or on underlying reference assets with the same issuer which would be expected to behave in a correlated fashion. The most common form of recourse provision to enable Nomura to recover from third parties any amounts paid under a written credit derivative is therefore not through the derivative itself but rather through the separate purchase of credit derivatives with identical or correlated underlyings.
Nomura quantifies the value of these purchased contracts in the following tables in the column titled �Purchased Credit Protection.� These amounts represent purchased credit protection with identical underlyings to the written credit derivative contracts which act as a hedge against Nomura�s exposure. To the extent Nomura is required to pay out under the written credit derivative, a similar amount would generally become due to Nomura under the purchased hedge.
Credit derivatives have a stated notional amount which represents the maximum payment Nomura may be required to make under the contract. However, this is generally not a true representation of the amount Nomura will actually pay as in addition to purchased credit protection, other risk mitigating factors reduce the likelihood and amount of any payment, including:
The probability of default: Nomura values credit derivatives taking into account the probability that the underlying reference asset will default and that Nomura will be required to make payments under the contract. Based on historical experience and Nomura�s assessment of the market, Nomura believes that the probability that all reference assets on which Nomura provides protection will default in a single period is remote. The disclosed notional amount, therefore, significantly overstates Nomura�s realistic exposure on these contracts.
The recovery value on the underlying asset: In the case of a default, Nomura�s liability on a contract is limited to the difference between the notional amount and the recovery value of the underlying reference asset. While the recovery value on a defaulted asset may be minimal, this does reduce amounts paid on these contracts.
Nomura holds assets as collateral in relation to written credit derivatives. However, these amounts do not enable Nomura to recover any amounts paid under the credit derivative but rather mitigate the risk of economic loss arising from a counterparty defaulting against amounts due to Nomura under the contract. Collateral requirements are determined on a counterparty level rather than individual contract, and also generally cover all types of derivative contracts rather than just credit derivatives.
�
F-52
Table of Contents
Notes to the Interim Consolidated Financial Statements�(Continued) (UNAUDITED)
�
The following tables present information about Nomura�s written credit derivatives and purchased credit protection with identical underlyings as of March�31, 2014 and September�30, 2014.
�
| � | �� | Billions of yen | � | |||||||||||||||||||||||||
| � | �� | March�31, 2014 | � | |||||||||||||||||||||||||
| � | �� | � | � | � | Maximum potential payout/Notional | � | �� | Notional | � | |||||||||||||||||||
| � | �� | Carrying�
value (Asset)�/�Liability(1) |
� | � | Total | � | �� | Years to maturity | � | �� | Purchased credit protection |
� | ||||||||||||||||
| � | �� | � | �� | Less�than 1 year |
� | �� | 1 to 3 years |
� | �� | 3�to�5 years |
� | �� | More�than 5 years |
� | �� | |||||||||||||
| Single-name credit default swaps |
�� | � | (235 | )� | � | � | 21,070 | �� | �� | � | 4,167 | �� | �� | � | 8,306 | �� | �� | � | 6,610 | �� | �� | � | 1,987 | �� | �� | � | 18,689 | �� |
| Credit default indices |
�� | � | (32 | )� | � | � | 9,082 | �� | �� | � | 1,215 | �� | �� | � | 3,552 | �� | �� | � | 3,582 | �� | �� | � | 733 | �� | �� | � | 7,704 | �� |
| Other credit risk related portfolio products |
�� | � | 123 | �� | � | � | 1,574 | �� | �� | � | 523 | �� | �� | � | 398 | �� | �� | � | 201 | �� | �� | � | 452 | �� | �� | � | 1,097 | �� |
| Credit risk related options and swaptions |
�� | � | (1 | )� | � | � | 676 | �� | �� | � | ��� | � | �� | � | ��� | � | �� | � | 504 | �� | �� | � | 172 | �� | �� | � | 548 | �� |
| �� | � |
� |
� | � | � |
� |
� | �� | � |
� |
� | �� | � |
� |
� | �� | � |
� |
� | �� | � |
� |
� | �� | � |
� |
� | |
| Total |
�� | � | (145 | )� | � | � | 32,402 | �� | �� | � | 5,905 | �� | �� | � | 12,256 | �� | �� | � | 10,897 | �� | �� | � | 3,344 | �� | �� | � | 28,038 | �� |
| �� | � |
� |
� | � | � |
� |
� | �� | � |
� |
� | �� | � |
� |
� | �� | � |
� |
� | �� | � |
� |
� | �� | � |
� |
� | |
| � | �� | Billions of yen | � | |||||||||||||||||||||||||
| � | �� | September�30, 2014 | � | |||||||||||||||||||||||||
| � | �� | � | � | � | Maximum potential payout/Notional | � | �� | Notional | � | |||||||||||||||||||
| � | �� | Carrying�
value (Asset)�/�Liability(1) |
� | � | Total | � | �� | Years to maturity | � | �� | Purchased credit protection |
� | ||||||||||||||||
| � | �� | � | �� | Less�than 1� year |
� | �� | 1�to�3 years |
� | �� | 3�to�5 years |
� | �� | More�than 5 years |
� | �� | |||||||||||||
| Single-name credit default swaps |
�� | � | (196 | )� | � | � | 21,039 | �� | �� | � | 4,214 | �� | �� | � | 8,480 | �� | �� | � | 6,589 | �� | �� | � | 1,756 | �� | �� | � | 18,785 | �� |
| Credit default indices |
�� | � | (36 | )� | � | � | 8,964 | �� | �� | � | 1,771 | �� | �� | � | 3,110 | �� | �� | � | 3,574 | �� | �� | � | 509 | �� | �� | � | 8,078 | �� |
| Other credit risk related portfolio products |
�� | � | (9 | )� | � | � | 1,008 | �� | �� | � | 532 | �� | �� | � | 225 | �� | �� | � | 236 | �� | �� | � | 15 | �� | �� | � | 622 | �� |
| Credit risk related options and swaptions |
�� | � | 1 | �� | � | � | 725 | �� | �� | � | ��� | � | �� | � | ��� | � | �� | � | 725 | �� | �� | � | ��� | � | �� | � | 519 | �� |
| �� | � |
� |
� | � | � |
� |
� | �� | � |
� |
� | �� | � |
� |
� | �� | � |
� |
� | �� | � |
� |
� | �� | � |
� |
� | |
| Total |
�� | � | (240 | )� | � | � | 31,736 | �� | �� | � | 6,517 | �� | �� | � | 11,815 | �� | �� | � | 11,124 | �� | �� | � | 2,280 | �� | �� | � | 28,004 | �� |
| �� | � |
� |
� | � | � |
� |
� | �� | � |
� |
� | �� | � |
� |
� | �� | � |
� |
� | �� | � |
� |
� | �� | � |
� |
� | |
�
| (1) | Carrying value amounts are shown on a gross basis prior to cash collateral or counterparty netting. Asset balances represent positive fair value amounts caused by tightening of credit spreads of underlyings since inception of the credit derivative contracts. |
The following tables present information about Nomura�s written credit derivatives by external credit rating of the underlying asset. Ratings are based on Standard�& Poor�s Financial Services LLC (�S&P�), or if not rated by S&P, based on Moody�s Investors Service, Inc. If ratings from either of these agencies are not available, the ratings are based on Fitch Ratings Ltd. or Japan Credit Rating Agency, Ltd. For credit default indices, the rating is determined by taking the weighted average of the external credit ratings given for each of the underlying reference entities comprising the portfolio or index.
�
| � | �� | Billions of yen | � | |||||||||||||||||||||||||
| � | �� | March�31, 2014 | � | |||||||||||||||||||||||||
| � | �� | Maximum potential payout/Notional | � | |||||||||||||||||||||||||
| � | �� | AAA | � | �� | AA | � | �� | A | � | �� | BBB | � | �� | BB | � | �� | Other(1) | � | �� | Total | � | |||||||
| Single-name credit default swaps |
�� | � | 2,125 | �� | �� | � | 1,331 | �� | �� | � | 5,232 | �� | �� | � | 7,362 | �� | �� | � | 3,231 | �� | �� | � | 1,789 | �� | �� | � | 21,070 | �� |
| Credit default indices |
�� | � | 86 | �� | �� | � | 23 | �� | �� | � | 4,445 | �� | �� | � | 2,884 | �� | �� | � | 1,341 | �� | �� | � | 303 | �� | �� | � | 9,082 | �� |
| Other credit risk related portfolio products |
�� | � | 22 | �� | �� | � | ��� | � | �� | � | 1 | �� | �� | � | ��� | � | �� | � | 4 | �� | �� | � | 1,547 | �� | �� | � | 1,574 | �� |
| Credit risk related options and swaptions |
�� | � | ��� | � | �� | � | ��� | � | �� | � | 387 | �� | �� | � | 195 | �� | �� | � | 94 | �� | �� | � | ��� | � | �� | � | 676 | �� |
| �� | � |
� |
� | �� | � |
� |
� | �� | � |
� |
� | �� | � |
� |
� | �� | � |
� |
� | �� | � |
� |
� | �� | � |
� |
� | |
| Total |
�� | � | 2,233 | �� | �� | � | 1,354 | �� | �� | � | 10,065 | �� | �� | � | 10,441 | �� | �� | � | 4,670 | �� | �� | � | 3,639 | �� | �� | � | 32,402 | �� |
| �� | � |
� |
� | �� | � |
� |
� | �� | � |
� |
� | �� | � |
� |
� | �� | � |
� |
� | �� | � |
� |
� | �� | � |
� |
� | |
| � | �� | Billions of yen | � | |||||||||||||||||||||||||
| � | �� | September�30, 2014 | � | |||||||||||||||||||||||||
| � | �� | Maximum potential payout/Notional | � | |||||||||||||||||||||||||
| � | �� | AAA | � | �� | AA | � | �� | A | � | �� | BBB | � | �� | BB | � | �� | Other(1) | � | �� | Total | � | |||||||
| Single-name credit default swaps |
�� | � | 2,231 | �� | �� | � | 1,536 | �� | �� | � | 4,986 | �� | �� | � | 7,474 | �� | �� | � | 2,951 | �� | �� | � | 1,861 | �� | �� | � | 21,039 | �� |
| Credit default indices |
�� | � | 82 | �� | �� | � | 25 | �� | �� | � | 4,347 | �� | �� | � | 2,999 | �� | �� | � | 1,256 | �� | �� | � | 255 | �� | �� | � | 8,964 | �� |
| Other credit risk related portfolio products |
�� | � | 35 | �� | �� | � | ��� | � | �� | � | 9 | �� | �� | � | 820 | �� | �� | � | 27 | �� | �� | � | 117 | �� | �� | � | 1,008 | �� |
| Credit risk related options and swaptions |
�� | � | ��� | � | �� | � | ��� | � | �� | � | 585 | �� | �� | � | 55 | �� | �� | � | 85 | �� | �� | � | ��� | � | �� | � | 725 | �� |
| �� | � |
� |
� | �� | � |
� |
� | �� | � |
� |
� | �� | � |
� |
� | �� | � |
� |
� | �� | � |
� |
� | �� | � |
� |
� | |
| Total |
�� | � | 2,348 | �� | �� | � | 1,561 | �� | �� | � | 9,927 | �� | �� | � | 11,348 | �� | �� | � | 4,319 | �� | �� | � | 2,233 | �� | �� | � | 31,736 | �� |
| �� | � |
� |
� | �� | � |
� |
� | �� | � |
� |
� | �� | � |
� |
� | �� | � |
� |
� | �� | � |
� |
� | �� | � |
� |
� | |
�
| (1) | �Other� includes credit derivatives where the credit rating of the underlying reference asset is below investment grade or where a rating is unavailable. |
�
F-53
Table of Contents
Notes to the Interim Consolidated Financial Statements�(Continued) (UNAUDITED)
�
4. Collateralized transactions:
Nomura enters into collateralized transactions, including reverse repurchase agreements, repurchase agreements, securities borrowing transactions, securities lending transactions, and other secured borrowings mainly to meet clients� needs, finance trading inventory positions and obtain securities for settlements. These transactions are typically documented under industry standard master netting agreements which reduce Nomura�s credit exposure to counterparties as they permit the close-out and offset of transactions and collateral amounts in the event of default of the counterparty. For certain centrally-cleared reverse repurchase and repurchase agreements, the clearing or membership agreements entered into by Nomura provide similar rights to Nomura in the event of default of the relevant central clearing counterparty. In order to support the enforceability of the close-out and offsetting rights within these agreements, Nomura generally seeks to obtain an external legal opinion.
For certain types of counterparty and in certain jurisdictions, Nomura may enter into reverse repurchase agreements, repurchase agreements, securities borrowing and securities lending transactions which are not documented under a master netting agreement. Similarly, even when these transactions are documented under such agreements, Nomura may not have yet sought evidence, or may not be able to obtain evidence to determine with sufficient certainty that the close-out and offsetting rights are legally enforceable. This may be the case where relevant local laws specifically prohibit such close-out and offsetting rights, or where local laws are complex, ambiguous or silent on the enforceability of such rights. This may include reverse repurchase agreements, repurchase agreements, securities borrowing and securities lending transactions executed with certain foreign governments, agencies, municipalities, central clearing counterparties, agent banks and pension funds.
Nomura considers the enforceability of a master netting agreement in determining how credit risk arising from transactions with a specific counterparty is hedged, how counterparty credit exposures are calculated and applied to credit limits and the extent and nature of collateral requirements from the counterparty.
In all of these transactions, Nomura either receives or provides collateral, including Japanese and non-Japanese government, agency, mortgage-backed, bank and corporate debt securities and equities. In most cases, Nomura is permitted to use the securities received to enter into repurchase agreements, enter into securities lending transactions or to cover short positions with counterparties. In repurchase and reverse repurchase agreements, the value of collateral typically exceeds the amount of cash transferred. Collateral is generally in the form of securities. Securities borrowing transactions generally require Nomura to provide the counterparty with collateral in the form of cash or other securities. For securities lending transactions, Nomura generally receives collateral in the form of cash or other securities. Nomura monitors the market value of the securities either received from or provided to the counterparty. Additional cash or securities are exchanged as necessary, to ensure that such transactions are adequately collateralized throughout the life of the transactions.
Reverse repurchase agreements and repurchase agreements, securities borrowing and lending transactions with the same counterparty documented under a master netting agreement are offset in the consolidated balance sheets where the specific criteria defined by ASC 210-20 are met. These criteria include requirements around the maturity of the transactions, the underlying systems on which the collateral is settled, associated banking arrangements and the legal enforceability of close-out and offsetting rights under the master netting agreement.
�
F-54
Table of Contents
Notes to the Interim Consolidated Financial Statements�(Continued) (UNAUDITED)
�
The following tables present information about offsetting of these transactions in the consolidated balance sheets, together with the extent to which master netting agreements entered into with counterparties and central clearing parties permit additional offsetting in the event of counterparty default. Transactions which are not documented under a master netting agreement or are documented under a master netting agreement for which Nomura does not have sufficient evidence of enforceability are not offset in the following table.
�
| � | �� | Billions of yen | � | |||||||||||||
| � | �� | March�31, 2014 | � | |||||||||||||
| � | �� | Assets | � | � | Liabilities | � | ||||||||||
| � | �� | Reverse repurchase agreements |
� | � | Securities borrowing transactions |
� | � | Repurchase agreements |
� | � | Securities lending transactions |
� | ||||
| Total gross balance(1) |
�� | � | 20,244 | �� | � | � | 7,729 | �� | � | � | 24,564 | �� | � | � | 2,602 | �� |
| Less: Amounts offset in the consolidated balance sheets(2) |
�� | � | (10,626 | )� | � | � | (5 | )� | � | � | (10,626 | )� | � | � | (5 | )� |
| �� | � |
� |
� | � | � |
� |
� | � | � |
� |
� | � | � |
� |
� | |
| Total net amounts of reported on the face of the consolidated balance sheets(3) |
�� | � | 9,618 | �� | � | � | 7,724 | �� | � | � | 13,938 | �� | � | � | 2,597 | �� |
| �� | � |
� |
� | � | � |
� |
� | � | � |
� |
� | � | � |
� |
� | |
| Less: Additional amounts not offset in the consolidated balance sheets(4) |
�� | � | � | � | ||||||||||||
| Financial instruments and non-cash collateral |
�� | � | (7,930 | )� | � | � | (5,725 | )� | � | � | (9,867 | )� | � | � | (2,235 | )� |
| Cash collateral |
�� | � | (0 | )� | � | � | ��� | � | � | � | (0 | )� | � | � | ��� | � |
| �� | � |
� |
� | � | � |
� |
� | � | � |
� |
� | � | � |
� |
� | |
| Net amount |
�� | � | 1,688 | �� | � | � | 1,999 | �� | � | � | 4,071 | �� | � | � | 362 | �� |
| �� | � |
� |
� | � | � |
� |
� | � | � |
� |
� | � | � |
� |
� | |
�
| � | �� | Billions of yen | � | |||||||||||||
| � | �� | September�30, 2014 | � | |||||||||||||
| � | �� | Assets | � | � | Liabilities | � | ||||||||||
| � | �� | Reverse repurchase agreements |
� | � | Securities borrowing transactions |
� | � | Repurchase agreements |
� | � | Securities lending transactions |
� | ||||
| Total gross balance(1) |
�� | � | 25,319 | �� | � | � | 8,161 | �� | � | � | 30,897 | �� | � | � | 2,895 | �� |
| Less: Amounts offset in the consolidated balance sheets(2) |
�� | � | (17,019 | )� | � | � | (98 | )� | � | � | (17,019 | )� | � | � | (98 | )� |
| �� | � |
� |
� | � | � |
� |
� | � | � |
� |
� | � | � |
� |
� | |
| Total net amounts of reported on the face of the consolidated balance sheets(3) |
�� | � | 8,300 | �� | � | � | 8,063 | �� | � | � | 13,878 | �� | � | � | 2,797 | �� |
| �� | � |
� |
� | � | � |
� |
� | � | � |
� |
� | � | � |
� |
� | |
| Less: Additional amounts not offset in the consolidated balance sheets(4) |
�� | � | � | � | ||||||||||||
| Financial instruments and non-cash collateral |
�� | � | (6,716 | )� | � | � | (6,196 | )� | � | � | (11,840 | )� | � | � | (2,565 | )� |
| Cash collateral |
�� | � | (0 | )� | � | � | ��� | � | � | � | ��� | � | � | � | ��� | � |
| �� | � |
� |
� | � | � |
� |
� | � | � |
� |
� | � | � |
� |
� | |
| Net amount |
�� | � | 1,584 | �� | � | � | 1,867 | �� | � | � | 2,038 | �� | � | � | 232 | �� |
| �� | � |
� |
� | � | � |
� |
� | � | � |
� |
� | � | � |
� |
� | |
�
| (1) | Includes all recognized balances irrespective of whether they are transacted under a master netting agreement or whether Nomura has obtained sufficient evidence of enforceability of the master netting agreement. Amounts include transactions carried at fair value through election of the fair value option and amounts carried at amortized cost. As of March�31, 2014, the gross balance of reverse repurchase agreements and repurchase agreements which were not transacted under master netting agreements or are documented under master netting agreements for which Nomura has not yet obtained sufficient evidence of enforceability was �1,278 billion and �3,918 billion, respectively. As of March�31, 2014, the gross balance of securities borrowing transactions and securities lending transactions which were not transacted under master netting agreements or are documented under master netting agreements for which Nomura has not yet obtained sufficient evidence of enforceability was �1,751 billion and �137 billion, respectively. As of September�30, 2014, the gross balance of reverse repurchase agreements and repurchase agreements which were not transacted under master netting agreements or are documented under master netting agreements for which Nomura has not yet obtained sufficient evidence of enforceability was �1,354 billion and �1,856 billion, respectively. As of September�30, 2014, the gross balance of securities borrowing transactions and securities lending transactions which were not transacted under master netting agreements or are documented under master netting agreements for which Nomura has not yet obtained sufficient evidence of enforceability was �1,812 billion and �128 billion, respectively. |
| (2) | Represents amounts offset through counterparty netting under master netting and similar agreements for which Nomura has obtained sufficient evidence of enforceability in accordance with ASC 210-20. Amounts offset include transactions carried at fair value through election of the fair value option and amounts carried at amortized cost. |
| (3) | Reverse repurchase agreements and securities borrowing transactions are reported within Collateralized agreements�Securities purchased under agreements to resell and Collateralized agreements�Securities borrowed in the consolidated balance sheets, respectively. Repurchase agreements and securities lending transactions are reported within Collateralized financing�Securities sold under agreements to repurchase and Collateralized financing�Securities loaned in the consolidated balance sheets, respectively. Amounts reported under securities lending transactions also include transactions where Nomura lends securities and receives securities that can be sold or pledged as collateral. Nomura recognizes the securities received at fair value and a liability for the same amount, representing the obligation to return those securities. The liability is reported within Other liabilities in the consolidated balance sheets. |
| (4) | Represents amounts which are not permitted to be offset on the face of the balance sheet in accordance with ASC 210-20 but which provide Nomura with the right of offset in the event of counterparty default. Amounts relating to agreements where Nomura has not yet obtained sufficient evidence of enforceability of such offsetting rights are excluded. |
�
F-55
Table of Contents
Notes to the Interim Consolidated Financial Statements�(Continued) (UNAUDITED)
�
The fair value of securities received as collateral, securities borrowed with collateral and securities borrowed without collateral which Nomura is permitted to sell or repledge and the portion that has been sold or repledged are as follows.
�
| � | �� | Billions of yen | � | |||||
| � | �� | March�31,�2014 | � | �� | September�30,�2014 | � | ||
| The fair value of securities received as collateral, securities borrowed as collateral and securities borrowed without collateral where Nomura is permitted by contract or custom to sell or repledge the securities |
�� | � | 35,530 | �� | �� | � | 44,108 | �� |
| The portion of the above that has been sold (reported within Trading liabilities in the consolidated balance sheets) or repledged |
�� | � | 28,959 | �� | �� | � | 37,689 | �� |
Nomura pledges firm-owned securities to collateralize repurchase agreements and other secured financings. Pledged securities that can be sold or repledged by the secured party, including Gensaki Repo transactions, are reported in parentheses as Securities pledged as collateral within Trading assets in the consolidated balance sheets. Assets owned, which have been pledged as collateral, primarily to stock exchanges and clearing organizations, without allowing the secured party the right to sell or repledge them, are summarized in the tables below.
�
| � | �� | Millions of yen | � | |||||
| � | �� | March�31,�2014 | � | �� | September�30,�2014 | � | ||
| Trading assets: |
�� | �� | ||||||
| Equities and convertible securities |
�� | � | 174,753 | �� | �� | � | 105,175 | �� |
| Government and government agency securities |
�� | � | 991,430 | �� | �� | � | 1,011,454 | �� |
| Bank and corporate debt securities |
�� | � | 150,183 | �� | �� | � | 211,059 | �� |
| Commercial mortgage-backed securities (�CMBS�) |
�� | � | 35,671 | �� | �� | � | 27,211 | �� |
| Residential mortgage-backed securities (�RMBS�) |
�� | � | 1,141,726 | �� | �� | � | 969,507 | �� |
| Collateralized debt obligations (�CDO�) and other(1) |
�� | � | 82,237 | �� | �� | � | 90,687 | �� |
| Investment trust funds and other |
�� | � | 18,503 | �� | �� | � | 60,836 | �� |
| �� | � |
� |
� | �� | � |
� |
� | |
| Total |
�� | � | 2,594,503 | �� | �� | � | 2,475,929 | �� |
| �� | � |
� |
� | �� | � |
� |
� | |
| Deposits with stock exchanges and other segregated cash |
�� | � | 4,630 | �� | �� | � | ��� | � |
| Non-trading debt securities |
�� | � | 42,087 | �� | �� | � | 43,634 | �� |
| Investments in and advances to affiliated companies |
�� | � | 28,642 | �� | �� | � | 29,726 | �� |
�
| (1) | Includes CLO and ABS (such as on credit card loans, auto loans and student loans). |
Assets subject to lien, except for those disclosed above, are as follows:
�
| � | �� | Millions of yen | � | |||||
| � | �� | March�31,�2014 | � | �� | September�30,�2014 | � | ||
| Loans and receivables |
�� | � | 141 | �� | �� | � | 337 | �� |
| Trading assets |
�� | � | 1,293,036 | �� | �� | � | 1,591,116 | �� |
| Office buildings, land, equipment and facilities |
�� | � | 5,236 | �� | �� | � | 5,397 | �� |
| Non-trading debt securities |
�� | � | 370,239 | �� | �� | � | 328,929 | �� |
| Other |
�� | � | 78 | �� | �� | � | ��� | � |
| �� | � |
� |
� | �� | � |
� |
� | |
| Total |
�� | � | 1,668,730 | �� | �� | � | 1,925,779 | �� |
| �� | � |
� |
� | �� | � |
� |
� | |
Assets in the above table were primarily pledged for secured borrowings, including other secured borrowings, collateralized borrowings of consolidated VIEs and trading balances of secured borrowings, and derivative transactions.
�
F-56
Table of Contents
Notes to the Interim Consolidated Financial Statements�(Continued) (UNAUDITED)
�
5. Non-trading securities:
The following tables present information regarding the cost and/or amortized cost, gross unrealized gains and losses and fair value of non-trading securities held by Nomura�s insurance subsidiary as of March�31, 2014 and September�30, 2014.
�
| � | �� | Millions of yen | � | |||||||||||||
| � | �� | March�31, 2014 | � | |||||||||||||
| � | �� | Cost�and/or amortized�cost |
� | �� | Unrealized�gains and losses | � | �� | Fair�value | � | |||||||
| � | �� | �� | Gross�unrealized�gains | � | �� | Gross�unrealized�losses | � | �� | ||||||||
| Government, agency and municipal securities(1) |
�� | � | 138,973 | �� | �� | � | 842 | �� | �� | � | 86 | �� | �� | � | 139,729 | �� |
| Other debt securities(2) |
�� | � | 129,311 | �� | �� | � | 6,851 | �� | �� | � | 91 | �� | �� | � | 136,071 | �� |
| Equity securities |
�� | � | 38,157 | �� | �� | � | 14,508 | �� | �� | � | 43 | �� | �� | � | 52,622 | �� |
| �� | � |
� |
� | �� | � |
� |
� | �� | � |
� |
� | �� | � |
� |
� | |
| Total |
�� | � | 306,441 | �� | �� | � | 22,201 | �� | �� | � | 220 | �� | �� | � | 328,422 | �� |
| �� | � |
� |
� | �� | � |
� |
� | �� | � |
� |
� | �� | � |
� |
� | |
�
| � | �� | Millions of yen | � | |||||||||||||
| � | �� | September�30, 2014 | � | |||||||||||||
| � | �� | Cost�and/or amortized�cost |
� | �� | Unrealized�gains and losses | � | �� | Fair�value | � | |||||||
| � | �� | �� | Gross�unrealized�gains | � | �� | Gross�unrealized�losses | � | �� | ||||||||
| Government, agency and municipal securities(1) |
�� | � | 112,688 | �� | �� | � | 2,375 | �� | �� | � | 30 | �� | �� | � | 115,033 | �� |
| Other debt securities(2) |
�� | � | 154,367 | �� | �� | � | 12,140 | �� | �� | � | 153 | �� | �� | � | 166,354 | �� |
| Equity securities |
�� | � | 39,244 | �� | �� | � | 17,382 | �� | �� | � | 21 | �� | �� | � | 56,605 | �� |
| �� | � |
� |
� | �� | � |
� |
� | �� | � |
� |
� | �� | � |
� |
� | |
| Total |
�� | � | 306,299 | �� | �� | � | 31,897 | �� | �� | � | 204 | �� | �� | � | 337,992 | �� |
| �� | � |
� |
� | �� | � |
� |
� | �� | � |
� |
� | �� | � |
� |
� | |
�
| (1) | Primarily Japanese government, agency and municipal securities. |
| (2) | Primarily corporate debt securities. |
For the six months ended September�30, 2013, non-trading securities of �98,421�million were disposed of resulting in �1,822�million of realized gains and �42�million of realized losses. Total proceeds received from these disposals were �100,201 million. For the six months ended September�30, 2014, non-trading securities of �42,320�million were disposed of resulting in �463�million of realized gains and �13�million of realized losses. Total proceeds received from these disposals were �42,770 million.
For the three months ended September�30, 2013, non-trading securities of �57,259�million were disposed of resulting in �247�million of realized gains and �33�million of realized losses. Total proceeds received from these disposals were �57,473 million. For the three months ended September�30, 2014, non-trading securities of �27,652�million were disposed of resulting in �364�million of realized gains and �11�million of realized losses. Total proceeds received from these disposals were �28,005 million.
Related gains and losses were computed using the average method. For the six months ended September�30, 2014, there were no transfers of non-trading securities to trading assets.
The following table presents the fair value of residual contractual maturity of non-trading debt securities as of September�30, 2014. Actual maturities may differ from contractual maturities as certain securities contain features that allow redemption of the securities prior to their contractual maturity.
�
| � | �� | Millions�of�yen | � | |||||||||||||||||
| � | �� | September�30,�2014 | � | |||||||||||||||||
| � | �� | Total | � | �� | Years to maturity | � | ||||||||||||||
| � | �� | �� | Less�than�1�year | � | �� | 1�to�5�years | � | �� | 5�to�10�years | � | �� | More�than�10�years | � | |||||||
| Non-trading debt securities |
�� | � | 281,387 | �� | �� | � | 36,950 | �� | �� | � | 127,172 | �� | �� | � | 83,325 | �� | �� | � | 33,940 | �� |
�
F-57
Table of Contents
Notes to the Interim Consolidated Financial Statements�(Continued) (UNAUDITED)
�
The following tables present the fair value and gross unrealized losses of non-trading securities aggregated by the length of time that individual securities have been in a continuous unrealized loss position as of March�31, 2014 and September�30, 2014.
�
| � | �� | Millions of yen | � | |||||||||||||||||||||
| � | �� | March�31, 2014 | � | |||||||||||||||||||||
| � | �� | Less than 12 months | � | �� | More than 12 months | � | �� | Total | � | |||||||||||||||
| � | �� | Fair�value | � | �� | Gross unrealized losses |
� | �� | Fair�value | � | �� | Gross unrealized losses |
� | �� | Fair�value | � | �� | Gross unrealized losses |
� | ||||||
| Government, agency and municipal securities |
�� | � | 54,007 | �� | �� | � | 82 | �� | �� | � | 2,294 | �� | �� | � | 4 | �� | �� | � | 56,301 | �� | �� | � | 86 | �� |
| Other debt securities |
�� | � | 8,106 | �� | �� | � | 91 | �� | �� | � | ��� | �� | �� | � | ��� | �� | �� | � | 8,106 | �� | �� | � | 91 | �� |
| Equity securities |
�� | � | 498 | �� | �� | � | 43 | �� | �� | � | ��� | �� | �� | � | ��� | �� | �� | � | 498 | �� | �� | � | 43 | �� |
| �� | � |
� |
� | �� | � |
� |
� | �� | � |
� |
� | �� | � |
� |
� | �� | � |
� |
� | �� | � |
� |
� | |
| Total |
�� | � | 62,611 | �� | �� | � | 216 | �� | �� | � | 2,294 | �� | �� | � | 4 | �� | �� | � | 64,905 | �� | �� | � | 220 | �� |
| �� | � |
� |
� | �� | � |
� |
� | �� | � |
� |
� | �� | � |
� |
� | �� | � |
� |
� | �� | � |
� |
� | |
| � | �� | Millions of yen | � | |||||||||||||||||||||
| � | �� | September�30, 2014 | � | |||||||||||||||||||||
| � | �� | Less than 12 months | � | �� | More than 12 months | � | �� | Total | � | |||||||||||||||
| � | �� | Fair�value | � | �� | Gross unrealized losses |
� | �� | Fair�value | � | �� | Gross unrealized losses |
� | �� | Fair�value | � | �� | Gross unrealized losses |
� | ||||||
| Government, agency and municipal securities |
�� | � | 21,553 | �� | �� | � | 30 | �� | �� | � | 0 | �� | �� | � | 0 | �� | �� | � | 21,553 | �� | �� | � | 30 | �� |
| Other debt securities |
�� | � | 11,748 | �� | �� | � | 153 | �� | �� | � | ��� | �� | �� | � | ��� | �� | �� | � | 11,748 | �� | �� | � | 153 | �� |
| Equity securities |
�� | � | 1,504 | �� | �� | � | 21 | �� | �� | � | ��� | �� | �� | � | ��� | �� | �� | � | 1,504 | �� | �� | � | 21 | �� |
| �� | � |
� |
� | �� | � |
� |
� | �� | � |
� |
� | �� | � |
� |
� | �� | � |
� |
� | �� | � |
� |
� | |
| Total |
�� | � | 34,805 | �� | �� | � | 204 | �� | �� | � | 0 | �� | �� | � | 0 | �� | �� | � | 34,805 | �� | �� | � | 204 | �� |
| �� | � |
� |
� | �� | � |
� |
� | �� | � |
� |
� | �� | � |
� |
� | �� | � |
� |
� | �� | � |
� |
� | |
As of March�31, 2014, the total number of non-trading securities in unrealized loss positions was approximately 60. As of September�30, 2014, the total number of non-trading securities in unrealized loss positions was approximately 20.
Where the fair value of non-trading securities held by the insurance subsidiary has declined below amortized cost, these are assessed to determine whether the decline in fair value is other-than-temporary in nature. Nomura considers quantitative and qualitative factors including the length of time and extent to which fair value has been less than amortized cost, the financial condition and near-term prospects of the issuer and Nomura�s intent and ability to hold the securities for a period of time sufficient to allow for any anticipated recovery in fair value. If an other-than-temporary impairment loss exists, for equity securities, the security is written down to fair value, with the entire difference between fair value and amortized cost recognized within Revenue�Other in the consolidated statements of income. For debt securities, an other-than-temporary impairment loss is also recognized within Revenue�Other in the consolidated statements of income if Nomura intends to sell the debt security or it is more-likely-than-not that Nomura will be required to sell the debt security before recovery of amortized cost. If Nomura does not expect to sell or be required to sell the debt security, only the credit loss component of an other-than-temporary impairment loss is recognized through earnings and any non-credit loss component recognized within Other comprehensive income (loss).
For the six and three months ended September�30, 2013, other-than-temporary impairment losses recognized for the certain non-trading equity securities were �47�million and �39�million, respectively. The amount of credit loss component of other-than-temporary impairment losses recognized for the certain non-trading debt securities were �25�million and �23�million, respectively. Other-than-temporary impairment losses related to the non-credit loss component recognized for the certain non-trading debt securities and the subsequent changes in the fair value within Other comprehensive income (loss) were �(61)�million and �(60)�million.
For the six and three months ended September�30, 2014, other-than-temporary impairment losses recognized for the certain non-trading equity securities were �15�million and �12 million. There was no credit loss component of other-than-temporary impairment losses recognized for the certain non-trading debt securities. Other-than-temporary impairment losses related to the non-credit loss component recognized for the certain non-trading debt securities within Other comprehensive income (loss) were �0 million and �(2)�million.
Other gross unrealized losses of non-trading securities were considered temporary.
�
F-58
Table of Contents
Notes to the Interim Consolidated Financial Statements�(Continued) (UNAUDITED)
�
6. Securitizations and Variable Interest Entities:
Securitizations
Nomura utilizes special purpose entities (�SPEs�) to securitize commercial and residential mortgage loans, government agency and corporate securities and other types of financial assets. Those SPEs are incorporated as stock companies, Tokumei kumiai (silent partnerships), Cayman special purpose companies (�SPCs�) or trust accounts. Nomura�s involvement with SPEs includes structuring SPEs, underwriting, distributing and selling debt instruments and beneficial interests issued by SPEs to investors. Nomura accounts for the transfer of financial assets in accordance with ASC 860. This statement requires that Nomura accounts for the transfer of financial assets as a sale when Nomura relinquishes control over the assets. ASC 860 deems control to be relinquished when the following conditions are met: (a)�the assets have been isolated from the transferor (even in bankruptcy or other receivership), (b)�the transferee has the right to pledge or exchange the assets received, or if the transferee is an entity whose sole purpose is to engage in securitization or asset-backed financing activities, the holders of its beneficial interests have the right to pledge or exchange the beneficial interests, and (c)�the transferor has not maintained effective control over the transferred assets. Nomura may retain an interest in the financial assets, including residual interests in the SPEs. Any such interests are accounted for at fair value and reported within Trading assets in Nomura�s consolidated balance sheets, with the change in fair value reported within Revenue�Net gain on trading. Fair value for retained interests in securitized financial assets is determined by using observable prices; or in cases where observable prices are not available for certain retained interests, Nomura estimates fair value based on the present value of expected future cash flows using its best estimates of the key assumptions, including forecasted credit losses, prepayment rates, forward yield curves and discount rates commensurate with the risks involved. Nomura may also enter into derivative transactions in relation to the assets transferred to an SPE.
As noted above, Nomura may have continuing involvement with SPEs to which Nomura transferred assets. For the six and three months ended September�30, 2013, Nomura received cash proceeds from SPEs in new securitizations of �202�billion and �73�billion, respectively, and there was no associated profit on sale. For the six and three months ended September�30, 2014, Nomura received cash proceeds from SPEs in new securitizations of �163�billion and �71�billion, respectively, and there was no associated profit on sale. For the six and three months ended September�30, 2013, Nomura received debt securities issued by these SPEs with an initial fair value of �817�billion and �372�billion, respectively, and cash inflows from third parties on the sale of those debt securities of �496�billion and �205�billion, respectively. For the six and three months ended September�30, 2014, Nomura received debt securities issued by these SPEs with an initial fair value of �479�billion and �263�billion, respectively, and cash inflows from third parties on the sale of those debt securities of �291�billion and �164�billion, respectively. The cumulative balance of financial assets transferred to SPEs with which Nomura has continuing involvement was �5,035 billion and �5,460 billion as of March�31, 2014 and September�30, 2014, respectively. Nomura�s retained interests were �215�billion and �181 billion, as of March�31, 2014 and September�30, 2014, respectively. For the six months and three months ended September�30, 2013, Nomura received cash flows of �29 billion and �10 billion, respectively, from the SPEs on the retained interests held in the SPEs. For the six and three months ended September�30, 2014, Nomura received cash flows of �11 billion and �5 billion, respectively, from the SPEs on the retained interests held in the SPEs.
Nomura had outstanding collateral service agreements or written credit default swap agreements in the amount of �4 billion and �2�billion as of March�31, 2014 and September�30, 2014, respectively. Nomura does not provide financial support to SPEs beyond its contractual obligations.
The following tables present the fair value of retained interests which Nomura has continuing involvement in SPEs and their classification in the fair value hierarchy, categorized by the type of transferred assets.
�
| � | �� | Billions of yen | � | |||||||||||||||||||||
| � | �� | March�31, 2014 | � | |||||||||||||||||||||
| � | �� | Level�1 | � | �� | Level�2 | � | �� | Level�3 | � | �� | Total | � | �� | Investment grade |
� | �� | Other | � | ||||||
| Government, agency and municipal securities |
�� | � | ��� | �� | �� | � | 195 | �� | �� | � | ��� | �� | �� | � | 195 | �� | �� | � | 195 | �� | �� | � | ��� | �� |
| Bank�and corporate debt securities |
�� | � | ��� | �� | �� | � | ��� | �� | �� | � | 0 | �� | �� | � | 0 | �� | �� | � | ��� | �� | �� | � | 0 | �� |
| Mortgage and mortgage-backed securities |
�� | � | ��� | �� | �� | � | 19 | �� | �� | � | 1 | �� | �� | � | 20 | �� | �� | � | 1 | �� | �� | � | 19 | �� |
| �� | � |
� |
� | �� | � |
� |
� | �� | � |
� |
� | �� | � |
� |
� | �� | � |
� |
� | �� | � |
� |
� | |
| Total |
�� | � | ��� | �� | �� | � | 214 | �� | �� | � | 1 | �� | �� | � | 215 | �� | �� | � | 196 | �� | �� | � | 19 | �� |
| �� | � |
� |
� | �� | � |
� |
� | �� | � |
� |
� | �� | � |
� |
� | �� | � |
� |
� | �� | � |
� |
� | |
| � | �� | Billions of yen | � | |||||||||||||||||||||
| � | �� | September�30, 2014 | � | |||||||||||||||||||||
| � | �� | Level�1 | � | �� | Level 2 | � | �� | Level 3 | � | �� | Total | � | �� | Investment grade |
� | �� | Other | � | ||||||
| Government, agency and municipal securities |
�� | � | ��� | �� | �� | � | 173 | �� | �� | � | ��� | �� | �� | � | 173 | �� | �� | � | 173 | �� | �� | � | ��� | �� |
| Bank�and corporate debt securities |
�� | � | ��� | �� | �� | � | ��� | �� | �� | � | 0 | �� | �� | � | 0 | �� | �� | � | ��� | �� | �� | � | 0 | �� |
| Mortgage and mortgage-backed securities |
�� | � | ��� | �� | �� | � | 7 | �� | �� | � | 1 | �� | �� | � | 8 | �� | �� | � | 1 | �� | �� | � | 7 | �� |
| �� | � |
� |
� | �� | � |
� |
� | �� | � |
� |
� | �� | � |
� |
� | �� | � |
� |
� | �� | � |
� |
� | |
| Total |
�� | � | ��� | �� | �� | � | 180 | �� | �� | � | 1 | �� | �� | � | 181 | �� | �� | � | 174 | �� | �� | � | 7 | �� |
| �� | � |
� |
� | �� | � |
� |
� | �� | � |
� |
� | �� | � |
� |
� | �� | � |
� |
� | �� | � |
� |
� | |
�
F-59
Table of Contents
Notes to the Interim Consolidated Financial Statements�(Continued) (UNAUDITED)
�
The following table presents the key economic assumptions used to determine the fair value of the retained interests and the sensitivity of this fair value to immediate adverse changes of 10% and 20% in those assumptions.
�
| � | �� | Billions�of�yen,�except�percentages | � | |||||
| � | �� | Material�retained�interests�held(1) | � | |||||
| � | �� | March�31,�2014 | � | � | September�30,�2014 | � | ||
| Fair value of retained interests(1) |
�� | � | 201 | �� | � | � | 165 | �� |
| Weighted-average life (Years) |
�� | � | 7.5 | �� | � | � | 6.8 | �� |
| Constant prepayment rate |
�� | � | 6.2 | %� | � | � | 7.7 | %� |
| Impact of 10% adverse change |
�� | � | (2.3 | )� | � | � | (2.1 | )� |
| Impact of 20% adverse change |
�� | � | (4.0 | )� | � | � | (3.9 | )� |
| Discount rate |
�� | � | 5.3 | %� | � | � | 3.5 | %� |
| Impact of 10% adverse change |
�� | � | (1.5 | )� | � | � | (0.9 | )� |
| Impact of 20% adverse change |
�� | � | (2.6 | )� | � | � | (1.7 | )� |
�
| (1) | The sensitivity analysis covers the material retained interests held of �201 billion out of �215 billion as of March�31, 2014 and �165 billion out of �181 billion as of September�30, 2014. |
| �� | Nomura considers the amount and the probability of anticipated credit loss from the retained interests which Nomura continuously holds would be minimal. |
Changes in fair value based on 10% or 20% adverse changes generally cannot be extrapolated since the relationship of the change in assumption to the change in fair value may not be linear.�The impact of a change in a particular assumption is calculated holding all other assumptions constant.�For this reason, concurrent changes in assumptions may magnify or counteract the sensitivities disclosed above.�The sensitivity analyses are hypothetical and do not reflect Nomura�s risk management practices that may be undertaken under those stress scenarios.
The following table presents the type and carrying value of financial assets included within Trading assets which have been transferred to SPEs but which do not meet the criteria for derecognition under ASC 860. These transfers are accounted for as secured financing transactions and generally reported within Long-term borrowings. The assets are pledged as collateral of the associated liabilities and cannot be removed unilaterally by Nomura and the liabilities are non-recourse to Nomura.
�
| � | �� | Billions of yen | � | |||||
| � | �� | March�31,�2014 | � | �� | September�30,�2014 | � | ||
| Assets |
�� | �� | ||||||
| Trading assets |
�� | �� | ||||||
| Equities |
�� | � | 99 | �� | �� | � | 89 | �� |
| Debt securities |
�� | � | 64 | �� | �� | � | 57 | �� |
| Mortgage and mortgage-backed securities |
�� | � | 23 | �� | �� | � | 25 | �� |
| Long-term loans receivable |
�� | � | 7 | �� | �� | � | 7 | �� |
| �� | � |
� |
� | �� | � |
� |
� | |
| Total |
�� | � | 193 | �� | �� | � | 178 | �� |
| �� | � |
� |
� | �� | � |
� |
� | |
| Liabilities |
�� | �� | ||||||
| Long-term borrowings |
�� | � | 182 | �� | �� | � | 167 | �� |
| �� | � |
� |
� | �� | � |
� |
� | |
Variable Interest Entities
In the normal course of business, Nomura acts as a transferor of financial assets to VIEs, and underwriter, distributor, and seller of repackaged financial instruments issued by VIEs in connection with its securitization and equity derivative activities. Nomura retains, purchases and sells variable interests in VIEs in connection with its market-making, investing and structuring activities.
If Nomura has an interest in a VIE that provides Nomura with control over the most significant activities of the VIE and the right to receive benefits or the obligation to absorb losses that could be significant to the VIE, Nomura is the primary beneficiary of the VIE and must consolidate the entity, provided that Nomura does not meet separate tests confirming that it is acting as a fiduciary for other interest holders. Nomura�s consolidated VIEs include those that were created to market structured securities to investors by repackaging corporate convertible securities, mortgages and mortgage-backed securities. Certain VIEs used in connection with Nomura�s aircraft leasing business as well as other purposes are consolidated. Nomura also consolidates certain investment funds, which are VIEs, and for which Nomura is the primary beneficiary.
�
F-60
Table of Contents
Notes to the Interim Consolidated Financial Statements�(Continued) (UNAUDITED)
�
The power to make the most significant decisions may take a number of different forms in different types of VIEs. For transactions such as securitizations, investment funds, and CDOs, Nomura considers collateral management and servicing to represent the power to make the most significant decisions. Accordingly, Nomura does not consolidate such types of VIEs for which it does not act as collateral manager or servicer unless Nomura has the right to replace the collateral manager or servicer or to require liquidation of the entity.
For many transactions, such as re-securitizations of mortgage backed securities and other asset repackaged notes, there are no significant economic decisions made on an ongoing basis and no single investor has the unilateral ability to liquidate the trust. In these cases, Nomura focuses its analysis on decisions made prior to the closing of the initial transaction. If one or a number of investors share responsibility for the design of the transaction, Nomura does not consolidate the VIE. Nomura has sponsored numerous re-securitization and asset repackaged notes transactions and in many cases has determined that it is not the primary beneficiary on the basis that control over the most significant activities of these entities are shared with investors. In some cases, however, Nomura has consolidated such VIEs, in each case where it was determined that investors did not share in the responsibility for the design of the transactions, as evidenced by less than significant purchases of the resulting securities by investors upon initiation.
The following table presents the classification of consolidated VIEs� assets and liabilities in these consolidated financial statements. The assets of a consolidated VIE may only be used to settle obligations of that VIE. Creditors do not have any recourse to Nomura beyond the assets held in the VIEs.
�
| � | �� | Billions of yen | � | |||||
| � | �� | March�31,�2014 | � | �� | September�30,�2014 | � | ||
| Consolidated VIE assets |
�� | �� | ||||||
| Cash and cash equivalents |
�� | � | 18 | �� | �� | � | 21 | �� |
| Trading assets |
�� | �� | ||||||
| Equities |
�� | � | 289 | �� | �� | � | 391 | �� |
| Debt securities |
�� | � | 393 | �� | �� | � | 432 | �� |
| Mortgage and mortgage-backed securities |
�� | � | 66 | �� | �� | � | 71 | �� |
| Derivatives |
�� | � | 2 | �� | �� | � | 2 | �� |
| Private equity investments |
�� | � | 1 | �� | �� | � | 1 | �� |
| Securities purchased under agreements to resell |
�� | � | 32 | �� | �� | � | 20 | �� |
| Office buildings, land, equipment and facilities |
�� | � | 12 | �� | �� | � | 15 | �� |
|
Other(1) |
�� | � | 70 | �� | �� | � | 29 | �� |
| �� | � |
� |
� | �� | � |
� |
� | |
| Total |
�� | � | 883 | �� | �� | � | 982 | �� |
| �� | � |
� |
� | �� | � |
� |
� | |
| Consolidated VIE liabilities |
�� | �� | ||||||
| Trading liabilities |
�� | �� | ||||||
| Debt securities |
�� | � | 33 | �� | �� | � | 18 | �� |
| Derivatives |
�� | � | 9 | �� | �� | � | 9 | �� |
| Securities sold under agreements to repurchase |
�� | � | 23 | �� | �� | � | 13 | �� |
| Borrowings |
�� | �� | ||||||
| Long-term borrowings |
�� | � | 424 | �� | �� | � | 640 | �� |
| Other |
�� | � | 4 | �� | �� | � | 2 | �� |
| �� | � |
� |
� | �� | � |
� |
� | |
| Total |
�� | � | 493 | �� | �� | � | 682 | �� |
| �� | � |
� |
� | �� | � |
� |
� | |
�
| (1) | Includes aircraft purchase deposits of �5 billion as of March�31, 2014. There was no aircraft purchase deposit as of September�30, 2014, due to the completion of aircraft delivery. In relation to these aircraft purchase deposits, certain of these SPEs have commitments to purchase aircraft. See Note 15 �Commitments, contingencies and guarantees� for further information. |
Nomura continuously reassesses its initial evaluation of whether it is the primary beneficiary of a VIE based on current facts and circumstances as long as it has any continuing involvement with the VIE. This determination is based upon an analysis of the design of the VIE, including the VIE�s structure and activities, the power to make significant economic decisions held by Nomura and by other parties, and the variable interests owned by Nomura and other parties.
Nomura also holds variable interests in VIEs where Nomura is not the primary beneficiary. Nomura�s variable interests in such VIEs include senior and subordinated debt, residual interests, and equity interests associated with commercial and residential mortgage-backed and other asset-backed securitizations and structured financings, equity interests in VIEs which were formed primarily to acquire high yield leveraged loans and other lower investment grade debt obligations, residual interests in operating leases for aircraft held by VIEs, and loans and investments in VIEs that acquire operating businesses.
�
F-61
Table of Contents
Notes to the Interim Consolidated Financial Statements�(Continued) (UNAUDITED)
�
The following tables present the carrying amount of variable interests of unconsolidated VIEs and maximum exposure to loss associated with these variable interests. Maximum exposure to loss does not reflect Nomura�s estimate of the actual losses that could result from adverse changes, nor does it reflect the economic hedges Nomura enters into to reduce its exposure. The risks associated with VIEs in which Nomura is involved are limited to the amount recorded in the consolidated balance sheets, the amount of commitments and financial guarantees and the notional amount of the derivative instruments. Nomura believes the notional amount of derivative instruments generally exceeds the amount of actual risk.
�
| � | �� | Billions of yen | � | |||||||||
| � | �� | March�31, 2014 | � | |||||||||
| � | �� | Carrying�amount�of variable�interests |
� | �� | Maximum�exposure to loss to unconsolidated�VIEs |
� | ||||||
| � | �� | Assets | � | �� | Liabilities | � | �� | |||||
| Trading assets and liabilities |
�� | �� | �� | |||||||||
| Equities |
�� | � | 67 | �� | �� | � | ��� | �� | �� | � | 67 | �� |
| Debt securities |
�� | � | 211 | �� | �� | � | ��� | �� | �� | � | 211 | �� |
| Mortgage and mortgage-backed securities |
�� | � | 2,308 | �� | �� | � | ��� | �� | �� | � | 2,308 | �� |
| Investment trust funds and other |
�� | � | 185 | �� | �� | � | ��� | �� | �� | � | 185 | �� |
| Derivatives |
�� | � | 0 | �� | �� | � | ��� | �� | �� | � | 4 | �� |
| Private equity investments |
�� | � | 25 | �� | �� | � | ��� | �� | �� | � | 25 | �� |
| Loans |
�� | �� | �� | |||||||||
| Short-term loans |
�� | � | 11 | �� | �� | � | ��� | �� | �� | � | 11 | �� |
| Long-term loans |
�� | � | 164 | �� | �� | � | ��� | �� | �� | � | 164 | �� |
| Other |
�� | � | 4 | �� | �� | � | ��� | �� | �� | � | 4 | �� |
| Commitments to extend credit and other guarantees |
�� | � | ��� | �� | �� | � | ��� | �� | �� | � | 49 | �� |
| �� | � |
� |
� | �� | � |
� |
� | �� | � |
� |
� | |
| Total |
�� | � | 2,975 | �� | �� | � | ��� | �� | �� | � | 3,028 | �� |
| �� | � |
� |
� | �� | � |
� |
� | �� | � |
� |
� | |
| � | �� | Billions of yen | � | |||||||||
| � | �� | September�30, 2014 | � | |||||||||
| � | �� | Carrying�amount�of variable�interests |
� | �� | Maximum�exposure to loss to unconsolidated�VIEs |
� | ||||||
| � | �� | Assets | � | �� | Liabilities | � | �� | |||||
| Trading assets and liabilities |
�� | �� | �� | |||||||||
| Equities |
�� | � | 63 | �� | �� | � | ��� | �� | �� | � | 63 | �� |
| Debt securities |
�� | � | 251 | �� | �� | � | ��� | �� | �� | � | 251 | �� |
| Mortgage and mortgage-backed securities |
�� | � | 2,212 | �� | �� | � | ��� | �� | �� | � | 2,212 | �� |
| Investment trust funds and other |
�� | � | 500 | �� | �� | � | ��� | �� | �� | � | 500 | �� |
| Derivatives |
�� | � | 0 | �� | �� | � | ��� | �� | �� | � | 2 | �� |
| Private equity investments |
�� | � | 24 | �� | �� | � | ��� | �� | �� | � | 24 | �� |
| Loans |
�� | �� | �� | |||||||||
| Short-term loans |
�� | � | 11 | �� | �� | � | ��� | �� | �� | � | 11 | �� |
| Long-term loans |
�� | � | 253 | �� | �� | � | ��� | �� | �� | � | 253 | �� |
| Other |
�� | � | 4 | �� | �� | � | ��� | �� | �� | � | 4 | �� |
| Commitments to extend credit and other guarantees |
�� | � | ��� | �� | �� | � | ��� | �� | �� | � | 46 | �� |
| �� | � |
� |
� | �� | � |
� |
� | �� | � |
� |
� | |
| Total |
�� | � | 3,318 | �� | �� | � | ��� | �� | �� | � | 3,366 | �� |
| �� | � |
� |
� | �� | � |
� |
� | �� | � |
� |
� | |
�
F-62
Table of Contents
Notes to the Interim Consolidated Financial Statements�(Continued) (UNAUDITED)
�
7. Financing receivables:
In the normal course of business, Nomura extends financing to clients primarily in the form of loans and collateralized agreements such as reverse repurchase agreements and securities borrowing transactions. These financing receivables are recognized as assets on Nomura�s consolidated balance sheets and provide a contractual right to receive money either on demand or on future fixed or determinable dates.
Collateralized agreements
Collateralized agreements consist of reverse repurchase agreements disclosed as Securities purchased under agreements to resell and securities borrowing transactions disclosed as Securities borrowed in the consolidated balance sheets, including those executed under Gensaki Repo agreements. Reverse repurchase agreements and securities borrowing transactions principally involve the buying of government and government agency securities from customers under agreements that also require Nomura to resell these securities to those customers. Nomura monitors the value of the underlying securities on a daily basis to the related receivables, including accrued interest, and requests or returns additional collateral when appropriate. Reverse repurchase agreements are generally recognized in the consolidated balance sheets at the amount for which the securities were originally acquired with applicable accrued interest. Securities borrowing transactions are generally recognized in the consolidated balance sheets at the amount of cash collateral advanced. No allowance for credit losses is generally recognized against these transactions due to the strict collateralization requirements.
Loans receivable
The key types of loans receivable recognized by Nomura are loans at banks, short-term secured margin loans, inter-bank money market loans and corporate loans.
Loans at banks include both retail and commercial secured and unsecured loans extended by licensed banking entities within Nomura such as The Nomura Trust�& Banking Co., Ltd. and Nomura Bank International plc. For both retail and commercial loans secured by real estate or securities, Nomura is exposed to the risk of a decline in the value of the underlying collateral. Loans at banks also include unsecured commercial loans provided to investment banking clients for relationship purposes. Nomura is exposed to risk of default of the counterparty, although these counterparties usually have high credit ratings. Where loans are secured by guarantees, Nomura is also exposed to the risk of default by the guarantor.
Short-term secured margin loans are loans provided to clients in connection with securities brokerage business. These loans provide funding for clients in order to purchase securities. Nomura requests initial margin in the form of acceptable collateral securities or deposits against these loans and holds the purchased securities as collateral through the life of the loans. If the value of the securities declines by more than specified amounts, Nomura can make additional margin calls in order to maintain a specified ratio of loan-to-value (�LTV�) ratio. For these reasons, the risk to Nomura of providing these loans is limited.
Inter-bank money market loans are loans to financial institutions in the inter-bank money market, where overnight and intra-day financings are traded through money market dealers. The risk to Nomura of making these loans is not significant as only qualified financial institutions can participate in these markets and these loans are usually overnight or short-term in nature.
Corporate loans are primarily commercial loans provided to corporate clients extended by non-licensed banking entities within Nomura. Corporate loans include loans secured by real estate or securities, as well as unsecured commercial loans provided to investment banking clients for relationship purposes. The risk to Nomura of making these loans is similar to those risks arising from commercial loans reported in loans at banks.
In addition to the loans above, Nomura has advances to affiliated companies which are loans provided to related parties of Nomura. As these loans are generally not secured, Nomura is exposed to the risk of default of the counterparty.
�
F-63
Table of Contents
Notes to the Interim Consolidated Financial Statements�(Continued) (UNAUDITED)
�
The following tables present a summary of loans receivable reported within Loans receivable or Investments in and advances to affiliated companies in the consolidated balance sheets by portfolio segment.
�
| � | �� | Millions of yen | � | |||||||||
| � | �� | March�31, 2014 | � | |||||||||
| � | �� | Carried at amortized�cost |
� | �� | Carried
at fair�value(1) |
� | �� | Total | � | |||
| Loans receivable |
�� | �� | �� | |||||||||
| Loans at banks |
�� | � | 274,966 | �� | �� | � | 44 | �� | �� | � | 275,010 | �� |
| Short-term secured margin loans |
�� | � | 421,809 | �� | �� | � | ��� | �� | �� | � | 421,809 | �� |
| Inter-bank money market loans |
�� | � | 42,885 | �� | �� | � | ��� | �� | �� | � | 42,885 | �� |
| Corporate loans |
�� | � | 284,259 | �� | �� | � | 303,912 | �� | �� | � | 588,171 | �� |
| �� | � |
� |
� | �� | � |
� |
� | �� | � |
� |
� | |
| Total loans receivable |
�� | � | 1,023,919 | �� | �� | � | 303,956 | �� | �� | � | 1,327,875 | �� |
| �� | � |
� |
� | �� | � |
� |
� | �� | � |
� |
� | |
| Advances to affiliated companies |
�� | � | 5,797 | �� | �� | � | ��� | �� | �� | � | 5,797 | �� |
| �� | � |
� |
� | �� | � |
� |
� | �� | � |
� |
� | |
| Total |
�� | � | 1,029,716 | �� | �� | � | 303,956 | �� | �� | � | 1,333,672 | �� |
| �� | � |
� |
� | �� | � |
� |
� | �� | � |
� |
� | |
�
| � | �� | Millions of yen | � | |||||||||
| � | �� | September�30, 2014 | � | |||||||||
| � | �� | Carried at amortized�cost |
� | �� | Carried
at fair�value(1) |
� | �� | Total | � | |||
| Loans receivable |
�� | �� | �� | |||||||||
| Loans at banks |
�� | � | 287,436 | �� | �� | � | 1 | �� | �� | � | 287,437 | �� |
| Short-term secured margin loans |
�� | � | 371,654 | �� | �� | � | ��� | �� | �� | � | 371,654 | �� |
| Inter-bank money market loans |
�� | � | 30,941 | �� | �� | � | ��� | �� | �� | � | 30,941 | �� |
| Corporate loans |
�� | � | 384,493 | �� | �� | � | 282,821 | �� | �� | � | 667,314 | �� |
| �� | � |
� |
� | �� | � |
� |
� | �� | � |
� |
� | |
| Total loans receivable |
�� | � | 1,074,524 | �� | �� | � | 282,822 | �� | �� | � | 1,357,346 | �� |
| �� | � |
� |
� | �� | � |
� |
� | �� | � |
� |
� | |
| Advances to affiliated companies |
�� | � | 3,137 | �� | �� | � | ��� | �� | �� | � | 3,137 | �� |
| �� | � |
� |
� | �� | � |
� |
� | �� | � |
� |
� | |
| Total |
�� | � | 1,077,661 | �� | �� | � | 282,822 | �� | �� | � | 1,360,483 | �� |
| �� | � |
� |
� | �� | � |
� |
� | �� | � |
� |
� | |
�
| (1) | Includes loans receivable and loan commitments carried at fair value through election of the fair value option. |
The amounts of significant purchases of corporate loans during the six and three months ended September�30, 2013, were �36,658�million and �11,030�million, respectively. During the same period, there were no significant sales of loans receivable and reclassifications of loans receivable to trading assets. The amount of significant purchases of corporate loans during the six months ended September�30, 2014, was �62,309�million. There were no significant purchases of loans receivable during the three months ended September�30, 2014. The amounts of significant sales of corporate loans during the six and three months ended September�30, 2014, were �8,636 million. During the same period, there were no significant reclassifications of loans receivable to trading assets.
�
F-64
Table of Contents
Notes to the Interim Consolidated Financial Statements�(Continued) (UNAUDITED)
�
Allowance for loan losses
Management establishes an allowance for loan losses for loans carried at amortized cost which reflects management�s best estimate of probable losses incurred. The allowance for loan losses which is reported in the consolidated balance sheets within Allowance for doubtful accounts comprises two components:
�
| � | � | � | A specific component for loans which have been individually evaluated for impairment; and |
�
| � | � | � | A general component for loans which, while not individually evaluated for impairment, have been collectively evaluated for impairment based on historical loss experience |
The specific component of the allowance for loan losses reflects probable losses incurred within loans which have been individually evaluated for impairment. A loan is defined as being impaired when, based on current information and events, it is probable that all amounts due according to the contractual terms of the loan agreement will not be collected. Factors considered by management in determining impairment include an assessment of the ability of borrowers to pay by considering various factors such as the nature of the loan, prior loan loss experience, current economic conditions, the current financial situation of the borrower and the fair value of any underlying collateral. Loans that experience insignificant payment delays or insignificant payment shortfalls are not classified as impaired. The impairment is measured on a loan by loan basis by adjusting the carrying value of the loan to either the present value of expected future cash flows discounted at the loan�s effective interest rate, the loan�s observable market price, or the fair value of the collateral if the loan is collateral dependent.
The general component of the allowance for loan losses is for loans not individually evaluated for impairment and includes judgment about collectability based on available information at the balance sheet date and the uncertainties inherent in those underlying assumptions. The allowance is based on historical loss experience adjusted for qualitative factors such as current economic conditions.
While management has based its estimate of the allowance for loan losses on the best information available, future adjustments to the allowance for loan losses may be necessary as a result of changes in the economic environment or variances between actual results and original assumptions.
Loans are charged-off when Nomura determines that the loans are uncollectible. This determination is based on factors such as the occurrence of significant changes in the borrower�s financial position such that the borrower can no longer pay the obligation or that the proceeds from collateral will not be sufficient to pay the loans.
�
F-65
Table of Contents
Notes to the Interim Consolidated Financial Statements�(Continued) (UNAUDITED)
�
The following tables present changes in the allowance for losses for the six and three months ended September�30, 2013 and 2014.
�
| � | �� | Millions of yen | � | |||||||||||||||||||||||||||||
| � | �� | Six months ended September�30, 2013 | � | |||||||||||||||||||||||||||||
| � | �� | Allowance for loan losses | � | � | Allowance�for receivables other than loans |
� | � | Total allowance�for doubtful accounts |
� | |||||||||||||||||||||||
| � | �� | Loans at�banks |
� | � | Short-term secured margin loans |
� | � | Inter-bank money market�loans |
� | �� | Corporate loans |
� | � | Advances�to affiliated companies |
� | � | Subtotal | � | � | � | ||||||||||||
| Opening balance |
�� | � | 789 | �� | � | � | 26 | �� | � | � | ��� | �� | �� | � | 95 | �� | � | � | 29 | �� | � | � | 939 | �� | � | � | 1,319 | �� | � | � | 2,258 | �� |
| Provision for losses |
�� | � | (90 | )� | � | � | (7 | )� | � | � | ��� | �� | �� | � | 30 | �� | � | � | (28 | )� | � | � | (95 | )� | � | � | 1,167 | �� | � | � | 1,072 | �� |
| Charge-offs |
�� | � | (2 | )� | � | � | ��� | �� | � | � | ��� | �� | �� | � | ��� | �� | � | � | ��� | �� | � | � | (2 | )� | � | � | (134 | )� | � | � | (136 | )� |
|
Other(1) |
�� | � | (0 | )� | � | � | ��� | �� | � | � | ��� | �� | �� | � | 0 | �� | � | � | ��� | �� | � | � | (0 | )� | � | � | 11 | �� | � | � | 11 | �� |
| �� | � |
� |
� | � | � |
� |
� | � | � |
� |
� | �� | � |
� |
� | � | � |
� |
� | � | � |
� |
� | � | � |
� |
� | � | � |
� |
� | |
| Ending balance |
�� | � | 697 | �� | � | � | 19 | �� | � | � | ��� | �� | �� | � | 125 | �� | � | � | 1 | �� | � | � | 842 | �� | � | � | 2,363 | �� | � | � | 3,205 | �� |
| �� | � |
� |
� | � | � |
� |
� | � | � |
� |
� | �� | � |
� |
� | � | � |
� |
� | � | � |
� |
� | � | � |
� |
� | � | � |
� |
� | |
| � | �� | Millions of yen | � | |||||||||||||||||||||||||||||
| � | �� | Six months ended September�30, 2014 | � | |||||||||||||||||||||||||||||
| � | �� | Allowance for loan losses | � | � | Allowance�for receivables other than loans |
� | � | Total allowance�for doubtful accounts |
� | |||||||||||||||||||||||
| � | �� | Loans at�banks |
� | � | Short-term secured margin loans |
� | � | Inter-bank money market�loans |
� | �� | Corporate loans |
� | � | Advances�to affiliated companies |
� | � | Subtotal | � | � | � | ||||||||||||
| Opening balance |
�� | � | 678 | �� | � | � | 87 | �� | � | � | ��� | �� | �� | � | 82 | �� | � | � | 1 | �� | � | � | 848 | �� | � | � | 2,161 | �� | � | � | 3,009 | �� |
| Provision for losses |
�� | � | (139 | )� | � | � | (35 | )� | � | � | ��� | �� | �� | � | (13 | )� | � | � | (0 | )� | � | � | (187 | )� | � | � | 34 | �� | � | � | (153 | )� |
| Charge-offs |
�� | � | ��� | �� | � | � | ��� | �� | � | � | ��� | �� | �� | � | ��� | �� | � | � | ��� | �� | � | � | ��� | �� | � | � | (121 | )� | � | � | (121 | )� |
|
Other(1) |
�� | � | ��� | �� | � | � | ��� | �� | � | � | ��� | �� | �� | � | 0 | �� | � | � | ��� | �� | � | � | 0 | �� | � | � | 19 | �� | � | � | 19 | �� |
| �� | � |
� |
� | � | � |
� |
� | � | � |
� |
� | �� | � |
� |
� | � | � |
� |
� | � | � |
� |
� | � | � |
� |
� | � | � |
� |
� | |
| Ending balance |
�� | � | 539 | �� | � | � | 52 | �� | � | � | ��� | �� | �� | � | 69 | �� | � | � | 1 | �� | � | � | 661 | �� | � | � | 2,093 | �� | � | � | 2,754 | �� |
| �� | � |
� |
� | � | � |
� |
� | � | � |
� |
� | �� | � |
� |
� | � | � |
� |
� | � | � |
� |
� | � | � |
� |
� | � | � |
� |
� | |
| � | �� | Millions of yen | � | |||||||||||||||||||||||||||||
| � | �� | Three months ended September�30, 2013 | � | |||||||||||||||||||||||||||||
| � | �� | Allowance for loan losses | � | � | Allowance�for receivables other than loans |
� | � | Total allowance�for doubtful accounts |
� | |||||||||||||||||||||||
| � | �� | Loans at�banks |
� | � | Short-term secured margin loans |
� | � | Inter-bank money market loans |
� | �� | Corporate loans |
� | � | Advances�to affiliated companies |
� | � | Subtotal | � | � | � | ||||||||||||
| Opening balance |
�� | � | 787 | �� | � | � | 21 | �� | � | � | ��� | �� | �� | � | 121 | �� | � | � | 29 | �� | � | � | 958 | �� | � | � | 2,487 | �� | � | � | 3,445 | �� |
| Provision for losses |
�� | � | (90 | )� | � | � | (2 | )� | � | � | ��� | �� | �� | � | 4 | �� | � | � | (28 | )� | � | � | (116 | )� | � | � | (110 | )� | � | � | (226 | )� |
| Charge-offs |
�� | � | ��� | �� | � | � | ��� | �� | � | � | ��� | �� | �� | � | ��� | �� | � | � | ��� | �� | � | � | ��� | �� | � | � | (12 | )� | � | � | (12 | )� |
|
Other(1) |
�� | � | ��� | �� | � | � | ��� | �� | � | � | ��� | �� | �� | � | 0 | �� | � | � | ��� | �� | � | � | 0 | �� | � | � | (2 | )� | � | � | (2 | )� |
| �� | � |
� |
� | � | � |
� |
� | � | � |
� |
� | �� | � |
� |
� | � | � |
� |
� | � | � |
� |
� | � | � |
� |
� | � | � |
� |
� | |
| Ending balance |
�� | � | 697 | �� | � | � | 19 | �� | � | � | ��� | �� | �� | � | 125 | �� | � | � | 1 | �� | � | � | 842 | �� | � | � | 2,363 | �� | � | � | 3,205 | �� |
| �� | � |
� |
� | � | � |
� |
� | � | � |
� |
� | �� | � |
� |
� | � | � |
� |
� | � | � |
� |
� | � | � |
� |
� | � | � |
� |
� | |
| �� | � | Millions of yen | �� | |||||||||||||||||||||||||||||
| � | �� | Three months ended September�30, 2014 | � | |||||||||||||||||||||||||||||
| � | �� | Allowance for loan losses | � | � | Allowance�for receivables other than loans |
� | � | Total allowance�for doubtful accounts |
� | |||||||||||||||||||||||
| � | �� | Loans at�banks |
� | � | Short-term secured margin loans |
� | � | Inter-bank money market�loans |
� | �� | Corporate loans |
� | � | Advances�to affiliated companies |
� | � | Subtotal | � | � | � | ||||||||||||
| Opening balance |
�� | � | 678 | �� | � | � | 58 | �� | � | � | ��� | �� | �� | � | 69 | �� | � | � | 1 | �� | � | � | 806 | �� | � | � | 2,050 | �� | � | � | 2,856 | �� |
| Provision for losses |
�� | � | (139 | )� | � | � | (6 | )� | � | � | ��� | �� | �� | � | 0 | �� | � | � | (0 | )� | � | � | (145 | )� | � | � | 29 | �� | � | � | (116 | )� |
| Charge-offs |
�� | � | ��� | �� | � | � | ��� | �� | � | � | ��� | �� | �� | � | ��� | �� | � | � | ��� | �� | � | � | ��� | �� | � | � | (8 | )� | � | � | (8 | )� |
|
Other(1) |
�� | � | ��� | �� | � | � | ��� | �� | � | � | ��� | �� | �� | � | 0 | �� | � | � | ��� | �� | � | � | 0 | �� | � | � | 22 | �� | � | � | 22 | �� |
| �� | � |
� |
� | � | � |
� |
� | � | � |
� |
� | �� | � |
� |
� | � | � |
� |
� | � | � |
� |
� | � | � |
� |
� | � | � |
� |
� | |
| Ending balance |
�� | � | 539 | �� | � | � | 52 | �� | � | � | ��� | �� | �� | � | 69 | �� | � | � | 1 | �� | � | � | 661 | �� | � | � | 2,093 | �� | � | � | 2,754 | �� |
| �� | � |
� |
� | � | � |
� |
� | � | � |
� |
� | �� | � |
� |
� | � | � |
� |
� | � | � |
� |
� | � | � |
� |
� | � | � |
� |
� | |
�
| (1) | Includes the effect of foreign exchange movements. |
�
F-66
Table of Contents
Notes to the Interim Consolidated Financial Statements�(Continued) (UNAUDITED)
�
The following tables present the allowance for loan losses and loans by impairment methodology and type of loans as of March�31, 2014 and September�30, 2014.
�
| � | �� | Millions of yen | � | |||||||||||||||||||||
| � | �� | March�31, 2014 | � | |||||||||||||||||||||
| � | �� | Loans at banks |
� | �� | Short-term secured�margin loans |
� | �� | Inter-bank money market�loans |
� | �� | Corporate loans |
� | �� | Advances�to affiliated companies |
� | �� | Total | � | ||||||
| Allowance by impairment methodology |
�� | �� | �� | �� | �� | �� | ||||||||||||||||||
| Evaluated individually |
�� | � | 3 | �� | �� | � | ��� | � | �� | � | ��� | � | �� | � | 7 | �� | �� | � | ��� | � | �� | � | 10 | �� |
| Evaluated collectively |
�� | � | 675 | �� | �� | � | 87 | �� | �� | � | ��� | � | �� | � | 75 | �� | �� | � | 1 | �� | �� | � | 838 | �� |
| �� | � |
� |
� | �� | � |
� |
� | �� | � |
� |
� | �� | � |
� |
� | �� | � |
� |
� | �� | � |
� |
� | |
| Total allowance for loan losses |
�� | � | 678 | �� | �� | � | 87 | �� | �� | � | ��� | � | �� | � | 82 | �� | �� | � | 1 | �� | �� | � | 848 | �� |
| �� | � |
� |
� | �� | � |
� |
� | �� | � |
� |
� | �� | � |
� |
� | �� | � |
� |
� | �� | � |
� |
� | |
| Loans by impairment methodology |
�� | �� | �� | �� | �� | �� | ||||||||||||||||||
| Evaluated individually |
�� | � | 4,374 | �� | �� | � | 103,345 | �� | �� | � | 42,885 | �� | �� | � | 275,753 | �� | �� | � | 882 | �� | �� | � | 427,239 | �� |
| Evaluated collectively |
�� | � | 270,592 | �� | �� | � | 318,464 | �� | �� | � | ��� | � | �� | � | 8,506 | �� | �� | � | 4,915 | �� | �� | � | 602,477 | �� |
| �� | � |
� |
� | �� | � |
� |
� | �� | � |
� |
� | �� | � |
� |
� | �� | � |
� |
� | �� | � |
� |
� | |
| Total loans |
�� | � | 274,966 | �� | �� | � | 421,809 | �� | �� | � | 42,885 | �� | �� | � | 284,259 | �� | �� | � | 5,797 | �� | �� | � | 1,029,716 | �� |
| �� | � |
� |
� | �� | � |
� |
� | �� | � |
� |
� | �� | � |
� |
� | �� | � |
� |
� | �� | � |
� |
� | |
| � | �� | Millions of yen | � | |||||||||||||||||||||
| � | �� | September�30, 2014 | � | |||||||||||||||||||||
| � | �� | Loans at banks |
� | �� | Short-term secured margin loans |
� | �� | Inter-bank money market�loans |
� | �� | Corporate loans |
� | �� | Advances to affiliated companies |
� | �� | Total | � | ||||||
| Allowance by impairment methodology |
�� | �� | �� | �� | �� | �� | ||||||||||||||||||
| Evaluated individually |
�� | � | 2 | �� | �� | � | ��� | � | �� | � | ��� | � | �� | � | 7 | �� | �� | � | ��� | � | �� | � | 9 | �� |
| Evaluated collectively |
�� | � | 537 | �� | �� | � | 52 | �� | �� | � | ��� | � | �� | � | 62 | �� | �� | � | 1 | �� | �� | � | 652 | �� |
| �� | � |
� |
� | �� | � |
� |
� | �� | � |
� |
� | �� | � |
� |
� | �� | � |
� |
� | �� | � |
� |
� | |
| Total allowance for loan losses |
�� | � | 539 | �� | �� | � | 52 | �� | �� | � | ��� | � | �� | � | 69 | �� | �� | � | 1 | �� | �� | � | 661 | �� |
| �� | � |
� |
� | �� | � |
� |
� | �� | � |
� |
� | �� | � |
� |
� | �� | � |
� |
� | �� | � |
� |
� | |
| Loans by impairment methodology |
�� | �� | �� | �� | �� | �� | ||||||||||||||||||
| Evaluated individually |
�� | � | 63 | �� | �� | � | 153,228 | �� | �� | � | 30,941 | �� | �� | � | 377,567 | �� | �� | � | 159 | �� | �� | � | 561,958 | �� |
| Evaluated collectively |
�� | � | 287,373 | �� | �� | � | 218,426 | �� | �� | � | ��� | � | �� | � | 6,926 | �� | �� | � | 2,978 | �� | �� | � | 515,703 | �� |
| �� | � |
� |
� | �� | � |
� |
� | �� | � |
� |
� | �� | � |
� |
� | �� | � |
� |
� | �� | � |
� |
� | |
| Total loans |
�� | � | 287,436 | �� | �� | � | 371,654 | �� | �� | � | 30,941 | �� | �� | � | 384,493 | �� | �� | � | 3,137 | �� | �� | � | 1,077,661 | �� |
| �� | � |
� |
� | �� | � |
� |
� | �� | � |
� |
� | �� | � |
� |
� | �� | � |
� |
� | �� | � |
� |
� | |
Nonaccrual and past due loans
Loans which are individually evaluated as impaired are assessed for nonaccrual status in accordance with Nomura�s policy. When it is determined to suspend interest accrual as a result of an assessment, any accrued but unpaid interest is reversed. Loans are generally only returned to an accrual status if the loan is brought contractually current, i.e. all overdue principal and interest amounts are paid. In limited circumstances, a loan which has not been brought contractually current will also be returned to an accrual status if all principal and interest amounts contractually due are reasonably assured of repayment within a reasonable period of time or there has been a sustained period of repayment performance by the borrower.
As of March�31, 2014, there were �6,022�million of loans which were on a nonaccrual status, primarily secured corporate loans. The amount of loans which were 90 days past due was not significant.
As of September�30, 2014, there were �6,330�million of loans which were on a nonaccrual status, primarily secured corporate loans. The amount of loans which were 90 days past due was not significant.
Once a loan is impaired and placed on a nonaccrual status, interest income is subsequently recognized using the cash basis method.
�
F-67
Table of Contents
Notes to the Interim Consolidated Financial Statements�(Continued) (UNAUDITED)
�
Loan impairment and troubled debt restructurings
In the ordinary course of business, Nomura may choose to recognize impairment and also restructure a loan classified as held for investment either because of financial difficulties of the borrower, or simply as a result of market conditions or relationship reasons. A troubled debt restructuring (�TDR�) occurs when Nomura (as lender) for economic or legal reasons related to the borrower�s financial difficulties grants a concession to the borrower that Nomura would not otherwise consider.
Any loan being restructured under a TDR will generally already be identified as impaired with an applicable allowance recognized in the allowance for loan losses. If not (for example if the loan is collectively assessed for impairment with other loans), the restructuring of the loan under a TDR will immediately result in the loan as being classified as impaired. An impairment loss for a loan restructuring under a TDR which only involves modification of the loan�s terms (rather than receipt of assets in full or partial settlement) is calculated in the same way as any other impaired loan. Assets received in full or partial satisfaction of a loan in a TDR are recognized at fair value.
As of March�31, 2014, the amount of loans which were classified as impaired but against which no allowance for loan losses had been recognized was not significant. For impaired loans with a related allowance, the amount of recorded investment, the total unpaid principal balance and the related allowance was not significant.
As of September�30, 2014, the amount of loans which were classified as impaired but against which no allowance for loan losses had been recognized was not significant. For impaired loans with a related allowance, the amount of recorded investment, the total unpaid principal balance and the related allowance was not significant.
The amount of TDRs which occurred during the six and three months ended September�30, 2013 and 2014, was not significant.
�
F-68
Table of Contents
Notes to the Interim Consolidated Financial Statements�(Continued) (UNAUDITED)
�
Credit quality indicators
Nomura is exposed to credit risks deriving from a decline in the value of loans or a default caused by deterioration of creditworthiness or bankruptcy of the obligor. Nomura�s risk management framework for such credit risks is based on a risk assessment through an internal rating process, in depth pre-financing credit analysis of each individual loan and continuous post-financing monitoring of obligor�s creditworthiness.
The following tables present an analysis of each class of loans not carried at fair value using Nomura�s internal ratings or equivalent credit quality indicators applied by subsidiaries as of March�31, 2014 and September�30, 2014.
�
| � | �� | Millions of yen | � | |||||||||||||||||
| � | �� | March�31, 2014 | � | |||||||||||||||||
| � | �� | AAA-BBB | � | �� | BB-CCC | � | �� | CC-D | � | �� | Others(1) | � | �� | Total | � | |||||
| Secured loans at banks |
�� | � | 98,356 | �� | �� | � | 33,669 | �� | �� | � | ��� | � | �� | � | 34,740 | �� | �� | � | 166,765 | �� |
| Unsecured loans at banks |
�� | � | 108,199 | �� | �� | � | ��� | � | �� | � | 2 | �� | �� | � | ��� | � | �� | � | 108,201 | �� |
| Short-term secured margin loans |
�� | � | ��� | � | �� | � | ��� | � | �� | � | ��� | � | �� | � | 421,809 | �� | �� | � | 421,809 | �� |
| Secured inter-bank money market loans |
�� | � | 12,885 | �� | �� | � | ��� | � | �� | � | ��� | � | �� | � | ��� | � | �� | � | 12,885 | �� |
| Unsecured inter-bank money market loans |
�� | � | 30,000 | �� | �� | � | ��� | � | �� | � | ��� | � | �� | � | ��� | � | �� | � | 30,000 | �� |
| Secured corporate loans |
�� | � | 136,302 | �� | �� | � | 107,141 | �� | �� | � | 5,719 | �� | �� | � | 1,938 | �� | �� | � | 251,100 | �� |
| Unsecured corporate loans |
�� | � | 3,395 | �� | �� | � | 26,902 | �� | �� | � | ��� | � | �� | � | 2,862 | �� | �� | � | 33,159 | �� |
| Advances to affiliated companies |
�� | � | 4,915 | �� | �� | � | 594 | �� | �� | � | ��� | � | �� | � | 288 | �� | �� | � | 5,797 | �� |
| �� | � |
� |
� | �� | � |
� |
� | �� | � |
� |
� | �� | � |
� |
� | �� | � |
� |
� | |
| Total |
�� | � | 394,052 | �� | �� | � | 168,306 | �� | �� | � | 5,721 | �� | �� | � | 461,637 | �� | �� | � | 1,029,716 | �� |
| �� | � |
� |
� | �� | � |
� |
� | �� | � |
� |
� | �� | � |
� |
� | �� | � |
� |
� | |
| � | �� | Millions of yen | � | |||||||||||||||||
| � | �� | September�30, 2014 | � | |||||||||||||||||
| � | �� | AAA-BBB | � | �� | BB-CCC | � | �� | CC-D | � | �� | Others(1) | � | �� | Total | � | |||||
| Secured loans at banks |
�� | � | 103,753 | �� | �� | � | 34,023 | �� | �� | � | ��� | � | �� | � | 35,370 | �� | �� | � | 173,146 | �� |
| Unsecured loans at banks |
�� | � | 110,414 | �� | �� | � | 3,874 | �� | �� | � | 2 | �� | �� | � | ��� | � | �� | � | 114,290 | �� |
| Short-term secured margin loans |
�� | � | ��� | � | �� | � | ��� | � | �� | � | ��� | � | �� | � | 371,654 | �� | �� | � | 371,654 | �� |
| Secured inter-bank money market loans |
�� | � | 10,877 | �� | �� | � | ��� | � | �� | � | ��� | � | �� | � | ��� | � | �� | � | 10,877 | �� |
| Unsecured inter-bank money market loans |
�� | � | 20,064 | �� | �� | � | ��� | � | �� | � | ��� | � | �� | � | ��� | � | �� | � | 20,064 | �� |
| Secured corporate loans |
�� | � | 215,648 | �� | �� | � | 155,847 | �� | �� | � | 4,849 | �� | �� | � | 2,136 | �� | �� | � | 378,480 | �� |
| Unsecured corporate loans |
�� | � | 3,181 | �� | �� | � | ��� | � | �� | � | ��� | � | �� | � | 2,832 | �� | �� | � | 6,013 | �� |
| Advances to affiliated companies |
�� | � | 2,978 | �� | �� | � | 159 | �� | �� | � | ��� | � | �� | � | ��� | � | �� | � | 3,137 | �� |
| �� | � |
� |
� | �� | � |
� |
� | �� | � |
� |
� | �� | � |
� |
� | �� | � |
� |
� | |
| Total |
�� | � | 466,915 | �� | �� | � | 193,903 | �� | �� | � | 4,851 | �� | �� | � | 411,992 | �� | �� | � | 1,077,661 | �� |
| �� | � |
� |
� | �� | � |
� |
� | �� | � |
� |
� | �� | � |
� |
� | �� | � |
� |
� | |
�
| (1) | Relate to collateralized exposures where a specified ratio of LTV is maintained. |
Nomura reviews internal ratings at least once a year by using available credit information of obligors including financial statements and other information. Internal ratings are also reviewed more frequently for high-risk obligors or problematic exposures and any significant credit event of obligors will trigger an immediate credit review process.
�
F-69
Table of Contents
Notes to the Interim Consolidated Financial Statements�(Continued) (UNAUDITED)
�
8. Leases:
Lessor
Nomura leases office buildings and aircraft in Japan and overseas. These leases are classified as operating leases and the related assets are stated at cost, net of accumulated depreciation, except for land, which is stated at cost in the consolidated balance sheets and reported within Other assets�Office buildings, land, equipment and facilities.
The following table presents the types of assets which Nomura leases under operating leases:
�
| � | �� | Millions of yen | � | |||||||||||||||||||||
| � | �� | March�31, 2014 | � | �� | September�30, 2014 | � | ||||||||||||||||||
| � | �� | Cost | � | �� | Accumulated depreciation |
� | � | Net�carrying amount |
� | �� | Cost | � | �� | Accumulated depreciation |
� | � | Net�carrying amount |
� | ||||||
| Real estate(1) |
�� | � | 3,447 | �� | �� | � | (1,334 | )� | � | � | 2,113 | �� | �� | � | 3,448 | �� | �� | � | (1,388 | )� | � | � | 2,060 | �� |
| Aircraft |
�� | � | 8,269 | �� | �� | � | (954 | )� | � | � | 7,315 | �� | �� | � | 15,917 | �� | �� | � | (1,234 | )� | � | � | 14,683 | �� |
| �� | � |
� |
� | �� | � |
� |
� | � | � |
� |
� | �� | � |
� |
� | �� | � |
� |
� | � | � |
� |
� | |
| Total |
�� | � | 11,716 | �� | �� | � | (2,288 | )� | � | � | 9,428 | �� | �� | � | 19,365 | �� | �� | � | (2,622 | )� | � | � | 16,743 | �� |
| �� | � |
� |
� | �� | � |
� |
� | � | � |
� |
� | �� | � |
� |
� | �� | � |
� |
� | � | � |
� |
� | |
�
| (1) | The amounts of cost, accumulated depreciation and net carrying amount are including those for the portion utilized by Nomura. |
Nomura recognized rental income of �999�million and �805�million for the six and three months ended September�30, 2013, respectively, and �558�million and �167�million for the six and three months ended September�30, 2014, respectively. These are included in the consolidated statements of income within Revenue�Other.
The future minimum lease payments to be received on non-cancellable operating leases as of September�30, 2014 were �14,871�million and these future minimum payments to be received are scheduled as below:
�
| � | �� | Millions of yen | � | |||||||||||||||||||||||||
| � | �� | � | � | �� | Years of receipt | � | ||||||||||||||||||||||
| � | �� | Total | � | �� | Less�than 1�year |
� | �� | 1 to 2 years |
� | �� | 2 to 3 years |
� | �� | 3 to 4 years |
� | �� | 4�to�5 years |
� | �� | More�than 5�years |
� | |||||||
| Future�minimum�lease payments�to�be�received |
�� | � | 14,871 | �� | �� | � | 1,811 | �� | �� | � | 1,784 | �� | �� | � | 1,614 | �� | �� | � | 1,438 | �� | �� | � | 1,117 | �� | �� | � | 7,107 | �� |
�
F-70
Table of Contents
Notes to the Interim Consolidated Financial Statements�(Continued) (UNAUDITED)
�
Lessee
Nomura leases its office space, certain employees� residential facilities and other facilities in Japan and overseas primarily under cancelable operating lease agreements which are customarily renewed upon expiration. Nomura also leases certain equipment and facilities under non-cancelable operating leases. Rental expenses, net of sublease rental income, for the six and three months ended September�30, 2013 were �23,576�million and �11,642�million, respectively, and for the six and three months ended September�30, 2014 were �23,434�million and �11,603�million, respectively.
The following table presents future minimum lease payments under non-cancelable operating leases having initial or remaining terms in excess of one year as of September�30, 2014:
�
| � | �� | Millions�of�yen | � | |
| � | �� | September�30,�2014 | � | |
| Total future minimum lease payments |
�� | � | 159,714 | �� |
| Less: Sublease rental income |
�� | � | (8,114 | )� |
| �� | � |
� |
� | |
| Net future minimum lease payments |
�� | � | 151,600 | �� |
| �� | � |
� |
� | |
The future minimum lease payments above are scheduled as below as of September�30, 2014:
�
| � | �� | Millions of yen | � | |||||||||||||||||||||||||
| � | �� | � | � | �� | Years of payment | � | ||||||||||||||||||||||
| � | �� | Total | � | �� | Less�than 1�year |
� | �� | 1 to 2 years |
� | �� | 2 to 3 years |
� | �� | 3 to 4 years |
� | �� | 4 to 5 years |
� | �� | More�than 5�years |
� | |||||||
| Future minimum lease payments |
�� | � | 159,714 | �� | �� | � | 18,024 | �� | �� | � | 15,863 | �� | �� | � | 14,060 | �� | �� | � | 12,808 | �� | �� | � | 11,806 | �� | �� | � | 87,153 | �� |
Nomura leases certain equipment and facilities in Japan and overseas under capital lease agreements. If the lease is classified as a capital lease, Nomura recognizes it at the lower of the fair value or present value of minimum lease payments, which is reported within Other assets�Office buildings, land, equipment and facilities in the consolidated balance sheets. The amount of capital lease assets as of March�31, 2014 and September�30, 2014 were �33,294�million and �34,443�million, respectively, and accumulated depreciations on such capital lease assets as of March�31, 2014 and September�30, 2014 were �4,579�million and �5,400�million, respectively.
The following table presents future minimum lease payments under capital leases as of September�30, 2014:
�
| � | �� | Millions�of�yen | � | |
| � | �� | September�30,�2014 | � | |
| Total future minimum lease payments |
�� | � | 67,193 | �� |
| Less: Amount representing interest |
�� | � | (36,306 | )� |
| �� | � |
� |
� | |
| Present value of net future minimum lease payments |
�� | � | 30,887 | �� |
| �� | � |
� |
� | |
The future minimum lease payments above are scheduled as below as of September�30, 2014:
�
| � | �� | Millions of yen | � | |||||||||||||||||||||||||
| � | �� | � | � | �� | Years of payment | � | ||||||||||||||||||||||
| � | �� | Total | � | �� | Less�than 1�year |
� | �� | 1 to 2 years |
� | �� | 2 to 3 years |
� | �� | 3 to 4 years |
� | �� | 4 to 5 years |
� | �� | More�than 5�years |
� | |||||||
| Future minimum lease payments |
�� | � | 67,193 | �� | �� | � | 1,795 | �� | �� | � | 4,429 | �� | �� | � | 4,417 | �� | �� | � | 4,239 | �� | �� | � | 4,276 | �� | �� | � | 48,037 | �� |
Certain leases contain renewal options or escalation clauses providing for increased rental payments based upon maintenance, utilities and tax increases.
�
F-71
Table of Contents
Notes to the Interim Consolidated Financial Statements�(Continued) (UNAUDITED)
�
9. Other assets�Other / Other liabilities:
The following table sets forth Other assets�Other and Other liabilities in the consolidated balance sheets by type.
�
| � | �� | Millions of yen | � | |||||
| � | �� | March�31,�2014 | � | �� | September�30,�2014 | � | ||
| Other assets�Other: |
�� | �� | ||||||
| Securities received as collateral |
�� | � | 236,808 | �� | �� | � | 167,908 | �� |
| Goodwill and other intangible assets(1) |
�� | � | 115,143 | �� | �� | � | 116,754 | �� |
| Deferred tax assets |
�� | � | 22,018 | �� | �� | � | 25,997 | �� |
| Investments in equity securities for other than operating purposes |
�� | � | 133,742 | �� | �� | � | 128,269 | �� |
| Other |
�� | � | 276,463 | �� | �� | � | 298,142 | �� |
| �� | � |
� |
� | �� | � |
� |
� | |
| Total |
�� | � | 784,174 | �� | �� | � | 737,070 | �� |
| �� | � |
� |
� | �� | � |
� |
� | |
| Other liabilities: |
�� | �� | ||||||
| Obligation to return securities received as collateral |
�� | � | 236,808 | �� | �� | � | 167,908 | �� |
| Accrued income taxes |
�� | � | 31,630 | �� | �� | � | 33,577 | �� |
| Other accrued expenses and provisions |
�� | � | 396,677 | �� | �� | � | 351,374 | �� |
|
Other(2) |
�� | � | 476,635 | �� | �� | � | 528,019 | �� |
| �� | � |
� |
� | �� | � |
� |
� | |
| Total |
�� | � | 1,141,750 | �� | �� | � | 1,080,878 | �� |
| �� | � |
� |
� | �� | � |
� |
� | |
�
| (1) | For the year ended March�31, 2014 and three months ended September�30, 2014, Nomura recognized impairment losses on goodwill of �2,840�million and �3,188�million, respectively, within Other in Nomura�s segment information. These are due to declines in the fair values of a reporting unit caused by decreases in expected cash flows arising from the changes in the economic environment. These impairment losses were recorded within Non-interest expenses�Other in the consolidated statements of income. The fair values were determined using DCF valuation techniques. |
| (2) | Includes the liabilities relating to the investment contracts which were underwritten by the insurance subsidiary. The amounts of carrying values were �270,950�million and �274,991�million and estimated fair values were �263,746�million and �267,100�million, as of March�31, 2014 and as of September�30, 2014, respectively. Fair value is estimated by discounting future cash flows and using valuation inputs which would be generally classified in Level 3 of the fair value hierarchy. |
�
F-72
Table of Contents
Notes to the Interim Consolidated Financial Statements�(Continued) (UNAUDITED)
�
10. Earnings per share:
A reconciliation of the amounts and the numbers used in the calculation of net income attributable to NHI shareholders per share (basic and diluted) is as follows:
�
| � | �� | Millions of yen except per share data presented in yen |
� | |||||
| � | �� | Six�months�ended September�30 | � | |||||
| � | �� | 2013 | � | �� | 2014 | � | ||
| Basic� |
�� | �� | ||||||
| Net income attributable to NHI shareholders |
�� | � | 104,006 | �� | �� | � | 72,732 | �� |
| Weighted average number of shares outstanding |
�� | � | 3,705,694,494 | �� | �� | � | 3,660,114,608 | �� |
| Net income attributable to NHI shareholders per share |
�� | � | 28.07 | �� | �� | � | 19.87 | �� |
| �� | � |
� |
� | �� | � |
� |
� | |
| Diluted� |
�� | �� | ||||||
| Net income attributable to NHI shareholders |
�� | � | 103,983 | �� | �� | � | 72,714 | �� |
| Weighted average number of shares outstanding |
�� | � | 3,822,691,418 | �� | �� | � | 3,759,340,816 | �� |
| Net income attributable to NHI shareholders per share |
�� | � | 27.20 | �� | �� | � | 19.34 | �� |
| �� | � |
� |
� | �� | � |
� |
� | |
�
| � | �� | Millions of yen except per share data presented in yen |
� | |||||
| � | �� | Three�months�ended September�30 | � | |||||
| � | �� | 2013 | � | �� | 2014 | � | ||
| Basic� |
�� | �� | ||||||
| Net income attributable to NHI shareholders |
�� | � | 38,112 | �� | �� | � | 52,872 | �� |
| Weighted average number of shares outstanding |
�� | � | 3,704,475,301 | �� | �� | � | 3,638,479,123 | �� |
| Net income attributable to NHI shareholders per share |
�� | � | 10.29 | �� | �� | � | 14.53 | �� |
| �� | � |
� |
� | �� | � |
� |
� | |
| Diluted� |
�� | �� | ||||||
| Net income attributable to NHI shareholders |
�� | � | 38,107 | �� | �� | � | 52,861 | �� |
| Weighted average number of shares outstanding |
�� | � | 3,813,266,130 | �� | �� | � | 3,736,423,754 | �� |
| Net income attributable to NHI shareholders per share |
�� | � | 9.99 | �� | �� | � | 14.15 | �� |
| �� | � |
� |
� | �� | � |
� |
� | |
Net income attributable to NHI shareholders is adjusted to reflect the decline in Nomura�s equity share of earnings of subsidiaries and affiliates for the six and three months ended September�30, 2013 and 2014, arising from options to purchase common shares issued by subsidiaries and affiliates.
The weighted average number of shares used in the calculation of diluted EPS reflects the increase in potential issuance of common shares arising from stock-based compensation plans issued by the Company, which would have minimal impact on EPS for the six and three months ended September�30, 2013 and 2014.
Antidilutive stock options to purchase 6,270,500 common shares and 2,374,500 common shares were not included in the computation of diluted EPS for the six and three months ended September 30, 2013, respectively. Antidilutive stock options to purchase 8,941,100 common shares were not included in the computation of diluted EPS for the six and three months ended September 30, 2014, respectively.
�
F-73
Table of Contents
Notes to the Interim Consolidated Financial Statements�(Continued) (UNAUDITED)
�
11. Employee benefit plans:
Nomura provides various pension plans and other post-employment benefits which cover certain employees worldwide. In addition, Nomura provides health care benefits to certain active and retired employees through its Nomura Securities Health Insurance Society.
Net periodic benefit cost
The net periodic benefit cost of the defined benefit plans includes the following components.
Japanese entities� plans�
�
| � | �� | Millions of yen | � | |||||
| � | �� | Six�months�ended September�30 |
� | |||||
| � | �� | 2013 | � | � | 2014 | � | ||
| Service cost |
�� | � | 4,237 | �� | � | � | 3,882 | �� |
| Interest cost |
�� | � | 1,721 | �� | � | � | 1,545 | �� |
| Expected return on plan assets |
�� | � | (2,486 | )� | � | � | (2,866 | )� |
| Amortization of net actuarial losses |
�� | � | 1,336 | �� | � | � | 1,063 | �� |
| Amortization of prior service cost |
�� | � | (574 | )� | � | � | (573 | )� |
| �� | � |
� |
� | � | � |
� |
� | |
| Net periodic benefit cost |
�� | � | 4,234 | �� | � | � | 3,051 | �� |
| �� | � |
� |
� | � | � |
� |
� | |
| � | �� | Millions of yen | � | |||||
| � | �� | Three�months�ended September�30 |
� | |||||
| � | �� | 2013 | � | � | 2014 | � | ||
| Service cost |
�� | � | 2,070 | �� | � | � | 1,945 | �� |
| Interest cost |
�� | � | 861 | �� | � | � | 772 | �� |
| Expected return on plan assets |
�� | � | (1,243 | )� | � | � | (1,433 | )� |
| Amortization of net actuarial losses |
�� | � | 668 | �� | � | � | 589 | �� |
| Amortization of prior service cost |
�� | � | (287 | )� | � | � | (285 | )� |
| �� | � |
� |
� | � | � |
� |
� | |
| Net periodic benefit cost |
�� | � | 2,069 | �� | � | � | 1,588 | �� |
| �� | � |
� |
� | � | � |
� |
� | |
Nomura also recognized net periodic benefit cost of plans other than Japanese entities� plans, which are not significant.
12. Restructuring initiatives:
During the second quarter of the year ended March�31, 2013, Nomura undertook a further restructuring initiatives focusing on its Wholesale Division to revise business models and increase business efficiencies. These restructuring initiatives were largely completed during the year ended March�31, 2014 and therefore the amount of further restructuring cost to be incurred going forward is not expected to be material.
As a result of this restructuring initiative, Nomura recognized a cumulative total of �18,238�million of restructuring costs as of September�30, 2014. These restructuring costs were primarily reported within Non-interest expenses�Compensation and benefits in the consolidated statements of income. Nomura didn�t recognize the restructuring costs in the consolidated statements of income during the six months ended September�30, 2014. Outstanding liabilities relating to these restructuring costs including currency translation adjustments were �3,760�million as of March�31, 2014 and �2,668�million as of September�30, 2014. For the six months ended September�30, 2014, �1,198�million of these liabilities was settled.
�
F-74
Table of Contents
Notes to the Interim Consolidated Financial Statements�(Continued) (UNAUDITED)
�
13. Income taxes:
Our effective statutory tax rates were 38% for the six and three months ended September�30, 2013 and 36% for the six and three�months ended September�30, 2014, respectively. Due to the revisions of domestic tax laws during the third�quarter ended December�31, 2011 and the fourth quarter ended March�31, 2014, our effective statutory tax rates are 38% for the fiscal years beginning between April�1, 2012 and March�31, 2014, and 36% thereafter.
For the six months ended September�30, 2013, the difference between the effective statutory tax rate of 38% and the effective tax rate of 43.8% was mainly due to non-deductible expenses, different tax rates and changes in effective statutory tax rates applicable to income (loss) of foreign subsidiaries, whereas non-taxable revenues and a decrease in valuation allowance of foreign subsidiaries reduced the effective tax rate.
For the three months ended September�30, 2013, the difference between the effective statutory tax rate of 38% and the effective tax rate of 47.4% was mainly due to non-deductible expenses, different tax rates and changes in effective statutory tax rates applicable to income (loss) of foreign subsidiaries, whereas non-taxable revenues and a decrease in valuation allowance of foreign subsidiaries reduced the effective tax rate.
For the six months ended September�30, 2014, the difference between the effective statutory tax rate of 36% and the effective tax rate of 40.8% was mainly due to non-deductible expenses, an increase in valuation allowance of foreign subsidiaries, whereas non-taxable revenue reduced the effective tax rate.
For the three months ended September�30, 2014, the difference between the effective statutory tax rate of 36% and the effective tax rate of 28.3% was mainly due to non-taxable revenue, different tax rates in effective statutory tax rates applicable to income (loss) of foreign subsidiaries, whereas non-deductible expenses increased the effective tax rate.
�
F-75
Table of Contents
Notes to the Interim Consolidated Financial Statements�(Continued) (UNAUDITED)
�
14. Other comprehensive income (loss):
Changes in accumulated other comprehensive income (loss) are as follows:
�
| � | �� | Millions of yen | � | |||||||||||||||||
| � | �� | Six months ended September�30, 2013 | � | |||||||||||||||||
| � | �� | Balance�at beginning of year |
� | � | Other comprehensive income (loss) before reclassifications |
� | �� | Reclassifications�out�of accumulated other comprehensive income�(loss)(1) |
� | � | Net�change during�the period |
� | �� | Balance�at end�of�period |
� | |||||
| Cumulative translation adjustments |
�� | � | (38,875 | )� | � | � | 26,987 | �� | �� | � | (85 | )� | � | � | 26,902 | �� | �� | � | (11,973 | )� |
| Pension liability adjustment |
�� | � | (28,518 | )� | � | � | 807 | �� | �� | � | 495 | �� | � | � | 1,302 | �� | �� | � | (27,216 | )� |
| Net unrealized gain on non-trading securities |
�� | � | 9,998 | �� | � | � | 1,507 | �� | �� | � | (895 | )� | � | � | 612 | �� | �� | � | 10,610 | �� |
| �� | � |
� |
� | � | � |
� |
� | �� | � |
� |
� | � | � |
� |
� | �� | � |
� |
� | |
| Total |
�� | � | (57,395 | )� | � | � | 29,301 | �� | �� | � | (485 | )� | � | � | 28,816 | �� | �� | � | (28,579 | )� |
| �� | � |
� |
� | � | � |
� |
� | �� | � |
� |
� | � | � |
� |
� | �� | � |
� |
� | |
�
| (1) | Reclassifications out of accumulated other comprehensive income (loss) are as follows: |
�
| � | �� | Millions of yen | ||||
| � | �� | Six months ended September�30, 2013 | ||||
| � | �� | Reclassifications�out�of accumulated other comprehensive�income�(loss) |
� | � | Affected line items in consolidated statements of income | |
| Net unrealized gain on non-trading securities: |
�� | � | ||||
| �� | � | 1,708 | �� | � | Gain (loss) on investments in equity securities | |
| �� | � | (502 | )� | � | Income tax expense | |
| �� | � |
� |
� | � | ||
| �� | � | 1,206 | �� | � | Net income | |
| �� | � |
� |
� | � | ||
| �� | � | (311 | )� | � | Net income attributable to noncontrolling interests | |
| �� | � | 895 | �� | � | Net�income�attributable�to�NHI shareholders | |
| �� | � |
� |
� | � | ||
Changes in accumulated other comprehensive income (loss) are as follows:
�
| � | �� | Millions of yen | � | |||||||||||||||||
| � | �� | Six months ended September�30, 2014 | � | |||||||||||||||||
| � | �� | Balance�at beginning of year |
� | � | Other comprehensive income (loss) before reclassifications |
� | � | Reclassifications�out�of accumulated other comprehensive income�(loss)(1) |
� | � | Net�change during�the period |
� | �� | Balance�at end�of�period |
� | |||||
| Cumulative translation adjustments |
�� | � | 27,704 | �� | � | � | 44,427 | �� | � | � | (49 | )� | � | � | 44,378 | �� | �� | � | 72,082 | �� |
| Pension liability adjustment |
�� | � | (18,809 | )� | � | � | (157 | )� | � | � | 320 | �� | � | � | 163 | �� | �� | � | (18,646 | )� |
| Net unrealized gain on non-trading securities |
�� | � | 11,741 | �� | � | � | 5,569 | �� | � | � | (213 | )� | � | � | 5,356 | �� | �� | � | 17,097 | �� |
| �� | � |
� |
� | � | � |
� |
� | � | � |
� |
� | � | � |
� |
� | �� | � |
� |
� | |
| Total |
�� | � | 20,636 | �� | � | � | 49,839 | �� | � | � | 58 | �� | � | � | 49,897 | �� | �� | � | 70,533 | �� |
| �� | � |
� |
� | � | � |
� |
� | � | � |
� |
� | � | � |
� |
� | �� | � |
� |
� | |
�
| (1) | Reclassifications out of accumulated other comprehensive income (loss) are as follows: |
�
| � | �� | Millions of yen | ||||
| � | �� | Six months ended September�30, 2014 | ||||
| � | �� | Reclassifications�out�of accumulated other comprehensive�income�(loss) |
� | � | Affected line items in consolidated statements of income | |
| Net unrealized gain on non-trading securities: |
�� | � | ||||
| �� | � | 435 | �� | � | Gain�(loss)�on�investments�in equity securities | |
| �� | � | (149 | )� | � | Income tax expense | |
| �� | � |
� |
� | � | ||
| �� | � | 286 | �� | � | Net income | |
| �� | � |
� |
� | � | ||
| �� | � | (73 | )� | � | Net income attributable to noncontrolling interests | |
| �� | � | 213 | �� | � | Net�income�attributable�to�NHI shareholders | |
| �� | � |
� |
� | � | ||
See Note 5. �Non-trading securities� for further information.
�
F-76
Table of Contents
Notes to the Interim Consolidated Financial Statements�(Continued) (UNAUDITED)
�
Changes in accumulated other comprehensive income (loss) are as follows:
�
| � | � | Millions of yen | � | |||||||||||||||||
| � | � | Three months ended September�30, 2013 | � | |||||||||||||||||
| � | � | Balance�at beginning of period |
� | � | Other comprehensive income (loss) before reclassifications |
� | � | Reclassifications�out�of accumulated other comprehensive income�(loss)(1) |
� | � | Net�change during�the period |
� | � | Balance�at end�of�period |
� | |||||
| Cumulative translation adjustments |
� | � | (6,532 | )� | � | � | (5,407 | )� | � | � | (34 | )� | � | � | (5,441 | )� | � | � | (11,973 | )� |
| Pension liability adjustment |
� | � | (27,494 | )� | � | � | 31 | �� | � | � | 247 | �� | � | � | 278 | �� | � | � | (27,216 | )� |
| Net unrealized gain on non-trading securities |
� | � | 8,216 | �� | � | � | 2,460 | �� | � | � | (66 | )� | � | � | 2,394 | �� | � | � | 10,610 | �� |
| � | � |
� |
� | � | � |
� |
� | � | � |
� |
� | � | � |
� |
� | � | � |
� |
� | |
| Total |
� | � | (25,810 | )� | � | � | (2,916 | )� | � | � | 147 | �� | � | � | (2,769 | )� | � | � | (28,579 | )� |
| � | � |
� |
� | � | � |
� |
� | � | � |
� |
� | � | � |
� |
� | � | � |
� |
� | |
�
| (1) | Reclassifications out of accumulated other comprehensive income (loss) are as follows: |
�
| � | �� | Millions of yen | ||||
| � | �� | Three months ended September�30, 2013 | ||||
| � | �� | Reclassifications�out�of accumulated other comprehensive�income�(loss) |
� | � | Affected�line�items�in�consolidated statements of income | |
| Net unrealized gain on non-trading securities: |
�� | � | ||||
| �� | � | 153 | �� | � | Gain�(loss)�on�investments�in equity securities | |
| �� | � | (65 | )� | � | Income tax expense | |
| �� | � |
� |
� | � | ||
| �� | � | 88 | �� | � | Net income | |
| �� | � |
� |
� | � | ||
| �� | � | (22 | )� | � | Net income attributable to noncontrolling interests | |
| �� | � | 66 | �� | � | Net�income�attributable�to�NHI shareholders | |
| �� | � |
� |
� | � | ||
Changes in accumulated other comprehensive income (loss) are as follows:
�
| � | �� | Millions of yen | � | |||||||||||||||||
| � | �� | Three months ended September�30, 2014 | � | |||||||||||||||||
| � | �� | Balance�at beginning of period |
� | � | Other comprehensive income (loss) before reclassifications |
� | � | Reclassifications�out�of accumulated other comprehensive income�(loss)(1) |
� | � | Net�change during�the period |
� | � | Balance�at end�of�period |
� | |||||
| Cumulative translation adjustments |
�� | � | 16,250 | �� | � | � | 55,763 | �� | � | � | 69 | �� | � | � | 55,832 | �� | � | � | 72,082 | �� |
| Pension liability adjustment |
�� | � | (18,591 | )� | � | � | (251 | )� | � | � | 196 | �� | � | � | (55 | )� | � | � | (18,646 | )� |
| Net unrealized gain on non-trading securities |
�� | � | 13,890 | �� | � | � | 3,375 | �� | � | � | (168 | )� | � | � | 3,207 | �� | � | � | 17,097 | �� |
| �� | � |
� |
� | � | � |
� |
� | � | � |
� |
� | � | � |
� |
� | � | � |
� |
� | |
| Total |
�� | � | 11,549 | �� | � | � | 58,887 | �� | � | � | 97 | �� | � | � | 58,984 | �� | � | � | 70,533 | �� |
| �� | � |
� |
� | � | � |
� |
� | � | � |
� |
� | � | � |
� |
� | � | � |
� |
� | |
�
| (1) | Reclassifications out of accumulated other comprehensive income (loss) are as follows: |
�
| � | �� | Millions of yen | ||||
| � | �� | Three months ended September�30, 2014 | ||||
| � | �� | Reclassifications�out�of accumulated other comprehensive�income�(loss) |
� | � | Affected�line�items�in�consolidated statements of income | |
| Net unrealized gain on non-trading securities: |
�� | � | ||||
| �� | � | 341 | �� | � | Gain�(loss)�on�investments�in equity securities | |
| �� | � | (116 | )� | � | Income tax expense | |
| �� | � |
� |
� | � | ||
| �� | � | 225 | �� | � | Net income | |
| �� | � |
� |
� | � | ||
| �� | � | (57 | )� | � | Net income attributable to noncontrolling interests | |
| �� | � | 168 | �� | � | Net�income�attributable�to�NHI shareholders | |
| �� | � |
� |
� | � | ||
See Note 5 �Non-trading securities� for further information.
�
F-77
Table of Contents
Notes to the Interim Consolidated Financial Statements�(Continued) (UNAUDITED)
�
15. Commitments, contingencies and guarantees:
Commitments�
Credit and investment commitments
In connection with its banking and financing activities, Nomura provides commitments to extend credit which generally have fixed expiration dates. In connection with its investment banking activities, Nomura enters into agreements with clients under which Nomura commits to underwrite notes that may be issued by clients. The outstanding commitments under these agreements are included in below commitments to extend credit.
Nomura has commitments to invest in various partnerships and other entities, primarily in connection with its merchant banking activities, and also has commitments to provide financing for investments related to these partnerships. The outstanding commitments under these agreements are included in below commitments to invest in partnerships.
Certain consolidated VIEs which are engaged in the aircraft leasing business have commitments to purchase aircraft. The outstanding commitments under these agreements are included in below commitments to purchase aircraft.
These commitments outstanding were as follows:
�
| � | �� | Millions of yen | � | |||||
| � | �� | March�31,�2014 | � | �� | September�30,�2014 | � | ||
| Commitments to extend credit |
�� | � | 479,634 | �� | �� | � | 514,715 | �� |
| Commitments to invest in partnerships |
�� | � | 18,460 | �� | �� | � | 24,864 | �� |
| Commitments to purchase aircraft |
�� | � | 4,409 | �� | �� | � | ��� | � |
As of September�30, 2014, these commitments had the following maturities:
�
| � | �� | Millions of yen | � | |||||||||||||||||
| � | �� | � | � | �� | Years to Maturity | � | ||||||||||||||
| � | �� | Total contractual amount |
� | �� | Less�than 1 year |
� | �� | 1 to 3 years |
� | �� | 3 to 5 years |
� | �� | More�than 5 years |
� | |||||
| Commitments to extend credit |
�� | � | 514,715 | �� | �� | � | 82,500 | �� | �� | � | 64,065 | �� | �� | � | 173,498 | �� | �� | � | 194,652 | �� |
| Commitments to invest in partnerships |
�� | � | 24,864 | �� | �� | � | 6,990 | �� | �� | � | 1,085 | �� | �� | � | ��� | � | �� | � | 16,789 | �� |
| Commitments to purchase aircraft |
�� | � | ��� | � | �� | � | ��� | � | �� | � | ��� | � | �� | � | ��� | � | �� | � | ��� | � |
The contractual amounts of these commitments to extend credit represent the amounts at risk but only if the contracts are fully drawn upon, should the counterparties default, and assuming the value of any existing collateral becomes worthless. The total contractual amount of these commitments may not represent future credit exposure or cash requirements since the commitments may expire without being drawn upon. The credit risk associated with these commitments varies depending on the clients� creditworthiness and the value of collateral held. Nomura evaluates each client�s creditworthiness on a case-by-case basis. The amount of collateral obtained, if deemed necessary by Nomura upon extension of credit, is based on credit evaluation of the counterparty.
�
F-78
Table of Contents
Notes to the Interim Consolidated Financial Statements�(Continued) (UNAUDITED)
�
Contingencies�
Investigations, lawsuits and other legal proceedings
In the normal course of business as a global financial services entity, Nomura is involved in investigations, lawsuits and other legal proceedings and, as a result, may suffer loss from any fines, penalties or damages awarded against Nomura, any settlements Nomura chooses to make to resolve a matter, and legal and other advisory costs incurred to support and formulate a defense.
The ability to predict the outcome of these actions and proceedings is inherently difficult, particularly where claimants are seeking substantial or indeterminate damages, where investigations and legal proceedings are at an early stage, where the matters present novel legal theories or involve a large number of parties, or which take place in foreign jurisdictions with complex or unclear laws.
The Company regularly evaluates each legal proceeding and claim on a case-by-case basis in consultation with external legal counsel to assess whether an estimate of possible loss or range of loss can be made, if recognition of a liability is not appropriate. In accordance with ASC 450 �Contingencies� (�ASC 450�), the Company recognizes a liability for this risk of loss arising on each individual matter when a loss is probable and the amount of such loss or range of loss can be reasonably estimated. The amount recognized as a liability is reviewed at least quarterly and is revised when further information becomes available. If these criteria are not met for an individual matter, such as if an estimated loss is only reasonably possible rather than probable, no liability is recognized. However, where a material loss is reasonably possible, the Company will disclose details of the legal proceeding or claim below. Under ASC 450 an event is defined as reasonably possible if the chance of the loss to the Company is more than remote but less than probable.
The most significant actions and proceedings against Nomura are summarized below. The Company believes that, based on current information available as of the date of these consolidated financial statements, the ultimate resolution of these actions and proceedings will not be material to the Company�s financial condition. However, an adverse outcome in certain of these matters could have a material adverse effect on the consolidated statements of income or cash flows in a particular quarter or annual period.
For those significant actions and proceedings described below where the counterparty has alleged a specific amount of damages, the Company currently estimates that the reasonably possible loss for the matter would not exceed the amount specified in each case. For each of these matters, the specific amount alleged (which is the Company�s current estimate of the maximum reasonably possible loss) is indicated in the description of the matter below. For certain other significant actions and proceedings, the Company is unable to provide an estimate of the reasonably possible loss or range of reasonably possible losses because, among other reasons, (i)�the proceedings are at such an early stage there is not enough information available to assess whether the stated grounds for the claim are viable; (ii)�damages have not been identified by the claimant; (iii)�damages are unsupported and/or exaggerated; (iv)�there is uncertainty as to the outcome of pending appeals or motions; (v)�there are significant legal issues to be resolved that may be dispositive, such as the applicability of statutes of limitations; and/or (vi)�there are novel or unsettled legal theories underlying the claims.
In January 2008, Nomura International plc (�NIP�) was served with a tax notice issued by the tax authorities in Pescara, Italy alleging breaches by NIP of the U.K.-Italy Double Taxation Treaty of 1998 (the �Tax Notice�). The alleged breaches relate to payments to NIP of tax credits on dividends on Italian shares. The Tax Notice not only denies certain payments to which NIP claims to be entitled but also seeks reimbursement of approximately EUR 33.8�million, plus interest, already refunded. NIP continues vigorously to challenge the Pescara Tax Court�s decisions in favor of the local tax authorities. The specified amount alleged is the Company�s current estimate of the maximum reasonably possible loss from this matter.
In October 2010 and June 2012, two actions were brought against NIP, seeking recovery of payments allegedly made to NIP by Fairfield Sentry Ltd. and Fairfield Sigma Ltd. (collectively, the �Fairfield Funds�), which are now in liquidation and were feeder funds to Bernard L. Madoff Investment Securities LLC (in liquidation pursuant to the Securities Investor Protection Act in the U.S. since December 2008) (�BLMIS�). The first suit was brought by the liquidators of the Fairfield Funds. It was filed on October�5, 2010 in the Supreme Court of the State of New York, but was subsequently removed to the U.S. Bankruptcy Court, where it is presently pending. The second suit was brought by the Trustee for the liquidation of BLMIS (the �Madoff Trustee�). NIP was added as a defendant in June 2012 when the Madoff Trustee filed an amended complaint in the U.S. Bankruptcy Court. Both actions seek to recover approximately $35 million. The $35 million amount is the Company�s current estimate of the maximum reasonably possible loss from this matter.
�
F-79
Table of Contents
Notes to the Interim Consolidated Financial Statements�(Continued) (UNAUDITED)
�
In March 2011, PT Bank Mutiara Tbk. (�Bank Mutiara�) commenced proceedings in the Commercial Court of the Canton of Zurich against a special purpose entity (�SPE�) established at the request of NIP. These are proceedings to challenge the SPE�s rights over approximately $156 million in an account held in Switzerland. The SPE, which is consolidated by NIP, has a security interest over the money pursuant to a loan facility with Telltop Holdings Limited, a third party company. Telltop Holdings Limited is currently in liquidation. The SPE does not believe that Bank Mutiara has any enforceable security interest over the funds and is seeking release of the monies. NIP was notified on October�2, 2014 that the court has found that the SPE alone is entitled to the funds. Bank Mutiara has appealed this decision. NIP will vigorously contest the appeal. Due to the uncertainties involved, the Company cannot currently estimate the maximum reasonably possible loss from this matter but believes it is significantly less than the amount referred to above, as supported by the court�s conclusion.
In April 2011, the Federal Home Loan Bank of Boston (�FHLB-Boston�) commenced proceedings in the Superior Court of Massachusetts against numerous issuers, sponsors and underwriters of residential mortgage-backed securities (�RMBS�), and their controlling persons, including Nomura Asset Acceptance Corporation (�NAAC�), Nomura Credit�& Capital, Inc. (�NCCI�), Nomura Securities International, Inc. (�NSI�) and Nomura Holding America Inc. (�NHA�). The action alleges that FHLB-Boston purchased RMBS issued by NAAC for which the offering materials contained untrue statements or omitted material facts concerning the underwriting standards used by the original lenders and the characteristics of the loans underlying the securities. FHLB-Boston seeks rescission of its purchases or compensatory damages pursuant to state law. FHLB-Boston alleges that it purchased certificates in four offerings issued by NAAC in the original principal amount of approximately $406 million. Due to the legal and factual uncertainties involved, the Company cannot provide an estimate of reasonably possible loss related to this matter at this time.
In July 2011, the National Credit Union Administration Board (�NCUA�) commenced proceedings in the United States District Court for the Central District of California as liquidating agent of Western Corporate Federal Credit Union (�WesCorp�) against various issuers, sponsors and underwriters of RMBS purchased by WesCorp. The complaint alleges that WesCorp purchased RMBS issued by NAAC and Nomura Home Equity Loan Inc. (�NHEL�), among others, for which the offering materials contained untrue statements or omitted material facts concerning the underwriting standards used by the original lenders. The complaint alleges that WesCorp purchased certificates in two offerings in the original principal amount of approximately $83 million and seeks rescission of its purchases or compensatory damages. The court has dismissed NCUA�s claims against NHEL and NCUA has appealed to the Ninth Circuit and the appeal is pending. NCUA�s claim against NAAC is proceeding. Due to the legal and factual uncertainties involved, the Company cannot provide an estimate of reasonably possible loss related to this matter at this time.
In September 2011, the Federal Housing Finance Agency (�FHFA�), as conservator for the government sponsored enterprises, Federal National Mortgage Association and Federal Home Loan Mortgage Corporation (the �GSEs�), commenced proceedings in the United States District Court for the Southern District of New York against numerous issuers, sponsors and underwriters of RMBS, and their controlling persons, including NAAC, NHEL, NCCI, NSI and NHA, (the Company�s U.S. subsidiaries). The action alleges that the GSEs purchased RMBS issued by NAAC and NHEL for which the offering materials contained untrue statements or omitted material facts concerning the underwriting standards used by the original lenders and the characteristics of the loans underlying the securities. FHFA alleges that the GSEs purchased certificates in seven offerings in the original principal amount of approximately $2,046 million and seeks rescission of its purchases or compensatory damages. The court has denied the motion to dismiss filed by the Company�s U.S. subsidiaries and the parties are involved in expert discovery. Due to certain legal uncertainties, the Company cannot provide an estimate of reasonably possible loss related to this matter at this time.
In October 2011, the NCUA commenced proceedings in the United States District Court for the District of Kansas as liquidating agent of U.S. Central Federal Credit Union (�U.S. Central�) against various issuers, sponsors and underwriters of RMBS purchased by U.S. Central, including NHEL. The complaint alleges that U.S. Central purchased RMBS issued by NHEL, among others, for which the offering materials contained untrue statements or omitted material facts concerning the underwriting standards used by the original lenders. The complaint alleges that U.S. Central purchased a certificate in one offering in the original principal amount of approximately $50 million and seeks rescission of its purchase or compensatory damages. The court denied, in part, motions to dismiss filed by the defendants, and the Tenth Circuit Court of Appeals affirmed the trial court�s holding; the Supreme Court vacated that decision and remanded the matter to the Tenth Circuit Court of Appeals for reconsideration in light of recent Supreme Court authority. Upon remand, the Tenth Circuit reinstated its decision and NHEL has filed a petition for writ of certiorari to the Supreme Court. Due to the legal uncertainties involved, the Company cannot provide an estimate of reasonably possible loss related to this matter at this time.
In November 2011, NIP was served with a claim filed by the Madoff Trustee appointed for the liquidation of BLMIS in the United States Bankruptcy Court Southern District of New York. This is a clawback action similar to claims filed by the Madoff Trustee against numerous other institutions. The Madoff Trustee alleges that NIP received redemptions from the BLMIS feeder fund, Harley International (Cayman) Limited in the six years prior to December�11, 2008 (the date proceedings were commenced against BLMIS) and that these are avoidable and recoverable under the U.S. Bankruptcy Code and New York law. The amount that the Madoff Trustee is currently seeking to recover from NIP is approximately $21 million. The specified amount alleged is the Company�s current estimate of the maximum reasonably possible loss from this matter.
�
F-80
Table of Contents
Notes to the Interim Consolidated Financial Statements�(Continued) (UNAUDITED)
�
In August 2012, The Prudential Insurance Company of America and certain of its affiliates filed several complaints in the Superior Court of New Jersey against various issuers, sponsors and underwriters of RMBS, including an action against NHEL, NCCI and NSI. The action against these Nomura subsidiaries has been removed to federal court. The complaint alleges that the plaintiffs purchased over $183 million in RMBS from five different offerings. The plaintiffs allege that the offering materials contained fraudulent misrepresentations regarding the underwriting practices and quality of the loans underlying the securities. The plaintiffs allege causes of action for fraud, aiding and abetting fraud, negligent misrepresentation, and New Jersey Civil RICO, and seek to recover, among other things, compensatory and treble damages. NHEL, NCCI and NSI have filed a motion to dismiss the action which is pending before the court. Due to the lack of factual information at this early stage of the litigation and the legal uncertainties involved, the Company cannot provide an estimate of reasonably possible loss related to this matter at this time.
In March 2013, Banca Monte dei Paschi di Siena SpA (�MPS�) issued a claim in the Italian Courts against two former directors of MPS and NIP. MPS alleges that the former directors improperly caused MPS to enter into certain structured financial transactions with NIP in 2009 (the �Transactions�) and alleges that NIP is jointly liable for the unlawful conduct of MPS�s former directors. MPS is claiming damages of not less than EUR700 million. In July 2013, a claim was also issued against the same former directors of MPS, and NIP, by the shareholder group Fondazione Monte dei Paschi di Siena (�FMPS�). The grounds of the FMPS claim are similar to those on which the MPS claim is founded. The level of damages sought by FMPS is not specified. An investigation has also been commenced by the Public Prosecutor�s office in Siena, Italy into various allegations against MPS and certain of its former directors, including in relation to the Transactions. Starting on April�15, 2013, the Public Prosecutor in Siena issued seizure orders in relation to the Transactions seeking to seize the Transactions and approximately EUR 1.9 billion of assets said to be held or receivable in various NIP and Nomura Bank International plc (�NBI�) accounts in, or managed through, Italy and alleging that the Transactions involved offenses under Italian law. To date, these seizure orders have not been validated by the Italian Courts. The Public Prosecutor lodged an appeal against the Italian Courts� decisions, which was heard at the Supreme Court in Rome on March�25, 2014. The Supreme Court determined that the appeal should be denied in part, but that the case should be sent back to the lower court for further consideration in relation to one element of the case. At a hearing on September�17, 2014 where the seizure order was to be reconsidered, the Public Prosecutor�s office withdrew its seizure order appeal. This means that the seizure order proceedings in Siena have now concluded with no seizure order in place against NIP or NBI. However, the investigation file has now been transferred to the Public Prosecutor�s office in Milan which will continue the criminal investigation going forward. The extent or scope of that investigation is not currently clear. Additionally, NIP commenced a claim against MPS in the English Courts in March 2013. The claim is for declaratory relief confirming that the Transactions remain valid and contractually binding. MPS filed and served its Defence and Counterclaim to these proceedings in March 2014. MPS alleges in its Counterclaim that NIP is liable to make restitution of a net amount of approximately EUR 1.5 billion, and seeks declarations regarding the illegality and invalidity of the Transactions. NIP filed and served its Reply and Defence to Counterclaim in June 2014 and continues to vigorously defend its position in each of the aforementioned proceedings. It is not possible for the Company to estimate the amount of reasonably possible loss in these proceedings. Numerous legal and factual issues may need to be resolved, including through potentially lengthy discovery and determination of important factual matters, and by addressing novel or unsettled legal questions relevant to the proceedings in question, before the amount of any potential liability can be reasonably estimated for these claims. The Company cannot predict if, how, or when the claims will be resolved or what any eventual settlement, fine, penalty or other relief may be, particularly since the claims are at an early stage in their development and the claimants are seeking substantial damages.
On July�15, 2014, NIP received, with no advance notice, a seizure order dated July�7, 2014 from the Court in Palermo, Sicily (the �Court�) which has restricted receipt of a coupon payment of EUR 6.9�million that was due from the Region of Sicily (�Sicily�) to NIP in connection with certain interest rate derivatives transactions entered into in 2005 and 2006. On July�25, 2014, NIP also received, also with no advance notice, a seizure order dated July�23, 2014 from the Court which has placed restrictions on a further EUR 98.3�million of cash and other financial assets, said to be the alleged profit made by NIP in connection with certain transactions entered between 2001 and 2006. NIP successfully appealed the seizure order dated July�23, 2014, which has therefore been annulled by the Court in Palermo. The Public Prosecutor�s office in Palermo has appealed the annulment. NIP has also filed a separate appeal of the seizure order dated July 7, 2014. Both orders were limited to Nomura�s Italian operations and therefore not expected to have an impact on Nomura�s operation or activities outside of Italy. NIP continues to investigate the position. The current transaction with Sicily remains in force. No civil proceedings have been served on NIP. Given the lack of information available at the present time, and that numerous legal and factual issues may need to be investigated, it is not possible for the Company to estimate the amount of reasonably possible loss in this matter.
�
F-81
Table of Contents
Notes to the Interim Consolidated Financial Statements�(Continued) (UNAUDITED)
�
Nomura Securities Co., Ltd. (�NSC�) is the leading securities firm in Japan with approximately 5.21�million client accounts. Accordingly, with a significant number of client transactions, NSC is from time to time party to various Japanese civil litigation and other dispute resolution proceedings with clients relating to investment losses. These include an action commenced against NSC in April 2012 by a corporate client seeking �5,102�million in damages for losses on the pre-maturity cash out of 16 series of currency-linked structured notes purchased from NSC between 2003 and 2008, and an action commenced against NSC in April 2013 by a corporate client seeking �10,247�million in damages for losses on currency derivative transactions and the pre-maturity cash out or redemption of 11 series of equity-linked structured notes purchased from NSC between 2005 and 2011. Although the allegations of the clients involved in such actions include the allegation that NSC�s explanation was insufficient at the time the contracts were entered into, NSC believes these allegations are without merit. The specified amounts alleged are the Company�s current estimate of the maximum reasonably possible loss from these matters.
Subsequent Events
In October 2014, another action in relation to investment losses was commenced against NSC by a corporate client seeking �2,143�million in damages for losses on currency derivative transactions conducted between 2006 and 2012. Although the allegations of the client include the allegation that NSC�s explanation was insufficient at the time the contracts were entered into, NSC believes these allegations are without merit. The specified amounts alleged are the Company�s current estimate of the maximum reasonably possible loss from this matter.
The Company supports the position of its subsidiaries in each of these claims.
Other mortgage-related contingencies in the U.S.
Certain of the Company�s subsidiaries in the U.S. securitized residential mortgage loans in the form of RMBS. These subsidiaries did not generally originate mortgage loans, but purchased mortgage loans from third-party loan originators (the �originators�). In connection with such purchases, these subsidiaries received loan level representations from the originators. In connection with the securitizations, the relevant subsidiaries provided loan level representations and warranties of the type generally described below, which mirror the representations the subsidiaries received from the originators.
The loan level representations made in connection with the securitization of mortgage loans were generally detailed representations applicable to each loan and addressed characteristics of the borrowers and properties. The representations included, but were not limited to, information concerning the borrower�s credit status, the loan-to-value ratio, the owner occupancy status of the property, the lien position, the fact that the loan was originated in accordance with the originator�s guidelines, and the fact that the loan was originated in compliance with applicable laws. Certain of the RMBS issued by the subsidiaries were structured with credit protection provided to specified classes of certificates by monoline insurers.
The relevant subsidiaries have received claims demanding the repurchase of certain loans from trustees of various securitization trusts, made at the instance of one or more investors, or from certificate insurers. The Company�s policy called for review of each claim received, and its subsidiaries have contested those claims believed to be without merit or have agreed to repurchase certain loans for those claims that the subsidiaries have determined to have merit. In several instances, following the rejection of repurchase demands, investors have instituted actions through the trustee alleging breach of contract. These breach of contract claims are at early stages and involve substantial legal uncertainty.
As at December 5, 2014, the total original principal amount of loans that are the subject of repurchase claims against the relevant subsidiaries is $3,203 million, including claims that are the subject of pending breach of contract actions. It should be noted, however, that the above amount does not include loans with a total original principal balance of $1,818 million that are the subject of repurchase claims rejected by the relevant subsidiaries as time-barred based on current law including a decision by the intermediate appellate court of New York State that claims alleging breach of representation must be brought within six years of the time the representation was made. The decision is currently being appealed by plaintiff, but the Company believes the decision will stand. Due to the many legal and factual uncertainties involved, the Company cannot provide an estimate of reasonably possible loss for repurchase claims that relevant subsidiaries have decided to reject.
�
F-82
Table of Contents
Notes to the Interim Consolidated Financial Statements�(Continued) (UNAUDITED)
�
Guarantees�
ASC 460 �Guarantees� specifies the disclosures to be made in regards to obligations under certain issued guarantees and requires a liability to be recognized for the fair value of a guarantee obligation at inception.
In the normal course of business, Nomura enters into various guarantee arrangements with counterparties in the form of standby letters of credit and other guarantees, which generally have a fixed expiration date.
In addition, Nomura enters into certain derivative contracts that meet the accounting definition of a guarantee, namely derivative contracts that contingently require a guarantor to make payment to a guaranteed party based on changes in an underlying that relate to an asset, liability or equity security held by a guaranteed party. Since Nomura does not track whether its clients enter into these derivative contracts for speculative or hedging purposes, Nomura has disclosed below information about derivative contracts that could meet the accounting definition of guarantees.
For information about the maximum potential amount of future payments that Nomura could be required to make under certain derivatives, the notional amount of contracts has been disclosed. However, the maximum potential payout for certain derivative contracts, such as written interest rate caps and written currency options, cannot be estimated, as increases in interest or foreign exchange rates in the future could be theoretically unlimited.
Nomura records all derivative contracts at fair value on its consolidated balance sheets. Nomura believes the notional amounts generally overstate its risk exposure. Since the derivative contracts are accounted for at fair value, carrying value is considered the best indication of payment and performance risk for individual contracts.
The following table presents information on Nomura�s derivative contracts that could meet the accounting definition of a guarantee and standby letters of credit and other guarantees.
�
| � | �� | Millions of yen | � | |||||||||||||
| � | �� | March�31, 2014 | � | �� | September�30, 2014 | � | ||||||||||
| � | �� | Carrying value |
� | �� | Maximum Potential Payout/ Notional Total |
� | �� | Carrying value |
� | �� | Maximum Potential Payout/ Notional Total |
� | ||||
| Derivative contracts(1)(2) |
�� | � | 5,155,198 | �� | �� | � | 195,466,506 | �� | �� | � | 5,954,567 | �� | �� | � | 255,694,644 | �� |
| Standby letters of credit and other guarantees(3) |
�� | � | 276 | �� | �� | � | 11,509 | �� | �� | � | 279 | �� | �� | � | 11,783 | �� |
�
| (1) | Credit derivatives are disclosed in Note 3 �Derivative instruments and hedging activities� and are excluded from derivative contracts. |
| (2) | Derivative contracts primarily consist of equity, interest rate and foreign exchange contracts. |
| (3) | Collateral held in connection with standby letters of credit and other guarantees as of March�31, 2014 is �6,487�million and as of September�30, 2014 is �6,898�million. |
The following table presents maturity information on Nomura�s derivative contracts that could meet the accounting definition of a guarantee and standby letters of credit and other guarantees as of September�30, 2014.
�
| � | �� | Millions of yen | � | |||||||||||||||||||||
| � | �� | � | � | �� | Maximum Potential Payout/Notional | � | ||||||||||||||||||
| � | �� | � | � | �� | � | � | �� | Years to Maturity | � | |||||||||||||||
| � | �� | Carrying value |
� | �� | Total | � | �� | Less�than 1�year |
� | �� | 1 to 3 years |
� | �� | 3 to 5 years |
� | �� | More�than 5�years |
� | ||||||
| Derivative contracts |
�� | � | 5,954,567 | �� | �� | � | 255,694,644 | �� | �� | � | 98,585,363 | �� | �� | � | 70,409,375 | �� | �� | � | 24,316,831 | �� | �� | � | 62,383,075 | �� |
| Standby letters of credit and other guarantees |
�� | � | 279 | �� | �� | � | 11,783 | �� | �� | � | 338 | �� | �� | � | 113 | �� | �� | � | 2,499 | �� | �� | � | 8,833 | �� |
�
F-83
Table of Contents
Notes to the Interim Consolidated Financial Statements�(Continued) (UNAUDITED)
�
16. Segment and geographic information:
Operating segments�
Nomura�s business operation and financial performance reports are prepared based on the Retail, the Asset Management and the Wholesale segments. Nomura structures its business segments based upon the nature of main products and services, its client base and its management structure.
The accounting policies for segment information materially follow U.S. GAAP, except for the impact of unrealized gains/losses on investments in equity securities held for operating purposes, which under U.S. GAAP are included in Income (loss) before income taxes, but excluded from segment information.
Revenues and expenses directly associated with each business segment are included in the operating results of each respective segment. Revenues and expenses that are not directly attributable to a particular segment are allocated to each respective business segment or included in �Other�, based upon Nomura�s allocation methodologies as used by management to assess each segment�s performance.
Business segments� results are shown in the following tables. Net interest revenue is disclosed because management views interest revenue net of interest expense for its operating decisions. Business segments� information on total assets is not disclosed because management does not utilize such information for its operating decisions and therefore, it is not reported to management.
�
| � | �� | Millions of yen | � | |||||||||||||||||
| � | �� | Retail | � | �� | Asset Management |
� | �� | Wholesale | � | �� | Other (Incl.�elimination) |
� | � | Total | � | |||||
| Six months ended September�30, 2013 |
�� | �� | �� | �� | � | |||||||||||||||
| Non-interest revenue |
�� | � | 283,200 | �� | �� | � | 37,238 | �� | �� | � | 313,738 | �� | �� | � | 73,856 | �� | � | � | 708,032 | �� |
| Net interest revenue |
�� | � | 2,872 | �� | �� | � | 1,562 | �� | �� | � | 64,219 | �� | �� | � | (1,175 | )� | � | � | 67,478 | �� |
| �� | � |
� |
� | �� | � |
� |
� | �� | � |
� |
� | �� | � |
� |
� | � | � |
� |
� | |
| Net revenue |
�� | � | 286,072 | �� | �� | � | 38,800 | �� | �� | � | 377,957 | �� | �� | � | 72,681 | �� | � | � | 775,510 | �� |
| Non-interest expenses |
�� | � | 165,011 | �� | �� | � | 25,937 | �� | �� | � | 327,435 | �� | �� | � | 83,176 | �� | � | � | 601,559 | �� |
| �� | � |
� |
� | �� | � |
� |
� | �� | � |
� |
� | �� | � |
� |
� | � | � |
� |
� | |
| Income (loss) before income taxes |
�� | � | 121,061 | �� | �� | � | 12,863 | �� | �� | � | 50,522 | �� | �� | � | (10,495 | )� | � | � | 173,951 | �� |
| �� | � |
� |
� | �� | � |
� |
� | �� | � |
� |
� | �� | � |
� |
� | � | � |
� |
� | |
| Six months ended September�30, 2014 |
�� | �� | �� | �� | � | |||||||||||||||
| Non-interest revenue |
�� | � | 222,691 | �� | �� | � | 43,219 | �� | �� | � | 299,636 | �� | �� | � | 127,647 | �� | � | � | 693,193 | �� |
| Net interest revenue |
�� | � | 2,112 | �� | �� | � | 1,810 | �� | �� | � | 79,820 | �� | �� | � | (38,353 | )� | � | � | 45,389 | �� |
| �� | � |
� |
� | �� | � |
� |
� | �� | � |
� |
� | �� | � |
� |
� | � | � |
� |
� | |
| Net revenue |
�� | � | 224,803 | �� | �� | � | 45,029 | �� | �� | � | 379,456 | �� | �� | � | 89,294 | �� | � | � | 738,582 | �� |
| Non-interest expenses |
�� | � | 154,332 | �� | �� | � | 28,946 | �� | �� | � | 351,508 | �� | �� | � | 84,206 | �� | � | � | 618,992 | �� |
| �� | � |
� |
� | �� | � |
� |
� | �� | � |
� |
� | �� | � |
� |
� | � | � |
� |
� | |
| Income (loss) before income taxes |
�� | � | 70,471 | �� | �� | � | 16,083 | �� | �� | � | 27,948 | �� | �� | � | 5,088 | �� | � | � | 119,590 | �� |
| �� | � |
� |
� | �� | � |
� |
� | �� | � |
� |
� | �� | � |
� |
� | � | � |
� |
� | |
�
F-84
Table of Contents
Notes to the Interim Consolidated Financial Statements�(Continued) (UNAUDITED)
�
| � | �� | Millions of yen | � | |||||||||||||||||
| � | �� | Retail | � | �� | Asset Management |
� | �� | Wholesale | � | �� | Other (Incl.� elimination) |
� | � | Total | � | |||||
| Three months ended September�30, 2013 |
�� | �� | �� | �� | � | |||||||||||||||
| Non-interest revenue |
�� | � | 118,322 | �� | �� | � | 18,485 | �� | �� | � | 162,103 | �� | �� | � | 26,341 | �� | � | � | 325,251 | �� |
| Net interest revenue |
�� | � | 1,408 | �� | �� | � | 141 | �� | �� | � | 21,245 | �� | �� | � | 3,308 | �� | � | � | 26,102 | �� |
| �� | � |
� |
� | �� | � |
� |
� | �� | � |
� |
� | �� | � |
� |
� | � | � |
� |
� | |
| Net revenue |
�� | � | 119,730 | �� | �� | � | 18,626 | �� | �� | � | 183,348 | �� | �� | � | 29,649 | �� | � | � | 351,353 | �� |
| Non-interest expenses |
�� | � | 79,774 | �� | �� | � | 12,454 | �� | �� | � | 158,063 | �� | �� | � | 33,166 | �� | � | � | 283,457 | �� |
| �� | � |
� |
� | �� | � |
� |
� | �� | � |
� |
� | �� | � |
� |
� | � | � |
� |
� | |
| Income (loss) before income taxes |
�� | � | 39,956 | �� | �� | � | 6,172 | �� | �� | � | 25,285 | �� | �� | � | (3,517 | )� | � | � | 67,896 | �� |
| �� | � |
� |
� | �� | � |
� |
� | �� | � |
� |
� | �� | � |
� |
� | � | � |
� |
� | |
| Three months ended September�30, 2014 |
�� | �� | �� | �� | � | |||||||||||||||
| Non-interest revenue |
�� | � | 116,948 | �� | �� | � | 21,441 | �� | �� | � | 119,322 | �� | �� | � | 81,742 | �� | � | � | 339,453 | �� |
| Net interest revenue |
�� | � | 990 | �� | �� | � | 250 | �� | �� | � | 71,248 | �� | �� | � | (40,700 | )� | � | � | 31,788 | �� |
| �� | � |
� |
� | �� | � |
� |
� | �� | � |
� |
� | �� | � |
� |
� | � | � |
� |
� | |
| Net revenue |
�� | � | 117,938 | �� | �� | � | 21,691 | �� | �� | � | 190,570 | �� | �� | � | 41,042 | �� | � | � | 371,241 | �� |
| Non-interest expenses |
�� | � | 79,075 | �� | �� | � | 13,882 | �� | �� | � | 168,363 | �� | �� | � | 38,508 | �� | � | � | 299,828 | �� |
| �� | � |
� |
� | �� | � |
� |
� | �� | � |
� |
� | �� | � |
� |
� | � | � |
� |
� | |
| Income (loss) before income taxes |
�� | � | 38,863 | �� | �� | � | 7,809 | �� | �� | � | 22,207 | �� | �� | � | 2,534 | �� | � | � | 71,413 | �� |
| �� | � |
� |
� | �� | � |
� |
� | �� | � |
� |
� | �� | � |
� |
� | � | � |
� |
� | |
Transactions between operating segments are recorded within segment results on commercial terms and conditions and are eliminated in the �Other� column.
The following tables present the major components of income (loss) before income taxes in �Other.�
�
| � | �� | Millions of yen | � | |||||
| � | �� | Six�months�ended�September�30 | � | |||||
| � | �� | 2013 | � | � | 2014 | � | ||
| Net gain related to economic hedging transactions |
�� | � | 5,706 | �� | � | � | 9,088 | �� |
| Realized gain on investments in equity securities held for operating purposes |
�� | � | 688 | �� | � | � | 3,145 | �� |
| Equity in earnings of affiliates |
�� | � | 14,227 | �� | � | � | 11,462 | �� |
| Corporate items |
�� | � | (21,045 | )� | � | � | (11,482 | )� |
|
Other(1) |
�� | � | (10,071 | )� | � | � | (7,125 | )� |
| �� | � |
� |
� | � | � |
� |
� | |
| Total |
�� | � | (10,495 | )� | � | � | 5,088 | �� |
| �� | � |
� |
� | � | � |
� |
� | |
| � | �� | Millions of yen | � | |||||
| � | �� | Three�months�ended�September�30 | � | |||||
| � | �� | 2013 | � | � | 2014 | � | ||
| Net gain (loss) related to economic hedging transactions |
�� | � | (1,667 | )� | � | � | 2,169 | �� |
| Realized gain (loss) on investments in equity securities held for operating purposes |
�� | � | 0 | �� | � | � | 292 | �� |
| Equity in earnings of affiliates |
�� | � | 8,884 | �� | � | � | 7,963 | �� |
| Corporate items |
�� | � | (8,701 | )� | � | � | (8,389 | )� |
|
Other(1) |
�� | � | (2,033 | )� | � | � | 499 | �� |
| �� | � |
� |
� | � | � |
� |
� | |
| Total |
�� | � | (3,517 | )� | � | � | 2,534 | �� |
| �� | � |
� |
� | � | � |
� |
� | |
�
| (1) | Includes the impact of Nomura�s own creditworthiness. |
�
F-85
Table of Contents
Notes to the Interim Consolidated Financial Statements�(Continued) (UNAUDITED)
�
The tables below present reconciliations of the combined business segments� results included in the preceding table to Nomura�s reported Net revenue, Non-interest expenses and Income before income taxes in the consolidated statements of income.
�
| � | �� | Millions of yen | � | |||||
| � | �� | Six�months�ended�September�30 | � | |||||
| � | �� | 2013 | � | �� | 2014 | � | ||
| Net revenue |
�� | � | 775,510 | �� | �� | � | 738,582 | �� |
| Unrealized gain on investments in equity securities held for operating purposes |
�� | � | 12,201 | �� | �� | � | 6,089 | �� |
| �� | � |
� |
� | �� | � |
� |
� | |
| Consolidated net revenue |
�� | � | 787,711 | �� | �� | � | 744,671 | �� |
| �� | � |
� |
� | �� | � |
� |
� | |
| Non-interest expenses |
�� | � | 601,559 | �� | �� | � | 618,992 | �� |
| Unrealized gain on investments in equity securities held for operating purposes |
�� | � | ��� | � | �� | � | ��� | � |
| �� | � |
� |
� | �� | � |
� |
� | |
| Consolidated non-interest expenses |
�� | � | 601,559 | �� | �� | � | 618,992 | �� |
| �� | � |
� |
� | �� | � |
� |
� | |
| Income before income taxes |
�� | � | 173,951 | �� | �� | � | 119,590 | �� |
| Unrealized gain on investments in equity securities held for operating purposes |
�� | � | 12,201 | �� | �� | � | 6,089 | �� |
| �� | � |
� |
� | �� | � |
� |
� | |
| Consolidated income before income taxes |
�� | � | 186,152 | �� | �� | � | 125,679 | �� |
| �� | � |
� |
� | �� | � |
� |
� | |
| � | �� | Millions of yen | � | |||||
| � | �� | Three�months�ended�September�30 | � | |||||
| � | �� | 2013 | � | �� | 2014 | � | ||
| Net revenue |
�� | � | 351,353 | �� | �� | � | 371,241 | �� |
| Unrealized gain on investments in equity securities held for operating purposes |
�� | � | 5,037 | �� | �� | � | 2,592 | �� |
| �� | � |
� |
� | �� | � |
� |
� | |
| Consolidated net revenue |
�� | � | 356,390 | �� | �� | � | 373,833 | �� |
| �� | � |
� |
� | �� | � |
� |
� | |
| Non-interest expenses |
�� | � | 283,457 | �� | �� | � | 299,828 | �� |
| Unrealized gain on investments in equity securities held for operating purposes |
�� | � | ��� | � | �� | � | ��� | � |
| �� | � |
� |
� | �� | � |
� |
� | |
| Consolidated non-interest expenses |
�� | � | 283,457 | �� | �� | � | 299,828 | �� |
| �� | � |
� |
� | �� | � |
� |
� | |
| Income before income taxes |
�� | � | 67,896 | �� | �� | � | 71,413 | �� |
| Unrealized gain on investments in equity securities held for operating purposes |
�� | � | 5,037 | �� | �� | � | 2,592 | �� |
| �� | � |
� |
� | �� | � |
� |
� | |
| Consolidated income before income taxes |
�� | � | 72,933 | �� | �� | � | 74,005 | �� |
| �� | � |
� |
� | �� | � |
� |
� | |
Geographic information�
Nomura�s identifiable assets, revenues and expenses are generally allocated based on the country of domicile of the legal entity providing the service. However, because of the integration of the global capital markets and the corresponding global nature of Nomura�s activities and services, it is not always possible to make a precise separation by location. As a result, various assumptions, which are consistent among years, have been made in presenting the following geographic data.
�
F-86
Table of Contents
Notes to the Interim Consolidated Financial Statements�(Continued) (UNAUDITED)
�
The table below presents a geographic allocation of net revenue and income (loss) before income taxes from operations by geographic areas, and long-lived assets associated with Nomura�s operations. Net revenue in �Americas� and �Europe� substantially represents Nomura�s operations in the United States and the United Kingdom, respectively. Net revenue and long-lived assets have been allocated based on transactions with external customers while income (loss) before income taxes have been allocated based on the inclusion of intersegment transactions.
�
| � | �� | Millions of yen | � | |||||
| � | �� | Six�months�ended�September�30 | � | |||||
| � | �� | 2013 | � | � | 2014 | � | ||
| Net revenue(1): |
�� | � | ||||||
| Americas |
�� | � | 109,859 | �� | � | � | 117,394 | �� |
| Europe |
�� | � | 127,252 | �� | � | � | 97,145 | �� |
| Asia and Oceania |
�� | � | 31,610 | �� | � | � | 40,118 | �� |
| �� | � |
� |
� | � | � |
� |
� | |
| Subtotal |
�� | � | 268,721 | �� | � | � | 254,657 | �� |
| Japan |
�� | � | 518,990 | �� | � | � | 490,014 | �� |
| �� | � |
� |
� | � | � |
� |
� | |
| Consolidated |
�� | � | 787,711 | �� | � | � | 744,671 | �� |
| �� | � |
� |
� | � | � |
� |
� | |
| Income (loss) before income taxes: |
�� | � | ||||||
| Americas |
�� | � | (9,824 | )� | � | � | (697 | )� |
| Europe |
�� | � | (24,050 | )� | � | � | (20,853 | )� |
| Asia and Oceania |
�� | � | 1,490 | �� | � | � | 8,157 | �� |
| �� | � |
� |
� | � | � |
� |
� | |
| Subtotal |
�� | � | (32,384 | )� | � | � | (13,393 | )� |
| Japan |
�� | � | 218,536 | �� | � | � | 139,072 | �� |
| �� | � |
� |
� | � | � |
� |
� | |
| Consolidated |
�� | � | 186,152 | �� | � | � | 125,679 | �� |
| �� | � |
� |
� | � | � |
� |
� | |
| � | �� | Millions of yen | � | |||||
| � | �� | Three�months�ended�September�30 | � | |||||
| � | �� | 2013 | � | � | 2014 | � | ||
| Net revenue(1): |
�� | � | ||||||
| Americas |
�� | � | 54,626 | �� | � | � | 48,095 | �� |
| Europe |
�� | � | 51,810 | �� | � | � | 66,524 | �� |
| Asia and Oceania |
�� | � | 14,765 | �� | � | � | 21,527 | �� |
| �� | � |
� |
� | � | � |
� |
� | |
| Subtotal |
�� | � | 121,201 | �� | � | � | 136,146 | �� |
| Japan |
�� | � | 235,189 | �� | � | � | 237,687 | �� |
| �� | � |
� |
� | � | � |
� |
� | |
| Consolidated |
�� | � | 356,390 | �� | � | � | 373,833 | �� |
| �� | � |
� |
� | � | � |
� |
� | |
| Income (loss) before income taxes: |
�� | � | ||||||
| Americas |
�� | � | (1,328 | )� | � | � | (6,757 | )� |
| Europe |
�� | � | (19,602 | )� | � | � | 2,027 | �� |
| Asia and Oceania |
�� | � | 2,270 | �� | � | � | 8,476 | �� |
| �� | � |
� |
� | � | � |
� |
� | |
| Subtotal |
�� | � | (18,660 | )� | � | � | 3,746 | �� |
| Japan |
�� | � | 91,593 | �� | � | � | 70,259 | �� |
| �� | � |
� |
� | � | � |
� |
� | |
| Consolidated |
�� | � | 72,933 | �� | � | � | 74,005 | �� |
| �� | � |
� |
� | � | � |
� |
� | |
�
| (1) | There is no revenue derived from transactions with a single major external customer. |
�
F-87
Table of Contents
Notes to the Interim Consolidated Financial Statements�(Continued) (UNAUDITED)
�
| � | �� | Millions of yen | � | |||||
| � | �� | March�31,�2014 | � | �� | September�30,�2014 | � | ||
| Long-lived assets: |
�� | �� | ||||||
| Americas |
�� | � | 133,147 | �� | �� | � | 138,883 | �� |
| Europe |
�� | � | 93,111 | �� | �� | � | 90,214 | �� |
| Asia and Oceania |
�� | � | 16,163 | �� | �� | � | 16,153 | �� |
| �� | � |
� |
� | �� | � |
� |
� | |
| Subtotal |
�� | � | 242,421 | �� | �� | � | 245,250 | �� |
| Japan |
�� | � | 281,780 | �� | �� | � | 285,159 | �� |
| �� | � |
� |
� | �� | � |
� |
� | |
| Consolidated |
�� | � | 524,201 | �� | �� | � | 530,409 | �� |
| �� | � |
� |
� | �� | � |
� |
� | |
17. Supplementary subsidiary guarantee information required under SEC rules:
The Company provides several guarantees of borrowings of its subsidiaries. The Company has fully and unconditionally guaranteed the securities issued or to be issued by Nomura America Finance LLC, which is an indirect, wholly owned finance subsidiary of the Company.
18. Subsequent events:
On October�28, 2014, the Board of Directors of the Company approved a resolution to set up a share buyback program, pursuant to the Company�s articles of incorporation set out in accordance with Article 459-1 of the Companies Act of Japan as follows: (a)�total number of shares authorized for repurchase is up to 40,000,000 shares, (b)�total value of shares authorized for repurchase is up to �28�billion and (c)�the share buyback program will run from November�13, 2014 to January�16, 2015.
�
F-88
Table of Contents
Report of Independent Registered Public Accounting Firm
The Board of Directors
Nomura Holdings, Inc.
We have reviewed the consolidated balance sheet of Nomura Holdings, Inc. (the �Company�) as of September�30, 2014, and the related consolidated statements of income and comprehensive income for the three and six-month periods ended September�30, 2014 and 2013, and the consolidated statements of changes in equity and cash flows for the six-month periods ended September�30, 2014 and 2013.�These financial statements are the responsibility of the Company�s management.
We conducted our review in accordance with the standards of the Public Company Accounting Oversight Board (United States). A review of interim financial information consists principally of applying analytical procedures and making inquiries of persons responsible for financial and accounting matters.�It is substantially less in scope than an audit conducted in accordance with the standards of the Public Company Accounting Oversight Board (United States), the objective of which is the expression of an opinion regarding the financial statements taken as a whole.�Accordingly, we do not express such an opinion.
Based on our review, we are not aware of any material modifications that should be made to the consolidated financial statements referred to above for them to be in conformity with U.S. generally accepted accounting principles.
We have previously audited, in accordance with the standards of the Public Company Accounting Oversight Board (United�States), the consolidated balance sheet of Nomura Holdings, Inc. as of March�31, 2014, and the related consolidated statements of income, comprehensive income, changes in equity and cash flows for the year then ended (not presented herein) and we expressed an unqualified opinion on those consolidated financial statements in our report dated June�26, 2014.�In our opinion, the accompanying consolidated balance sheet of Nomura Holdings, Inc. as of March�31, 2014, is fairly stated, in all material respects, in relation to the consolidated balance sheet from which it has been derived.
/s/ Ernst�& Young ShinNihon LLC
Tokyo, Japan
December�19, 2014
�
F-89
Table of Contents
December�19, 2014
The Board of Directors
Nomura Holdings, Inc.
We are aware of the incorporation by reference in the Registration Statements (Form F-3 No.�333-186755 and No.�333-191250 and Form S-8 No.�333-134590, No.�333-141988, No.�333-158344, No.�333-165925, No.�333-173244, No.�333-180506, No.�333-187585 and No.�333-195004) and related Prospectus of Nomura Holdings, Inc. of our report dated December�19, 2014 relating to the unaudited interim consolidated financial statements of Nomura Holdings, Inc. as of September�30, 2014 and for the quarter ended September�30, 2014 that are included in its Form 6-K dated December�19, 2014.
/s/ Ernst�& Young ShinNihon LLC
Create E-mail Alert Related Categories
SEC FilingsRelated Entities
NomuraSign up for StreetInsider Free!
Receive full access to all new and archived articles, unlimited portfolio tracking, e-mail alerts, custom newswires and RSS feeds - and more!
