

Form 8-K Zayo Group Holdings, For: Oct 01
 Tweet
Tweet Share
Share
UNITED STATES
SECURITIES AND EXCHANGE COMMISSION
Washington, D.C. 20549
FORM 8-K
CURRENT REPORT
PURSUANT TO SECTION 13 OR 15 (d) OF
THE SECURITIES EXCHANGE ACT OF 1934
Date of report (Date of earliest event reported): October 1, 2015
Zayo Group Holdings, Inc.
(Exact name of registrant as specified in its charter)
|
Delaware |
|
001-36690 |
|
26-1398293 |
|
(State or Other Jurisdiction |
|
(Commission |
|
(I.R.S. Employer |
1805 29th Street, Suite 2050, Boulder, CO 80301
(Address of Principal Executive Offices)
(303) 381-4683
(Registrant’s Telephone Number, Including Area Code)
Check the appropriate box below if the Form 8-K filing is intended to simultaneously satisfy the filing obligation of the registrant under any of the following provisions (see General Instructions A.2. below):
o Written communications pursuant to Rule 425 under the Securities Act (17 CFR 230.425)
o Soliciting material pursuant to Rule 14a-12 under the Exchange Act (17 CFR 240.14a-12)
o Pre-commencement communications pursuant to Rule 14d-2(b) under the Exchange Act (17 CFR 240.14d-2(b))
o Pre-commencement communications pursuant to Rule 13e-4(c) under the Exchange Act (17 CFR 240.13e-4(c))
Item 8.01 Other Events.
With the continued increase in Zayo Group Holdings, Inc.’s (the “Company’s”) scope and scale, effective October 1, 2015 the Company’s chief operating decision maker (“CODM”), the Company’s Chief Executive Officer, implemented certain organizational changes to the management and operation of the business that directly impacts how the CODM makes resource allocation decisions and manages the Company. The change in structure had the impact of establishing a new reportable segment and re-aligning the Company’s existing Strategic Product Groups (“SPGs”) to the revised reportable segments. Prior to this change, the operating segments were reported as Physical Infrastructure which included the Company’s Dark Fiber, Mobile Infrastructure Group (“MIG”) and Zayo Colocation (“zColo”) SPGs, Cloud and Connectivity which included the Company’s Waves, SONET, Ethernet, IP and Cloud SPGs, and Other which primarily included the Company’s Zayo Professional Services (“ZPS”) SPG. The new structure has removed the zColo and Cloud SPG’s out of the Physical Infrastructure and Cloud and Connectivity reporting segments, respectively, creating a new reportable segment name Zayo Colocation and Cloud Infrastructure (“ZCC”). The Dark Fiber and MIG SPGs are now reported as Dark Fiber Solutions, and Ethernet, IP, Waves, and SONET, are now reported in the Network Connectivity operating segment.
The Company’s Revised Segments are further described below:
Dark Fiber Solutions. Through the Dark Fiber Solutions segment, the Company provides raw bandwidth infrastructure to customers that require more control of their internal networks. These services include dark fiber and mobile infrastructure (fiber-to-the-tower and small cell). Dark fiber is a physically separate and secure, private platform for dedicated bandwidth. The Company leases dark fiber pairs (usually 2 to 12 total fibers) to its customers, who “light” the fiber using their own optronics. The Company’s mobile infrastructure services provide direct fiber connections to cell towers, small cells, hub sites, and mobile switching centers. Dark Fiber Solutions customers include carriers and other communication service providers, Internet service providers, wireless service providers, major media and content companies, large enterprises, and other companies that have the expertise to run their own fiber optic networks or require interconnected technical space. The contract terms in the Dark Fiber Solutions segment generally tend to range from three to twenty years.
Network Connectivity. The Network Connectivity segment provides bandwidth infrastructure solutions over the Company’s metro, regional, and long-haul fiber networks where it uses optronics to light the fiber and the Company’s customers pay for access based on the amount and type of bandwidth they purchase. The Company’s services within this segment include wavelength, Ethernet, IP and SONET. The Company targets customers who require a minimum of 10G of bandwidth across their networks. Network Connectivity customers include carriers, financial services companies, healthcare, government institutions, education institutions and other enterprises. The contract terms in this segment tend to range from two to five years.
Colocation and Cloud Infrastructure. The Colocation and Cloud Infrastructure segment provides data center infrastructure solutions to a broad range of enterprise, carrier, content and cloud customers. The Company’s services within this segment include colocation, interconnection, cloud, hosting and managed services, such as security and remote hands offerings. Solutions range in size from single cabinet and server support to comprehensive international outsourced IT infrastructure environments. The Company’s datacenters also support a large component of the Company’s networking equipment for the purpose of aggregating and distributing data, voice, Internet, and video traffic. The contract terms in this segment tend to range from two to five years
Other. The Other segment is primarily comprised of ZPS. ZPS provides network and technical resources to customers in designing, acquiring and maintaining their networks. Services are typically provided for a term of one year for a fixed recurring monthly fee in the case of network and on an hourly basis for technical resources (usage revenue).
Effective October 1, 2015 financial results and operating metrics for all of the Company’s products are included in one of the Company’s segments. This segment structure will be recast for all prior periods presented for comparability in the Company’s future filings with the SEC on Forms 10-K and 10-Q.
The Company is filing this Current Report on Form 8-K (the “Current Report”) to reclassify historical segment information in accordance with the Company’s new reportable segment structure. Exhibit 99.1 hereto updates the reportable segment information presented in the press release presented on November 10, 2015 only to the extent this information is impacted by the realignment of our reportable segments.
This Current Report is being filed only for the purposes described above. All other information in the Company’s earnings release and Quarterly Report on Form 10-Q remains unchanged. This Current Report does not modify or update the disclosures in the Annual Report on Form 10-K, Quarterly Report on Form 10-Q beyond as described above, nor does it reflect any subsequent information or events.
Item 9.01. Financial Statements and Exhibits
(d) Exhibits. The following exhibit is furnished with this Form 8-K:
|
Exhibit No. |
|
Description |
|
99.1 |
|
Re-casted Segment Financial Information |
Investors should take into consideration, with respect to the Company, those risks and uncertainties discussed in its Annual Report on Form 10-K for the year ended June 30, 2015 and its Quarterly Report on Form 10-Q for the quarter ended September 30, 2015, including but not limited to those under the heading “Risk Factors” to the extent each heading is included therein.
SIGNATURE
Pursuant to the requirements of the Securities Exchange Act of 1934, the registrant has duly caused this report to be signed on its behalf by the undersigned hereunto duly authorized.
|
|
|
Zayo Group Holdings, Inc. | |
|
|
|
| |
|
|
|
By: |
/s/ Ken desGarennes |
|
|
|
Name: |
Ken desGarennes |
|
|
|
Title: |
Chief Financial Officer |
DATED: January 26, 2016
Exhibit 99.1
Supplemental Earnings information FY 2016 Q1 Zayo Group Holdings, Inc. Additional Segment Financials
Zayo Dark Fiber Solutions Segment Financial Data 1 Pro-forma annualized growth for revenue and Adjusted EBITDA are calculated as if the acquisitions occurred on the first day of the quarter preceding the respective quarter in which the acquisitions closed Financial Data

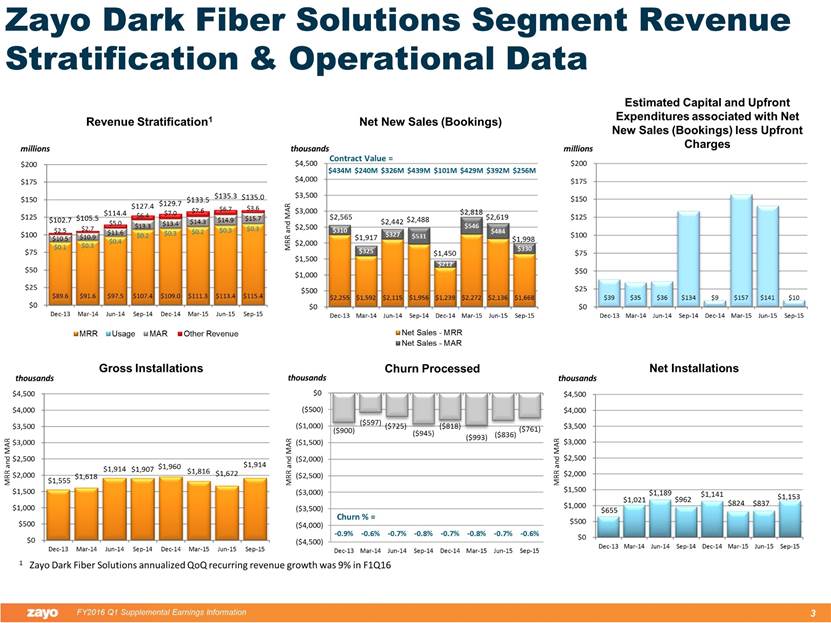
millions Revenue Stratification Estimated Capital and Upfront Expenditures associated with Net New Sales (Bookings) less Upfront Charges millions Zayo Dark Fiber Solutions Segment Revenue Stratification & Operational Data thousands Churn Processed Gross Installations MRR and MAR MRR and MAR thousands Net Installations thousands MRR and MAR Churn % = Net New Sales (Bookings) thousands MRR and MAR $1,555 $1,618 $1,914 $1,907 $1,960 $1,816 $1,672 $1,914 $0 $500 $1,000 $1,500 $2,000 $2,500 $3,000 $3,500 $4,000 $4,500 Dec-13 Mar-14 Jun-14 Sep-14 Dec-14 Mar-15 Jun-15 Sep-15 $89.6 $91.6 $97.5 $107.4 $109.0 $111.3 $113.4 $115.4 $0.1 $0.3 $0.4 $0.2 $0.3 $0.2 $0.3 $0.3 $10.5 $10.9 $11.6 $13.3 $13.4 $14.3 $14.9 $15.7 $2.5 $2.7 $5.0 $6.4 $7.0 $7.6 $6.7 $3.6 $102.7 $105.5 $114.4 $127.4 $129.7 $133.5 $135.3 $135.0 $0 $25 $50 $75 $100 $125 $150 $175 $200 Dec-13 Mar-14 Jun-14 Sep-14 Dec-14 Mar-15 Jun-15 Sep-15 MRR Usage MAR Other Revenue $39 $35 $36 $134 $9 $157 $141 $10 $0 $25 $50 $75 $100 $125 $150 $175 $200 Dec-13 Mar-14 Jun-14 Sep-14 Dec-14 Mar-15 Jun-15 Sep-15 ($900) ($597) ($725) ($945) ($818) ($993) ($836) ($761) -0.9% -0.6% -0.7% -0.8% -0.7% -0.8% -0.7% -0.6% ($4,500) ($4,000) ($3,500) ($3,000) ($2,500) ($2,000) ($1,500) ($1,000) ($500) $0 Dec-13 Mar-14 Jun-14 Sep-14 Dec-14 Mar-15 Jun-15 Sep-15 $655 $1,021 $1,189 $962 $1,141 $824 $837 $1,153 $0 $500 $1,000 $1,500 $2,000 $2,500 $3,000 $3,500 $4,000 $4,500 Dec-13 Mar-14 Jun-14 Sep-14 Dec-14 Mar-15 Jun-15 Sep-15 $2,255 $1,592 $2,115 $1,956 $1,239 $2,272 $2,136 $1,668 $310 $325 $327 $531 $212 $546 $484 $330 $2,565 $1,917 $2,442 $2,488 $1,450 $2,818 $2,619 $1,998 $434M $240M $326M $439M $101M $429M $392M $256M $0 $500 $1,000 $1,500 $2,000 $2,500 $3,000 $3,500 $4,000 $4,500 Dec-13 Mar-14 Jun-14 Sep-14 Dec-14 Mar-15 Jun-15 Sep-15 Net Sales - MRR Net Sales - MAR Contract Value =
% of Revenue millions Purchases of Property and Equipment % of Revenue millions Adjusted EBITDA % of Revenue millions Net Capital1 % of Revenue millions Adj Unlevered FCF3 % of Revenue millions Unlevered Free Cash Flow (FCF)2 Zayo Dark Fiber Solutions Segment Cash Flow Stratification 1 Net Capital is equal to “Cash Outflows for Purchases of Property and Equipment” less “Additions to Deferred Revenue” 2 Unlevered Free Cash Flow is equal to Adjusted EBITDA less “Cash Outflows for Purchases of Property and Equipment” 3 Adjusted Unlevered Free Cash Flow is equal to Adjusted EBITDA less “Net Capital” less “Monthly Amortized Revenue” $41 $48 $50 $58 $70 $73 $79 $94 40% 45% 44% 46% 54% 55% 58% 69% $0 $25 $50 $75 $100 $125 Dec-13 Mar-14 Jun-14 Sep-14 Dec-14 Mar-15 Jun-15 Sep-15 $71 $73 $77 $85 $90 $93 $97 $97 69% 69% 68% 67% 69% 69% 72% 72% $0 $25 $50 $75 $100 $125 Dec-13 Mar-14 Jun-14 Sep-14 Dec-14 Mar-15 Jun-15 Sep-15 $20 ($14) $4 $20 $35 $32 $56 $54 19% -14% 4% 16% 27% 24% 41% 40% ($25) $0 $25 $50 $75 $100 Dec-13 Mar-14 Jun-14 Sep-14 Dec-14 Mar-15 Jun-15 Sep-15 $41 $76 $61 $52 $41 $46 $26 $26 40% 72% 54% 40% 31% 35% 19% 20% $0 $25 $50 $75 $100 $125 Dec-13 Mar-14 Jun-14 Sep-14 Dec-14 Mar-15 Jun-15 Sep-15 $30 $25 $27 $27 $20 $20 $18 $3 29% 24% 24% 21% 15% 15% 13% 2% $0 $25 $50 $75 $100 $125 Dec-13 Mar-14 Jun-14 Sep-14 Dec-14 Mar-15 Jun-15 Sep-15

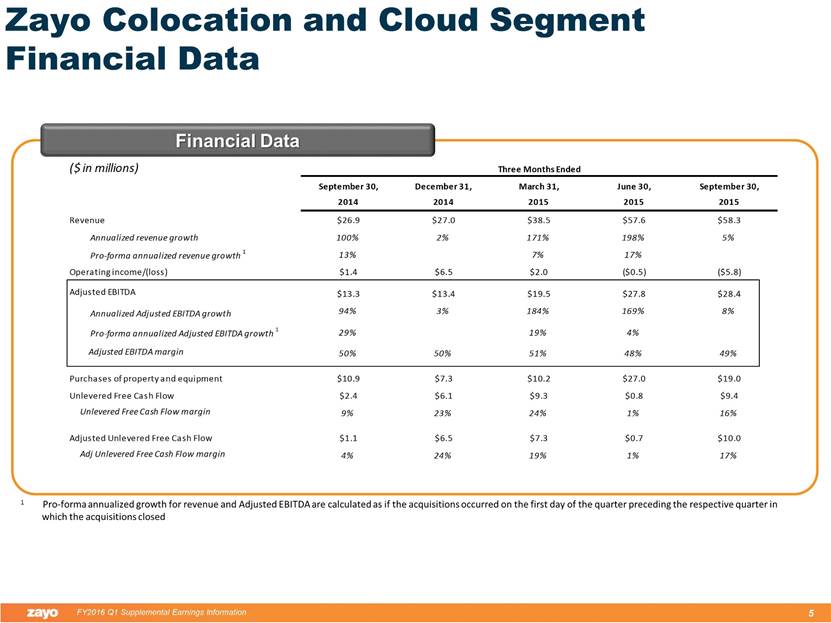
Zayo Colocation and Cloud Segment Financial Data 1 Pro-forma annualized growth for revenue and Adjusted EBITDA are calculated as if the acquisitions occurred on the first day of the quarter preceding the respective quarter in which the acquisitions closed Financial Data
millions Revenue Stratification Estimated Capital and Upfront Expenditures associated with Net New Sales (Bookings) less Upfront Charges millions Zayo Colocation and Cloud Segment Revenue Stratification & Operational Data thousands Churn Processed Gross Installations MRR and MAR MRR and MAR thousands Net Installations thousands MRR and MAR Churn % = Net New Sales (Bookings) thousands MRR and MAR $468 $470 $443 $517 $489 $1,069 $1,189 $680 $0 $250 $500 $750 $1,000 $1,250 $1,500 Dec-13 Mar-14 Jun-14 Sep-14 Dec-14 Mar-15 Jun-15 Sep-15 $16.8 $18.4 $20.3 $25.5 $25.8 $34.9 $54.5 $55.4 $0.3 $0.4 $0.4 $0.6 $0.8 $1.3 $2.2 $2.2 $0.3 $0.3 $0.3 $0.4 $0.4 $0.6 $0.8 $0.8 $0.8 $0.5 $0.5 $0.3 $0.0 $1.9 $0.1 ($0.1) $18.2 $19.6 $21.5 $26.9 $27.0 $38.5 $57.6 $58.3 ($20) $0 $20 $40 $60 $80 Dec-13 Mar-14 Jun-14 Sep-14 Dec-14 Mar-15 Jun-15 Sep-15 MRR Usage MAR Other Revenue $16 $5 $7 $2 $18 $31 $13 $14 $0 $20 $40 $60 $80 $100 Dec-13 Mar-14 Jun-14 Sep-14 Dec-14 Mar-15 Jun-15 Sep-15 ($184) ($216) ($237) ($301) ($262) ($475) ($700) ($613) -1.1% -1.2% -1.2% -1.2% -1.0% -1.3% -1.3% -1.1% ($1,500) ($1,250) ($1,000) ($750) ($500) ($250) $0 Dec-13 Mar-14 Jun-14 Sep-14 Dec-14 Mar-15 Jun-15 Sep-15 $284 $254 $205 $216 $227 $594 $489 $67 $0 $250 $500 $750 $1,000 $1,250 $1,500 Dec-13 Mar-14 Jun-14 Sep-14 Dec-14 Mar-15 Jun-15 Sep-15 $377 $397 $415 $452 $536 $852 $831 $847 $29 $22 $48 $37 $35 $80 $51 $72 $406 $420 $462 $489 $570 $932 $882 $918 $16M $13M $17M $15M $19M $31M $23M $30M $0 $250 $500 $750 $1,000 $1,250 $1,500 Dec-13 Mar-14 Jun-14 Sep-14 Dec-14 Mar-15 Jun-15 Sep-15 Net Sales - MRR Net Sales - MAR Contract Value =
% of Revenue millions Purchases of Property and Equipment % of Revenue millions Adjusted EBITDA % of Revenue millions Net Capital1 % of Revenue millions Adj Unlevered FCF3 % of Revenue millions Unlevered Free Cash Flow (FCF)2 Zayo Colocation and Cloud Segment Cash Flow Stratification 1 Net Capital is equal to “Cash Outflows for Purchases of Property and Equipment” less “Additions to Deferred Revenue” 2 Unlevered Free Cash Flow is equal to Adjusted EBITDA less “Cash Outflows for Purchases of Property and Equipment” 3 Adjusted Unlevered Free Cash Flow is equal to Adjusted EBITDA less “Net Capital” less “Monthly Amortized Revenue” $6 $9 $10 $11 $7 $10 $27 $19 32% 48% 47% 40% 27% 26% 47% 33% $0 $20 $40 $60 $80 Dec-13 Mar-14 Jun-14 Sep-14 Dec-14 Mar-15 Jun-15 Sep-15 $9 $10 $11 $13 $13 $20 $28 $28 51% 49% 50% 50% 50% 51% 48% 49% $0 $20 $40 $60 $80 Dec-13 Mar-14 Jun-14 Sep-14 Dec-14 Mar-15 Jun-15 Sep-15 $6 $9 $10 $12 $6 $12 $26 $18 31% 46% 44% 44% 24% 30% 46% 30% $0 $20 $40 $60 $80 Dec-13 Mar-14 Jun-14 Sep-14 Dec-14 Mar-15 Jun-15 Sep-15 $3 $0 $1 $1 $7 $7 $1 $10 18% 1% 4% 4% 24% 19% 1% 17% $0 $20 $40 $60 $80 Dec-13 Mar-14 Jun-14 Sep-14 Dec-14 Mar-15 Jun-15 Sep-15 $3 $0 $1 $2 $6 $9 $1 $9 19% 1% 3% 9% 23% 24% 1% 16% $0 $20 $40 $60 $80 Dec-13 Mar-14 Jun-14 Sep-14 Dec-14 Mar-15 Jun-15 Sep-15

Zayo Network Connectivity Segment Financial Data Financial Data 1 Pro-forma annualized growth for revenue and Adjusted EBITDA are calculated as if the acquisitions occurred on the first day of the quarter preceding the respective quarter in which the acquisitions closed
millions Revenue Stratification Net New Sales (Bookings) thousands MRR and MAR Zayo Network Connectivity Segment Revenue Stratification & Operational Data thousands Churn Processed Gross Installations MRR and MAR MRR and MAR thousands Net Installations thousands MRR and MAR Churn % = Estimated Capital and Upfront Expenditures associated with Net New Sales (Bookings) less Upfront Charges millions $2,695 $2,961 $2,899 $2,942 $3,017 $2,988 $3,307 $3,381 $0 $500 $1,000 $1,500 $2,000 $2,500 $3,000 $3,500 $4,000 $4,500 Dec-13 Mar-14 Jun-14 Sep-14 Dec-14 Mar-15 Jun-15 Sep-15 $144.2 $144.8 $146.1 $153.1 $154.0 $154.2 $156.3 $159.2 $1.2 $1.7 $1.4 $1.8 $2.4 $2.2 $1.9 $1.8 $2.3 $2.6 $2.9 $3.4 $3.4 $3.4 $3.5 $3.8 $3.5 $2.6 $3.3 $1.9 $1.9 $3.2 $1.4 $2.2 $151.3 $151.7 $153.8 $160.2 $161.7 $163.0 $163.0 $167.0 $0 $25 $50 $75 $100 $125 $150 $175 $200 Dec-13 Mar-14 Jun-14 Sep-14 Dec-14 Mar-15 Jun-15 Sep-15 MRR Usage MAR Other Revenue $2,610 $2,705 $2,968 $2,735 $3,017 $3,125 $3,148 $3,259 $76 $94 $162 $57 $177 $95 $107 $164 $2,686 $2,799 $3,130 $2,792 $3,194 $3,220 $3,255 $3,423 $80M $100M $150M $90M $106M $103M $100M $119M $0 $500 $1,000 $1,500 $2,000 $2,500 $3,000 $3,500 $4,000 $4,500 Dec-13 Mar-14 Jun-14 Sep-14 Dec-14 Mar-15 Jun-15 Sep-15 Net Sales - MRR Net Sales - MAR Contract Value = ($2,461) ($2,669) ($2,452) ($2,458) ($2,587) ($2,595) ($2,263) ($2,308) -1.7% -1.8% -1.6% -1.6% -1.6% -1.6% -1.4% -1.4% ($4,500) ($4,000) ($3,500) ($3,000) ($2,500) ($2,000) ($1,500) ($1,000) ($500) $0 Dec-13 Mar-14 Jun-14 Sep-14 Dec-14 Mar-15 Jun-15 Sep-15 $233 $292 $447 $484 $430 $393 $1,044 $1,073 $0 $500 $1,000 $1,500 $2,000 $2,500 $3,000 $3,500 $4,000 $4,500 Dec-13 Mar-14 Jun-14 Sep-14 Dec-14 Mar-15 Jun-15 Sep-15 $27 $36 $41 $32 $41 $35 $35 $40 $0 $25 $50 $75 $100 $125 $150 $175 $200 Dec-13 Mar-14 Jun-14 Sep-14 Dec-14 Mar-15 Jun-15 Sep-15
% of Revenue millions Purchases of Property and Equipment % of Revenue millions Adjusted EBITDA % of Revenue millions Net Capital1 % of Revenue millions Adj Unlevered FCF3 % of Revenue millions Unlevered Free Cash Flow (FCF)2 Zayo Network Connectivity Segment Cash Flow Stratification 1 Net Capital is equal to “Cash Outflows for Purchases of Property and Equipment” less “Additions to Deferred Revenue” 2 Unlevered Free Cash Flow is equal to Adjusted EBITDA less “Cash Outflows for Purchases of Property and Equipment” 3 Adjusted Unlevered Free Cash Flow is equal to Adjusted EBITDA less “Net Capital” less “Monthly Amortized Revenue” $42 $34 $35 $46 $53 $47 $49 $47 27% 22% 23% 29% 32% 29% 30% 28% $0 $25 $50 $75 $100 $125 Dec-13 Mar-14 Jun-14 Sep-14 Dec-14 Mar-15 Jun-15 Sep-15 $81 $82 $82 $83 $86 $86 $85 $89 54% 54% 53% 52% 53% 53% 52% 53% $0 $25 $50 $75 $100 $125 Dec-13 Mar-14 Jun-14 Sep-14 Dec-14 Mar-15 Jun-15 Sep-15 $40 $31 $32 $40 $47 $47 $48 $38 26% 20% 21% 25% 29% 29% 29% 22% $0 $25 $50 $75 $100 $125 Dec-13 Mar-14 Jun-14 Sep-14 Dec-14 Mar-15 Jun-15 Sep-15 $39 $49 $46 $40 $35 $35 $34 $47 26% 32% 30% 25% 22% 22% 21% 28% $0 $25 $50 $75 $100 $125 Dec-13 Mar-14 Jun-14 Sep-14 Dec-14 Mar-15 Jun-15 Sep-15 $40 $49 $47 $37 $33 $39 $36 $42 26% 32% 30% 23% 20% 24% 22% 25% $0 $25 $50 $75 $100 $125 Dec-13 Mar-14 Jun-14 Sep-14 Dec-14 Mar-15 Jun-15 Sep-15

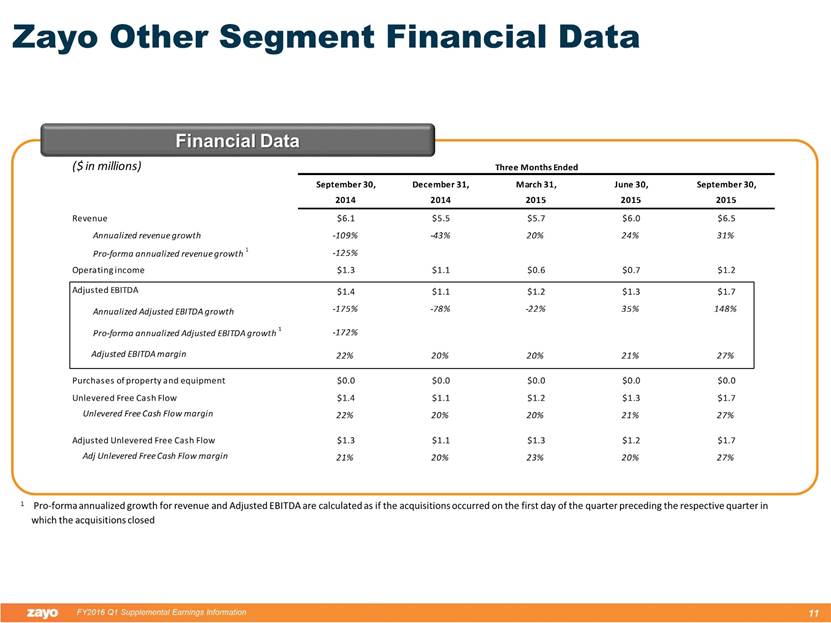
Zayo Other Segment Financial Data 1 Pro-forma annualized growth for revenue and Adjusted EBITDA are calculated as if the acquisitions occurred on the first day of the quarter preceding the respective quarter in which the acquisitions closed Financial Data
Segment Financial Data Rollup Segment Data Rollup

Invested Capital Ratio by Reporting Segment Invested Capital
Segment Data Reconciliation: Net (Loss)/Earnings to Adjusted EBITDA Segment Data Reconciliation1 1 A reconciliation of previous quarters’ legacy segment information can be found in our historical earnings supplements found on our website at http://www.zayo.com/financial-earnings-release

Segment Data Reconciliation: Net (Loss)/Earnings to Adjusted EBITDA Segment Data Reconciliation ($ in millions) Zayo Dark Fiber Solutions Zayo Network Connectivity Zayo Colocation and Cloud Infrastructure Zayo Other Corporate / Intercompany Elimination Zayo Group Holdings Net earnings/(loss) ($5.2) $7.2 ($9.9) $1.1 $11.9 $5.1 Interest expense 26.1 17.8 9.1 0.0 0.0 53.0 Benefit/(provision) for income taxes 0.0 0.0 0.0 (0.4) 5.0 4.6 Depreciation and amortization expense 55.3 34.8 22.6 0.5 0.0 113.2 Stock-based compensation 15.5 21.5 5.8 0.1 0.0 42.9 Loss on extinguishment of debt 4.7 3.6 0.2 0.0 0.0 8.5 Unrealized foreign currency gain/(loss) on intercompany loans 0.0 0.1 0.0 0.0 (16.9) (16.8) Non-cash loss on investments 0.4 0.0 0.0 0.0 0.0 0.4 Adjusted EBITDA $96.8 $85.0 $27.8 $1.3 $0.0 $210.9 Three Months Ended June 30, 2015
Segment Data Reconciliation: Net (Loss)/Earnings to Adjusted EBITDA Segment Data Reconciliation
Segment Data Reconciliation: Net (Loss)/Earnings to Adjusted EBITDA Segment Data Reconciliation
Segment Data Reconciliation: Net (Loss)/Earnings to Adjusted EBITDA Segment Data Reconciliation ($ in millions) Zayo Dark Fiber Solutions Zayo Network Connectivity Zayo Colocation and Cloud Infrastructure Zayo Other Corporate / Intercompany Elimination Zayo Group Holdings Net loss ($62.5) ($22.0) ($1.0) $0.9 ($25.9) ($110.5) Interest expense 27.0 17.5 2.4 0.0 0.0 46.9 Provision for income taxes 0.0 0.0 0.0 0.4 9.0 9.4 Depreciation and amortization expense 56.4 33.8 5.3 0.5 0.0 96.0 Transaction costs 0.8 0.3 0.1 0.0 2.2 3.4 Stock-based compensation 63.5 53.5 6.5 (0.4) 0.0 123.1 Foreign currency gain on intercompany loans 0.0 0.0 0.0 0.0 14.7 14.7 Adjusted EBITDA $85.2 $83.1 $13.3 $1.4 $0.0 $183.0 Three Months Ended September 30, 2014
Serious News for Serious Traders! Try StreetInsider.com Premium Free!
You May Also Be Interested In
- Snoqualmie Casino Brings "Burning Trotman" – Top 7 Artists
- Stockholder Alert: Robbins LLP Informs Investors of the Class Action Filed Against Autodesk, Inc. (ADSK)
- With New Hire, FeganScott Expands Footprint to Include Nation’s Capital
Create E-mail Alert Related Categories
SEC FilingsSign up for StreetInsider Free!
Receive full access to all new and archived articles, unlimited portfolio tracking, e-mail alerts, custom newswires and RSS feeds - and more!
