Form 8-K MOSAIC CO For: Mar 24
UNITED STATES
SECURITIES AND EXCHANGE COMMISSION
Washington, D.C. 20549
FORM 8-K
CURRENT REPORT
Pursuant to Section 13 or 15(d)
of the Securities Exchange Act of 1934
Date of Report (Date of earliest event reported): March 24, 2015
THE MOSAIC COMPANY
(Exact name of registrant as specified in its charter)
Delaware | 001-32327 | 20-1026454 | ||
(State or other jurisdiction of incorporation) | (Commission File Number) | (IRS Employer Identification No.) | ||
3033 Campus Drive Suite E490 Plymouth, Minnesota | 55441 | |
(Address of principal executive offices) | (Zip Code) | |
Registrant’s telephone number, including area code: (800) 918-8270
Not applicable
(Former Name or Former Address, if Changed Since Last Report)
Check the appropriate box below if the Form 8-K filing is intended to simultaneously satisfy the filing obligation of the registrant under any of the following provisions (see General Instruction A.2. below):
¨ | Written communications pursuant to Rule 425 under the Securities Act (17 CFR 230.425) |
¨ | Soliciting material pursuant to Rule 14a-12 under the Exchange Act (17 CFR 240.14a-12) |
¨ | Pre-commencement communications pursuant to Rule 14d-2(b) under the Exchange Act (17 CFR 240.14d-2(b)) |
¨ | Pre-commencement communications pursuant to Rule 13e-4(c) under the Exchange Act (17 CFR 240.13e-4(c)) |
Item 7.01. Regulation FD Disclosure.
The following information is being “furnished” in accordance with General Instruction B.2. of Form 8-K and shall not be deemed “filed” for purposes of Section 18 of the Securities Exchange Act of 1934, as amended (the “Exchange Act”), or otherwise subject to the liabilities of that section, nor shall it be deemed to be incorporated by reference in any filing under the Securities Act of 1933, as amended (the “Securities Act”), or the Exchange Act, except as expressly set forth by specific reference in such filing:
Furnished herewith as Exhibit 99.1 and incorporated by reference herein is a copy of a presentation being made by The Mosaic Company on March 24, 2015 at the CRU Phosphates 2015 International Conference & Exhibition in Tampa, Florida.
Item 9.01. Financial Statements and Exhibits.
(d) Exhibits.
Reference is made to the Exhibit Index hereto with respect to the exhibit furnished herewith. The exhibit listed in the Exhibit Index hereto is being “furnished” in accordance with General Instruction B.2. of Form 8-K and shall not be deemed “filed” for purposes of Section 18 of the Exchange Act, or otherwise subject to the liabilities of that section, nor shall it be deemed to be incorporated by reference in any filing under the Securities Act or the Exchange Act, except as expressly set forth by specific reference in such filing.
SIGNATURES
Pursuant to the requirements of the Securities Exchange Act of 1934, the registrant has duly caused this report to be signed on its behalf by the undersigned hereunto duly authorized.
THE MOSAIC COMPANY | ||||||
Date: March 24, 2015 | By: | /s/ Mark J. Isaacson | ||||
Name: | Mark J. Isaacson | |||||
Title: | Vice President, General Counsel | |||||
and Corporate Secretary | ||||||
EXHIBIT INDEX
Exhibit No. | Description | |
99.1 | Presentation being made by The Mosaic Company on March 24, 2015 at the CRU Phosphates 2015 International Conference & Exhibition in Tampa, Florida | |

North American Phosphate Outlook CRU Phosphates 2015 Marriott Waterside Hotel Tampa, Florida March 24, 2015 Dr. Michael R. Rahm Vice President Market and Strategic Analysis

Safe Harbor Statement 2 This document contains forward-looking statements within the meaning of the Private Securities Litigation Reform Act of 1995. Such statements include, but are not limited to, statements about the Northern Promise Joint Venture, the acquisition and assumption of certain related liabilities of the Florida phosphate assets of CF Industries, Inc. (“CF”) and Mosaic’s ammonia supply agreements with CF; repurchases of stock; other proposed or pending future transactions or strategic plans and other statements about future financial and operating results. Such statements are based upon the current beliefs and expectations of The Mosaic Company’s management and are subject to significant risks and uncertainties. These risks and uncertainties include but are not limited to risks and uncertainties arising from the ability of the Northern Promise Joint Venture to obtain additional planned funding in acceptable amounts and upon acceptable terms, the future success of current plans for the Northern Promise Joint Venture and any future changes in those plans; difficulties with realization of the benefits of the transactions with CF, including the risks that the acquired assets may not be integrated successfully or that the cost or capital savings from the transactions may not be fully realized or may take longer to realize than expected, or the price of natural gas or ammonia changes to a level at which the natural gas based pricing under one of the long term ammonia supply agreements with CF becomes disadvantageous to Mosaic; customer defaults; the effects of Mosaic’s decisions to exit business operations or locations; the predictability and volatility of, and customer expectations about, agriculture, fertilizer, raw material, energy and transportation markets that are subject to competitive and other pressures and economic and credit market conditions; the level of inventories in the distribution channels for crop nutrients; changes in foreign currency and exchange rates; international trade risks and other risks associated with Mosaic’s international operations and those of joint ventures in which Mosaic participates, including the risk that protests against natural resource companies in Peru extend to or impact the Miski Mayo mine; changes in government policy; changes in environmental and other governmental regulation, including greenhouse gas regulation, implementation of numeric water quality standards for the discharge of nutrients into Florida waterways or efforts to reduce the flow of excess nutrients into the Mississippi River basin, the Gulf of Mexico or elsewhere; further developments in judicial or administrative proceedings, or complaints that Mosaic’s operations are adversely impacting nearby farms, business operations or properties; difficulties or delays in receiving, increased costs of or challenges to necessary governmental permits or approvals or increased financial assurance requirements; resolution of global tax audit activity; the effectiveness of Mosaic’s processes for managing its strategic priorities; adverse weather conditions affecting operations in Central Florida, the Mississippi River basin, the Gulf Coast of the United States or Canada, and including potential hurricanes, excess heat, cold, snow, rainfall or drought; actual costs of various items differing from management’s current estimates, including, among others, asset retirement, environmental remediation, reclamation or other environmental regulation, Canadian resources taxes and royalties, the liabilities Mosaic assumed in the Florida phosphate assets acquisition, or the costs of the Northern Promise Joint Venture, its existing or future funding and Mosaic’s commitments in support of such funding; reduction of Mosaic’s available cash and liquidity, and increased leverage, due to its use of cash and/or available debt capacity to fund share repurchases, financial assurance requirements and strategic investments; brine inflows at Mosaic’s Esterhazy, Saskatchewan, potash mine or other potash shaft mines; other accidents and disruptions involving Mosaic’s operations, including potential mine fires, floods, explosions, seismic events or releases of hazardous or volatile chemicals, as well as other risks and uncertainties reported from time to time in The Mosaic Company’s reports filed with the Securities and Exchange Commission. Actual results may differ from those set forth in the forward-looking statements.

Agenda Demand Drivers Demand Outlook Supply Developments Factors to Watch 3

Demand Drivers
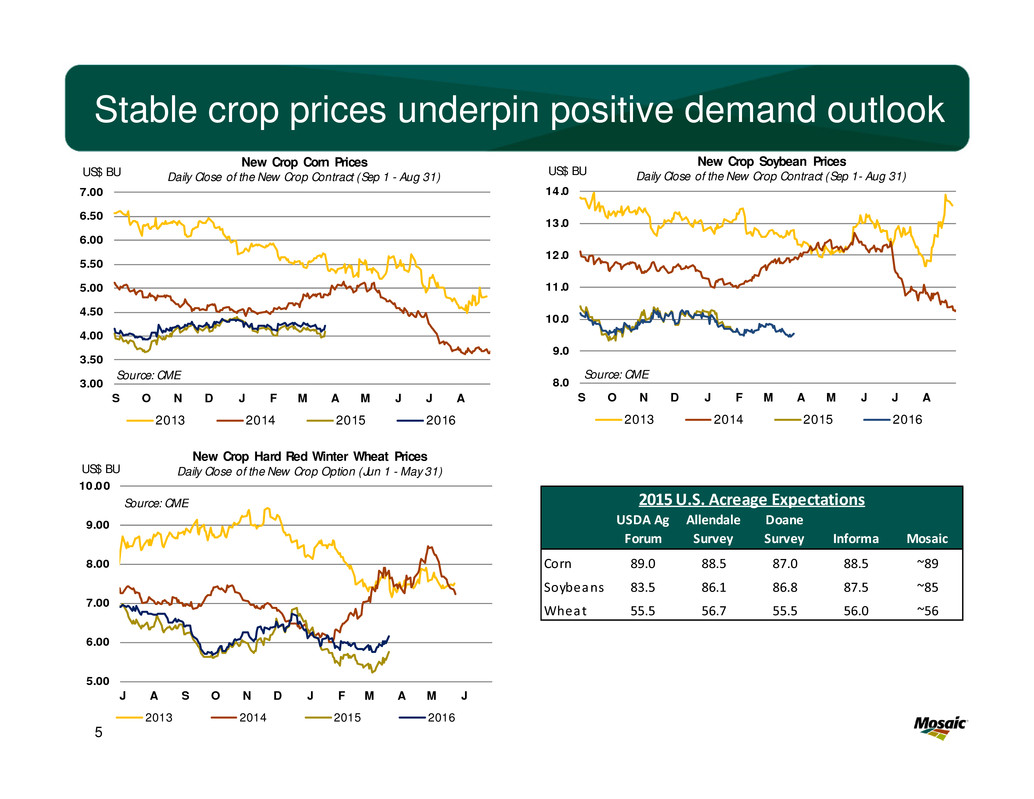
Stable crop prices underpin positive demand outlook 5 3.00 3.50 4.00 4.50 5.00 5.50 6.00 6.50 7.00 S O N D J F M A M J J A US$ BU New Crop Corn Prices Daily Close of the New Crop Contract (Sep 1 - Aug 31) 2013 2014 2015 2016 Source: CME 8.0 9.0 10.0 11.0 12.0 13.0 14.0 S O N D J F M A M J J A US$ BU New Crop Soybean Prices Daily Close of the New Crop Contract (Sep 1- Aug 31) 2013 2014 2015 2016 Source: CME 5.00 6.00 7.00 8.00 9.00 10.00 J A S O N D J F M A M J US$ BU New Crop Hard Red Winter Wheat Prices Daily Close of the New Crop Option (Jun 1 - May 31) 2013 2014 2015 2016 Source: CME USDA Ag Forum Allendale Survey Doane Survey Informa Mosaic Corn 89.0 88.5 87.0 88.5 ~89 Soybeans 83.5 86.1 86.8 87.5 ~85 Wheat 55.5 56.7 55.5 56.0 ~56 2015 U.S. Acreage Expectations

Balanced near term price drivers (at least for now) 6 BullBear Strong demand for food, feed and biofuels in response to more moderate crop prices Downward revisions to the Brazilian crop and a smattering of weather concerns elsewhere Other disruptive factors such as Russian export restrictions, the recent Brazilian truckers strike, and Argentine farmers hoarding grain as an FX hedge A somewhat worrisome U.S. drought monitor map Large speculative traders have no large net long position so no threat of long covering Mother Nature a potential bullish wild card The strong dollar Plentiful supplies - record 2014 Northern Hemisphere crop and large projected stock build in 2014/15 Record 2014/15 South American crop – lower Brazil estimates mostly offset by higher Argentina forecasts March 31 Prospective Plantings report expected to show larger-than-needed U.S. acreage in 2015 Generally cautious sentiment due to weaker economic outlooks in Brazil and China Large speculative traders have no large net short position so no threat of short covering Mother nature a potential bearish wild card
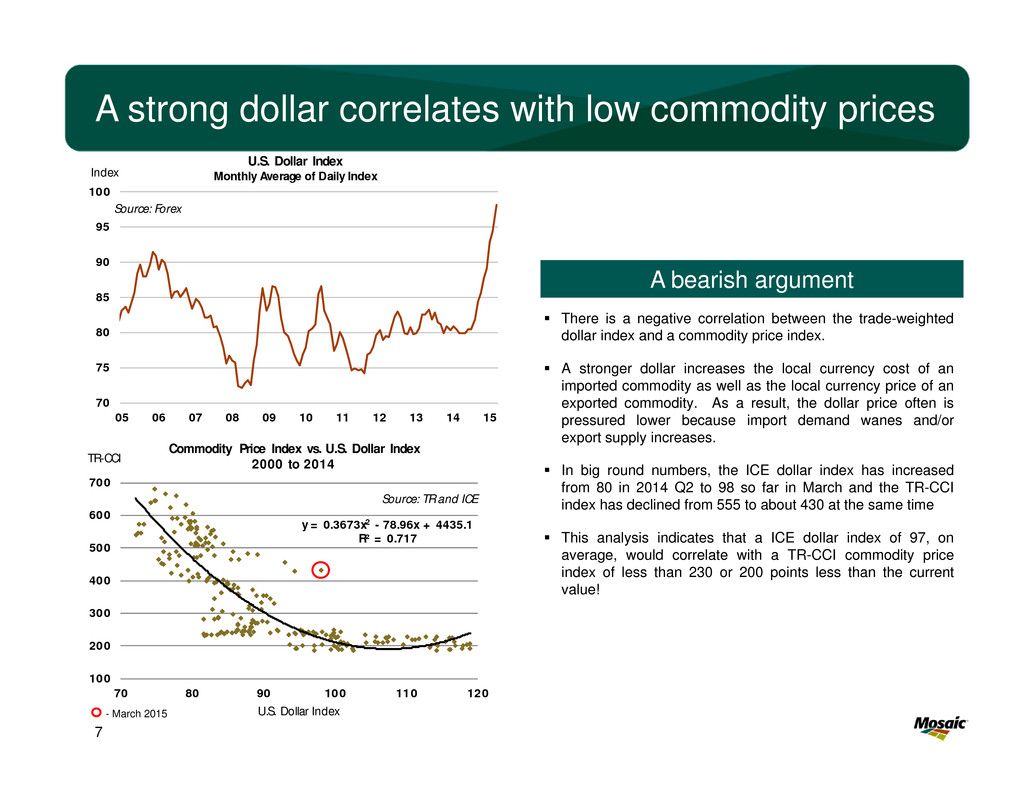
A strong dollar correlates with low commodity prices 7 70 75 80 85 90 95 100 05 06 07 08 09 10 11 12 13 14 15 Index U.S. Dollar Index Monthly Average of Daily Index Source: Forex y = 0.3673x2 - 78.96x + 4435.1 R² = 0.717 100 200 300 400 500 600 700 70 80 90 100 110 120 TR-CCI U.S. Dollar Index Commodity Price Index vs. U.S. Dollar Index 2000 to 2014 Source: TR and ICE There is a negative correlation between the trade-weighted dollar index and a commodity price index. A stronger dollar increases the local currency cost of an imported commodity as well as the local currency price of an exported commodity. As a result, the dollar price often is pressured lower because import demand wanes and/or export supply increases. In big round numbers, the ICE dollar index has increased from 80 in 2014 Q2 to 98 so far in March and the TR-CCI index has declined from 555 to about 430 at the same time This analysis indicates that a ICE dollar index of 97, on average, would correlate with a TR-CCI commodity price index of less than 230 or 200 points less than the current value! - March 2015 A bearish argument

15.0% 17.5% 20.0% 22.5% 25.0% 27.5% 30.0% 99 00 01 02 03 04 05 06 07 08 09 10 11 12 13E14F Global Grain & Oilseed Stocks as a Percent of Use Source: USDA Markets looking ahead to continued strong demand 8 2.50 2.60 2.70 2.80 2.90 3.00 3.10 3.20 3.30 800 820 840 860 880 900 920 940 960 00 01 02 03 04 05 06 07 08 09 10 11 12 13E14F MT HaMil Ha World Grain and Oilseed Area and Yields Harvested Area Yield Trend Source: USDA 2.0 2.1 2.2 2.3 2.4 2.5 2.6 2.7 2.8 2.9 3.0 3.1 00 01 02 03 04 05 06 07 08 09 10 11 12 13E 14F Bil Tonnes World Grain and Oilseed Production Production Use Source: USDA A bullish argument

But Mother Nature likely will have the final say! 9

The trend is our friend 10 Farming with spreadsheets 607 580 495 408 470 462 425 437 512 568 549 537 522 583 618 350 400 450 500 550 600 650 700 00 01 02 03 04 05 06 07 08 09 10 11 12 13 14E15F Mil Tonnes World Grain & Oilseed Stocks USDA Mosaic 2015/16 Range Mosaic Medium Scenarios Source: USDA and Mosaic 2015/16 Grain and Oilseed Scenario Assumptions Low Medium High Harvested Area Change ‐0.25% 0.00% 0.25% Yield Deviation from Trend * Largest Negative At Trend Largest Positive Demand Growth 1.75% 2.00% 2.25% * Trend yield for 2000/01 to 2013/14 crop years. Source: Mosaic. Food Crisis Farm Crisis 1.75 2.00 2.25 2.50 2.75 3.00 3.25 3.50 3.75 4.00 750 775 800 825 850 875 900 925 950 975 80 85 90 95 00 05 10 15F 20F 25F 30F MT HaMil Ha World Harvested Area and Average Yield Actual Area Forecast Area Actual Yield Required Yield 1980-10 Yield Trend Source: USDA and Mosaic The food story, while not in vogue today, still is very much intact!

Demand Outlook

M o r e A f f o r d a b l e L e s s A f f o r d a b l e Plant nutrients remain affordable . . . 12 0.50 0.75 1.00 1.25 1.50 1.75 05 06 07 08 09 10 11 12 13 14 15 Plant Nutrient Affordability Plant Nutrient Price Index / Crop Price Index Affordability Metric Average Source: Weekly Price Publications, CME, USDA, AAPFCO, Mosaic

. . . and underpin positive demand forecasts 13 W orld Grain & Oilseed Nutrient Rem oval M il Tonnes 2012 2014 % Change Product N Rem oval 59.3 64.6 5.3 8.9% 11.5 P2O 5 Rem oval 22.9 24.8 1.9 8.5% 4.2 K2O Rem oval 19.2 20.9 1.7 8.8% 2.8 Source: USDA, IPNI, M osaic 64.5-66.5 30 35 40 45 50 55 60 65 70 00 01 02 03 04 05 06 07 08 09 10 11 12 13 14E15F Global Phosphate ShipmentsMMT Product DAP/ MAP/ MES/TSP Source: CRU and Mosaic Record Global Harvests = Record P Removal from Soils Global shipments have notched new highs for six years in a row, but the rate of growth has slowed during the last three mainly due to the large drop in Indian DAP shipments since 2011 Nevertheless, global shipments increased at a respectable rate of 2.7% per year or 6.5 million tonnes from 2010 to 2014, despite the significant drag from India Shipments are forecast to post a solid gain in 2015 - Shipments are projected to climb to 65.4 million tonnes this year from 64.6 in 2014 - Banking on India for a strong rebound in phosphate shipments beginning this year

Banking on the beginning of a rebound in India 14 – Positive demand drivers • Profitable farm economics and good farm demand • A bone-dry retail distribution channel • Stable phosphate subsidy (a windfall from lower oil prices) • The rupee has remained relatively stable – The government is expected to make import economics work because India needs to import significantly more phosphate this year – Banking on India • Imports are forecast to climb to 5.0-5.5 million tonnes in 2015, up from ~4.0 million tonnes last year • Import economics work at ~$500 tonne c&f India • More upside than downside risk 0.0 1.0 2.0 3.0 4.0 5.0 6.0 7.0 8.0 9.0 00 01 02 03 04 05 06 07 08 09 10 11 12 13 14E15F Mil Tonnes India DAP/ MAP/ TSP Imports DAP MAP TSP Source: CRU, IFA, Mosaic Im porter Breakeven Scenario 2015/16 DAP Subsidy Analysis US$ INR DAP Contract Price c&f India $498 31,100 plus Duty, Taxes, Insurance 1 $31 1,950 plus Bogey to Retail 2 $45 2,800 Estim ated Im porter Cost to Retail Plant $574 35,850 less Subsidy 3 $198 12,350 Estim ated Cost Retail Plant After Subsidy $376 23,500 M axim um Retail Price (M RP) $376 23,500 Im plied Im porter M argin $0.00 0 Rupee/US$ Rate = 62.5 1 Duty, Taxes, Insurance Paid - Duty: 5.05% . Insurance: 45-69 INR/M T. Countervailing Duty: 1% . Education Assessm ent: 3% on CVD. 2 Handling, Bagging, Transport, etc. 3 Excluding prim ary and secondary freight subsidy INR/$ Source: FAI and Mosaic

Strong and steady North America shipments 15 2014/15 forecast – 9.9 million tons - second highest in modern era • Increase of 4% or 400,000 tons from last year • Up 9% or 834,000 tons from the seven-year Olympic average • Some tonnage inflation due to MicroEssentials® substituting for DAP/MAP, but solid agronomic and economic demand drivers – Outstanding fall shipments (Jul-Dec 2014) • Totaled 5.1 million tons, up 11% or 509,000 tons from average • Second highest in last seven years – Continued strong shipments expected this spring • Expected to total 4.9 million tons, up 8% or 346,0000 tons from the seven-year Olympic average • Third highest in last seven years 2015/16 forecast – Will depend on 2015 harvest and crop prices – Shipments at this point are projected to decline slightly to 9.7 million tons 0 1 2 3 4 5 6 7 8 9 10 11 01 02 03 04 05 06 07 08 09 10 11 12 13 14 15F 16F Mil Tons Product North America DAP/ MAP/ MES/ TSP Shipments Source: AAPFCO, TFI, IFA and Mosaic Fertilizer Year Ending June 30 0.0 1.0 2.0 3.0 4.0 5.0 6.0 Jul‐Dec 2014 (A) Jan‐Jun 2015 (F) Mil Tons Source: TFI, USDOC and Mosaic North American Phophate Shipments 2014/15 7‐Yr Olympic Average 7‐Yr Min‐Max Range
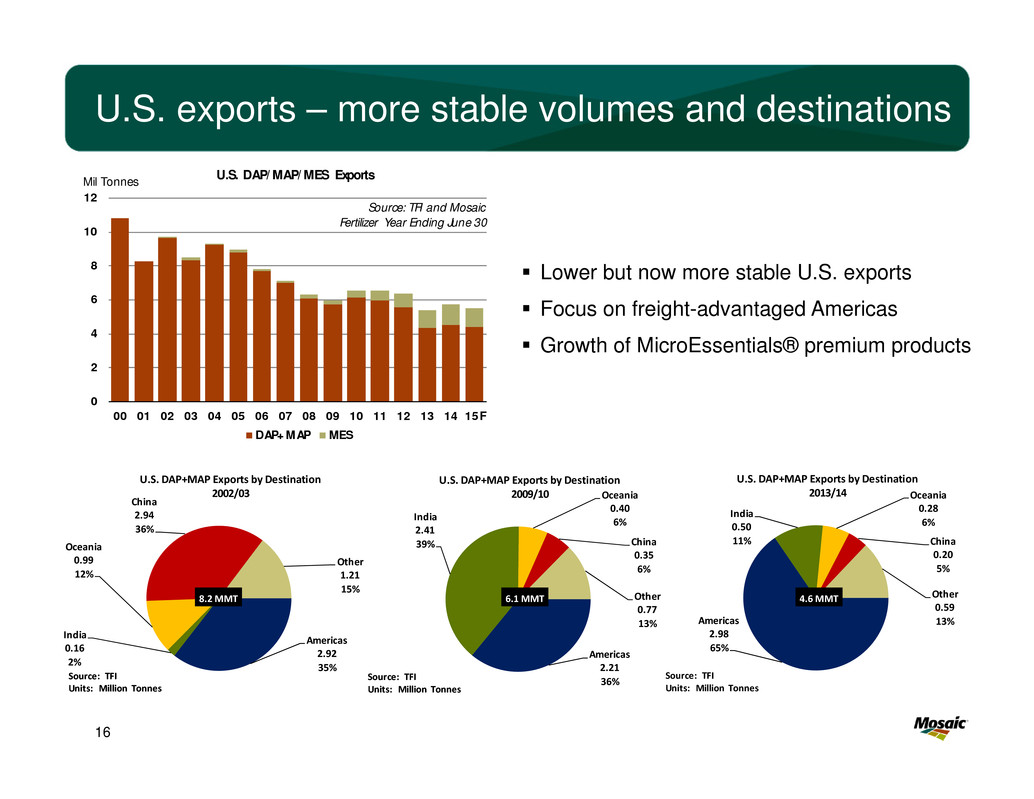
U.S. exports – more stable volumes and destinations 16 Lower but now more stable U.S. exports Focus on freight-advantaged Americas Growth of MicroEssentials® premium products Americas 2.92 35% India 0.16 2% Oceania 0.99 12% China 2.94 36% Other 1.21 15% U.S. DAP+MAP Exports by Destination 2002/03 Source: TFI Units: Million Tonnes Americas 2.21 36% India 2.41 39% Oceania 0.40 6% China 0.35 6% Other 0.77 13% U.S. DAP+MAP Exports by Destination 2009/10 Source: TFI Units: Million Tonnes Americas 2.98 65% India 0.50 11% Oceania 0.28 6% China 0.20 5% Other 0.59 13% U.S. DAP+MAP Exports by Destination 2013/14 Source: TFI Units: Million Tonnes 4.6 MMT8.2 MMT 6.1 MMT 0 2 4 6 8 10 12 00 01 02 03 04 05 06 07 08 09 10 11 12 13 14 15F Mil Tonnes U.S. DAP/ MAP/ MES Exports DAP+ MAP MES Source: TFI and Mosaic Fertilizer Year Ending June 30

Supply Developments
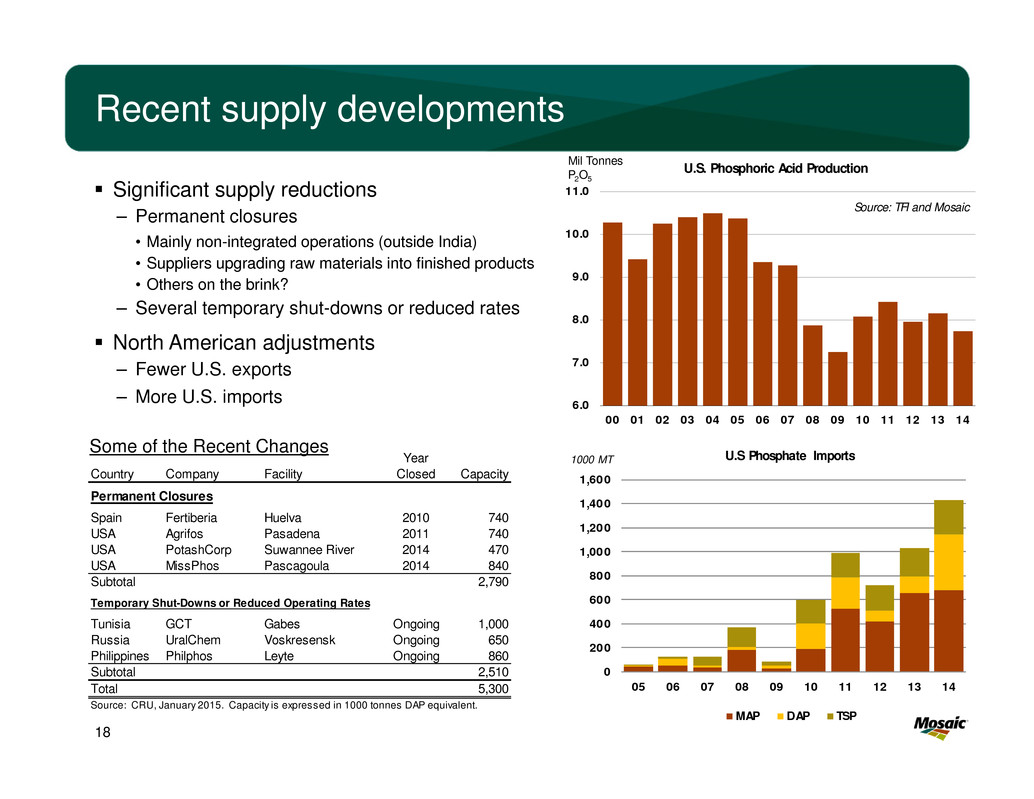
Recent supply developments Significant supply reductions – Permanent closures • Mainly non-integrated operations (outside India) • Suppliers upgrading raw materials into finished products • Others on the brink? – Several temporary shut-downs or reduced rates North American adjustments – Fewer U.S. exports – More U.S. imports 18 6.0 7.0 8.0 9.0 10.0 11.0 00 01 02 03 04 05 06 07 08 09 10 11 12 13 14 Mil Tonnes P2O5 U.S. Phosphoric Acid Production Source: TFI and Mosaic Year Country Company Facility Closed Capacity Permanent Closures Spain Fertiberia Huelva 2010 740 USA Agrifos Pasadena 2011 740 USA PotashCorp Suwannee River 2014 470 USA MissPhos Pascagoula 2014 840 Subtotal 2,790 Temporary Shut-Downs or Reduced Operating Rates Tunisia GCT Gabes Ongoing 1,000 Russia UralChem Voskresensk Ongoing 650 Philippines Philphos Leyte Ongoing 860 Subtotal 2,510 Total 5,300 Source: CRU, January 2015. Capacity is expressed in 1000 tonnes DAP equivalent. Some of the Recent Changes 0 200 400 600 800 1,000 1,200 1,400 1,600 05 06 07 08 09 10 11 12 13 14 1000 MT U.S Phosphate Imports MAP DAP TSP
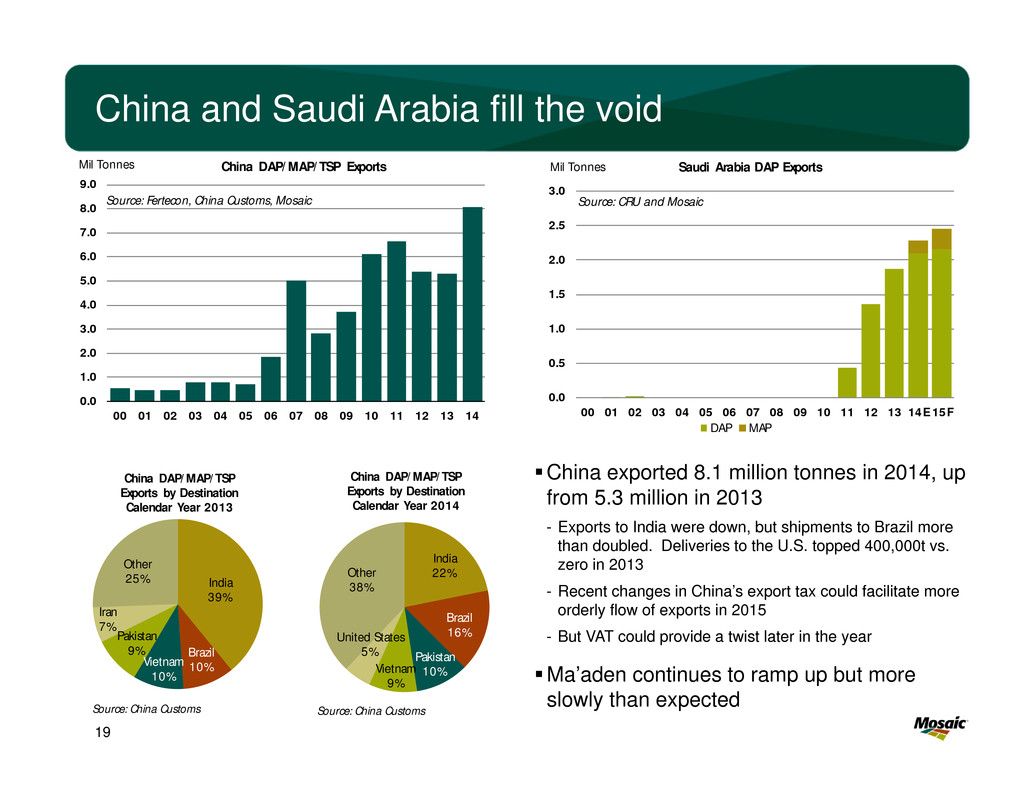
China and Saudi Arabia fill the void 19 China exported 8.1 million tonnes in 2014, up from 5.3 million in 2013 - Exports to India were down, but shipments to Brazil more than doubled. Deliveries to the U.S. topped 400,000t vs. zero in 2013 - Recent changes in China’s export tax could facilitate more orderly flow of exports in 2015 - But VAT could provide a twist later in the year Ma’aden continues to ramp up but more slowly than expected India 22% Brazil 16% Pakistan 10%Vietnam 9% United States 5% Other 38% China DAP/ MAP/ TSP Exports by Destination Calendar Year 2014 Source: China Customs India 39% Brazil 10%Vietnam 10% Pakistan 9% Iran 7% Other 25% China DAP/ MAP/ TSP Exports by Destination Calendar Year 2013 Source: China Customs 0.0 0.5 1.0 1.5 2.0 2.5 3.0 00 01 02 03 04 05 06 07 08 09 10 11 12 13 14E15F Mil Tonnes Saudi Arabia DAP Exports DAP MAP Source: CRU and Mosaic 0.0 1.0 2.0 3.0 4.0 5.0 6.0 7.0 8.0 9.0 00 01 02 03 04 05 06 07 08 09 10 11 12 13 14 Mil Tonnes China DAP/ MAP/ TSP Exports Source: Fertecon, China Customs, Mosaic
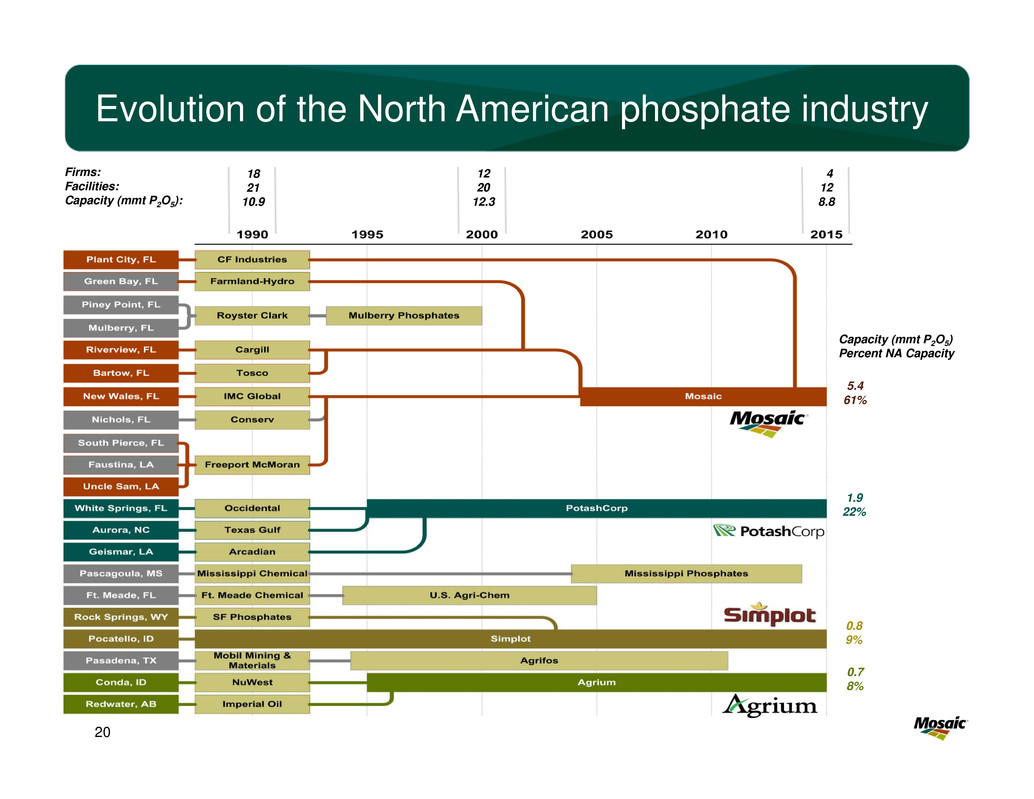
Evolution of the North American phosphate industry 20 Capacity (mmt P2O5) Percent NA Capacity 12 20 12.3 4 12 8.8 5.4 61% 1.9 22% 0.8 9% 0.7 8% 18 21 10.9 Firms: Facilities: Capacity (mmt P2O5):

Factors to Watch
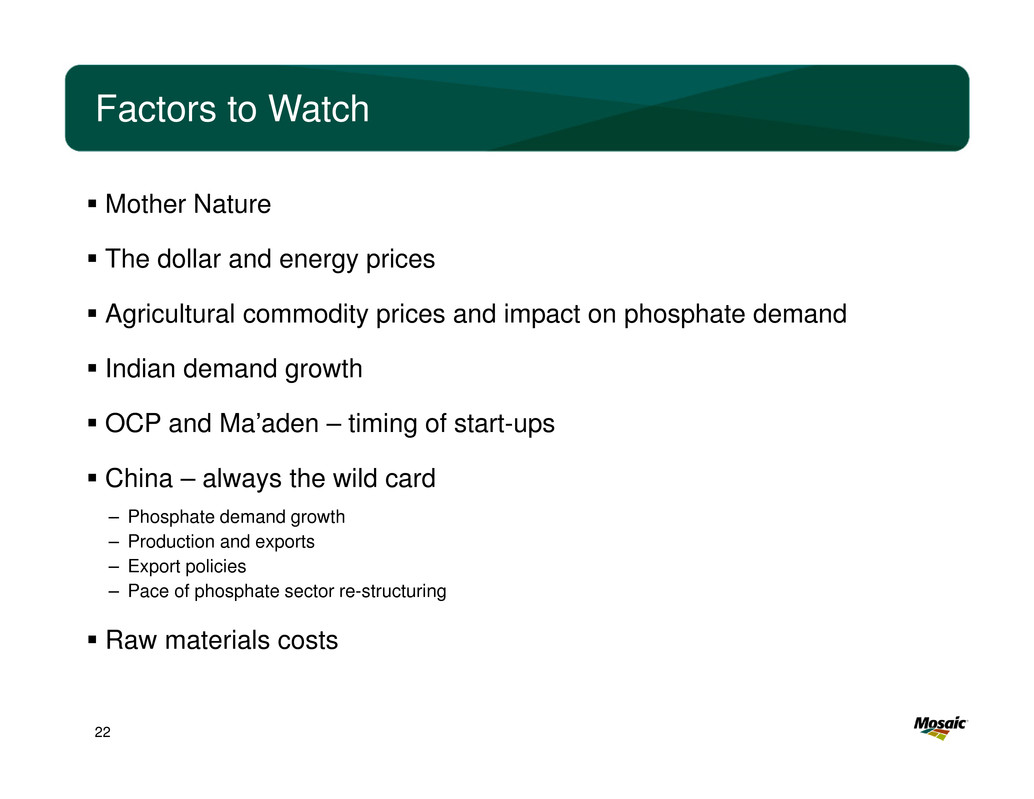
Factors to Watch Mother Nature The dollar and energy prices Agricultural commodity prices and impact on phosphate demand Indian demand growth OCP and Ma’aden – timing of start-ups China – always the wild card – Phosphate demand growth – Production and exports – Export policies – Pace of phosphate sector re-structuring Raw materials costs 22

Look for products on the Mosaic website 23 http://www.mosaicco.com/resources/market_analysis.htm Mosaic Stakeholder Handbook Market Mosaic ▪ Market Alerts ▪ Past Presentations

North American Phosphate Outlook CRU Phosphates 2015 Marriott Waterside Hotel Tampa, Florida March 24, 2015 Dr. Michael R. Rahm Vice President Market and Strategic Analysis Thank You!
Serious News for Serious Traders! Try StreetInsider.com Premium Free!
You May Also Be Interested In
- Dimensional Fund Advisors Ltd. : Form 8.3 - MONDI PLC - Ordinary Shares
- Balchem Corporation Announces Quarterly Conference Call for First Quarter Financial Results on May 3, 2024
- Top Non Bank Lenders in Australia
Create E-mail Alert Related Categories
SEC FilingsSign up for StreetInsider Free!
Receive full access to all new and archived articles, unlimited portfolio tracking, e-mail alerts, custom newswires and RSS feeds - and more!


 Tweet
Tweet Share
Share