Form 8-K APARTMENT INVESTMENT & For: Jun 07
UNITED STATES
SECURITIES AND EXCHANGE COMMISSION
WASHINGTON, D.C. 20549
_____________________________________________
FORM 8-K
_____________________________________________
CURRENT REPORT
PURSUANT TO SECTION 13 OR 15(d) OF THE
SECURITIES EXCHANGE ACT OF 1934
Date of Report (Date of earliest event reported) June 7, 2016
_____________________________________________
APARTMENT INVESTMENT AND MANAGEMENT COMPANY
(Exact name of registrant as specified in its charter)
_____________________________________________
MARYLAND | 1-13232 | 84-1259577 | ||
(State or other jurisdiction | (Commission | (I.R.S. Employer | ||
of incorporation or organization) | File Number) | Identification No.) | ||
4582 SOUTH ULSTER STREET
SUITE 1100, DENVER, CO 80237
_____________________________________________
(Address of principal executive offices) | (Zip Code) | |
Registrant's telephone number, including area code: (303) 757-8101
NOT APPLICABLE
(Former name or Former Address, if Changed Since Last Report)
_____________________________________________
Check the appropriate box below if the Form 8-K filing is intended to simultaneously satisfy the filing obligation of the registrant under any of the following provisions:
o | Written communications pursuant to Rule 425 under the Securities Act (17 CFR 230.425) |
o | Soliciting material pursuant to Rule 14a-12 under the Exchange Act (17 CFR 240.14a-12) |
o | Pre-commencement communications pursuant to Rule 14d-2(b) under the Exchange Act (17 CFR 240.14d-2(b)) |
o | Pre-commencement communications pursuant to Rule 13e-4(c) under the Exchange Act (17 CFR 240.13e-4(c)) |
ITEM 7.01. Regulation FD.
On June 7-8, 2016, representatives of Apartment Investment and Management Company (“Aimco”), including Terry Considine, Chairman of the Board and Chief Executive Officer, Paul Beldin, Executive Vice President and Chief Financial Officer, John Bezzant, Executive Vice President and Chief Investment Officer and Lisa Cohn, Executive Vice President, General Counsel and Secretary, will meet with investors. During those meetings, Aimco representatives will distribute the attached presentations. The presentations are furnished herewith as Exhibit 99.1 and Exhibit 99.2.
ITEM 9.01. Financial Statements and Exhibits.
(d) The following exhibits are furnished with this report:
Exhibit Number Description
99.1 | Apartment Investment and Management Company Presentation |
99.2 | Apartment Investment and Management Company Net Asset Value Presentation |
SIGNATURE
Pursuant to the requirements of the Securities Exchange Act of 1934, as amended, the Registrant has duly caused this report to be signed on its behalf by the undersigned thereunto duly authorized.
Dated: June 7, 2016
APARTMENT INVESTMENT AND MANAGEMENT COMPANY
/s/ Paul Beldin
___________________________________________
Paul Beldin
Executive Vice President and Chief Financial Officer

NAREIT REITWEEK JUNE 2016 1

2 AIMCO VALUE CREATION ECONOMIC INCOME: year-over-year NAV growth plus annual dividend 2015 Economic Income: $5.28 per share* 14% Return on Beginning-of-Year NAV $3.10 Property Operations Aimco's 2015 Same Store NOI growth of 5.6% created ~$3.00 of NAV per share. $0.50 Redevelopment Annual investment of $200 - $300M, at value creation averaging 25 - 35% of investment. Adds $0.50 to NAV per share annually. $0.50 Balance Sheet Each year, Aimco funds from retained earnings ~$80M of property debt amortization, adding $0.50 to NAV per share. $1.18 Annual Dividend Cash dividends per share up 13% to $1.18. * Represents the sum of a) the year-over-year change in consensus NAV as reported by KeyBanc Capital Markets and b) cash dividends per share paid by Aimco during 2015.

3 STRATEGIC AREAS OF FOCUS REDEVELOPMENT • Redevelopment is a core business activity • Robust pipeline of redevelopment opportunities within existing portfolio • Occasional development when warranted by risk-adjusted returns • Above-average property operating results over cycle • Above-average resident retention • Peer-leading expense control PROPERTY OPERATIONS • Diversified across markets and price points to reduce volatility in revenue • Disciplined capital recycling to upgrade portfolio • Peer-leading growth in average revenue per apartment home PORTFOLIO MANAGEMENT • Quantity of leverage in line with peers and declining • Quality of leverage superior to peers • Growing unencumbered pool adding financial flexibility • Rated investment grade by S&P and by Fitch BALANCE SHEET • Focus on ownership and operation of apartment communities • Add value through operational excellence and redevelopment • Live our values, foster a culture of success and work collaboratively every day to achieve our goals BUSINESS & CULTURE

PROPERTY OPERATIONS STRATEGY 4 STRATEGY PROVIDES FOR • Greater NOI contribution: Renewal lease rate increases are generally higher than new lease rate increases; renewals avoid costs associated with turnover: higher vacancy, refurbishment, and marketing. • More predictable operating results: Renewal lease rate increases are less volatile; operating costs more predictable. PRODUCE ABOVE-AVERAGE OPERATING RESULTS • Focus on customer satisfaction, resident retention, and superior cost control
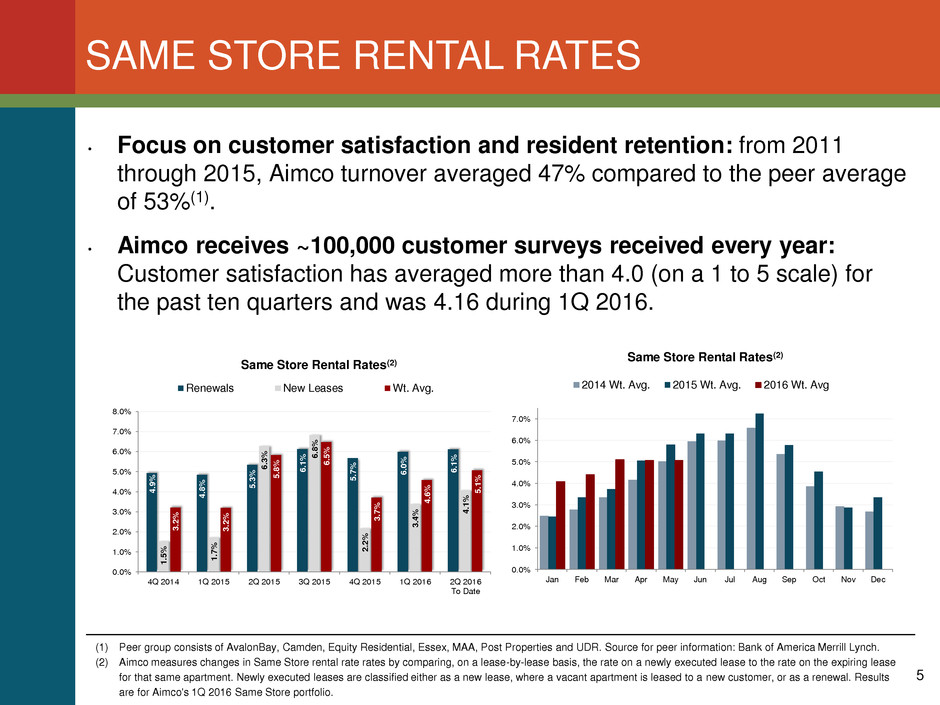
• Focus on customer satisfaction and resident retention: from 2011 through 2015, Aimco turnover averaged 47% compared to the peer average of 53%(1). • Aimco receives ~100,000 customer surveys received every year: Customer satisfaction has averaged more than 4.0 (on a 1 to 5 scale) for the past ten quarters and was 4.16 during 1Q 2016. SAME STORE RENTAL RATES 5 (1) Peer group consists of AvalonBay, Camden, Equity Residential, Essex, MAA, Post Properties and UDR. Source for peer information: Bank of America Merrill Lynch. (2) Aimco measures changes in Same Store rental rate rates by comparing, on a lease-by-lease basis, the rate on a newly executed lease to the rate on the expiring lease for that same apartment. Newly executed leases are classified either as a new lease, where a vacant apartment is leased to a new customer, or as a renewal. Results are for Aimco's 1Q 2016 Same Store portfolio. 4. 9% 4. 8% 5 .3 % 6 .1 % 5. 7% 6. 0% 6. 1% 1. 5% 1. 7% 6. 3% 6 .8 % 2. 2% 3. 4% 4. 1% 3. 2% 3. 2% 5. 8% 6 .5 % 3. 7% 4. 6% 5 .1 % 4Q 2014 1Q 2015 2Q 2015 3Q 2015 4Q 2015 1Q 2016 2Q 2016 To Date 0.0% 1.0% 2.0% 3.0% 4.0% 5.0% 6.0% 7.0% 8.0% Same Store Rental Rates(2) Renewals New Leases Wt. Avg. Jan Feb Mar Apr May Jun Jul Aug Sep Oct Nov Dec 0.0% 1.0% 2.0% 3.0% 4.0% 5.0% 6.0% 7.0% Same Store Rental Rates(2) 2014 Wt. Avg. 2015 Wt. Avg. 2016 Wt. Avg

SAME STORE RENTAL RATES 6 Results are for Aimco's 1Q 2016 Same Store portfolio. • Aimco diversification by market and price point continues to provide balanced rent growth. As stated on our 1Q 2016 earnings call, 2Q and 3Q new lease pricing are adversely affected by the relocation of lease expirations from 4Q and 1Q with the offsetting benefits in lower lease expirations outside of the 2Q and 3Q leasing season. • We remain on track to achieve our 2016 revenue growth guidance of 4.5% to 5.0%. % Total NOI % Total Revenue 1Q 2016 1Q 2016 QTD 2Q 2016 QTD 2Q 2015 QTD 2Q 2016 QTD 2Q 2015 QTD 2Q 2016 QTD 2Q 2015 ATLANTA 2.6% 3.0% 4.2% 4.1% 7.3% 7.2% 5.5% 5.1% BAY AREA 8.5% 8.2% 7.2% 21.0% 10.3% 8.1% 8.8% 13.9% BOSTON 9.0% 9.7% 7.9% 6.7% 7.2% 6.4% 7.5% 6.6% CHICAGO 7.3% 7.5% 6.8% 8.8% 5.6% 4.3% 6.2% 6.3% DENVER 5.1% 4.4% 5.2% 12.4% 8.8% 4.8% 6.6% 9.2% GREATER DC 14.1% 14.2% 1.3% 0.6% 4.8% 3.7% 3.2% 2.0% GREATER LA 18.8% 17.1% 2.8% 5.0% 6.2% 3.8% 4.2% 4.4% MIAMI 7.8% 7.9% 0.5% 6.9% 3.6% 8.0% 2.2% 7.5% NEW YORK 4.1% 4.6% 5.1% 7.7% 3.7% 5.4% 4.4% 6.4% PHILADELPHIA 6.4% 7.2% 1.7% 1.5% 5.5% 3.5% 3.7% 2.5% SAN DIEGO 6.4% 5.6% 6.8% 8.8% 7.4% 4.8% 7.0% 7.2% SEATTLE 0.6% 0.7% 17.9% 12.1% 14.0% 6.3% 16.0% 9.6% TOTAL TARGET MARKETS 90.7% 90.2% 4.3% 6.5% 6.1% 5.2% 5.2% 5.9% TOTAL OTHER MARKETS 9.3% 9.8% 2.5% 1.2% 5.9% 4.8% 4.2% 2.7% GRAND TOTAL 100.0% 100.0% 4.1% 5.7% 6.1% 5.2% 5.1% 5.5% Weighted AverageNew Leases Renewals

7 DEMOGRAPHICS SUPPORT STRONG DEMAND • Historically, 64% of people aged 20 to 34 have opted for rental housing. • If propensity to rent remains, people in this age cohort could add 650k people to the rental population over the next 10 years. • Historically, about 21% of people over the age of 55 have opted for rental housing. • If propensity to rent remains, people in this age cohort could add 3.8M people to the rental population over the next 10 years. Sources: Moody's Economy.com; Green Street Advisors -0.3 -0.2 -0.1 0.0 0.1 0.2 0.3 0.4 0.5 2016 2017 2018 2019 2020 2021 2022 2023 2024 2025 Mi llio ns Impact of Baby Boomer and Echo Boomer Population Change on Potential New Renters Aged > 55 Aged > 20 - 34
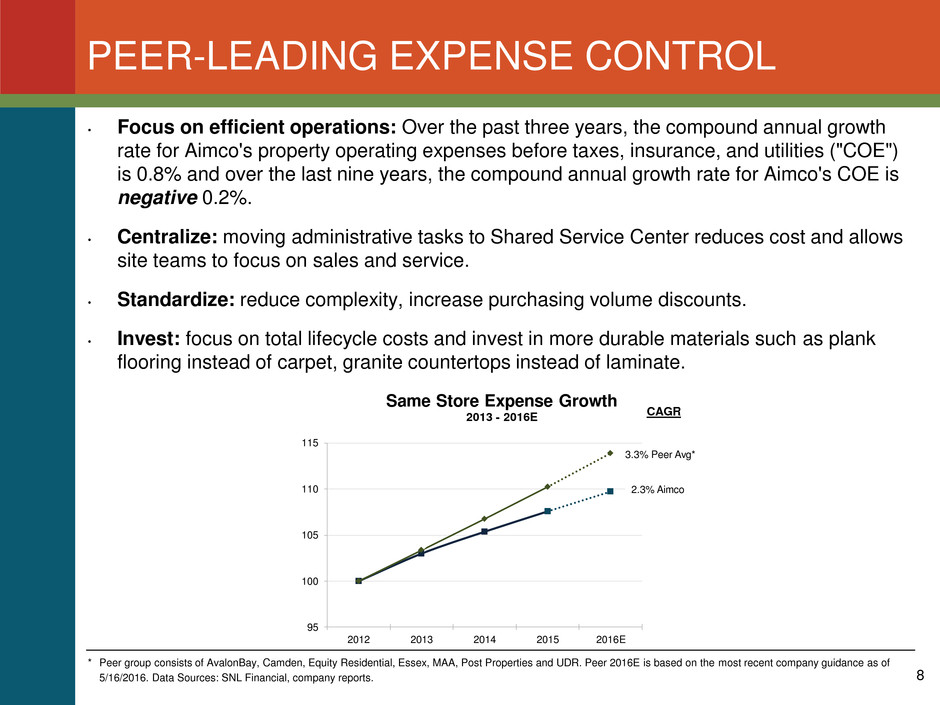
PEER-LEADING EXPENSE CONTROL 8 * Peer group consists of AvalonBay, Camden, Equity Residential, Essex, MAA, Post Properties and UDR. Peer 2016E is based on the most recent company guidance as of 5/16/2016. Data Sources: SNL Financial, company reports. • Focus on efficient operations: Over the past three years, the compound annual growth rate for Aimco's property operating expenses before taxes, insurance, and utilities ("COE") is 0.8% and over the last nine years, the compound annual growth rate for Aimco's COE is negative 0.2%. • Centralize: moving administrative tasks to Shared Service Center reduces cost and allows site teams to focus on sales and service. • Standardize: reduce complexity, increase purchasing volume discounts. • Invest: focus on total lifecycle costs and invest in more durable materials such as plank flooring instead of carpet, granite countertops instead of laminate. CAGR 2.3% Aimco 3.3% Peer Avg* 95 100 105 110 115 2012 2013 2014 2015 2016E Same Store Expense Growth 2013 - 2016E
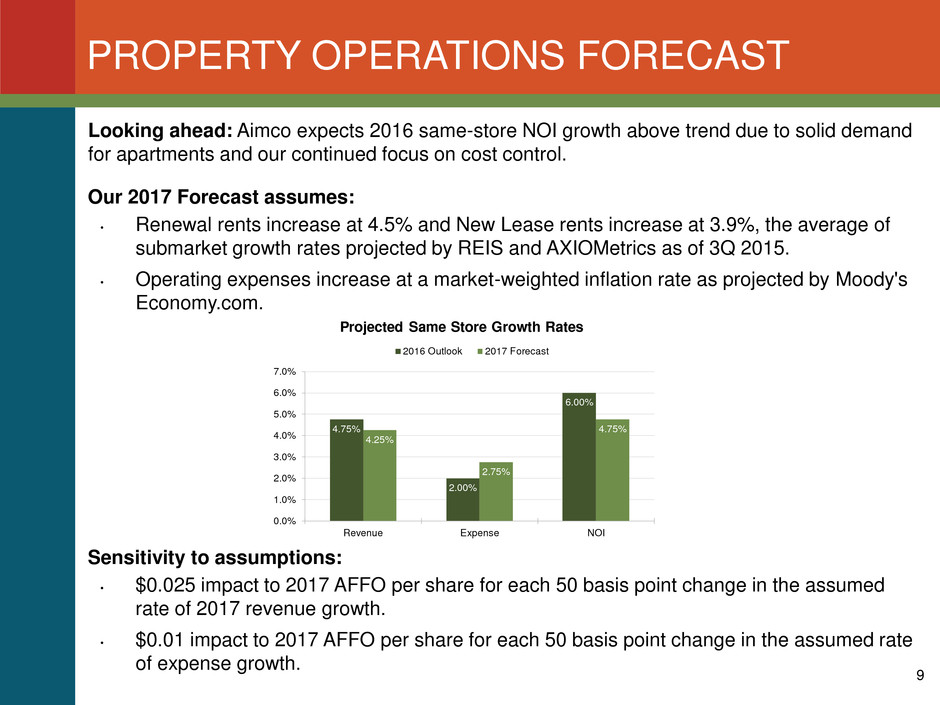
Looking ahead: Aimco expects 2016 same-store NOI growth above trend due to solid demand for apartments and our continued focus on cost control. Our 2017 Forecast assumes: • Renewal rents increase at 4.5% and New Lease rents increase at 3.9%, the average of submarket growth rates projected by REIS and AXIOMetrics as of 3Q 2015. • Operating expenses increase at a market-weighted inflation rate as projected by Moody's Economy.com. Sensitivity to assumptions: • $0.025 impact to 2017 AFFO per share for each 50 basis point change in the assumed rate of 2017 revenue growth. • $0.01 impact to 2017 AFFO per share for each 50 basis point change in the assumed rate of expense growth. PROPERTY OPERATIONS FORECAST 9 4.75% 2.00% 6.00% 4.25% 2.75% 4.75% 0.0% 1.0% 2.0% 3.0% 4.0% 5.0% 6.0% 7.0% Revenue Expense NOI Projected Same Store Growth Rates 2016 Outlook 2017 Forecast

• During 2016 and 2017, Aimco expects to lease-up three newly-constructed communities, which communities are projected to make a neutral contribution to NOI in 2016, and to contribute $0.12 per share to 2017 NOI. Sensitivity to assumptions: • If the lease-up of these communities is six months faster or slower, the contribution to NOI would be plus or minus $0.02 per share in 2016, and plus or minus $0.03 per share in 2017. • If the lease-up of these communities is achieved at rents 10% higher or lower, the contribution to NOI would be plus or minus $0.01 per share in 2016, and plus or minus $0.02 per share in 2017. LEASE-UP COMMUNITIES 10 Schedule Total Apt. Homes % Leased as of 6/5/2016 Initial Occupancy Stabilized Occupancy Stabilized NOI Stabilized Revenue per Apt. Home Commercial Revenue ONE CANAL, BOSTON 310 29% 2Q 2016 3Q 2017 4Q 2018 $ 3,865 $1.1M VIVO, CAMBRIDGE 91 87% 4Q 2015 3Q 2016 4Q 2017 $ 2,750 $0.4M INDIGO, BAY AREA 463 17% 2Q 2016 3Q 2017 4Q 2018 $ 4,130 -
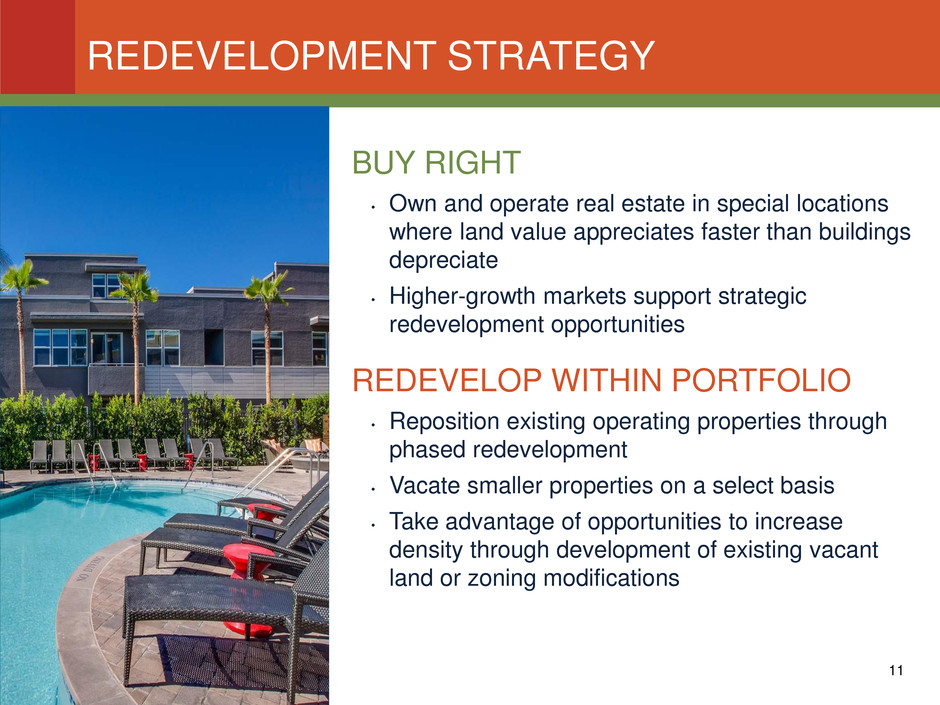
REDEVELOPMENT STRATEGY 11 BUY RIGHT • Own and operate real estate in special locations where land value appreciates faster than buildings depreciate • Higher-growth markets support strategic redevelopment opportunities REDEVELOP WITHIN PORTFOLIO • Reposition existing operating properties through phased redevelopment • Vacate smaller properties on a select basis • Take advantage of opportunities to increase density through development of existing vacant land or zoning modifications

12 REDEVELOPMENT VALUE CREATION NOI STABILIZED Communities Net Investment 4 $167M OCCUPANCY STABILIZED Communities Net investment 3 $583M UNDER CONSTRUCTION Communities Estimated net investment 2 $160M TOTAL / WEIGHTED AVERAGE Communities Net Investment Actual / projected value creation as a % of net investment 9 $910M 33% • During the last three years, Aimco completed seven redevelopments located in high-quality locations in: the Bay Area; La Jolla, CA; west Los Angeles; downtown Seattle; and suburban Chicago.

13 2016 REDEVELOPMENT FOCUS NOI STABILIZATION OF COMPLETED CALIFORNIA REDEVELOPMENTS BAY AREA Preserve at Marin (126 Apartments) PHILADELPHIA The Sterling (Expanded Scope) Park Towne Place (Expanded Scope) GREATER LA Lincoln Place (795 Apartments) BOSTON One Canal (310 Apartments) SAN DIEGO Ocean House on Prospect (53 Apartments) COMPLETION OF CONSTRUCTION OF APPROVED REDEVELOPMENTS AND DEVELOPMENT PROJECTS IN PHILADELPHIA AND BOSTON • Achieve NOI stabilization of occupancy stabilized communities and occupancy stabilization of communities under construction, contributing incremental NOI of $0.06 per share in 2016 and $0.09 per share in 2017. • Continue to plan additional 2017 and 2018 starts to backfill redevelopment pipeline and support spending of $200M to $300M per annum.

14 WHAT'S NEXT FOR REDEVELOPMENT? REDEVELOPMENT PIPELINE BAY AREA 707 Leahy (110 Apartments) CHICAGO Yorktown Apartments (364 Apartments) Yorktown Apartments Expansion (~100 Apartments) MIAMI Yacht Club at Brickell (357 Apartments) PHILADELPHIA Park Towne Place (Expanded Scope) DENVER Eastpointe (140 Apartments) GREATER LA Palazzo East (611 Apartments) Villas at Park La Brea (250 Apartments) The Palazzo at Park La Brea (Expanded Scope) 3400 Avenue of the Arts (Expanded Scope) Pipeline projects included in the above have not yet been approved by Aimco's Investment Committee. Approved redevelopment projects and scope may differ materially from the above.
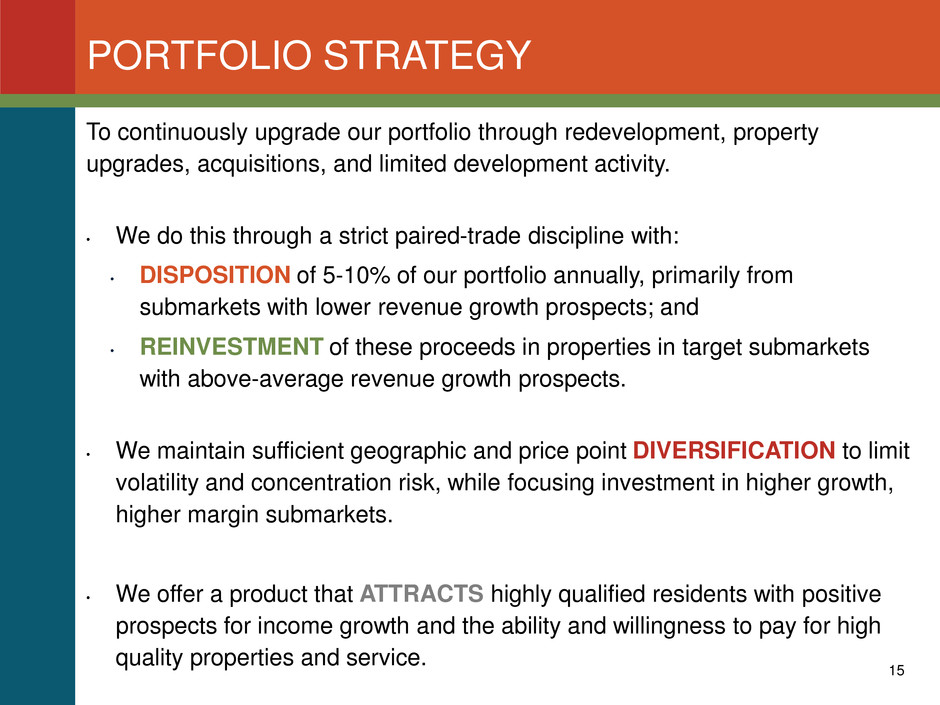
15 PORTFOLIO STRATEGY To continuously upgrade our portfolio through redevelopment, property upgrades, acquisitions, and limited development activity. • We do this through a strict paired-trade discipline with: • DISPOSITION of 5-10% of our portfolio annually, primarily from submarkets with lower revenue growth prospects; and • REINVESTMENT of these proceeds in properties in target submarkets with above-average revenue growth prospects. • We maintain sufficient geographic and price point DIVERSIFICATION to limit volatility and concentration risk, while focusing investment in higher growth, higher margin submarkets. • We offer a product that ATTRACTS highly qualified residents with positive prospects for income growth and the ability and willingness to pay for high quality properties and service.

PORTFOLIO STRATEGY EXECUTION 16 • Aimco targets the disposition of 5-10% of our portfolio annually. On average, during the last three years, we have disposed of 5% of our portfolio annually. • We fund redevelopment, development and property upgrades from the sale of 2-3% of assets each year (~$200-$300M) and fund selective acquisitions with additional sales up to the 5-10% target, only if accretive opportunities are identified that improve portfolio quality. Aimco is cautious about acquisitions in the current environment where accretive opportunities are limited. $ Millions 2013 2014 2015 Total/ Wt. Avg. PROPERTY SALES Gross proceeds % of Portfolio Net proceeds $406 4% $203 $689 7% $435 $386 4% $226 $1,481 5% $867 USE OF PROCEEDS Redevelopment/development Property upgrades Acquisitions Decrease/(increase) in leverage Total $194 39 54 119 $406 $229 50 349 61 $689 $233 49 129 (25) $386 $656 138 532 155 $1,481
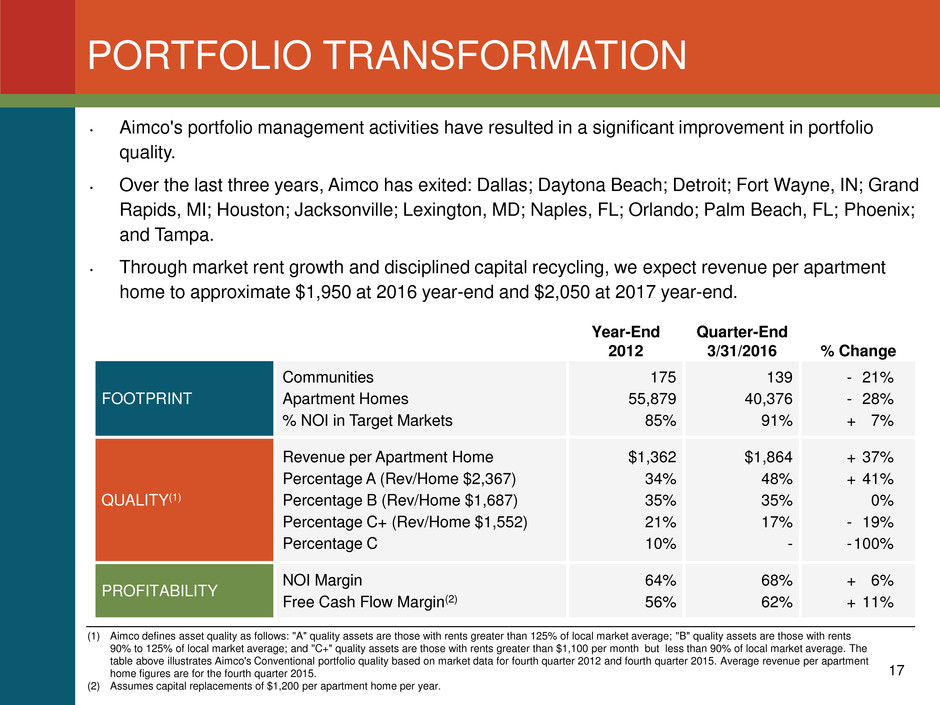
• Aimco's portfolio management activities have resulted in a significant improvement in portfolio quality. • Over the last three years, Aimco has exited: Dallas; Daytona Beach; Detroit; Fort Wayne, IN; Grand Rapids, MI; Houston; Jacksonville; Lexington, MD; Naples, FL; Orlando; Palm Beach, FL; Phoenix; and Tampa. • Through market rent growth and disciplined capital recycling, we expect revenue per apartment home to approximate $1,950 at 2016 year-end and $2,050 at 2017 year-end. 17 PORTFOLIO TRANSFORMATION (1) Aimco defines asset quality as follows: "A" quality assets are those with rents greater than 125% of local market average; "B" quality assets are those with rents 90% to 125% of local market average; and "C+" quality assets are those with rents greater than $1,100 per month but less than 90% of local market average. The table above illustrates Aimco's Conventional portfolio quality based on market data for fourth quarter 2012 and fourth quarter 2015. Average revenue per apartment home figures are for the fourth quarter 2015. (2) Assumes capital replacements of $1,200 per apartment home per year. Year-End 2012 Quarter-End 3/31/2016 % Change FOOTPRINT Communities Apartment Homes % NOI in Target Markets 175 55,879 85% 139 40,376 91% - 21% - 28% + 7% QUALITY(1) Revenue per Apartment Home Percentage A (Rev/Home $2,367) Percentage B (Rev/Home $1,687) Percentage C+ (Rev/Home $1,552) Percentage C $1,362 34% 35% 21% 10% $1,864 48% 35% 17% - + 37% + 41% 0% - 19% - 100% PROFITABILITY NOI Margin Free Cash Flow Margin(2) 64% 56% 68% 62% + 6% + 11%

HIGH QUALITY BALANCE SHEET • During the last three years, Aimco has reduced leverage and added financial flexibility by creating an unencumbered pool of assets. Both S&P and Fitch rate the Aimco balance sheet "investment grade." • Aimco leverage is primarily ten year property debt that prices today at approximately 150 basis points above the ten year Treasury rate. • Year-to-date, REITs having an investment grade rating similar to Aimco's have issued ten year bonds at a weighted average rate more than 220 basis points above the ten year Treasury rate. 18 Year-End 2012 Quarter-End 3/31/2016 % Change DEBT TO EBITDA 7.5x 6.4x - 15% DEBT AND PREFERRED EQUITY TO EBITDA 7.8x 6.8x - 13% VALUE OF UNENCUMBERED ASSETS $0.0B $1.8B + 100%

• Aimco Debt and Preferred Equity to EBITDA of 6.8x reflects outstanding balances at 3/31/2016, but overstates the refunding risk of our leverage. • Our property debt balances at maturity are more than $700 million lower than quarter-end 2016 balances as principal amortization is paid from retained earnings. 5.4x 6.8x 4.9x Peer Wt. Avg. Aimco Aimco Based on Balances Due at Maturity HIGH QUALITY BALANCE SHEET (1) Peer group consists of AvalonBay, Camden, Equity Residential, Essex, MAA, Post Properties and UDR. Peer weighted average computed by Aimco based on 3/31/2016 debt and preferred equity balances, less cash, cash equivalents and restricted cash, divided by last twelve months recurring EBITDA, all as reported by SNL Financial. Balances are adjusted to reflect company share of unconsolidated debt and NOI. For Aimco, leverage represents Aimco's share of property debt, preferred equity and any balance on the revolving credit facility, reduced by Aimco's share of cash, cash equivalents, restricted cash and investments in a securitization trust that holds Aimco property loans. See further information in Aimco's 1Q 2016 Earnings Release. (2) Refunding Risk is lower than Total Leverage because property debt balances are reduced by scheduled amortization funded from retained earnings and because perpetual preferred equity is not subject to mandatory refunding. Property debt amortization, Perpetual Preferred Equity Total Leverage / LTM EBITDA as of March 31, 2016 (1) Refunding Risk (2) 19

• Looking ahead: We expect the quantum of leverage to remain fairly constant over the next several years and that our leverage ratios will improve due to NOI growth in our same store portfolio and the earn-in from stabilization of redevelopments and lease-up properties. • Exposure to interest rates: Aimco has limited near-term exposure to changes in interest rates due to the long duration and fixed rates of its leverage. If Aimco refinances maturing property loans at today's interest rates, it would result in an annual increase to AFFO per share of approximately $0.05 for each of the next few years. • Exposure to capital markets: Aimco's operating, investing and financing activities have limited exposure to capital markets with 2016 and 2017 fully funded by: (i) continuing operations, (ii) selling $625M - $725M in properties (a reduction of approximately 30% from our average annual sales during the past three years), (iii) the refinancing of $575M of maturing property debt with average LTVs at maturity of 30%, and (iv) placing approximately $145M of new property debt. Through May 2016, Aimco has completed $255M of property sales and rate locked $145M of property debt at 3.34%. Aimco's business plans do not contemplate equity issuance. Year-End 2015 Year-End 2017 Forecast % Change DEBT TO EBITDA 6.4x ~ 5.9x - 8% DEBT AND PREFERRED EQUITY TO EBITDA 6.8x ~ 6.3x - 7% VALUE OF UNENCUMBERED ASSETS $1.8B $2.1B + 17% FOCUS ON REDUCING LEVERAGE 20

Integrity Respect Collaboration Customer Focus Performance Our Vision To be the best owner and operator of apartment communities, inspired by a talented team committed to exceptional customer service, strong financial performance, and outstanding corporate citizenship. Aimco Cares In 2014, we celebrated 10 years of Aimco Cares. Over the last decade: Aimco team members have contributed tens of Top Work Place In 2016, Aimco was again recognized by the Denver Post as a Top Work Place based on independent surveys of ~300 team members. thousands of volunteer hours to hundreds of non-profit organizations; the annual Aimco Cares Charity Golf Classic has raised nearly $3 million for patriotic and educational causes; and Aimco has awarded nearly 500 college scholarships to help team members with the cost of their child's higher education. WE LIVE OUR VALUES 21 2013 2014 2015 2016

AIMCO SENIOR LEADERSHIP TEAM Terry is a life-long entrepreneur focused on business, politics and family. Terry has been an active real estate investor for more than 45 years, serving four REITs as CEO. Through the Considine Companies, Terry has invested in real estate, television broadcasting, convenience stores, environmental services, and venture capital. Terry contributed his apartment business to the formation of Aimco, led the Aimco IPO in 1994, and has served as Aimco Chairman/CEO since that time. Terry has also been active in politics, elected twice to the Colorado Senate and holding leadership roles in numerous campaigns and political organizations. He is a director of the Lynde and Harry Bradley Foundation in Milwaukee, Wisconsin and Intrepid Potash (NYSE: IPI) in Denver, Colorado. Terry has been married for 40 years to his wife Betsy. Together, they are actively involved in education reform and ranching in western Colorado. Most of all, they enjoy three adult children, their spouses, and a remarkable granddaughter. TERRY CONSIDINE Chairman of the Board & Chief Executive Officer 22

AIMCO SENIOR LEADERSHIP TEAM Paul was promoted to Executive Vice President and Chief Financial Officer in September 2015. He joined Aimco in 2008 as Senior Vice President and Chief Accounting Officer. Prior to joining Aimco, from October 2007 to March 2008, Paul served as Chief Financial Officer of APRO Residential Fund. Prior to that, from May 2005 to September 2007, Paul served as Chief Financial Officer of America First Apartment Investors, Inc., then a publicly traded company. From 1996 to 2005, Paul was with the firm of Deloitte & Touche, LLP serving in numerous roles. Paul is a certified public accountant. PAUL BELDIN Executive Vice President & Chief Financial Officer 23
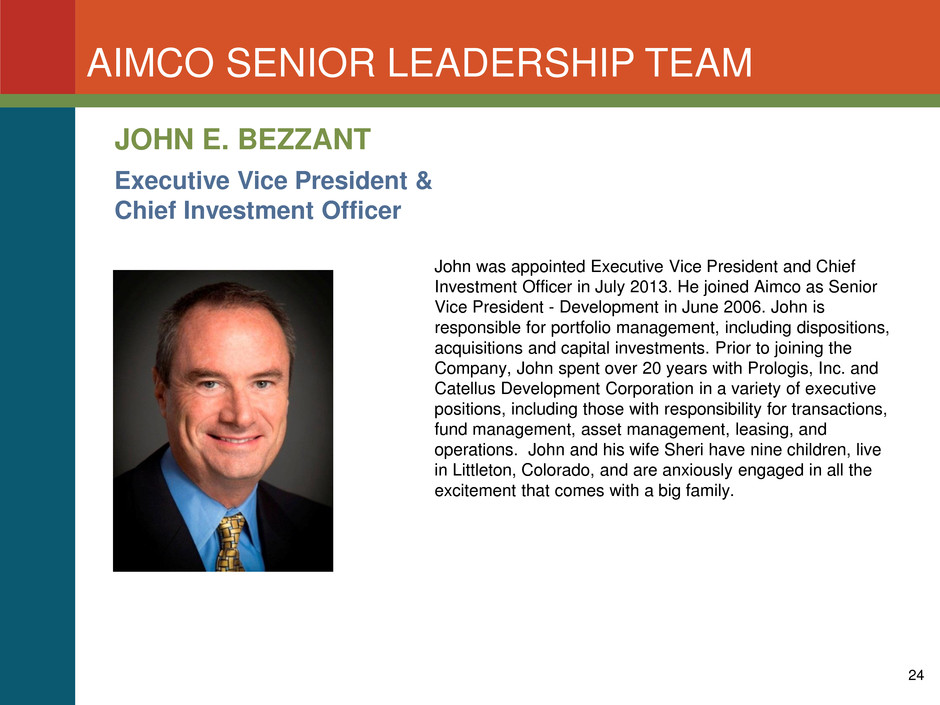
AIMCO SENIOR LEADERSHIP TEAM John was appointed Executive Vice President and Chief Investment Officer in July 2013. He joined Aimco as Senior Vice President - Development in June 2006. John is responsible for portfolio management, including dispositions, acquisitions and capital investments. Prior to joining the Company, John spent over 20 years with Prologis, Inc. and Catellus Development Corporation in a variety of executive positions, including those with responsibility for transactions, fund management, asset management, leasing, and operations. John and his wife Sheri have nine children, live in Littleton, Colorado, and are anxiously engaged in all the excitement that comes with a big family. JOHN E. BEZZANT Executive Vice President & Chief Investment Officer 24

AIMCO SENIOR LEADERSHIP TEAM Lisa has served as Aimco's Executive Vice President, General Counsel and Secretary since 2007. Lisa is responsible for Aimco's legal, insurance and risk management functions and has executive responsibility for human resources, compliance, commercial and ancillary income, and asset quality and service. Lisa has also served as Chairman of the Aimco Investment Committee since November 2014. She joined Aimco in July 2002 as Vice President, Assistant General Counsel and Assistant Secretary and was promoted to Senior Vice President in July 2004. Prior to joining Aimco, Lisa was engaged in the private practice of law at Hogan & Hartson LLP (now Hogan Lovells), with an emphasis on public and private transactional work, public equity offerings and venture capital financing. Prior to private practice, she spent two years as a Federal judicial law clerk. Lisa earned her degree in Public Policy from Stanford University and earned her law degree from Harvard Law School. She serves on the Board of Trustees of the Rose Community Foundation and is actively involved in the Denver community. Lisa and her husband, Rich, have one son. LISA R. COHN Executive Vice President, General Counsel & Secretary 25

AIMCO SENIOR LEADERSHIP TEAM Miles was promoted to Executive Vice President and Chief Administrative Officer in December 2007. He is responsible for administration, government relations, communications, and special projects, and chairs the Senior Leadership Team. Miles joined Aimco in August 2001 as Executive Vice President, General Counsel and Secretary. Prior to joining the Company, he practiced law in Denver, Colorado since 1970 and served as president of both the Colorado Bar Association and the Denver Bar Association. For over ten years he was recognized in "Best Lawyers in America" and in 2001 was the Denver Business Journal's "Law Executive of the Year." He served with the First Infantry Division in Vietnam in 1969, where he was awarded the Bronze Star, the Air Medal and the Army Commendation Medal. Miles has been a trustee of Trinity University since 2005 and serves on the board of directors of the Colorado Open Golf Foundation. He is married to Jan Cortez, and they have four children and five grandchildren. He is an avid tennis player and golfer, and speaks Spanish. MILES CORTEZ Executive Vice President & Chief Administrative Officer 26

AIMCO SENIOR LEADERSHIP TEAM Patti was promoted to Executive Vice President — Securities and Debt in February 2003 and Treasurer in January 2005 and assumed responsibility for Redevelopment activities in November 2014. She is responsible for debt financing activities, including property debt and corporate financings, and she oversees all Treasury, LIHTC and joint ventures for the company. Patti joined Aimco in February 1997 as Vice President-Tenders, Securities and Debt and was promoted to Senior Vice President-Securities and Debt in January 2000. Prior to joining Aimco, Patti was with Hanover Capital from 1996- 1997 and from 1993-1995 she was Vice Chairman, Senior Vice President and Co-Founder of CapSource Funding Corp. Patti was a Group Vice President with Duff & Phelps Rating Company from 1987 to 1993 and a commercial real estate appraiser with American Appraisal for three years. Patti and her husband Bill have two boys. In her spare time she enjoys skiing, biking, and swimming. PATTI FIELDING Executive Vice President – Redevelopment 27

AIMCO SENIOR LEADERSHIP TEAM Keith was born in Pittsburgh, Pennsylvania and is a die hard Steelers fan. In 1976 his family moved to Southern California where he quickly acclimated to the beautiful beaches and took up his passion for surfing. Keith is married to his wonderful wife Leyla, and they have two beautiful children and now reside in Colorado. Keith began his career in the multifamily real estate business in 1992 as a leasing consultant and on-site manager, where he learned the day- to-day operations and cultivated a keen connection to our team members. He joined Aimco in March 2002 as a Regional Manager and in March 2006 was promoted to a Regional Vice President of property operations for California. In September 2008 Keith was appointed Area Vice President of property operations for the western United States. Most recently, as of January 2011, Keith was promoted to the Executive Vice President of Property Operations heading our national operations. KEITH M. KIMMEL Executive Vice President – Property Operations 28

29 FORWARD LOOKING STATEMENTS & OTHER INFORMATION This presentation contains forward-looking statements within the meaning of the federal securities laws, including, without limitation, statements regarding projected results and specifically forecasts of: selected components of Pro forma FFO and AFFO per share; Aimco's redevelopment and development timelines and NOI contribution; Aimco's lease-up timelines and NOI contribution; expectations regarding sales of Aimco apartment communities and the use of proceeds therefrom; and Aimco liquidity and leverage metrics. These forward-looking statements are based on management's judgment as of this date and include certain risks and uncertainties. Risks and uncertainties include, but are not limited to: Aimco's ability to maintain current or meet projected occupancy, rental rates and property operating results; the effect of acquisitions, dispositions, redevelopments and developments; Aimco's ability to meet budgeted costs and timelines, and achieve budgeted rental rates related to our developments and redevelopments; Aimco's ability to meet timelines and budgeted rental rates related to our lease-up properties; and Aimco's ability to comply with debt covenants, including financial coverage ratios. Actual results may differ materially from those described in these forward-looking statements and, in addition, will be affected by a variety of risks and factors, some of which are beyond Aimco's control, including, without limitation: real estate risks, including fluctuations in real estate values and the general economic climate in the markets in which Aimco operates and competition for residents in such markets; national and local economic conditions, including the pace of job growth and the level of unemployment; the amount, location and quality of competitive new supply; financing risks, including the availability and cost of capital markets financing and the risk that our cash flows from operations may be insufficient to meet required payments of principal and interest; the risk that our earnings may not be sufficient to maintain compliance with debt covenants; the terms of governmental regulations that affect Aimco and interpretations of those regulations; the competitive environment in which Aimco operates; the timing of acquisitions, dispositions, redevelopments and developments; insurance risk, including the cost of insurance; natural disasters and severe weather such as hurricanes; litigation, including costs associated with prosecuting or defending claims and any adverse outcomes; energy costs; and possible environmental liabilities, including costs, fines or penalties that may be incurred due to necessary remediation of contamination of apartment communities presently or previously owned by Aimco. In addition, Aimco's current and continuing qualification as a real estate investment trust involves the application of highly technical and complex provisions of the Internal Revenue Code and depends on its ability to meet the various requirements imposed by the Internal Revenue Code, through actual operating results, distribution levels and diversity of stock ownership. Readers should carefully review Aimco's financial statements and the notes thereto, as well as the section entitled "Risk Factors" in Item 1A of Aimco's Annual Report on Form 10-K for the year ended December 31, 2015, and the other documents Aimco files from time to time with the Securities and Exchange Commission. These forward-looking statements reflect management's judgment as of this date, and Aimco assumes no obligation to revise or update them to reflect future events or circumstances. This presentation does not constitute an offer of securities for sale. Glossary & Reconciliations of Non-GAAP Financial and Operating Measures Financial and operating measures discussed in this document include certain financial measures used by Aimco management, some of which are measures not defined under accounting principles generally accepted in the United States, or GAAP. These measures are defined in the Glossary included in Aimco's First Quarter 2016 Earnings Release dated April 29, 2016. Where appropriate, the non-GAAP financial measures for Aimco's 2016 results and guidance included within this document have been reconciled to the most comparable GAAP measures within Aimco's First Quarter 2016 Earnings Release referenced above.

NET ASSET VALUE PRESENTATION JUNE 2016 1 ONE CANAL, BOSTON, MA
2 AIMCO NET ASSET VALUE PRESENTATION GENERAL DISCLOSURES The information provided in this presentation is intended to assist users in estimating Aimco Net Asset Value per share. Aimco is providing this presentation at this time in order to provide consistent disclosure to all investors as to Aimco views regarding the range of estimates of Net Asset Value expressed by others. This is not an offer to sell securities and does not constitute legal, tax, investment or other professional advice on any subject matter. Information provided is not all-inclusive and should not be relied upon as being all-inclusive. Net Asset Value is considered useful by some investors in valuing shares in public real estate companies because it seeks to value the assets held by public companies to those established in private transactions. This presentation describes a process to calculate Aimco's estimated Net Asset Value per share as of March 31, 2016. This value will fluctuate over time. Aimco's estimated Net Asset Value per share is based upon subjective judgments, assumptions and opinions and include certain risks and uncertainties. Risks and uncertainties include, but are not limited to: Aimco's ability to maintain current or meet projected occupancy, rental rates and property operating results; the effect of acquisitions, dispositions, redevelopments and developments; Aimco's ability to meet budgeted costs and timelines, and achieve budgeted rental rates related to our developments and redevelopments; Aimco's ability to meet timelines and budgeted rental rates related to our lease-up properties; and Aimco's ability to meet its obligations under Low Income Housing Tax Credit agreements.
3 AIMCO NET ASSET VALUE PRESENTATION GENERAL DISCLOSURES (CONTINUED) This Net Asset Value per share information should not be relied upon as representative of the amount a stockholder could expect to receive in a liquidation event, now or in the future. Certain assets are excluded as are certain liabilities such as the taxes and transaction costs associated with a liquidation (see page 7). Aimco's estimated Net Asset Value is based on management's judgments, assumptions and opinions as of this date, and Aimco assumes no obligation to revise or update them to reflect future events or circumstances. Actual results may differ materially from management's forecasts as of this date and, in addition, will be affected by a variety of risks and factors, some of which are beyond Aimco's control, including, without limitation: real estate risks, including fluctuations in real estate values and the general economic climate in the markets in which Aimco operates and competition for residents in such markets; national and local economic conditions, including the pace of job growth and the level of unemployment; the amount, location and quality of competitive new supply; financing risks, including the availability and cost of capital markets financing and the risk that our cash flows from operations may be insufficient to meet required payments of principal and interest; the risk that our earnings may not be sufficient to maintain compliance with debt covenants; the terms of governmental regulations that affect Aimco and interpretations of those regulations; the competitive environment in which Aimco operates; the timing of acquisitions, dispositions, redevelopments and developments; insurance risk, including the cost of insurance; natural disasters and severe weather such as hurricanes; litigation, including costs associated with prosecuting or defending claims and any adverse outcomes; energy costs; and possible environmental liabilities, including costs, fines or

4 AIMCO NET ASSET VALUE PRESENTATION GENERAL DISCLOSURES (CONTINUED) penalties that may be incurred due to necessary remediation of contamination of apartment communities presently or previously owned by Aimco. In addition, Aimco's current and continuing qualification as a real estate investment trust involves the application of highly technical and complex provisions of the Internal Revenue Code and depends on its ability to meet the various requirements imposed by the Internal Revenue Code, through actual operating results, distribution levels and diversity of stock ownership. Readers should carefully review Aimco's financial statements and the notes thereto, as well as the section entitled "Risk Factors" in Item 1A of Aimco's Annual Report on Form 10-K for the year ended December 31, 2015, and the other documents Aimco files from time to time with the Securities and Exchange Commission.

5 AIMCO NET ASSET VALUE PRESENTATION VALUATION METHODOLOGY Real Estate - Aimco estimated the value of its properties using methods management believes to be appropriate based on the characteristics of the properties. For valuation purposes, Aimco segregated its portfolio into the following categories: Stabilized Conventional Portfolio; Redevelopment Properties Under Construction; Development Properties in Lease-Up; Properties Scheduled for Sale; Other Conventional Real Estate; and Affordable Portfolio. Properties in these categories were valued as follows: • Stabilized Conventional Portfolio - valued using a direct capitalization rate ("cap rate") method based on annualized 1Q 2016 property NOI, less a 2% management fee, and market cap rates; • Redevelopment Properties Under Construction and Lease-Up Properties - valued based on discounted projected future cash flows; • Properties Scheduled for Sale - valued at contract price; • Other Conventional Real Estate - includes non-stabilized recent acquisitions valued at Aimco's purchase price and certain land investments valued at Aimco's book value; • Affordable Portfolio - valued using a direct cap rate method based on annualized 1Q 2016 property NOI, less a 2% management fee, with market cap rates adjusted to take into account discounted future cash flows expected to be distributed to tax credit investors under existing tax credit partnership agreements.
6 AIMCO NET ASSET VALUE PRESENTATION VALUATION METHODOLOGY (CONTINUED) Other Tangible Assets - consist of cash, restricted cash, accounts receivable and other assets for which Aimco reasonably expects to receive cash through the normal course of operations or another future event. Debt - the fair value of Aimco's debt has been calculated based on the Money-Weighted Average interest rate on its debt, which rate takes into account the timing of amortization and maturities, and a market rate that takes into account the loan-to-value and duration of the property debt. Other Tangible Liabilities - consist of accounts payable, accrued liabilities and other tangible liabilities Aimco reasonably expects to settle in cash through the normal course of operations or another future event. Preferred Equity - the fair value of Aimco's preferred equity includes a mark-to-market adjustment for listed securities based on their closing share price on March 31, 2016.

7 AIMCO NET ASSET VALUE PRESENTATION VALUATION METHODOLOGY (CONTINUED) Other Items of Note • Real estate values are based on Aimco's current uses and do not include the value of unused or underused land or air rights. • Real estate values do not take into consideration transaction costs or other items such as real estate tax adjustments that may impact the value a buyer might ascribe to Aimco's properties. • This calculation of Aimco Net Asset Value does not include the impact of planned or completed transactions subsequent to March 31, 2016, for example, the sale of Aimco's Riverside community, located in Alexandria, Virginia, to complete the funding of Aimco's planned acquisition of Indigo, a 463-apartment home community currently under construction in Redwood City, California. This paired-trade is treated as NAV-neutral. • This calculation of Aimco Net Asset Value does not include the value of such fee income as property management revenues, cash due from Low Income Housing Tax Credit investors, or non-recurring investment management revenues. • This calculation of Aimco Net Asset Value does not include tax assets including Historic Tax Credits nor does it consider tax liabilities, • This calculation of Aimco Net Asset Value does not consider enterprise or going concern value. • Additional details of Aimco's calculations and methodologies are included on the following pages.

8 AIMCO NET ASSET VALUE March 31, 2016 Estimated Fair Value of Real Estate: $75 per share* * See additional details and disclosures beginning on page 10. Lease-Up Portfolio Cash flows discounted from property stabilization to March 31, 2016 Redevelopment Portfolio Cash flows discounted from property stabilization to March 31, 2016 Affordable Portfolio Annualized 1Q 2016 NOI Less: Management fee of 2% of revenue Divided By: NOI capitalization rate of 8.0% Stabilized Conventional Portfolio Annualized 1Q 2016 NOI Less: Management fee of 2% of revenue Divided By: NOI capitalization rate of 5.0% Other Real Estate Portfolio Sale Properties: Properties sold or under contract for sale, valued at the sales or contract price. Acquisition Properties: Non-stabilized properties not in lease-up; valued at cost. $2 $4 $3 $4 $62
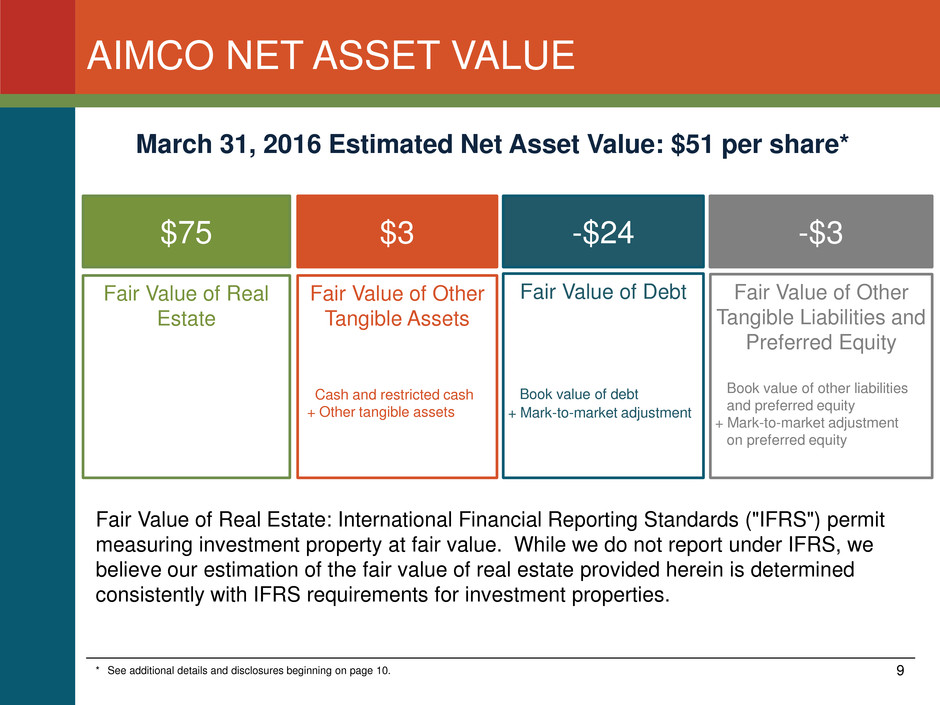
9 AIMCO NET ASSET VALUE March 31, 2016 Estimated Net Asset Value: $51 per share* $75 $3 -$24 -$3 Fair Value of Real Estate Fair Value of Other Tangible Assets Cash and restricted cash + Other tangible assets Fair Value of Debt Book value of debt + Mark-to-market adjustment Fair Value of Other Tangible Liabilities and Preferred Equity Book value of other liabilities and preferred equity + Mark-to-market adjustment on preferred equity Fair Value of Real Estate: International Financial Reporting Standards ("IFRS") permit measuring investment property at fair value. While we do not report under IFRS, we believe our estimation of the fair value of real estate provided herein is determined consistently with IFRS requirements for investment properties. * See additional details and disclosures beginning on page 10.

10 Fair Value of Real Estate as of March 31, 2016 ($M) Stabilized Conventional Portfolio Annualized 1Q 2016 NOI, less 2% management fee 515$ 1 NOI cap rate 5.0% 2 Stabilized Conventional Portfolio Value 10,287$ Non-Stabilized Conventional Portfolio Redevelopment properties under construction 616$ 3 Development properties in lease-up 348 4 Properties scheduled for sale 292 5 Other Conventional real estate 153 6 Non-Stabilized Conventional Portfolio Value 1,409$ Affordable Portfolio Annualized 1Q 2016 NOI, less 2% management fee 60$ 7 NOI cap rate 8.0% 8 Affordable Portfolio Value 744$ Fair Value of Real Estate at March 31, 2016 12,440$ See notes beginning on page 13. AIMCO NET ASSET VALUE BUILD-UP

11 Fair Value of Other Assets, Debt and Other Liabilities as of March 31, 2016 ($M) 9 See notes beginning on page 13. AIMCO NET ASSET VALUE BUILD-UP Proportionate Amount Adjustments As Adjusted Other Tangible Assets Cash and cash equivalents 63$ -$ 63$ Restricted cash 90 - 90 Goodwill 44 (44) - 10 Other tangible assets 263 - 263 Fair Value of Other Tangible Assets 460$ (44)$ 416$ Debt Non-recourse property debt 3,696$ 173$ 3,869$ 11 Revolving credit facility borrowings 106 - 106 Fair Value of Debt 3,802$ 173$ 3,975$ Other Tangible Liabilities Deferred income 60$ (60)$ -$ 12 Other tangible liabilities 189 - 189 Liabilities related to assets held for sale - - - Fair Value of Other Tangible Liabilities 249$ (60)$ 189$ Preferred Equity Preferred noncontrolling interests in Aimco Operating Partnership 86$ -$ 86$ Perpetual preferred stock 159 10 169 13 Fair Value of Preferred Equity 245$ 10$ 255$ Fair Value of Other Tangible Assets, Debt, Other Tangible Liabilities and Preferred Equity 3,836$ 168$ 4,003$

12 Net Asset Value as of March 31, 2016 ($M, except per share amounts) See notes beginning on page 13. AIMCO NET ASSET VALUE BUILD-UP Fair Value of Real Estate 12,440$ Fair Value of Other Intangible Assets, Debt and Other Liabilities (4,003) Net Asset Value 8,437$ Total Shares, Units and Dilutive Share Equivalents Outstanding 165 14 Net Asset Value per Share 51$

13 Footnotes 1. Represents Stabilized Conventional Property NOI for the three months ended March 31, 2016, annualized, and adjusted for an assumed property management fee. Market management fees range between 1.5% and 3.0% with larger, higher quality portfolios at the lower end of that range. For the purposes of this calculation of Net Asset Value, Aimco has assumed a 2% management fee. Annualization of Property Net Operating income is consistent with Aimco's experience of seasonality of earnings quarter-to-quarter. During the last six years, Aimco's Conventional Same Store NOI has been distributed as follows: 1Q 24.5%; 2Q 24.8%; 3Q 25.2%; 4Q 25.5%. For the purposes of this calculation of Net Asset Value, we use 1Q 2016 NOI multiplied by four. Amounts below do not include an assumed cost of sale. Proportionate amounts are non-GAAP measures representing Aimco's share of Property NOI and may be found on Supplemental Schedule 2(a) of Aimco's 1Q 2016 Earnings Release. These amounts are reconciled to the most comparable GAAP measures on page 21 of this document Please see the following page for explanation of adjustments to proportionate amounts for purposes of computing Stabilized Conventional Property NOI. AIMCO NET ASSET VALUE DISCLOSURES Stabilized Conventional Portfolio NOI ($000s) Proportionate Amount Adjustments As Adjusted Rental and other property revenues Conventional Same Store 173,240$ (429)$ a 172,811$ Conventional Redevelopment and Development 16,609 (6,407) b 10,202 Conventional Acquisitions 1,742 (1,742) c - Other Conventional 18,062 (8,350) d 9,711 Total rental and other property revenues 209,653 (16,927) 192,725 Less: Direct property operating expenses Conventional Same Store (53,397)$ 291$ a (53,106)$ Conventional Redevelopment and Development (5,552) 3,100 b (2,452) Conventional Acquisitions (930) 930 c - Other Conventional (8,160) 3,656 d (4,505) Total property operating expenses (68,039) 7,978 (60,062) Property Net Operating Income 141,614$ (8,949)$ 132,663$ Less: Assumed property management fee of 2% of revenue (4,193) 339 (3,855) Property Net Operating Income after 2% management fee 137,421$ (8,610)$ 128,808$ Annualized Property Net Operating Income 549,684$ (34,440)$ 515,232$
14 Footnotes (continued) 1. (continued) a. Represents residential revenues and expenses related to Aimco's Tremont community acquired by Aimco in December 2014. Residential operations have been stabilized for more than one year and are included in Same Store results. Commercial operations are included in Other Conventional results and are not yet stabilized. For the purposes of this Net Asset Value calculation, Tremont is valued at Aimco's cost and included within Aimco's Other Conventional Real Estate value. b. Represents revenues and expenses related to two redevelopment communities currently under construction, Park Towne Place and The Sterling, both located in Center City Philadelphia. Also included in these adjustments are revenues and expenses related to two lease-up communities, One Canal, located in Boston, Massachusetts; and Vivo, located in Cambridge, Massachusetts. Aimco's redevelopment communities currently under construction and its lease-up communities are valued based on discounted cash flows as described in notes 3 and 4 on page 17. For the purposes of this Net Asset Value calculation, Park Towne Place and The Sterling are included in Aimco's Redevelopment Properties Under Construction value. For the purposes of this Net Asset Value calculation, One Canal and Vivo are included in Aimco's Development Properties in Lease-Up value. After excluding the results related to the communities described above, Stabilized Conventional NOI related to redevelopment and development communities represents the results of operations from three occupancy stabilized communities: Lincoln Place, located in Venice, California; Preserve at Marin, located in Corte Madera, California; and Ocean House on Prospect, located in La Jolla, California. c. Represents revenues and expenses related to two acquisition communities, Axiom, located in Cambridge, Massachusetts, which Aimco acquired in April 2015, and Mezzo, located in Atlanta, Georgia, which Aimco purchased in February 2015. Axiom is valued based on discounted cash flows as described in note 4 on page 17 and for the purposes of this Net Asset Value calculation, is included in Aimco's Development Properties in Lease-Up value. Mezzo is valued at Aimco's cost and for the purposes of this Net Asset Value calculation, is included in Aimco's Other Conventional Real Estate value. AIMCO NET ASSET VALUE DISCLOSURES
15 Footnotes (continued) 1. (continued) d. Represents revenue and expenses related primarily to Tremont commercial operations and treated for the purposes of this Net Asset Value calculation as described in (a) above, and to two for-sale communities: Riverside, located in Alexandria, Virginia, which was sold in May 2016; and Grand Pointe, located in Columbia, Maryland, whose sale is expected during summer 2016. For the purposes of this Net Asset Value calculation, Riverside and Grand Pointe are included in Aimco's Assets Scheduled for Sale value. 2. Represents Aimco's estimated current NOI cap rate for its Stabilized Conventional Portfolio, which was calculated by Aimco on a property-by-property basis, based primarily on information published by CBRE in its 2H 2015 Cap Rate Survey. CBRE is a nationally recognized provider of real estate data. Such Survey includes ranges of current cap rates based on the following property characteristics: market in which the property is located; infill or suburban location within the market; property quality grade; and whether the property is stabilized or value-add. In estimating the appropriate current cap rate for its Stabilized Conventional Portfolio, Aimco categorized properties in the Portfolio using the framework described above and, using its judgment and detailed knowledge of each property's condition and location, other than the exceptions noted below, Aimco selected an appropriate current cap rate from within the range provided in CBRE's Cap Rate Survey. The results of this analysis are detailed on the following page. AIMCO NET ASSET VALUE DISCLOSURES

16 Footnotes (continued) 2. (continued) a. Based on the quality of its communities and locations within the market, Aimco estimates the current NOI cap rates for its Chicago and San Diego portfolios are slightly higher than the high end of the range of cap rates that is indicated by the results of Aimco's analysis using the CBRE Cap Rate Survey. b. Aimco estimates the current NOI cap rates for its properties located in New York City are on average 40 basis points lower than the low end of the range of cap rates that is indicated by the results of Aimco's analysis using the CBRE Cap Rate Survey. Aimco believes this lower cap rate is appropriate because the Survey reflects cap rates for the New York City metro area while Aimco's portfolio is concentrated in Manhattan, where today cap rates are lower. AIMCO NET ASSET VALUE DISCLOSURES Properties Apartment Homes Effective Apartment Homes Portfolio Age Average Revenue per Apartment Home Average Rent as a Percentage of Market Average Quality Grade Low High Aimco Selected Cap Rate Atlanta 6 1,325 1,311 18 $ 1,323 131% A 5.1% 5.6% 5.6% Boston 12 4,173 4,173 42 $ 1,538 71% C+ 6.2% 6.7% 6.4% Chicago 10 3,246 3,246 21 $ 1,635 124% B 5.0% 5.3% 5.5% a Bay Area 11 2,169 2,169 21 $ 2,684 111% B 4.1% 4.6% 4.4% Denver 8 2,065 2,026 20 $ 1,522 129% A 5.2% 5.8% 5.5% Greater DC 13 5,325 5,297 48 $ 1,548 88% C+ 5.6% 6.2% 5.8% Greater LA 15 5,313 4,662 10 $ 2,568 150% A 3.9% 4.5% 4.1% Miami 5 2,571 2,560 23 $ 2,281 161% A 4.2% 4.7% 4.3% New York 18 1,040 1,040 88 $ 3,235 103% B 4.5% 5.1% 4.1% b Philadelphia 4 2,042 1,963 39 $ 1,508 114% B 5.6% 6.1% 6.0% San Diego 12 2,423 2,353 25 $ 1,724 102% B 4.8% 5.3% 5.4% a Seattle 2 239 239 3 $ 2,049 135% A 4.7% 5.2% 4.8% Target 116 31,931 31,039 27 $ 1,907 112% B 4.7% 5.2% 4.9% Baltimore 2 376 376 36 $ 1,461 120% B 5.3% 5.8% 5.7% Nashville 3 764 764 23 $ 1,385 137% A 5.8% 6.3% 6.1% Norfolk - Richmond 5 1,487 1,408 26 $ 1,132 105% B 5.9% 7.6% 7.1% Other Markets 4 2,092 2,092 42 $ 1,611 114% B 5.3% 6.4% 5.9% Non-Target 14 4,719 4,640 34 $ 1,416 115% B 5.5% 6.6% 6.2% Total/Weighted Average 130 36,650 35,680 28 $ 1,843 112% B 4.7% 5.3% 5.0% Range of CBRE Cap Rates for Aimco's Portfolio 1Q 2016 Stabilized Conventional Portfolio

17 Footnotes (continued) 2. (continued) Aimco also estimated current NOI cap rates for its Stabilized Conventional Portfolio using market cap rates reported by Real Capital Analytics ("RCA"). While individual market NOI cap rates differ, the weighted average cap rate for Aimco's Stabilized Conventional Portfolio using RCA cap rates is consistent with that computed by Aimco using the methodology described on the previous page. 3. Represents the value of two properties currently under redevelopment, Park Towne Place and The Sterling, both located in Center City Philadelphia. Properties are valued based on discounted cash flows using the following assumptions: a. Revenues: based on in-place rents, projected submarket rent growth to property stabilization based on the average of projections published by REIS and AXIOmetrics, and the impacts of redevelopment. b. Expenses: estimated operating costs adjusted for inflation as projected by Moody's Economy.com; management fee equal to 2% of projected revenue. c. Cost to complete construction: based on current estimates. Note that for Park Towne Place, cost to complete includes future phases of redevelopment not yet approved by Aimco's Investment Committee. Please see Supplemental Schedule 10 to Aimco's 1Q 2016 Earnings Release for additional information and descriptions of these projects. d. Terminal value: based on current market cap rate plus 5 basis points per year from March 31, 2016, to property stabilization. e. Sales cost: 2% of terminal value. f. Discount rate: 8.00% - 8.25% depending on construction and lease-up progress at March 31, 2016. 4. Represents the value of three properties currently in lease-up: Axiom and Vivo, both located in Cambridge, Massachusetts, and One Canal located in Boston. Properties are valued based on discounted cash flows using the same assumptions described in note 3 above for redevelopment properties under construction. Discount rates range from 8.0% to 8.7% depending on construction and lease-up progress at March 31, 2016. AIMCO NET ASSET VALUE DISCLOSURES

18 5. Represents the sale price of Aimco's Riverside community located in Alexandria, Virginia, which was sold in May 2016; and the expected sale price of Aimco's Grand Pointe community located in Columbia, Maryland, which is under contract to close in summer 2016. 6. Represents the value of two recently acquired, non-stabilized conventional acquisition properties, Mezzo and Tremont, both located in Atlanta; Aimco's investment in land and non-multifamily real estate operations in La Jolla, California; and Aimco's investment in vacant land contiguous to its Preserve at Marin community located in Corte Madera, California. These investments are valued at Aimco's cost. 7. Represents annualized 1Q 2016 NOI for Aimco's portfolio of Affordable properties, adjusted for an assumed 2% property management fee. First quarter 2016 Affordable property operating results may be found on Supplemental Schedule 2(a) of Aimco's 1Q 2016 Earnings Release. Proportionate results are reconciled to the most comparable GAAP measures in the Glossary to Aimco's 1Q 2016 Earnings Release. 8. Aimco's Affordable portfolio cap rate of 8% is a derived value computed as annualized 1Q 2016 Affordable portfolio NOI divided by our estimate of the value to Aimco of its Affordable portfolio. The estimated value of our portfolio takes into account discounted future cash flows expected to be distributed to tax credit investors under existing tax credit agreements, which results in a derived cap rate in excess of the cap rate associated with the underlying real estate. 9. Proportionate balance sheet amounts are non-GAAP measures representing Aimco's share of financial information discussed on page 11 of this document and may be found in Supplemental Schedule 4 to Aimco's 1Q 2016 Earnings Release. These amounts are reconciled to the most comparable GAAP measures on page 21 of this document. Unless otherwise noted, other tangible assets and liabilities, debt and preferred equity are valued at Aimco book value. 10. For the purposes of this Net Asset Value calculation, intangible assets are excluded. Footnotes (continued) AIMCO NET ASSET VALUE DISCLOSURES

19 11. Represents the carrying value of Aimco's non-recourse property debt, adjusted for the mark-to-market liability on Aimco's fixed rate property debt as of March 31, 2016. Such mark-to-market has been computed by Aimco using a Money-Weighted Average Interest Rate of 4.65% on Aimco's fixed rate property debt, which rate takes into account the timing of amortization and maturities, and a market rate of 3.64%, which rate takes into account the duration and loan- to-value of the property debt. Please see Supplemental Schedule 5 to Aimco's 1Q 2016 Earnings Release for additional information regarding Aimco's leverage in general and property debt specifically, and a reconciliation of proportionate amounts to the most comparable GAAP measures. 12. Deferred income represents cash received by Aimco in prior periods which is required under GAAP to be deferred upon receipt and recognized in income in future periods. For the purposes of this Net Asset Value calculation, Deferred Income is excluded. 13. Represents the fair value of Aimco's preferred stock, which is estimated by Aimco as the closing stock price on March 31, 2016 less accumulated dividends. Such accumulated dividends are assumed to be accounted for in the closing stock price and these amounts are also included on Aimco's balance sheet in accrued liabilities. As such, an adjustment is made to the value of Aimco's preferred stock so as not to overstate the fair value of Aimco's liabilities and preferred stock on a combined basis. 14. Represents Total Shares, Units and Dilutive Share Equivalents Outstanding, which information may be found in Supplemental Schedule 5 to Aimco's 1Q 2016 Earnings Release. Footnotes (continued) AIMCO NET ASSET VALUE DISCLOSURES
20 AIMCO OPERATING PARTNERSHIP (OP): AIMCO Properties, L.P., a Delaware limited partnership, is the operating partnership in Aimco's UPREIT structure. Aimco owns approximately 95% of the common partnership units of the Aimco OP. AIMCO PROPORTIONATE FINANCIAL INFORMATION: Non-GAAP measures representing Aimco's share of financial information discussed in this Earnings Release and Supplemental Information. Aimco's proportionate share of financial information includes Aimco's share of unconsolidated real estate partnerships and excludes noncontrolling interests in consolidated real estate partnerships. Proportionate reporting benefits the users of Aimco's financial information by providing the amount of revenues, expenses, assets and liabilities attributable to Aimco stockholders. Aimco also refers to this measure as "Aimco Share" of financial information. See the following page for reconciliation of Aimco's proportionate share of financial results included in this document to Aimco's consolidated financial statements. MONEY-WEIGHTED AVERAGE INTEREST RATE: Money-Weighted Average Interest Rate represents the weighted average interest rate on Aimco's fixed and floating rate property debt, which takes into account the timing of amortization and maturities. This rate is calculated by Aimco based on the unpaid principal balance as of March 31, 2016, and all contractual debt service payments associated with each of its fixed and floating rate property loans. The Money-Weighted Average Interest Rate can be compared to market interest rates for comparable durations and loan-to-value to estimate the difference between the book value of Aimco's fixed and floating rate property debt and the market value of such debt. PORTFOLIO QUALITY RATINGS: Aimco measures portfolio quality based on apartment community rents compared to local market average rents as reported by REIS, a third-party provider of commercial real estate performance information and analysis. Aimco defines portfolio quality as follows: "A" quality properties are those with rents greater than 125% of the local market average; "B" quality properties are those with rents between 90% and 125% of the local market average; "C+" quality properties are those with rents greater than $1,100 per month but lower than 90% of the local market average; and "C" quality assets are those with rents less than $1,100 per month and lower than 90% of the local market average. DEFINITIONS AND RECONCILIATIONS Definitions

21 DEFINITIONS AND RECONCILIATIONS Reconciliations to Non-GAAP Financial Measures $ in Thousands Consolidated Amount Proportionate Share of Unconsolidated Partnerships Noncontrolling Interests Proportionate Amount Real estate operations: Rental and other property revenues Conventional Same Store 180,425$ -$ (7,185)$ 173,240$ Conventional Redevelopment 16,609 - - 16,609 Conventional Acquisition 1,742 - - 1,742 Other Conventional 17,511 551 - 18,062 Total Conventional 216,287 551 (7,185) 209,653 Affordable Portfolio 25,174 1,016 (144) 26,046 Property management revenues, primarily from affiliates 2 (60) 147 89 Total rental and other property revenues 241,463 1,507 (7,182) 235,788 Property operating expenses Conventional Same Store 55,729 - (2,332) 53,397 Conventional Redevelopment 5,552 - - 5,552 Conventional Acquisition 930 - - 930 Other Conventional 7,981 179 - 8,160 Total Conventional 70,192 179 (2,332) 68,039 Affordable Portfolio 10,231 444 (65) 10,610 Casualties 2,150 - (25) 2,125 Property management expenses 5,900 - 1 5,901 Total property operating expenses 88,473 623 (2,421) 86,675 Net real estate operations 152,990$ 884$ (4,761)$ 149,113$ Proportionate Consolidated Share of Proportionate GAAP Unconsolidated Noncontrolling Balance Balance Sheet Partnerships Interests Sheet Assets Real estate 8,386,163$ 50,767$ (256,240)$ 8,180,690$ Accumulated depreciation (2,858,642) (11,157) 87,484 (2,782,315) Net real estate 5,527,521 39,610 (168,756) 5,398,375 Cash and cash equivalents 64,454 511 (1,932) 63,033 Restricted cash 90,158 1,507 (1,812) 89,853 Investment in unconsolidated real estate partnerships 15,544 (15,544) - - Goodwill 43,878 - - 43,878 Other assets 400,658 (1,698) (135,821) 263,139 Total assets 6,142,213$ 24,386$ (308,321)$ 5,858,278$ Liabilities and Equity Non-recourse property debt 3,834,634 23,230 (162,043) 3,695,821 Debt adjustments (23,124) (199) 354 (22,969) Non-recourse property debt, net 3,811,510 23,031 (161,689) 3,672,852 Revolving credit facility borrowings 106,080 - - 106,080 Deferred income 59,961 27 (291) 59,697 Other liabilities 343,396 1,328 (156,045) 188,679 Total liabilities 4,320,947 24,386 (318,025) 4,027,308 Preferred noncontrolling interests in Aimco Operating Partnership 86,201 - - 86,201 Perpetual preferred stock 159,126 - - 159,126 Other Aimco equity 1,444,036 - 152,446 1,596,482 Noncontrolling interests in consolidated real estate partnerships 142,742 - (142,742) - Common noncontrolling interests in Aimco Operating Partnership (10,839) - - (10,839) Total liabilities and equity 6,142,213$ 24,386$ (308,321)$ 5,858,278$ Three Months Ended March 31, 2016 As of March 31, 2016
Serious News for Serious Traders! Try StreetInsider.com Premium Free!
You May Also Be Interested In
- Kopin Achieves Important Technical Milestones in Development of NeuralDisplay™ Architecture
- Partner base continues to grow: Greenman Energy opts for battery-buffered fast chargers from ADS-TEC Energy
- Veru to Present at the American Association of Clinical Endocrinology (AACE) 2024 Annual Meeting on May 9-11
Create E-mail Alert Related Categories
SEC FilingsSign up for StreetInsider Free!
Receive full access to all new and archived articles, unlimited portfolio tracking, e-mail alerts, custom newswires and RSS feeds - and more!


 Tweet
Tweet Share
Share